Embed Size (px)
Citation preview

Meeting with Investors – Banco VotorantimDecember, 2014

2
The information contained in this presentation may include statements whichconstitute forward-looking statements, within the meaning of Section 27A of the U.S.Securities Act of 1933, as amended, and Section 21E of the U.S. Securities ExchangeAct of 1934, as amended. Such forward-looking statements involve a certain degree ofrisk and uncertainty with respect to business, financial, trend, strategy and otherforecasts, and are based on assumptions, data or methods that, although consideredreasonable by the company at the time, may turn out to be incorrect or imprecise, ormay not be possible to realize. The company gives no assurance that expectationsdisclosed in this presentation will be confirmed. Prospective investors are cautionedthat any such forward-looking statements are not guarantees of future performanceand involve risks and uncertainties, and that actual results may differ materially fromthose in the forward-looking statements, due to a variety of factors, including, but notlimited to, the risks of international business and other risks referred to in thecompany’s filings with the CVM and SEC. The company does not undertake, andspecifically disclaims any obligation to update any forward-looking statements, whichspeak only for the date on which they are made.
Disclaimer

3
Company Overview1Pulp and Paper Market2Financial and Operational Highlights3
Agenda
Final Remarks4

4
Company Overview

5
A Winning Player
Port Terminal Pulp Unit
Três Lagoas
Santos
AracruzPortocel
Caravelas
BelmonteVeracel
Jacareí
Superior Asset Combination Main Figures – 3Q14 LTM
Pulp capacity million tons 5,300
Net revenues R$ billion 7.0
Total Forest Base(1) thousand hectares 970
Planted area(1) thousand hectares 562
Net Debt R$ billion 7.3
Net Debt/EBITDA (in Dollars)(2) X 2.5
Net Debt/EBITDA (in Reais) X 2.7
Source: Fibria(1) Including 50% of Veracel, excluding forest partnership areas and forest bases linked to the sales of Losango and forest assets in Southern Bahia State. (2) For covenants purposes, the Net Debt/EBITDA ratio is calculated in Dollars.

6
Fibria’s Units Industrial Capacity
* Veracel is a joint venture between Fibria (50%) and Stora Enso (50%) and the total capacity is 1,120 thousand ton/year

7
Worldwide presence
Strong global customer base
Long-term relationships
Focus on customers with stable business
Customized pulp products and services
Sound forestry and industrial R&D
Focus on less volatile end-use markets such as tissue
Efficient logistics set up
Low dependence on volatile markets such as China
Low credit risk
100% certified pulp (FSC and PEFC/Cerflor)
Sales Mix by End Use - Fibria
Sales Mix by Region - Fibria
Europe39%
N. America
26%
Asia25%
Other10%
Region - 3Q14
Tissue55%
Printing & Writing
27%
Specialty18%
End Use - 3Q14
Highlights
30%20%
29% 29% 24% 18%26% 26% 30%
22% 28% 31% 30%19% 22% 26%
37%46%
46% 41%
35% 44%43% 41% 36%
42%43% 35% 36%
46% 42% 39%
22% 25%14% 20%
31% 28% 20% 23% 25% 26%21% 26% 26% 26% 27% 25%
11% 9% 11% 10% 10% 10% 11% 10% 9% 10% 8% 8% 8% 9% 9% 10%
4Q10 1Q11 2Q11 3Q11 4Q11 1Q12 2Q12 3Q12 4Q12 1Q13 2Q13 3Q13 4Q13 1Q14 2Q14 3Q14
North America Europe Asia Other
Fibria’s Commercial Strategy

8
(1) Controlling group(2) Free Float 40.14% + Treasury 0.06%
Votorantim Industrial S.A.
(1)
29.42%
BNDESParticipações (1)
30.38%
FreeFloat (2)
40.20%
• Only 1 class of shares →100% voting rights
• 100% tag along rights (Brazilian corporate law establishes 80%)
• Board of Directors with minimum 20% independent members
• Financial Statements in International Standards – IFRS
• Adoption of Arbitration Chamber
• SEC Registered ADR Level III program
• Indebtedness and Liquidity
• Market Risk Management
• Risk Management
• Corporate Governance
• Related Parties Transactions
• Anti-Corruption
• Information Disclosure
• Securities Trading
Fiscal Council
Board of Directors
20% independent
members
Role of CEO and
chairman is split
Personnel and Remuneration
Committee
Statutory Audit
Committee
Finance Committee
Sustainability Committee
Innovation Committee
General Meeting
Listed on Novo Mercado, highest CG level at BM&FBovespa: Policies approved by the Board of Directors:
Shareholder Structure and Corporate Governance
30%
independent
members
100%
independent
members
50% independent members
45% independent members
-

9
Pulp and Paper Market
10
Today, according to public information, there will be a 10% increase of the pulp market capacity between 2014 and 2016
SOFTWOOD(1)
25.5 MT
HARDWOOD(1)
31.1 MT
MARKET PULP(1)
56.6 MT+ =
2014-2016(3):
• New capacities: 6.0 mt
• Announced Closures: (1.0) mt
Net: 5.0 mt
2014-2016(2):
• New capacities: 0.7 mt
• Announced Closures: (0.4) mt
Net: 0.3 mt
2014-2016:
• New capacities: 6.7 mt
• Announced Closures: (1.4) mt
Net: 5.3 mt
(1) Source: PPPC Special Research Note May 2014 – does not include Sulphite and UKP(2) Projects included: Paper Excellence (70kt); UPM Kymi (170kt); Klabin (200kt); Sodra Värö (275kt)| Closures: Birla AV Terrace Bay (350kt)(3) Projects included: Maranhão (1.5mt); Montes del Plata (1.3 mt); Oji Nantong (700kt); Eldorado (200kt); CMPC Guaíba II (1.3 mt); Klabin Ortigueira (1.0mt) | Closures: April Rizhao
(130kt); Arauco Valdivia (300kt); Old Town (200kt); Ence Huelva (400 kt).

11
Global Market Pulp Demand
Demand growth rate
Hardwood (BHKP) vs. Softwood (BSKP) (000 ton)
Hardwood demand will continue to increase at a faster pace than Softwood
Source: PPPC
Source: PPPC. Excludes Sulphite and UKP market pulp.
NBSK vs. BHKP - Prices(1)
(1) Source: FOEX |Average spread in the last 5 years.
0
5.000
10.000
15.000
20.000
25.000
30.000
35.000
19
98
19
99
20
00
20
01
20
02
20
03
20
04
20
05
20
06
20
07
20
08
20
09
20
10
20
11
20
12
20
13
20
14
20
15
20
16
20
17
20
18
Hardwood Softwood
2013 - 2018 CAGR:Hardwood: +2.8%Softwood: +0.7%
000 ton 1998 2008 2018
Growth
1998-
2008
Growth
2008-
2018
Hardwood 15.0 24.5 32.8 63% 34%
Eucalyptus 6.0 14.2 23.4 137% 63%
Softwood 17.6 21.6 24.8 23% 15%
Market Pulp 32.6 46.1 57.1
Paper Production – Runnability with BHKP
Source: RISI conference, August 2014.
400
500
600
700
800
900
1000
1100
0
50
100
150
200
250
Spread Average spread BHKP NBSK
Average spread: US$112
Spread Nov/14: US$197

12
Supply structural changes puts pressure on the industry
MARKET PULP CAPACITY RANKING 2014 (000T) MAIN PROJECTS
Project Country Capacity Timing Fiber Status
CMPC Guaíba II Brazil 1.3 Mt 2Q2015 BEKP Confirmed
Klabin Paraná Brazil 1.5 Mt 2Q2016BEKP/
BSKP/FluffConfirmed
APP South Sumatra Indonesia 2.0 Mt 1Q2017 BHKP Confirmed
Fibria Três Lagoas II Brazil 1.75 Mt - BEKP Unconfirmed
COST CURVE EVOLUTION
USD
/Ad
t, 2
01
3 c
ost
leve
l
Cumulative Capacity Million t/a
Cost position of marginal
producer
Source: Hawkins Wright , Poyry and Fibria Analysis (as of Aug. 2014).
0 2000 4000 6000
Canfor
ENCE
Eldorado
Resolute Forest
Domtar
Mercer
Sodra
Ilim
IP
Weyerhaeuser
Metsa Group
Paper Excellence
Stora Enso
UPM-Kymmene
CMPC
Georgia Pacific
Suzano
Arauco
APRIL
Fibria
Bleached Softwood Kraft Pulp (BSKP)
Bleached Hardwood Kraft Pulp (BHKP)
Unbleached Kraft Pulp (UKP)
Mechanical Pulp (MP)

13
Gross capacity addition should not be counted as the only factorinfluencing pulp price volatility….(1)
List Price bottoming at US$650/t in 2011 and US$724/t in 2014
Cap
acit
y (0
00
to
n)
0,0
0,2
0,4
0,6
0,8
1,0
1,2
1,4
1,6
1,8
2,0
0
100
200
300
400
500
600
700
800
900
1.000
2002 2003 2004 2005 2006 2007 2008 2009 2010 2011 2012 2013 2014 2015 2016 2017 2018
Valdivia
APP Hainan
Veracel Nueva Aldea
Santa Fé
Mucuri
FrayBentos
KerinciPL3
Três Lagoas
Rizhao
APP Guangxi
ChenmingZhanjiang
Eldorado Montes del Plata
Maranhão
Guaíba II
APP South Sumatra(2)
Klabin
BH
KP
pri
ces
-C
IF E
uro
pe
(U
S$/t
on
)
(1) Source: Hawkins Wright , Poyry and Fibria Analysis. Pulp price estimates according to Hawkins Wright (Sep/14), Brian McClay (Nov/14) and RISI (Nov/14)(2) Partially integrated production

14
Technical Age and Scale in the Market Pulp IndustryFurther closures are expected due to lack of adequate investments in the industry…
Hardwood (BHKP) Market Pulp Softwood (BSKP) Market Pulp
STRONGWeighted average
technical age 12.3 years
Weighted average
capacity 1,277,000 t/a
Aracruz
Três Lagoas
Veracel
Jacareí
0
500
1.000
1.500
2.000
2.500
3.000
051015202530
PM Capacity, 1000 t/a
Technical Age, years
WEAK
STRONGWeighted average
technical age 21 years
Weighted average
capacity 527,000 t/a
North American Pulp Mills Other Pulp Mills Closures Grade Switch On & Off
WEAK0
500
1.000
1.500
2.000
2.500
3.000
0102030
PM Capacity, 1000 t/a
Technical Age, years

15
Source: PPPC and Fibria
Closures of Hardwood Capacity Worldwide(000 ton)
Capacity closures DO happen
-910
-85
-1,260
-1,180
-540-500
-105
-1,085
-830
2006 2007 2008 2009 2010 2011 2012 2013 2014-2016 E
as of Oct14

16
Lowest Volatility Among Commodities
Change Nov/2014 vs. Nov/2013(3)
38%
32%30%
26% 25%21%
16%
7%
Sugar Iron Ore WTI Crude
Oil
Soy LME Metals Ibovespa Cattle FOEX PIX
BHKP
Sugar Iron Ore Crude Oil SoyLME
Metals Ibovespa Cattle Pulp BHKP
Commoditiy Spot Price -7% -49% -21% -21% - - 28% -5%
S&P Sector Index(2) -7% -22% -17% -21% 2% 7% 28% -
FIBR3|FBR - - - - - - - 7%|-3%
Commodities Historical Volatility (US$)(1)
(1) Since 2009 | (2) Except Iron Ore (Average Vale, Rio Tinto and BHP) and LME Metals | (3) November, 26th

17
Total Cash Cost of BHKP delivered to Europe (US$/t)
Source: Hawkins Wright (Outlook for Market Pulp, September 2014) | Fibria’s 3Q14 considering a FX of R$/US$2.27.Gray bar includes cash expenses as Interest, CAPEX, SG&A and Taxes (Source: RISI and Fibria).
3Q14 net price:
US$ 554/t
Positive WorkingCapital: US$5/t
SG&A
Capex
Interest
Among the industry’s lowest cash cost producers
498 508456 468
420 404 424 424 406342 315 311 297
235 221
71 4669 41
86 12134 38 41
4855 38 67
11166
54
142
24
Cash Cost (US$/t) Delivery (US$/t)
Income Tax1
Interest
Capacity(k tons):
1,775 660 595 570 1,570 1,045 2,415 335 625 340 7,450 = 31,3853,745 1,010 3,950 5,300
18
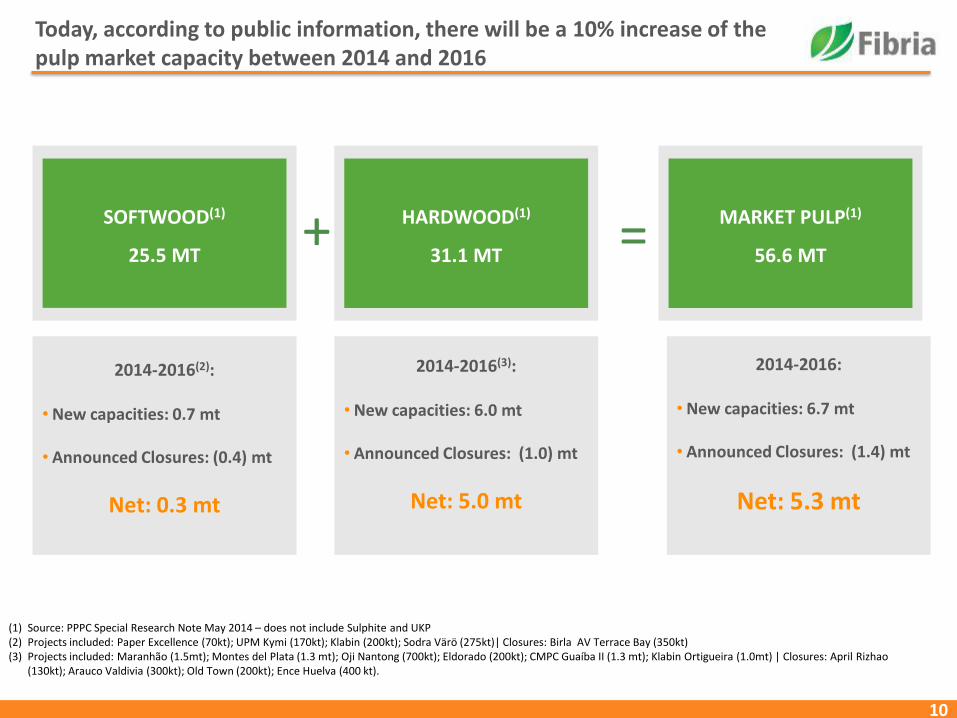
Shipments of Eucalyptus Pulp (1)
(1) Source: PPPC World 20 – December/2013
6%
12%
-1%
23%
Total North America Western Europe China
+844 kt -37 kt
+674 kt
+185 kt
2013 vs. 2012 10M2014 vs. 10M2013
+1,400 kt
+60 kt +255 kt+680 kt
+403 kt
11%
4% 5%
25%
12%
Total NorthAmerica
WesternEurope
China Other
Global Market BEKP Demand
Ktons 2013 2014E 2015E Total
P&W (woodfree) 385 150 576 1,111
Tissue 1,029 1,831 471 3,331
Cartonboard 2,128 1,616 180 3,958
Total 3,542 3,631 1,227 8,400
Paper Capacity increase in China
(1) Source: PPPC World 20 – October/2014

19
World Tissue Consumption, 1991-2013 (3)
Per Capita Consumption of Tissue by World Region (3)China's Share of Market Pulp (2)
24
15 15
12
7 65
1
0
5
10
15
20
25
30
N.America
WestEurope
Japan Oceania EastEurope
LatAm China Africa
9 11 1316
26
1721 20
23
79 10
12
22
1620 19
2110
1012
14
21
17
2223
23
0
2.000
4.000
6.000
8.000
10.000
12.000
2005 2006 2007 2008 2009 2010 2011 2012 2013
Eucalyptus Hardwood Total
5.988
2.436
1.482 1.713
184 12747
6.403
3.037
1.593 1.592
141 2613
0
1.000
2.000
3.000
4.000
5.000
6.000
7.000
BHKP Total LatinAmerica
Indonesia Other* USA Canada WesternEurope
9M2013 9M2014
Latin America is the leading exporter of BHKP to China, accounting to approximately 47% of China's total imports in 9M2014.
(Kg/capita/year)
(million t)(‘000s t) (kg/person/year)
Between 2005 and 2013, the Chinese market share of eucalyptus shipments increased by 14 p.p. (total market pulp: + p.p.)
* includes Russia, China, Thailand and New Zealand
0
5
10
15
20
25
30
35
1991 1996 2001 2006 2009 2010 2011 2012 2013N.America W.Europe E.Europe L.AmericaMiddle East Japan China Asia FEOceania Africa
LTM Growth Rate +4.2%
Benefiting From China’s Growth
China’s Hardwood Imports of BHKP by Country (1)
(1) PPPC – Pulp China(2) PPPC – W20. Coverage for chemical market pulp is 80% of world capacity (3) RISI
(In percentage)
20
Financial and Operational Highlights

21
No exposure eletricity shortage risks, in spite of which the companyhas benefited from the sale of its surplus energy
Energy sales and operational efficiency have contributed for cash production cost stability.(Utilities: 3Q14: R$ 34/t I 2Q14: R$ 36/t I 3Q13: R$ 12/t)
501 502
4 18 ( 23 ) 2
3Q13 MaintenanceDowntimes
Wood Utilities Other 3Q14
+ 0.2%
22
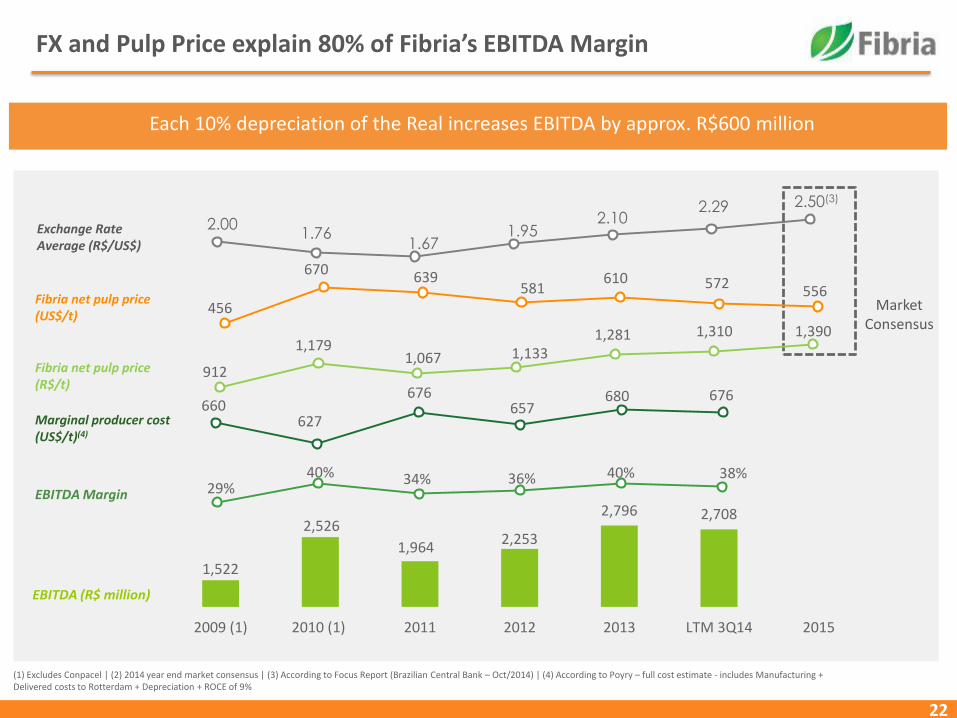
FX and Pulp Price explain 80% of Fibria’s EBITDA Margin
(1) Excludes Conpacel | (2) 2014 year end market consensus | (3) According to Focus Report (Brazilian Central Bank – Oct/2014) | (4) According to Poyry – full cost estimate - includes Manufacturing + Delivered costs to Rotterdam + Depreciation + ROCE of 9%
Each 10% depreciation of the Real increases EBITDA by approx. R$600 million
1,522
2,526
1,9642,253
2,796 2,708
2009 (1) 2010 (1) 2011 2012 2013 LTM 3Q14 2015
2.00 1.76
1.67 1.95
2.10 2.29 2.50(3)
Exchange Rate Average (R$/US$)
EBITDA Margin
EBITDA (R$ million)
29%40% 34% 36% 40% 38%
Marginal producer cost(US$/t)(4)
Fibria net pulp price(US$/t)
Market Consensus
456
670 639 581
610 572 556
660 627
676 657
680 676
912
1,1791,067 1,133
1,281 1,310 1,390
Fibria net pulp price(R$/t)

23
Fibria delivers one of the highest EBITDA/t and FCF/t of the industry
Free cash flow generation - 3Q14 LTM (R$ Million)
Free Cash Flow per ton - 3Q14 LTM (R$/ton)(1)
2,708
1,119
(1,509)(370)
317
(20) (7)
Adjusted EBITDA Capex Interest(paid/received)
Working Capital Taxes Other Free Cash Flow
507
210
(283)(69)
59
(4) (1)
Adjusted EBITDA Capex Interest(paid/received)
Working Capital Taxes Other Free Cash Flow
(1) Does not include: asset sales, expenses on bonds repurchase, expenses related to the REFIS on subsidiaries profits abroad and tax credits from theBEFIEX program.

24
Net Debt/EBITDA (x)(1)
Fibria Arauco CMPC Klabin Suzano
S&P BB+/Positive BBB-/Stable BBB+/Negative BBB-/Negative BB/Stable
Moody’s Ba1/Positive Baa3/Stable Baa3/Negative - Ba2/Stable
Fitch BBB-/Stable BBB/Stable BBB+/Stable BBB-/Negative BB/Stable
(1) Fibria’s historical data in BRL. | (2) Market consensus.
Capital Structure: Fibria has achieved the lowest leverage ratio among its Latin American peers
2.4 2.3
2.72.6
4.84.5 4.5
4.2
1.7 1.7
2.4
2.72.93.1
3.13.7
3.6 3.7 3.6
14.813.2
11.711.1
4Q11 1Q12 2Q12 3Q12 4Q12 1Q13 2Q13 3Q13 4Q13 1Q14 2Q14 3Q14 2014
Fibria Suzano Klabin CMPC Arauco Eldorado
2
25
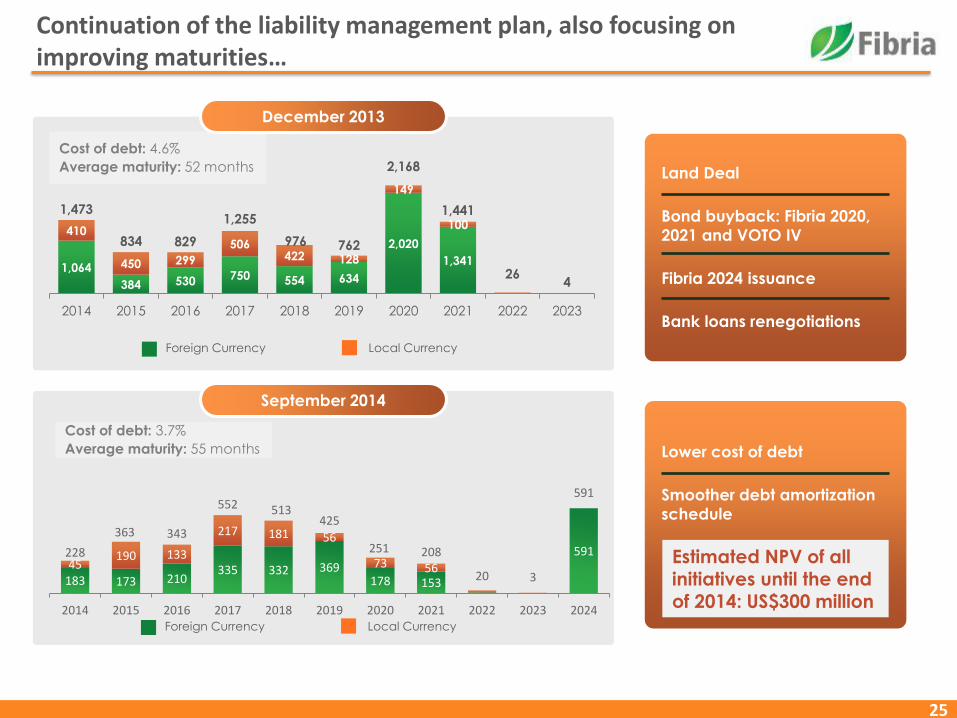
Continuation of the liability management plan, also focusing on improving maturities…
1,064
384 530 750 554 634
2,020
1,341
-
410
450 299
506422 128
149
100
1,473
834 829
1,255
976 762
2,168
1,441
264
2014 2015 2016 2017 2018 2019 2020 2021 2022 2023
Cost of debt: 4.6%
Average maturity: 52 months
December 2013
Local CurrencyForeign Currency
September 2014
Cost of debt: 3.7%
Average maturity: 55 months
Local CurrencyForeign Currency
Land Deal
Bond buyback: Fibria 2020,
2021 and VOTO IV
Fibria 2024 issuance
Bank loans renegotiations
Lower cost of debt
Smoother debt amortization
schedule
Estimated NPV of all initiatives until the end of 2014: US$300 million
183 173 210335 332 369
178 153
59145
190 133
217 181 56
73 56228
363 343
552 513425
251 208
20 3
591
2014 2015 2016 2017 2018 2019 2020 2021 2022 2023 2024

26
… But the initiatives have not finished. There are certain ongoing negotiations that will improve Fibria’s debt profile even further
26
▶ Repurchase of costly debt
▶ Issuance of a Syndicated EPP (US$400 MM)
▶ Joint Bookrunners: BNP Paribas and Natixis (full commitment)
▶ Tranche A: L + 1.30% p.a.| 5 year term loan with the amortization starting at the end of year 4.
Cost reduction of 32.5 bps from our last comparable EPP.
▶ Tranche B: L + 1.40% p.a. | 5-year Term Loan with a bullet repayment.
Average term increase of 1 year and cost reduction of 22.5 bps from our last comparable EPP.
▶ Tranche C: L + 1.55% p.a. | 6-year Term Loan with the amortization starting on Jan/2020.
Average term increase of 1.5 years and cost reduction of 7.5 bps from our last comparable EPP.
514(cash)
627(revolver)
2014 2015 2016 2017 2018 2019 2020 2021 2022 2023 2024
Other ACC/ACE ECN BNDES Bond EPP
FCF 3Q14 LTM: US$489 mn
Amortization Schedule – Pro-forma Dec/14 - US$ mn

27
A consistent and disciplined approach focused on reducing debt and its cost
Debt (US$ million) x Leverage (US$) Interest (US$ million) x Cost of Debt (US$)
Free Cash Flow Increase
Interest Reduction
Cost of Debt Reduction
This dynamics creates a virtuous
cycle
8.6
3.5
6.3
3.0
2009 2010 2011 2012 2013 Sept/2014
Gross Debt Net Debt
7.5
4.1 4.23.3
2.6 2.5473
414 408350
268217
2009 2010 2011 2012 2013 LTM 3T14
6.3 5.95.5
5.2 4.6 3.7

28
New issuance better priced than Investment Grade issuers
Rating Maturity Volume T-Spread Coupon X Book
Fibria Ba1 / BBB- / BB+ 2024 US$600 mn 275 bps 5.25% 11.5x
Braskem Baa3/BBB-/BBB- 2024 US$500 mn 340 bps 6.45% 11.0x
Petrobras Baa1/BBB/BBB 2024 US$2.5 bn 350 bps 6.28% 3.3x
Klabin BBB-/BBB- 2024 US$500 mn 269 bps 5.25% 6.0x
Samarco BBB-/BBB 2024 US$500 mn 288 bps 5.375% 3.6x
Rating Maturity Volume G-Spread Yield
Fibria Ba1 / BBB- / BB+ 2024 US$600 mn 289 bps 5.047%
Braskem Baa3/BBB-/BBB- 2024 US$500 mn 362 bps 5.742%
Klabin BBB-/BBB- 2024 US$500 mn 332 bps 5.490%
Odebrecht Baa3/BBB-/BBB 2023 US$800 mn (1) 297 bps 5.017%
Petrobras Baa1/BBB/BBB 2024 US$2.5 bn 368 bps 5.817%
Gerdau Baa3/BBB-/BBB- 2023 US$750 mn 308 bps 5.130%
Samarco BBB-/BBB 2024 US$ 500 mn 366 bps 5.848%
(1) Outstanding: US$102 mn
Secondary Market - As of Nov 28, 2014
Issuance

Fibria Cash Production Cost (1) (R$/ton)
Consistently controlling the
production cash cost at a level
below the inflation pace
29
Cash Production Cost saw a annual increaseof 3.7% over the past 6 years
(1) Excludes Conpacel.
432448
471 473505 518
2009 (2) 2010 (2) 2011 2012 2013 3Q14 LTM
CAGR: + 3.7%

30
Fibria has the simplest and most transparent call in the industry
Negative Neutral Positive
Pulp supply ✔
Closures/conversions ✔
Inefficient capacities in China ✔
Demand ✔
‣ Fiber and grade substitution ✔
‣ Tissue ✔
‣China ✔
Pulp price ✔
Brazil GDP ✔
Energy crisis ✔
FX ✔
Capex inflation ✔
Cost inflation ✔
Rating ✔
Tax ✔
Corporate Governance ✔

31
Final Remarks

32
PULP
- Growth with discipline
- Best portfolio of projects
BIO-ENERGY
- Complementary to pulp
- Ensyn
INDUSTRY
CONSOLIDATION ?
OTHER OPPORTUNITIES
- Portocel
- Land and forest
Potential Growth
Prospects
Fibria is seeking value creation for its shareholders with capital discipline

33
593 593 605 584648 649
900826
766678 699
2009* 2010* 2011 2012 2013 3Q14 LTM
4,600
5,0545,184
5,299 5,271 5,251
2009* 2010* 2011 2012 2013 3Q14 LTM
The maturity of synergies captured since Fibria’s creation improved its operating indicators…
+14%
PRODUCTION VOLUME (000 t)BEST PRACTICES AND OPERATING STABILITY
Historical Value Inflation Effect**
-21%
CASH COST (R$/ton)
Historical Value Inflation Effect**
-28%
SG&A (R$ million)STRUCTURE AND PROCESS SIMPLIFICATION
1,522
2,526
1,964 2,253
2,796 2,708
2009* 2010* 2011 2012 2013 3Q14 LTM
29%
40%34% 36%
40% 38%
EBITDA (R$ million) - EBITDA MARGIN (%)
* Excludes Conpacel | ** IPCA index considered to calculate the inflation effect
432 448 471 473 505 518
656 624 596549 545
2009* 2010* 2011 2012 2013 3Q14 LTM

34
Key Highlights
Sound credit profile, with decreasing leverage ratios
Market leader with a highly profitable operation and cash cost below industry average
Highly experienced and qualified management team
Highly recognized and awarded by industry specialists

35
Back up

36
3Q14 Results
Cash Production Cost (R$/t)
Pulp Production and Sales (‘000 t) Net Revenue (R$ million)
EBITDA (R$ million) and EBITDA Margin (%)
1.347
1.271
1.345 1.301
1.334 1.372
3Q13 2Q14 3Q14
Production Sales
1.8411.694 1.746
3Q13 2Q14 3Q14
482 486 478 501
559502
3Q13 2Q14 3Q14
Cash cost ex-scheduled downtimes Cash cost
762
594 613
3Q13 2Q14 3Q14
41%35% 35%
37
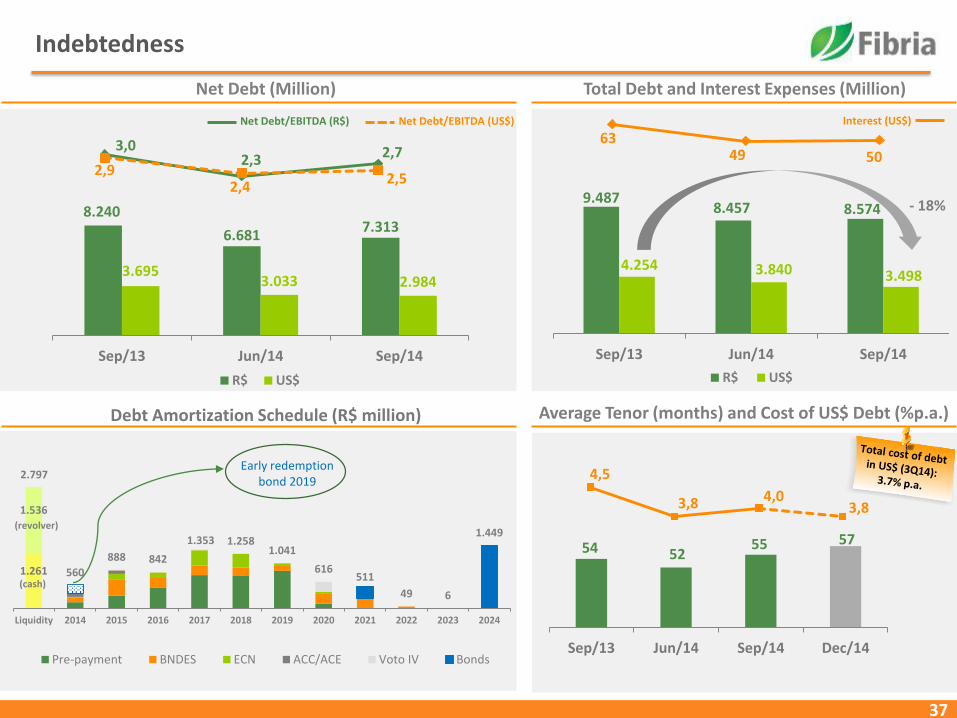
Indebtedness
Net Debt (Million) Total Debt and Interest Expenses (Million)
Net Debt/EBITDA (US$)Net Debt/EBITDA (R$)
Debt Amortization Schedule (R$ million) Average Tenor (months) and Cost of US$ Debt (%p.a.)
3,02,3 2,7
2,9 2,4
2,5
8.240
6.6817.313
3.6953.033 2.984
Sep/13 Jun/14 Sep/14
R$ US$
9.4878.457 8.574
4.254 3.840 3.498
Sep/13 Jun/14 Sep/14
R$ US$
6349 50
- 18%
Interest (US$)
1.261
1.536
2.797
560
888 842
1.353 1.2581.041
616511
49 6
1.449
Liquidity 2014 2015 2016 2017 2018 2019 2020 2021 2022 2023 2024
Pre-payment BNDES ECN ACC/ACE Voto IV Bonds
(cash)
(revolver)
Early redemptionbond 2019
4,5
3,8 4,03,8
54 5255 57
Sep/13 Jun/14 Sep/14 Dec/14

38
Fibria’s tax structure
Tax benefits (R$)
Fiscal - annual adjustment
Benefit Amount Maturity
Goodwill
(Aracruz
acquisition)
Annual tax deduction:
R$85 million (tax)
Remaining Balance Sep/14:
R$1,2 bilion (base)
2018
Forestry Capex in
Mato Grosso do
Sul state
LTM 3Q14 tax deduction
related to depletion: R$31
million
Undefined
Tax loss carry forward and tax credits
Benefit Amount
Tax loss
carryforward
Balance up to Sept. 14: R$332
million (base)
Accumulated tax
credits
Balance Sept./2014:
-PIS/COFINS: R$556 million
-withholding tax (IR and CSLL):
R$604 million
-Befiex: R$537 million
Tax payment (cash basis)
2009 2010 2011 2012 2013 LTM 3Q14
R$ 7 million R$ 16 million R$ 4 million R$ 15 million R$ 31 million R$ 20 million

39
Liquidity Events: delivered as promised
1,361
5,715
1,045
850
836
1,403
1,268
1,851
1,625
EQUITY OFFERING FOREST SALE 2012 (1) FCF 2012 LAND DEAL FCF 2013 TOTAL
4.8 5.2 4.7 4.53.4 3.1 3.3 3.0 2.8 2.4 2.3 2.7
Dec/11 Mar/12 Jun/12 Sep/12 Dec/12 Mar/13 Jun/13 Sep/13 Dec/13 Mar/14 Jun/14 Set/14
Net Debt/EBITDA (x) R$
(1) Losango and forestry assets and land in the south of Bahia State
2012 Bond prepayment
2013 Bond prepayment
Available
Sources (R$ Million) Uses (R$ Million)
2014 Bond prepayment
REFIS
40
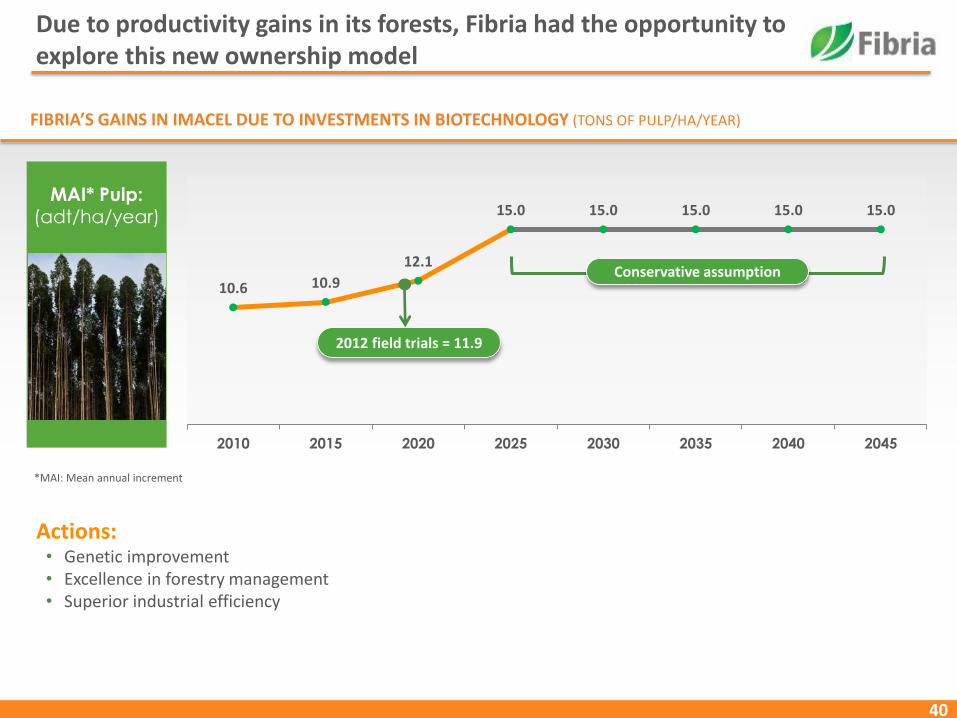
Due to productivity gains in its forests, Fibria had the opportunity to explore this new ownership model
MAI* Pulp: (adt/ha/year)
10.6 10.9
12.1
15.0 15.0 15.0 15.0 15.0
2010 2015 2020 2025 2030 2035 2040 2045
FIBRIA’S GAINS IN IMACEL DUE TO INVESTMENTS IN BIOTECHNOLOGY (TONS OF PULP/HA/YEAR)
2012 field trials = 11.9
Conservative assumption
*MAI: Mean annual increment
Actions: • Genetic improvement• Excellence in forestry management• Superior industrial efficiency

41
Leadership position
(1) Fiber Consumption, Recycled Fiber and Pulp: RISI | Market Pulp, Hardwood and Eucalyptus: PPPC Special Research Note - May 2014
Recycled Fiber 234 million t
49% 51%
60%
18% 82%
58% 42%
40%
35% 65%
29%71%
Fiber Consumption403 million t
Pulp 169 million t
Chemical139 million t
Mechanical31 million t
Integrated Mills 84 million t
Market Pulp 56 million t
Hardwood29 million t
Other Eucalyptus Pulp producers:
13 million t
Softwood/Other 27 million t
Acacia/Other 10 million t
Eucalyptus19 million t
Industry Outlook(1)

42
Global Paper Consumption
1996 1997 1998 1999 2000 2001 2002 2003 2004 2005 2006 2007 2008 2009 2010 2011 2012 2013 2014 2015 2016
Developed Markets Emerging Markets
1996 1997 1998 1999 2000 2001 2002 2003 2004 2005 2006 2007 2008 2009 2010 2011 2012 2013 2014 2015 2016
Developed Markets Emerging Markets
CAGR 1996 – 2006Developed Markets: + 1.7%Emerging Markets : + 6.0%
85,291
117,611
15,548
37,474
P&W Consumption (000 tons)(1)
Tissue Consumption (000 tons)(1)
114,507
CAGR 2007 – 2016Developed Markets: - 4.0%Emerging Markets : + 4.1%
CAGR 1996 – 2006Developed Markets: + 2.4%Emerging Markets : + 6.9%
CAGR 2007 – 2016Developed Markets: + 1.4%Emerging Markets : + 6.7%
26,877
Source: RISI

43
China: Internal Consumption and Urbanization
China’s private consumption vs. exports(CNY trillion and annual % change) (1)
Chinese Urbanization Driver of Long-Term Growth(UN Population Projections, Millions)(2)
Sources: (1) The Economist. (2) RISI China Pulp Market Study.
Shift from exports to private consumption;
Positive effects on households income and rising standards of living.

44
Fibria was elected as 1st place in the
pulp & paper sector in the corporate
governance and future's vision categories
Fibria is one of the 5 Brazilian companies
nominees to the Best Corporate
Governance
Award from London.
Company of the year,
among all industries,
according to Valor
Econômico.
Valor 1000
XVII ANEFAC-FIPECAFI - SERASA
EXPERIAN Prize
Fibria is among the most
transparent public companies
in Brazil, recognized for the
quality of its 2012 financial
statements.
Fibria was ranked for the fifth
consecutive year (2010, 2011, 2012,
2013 and 2014).
2014 Institutional Investor Latam Ranking -
P&P Sector
Fibria was selected as one of the 10 best
companies in transparency.
The only one in the pulp &
paper sector.
CDP Brasil 100 – Climate Change 2013
ReportÉpoca Negócios 360º
International Recognition by Corporate
Governance Report
Fibria was elected as 2nd place.
The prize highlights the
business profitability,
share profitability,
liquidity, corporate
governance and sustainability.
The Best Companies to the Shareholders
Prize of Capital Aberto Magazine
Fibria is the only Latin America company
selected by RobecoSAM (responsible for
DJSI) as one of the 10 worldwide leaders in
SRI magazine’s “The 10 Game Changers –
Changing the industry through
sustainability”.
RobecoSAM - Sustainability Investing
Magazine
Selected to Dow Jones World and
Emerging Markets Sustainability
Indices for 2014/15 of Forestry
Resources and Paper sector.
DJSI World and DJSI Emerging Markets
Acknowledgments: Governance, Transparency, Profitability & Sustainability