Embed Size (px)
Citation preview
MEETING THE NDP’S LABOUR MARKET OBJECTIVESA CRITICAL REVIEW

Paul Benjamin (BA, LLB, LL.M) Director: Cheadle, Thompson & Haysom Inc. Attorneys; Extraordinary Professor, Department of Mercantile & Labour Law, University of the Western Cape. and Ayabonga Cawe (B.COM, B.COM Honours, M.COM)Managing Director: Xesibe Holdings
MEETING THE NDP’S LABOUR MARKET OBJECTIVESA CRITICAL REVIEW
TABLE OF CONTENTS1 Executive Summary 102 Introduction 18
2.1 Objectives 182.2 Context 182.3 The National Development Plan on the Labour Market 20
3 Background 243.1 Approach and methodology 253.2 The Labour Market Vision – an Adaptive and Responsive Labour Market 253.3 Improving Lifelong Learning and Career Advancement 263.4 Improving Labour Market Matching and Transitions 263.5 Experimenting with Various Youth Labour Market Interventions 263.6 Stabilising the Labour Environment, Improving Dispute Resolution and Shop Floor Relations 273.7 Clarifying Dismissal and Retrenchment Provisions in the Labour Relations Act 273.8 Reviewing Legal Regulations and Operating Standards for Small Businesses 273.9 Identifying Effective Routes to More Equitable Wage Determination in the Private Sector 273.10 Public Sector Labour Relations Should be Conducive to Delivery and Employment 28
4 South Africa’s Labour Market Performance and Outcomes 304.1 Historical Context - Apartheid 304.2 Geography, Migration and the Labour Market 344.3 Protection of Workers in the Informal Economy 374.4 Platform Work, On-Demand Services and the Future of Work 384.5 Climate Change and the Labour Market 38
5 Government Action to Achieve the Objectives of the National Development Plan 405.1 Improving Lifelong Learning and Career Advancement 405.2 Access to Higher Education, Vocational and Workplace Training 405.3 Institutional Performance and Financing of the PSET Sector 44
5.3.1 The National Skills Fund (NSF) 445.3.2 Active Labour Market Policy Framework 455.3.3 Labour Activation Mechanisms - The Unemployment Insurance Fund (UIF)) 45
5.4 Improving Labour Market Matching and Transitions 475.4.1 Employment Services South Africa (ESSA)
Training and Communication Resources 475.4.2 The Jobs Fund 515.4.3 Private Sector Initiatives 535.4.4 Temporary Employment Services (TESs) 535.4.5 Experimenting with Various Labour Market Interventions Directed at the Youth 545.4.6 Youth Employment Tax Initiative (YETI) 555.4.7 Public Sector Departmental Initiatives 585.4.8 The National Youth Development Agency, Youth Labour Centres 585.4.9 Youth Employment Services (YES) 60
5.5 Stabilising the Labour Environment, Improving Dispute Resolution and Shop Floor/Workplace Relations 61
5.5.1 Labour Relations Climate – Managing Strike Action and Prolonged Industrial Disputes 61
5.5.2 Commission for Conciliation, Mediation and Arbitration (CCMA) 635.5.3 The CCMA/BUSA Labour Advice Tool for small businesses 645.5.4 The Temporary Employee/Employer Relief Scheme (TERS) 64
5.5.5 Labour Court and Labour Appeal Court 655.5.6 Bargaining Councils 655.5.7 Labour Inspection and Enforcement Service 665.5.8 National Economic Development and Labour Council (Nedlac) 67
5.6 Clarifying Dismissal and Retrenchment Provisions in the Labour Relations Act 685.6.1 Dismissal 685.6.2 Restriction of Rights of Higher-Paid Employees 705.6.3 Reviewing Regulations and Standards for Small Businesses 715.6.4 Skills Development Levy 725.6.5 Registration of Private Employment Agencies 725.6.6 Small Business and Bargaining 735.6.7 AffirmativeAction 745.6.8 Extending Bargaining Council Agreements 745.6.9 BUSA-CCMA Web Tool 74
6 Identifying Effective Routes to more Equitable Wage Determinations in the Private Sector 766.1 Who determines wages in South Africa? 766.2 Fair Distribution of Earnings – The National Minimum Wage and Excessive Pay 786.3 The National Minimum Wage 796.4 Section 27 of the Employment Equity Act (EEA) 806.5 What has the Employment Equity Act’s provisions on income differential achieved? 806.6 Other Employment Equity-Related Issues 826.7 Lowering the cost drivers for poor households – How has our social wage performed? 836.8 Transport, education, healthcare, access to water, electricity and food 856.9 Gaps in the Social Wage 866.10 An ethical, developmental and capable state 88
7 Public Sector Labour Relations Conducive to Effective Service Delivery and a Salary Structure Conducive to Long-Term Public Sector Objectives 907.1 Public Sector Labour Context 917.2 Remuneration 937.3 Labour Relations and Wage-Setting 957.4 Wages,Benefits,PayProgressionandOccupationalSpecificDispensations 957.5 Pay Progression Policies 967.6 BenefitStructures 977.7 OccupationSpecificDispensation(OSD) 987.8 Reviewing Public Bargaining Structures and Clarifying What Essential Services Entails 100
7.8.1 Separate Chambers: A Different Approach to Public Service Bargaining 1007.8.2 Clarifying Dispute Resolution: Essential Services 1007.8.3 The Debate on Essential Services 101
8 The Expanded Public Works Programme – A Case Study (See also Appendix 4) 104
8.1 International Benchmarkin 1069 Concluding Remarks and Policy Recommendations 108
Endnotes 114References 128Appendix 1: List of Abbreviations 134Appendix 2: List of Respondents (Interviews) 135Appendix 3: A Case Study on Employment Creation Incentives 136Appendix 4: A Case Study on the Expanded Public Works Programme (EPWP) 138Appendix 5: History of Labour Brokers in SA 141Appendix 6: International Benchmarking Case Study 143Appendix 7: CCMA Training Interventions 153

List of Tables
Table 1: Employment Growth and Share by sector 2001-2016 30 Table 2: Employment by sector and skills level, % share, 1995-201512 31 Table 3: Real Wage Inequality, 1995 – 2014 32 Table 4: Unemployment rate by province, Q3 2019 32 Table 5: Progress Towards Key Performance Indicators in the PSET System 39 Table 6: Budget for Public Employment Services 48 Table 7: The Performance of the Jobs Fund 50 Table 8: YETI monthly incentive value by monthly wage of eligible worker 53 Table 9: Performance of Selected Public Sector Led Youth-Focused Labour Market Interventions /
NEETfiguresbasedonyouthbetweentheagesof15-34fromStats 56 Table 10: Reasons behind strike action in 2016 and 2017 60 Table 11: Proportion of Workers Covered by Sectoral Determination by Firm Size 71 Table 12: Percentage of Workforce by How Wages are Determined 75 Table 13: Wages in Sectoral Determination Sectors 77 Table 14: Number of Employees Receiving Work-Linked Entitlements (pension fund contributions
and paid leave), Q3 2019 81 Table 15: Personnel Changes in the Public Service 2006 – 2018 by province 90 Table 16: Distribution of Personnel by Salary Grade 1-16 (excl. SANDF) 91 Table 17: Salary Levels in the Public Service 2006-2018 94 Table 18: Selected OSD groups and remuneration (excl. SANDF) 96 Table 19: 2018-2021 Wage Agreement Compared to Compensation Budget 97
List of Figures
Figure 1: Occupational structure and educational level, 2007 29Figure 2: Occupational structure and educational level, 2017 29Figure 3: Labour Market Outcomes of Migrant Populations in South Africa, 2012-2017 Reason for
migration of internal-migrants and immigrants, 2012 and 2017 33Figure 4: Labour Market Outcomes for Migrant Populations 35Figure5: ContributoryBenefitsbyEmployer(UIFandPensionFund)forMigrantPopulations 35Figure 6: ESSA Placement in proportion to discouraged work seekers 46Figure 7: Fiscal Cost per Job, by Policy Measure 54Figure 8: Shows the geographical spread of NYDA placements 57Figure 9: Composition of Employment by Sector and Firm Size 71Figure 10: Workers Covered By Sectoral Determinations (Minimum Wage Zone) and Workers
Covered By Collective Bargaining By Salary Level (1-25) 76Figure 11: Percentage support for legislation to limit executive pay by demographic attributes 79Figure12: PercentageofHouseholdsandIndividualswhohaveBenefitedfromSocialGrants,
2003 – 2018. 82Figure 13: Budgeted Social Wage Expenditure (basic education, health, housing, water and social
grants) 2015-2022 (in billions) 83Figure 14: Fulltime equivalent personnel in the public service 2006-2018 90Figure 15: Average (%) remuneration growth in the public service and the rest of the economy 91Figure 16: Drivers of Higher Compensation Spending 2006 – 2018 93Figure 17: Distribution of public servants by real monthly salary 95


Chapter
01

10
EXECUTIVE SUMMARYThe South African labour market and its trajectory is intimately tied to the history and political eco-nomy of South Africa. It was central to the grand designs of the apartheid and colonial administrations. These policies were aimed at the creation and reinforcement of a ‘race-based, dual labour market’. The early pieces of legislation in the Union of South Africa after 1910, such as the Native Labour Regulation ActandtheMinesandWorksActs,fixedtheparametersofnotonlythelabourmarketbutthesegre-gation of public life and ultimately apartheid. Throughout much of the twentieth century, industrial expansion and the expansion of a modernizing economy, created a labour market with protections and bargaining frameworks for White workers, and slave-like conditions for African workers.
The rise of independent trade unions in the 1970s opened the space for bargaining, organizing and other labour rights, and entrenched a vibrant and militant culture of trade unionism in South Africa that won many rights for working people on the shop-floor and beyond. Since 1994, our legislative framework protects workers against unfair labour practices and pursues greater collaboration between workers and employers, while promoting equity and skills development. The technolo-gical and structural changes in key sectors of the economy since 1994 have influenced the growth of labour demand to favour workers with better skills. However, a history of exclusion and poor education outcomes means that race (and class and geography) remain key deter-minants of labour market participation and economic mobility. Moreover, even in the con-temporary period, many South African workers do not have a say in how much they are paid nor do they control the conditions of their employment.
Income and pay disparities (by race, gender, nationality and occupational category) are prevalent, contributing to widespread inequality. These structural constraints make it even more difficult for young people to enter and stay in the labour market in the context of a youth unemployment crisis. The Quarterly Labour Force Survey (QLFS) in the first quarter of 2020 indicates the scale of this crisis: The unemployment rate for those between the ages of 25-34, stood at 37.3% (higher than the national rate of 31%), and the rate is much higher (56%) for those between the ages of 15-24
(Statistics South Africa (Stats SA), 2020). Within this cohort, unemployment levels are much higher for those without a secondary qualifi-cation, reflecting the shifting skill intensity of occupations across different industries.
This coupled with challenging industrial relations within the public sector and concerns about the impact of labour laws and regulations on the job creation potential of small businesses complicate the unfolding story of the post-apar-theid labour market.
It is to this context that the National Development Plan (NDP) sought to respond in 2012. The Plan envisions an ‘adaptive and responsive labour market’, that expands employment opportunities whilst raising living standards and reducing inequality. On the supply-side, and in response to the skills constraints in the South African economy, the NDP recognises the need to encourage and improve lifelong learning and career advancement through the acquisition of skills in the training ecosystem and within the workplace. On the demand-side, the Plan also recognizes the importance of equitable sharing of productivity improvements through expanded employment and improvements in remuneration. Moreover, the Plan envisages a critical role for investment in expanding the economic base from which employment opportunities emerge.
11
The proposals of the NDP, both specific and broad, are premised on supply and demand side interventions, coupled with labour regulations that entrench progressive protections for vulnerable workers, improve work-seeker support and confront increasingly acrimonious industrial relations that place severe limitations on national economic goals. In these cases, the NDP suggests the need for better dispute resolution mechanisms for the creation of a labour relations environment conducive to pro-ductivity growth.
Further, the Plan articulates the aspiration of an ethical, capable and developmental state. Within this framework, the NDP highlights
the current industrial relations challenges in the public service, which limits the delivery of public goods and is not conducive to effective service delivery. On this score, as with the issues highlighted above, the NDP makes specific proposals that we consider.
Our task is to review these proposals against what has been implemented in the labour market since the publication of the NDP in 2012, and consider (where relevant and necessary), changes in the labour market that necessitate new approaches and interventions. We outline some of these implementation issues and further areas for consideration in the table below.
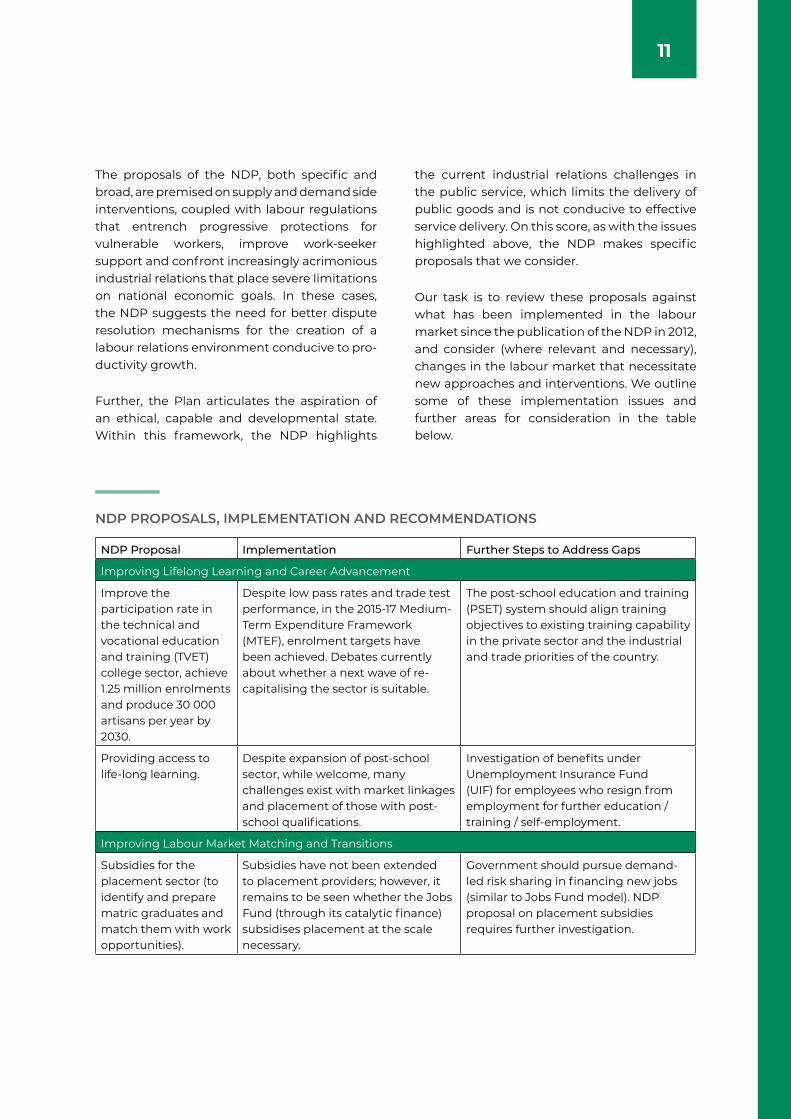
NDP PROPOSALS, IMPLEMENTATION AND RECOMMENDATIONS
NDP Proposal Implementation Further Steps to Address Gaps
Improving Lifelong Learning and Career Advancement
Improve the participation rate in the technical and vocational education and training (TVET) college sector, achieve 1.25 million enrolments and produce 30 000 artisans per year by 2030.
Despite low pass rates and trade test performance, in the 2015-17 Medium-Term Expenditure Framework (MTEF), enrolment targets have been achieved. Debates currently about whether a next wave of re-capitalising the sector is suitable.
The post-school education and training (PSET) system should align training objectives to existing training capability in the private sector and the industrial and trade priorities of the country.
Providing access to life-long learning.
Despite expansion of post-school sector, while welcome, many challenges exist with market linkages and placement of those with post-school qualifications.
Investigation of benefits under Unemployment Insurance Fund (UIF) for employees who resign from employment for further education / training / self-employment.
Improving Labour Market Matching and Transitions
Subsidies for the placement sector (to identify and prepare matric graduates and match them with work opportunities).
Subsidies have not been extended to placement providers; however, it remains to be seen whether the Jobs Fund (through its catalytic finance) subsidises placement at the scale necessary.
Government should pursue demand-led risk sharing in financing new jobs (similar to Jobs Fund model). NDP proposal on placement subsidies requires further investigation.
12
NDP Proposal Implementation Further Steps to Address Gaps
Improving Labour Market Matching and Transitions
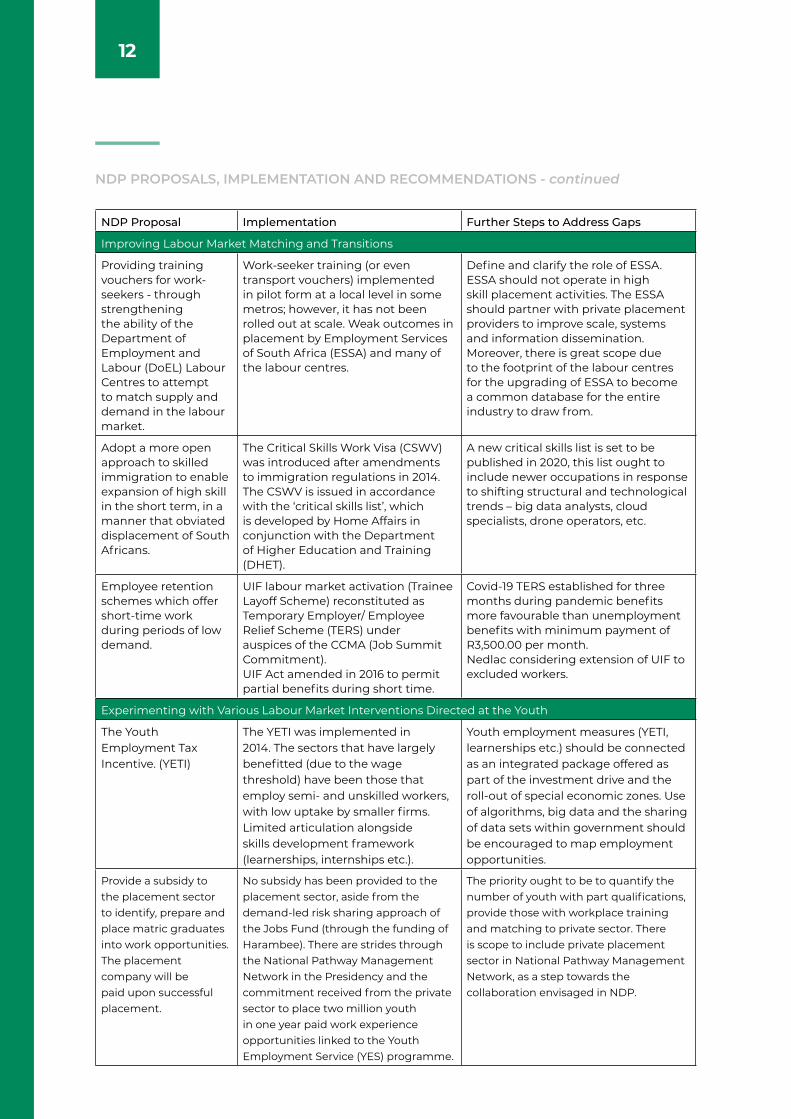
Providing training vouchers for work-seekers - through strengthening the ability of the Department of Employment and Labour (DoEL) Labour Centres to attempt to match supply and demand in the labour market.
Work-seeker training (or even transport vouchers) implemented in pilot form at a local level in some metros; however, it has not been rolled out at scale. Weak outcomes in placement by Employment Services of South Africa (ESSA) and many of the labour centres.
Define and clarify the role of ESSA. ESSA should not operate in high skill placement activities. The ESSA should partner with private placement providers to improve scale, systems and information dissemination. Moreover, there is great scope due to the footprint of the labour centres for the upgrading of ESSA to become a common database for the entire industry to draw from.
Adopt a more open approach to skilled immigration to enable expansion of high skill in the short term, in a manner that obviated displacement of South Africans.
The Critical Skills Work Visa (CSWV) was introduced after amendments to immigration regulations in 2014. The CSWV is issued in accordance with the ‘critical skills list’, which is developed by Home Affairs in conjunction with the Department of Higher Education and Training (DHET).
A new critical skills list is set to be published in 2020, this list ought to include newer occupations in response to shifting structural and technological trends – big data analysts, cloud specialists, drone operators, etc.
Employee retention schemes which offer short-time work during periods of low demand.
UIF labour market activation (Trainee Layoff Scheme) reconstituted as Temporary Employer/ Employee Relief Scheme (TERS) under auspices of the CCMA (Job Summit Commitment). UIF Act amended in 2016 to permit partial benefits during short time.
Covid-19 TERS established for three months during pandemic benefits more favourable than unemployment benefits with minimum payment of R3,500.00 per month.Nedlac considering extension of UIF to excluded workers.
Experimenting with Various Labour Market Interventions Directed at the Youth
The Youth Employment Tax Incentive. (YETI)
The YETI was implemented in 2014. The sectors that have largely benefitted (due to the wage threshold) have been those that employ semi- and unskilled workers, with low uptake by smaller firms. Limited articulation alongside skills development framework (learnerships, internships etc.).
Youth employment measures (YETI, learnerships etc.) should be connected as an integrated package offered as part of the investment drive and the roll-out of special economic zones. Use of algorithms, big data and the sharing of data sets within government should be encouraged to map employment opportunities.
Provide a subsidy to the placement sector to identify, prepare and place matric graduates into work opportunities. The placement company will be paid upon successful placement.
No subsidy has been provided to the placement sector, aside from the demand-led risk sharing approach of the Jobs Fund (through the funding of Harambee). There are strides through the National Pathway Management Network in the Presidency and the commitment received from the private sector to place two million youth in one year paid work experience opportunities linked to the Youth Employment Service (YES) programme.
The priority ought to be to quantify the number of youth with part qualifications, provide those with workplace training and matching to private sector. There is scope to include private placement sector in National Pathway Management Network, as a step towards the collaboration envisaged in NDP.
NDP PROPOSALS, IMPLEMENTATION AND RECOMMENDATIONS - continued

13
NDP Proposal Implementation Further Steps to Address Gaps
Experimenting with Various Labour Market Interventions Directed at the Youth
Expand learnerships and make training vouchers directly available to work-seekers.
The training voucher scheme seems impractical at this point, as even a significant number of those who have received training in artisanal areas, have been unable to complete their qualifications due to lack of experiential and workplace learning.
Policies aimed at getting young people into work, like the YETI need to be co-articulated with learnerships, internship programmes and empowerment legislation (as in the case of the YES) and facilitated through one ‘regulatory window’ so firms can see the benefits of compliance. This could be done through a common application process that triggers a YETI response and an impact on sector scorecards.
Free driver training lessons for school-leavers.
Driver training (outside Model C and private schools) has not occurred. A programme for school-leavers in no-fee schools, was started by the Gauteng Education Department.
Partnerships between Department of Basic Education/Transport with private sector operators and auto manufacturers to roll this programme out at scale. Facilitate innovative private and public-private interventions that use existing assets of private sector to socialise and underwrite the costs of the job search for youth.
Clarifying Dismissal and Retrenchment Provisions in the Labour Relations Act
Dismissal provisions in Labour Relations Act (LRA) to be simplified/ probation rules changed
CCMA has published and revised guidelines for Arbitrations on Misconduct for Arbitrators to promote consistent decision-making.
Nedlac should prioritise revising the Code of Good Practice: Unfair Dismissal in line with binding court decisions. This should include a separate section for small business.Research for a policy proposal to examine additional changes to the law concerning dismissal, should be undertaken.
Clarifying Dismissal and Retrenchment Provisions in the Labour Relations Act
An effective approach to regulating Temporary Employment Service (TES)
Legislation providing additional protection for low-paid workers placed by TES came into effect on 1 January 2015.Parliament reduced the period for temporary placements from 6 months to 3 months.
Greater monitoring and review of section 198A protections for vulnerable workers, and the ability of workers to access these rights is needed.
Senior managers earning above R 300 000 to be excluded from ambit of CCMA.
Proposal to limit unfair dismissal rights of employees earning in excess of R 1.2 million agreed at Nedlac in 2012 but rejected by Parliament.
Limitation of rights of highly paid employees in respect of unfair dismissal to be considered as part of LRA amendment process.
14
NDP Proposal Implementation Further Steps to Address Gaps
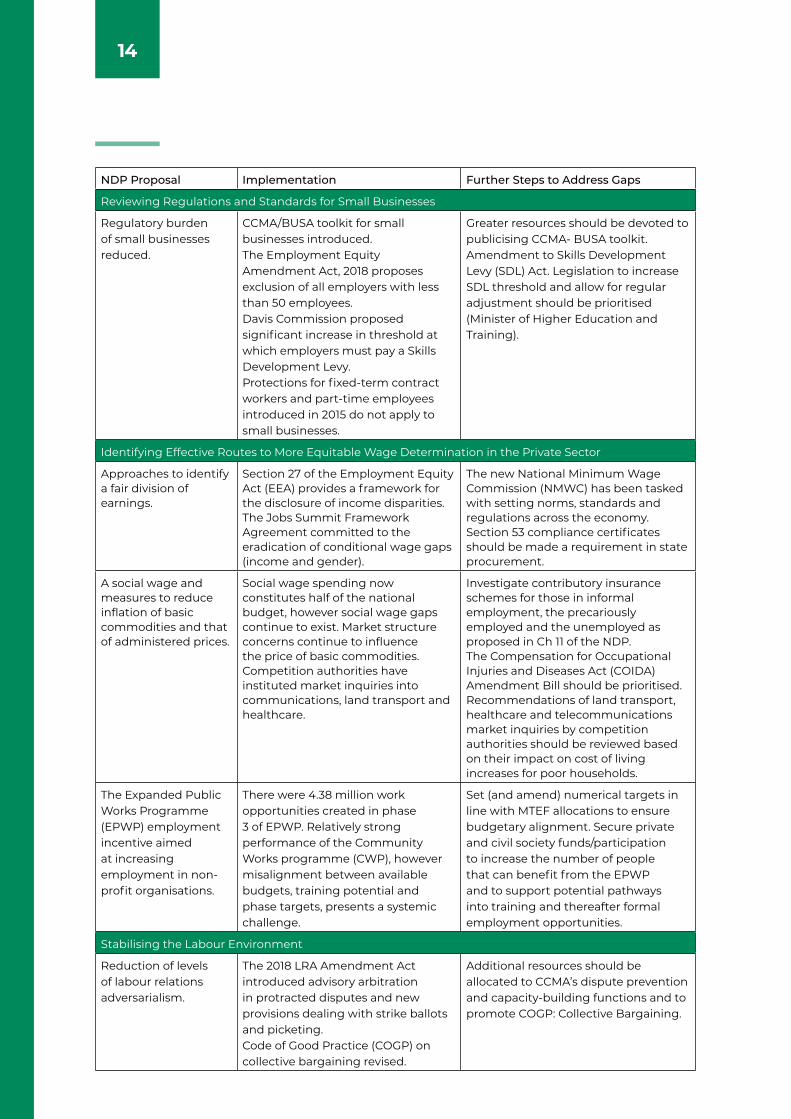
Reviewing Regulations and Standards for Small Businesses
Regulatory burden of small businesses reduced.
CCMA/BUSA toolkit for small businesses introduced. The Employment Equity Amendment Act, 2018 proposes exclusion of all employers with less than 50 employees. Davis Commission proposed significant increase in threshold at which employers must pay a Skills Development Levy.Protections for fixed-term contract workers and part-time employees introduced in 2015 do not apply to small businesses.
Greater resources should be devoted to publicising CCMA- BUSA toolkit. Amendment to Skills Development Levy (SDL) Act. Legislation to increase SDL threshold and allow for regular adjustment should be prioritised (Minister of Higher Education and Training).
Identifying Effective Routes to More Equitable Wage Determination in the Private Sector
Approaches to identify a fair division of earnings.
Section 27 of the Employment Equity Act (EEA) provides a framework for the disclosure of income disparities. The Jobs Summit Framework Agreement committed to the eradication of conditional wage gaps (income and gender).
The new National Minimum Wage Commission (NMWC) has been tasked with setting norms, standards and regulations across the economy. Section 53 compliance certificates should be made a requirement in state procurement.
A social wage and measures to reduce inflation of basic commodities and that of administered prices.
Social wage spending now constitutes half of the national budget, however social wage gaps continue to exist. Market structure concerns continue to influence the price of basic commodities. Competition authorities have instituted market inquiries into communications, land transport and healthcare.
Investigate contributory insurance schemes for those in informal employment, the precariously employed and the unemployed as proposed in Ch 11 of the NDP.The Compensation for Occupational Injuries and Diseases Act (COIDA) Amendment Bill should be prioritised. Recommendations of land transport, healthcare and telecommunications market inquiries by competition authorities should be reviewed based on their impact on cost of living increases for poor households.
The Expanded Public Works Programme (EPWP) employment incentive aimed at increasing employment in non-profit organisations.
There were 4.38 million work opportunities created in phase 3 of EPWP. Relatively strong performance of the Community Works programme (CWP), however misalignment between available budgets, training potential and phase targets, presents a systemic challenge.
Set (and amend) numerical targets in line with MTEF allocations to ensure budgetary alignment. Secure private and civil society funds/participation to increase the number of people that can benefit from the EPWP and to support potential pathways into training and thereafter formal employment opportunities.
Stabilising the Labour Environment
Reduction of levels of labour relations adversarialism.
The 2018 LRA Amendment Act introduced advisory arbitration in protracted disputes and new provisions dealing with strike ballots and picketing.Code of Good Practice (COGP) on collective bargaining revised.
Additional resources should be allocated to CCMA’s dispute prevention and capacity-building functions and to promote COGP: Collective Bargaining.
15
NDP Proposal Implementation Further Steps to Address Gaps
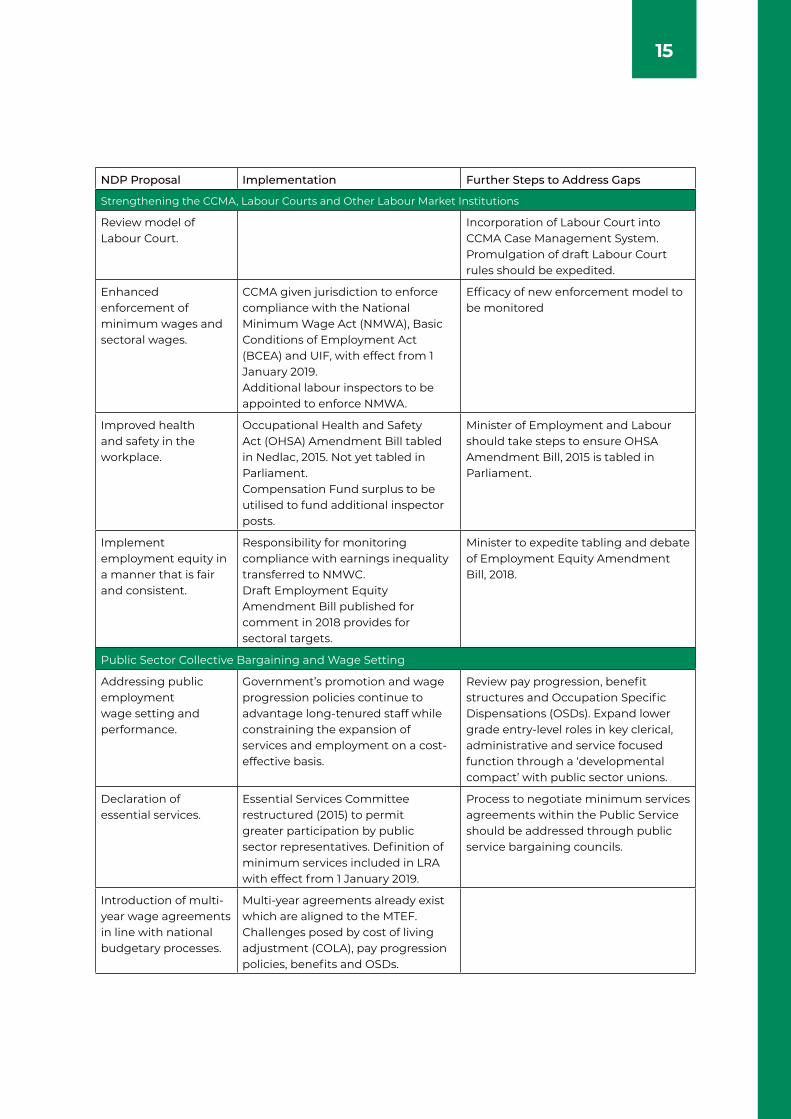
Strengthening the CCMA, Labour Courts and Other Labour Market Institutions
Review model of Labour Court.
Incorporation of Labour Court into CCMA Case Management System. Promulgation of draft Labour Court rules should be expedited.
Enhanced enforcement of minimum wages and sectoral wages.
CCMA given jurisdiction to enforce compliance with the National Minimum Wage Act (NMWA), Basic Conditions of Employment Act (BCEA) and UIF, with effect from 1 January 2019.Additional labour inspectors to be appointed to enforce NMWA.
Efficacy of new enforcement model to be monitored
Improved health and safety in the workplace.
Occupational Health and Safety Act (OHSA) Amendment Bill tabled in Nedlac, 2015. Not yet tabled in Parliament. Compensation Fund surplus to be utilised to fund additional inspector posts.
Minister of Employment and Labour should take steps to ensure OHSA Amendment Bill, 2015 is tabled in Parliament.
Implement employment equity in a manner that is fair and consistent.
Responsibility for monitoring compliance with earnings inequality transferred to NMWC.Draft Employment Equity Amendment Bill published for comment in 2018 provides for sectoral targets.
Minister to expedite tabling and debate of Employment Equity Amendment Bill, 2018.
Public Sector Collective Bargaining and Wage Setting
Addressing public employment wage setting and performance.
Government’s promotion and wage progression policies continue to advantage long-tenured staff while constraining the expansion of services and employment on a cost-effective basis.
Review pay progression, benefit structures and Occupation Specific Dispensations (OSDs). Expand lower grade entry-level roles in key clerical, administrative and service focused function through a ‘developmental compact’ with public sector unions.
Declaration of essential services.
Essential Services Committee restructured (2015) to permit greater participation by public sector representatives. Definition of minimum services included in LRA with effect from 1 January 2019.
Process to negotiate minimum services agreements within the Public Service should be addressed through public service bargaining councils.
Introduction of multi-year wage agreements in line with national budgetary processes.
Multi-year agreements already exist which are aligned to the MTEF. Challenges posed by cost of living adjustment (COLA), pay progression policies, benefits and OSDs.
16
NDP Proposal Implementation Further Steps to Address Gaps
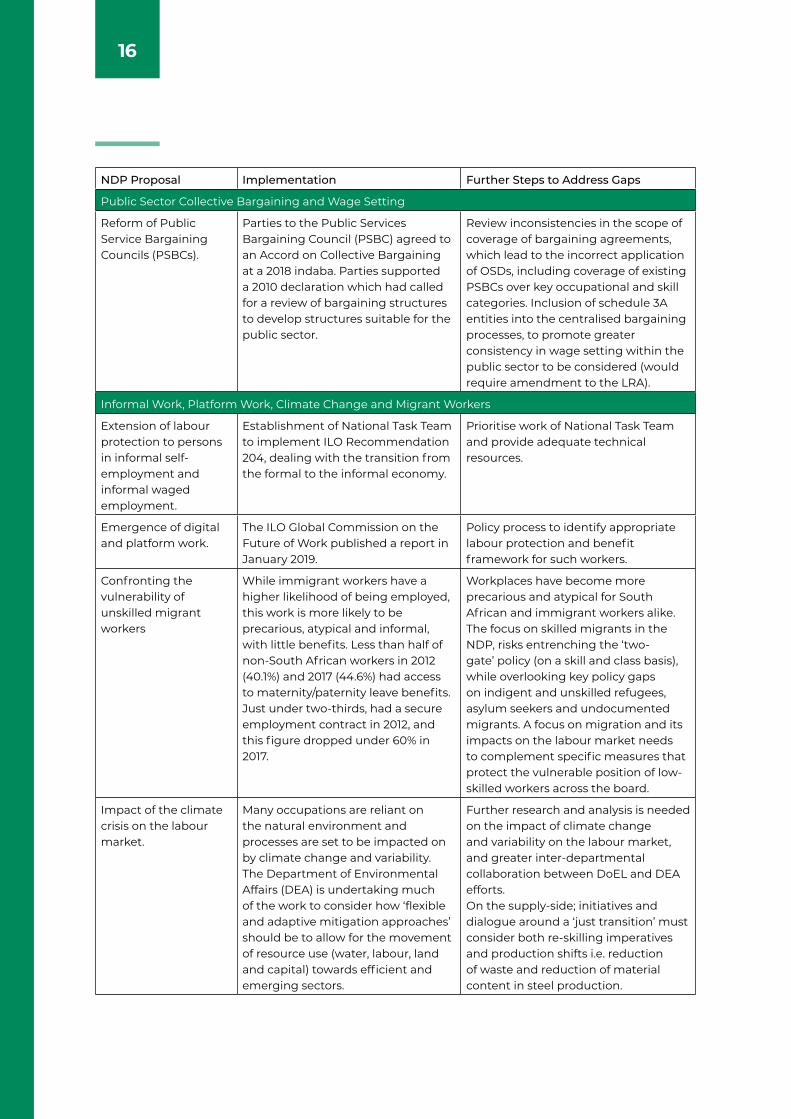
Public Sector Collective Bargaining and Wage Setting
Reform of Public Service Bargaining Councils (PSBCs).
Parties to the Public Services Bargaining Council (PSBC) agreed to an Accord on Collective Bargaining at a 2018 indaba. Parties supported a 2010 declaration which had called for a review of bargaining structures to develop structures suitable for the public sector.
Review inconsistencies in the scope of coverage of bargaining agreements, which lead to the incorrect application of OSDs, including coverage of existing PSBCs over key occupational and skill categories. Inclusion of schedule 3A entities into the centralised bargaining processes, to promote greater consistency in wage setting within the public sector to be considered (would require amendment to the LRA).
Informal Work, Platform Work, Climate Change and Migrant Workers
Extension of labour protection to persons in informal self-employment and informal waged employment.
Establishment of National Task Team to implement ILO Recommendation 204, dealing with the transition from the formal to the informal economy.
Prioritise work of National Task Team and provide adequate technical resources.
Emergence of digital and platform work.
The ILO Global Commission on the Future of Work published a report in January 2019.
Policy process to identify appropriate labour protection and benefit framework for such workers.
Confronting the vulnerability of unskilled migrant workers
While immigrant workers have a higher likelihood of being employed, this work is more likely to be precarious, atypical and informal, with little benefits. Less than half of non-South African workers in 2012 (40.1%) and 2017 (44.6%) had access to maternity/paternity leave benefits. Just under two-thirds, had a secure employment contract in 2012, and this figure dropped under 60% in 2017.
Workplaces have become more precarious and atypical for South African and immigrant workers alike. The focus on skilled migrants in the NDP, risks entrenching the ‘two-gate’ policy (on a skill and class basis), while overlooking key policy gaps on indigent and unskilled refugees, asylum seekers and undocumented migrants. A focus on migration and its impacts on the labour market needs to complement specific measures that protect the vulnerable position of low-skilled workers across the board.
Impact of the climate crisis on the labour market.
Many occupations are reliant on the natural environment and processes are set to be impacted on by climate change and variability. The Department of Environmental Affairs (DEA) is undertaking much of the work to consider how ‘flexible and adaptive mitigation approaches’ should be to allow for the movement of resource use (water, labour, land and capital) towards efficient and emerging sectors.
Further research and analysis is needed on the impact of climate change and variability on the labour market, and greater inter-departmental collaboration between DoEL and DEA efforts. On the supply-side; initiatives and dialogue around a ‘just transition’ must consider both re-skilling imperatives and production shifts i.e. reduction of waste and reduction of material content in steel production.

Chapter
02
18
INTRODUCTION
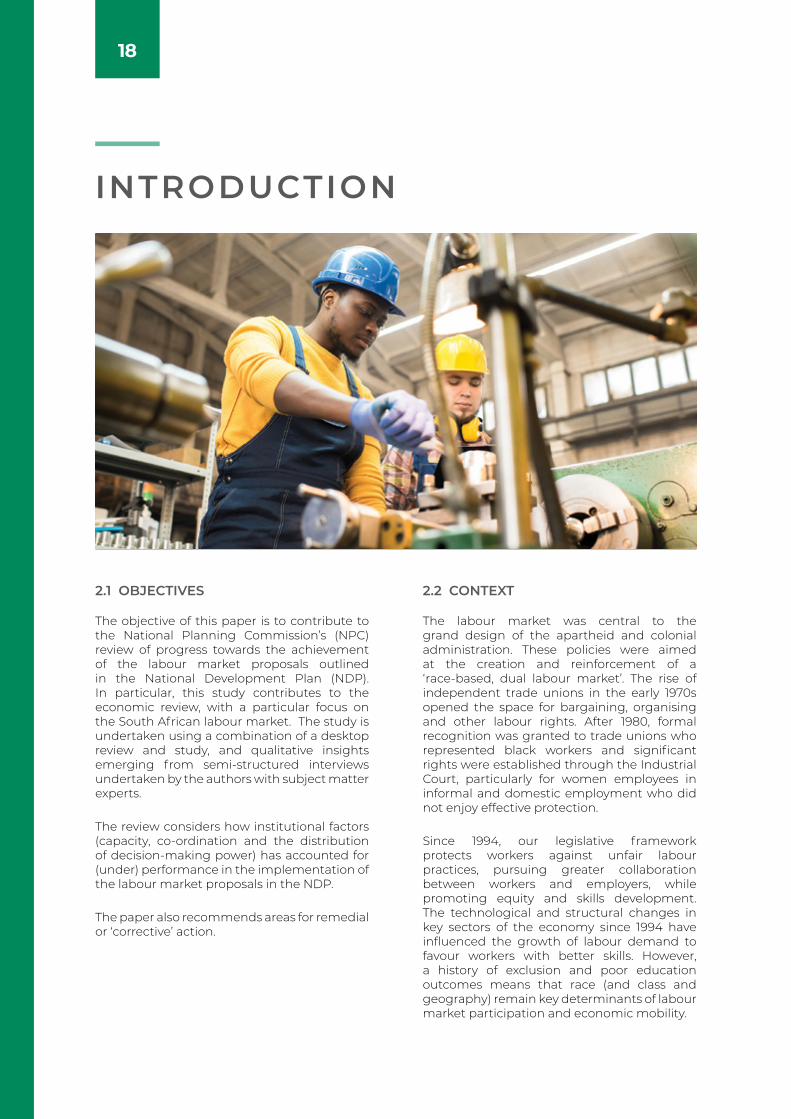
2.1 OBJECTIVES 2.2 CONTEXT
The objective of this paper is to contribute to the National Planning Commission’s (NPC) review of progress towards the achievement of the labour market proposals outlined in the National Development Plan (NDP). In particular, this study contributes to the economic review, with a particular focus on the South African labour market. The study is undertaken using a combination of a desktop review and study, and qualitative insights emerging from semi-structured interviews undertaken by the authors with subject matter experts.
The review considers how institutional factors (capacity, co-ordination and the distribution of decision-making power) has accounted for (under) performance in the implementation of the labour market proposals in the NDP.
The paper also recommends areas for remedial or ‘corrective’ action.
The labour market was central to the grand design of the apartheid and colonial administration. These policies were aimed at the creation and reinforcement of a ‘race-based, dual labour market’. The rise of independent trade unions in the early 1970s opened the space for bargaining, organising and other labour rights. After 1980, formal recognition was granted to trade unions who represented black workers and significant rights were established through the Industrial Court, particularly for women employees in informal and domestic employment who did not enjoy effective protection.
Since 1994, our legislative framework protects workers against unfair labour practices, pursuing greater collaboration between workers and employers, while promoting equity and skills development. The technological and structural changes in key sectors of the economy since 1994 have influenced the growth of labour demand to favour workers with better skills. However, a history of exclusion and poor education outcomes means that race (and class and geography) remain key determinants of labour market participation and economic mobility.
19
2.3 THE NATIONAL DEVELOPMENT PLAN ON THE LABOUR MARKET
The National Development Plan envisions an ‘adaptive and responsive labour market’ that is, ‘responsive to the challenge of simultaneously expanding employment opportunities, raising living standards and reducing inequality’. It also recognises the need to challenge the view that expanding employment may not be synonymous with reducing inequality or improving the living standards of the poor. The NDP suggests that for South Africa to achieve its social and economic objectives, employment opportunities must be expanded, while entrenching progressive legal and other forms of protections for workers. For this to occur, numerous supply and demand side actions need to be undertaken in response to the challenges discussed in the preceding discussion.
On the supply-side, the NDP recognises the need to encourage and improve lifelong learning and career advancement through the acquisition of skills in the training ecosystem and within the workplace. The South African labour market, for historical reasons, has a skills deficit. This, combined with the growing skill intensity of occupations across the spectrum, makes the role of schooling and post-school education and training (PSET) systems important in facilitating workplace acquisition of skill and the pathways and transitions of work-seekers into the labour market.
The NDP proposes improving marketplace matching and transitions, especially for young people. In this regard, the NDP recognises the challenges associated with a labour market that has ‘locked out new entrants’. The Plan proposes ‘active labour market policies’ including (but not limited to) placement subsidies for private sector placement agencies, free driver training for school leavers and the youth employment tax incentive (YETI).
The NDP notes the increasing adversarial relationship between employers and workers, which possibly contributed to the events leading to the Marikana Massacre in 2012. The NDP identifies the Commission for Conciliation, Mediation and Arbitration (CCMA) as a key mechanism to promote industrial harmony. The intervening period has seen the amendment of legislation and Codes of Good Practice to promote labour market stability. In light of continued high level of adversarialism in the workplace, further attention needs to be focused on enhancing the capacity of the CCMA to perform dispute prevention and capacity-building functions in the labour market on an on-going basis. The NDP also briefly deals with the need to enhance the capacity of other labour market institutions, including the Labour Court, bargaining councils and the labour inspectorates., all of which have significant resource constraints.
The NDP identifies a lack of clarity in certain dismissal provisions in the Labour Relations Act (LRA) as a disincentive to new employment that requires attention. The issues identified by the NDP should be addressed in the first instance by the National Economic Development and Labour Council (Nedlac) as part of a revision of the Codes of Good Practice dealing with dismissal and retrenchment which it is widely recognised needs updating. The NDP identifies small businesses as the major source of future job creation, an approach which has been contested by a number of commentators. The NDP proposes that the regulatory burden of small businesses should be reduced and identifies dismissal, employment equity and skills development as key issues. This paper seeks to concretise these proposals to provide guidance for changes that could be implemented.
20
The NDP recognises that a key factor affecting the achievement of employment and equity objectives is the process by which wages are determined in the private sector. The NDP suggests the need for better dispute resolution mechanisms in cases where such determinations are in dispute and support for the creation of a labour relations environment conducive to productivity growth. This involves ensuring a fair division of labour, the expansion of employment at affordable wages and the recognition of the important role of a ‘social floor’ or ‘social wage’.
The NDP articulates the goal of creating an ethical, capable and developmental state. It further observes that the conduct of labour relations in the public sector undermines the delivery of public goods and services to communities and is not conducive to effective delivery. It highlights the current industrial relations challenges within the public service, which include the definition of ‘essential services’ and the failure by public service employers and trade unions to agree on minimum service agreements, as well as aspects of the structure of the public service bargaining councils and the process of collective bargaining.

Chapter
03
22
BACKGROUNDThe NDP set ambitious targets in 2012 to reduce unemployment to 14% by 2020, with a target of 6% by 2030. The target required the creation of 11 million jobs in the intervening period. To achieve this, multiple goals, interventions and actions have been proposed, approved and implemented. The NDP highlights the following ‘development goals’ to achieve these objectives:
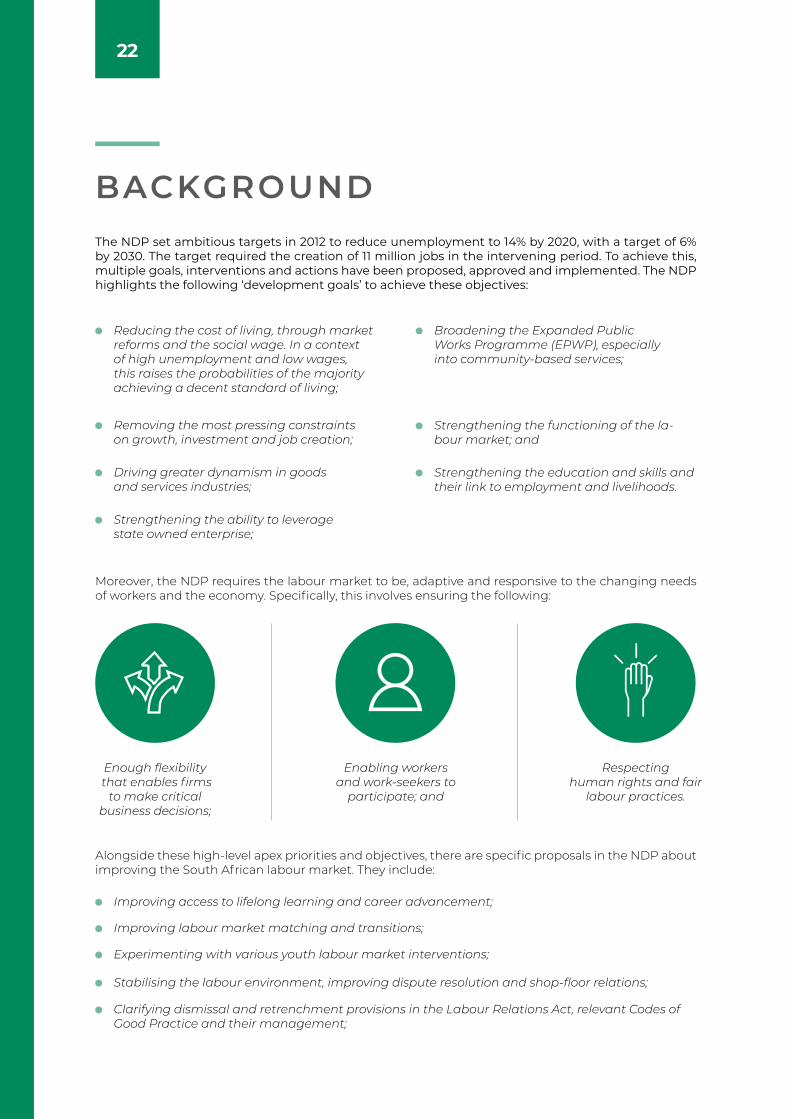
Moreover, the NDP requires the labour market to be, adaptive and responsive to the changing needs of workers and the economy. Specifically, this involves ensuring the following:
Alongside these high-level apex priorities and objectives, there are specific proposals in the NDP about improving the South African labour market. They include:
Reducing the cost of living, through market reforms and the social wage. In a context of high unemployment and low wages, this raises the probabilities of the majority achieving a decent standard of living;
Enough flexibility that enables firms
to make critical business decisions;
Enabling workers and work-seekers to
participate; and
Respecting human rights and fair
labour practices.
Removing the most pressing constraints on growth, investment and job creation;
Broadening the Expanded Public Works Programme (EPWP), especially into community-based services;
Driving greater dynamism in goods and services industries;
Strengthening the functioning of the la-bour market; and
Strengthening the ability to leverage state owned enterprise;
Strengthening the education and skills and their link to employment and livelihoods.
Improving access to lifelong learning and career advancement;
Improving labour market matching and transitions;
Experimenting with various youth labour market interventions;
Stabilising the labour environment, improving dispute resolution and shop-floor relations;
Clarifying dismissal and retrenchment provisions in the Labour Relations Act, relevant Codes of Good Practice and their management;
23
Below we deal with the scope of the review and the approach we have undertaken in its development. The review does not examine macro-industrial labour market dimensions that influence outcomes on the shop-floor. These issues (not only in relation to industrial and trade policy, but also those relating to education and key aspects of the PSET sector) are addressed to a great extent in a complementary series of papers commissioned by the National Planning Commission.
Strengthening the functioning of the Labour Courts, bargaining councils and better resourcing of the Commission for Conciliation, Mediation and Arbitration;
Reviewing regulations and standards for small and medium sized enterprises (small businesses);
Identifying the route to more equitable wage determinations in the private sector;
Implementing the Employment Equity Act in a manner that is fair and consistent.
Ensuring public sector relations conducive to service delivery and a public sector salary structure supportive of long-term public-sector objectives; and
3.1 APPROACH AND METHODOLOGY
3.2 THE LABOUR MARKET VISION – AN ADAPTIVE AND RESPONSIVE LABOUR MARKET
We used a combination of approaches:
• An analysis of the proposals included in the NDP;
• A desktop review of the literature and relevant case law: We undertook an analysis of the literature, departmental annual and performance reports, Statistics South Africa (Stats SA) and other statistical analysis and releases, Government Gazettes, policy papers and statements (speeches, White and Green Papers and reviews, inter alia). This included an analysis of how some of the key labour market proposals of the NDP have been operationalised within relevant institutions in terms of budget and resource allocation, institutional
performance and key concerns and debates;
• An analysis of media reports and other relevant publications; and
• Semi-structured qualitative interviews with key respondents. (See Appendix 2)
• This approach was informed by the Terms of Reference and benefited from the complementary nature of open-ended, semi-structured interviews and data obtained from publications noted above.
The report concludes with a comparison of the NDP’s proposals, implementation and recommendations.
Chapter 3 of the NDP (‘Economy and Employment’) discusses the institutions, relationships and regulations that govern industrial relations in the South African labour market in detail.
The NDP recognises that the labour market needs to be ‘responsive to the challenge of simultaneously expanding employment opportunities, raising living standards and reducing inequality’. This also recognises the need to challenge the view that in an economy such as ours, that expanding employment may
not be synonymous with reducing inequality or improving the living standards of the poor. The NDP suggests that for South Africa to achieve its social and economic objectives, we must expand employment possibilities whilst entrenching progressive legal and other forms of protections for workers. The NDP recognizes that even in a context of full employment, labour market outcomes might dent but not fully eradicate poverty, and in that gap, there exists a role for social grants and the social wage.
24
3.3 IMPROVING LIFELONG LEARNING AND CAREER ADVANCEMENT
3.5 EXPERIMENTING WITH VARIOUS YOUTH LABOUR MARKET INTERVENTIONS
3.4 IMPROVING LABOUR MARKET MATCHING AND TRANSITIONS
Considerable changes in the labour market have taken place since 2012, including, for example, the rapid advances in workplace technology, greater automation, digitisation of business processes, unprecedented regional migration and the internal movement of people (especially women) across provinces. Our review considers the impacts of both inward and international immigration on the South African labour market.
Below we consider some of the objectives and proposals outlined in the NDP relevant to the labour market.
The NDP suggested labour market experiments to strengthen labour matching and to increase skills development and supply. One example is improving the provision of access to lifelong learning to improve job-seekers/workers ‘employability’.1
The NDP also made a commitment to address obstacles to skills development and career mobility. This includes working on improving educational outcomes and providing vocational training for younger people.
The challenge presented by insufficient skills in the South African economy is
acknowledged in the NDP (Chapter 3, Chapter 9). The National Planning Commission has stated that this requires an improvement in the quality of education outcomes throughout the education system including a post-school system which provides quality learning opportunities for young people and adults who want to change careers or upgrade their skills and people who have left school before completing their secondary education, as well as unemployed people who wish to start a new career.
This topic is addressed in more detail in section 5.
The NDP recognises the challenges associated with the structural location of young people in society and within the labour market. It acknowledges the high unemployment rate among young people and a labour market that has ‘locked out new entrants’ thus
reducing access to new opportunities. The NDP, therefore, proposes inter alia ‘active labour market policies’ such as the youth employment tax incentive, free driver training lessons for school-leavers and placement subsidies.3
The NDP makes specific proposals to ‘strengthen (and improve) labour market matching and increase skills development and supply’.2
These include but are not limited to -
Subsidies for the placement sector (to identify and prepare matric graduates and match them with work opportunities)
Providing training vouchers for work-seekers - through strengthening the ability of the Department of Employment and Labour (DoEL) Labour Centres to attempt to match supply and demand in the labour market.
25
3.6 STABILISING THE LABOUR ENVIRONMENT, IMPROVING DISPUTE RESOLUTION AND SHOP FLOOR RELATIONS
3.8 REVIEWING LEGAL REGULATIONS AND OPERATING STANDARDS FOR SMALL BUSINESSES
3.9 IDENTIFYING EFFECTIVE ROUTES TO MORE EQUITABLE WAGE DETERMINATION IN THE PRIVATE SECTOR
3.7 CLARIFYING DISMISSAL AND RETRENCHMENT PROVISIONS IN THE LABOUR RELATIONS ACT
The NDP has noted the increasing adversarial nature of labour relations in South Africa, in part the result of a historical relationship of distrust between workers and employers. This relationship is characterised by an unwillingness to negotiate, the influence of non-workplace related issues, the country’s political environment and the growth of new political parties, with declining employment
levels both in South Africa and globally (retrenchment etc.), and declining union membership in the private sector as well as trade union fragmentation. The NDP identified the CCMA’s dispute prevention and resolution service as a key mechanism to address this, albeit an overstretched one. We return to the CCMA’s current dispute resolution mandate in section 5.5.
The NDP identifies current labour legislation as one of the main regulatory burdens faced by small businesses because small businesses generally do not have the financial and administrative resources to comply fully with existing regulatory requirements. The NDP did not suggest an exemption either, for obvious
reasons. However, it did recommend that the Code of Good Practice: Unfair Dismissals set out simpler compliance requirements and raised the need to design compliance regulations that can be implemented by SMEs without extensive administrative and human resource departments.4
The NDP recognises that a key factor affecting the achievement of employment and equity objectives is the process by which wages are determined within the private sector. The considerations laid out in the NDP include (but are not limited to the following):
The NDP noted that South Africa’s legal framework on dismissals, particularly the rules on probation for new employees, act as a disincentive for employers to offer permanent employment contracts. It made proposals which would require clarification of existing legal provisions and changes to the Codes of Good Practice dealing with dismissals to facilitate the hiring of new employees. This would also assist with reducing the overall caseload of the CCMA, as a large proportion of its cases deal with unfair dismissals.
Ensuring a fair division of earnings in a context of extreme inequality;
Determining affordable wages that support economic expansion; and
Recognising the need to achieve a social floor including a social wage, and measures to reduce inflation affecting basic commodities (and that of administered prices).5
26
3.10 PUBLIC SECTOR LABOUR RELATIONS SHOULD BE CONDUCIVE TO DELIVERY AND EMPLOYMENT
The determination of private sector wages must be linked to productivity growth. The NDP suggests that it might be possible for this to ‘veer off’ for a few years, but that it will not be feasible to sustain a labour-absorbing path without a growth in productivity. Below we consider what has helped to improve economy-wide and intra-firm productivity to achieve real wages and the expansion of employment. We also look at shifts that
have occurred in wage distribution since 2012 including the introduction of the national minimum wage (NMW) from 1 January 2019 and other initiatives such as the growing attention being paid to Section 27 of the Employment Equity Act on income differentials that respond to firm level wage inequality and any general measures that advance the notion of a social wage.6
Government (the public services sector) is the largest employer in South Africa (approx. 2.3 million fulltime personnel according to Stats SA´s September 2019 Quarterly Employment Survey (QLFS)) which explains why it is at the heart of the delivery of public goods to communities.
As the NDP states, the current system of managing disputes affecting essential services such as health, education and policing is not conducive to public sector productivity. The NDP makes a few proposals to ensure harmonious public sector industrial relations:
We discuss public sector employment, earnings and skills/occupational levels in section 7 and look at the status of several dispute management proposals that were outlined in the NDP.
The definition of ‘essential services’ should be clarified.
The introduction of multi-year wage agreements in line with the national budgetary process to ensure affordability.
Reforming the Public Service Bargaining Council (PSBC).

Chapter
04
28
SOUTH AFRICA’S LABOUR MARKET PERFORMANCE AND OUTCOMES4.1 HISTORICAL CONTEXT - APARTHEID
A racially skewed labour market policy and regime was a key feature of the broader repressive colonial and apartheid system and government. Migrant labour, race-based restrictions on pursuing certain occupations or professions and ‘separate development’ had their roots in the labour market. The Glen Grey Act of 1894 not only established individual land tenure (in areas that historically had practiced communal property relations) but created a new labour tax that would compel Black African men in the then Cape Colony to seek work on farms and in other industries.7
During apartheid, the labour market consisted of White skilled workers, a subordinate layer of Coloured and Indian semi-skilled workers, and a ‘secondary’ labour market consisting of Black Africans, many of whom were migrants with contractual obligations.8
This race-based, dual labour market guaranteed bargaining and other workplace rights for White workers, and to a lesser extent for Indian and Coloured workers, while denying the same rights to African workers. Non-white trade unions were only legally recognised after the 1973 Durban strike and the 1976 Soweto uprising. Many of these shifts largely applied to and benefitted male African workers with many African women still confined to the periphery in the homelands playing a function of ‘socially reproducing’ successive generations of labourers. In the contemporary context the situation is seemingly not different for many African women, who according to a recent Oxfam report join the large number of women globally who are excluded from the labour market due to unpaid obligations of care and household work that limit their involvement in formal labour markets.
Due to the evolving political context and opposition to apartheid labour policies, job reservation (a system of reserving better paying and skilled jobs for White male workers only) was eradicated, which paved the way for the greater involvement of Black African trade
unions and workers in collective bargaining processes. The formation of a new federation of trade unions, the Congress of South African Trade Unions (COSATU), during the height of apartheid (1985) revealed the growing militancy of black workers amidst worsening industrial and political relations in the country.
After 1994, there was a recognition by the business sector, workers and the state that South Africa’s successful re-entry into global markets would not only require productivity improvements, but also ‘increased management - labour (worker) co-operation in the workplace’.9 After 1994, the Reconstruction and Development Programme (RDP) and legislative labour reforms, therefore, focused on facilitating greater worker participation and decision-making in the world of work in line with various ILO conventions, the Interim Constitution and the RDP itself.10
However, despite these positive advances, the effects of centuries-long labour controls premised on race and gender remained, alongside general low levels of educational attainment, stifled entrepreneurship and worsening spatial inequality.11
After 1994, the South African government had to design a new legislative framework that redressed historical unfair labour practices (based on race) whilst pursuing greater ‘collaboration between workers and employers, the fair distribution of benefits’ and overcoming barriers to career advancement and the acquisition of skill.
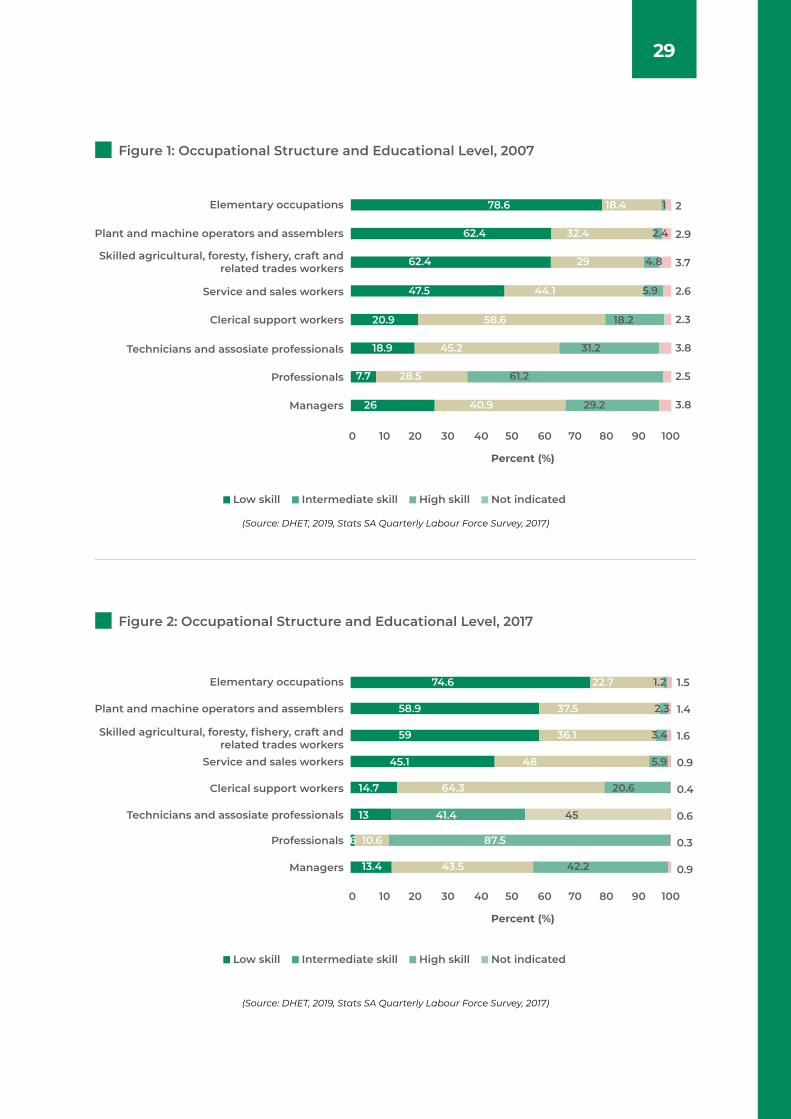
Unsurprisingly at present, employment outcomes in the labour market has a skill bias suggesting that much of the growth in labour demand in the post-apartheid era occurred across sectors whose occupational requirements have gravitated towards greater skill, even in occupational categories that would have been seen as ‘elementary’ in the past (as can be seen in Figure 1 and Figure 2)
29
Figure 1: Occupational Structure and Educational Level, 2007
Low skill Intermediate skill High skill Not indicated
Percent (%)
0 10 20 30 40
2
2.9
3.7
2.6
2.3
3.8
2.5
3.8
Elementary occupations
Managers
Professionals
Technicians and assosiate professionals
Clerical support workers
Service and sales workers
Skilled agricultural, foresty, fishery, craft and related trades workers
Plant and machine operators and assemblers
50 60 70 80 90 100
78.6
62.4
62.4
47.5
20.9
18.9
7.7
26 40.9 29.2
28.5 61.2
45.2 31.2
58.6 18.2
44.1 5.9
29 4.8
32.4 2.4
18.4 1
Figure 2: Occupational Structure and Educational Level, 2017
Low skill Intermediate skill High skill Not indicated
Percent (%)
0 10 20 30 40 50 60 70 80 90 100
1.5
1.4
1.6
0.9
0.4
0.6
0.3
0.9
Elementary occupations
Managers
Professionals
Technicians and assosiate professionals
Clerical support workers
Service and sales workers
Skilled agricultural, foresty, fishery, craft and related trades workers
Plant and machine operators and assemblers
74.6
58.9
59
45.1
14.7
13
6 10.6
13.4 43.5 42.2
87.5
41.4 45
64.3 20.6
48 5.9
36.1 3.4
37.5 2.3
22.7 1.2
(Source: DHET, 2019, Stats SA Quarterly Labour Force Survey, 2017)
(Source: DHET, 2019, Stats SA Quarterly Labour Force Survey, 2017)
30
EMPLOYMENT, INEQUALITY AND INVESTMENT
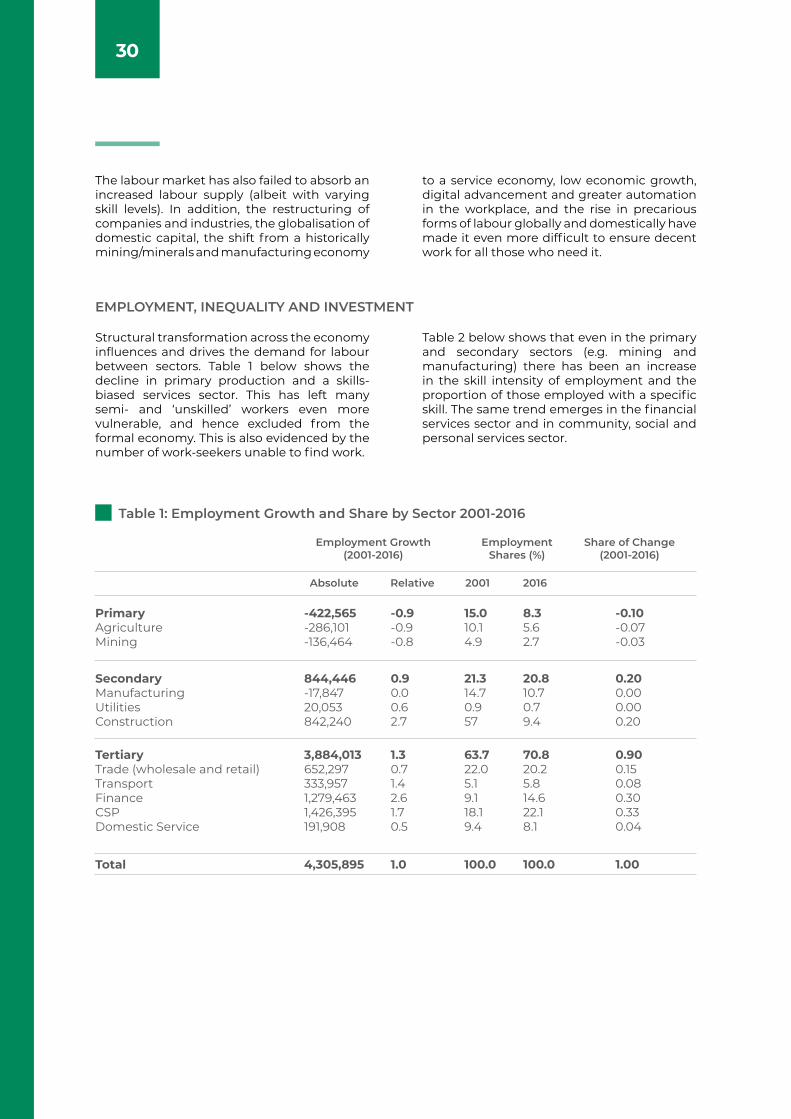
The labour market has also failed to absorb an increased labour supply (albeit with varying skill levels). In addition, the restructuring of companies and industries, the globalisation of domestic capital, the shift from a historically mining/minerals and manufacturing economy
to a service economy, low economic growth, digital advancement and greater automation in the workplace, and the rise in precarious forms of labour globally and domestically have made it even more difficult to ensure decent work for all those who need it.
Structural transformation across the economy influences and drives the demand for labour between sectors. Table 1 below shows the decline in primary production and a skills-biased services sector. This has left many semi- and ‘unskilled’ workers even more vulnerable, and hence excluded from the formal economy. This is also evidenced by the number of work-seekers unable to find work.
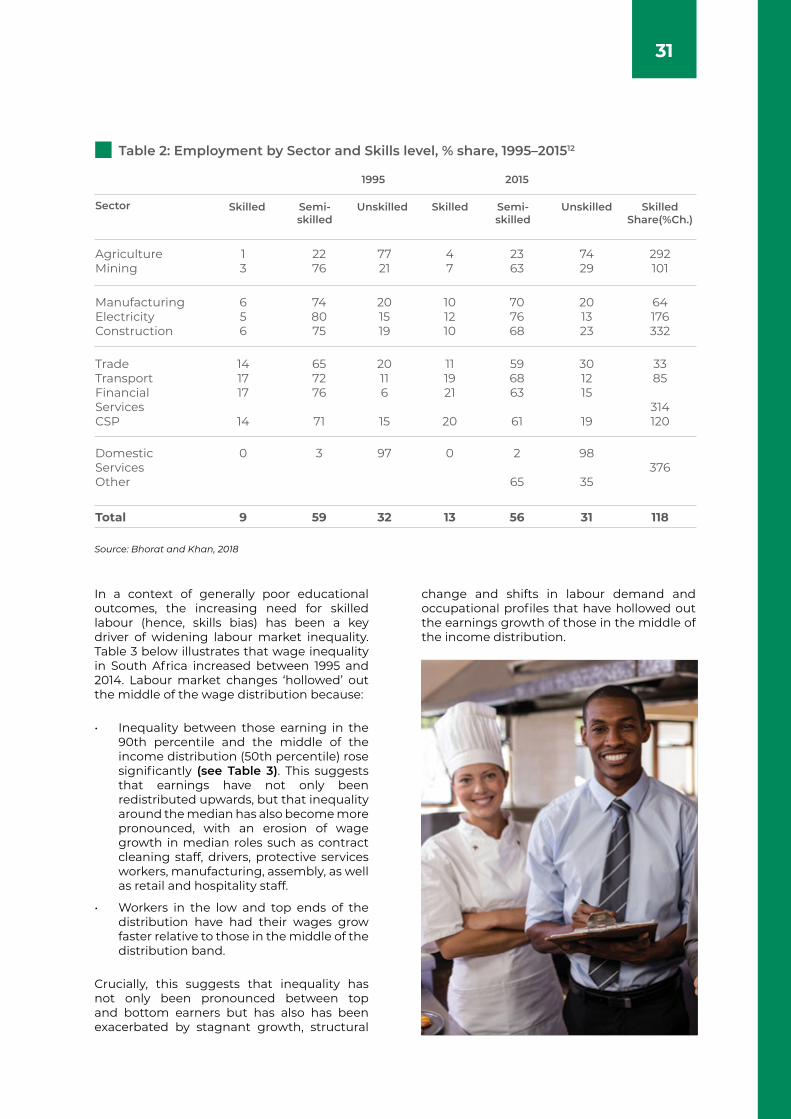
Table 2 below shows that even in the primary and secondary sectors (e.g. mining and manufacturing) there has been an increase in the skill intensity of employment and the proportion of those employed with a specific skill. The same trend emerges in the financial services sector and in community, social and personal services sector.
Table 1: Employment Growth and Share by Sector 2001-2016
Employment Growth (2001-2016)
Absolute 2001Relative 2016
PrimaryAgricultureMining
SecondaryManufacturingUtilitiesConstruction
TertiaryTrade (wholesale and retail)TransportFinanceCSPDomestic Service
Total
-422,565-286,101-136,464
844,446-17,84720,053842,240
3,884,013652,297333,9571,279,4631,426,395191,908
4,305,895
-0.9-0.9-0.8
0.90.00.62.7
1.30.71.42.61.70.5
1.0
15.010.14.9
21.314.70.957
63.722.05.19.118.19.4
100.0
8.35.62.7
20.810.70.79.4
70.820.25.814.622.18.1
100.0
-0.10-0.07-0.03
0.200.000.000.20
0.900.150.080.300.330.04
1.00
Employment Shares (%)
Share of Change (2001-2016)
31
Source: Bhorat and Khan, 2018
In a context of generally poor educational outcomes, the increasing need for skilled labour (hence, skills bias) has been a key driver of widening labour market inequality. Table 3 below illustrates that wage inequality in South Africa increased between 1995 and 2014. Labour market changes ‘hollowed’ out the middle of the wage distribution because:
• Inequality between those earning in the 90th percentile and the middle of the income distribution (50th percentile) rose significantly (see Table 3). This suggests that earnings have not only been redistributed upwards, but that inequality around the median has also become more pronounced, with an erosion of wage growth in median roles such as contract cleaning staff, drivers, protective services workers, manufacturing, assembly, as well as retail and hospitality staff.
• Workers in the low and top ends of the distribution have had their wages grow faster relative to those in the middle of the distribution band.
Crucially, this suggests that inequality has not only been pronounced between top and bottom earners but has also has been exacerbated by stagnant growth, structural
change and shifts in labour demand and occupational profiles that have hollowed out the earnings growth of those in the middle of the income distribution.
Table 2: Employment by Sector and Skills level, % share, 1995–201512
1995
SkilledSector Semi-skilled
Semi-skilled
Unskilled Unskilled Skilled Share(%Ch.)
Skilled
AgricultureMining
ManufacturingElectricityConstruction
DomesticServicesOther
TradeTransportFinancialServicesCSP
13
656
0
9
141717
14
2276
748075
3
59
657276
71
7721
201519
97
32
20116
15
47
101210
0
13
111921
20
2363
707668
2
65
56
596863
61
7429
201323
98
35
31
301215
19
292101
64176332
376
118
3385
314120
Total
2015
32
Source: Bhorat and Khan, 2018
Source: Quarterly Labour Force Survey, Statistics SA 2019.
Table 3: Real Wage Inequality, 1995 – 2014
Table 4: Unemployment rate by province, Q3 2019
1995Differential 20052000 2010 2014 % Change (95-14)
90:1090:5075:2550:1075:50
Gini Coefficient
Coefficient of variation
Palma ratio
17.343.194.395.431.84
0.58
2.23
5.11
22.324.465.455.002.31
0.74
15.73
11.77
18.484.444.714.162.22
0.59
5.40
5.68
16.984.534.833.752.33
0.65
12.74
8.08
25.715.935.334.332.64
0.69
12.09
10.13
488622-2043
19
442
98
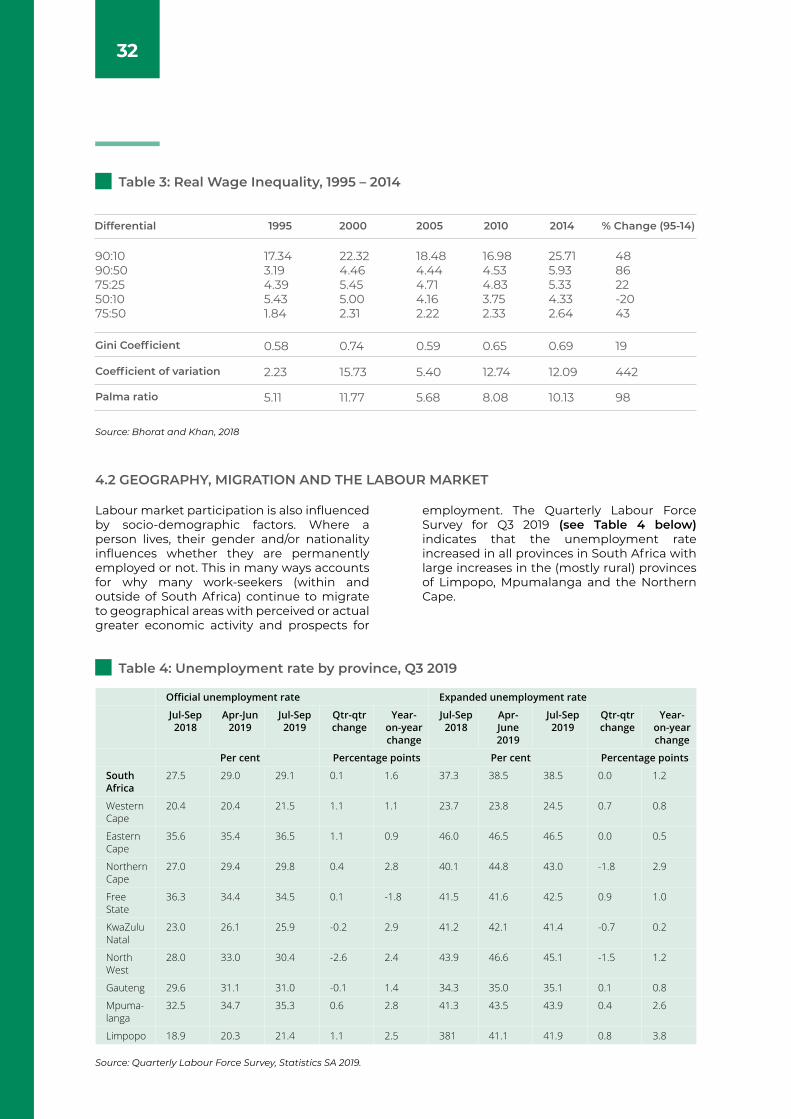
4.2 GEOGRAPHY, MIGRATION AND THE LABOUR MARKET
Labour market participation is also influenced by socio-demographic factors. Where a person lives, their gender and/or nationality influences whether they are permanently employed or not. This in many ways accounts for why many work-seekers (within and outside of South Africa) continue to migrate to geographical areas with perceived or actual greater economic activity and prospects for
employment. The Quarterly Labour Force Survey for Q3 2019 (see Table 4 below) indicates that the unemployment rate increased in all provinces in South Africa with large increases in the (mostly rural) provinces of Limpopo, Mpumalanga and the Northern Cape.
Official unemployment rate Expanded unemployment rate
Jul-Sep 2018
Apr-Jun2019
Jul-Sep2019
Qtr-qtr change
Year-on-year change
Jul-Sep2018
Apr-June2019
Jul-Sep2019
Qtr-qtr change
Year-on-year change
Per cent Percentage points Per cent Percentage points
South Africa
27.5 29.0 29.1 0.1 1.6 37.3 38.5 38.5 0.0 1.2
Western Cape
20.4 20.4 21.5 1.1 1.1 23.7 23.8 24.5 0.7 0.8
Eastern Cape
35.6 35.4 36.5 1.1 0.9 46.0 46.5 46.5 0.0 0.5
Northern Cape
27.0 29.4 29.8 0.4 2.8 40.1 44.8 43.0 -1.8 2.9
Free State
36.3 34.4 34.5 0.1 -1.8 41.5 41.6 42.5 0.9 1.0
KwaZulu Natal
23.0 26.1 25.9 -0.2 2.9 41.2 42.1 41.4 -0.7 0.2
North West
28.0 33.0 30.4 -2.6 2.4 43.9 46.6 45.1 -1.5 1.2
Gauteng 29.6 31.1 31.0 -0.1 1.4 34.3 35.0 35.1 0.1 0.8
Mpuma-langa
32.5 34.7 35.3 0.6 2.8 41.3 43.5 43.9 0.4 2.6
Limpopo 18.9 20.3 21.4 1.1 2.5 381 41.1 41.9 0.8 3.8
33
Source: Stats SA
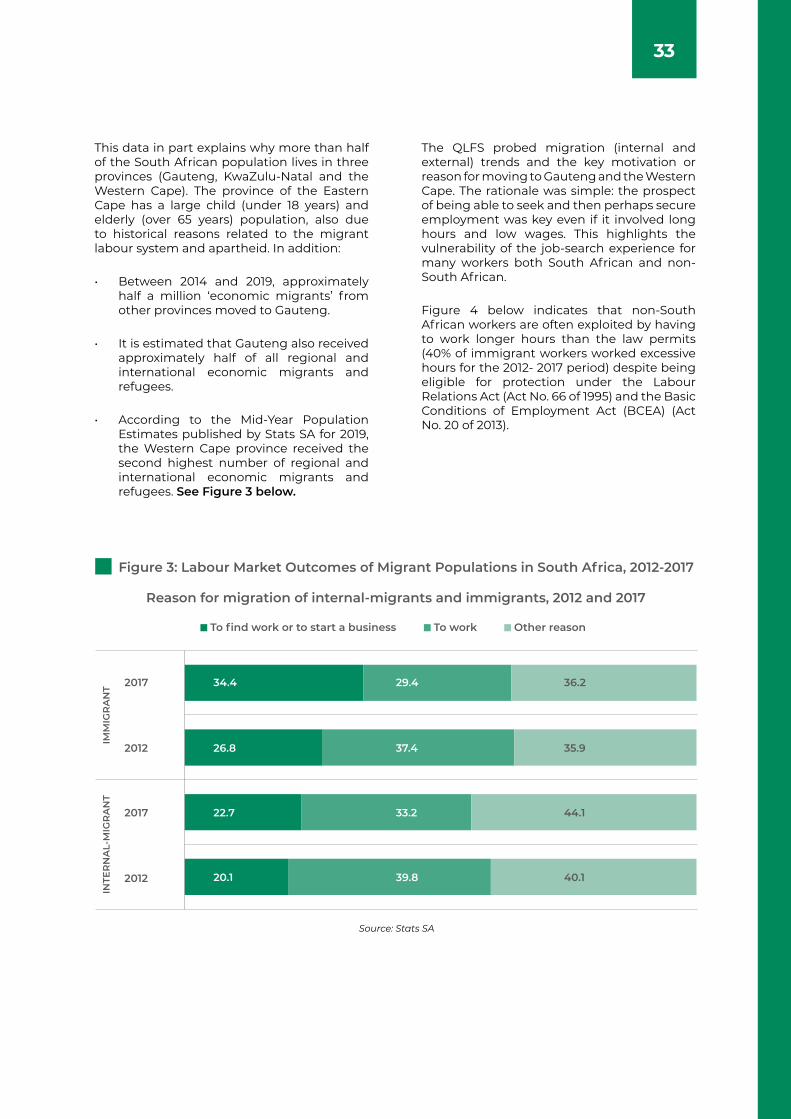
This data in part explains why more than half of the South African population lives in three provinces (Gauteng, KwaZulu-Natal and the Western Cape). The province of the Eastern Cape has a large child (under 18 years) and elderly (over 65 years) population, also due to historical reasons related to the migrant labour system and apartheid. In addition:
• Between 2014 and 2019, approximately half a million ‘economic migrants’ from other provinces moved to Gauteng.
• It is estimated that Gauteng also received approximately half of all regional and international economic migrants and refugees.
• According to the Mid-Year Population Estimates published by Stats SA for 2019, the Western Cape province received the second highest number of regional and international economic migrants and refugees. See Figure 3 below.
The QLFS probed migration (internal and external) trends and the key motivation or reason for moving to Gauteng and the Western Cape. The rationale was simple: the prospect of being able to seek and then perhaps secure employment was key even if it involved long hours and low wages. This highlights the vulnerability of the job-search experience for many workers both South African and non-South African.
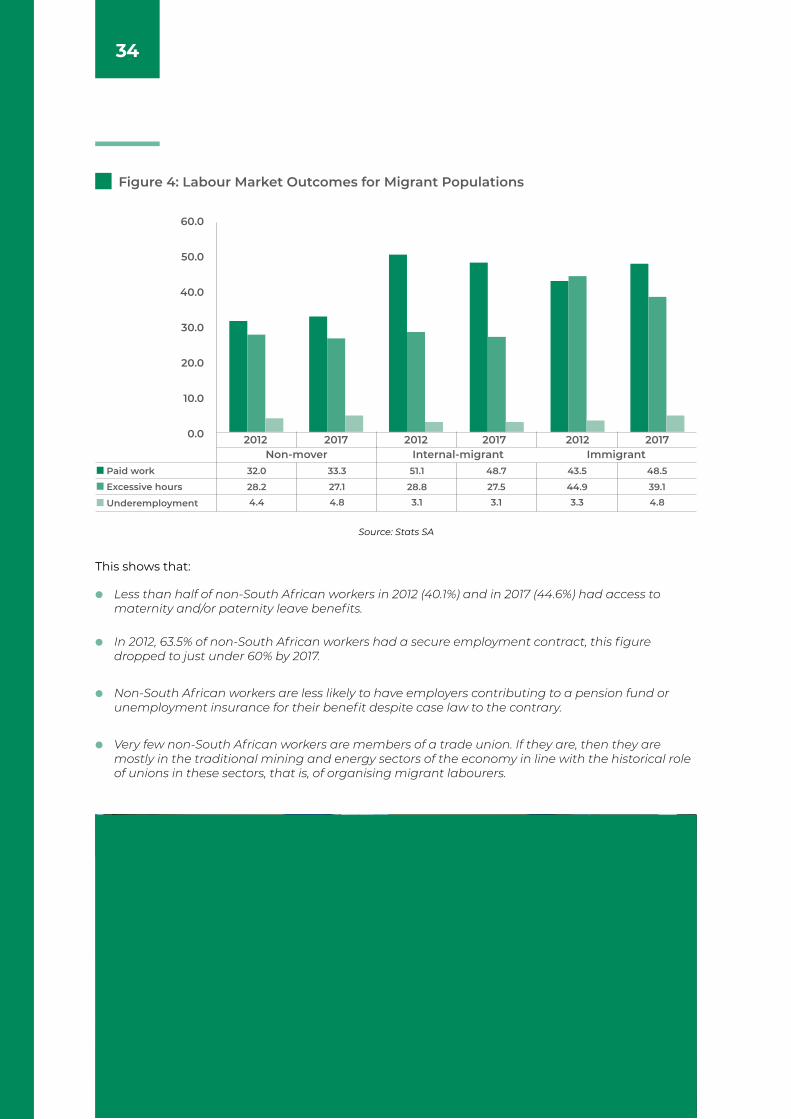
Figure 4 below indicates that non-South African workers are often exploited by having to work longer hours than the law permits (40% of immigrant workers worked excessive hours for the 2012- 2017 period) despite being eligible for protection under the Labour Relations Act (Act No. 66 of 1995) and the Basic Conditions of Employment Act (BCEA) (Act No. 20 of 2013).
Figure 3: Labour Market Outcomes of Migrant Populations in South Africa, 2012-2017
Reason for migration of internal-migrants and immigrants, 2012 and 2017
To find work or to start a business To work Other reason
34.4
26.8
22.7
20.1
29.4
37.4
33.2
39.8
36.22017
2017
2012
2012
INTE
RN
AL-
MIG
RA
NT
IMM
IGR
AN
T
35.9
44.1
40.1
34
Source: Stats SA
This shows that:
Figure 4: Labour Market Outcomes for Migrant Populations
Excessive hours
Underemployment
Paid work 32.0 33.3 51.1 48.7 43.5 48.5
28.2 27.1 28.8 27.5 44.9 39.14.4 4.8 3.1 3.1 3.3 4.8
60.0
50.0
40.0
30.0
20.0
10.0
0.0 2012 2017 2012 2017 20172012Non-mover Internal-migrant Immigrant
Less than half of non-South African workers in 2012 (40.1%) and in 2017 (44.6%) had access to maternity and/or paternity leave benefits.
In 2012, 63.5% of non-South African workers had a secure employment contract, this figure dropped to just under 60% by 2017.
Non-South African workers are less likely to have employers contributing to a pension fund or unemployment insurance for their benefit despite case law to the contrary.
Very few non-South African workers are members of a trade union. If they are, then they are mostly in the traditional mining and energy sectors of the economy in line with the historical role of unions in these sectors, that is, of organising migrant labourers.
35
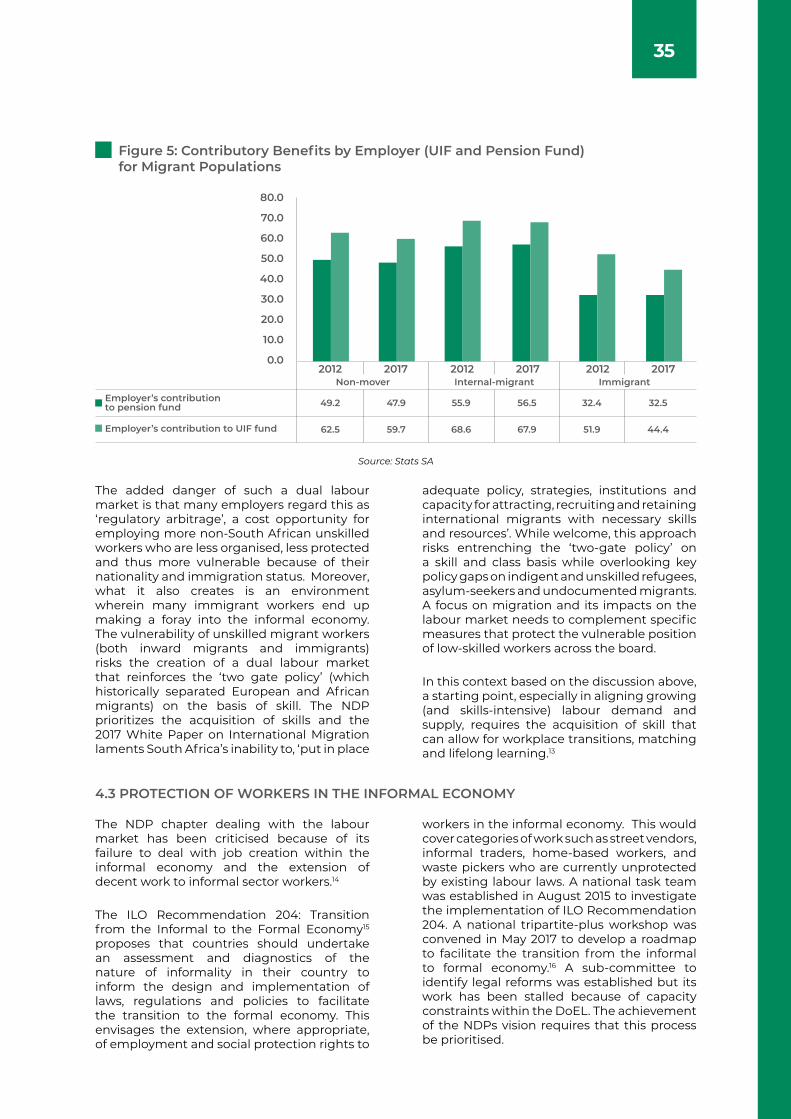
The added danger of such a dual labour market is that many employers regard this as ‘regulatory arbitrage’, a cost opportunity for employing more non-South African unskilled workers who are less organised, less protected and thus more vulnerable because of their nationality and immigration status. Moreover, what it also creates is an environment wherein many immigrant workers end up making a foray into the informal economy. The vulnerability of unskilled migrant workers (both inward migrants and immigrants) risks the creation of a dual labour market that reinforces the ‘two gate policy’ (which historically separated European and African migrants) on the basis of skill. The NDP prioritizes the acquisition of skills and the 2017 White Paper on International Migration laments South Africa’s inability to, ‘put in place
adequate policy, strategies, institutions and capacity for attracting, recruiting and retaining international migrants with necessary skills and resources’. While welcome, this approach risks entrenching the ‘two-gate policy’ on a skill and class basis while overlooking key policy gaps on indigent and unskilled refugees, asylum-seekers and undocumented migrants. A focus on migration and its impacts on the labour market needs to complement specific measures that protect the vulnerable position of low-skilled workers across the board.
In this context based on the discussion above, a starting point, especially in aligning growing (and skills-intensive) labour demand and supply, requires the acquisition of skill that can allow for workplace transitions, matching and lifelong learning.13
Source: Stats SA
Figure 5: Contributory Benefits by Employer (UIF and Pension Fund) for Migrant Populations
80.0
70.0
60.0
50.0
40.0
30.0
20.0
10.0
0.02012 2012 20122017 2017 2017
Employer’s contribution to pension fund
Non-mover
49.2 47.9 55.9 56.5 32.4 32.5
62.5 59.7 68.6 67.9 51.9 44.4
Internal-migrant Immigrant
Employer’s contribution to UIF fund
4.3 PROTECTION OF WORKERS IN THE INFORMAL ECONOMY
The NDP chapter dealing with the labour market has been criticised because of its failure to deal with job creation within the informal economy and the extension of decent work to informal sector workers.14
The ILO Recommendation 204: Transition from the Informal to the Formal Economy15 proposes that countries should undertake an assessment and diagnostics of the nature of informality in their country to inform the design and implementation of laws, regulations and policies to facilitate the transition to the formal economy. This envisages the extension, where appropriate, of employment and social protection rights to
workers in the informal economy. This would cover categories of work such as street vendors, informal traders, home-based workers, and waste pickers who are currently unprotected by existing labour laws. A national task team was established in August 2015 to investigate the implementation of ILO Recommendation 204. A national tripartite-plus workshop was convened in May 2017 to develop a roadmap to facilitate the transition from the informal to formal economy.16 A sub-committee to identify legal reforms was established but its work has been stalled because of capacity constraints within the DoEL. The achievement of the NDPs vision requires that this process be prioritised.
36
4.4 PLATFORM WORK, ON-DEMAND SERVICES AND THE FUTURE OF WORK
4.5 CLIMATE CHANGE AND THE LABOUR MARKET
South Africa, like all other countries, has witnessed a substantial increase in the extent of platform work and other forms of digital work generally associated with the Fourth Industrial Revolution (4IR). This has posed challenges for labour market regulation to ensure appropriate protection for this increasing and diverse group of workers.
Since the publication of the NDP in 2012 there has been an increase in platform work within what is increasingly referred to as the ‘on-demand economy’. Driven by increasing access to digital connectivity and the availability of digitally-enabled financial services, this type of work facilitates access to a range of services for consumers – from Uber for transport, to SweepSouth for domestic work services. A key
consideration is whether these innovations in labour market matching, facilitate decent work. While such atypical or non-standard forms of employment have a high degree of autonomy, they are also characterized by high job insecurity, low wages and lack of social protection and representation.
Recent case law suggests (contrary to their characterization as ‘contractors) that many platform workers should be considered as employees, and ought to be covered by the LRA and BCEA with social security and protection measures similar to those enjoyed by other workers. Unemployment insurance, occupational and health coverage and representation rights ought to, therefore, be extended to platform workers.
Climate change has had a significant impact on a range of sectors and occupations including those that are reliant on the natural environment. A report submitted to the Water Research Commission in 2018 suggests that the impact of the recent drought is not confined to production and employment losses in the agricultural and agri-processing sectors but also extends to sectors such as mining and tourism.17
While much has been done to provide disaster relief interventions to minimise the impact
on jobs, production and profits, it is unclear whether existing disaster relief interventions are adaptive enough to deal with a diversity of acute shocks associated with climate change.
Further research and analysis is needed that examines the impact of climate change on the labour market, which will require greater collaboration between DoEL and the Department of Environmental Affairs (DEA).

Chapter
05
38
GOVERNMENT ACTION TO ACHIEVE THE OBJECTIVES OF THE NATIONAL DEVELOPMENT PLAN 5.1 IMPROVING LIFELONG LEARNING AND CAREER ADVANCEMENT
5.2 ACCESS TO HIGHER EDUCATION, VOCATIONAL AND WORKPLACE TRAINING
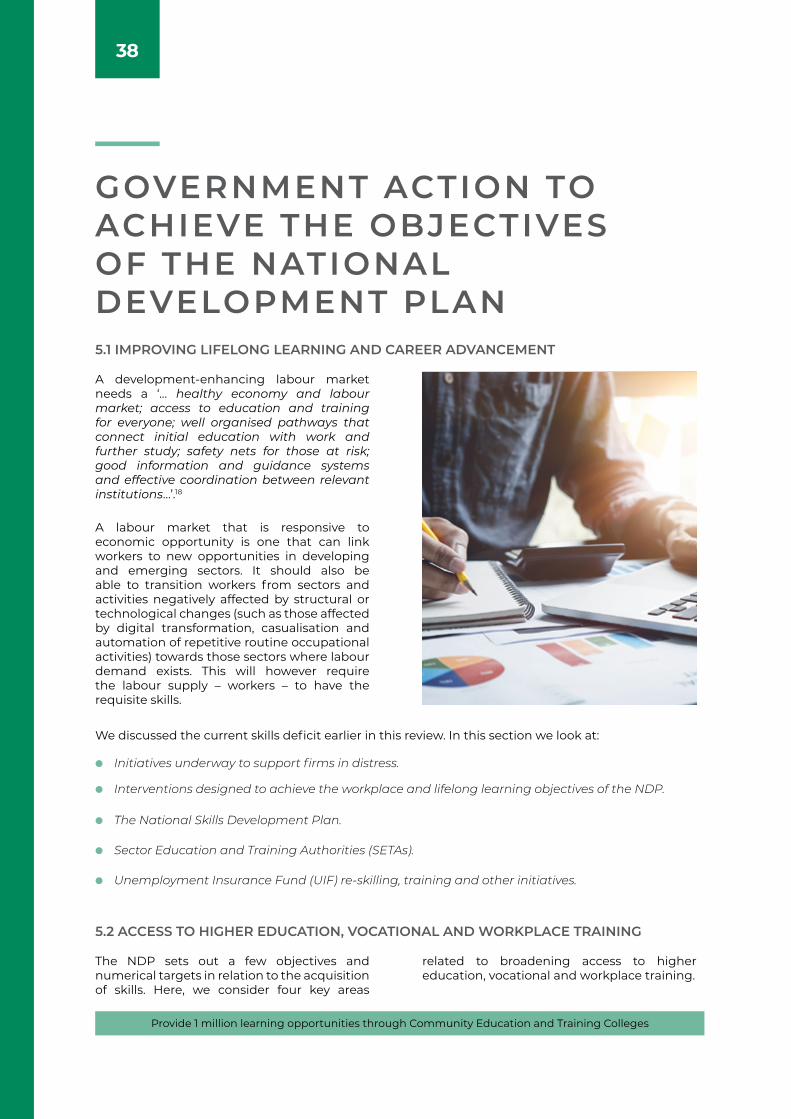
A development-enhancing labour market needs a ‘… healthy economy and labour market; access to education and training for everyone; well organised pathways that connect initial education with work and further study; safety nets for those at risk; good information and guidance systems and effective coordination between relevant institutions…’.18
A labour market that is responsive to economic opportunity is one that can link workers to new opportunities in developing and emerging sectors. It should also be able to transition workers from sectors and activities negatively affected by structural or technological changes (such as those affected by digital transformation, casualisation and automation of repetitive routine occupational activities) towards those sectors where labour demand exists. This will however require the labour supply – workers – to have the requisite skills.
The NDP sets out a few objectives and numerical targets in relation to the acquisition of skills. Here, we consider four key areas
related to broadening access to higher education, vocational and workplace training.
We discussed the current skills deficit earlier in this review. In this section we look at:
Initiatives underway to support firms in distress.
Interventions designed to achieve the workplace and lifelong learning objectives of the NDP.
The National Skills Development Plan.
Sector Education and Training Authorities (SETAs).
Unemployment Insurance Fund (UIF) re-skilling, training and other initiatives.
Provide 1 million learning opportunities through Community Education and Training Colleges
39
This is surprising in a context where a third of all young people between the ages of 15 and 24 years (3.4 million) are not employed or receiving an education or training. Two million young people have not completed their National Senior Certificate examination making them a captive market for technical
and vocational education and training (TVET) and CETC training opportunities. This data suggests that there are serious advocacy and recruitment challenges coupled with a credibility and public relations crisis facing the CETC and TVET sectors.
The White Paper on Post-School Education and Training (2013) commits to simpler pathways to establishing artisan trades, improving the quality of training, and producing 30 000 artisans per year by 2030 (in line with the NDP).
During the 2015 – 2017 Medium-Term Expenditure Framework (MTEF) period (shortly after the publication of the NDP) there was a gradual rise in the number of qualified
artisans, and the number of new registrations for artisanal studies. In the 2014/15 financial year, 28 301 new students registered for artisanal studies and by the 2017/18 financial year this figure had risen to just over 32 000.
However, a key concern is that the proportion of those passing from the number that registered is low. At this rate, the DHET will not be able to achieve its target of a 65% pass rate within the next five years.
The Community Education and Training Colleges (CETC) sector receives little attention yet it is responsible for the National Senior Certificate for Adults.
Current certification rates are dismal, with the Department of Higher Education and Training (DHET) attributing this to ‘insufficient learning and teaching support’ due to what it regards as ‘funding and procurement’ challenges.19
There has been no increase in enrolment due to a ‘poor advocacy and learner recruitment strategy’.20
Improve the participation rate in the TVET college sector, achieve 1.25 million enrolments and produce 30 000 artisans per year by 2030
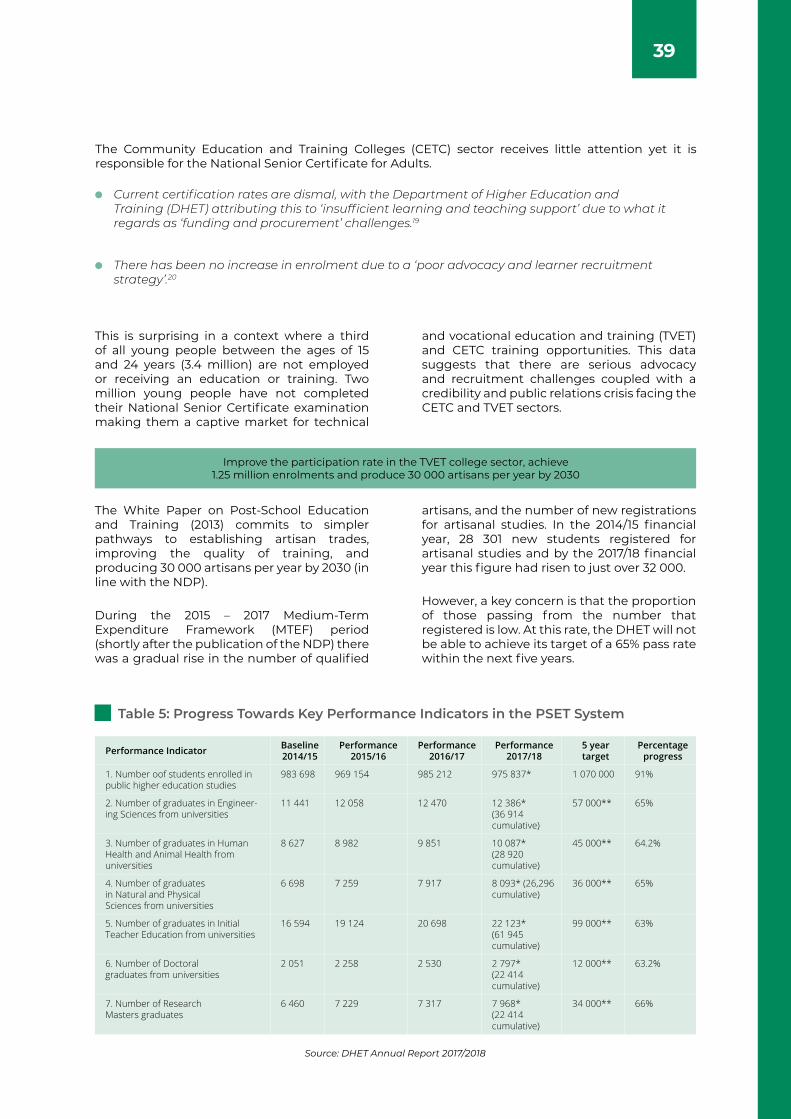
Table 5: Progress Towards Key Performance Indicators in the PSET System
Performance Indicator Baseline 2014/15
Performance 2015/16
Performance 2016/17
Performance 2017/18
5 year target
Percentage progress
1. Number oof students enrolled in public higher education studies
983 698 969 154 985 212 975 837* 1 070 000 91%
2. Number of graduates in Engineer-ing Sciences from universities
11 441 12 058 12 470 12 386*(36 914 cumulative)
57 000** 65%
3. Number of graduates in Human Health and Animal Health from universities
8 627 8 982 9 851 10 087* (28 920 cumulative)
45 000** 64.2%
4. Number of graduates in Natural and Physical Sciences from universities
6 698 7 259 7 917 8 093* (26,296 cumulative)
36 000** 65%
5. Number of graduates in Initial Teacher Education from universities
16 594 19 124 20 698 22 123*(61 945 cumulative)
99 000** 63%
6. Number of Doctoral graduates from universities
2 051 2 258 2 530 2 797*(22 414 cumulative)
12 000** 63.2%
7. Number of Research Masters graduates
6 460 7 229 7 317 7 968*(22 414 cumulative)
34 000** 66%
Source: DHET Annual Report 2017/2018
40
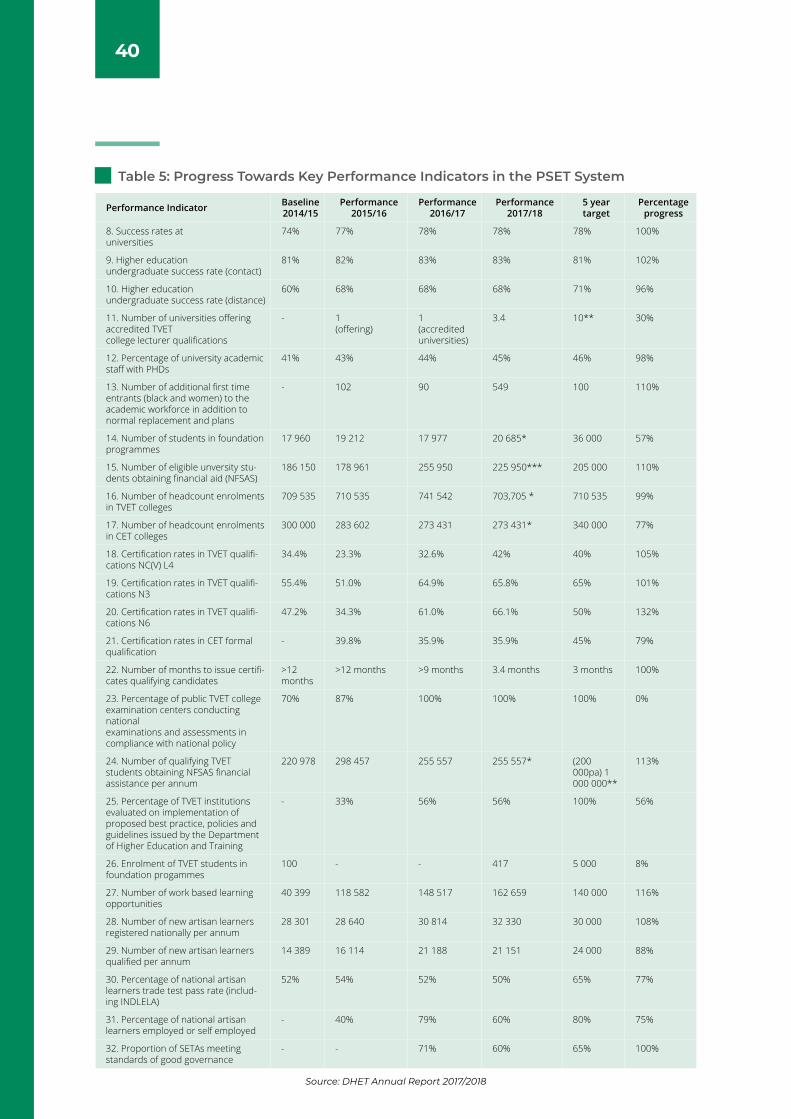
Performance Indicator Baseline 2014/15
Performance 2015/16
Performance 2016/17
Performance 2017/18
5 year target
Percentage progress
8. Success rates at universities
74% 77% 78% 78% 78% 100%
9. Higher education undergraduate success rate (contact)
81% 82% 83% 83% 81% 102%
10. Higher education undergraduate success rate (distance)
60% 68% 68% 68% 71% 96%
11. Number of universities offering accredited TVET college lecturer qualifications
- 1(offering)
1(accredited universities)
3.4 10** 30%
12. Percentage of university academic staff with PHDs
41% 43% 44% 45% 46% 98%
13. Number of additional first time entrants (black and women) to the academic workforce in addition to normal replacement and plans
- 102 90 549 100 110%
14. Number of students in foundation programmes
17 960 19 212 17 977 20 685* 36 000 57%
15. Number of eligible unversity stu-dents obtaining financial aid (NFSAS)
186 150 178 961 255 950 225 950*** 205 000 110%
16. Number of headcount enrolments in TVET colleges
709 535 710 535 741 542 703,705 * 710 535 99%
17. Number of headcount enrolments in CET colleges
300 000 283 602 273 431 273 431* 340 000 77%
18. Certification rates in TVET qualifi-cations NC(V) L4
34.4% 23.3% 32.6% 42% 40% 105%
19. Certification rates in TVET qualifi-cations N3
55.4% 51.0% 64.9% 65.8% 65% 101%
20. Certification rates in TVET qualifi-cations N6
47.2% 34.3% 61.0% 66.1% 50% 132%
21. Certification rates in CET formal qualification
- 39.8% 35.9% 35.9% 45% 79%
22. Number of months to issue certifi-cates qualifying candidates
>12 months
>12 months >9 months 3.4 months 3 months 100%
23. Percentage of public TVET college examination centers conducting national examinations and assessments in compliance with national policy
70% 87% 100% 100% 100% 0%
24. Number of qualifying TVET students obtaining NFSAS financial assistance per annum
220 978 298 457 255 557 255 557* (200 000pa) 1 000 000**
113%
25. Percentage of TVET institutions evaluated on implementation of proposed best practice, policies and guidelines issued by the Department of Higher Education and Training
- 33% 56% 56% 100% 56%
26. Enrolment of TVET students in foundation progammes
100 - - 417 5 000 8%
27. Number of work based learning opportunities
40 399 118 582 148 517 162 659 140 000 116%
28. Number of new artisan learners registered nationally per annum
28 301 28 640 30 814 32 330 30 000 108%
29. Number of new artisan learners qualified per annum
14 389 16 114 21 188 21 151 24 000 88%
30. Percentage of national artisan learners trade test pass rate (includ-ing INDLELA)
52% 54% 52% 50% 65% 77%
31. Percentage of national artisan learners employed or self employed
- 40% 79% 60% 80% 75%
32. Proportion of SETAs meeting standards of good governance
- - 71% 60% 65% 100%
Table 5: Progress Towards Key Performance Indicators in the PSET System
Source: DHET Annual Report 2017/2018
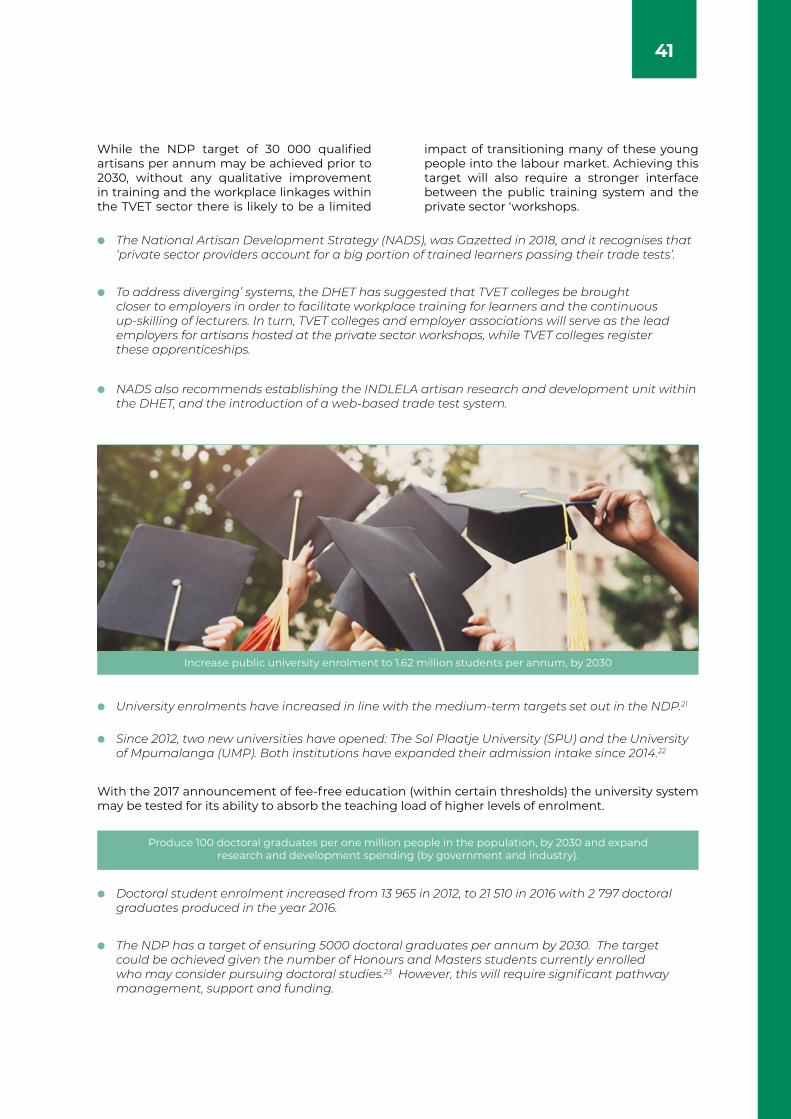
41
While the NDP target of 30 000 qualified artisans per annum may be achieved prior to 2030, without any qualitative improvement in training and the workplace linkages within the TVET sector there is likely to be a limited
impact of transitioning many of these young people into the labour market. Achieving this target will also require a stronger interface between the public training system and the private sector ‘workshops.
With the 2017 announcement of fee-free education (within certain thresholds) the university system may be tested for its ability to absorb the teaching load of higher levels of enrolment.
The National Artisan Development Strategy (NADS), was Gazetted in 2018, and it recognises that ‘private sector providers account for a big portion of trained learners passing their trade tests’.
University enrolments have increased in line with the medium-term targets set out in the NDP.21
Since 2012, two new universities have opened: The Sol Plaatje University (SPU) and the University of Mpumalanga (UMP). Both institutions have expanded their admission intake since 2014.22
Doctoral student enrolment increased from 13 965 in 2012, to 21 510 in 2016 with 2 797 doctoral graduates produced in the year 2016.
The NDP has a target of ensuring 5000 doctoral graduates per annum by 2030. The target could be achieved given the number of Honours and Masters students currently enrolled who may consider pursuing doctoral studies.23 However, this will require significant pathway management, support and funding.
NADS also recommends establishing the INDLELA artisan research and development unit within the DHET, and the introduction of a web-based trade test system.
To address diverging’ systems, the DHET has suggested that TVET colleges be brought closer to employers in order to facilitate workplace training for learners and the continuous up-skilling of lecturers. In turn, TVET colleges and employer associations will serve as the lead employers for artisans hosted at the private sector workshops, while TVET colleges register these apprenticeships.
Increase public university enrolment to 1.62 million students per annum, by 2030
Produce 100 doctoral graduates per one million people in the population, by 2030 and expand research and development spending (by government and industry).
42
5.3 INSTITUTIONAL PERFORMANCE AND FINANCING OF THE PSET SECTOR
5.3.1 THE NATIONAL SKILLS FUND (NSF)
The Post-School Education and Training (PSET) sector is critical to achieve many of the skilled developmental objectives set out in the NDP. The NDP proposed the expansion of learnerships and the provision of training vouchers to work-seekers and providing opportunities for lifelong learning. An important distinction exists here: the former deals with facilitating entry into the workplace and experiential training opportunities for work-seekers with limited experience, and the latter is about learning opportunities for workers in or between employment with limited workplace experience and in need of additional training to improve their chances of employability, especially in a climate of retrenchments.
The Skills Development Levy (SDL) funds skills training and is a compulsory levy scheme.24
There is consensus that the SDL is an effective way to support skills development. However, there is disagreement about what exactly is incentivised by the automatic allocation of resources to different institutions and concerns have been raised about adequate oversight over their performance. For example, in some SETAs there has been ‘significant dependency on external consultants to undertake management responsibilities’.25 The Parliamentary Portfolio Committee on Higher Education and Training has also noted the negative audit outcomes of TVET colleges and SETAs. Approximately R10 billion passes through the entire skills development system annually.
The NSF’s role is to support financing skills development initiatives for priority occupations including for small businesses and in rural areas, and to support the expansion of an integrated and effective
PSET system. Yet, the NSF had accumulated surpluses in the 2016 and 2017 academic years (which was used to support higher education policy choices).
There is a misalignment between policy goals and human and budgetary resources. Diverting funds also has a negative impact on providing optimal equipment and machinery
for vocational training.28 Challenges in the financing, quality assurance and capitalisation of workplace-relevant skills training in South Africa thus continue:
Approximately R1.5 billion was lost which could have benefited artisan skills development efforts and another R1.5 billion was diverted away from ‘systemic priority improvements’ in the PSET sector.26
The roles and functions of key institutions in the skills development arena must be clarified.
An approach that focuses on specialisation that is aligned to areas of industrial priority must be pursued.
There is a need to share, build and support existing training capability in the private sector.
This has negatively affected the operations of the National Artisan Moderation Body, Career Development Services, new TVET college campuses, the National Artisan Development Centre and critical posts in the TVET branch of the NSF. (NSF, 2018).27
43
5.3.2 ACTIVE LABOUR MARKET POLICY FRAMEWORK
5.3.3 LABOUR ACTIVATION MECHANISMS - THE UNEMPLOYMENT INSURANCE FUND (UIF))
In 2015 the DoEL launched the Labour Activation Programme (LAP), operating alongside the Unemployment Insurance Fund (UIF).29 As a result, within the DoEL, the Labour Activation Programme Unit was established in response to S48(1) of the Unemployment Insurance Act, which empowers the UIF Board to advise the Ministry of Employment and Labour on policies to minimise unemployment.
The DoEL identified key policy areas as training of the unemployed, assistance to companies
in distress and the provision of enterprise development support, in partnership with government, state-owned entities (SOEs) and the private sector.30
In respect of enterprise development, the DoEL has been engaged in training-related activities with UIF beneficiaries who aspire to be entrepreneurs. Below we discuss the progress achieved in pursuit of this.
According to Stats SA, there are approximately 2.7 million ‘discouraged’ work-seekers in the South African labour market.31
The NDP therefore recommended that available UIF resources be used to assist those seeking work and for training and skills development initiatives to assist people to return to active employment and thus reduce unemployment levels.32 The Director-General of the DoEL is also empowered to refer UIF beneficiaries for vocational training, as a pre-condition to qualify for unemployment benefits.
The NDP analysed the Unemployment Insurance Act 63 of 2001 (UIA) as part of its proposals for developing comprehensive social protection. The approach of the NDP draws on the 2002 report of the Committee of Inquiry into a Comprehensive System of Social Security for South Africa (Taylor Report) which argued for a more comprehensive approach to social protection to minimise the negative social effects of widespread unemployment.33
Prominent legal academics have also argued for the introduction of innovative measures to promote the re-integration of unemployed individuals into the labour market.34 This topic is not dealt with in the NDP.
While labour market transitions and life-long learning are highlighted as key aspects of the labour regime, the concrete proposals in the NDP on these topics focus on ‘youth
employment and initial entry into work’. The mechanisms by which the labour market regime could facilitate labour market transition, including changes in labour market status during the entirety of an individual’s working life, are not addressed. In addition, the NDP’s proposals confine it to regulating the entry into and the protection of employees in conventional employment arrangements as well as recommendations directed at increasing informal employment.35
The UIF which had a substantial deficit in the 1990s has built up a significant surplus.36
At present, workers who voluntarily resign cannot claim unemployment insurance benefits, even if they resign to undergo further training or to start their own business (self-employment).37
The Unemployment Insurance Amendment Act (Act No. 10 of 2016) was assented to in 2017 but its implementation was delayed due to technical issues. The amendment extends coverage to benefit national and provincial government employees38, persons employed under learnerships and economic migrants with valid work visas.39
It also enables the UIF to be used to finance employment retention efforts and the re-entry of contributors to the labour market, and any other scheme that supports vulnerable workers.40 This affords the administrators the discretion to utilise surplus funds to support schemes that promote employment.41
Below we consider some of the skills and training-aligned labour activation mechanisms focused on firms in distress, unemployed work-seekers and enterprise development support.
44
Key amendments which improve benefits include:
Workers may claim partial benefits during periods in which they lose income due to employers reducing their working time (short time).42 This facilitates the achievement of the NDP recommendation to create employee retention schemes.
Maternity benefits increase to two-thirds of basic salary (66%, subject to a maximum earnings threshold) and the payment is no longer deducted from an employee’s credit.44 Pregnant employees who have contributed to the UIF for at least 13 weeks qualify for maternity benefits.45 Recently, paternity benefits were also approved by Parliament, including benefits for adoptive parents.
The maximum period for which benefits can be claimed is increased to 365 days, from 268 days.43
Ill-health benefits can be claimed for periods of more than seven days.
The amendments were widely supported by all stakeholders, though frustration exists with the pace of implementation.46 The organised labour and business sectors support the
further extension of UIF benefits and have called on the DoEL to commence a policy process.
RECOMMENDATION
The further evolution of the UIF Act represents one of the key opportunities for incremental progress towards a more responsive labour market.
Two key themes for extending the functions of the UIF can be drawn from current debates covered in the NDP: Firstly, there has been an introduction of reintegration measures to enable employees who have been in employment to return to work, whether as employees or via self-employment. Secondly, as per Chapter 13 of the NDP, there is an extension of the UIF to workers who are not currently covered by benefits on a contributory basis. This discussion should include not only informal workers, as stressed in Chapter 13, but also workers in new forms of digital work such as on online platforms.
To date, the policy debates surrounding the UIF Act have tended to be conducted in isolation from debates over other legislation. For example, a future policy process could address the extent to which the design of unemployment benefits could be used to reduce the risks (in the form of dismissal disputes) that employers faced when engaging new employees.
45
Registration of work-seekers and work opportunities including retrenched workers.
Establish schemes to promote the employment of youth and other unemployed persons;
Provide opportunities for self-employment; and
Establish schemes to minimise retrenchments in enterprises that are in economic distress.48 This may include providing for turn-around strategies, lay-offs, retraining. and alternative employment opportunities.49
Registration of job vacancies and work or training opportunities in the private sector.
Placement services that match employers and work-seekers.
Counselling services that identify career guidance needs and which offer information on career and skills development opportunities.
5.4 IMPROVING LABOUR MARKET MATCHING AND TRANSITIONS
5.4.1 EMPLOYMENT SERVICES SOUTH AFRICA (ESSA)
The institutions, relationships and initiatives that facilitate labour market matching and transitions, are often loosely referred to as the ‘employment services industry’. This consists of multiple stakeholders: private and public employment agencies, online recruitment platforms and civil society organisations.
Much of the debate around transitions and matching has focused on how private players (labour brokers, permanent employment services and temporary staffing services) can work alongside public sector platforms such
as the Employment Services of South Africa (ESSA), located in the DoEL. The NPC argued that the role of the public sector in matching (in the low skill segments of the labour market) should be one of regulation and subsidization of the private sector to provide matching services.
Below we discuss some of the institutional relationships and emerging trends against the objectives and goals of the NDP and provide recommendations on areas for further policy development.
The Institutional Context – How do public placement programmes fare?
Employment Services South Africa is a platform that registers unemployed work seekers and links them to work opportunities.47 It offers and involves the:
The Employment Services Act (Act No. 4 of 2014) (ESA) enables the use of funds from the UIF as well as the Compensation for Occupational Injuries and Diseases Act’s (COIDA) Compensation Fund for the purposes of providing ‘free public employment services’ through the DoEL.
Under ESA, the Minister of Labour also has the power to:
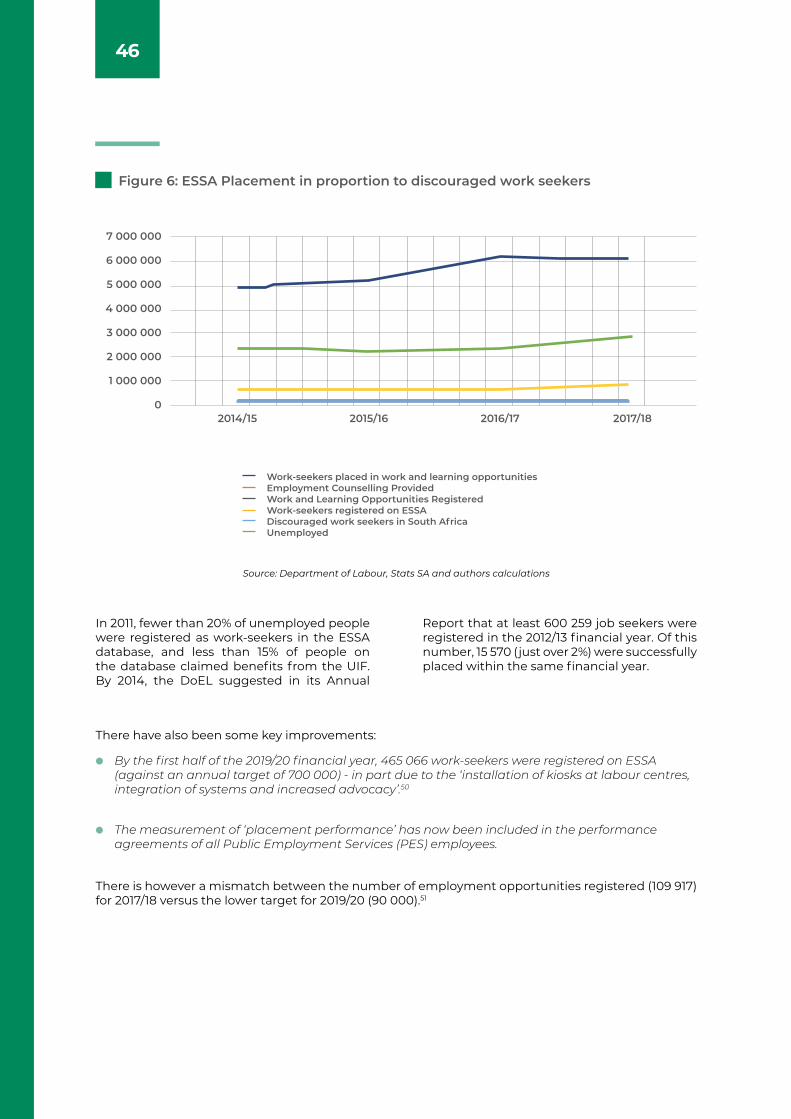
46
By the first half of the 2019/20 financial year, 465 066 work-seekers were registered on ESSA (against an annual target of 700 000) - in part due to the ‘installation of kiosks at labour centres, integration of systems and increased advocacy’.50
The measurement of ‘placement performance’ has now been included in the performance agreements of all Public Employment Services (PES) employees.
In 2011, fewer than 20% of unemployed people were registered as work-seekers in the ESSA database, and less than 15% of people on the database claimed benefits from the UIF. By 2014, the DoEL suggested in its Annual
Report that at least 600 259 job seekers were registered in the 2012/13 financial year. Of this number, 15 570 (just over 2%) were successfully placed within the same financial year.
There have also been some key improvements:
There is however a mismatch between the number of employment opportunities registered (109 917) for 2017/18 versus the lower target for 2019/20 (90 000).51
Source: Department of Labour, Stats SA and authors calculations
Figure 6: ESSA Placement in proportion to discouraged work seekers
7 000 000
6 000 000
5 000 000
4 000 000
3 000 000
2 000 000
1 000 000
02014/15 2015/16 2016/17 2017/18
Work-seekers placed in work and learning opportunitiesEmployment Counselling ProvidedWork and Learning Opportunities Registered Work-seekers registered on ESSADiscouraged work seekers in South AfricaUnemployed
47
Between 2007 and 2010, the majority of ‘work opportunities’ registered on the database were in the areas of social and human sciences (sales, marketing, social work and customer care) followed by general work (manual labour, public works programmes) and artisanal opportunities.53
Job-seekers value work that provide an opportunity to place their skills to good use, that offer job security, fair earnings and characteristics that are ‘generally not found in portions of the security, agriculture and hospitality sectors’.54
These attitudes are, in turn, associated with the features of low-skill sectors of the South African labour market, including an increase in non-standard forms of employment, sluggish labour market compliance and an increase in the number of the working poor. As a result, there has been a steady increase in the number of discouraged work-seekers.55
Employment-seeking is not only explained by macro-level economic factors, but also by micro-level considerations such as conditions of employment (especially in low wage/skill sectors).
Lower skilled work-seekers tend to use the services of public labour centres, and more highly skilled work-seekers use the services of private agencies (du Toit, 2005).
CHALLENGES:
The DoEL commissioned a study in 2011 on ESSA.52 Several challenges emerged, especially in the areas of infrastructure, equipment, facilities, data reliability, and critically, low engagement levels with, also in part due to ‘less positive’ perceptions about, the programme.
Attitudes towards initiatives such as ESSA also account for low placement levels and low engagement with ESSA. Numerous studies have been undertaken to understand drivers of engagement among young work-seekers.
If one considers that the crucial challenge within the South African labour market is the oversupply of unskilled or semi-skilled workers56, then public labour centres will continue to play a critical role in not only matching work-seekers with employment but also facilitating access to and sharing information. Moreover, their role as a
‘touchpoint’ (due to the scale of the reach of its legacy system outside urban areas) is important in serving as a critical window to all the support services provided through the public-private partnerships that underpin the recently announced National Pathway Management Network.
These studies found that:
WHAT CAN BE DONE TO ENSURE THAT THESE CENTRES FUNCTION BETTER?
To answer this, we consider the demand-side experiences of ESSA:
Firstly, employers (public and private) indicated that they use ESSA as one of several channels – both formal and informal. Secondly, employers perceive the ESSA to be a ‘source of information’ about the availability of intermediate and low-skilled workers. Thirdly,
ESSA is unable to meet the skill demands of public sector entities.
Fourth, qualitative suggestions include improving the online portal, proper preparation and screening of candidates. This requires an investment in ICT infrastructure, inter alia.
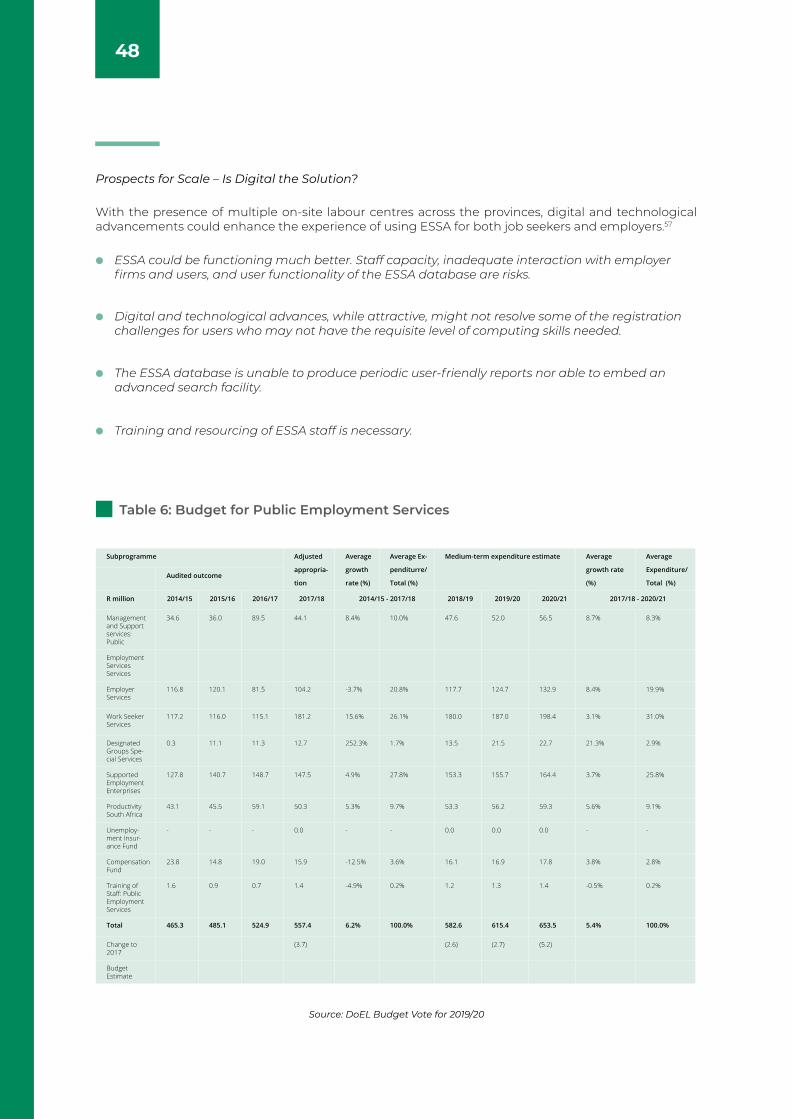
48
ESSA could be functioning much better. Staff capacity, inadequate interaction with employer firms and users, and user functionality of the ESSA database are risks.
Digital and technological advances, while attractive, might not resolve some of the registration challenges for users who may not have the requisite level of computing skills needed.
The ESSA database is unable to produce periodic user-friendly reports nor able to embed an advanced search facility.
Training and resourcing of ESSA staff is necessary.
Prospects for Scale – Is Digital the Solution?
With the presence of multiple on-site labour centres across the provinces, digital and technological advancements could enhance the experience of using ESSA for both job seekers and employers.57
Table 6: Budget for Public Employment Services
Subprogramme Adjusted
appropria-
tion
Average
growth
rate (%)
Average Ex-
penditurre/
Total (%)
Medium-term expenditure estimate Average
growth rate
(%)
Average
Expenditure/
Total (%)Audited outcome
R million 2014/15 2015/16 2016/17 2017/18 2014/15 - 2017/18 2018/19 2019/20 2020/21 2017/18 - 2020/21
Management and Support services: Public
34.6 36.0 89.5 44.1 8.4% 10.0% 47.6 52.0 56.5 8.7% 8.3%
Employment Services Services
Employer Services
116.8 120.1 81.5 104.2 -3.7% 20.8% 117.7 124.7 132.9 8.4% 19.9%
Work Seeker Services
117.2 116.0 115.1 181.2 15.6% 26.1% 180.0 187.0 198.4 3.1% 31.0%
Designated Groups Spe-cial Services
0.3 11.1 11.3 12.7 252.3% 1.7% 13.5 21.5 22.7 21.3% 2.9%
Supported Employment Enterprises
127.8 140.7 148.7 147.5 4.9% 27.8% 153.3 155.7 164.4 3.7% 25.8%
Productivity South Africa
43.1 45.5 59.1 50.3 5.3% 9.7% 53.3 56.2 59.3 5.6% 9.1%
Unemploy-ment Insur-ance Fund
- - - 0.0 - - 0.0 0.0 0.0 - -
Compensation Fund
23.8 14.8 19.0 15.9 -12.5% 3.6% 16.1 16.9 17.8 3.8% 2.8%
Training of Staff: Public Employment Services
1.6 0.9 0.7 1.4 -4.9% 0.2% 1.2 1.3 1.4 -0.5% 0.2%
Total 465.3 485.1 524.9 557.4 6.2% 100.0% 582.6 615.4 653.5 5.4% 100.0%
Change to 2017
(3.7) (2.6) (2.7) (5.2)
Budget Estimate
Source: DoEL Budget Vote for 2019/20

49
The initial target of the Jobs Fund was the creation of 150 000 permanent jobs.
By 2018/19, jobs contracted (or facilitated) through the four funding windows exceeded 150 000.60
The Jobs Fund, after eight funding rounds had 127 projects, with R6.7 billion approved, and just under R9.5 billion committed by project partners for matching funding.61
Table 6 above shows that the budget for PES declined by 5% between 2014 and 2018. There has also been a decline in spending on ‘employer services’ in the same period, of just under 4%, and on communication (decline
of 24.4%). This needs remedying, especially considering the information dissemination challenges that account for some of the engagement challenges with the ESSA.
This review looks at projects funded to support work-seekers (3, above).
5.4.2 THE JOBS FUND
1.
2.
3.
4.
The Jobs Fund initially set aside R9 billion to co-finance projects by public, private and non-governmental organisations to contribute to job creation. The aim of the Jobs Fund is to use public funds to catalyse innovation and investment that directly contribute to employment creation.58
The Jobs Fund provides funding for ‘four windows’: 59
Subprogramme Adjusted
appropria-
tion
Average
growth
rate (%)
Average Ex-
penditurre/
Total (%)
Medium-term expenditure estimate Average
growth rate
(%)
Average
Expenditure/
Total (%)Audited outcome
R million 2014/15 2015/16 2016/17 2017/18 2014/15 - 2017/18 2018/19 2019/20 2020/21 2017/18 - 2020/21
Economic Classification
Current Payments
297.5 277.6 294.6 336.5 4.2% 59.3% 351.6 370.5 395.6 5.5% 60.4%
Compensation of employees
265.1 245.7 272.3 304.9 4.8% 53.5% 312.0 328.7 351.1 4.8% 53.8%
Goods and services1 of which:
32.4 31.8 22.4 31.6 -0.9% 5.8% 39.6 41.7 44.5 12.1% 6.5%
Communi-cation
4.9 5.6 1.5 2.1 -24.4% 0.7% 1.5 1.6 1.8 -6.2% 0.3%
Fleet services (including government motor trans-port)
2.7 3.0 2.8 3.1 4.4% 0.6% 8.3 9.9 11.5 54.7% 1.4%
Consumables: Stationery, printing and office supplies
2.2 1.7 1.5 3.3 14.3% 0.4% 5.0 5.5 6.3 24.3% 0.8%
Operating leases
0.5 0.4 0.3 1.5 46.7% 0.1% 2.7 1.9 1.9 8.4% 0.3%
Travel and subsistence
10.3 9.0 8.9 9.2 -3.8% 1.8% 14.0 14.8 14.3 16.1% 2.2%
Operating payments
1.5 1.1 1.6 1.9 7.8% 0.3% 2.2 2.1 2.2 5.8% 0.3%
Training and Communication Resources
Enterprise Development.
Infrastructure Investment.
Support for Work-Seekers
Institutional Capacity Building.
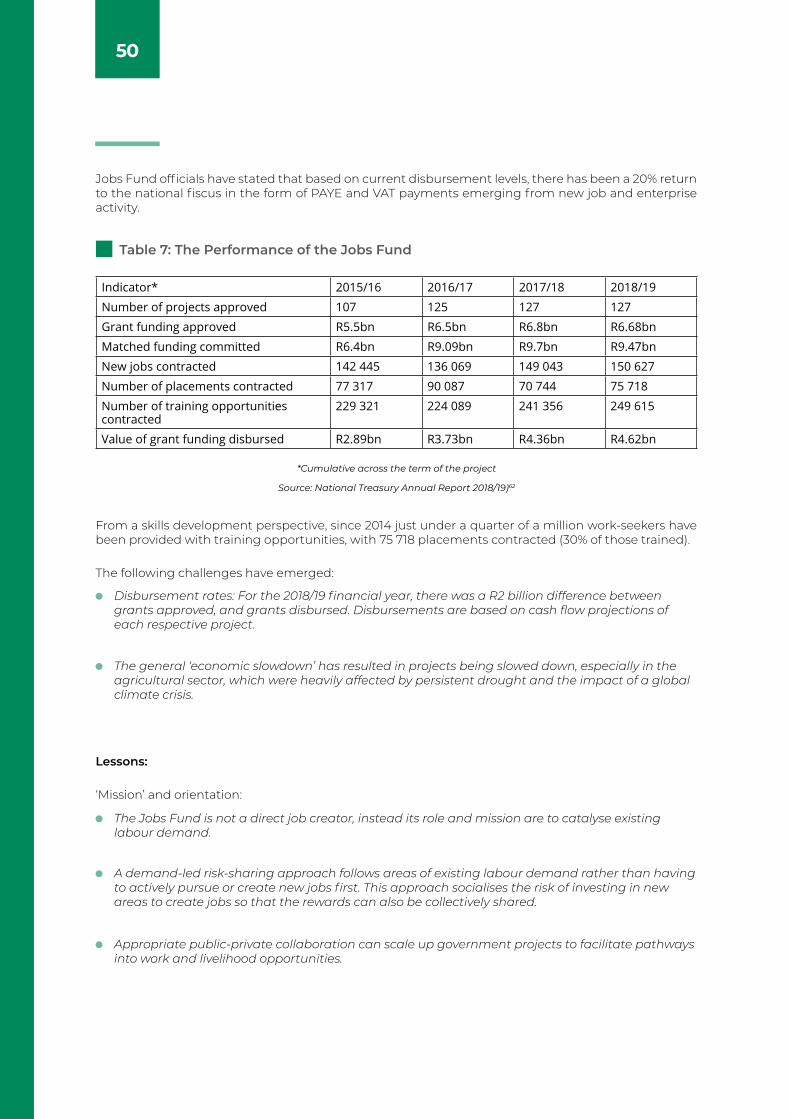
50
Disbursement rates: For the 2018/19 financial year, there was a R2 billion difference between grants approved, and grants disbursed. Disbursements are based on cash flow projections of each respective project.
The Jobs Fund is not a direct job creator, instead its role and mission are to catalyse existing labour demand.
A demand-led risk-sharing approach follows areas of existing labour demand rather than having to actively pursue or create new jobs first. This approach socialises the risk of investing in new areas to create jobs so that the rewards can also be collectively shared.
Appropriate public-private collaboration can scale up government projects to facilitate pathways into work and livelihood opportunities.
The general ‘economic slowdown’ has resulted in projects being slowed down, especially in the agricultural sector, which were heavily affected by persistent drought and the impact of a global climate crisis.
Jobs Fund officials have stated that based on current disbursement levels, there has been a 20% return to the national fiscus in the form of PAYE and VAT payments emerging from new job and enterprise activity.
From a skills development perspective, since 2014 just under a quarter of a million work-seekers have been provided with training opportunities, with 75 718 placements contracted (30% of those trained).
The following challenges have emerged:
Lessons:
‘Mission’ and orientation:
Table 7: The Performance of the Jobs Fund
Source: National Treasury Annual Report 2018/19)62
*Cumulative across the term of the project
Indicator* 2015/16 2016/17 2017/18 2018/19
Number of projects approved 107 125 127 127
Grant funding approved R5.5bn R6.5bn R6.8bn R6.68bn
Matched funding committed R6.4bn R9.09bn R9.7bn R9.47bn
New jobs contracted 142 445 136 069 149 043 150 627
Number of placements contracted 77 317 90 087 70 744 75 718
Number of training opportunities contracted
229 321 224 089 241 356 249 615
Value of grant funding disbursed R2.89bn R3.73bn R4.36bn R4.62bn
51
Lower-skilled work-seekers use a combination of government labour centres and temporary employment service (TES) agencies; and
Higher skilled work-seekers use private placement agencies.64
In the South African labour market:
Examples of such initiatives are included in APPENDIX 3.
5.4.3 PRIVATE SECTOR INITIATIVES
5.4.4 TEMPORARY EMPLOYMENT SERVICES (TESs)
Historically, public employment services like the PES division in the DoEL dominated labour market matching services in many countries. The earliest experiences of private sector employment bureaux services in South Africa include Teba (mining sector) and the Witwatersrand Native Labour Association, known as Wenela (predecessor to Teba) – which underscored the centrality of placement activities in the growth of the South African economy from an agricultural
to a mineral-reliant economy. For example, with an extensive migrant labour system, mine workers were required to conclude their employment contracts through a single recruitment agency during apartheid that was controlled by mining companies.63 In the last few decades, private employment agencies have begun to play a more prominent role in the placement of work-seekers across jobs of different skill requirements and complexity.
The NDP called for the effective regulation of the labour placement sector, in particular temporary employment services.65 The NDP proposed that where employees are placed by TESs for longer than six months, the respective agency and the client (company) should be jointly liable for any unfair dismissal and/or unfair labour practice. This, it argued, was necessary to ensure that the opportunity for job matching is also available to vulnerable workers, while protecting their basic labour rights as workers. To assess the extent to which the NDP’s recommendations have been implemented, it is necessary to evaluate the policy processes and recent legislative provisions enacted by Parliament.
There has been a complex and controversial policy and legislative debate about the role and purpose of TESs in South Africa which commenced in 2004 (see APPENDIX 5).
A policy process to review labour legislation, including issues on non-standard work, commenced at Nedlac in 2011. Consensus on key issues was not reached, including the regulation of TESs, and draft legislation was published for public comment in April 2012 (prior to the publication of the NDP) before being submitted to Parliament. After
a lengthy parliamentary process, significant changes to the law dealing with non-standard employment was enacted by Parliament and came into effect on 1 January 2015.
The model for regulating TES introduced by the 2014 LRA Amendment Act retains the approach that TESs are deemed to be the employers of workers they place with clients and does not make use of the concept of “joint employment” suggested in the NDP.
The provisions dealing with joint and several liability introduced in 1995 were strengthened to ensure that employees could hold both clients and agencies liable. These amendments also seek to promote trade unionism among placed workers.
Workers placed by a TESs are considered to be employees of the TESs for the purposes of the LRA if that placement is for less than three months (or if the worker is a substitute for an employee during that employees period of temporary absence). The draft Bill, reflecting a DoEL position endorsed by Cabinet, had proposed that ‘deeming’ would occur after six months (This was rejected by Parliament).66
52
5.4.5 EXPERIMENTING WITH VARIOUS LABOUR MARKET INTERVENTIONS DIRECTED AT THE YOUTH
The Minister of Labour may also classify other categories of work as temporary work, during which a placed worker will remain an employee of the relevant private agency, although this power has not been used yet.67 A worker who is “deemed” to be an employee receives protection against unfair dismissal and unfair labour practices, enforceable against the ‘user enterprise’ client and must receive the same remuneration and be treated in the same manner as the other employees at that company, unless there is a justifiable basis for the differentiation.68 Such workers benefit from existing collective agreements. Additional protections were introduced to protect lower-paid fixed-term contract and part-time employees as well.69
Section 13 of the Employment Services Act, which came into effect in 2015, also regulates the operation of private employment agencies including TESs (as defined in the LRA). Draft regulations to give effect to Section 13 were published for public comment on 18 December 2018 but have not yet come into effect.70
These amendments have not led to a decrease in the use of TESs as was widely predicted. The Department of Labour has concluded that while there was a small decline in short-term contract employment after the 2015 amendments came into effect, there was a larger increase in permanent employment indicating that the amendments did not have dis-employment effects. By 2018, the placement of workers by TESs had returned to pre-2015 levels (before the legislative amendments).71
Organisations advising TES workers have identified a range of strategies designed by employers to limit the benefits of these amendments, including the increased use of zero-hour contracts.[11] In addition, the fact that the threshold established in terms of Section 6(3) of the BCEA has remained unchanged since 2014 has resulted in a declining proportion of employees being covered by the provision.
According to the QLFS for Q1 of 2019, young people in South Africa account for 63.4% of all people without a job, with a crisis level of unemployment.72 After the global financial crisis in 2007-8, almost a million jobs were lost prior to 2012, the bulk of these jobs being those undertaken by people under the age of 34. Three hundred thousand fewer youth were in employment in the first quarter of 2019 than during the period after the global financial crisis. What this suggests is that youth employment patterns have followed a path vastly different to what the NDP envisaged.
The NDP recognises that the first-time entry of young people in the labour market is crucial
to addressing high levels of unemployment. Active labour market interventions that encourage the demand for younger people’s labour, increase their participation in public and community works programmes, support the development of small businesses using youth labour, and interventions that focus on job placements and internship schemes for young people, are essential.
In this section we review the efficacy of the Youth Employment Tax Incentive, the information-sharing and job-matching role of Youth Centres and the newly launched Youth Employment Service (YES).
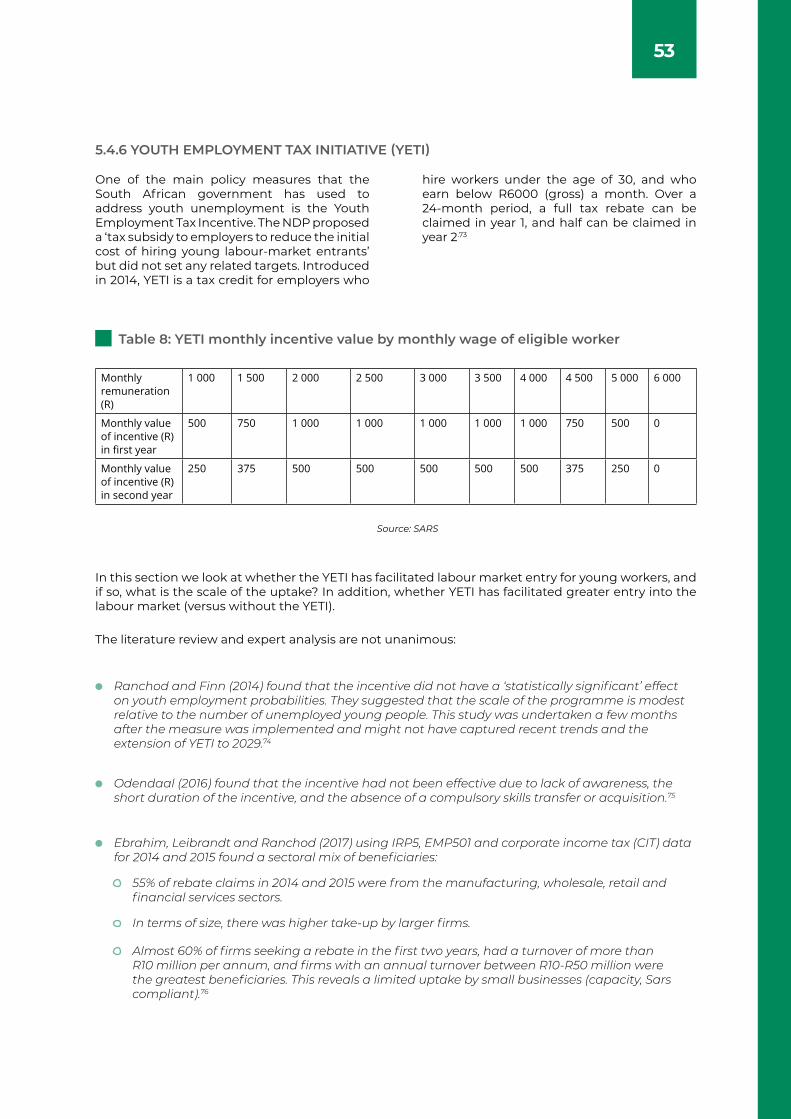
53
5.4.6 YOUTH EMPLOYMENT TAX INITIATIVE (YETI)
One of the main policy measures that the South African government has used to address youth unemployment is the Youth Employment Tax Incentive. The NDP proposed a ‘tax subsidy to employers to reduce the initial cost of hiring young labour-market entrants’ but did not set any related targets. Introduced in 2014, YETI is a tax credit for employers who
hire workers under the age of 30, and who earn below R6000 (gross) a month. Over a 24-month period, a full tax rebate can be claimed in year 1, and half can be claimed in year 2.73
Table 8: YETI monthly incentive value by monthly wage of eligible worker
Source: SARS
Monthly remuneration (R)
1 000 1 500 2 000 2 500 3 000 3 500 4 000 4 500 5 000 6 000
Monthly value of incentive (R) in first year
500 750 1 000 1 000 1 000 1 000 1 000 750 500 0
Monthly value of incentive (R) in second year
250 375 500 500 500 500 500 375 250 0
Ranchod and Finn (2014) found that the incentive did not have a ‘statistically significant’ effect on youth employment probabilities. They suggested that the scale of the programme is modest relative to the number of unemployed young people. This study was undertaken a few months after the measure was implemented and might not have captured recent trends and the extension of YETI to 2029.74
Odendaal (2016) found that the incentive had not been effective due to lack of awareness, the short duration of the incentive, and the absence of a compulsory skills transfer or acquisition.75
Ebrahim, Leibrandt and Ranchod (2017) using IRP5, EMP501 and corporate income tax (CIT) data for 2014 and 2015 found a sectoral mix of beneficiaries:
55% of rebate claims in 2014 and 2015 were from the manufacturing, wholesale, retail and financial services sectors.
In terms of size, there was higher take-up by larger firms.
Almost 60% of firms seeking a rebate in the first two years, had a turnover of more than R10 million per annum, and firms with an annual turnover between R10-R50 million were the greatest beneficiaries. This reveals a limited uptake by small businesses (capacity, Sars compliant).76
In this section we look at whether the YETI has facilitated labour market entry for young workers, and if so, what is the scale of the uptake? In addition, whether YETI has facilitated greater entry into the labour market (versus without the YETI).
The literature review and expert analysis are not unanimous:
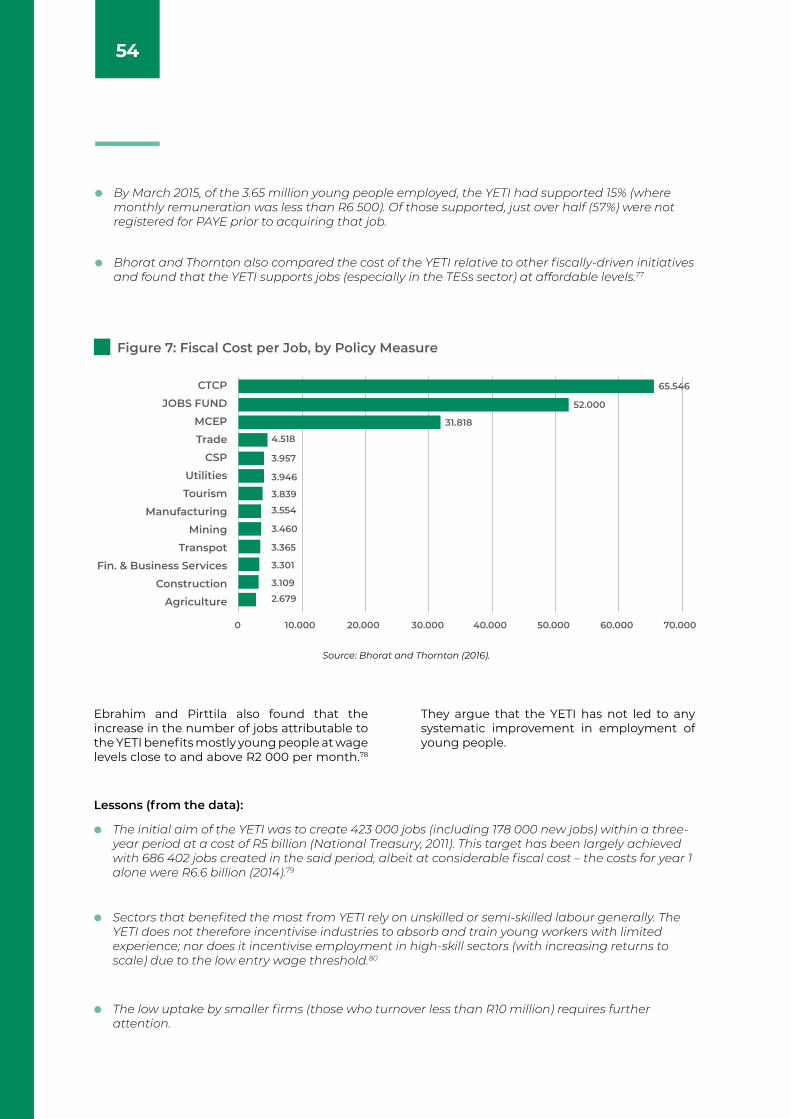
54
Ebrahim and Pirttila also found that the increase in the number of jobs attributable to the YETI benefits mostly young people at wage levels close to and above R2 000 per month.78
They argue that the YETI has not led to any systematic improvement in employment of young people.
Lessons (from the data):
Figure 7: Fiscal Cost per Job, by Policy Measure
Source: Bhorat and Thornton (2016).
CTCP
JOBS FUND
MCEP
Trade
CSP
Utilities
Tourism
Manufacturing
Mining
Transpot
Fin. & Business Services
Construction
Agriculture
0
4.518
65.546
52.000
31.818
3.957
3.946
3.839
3.554
3.460
3.365
3.301
3.109
2.679
10.000 20.000 30.000 40.000 50.000 60.000 70.000
The initial aim of the YETI was to create 423 000 jobs (including 178 000 new jobs) within a three-year period at a cost of R5 billion (National Treasury, 2011). This target has been largely achieved with 686 402 jobs created in the said period, albeit at considerable fiscal cost – the costs for year 1 alone were R6.6 billion (2014).79
Sectors that benefited the most from YETI rely on unskilled or semi-skilled labour generally. The YETI does not therefore incentivise industries to absorb and train young workers with limited experience; nor does it incentivise employment in high-skill sectors (with increasing returns to scale) due to the low entry wage threshold.80
The low uptake by smaller firms (those who turnover less than R10 million) requires further attention.
By March 2015, of the 3.65 million young people employed, the YETI had supported 15% (where monthly remuneration was less than R6 500). Of those supported, just over half (57%) were not registered for PAYE prior to acquiring that job.
Bhorat and Thornton also compared the cost of the YETI relative to other fiscally-driven initiatives and found that the YETI supports jobs (especially in the TESs sector) at affordable levels.77
55
Moreover, there is a binding macro-economic constraint to the YETI and other youth interventions (see below) wherein there are growth and regulatory constraints to the growth of sectors with a relatively higher propensity to employ young people, such as the tourism sector. It is clear in this environment that the YETI did not incentivized any new jobs (beyond those that might have been created) nor did it provide the relief
expected for smaller firms employing those with limited or no skill.
YETI should work alongside the existing skills development framework, that is, the learnerships facilitated by the SETAs. This is because firms with registered learnerships employ more younger people.81
The first, consists of programmes aimed at developing the skills and knowledge of young people on the supply-side. These include initiatives such as those overseen by the DHET (as discussed in the section on skills development).
The second, consists of funding programmes aimed at improving the demand for labour through matched funding and enterprise development support.
5.4.7 PUBLIC SECTOR DEPARTMENTAL INITIATIVES
Several labour market public participation initiatives reside outside the DoEL and the National Treasury. These initiatives can be classified into two different groups:
These initiatives are estimated to have reached over 2 million young people at a cost of over R16 billion by 2016.82
In Table 9 below, we look at four programmes/initiatives falling outside of the EPWP, DHET and National Treasury for illustrative purposes, looking at reach and expenditure in relation to the number of young people ‘not in employment, education or training’ (NEET):
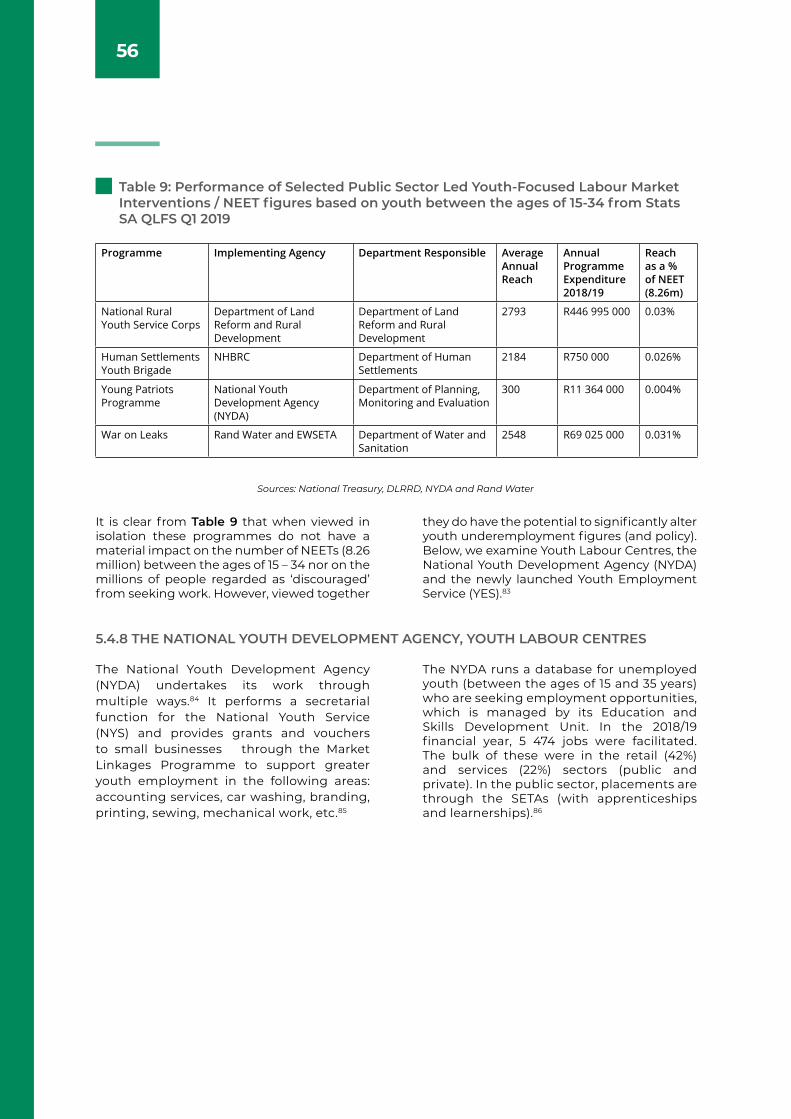
56
It is clear from Table 9 that when viewed in isolation these programmes do not have a material impact on the number of NEETs (8.26 million) between the ages of 15 – 34 nor on the millions of people regarded as ‘discouraged’ from seeking work. However, viewed together
they do have the potential to significantly alter youth underemployment figures (and policy). Below, we examine Youth Labour Centres, the National Youth Development Agency (NYDA) and the newly launched Youth Employment Service (YES).83
Programme Implementing Agency Department Responsible Average Annual Reach
Annual Programme Expenditure 2018/19
Reach as a % of NEET (8.26m)
National Rural Youth Service Corps
Department of Land Reform and Rural Development
Department of Land Reform and Rural Development
2793 R446 995 000 0.03%
Human Settlements Youth Brigade
NHBRC Department of Human Settlements
2184 R750 000 0.026%
Young Patriots Programme
National Youth Development Agency (NYDA)
Department of Planning, Monitoring and Evaluation
300 R11 364 000 0.004%
War on Leaks Rand Water and EWSETA Department of Water and Sanitation
2548 R69 025 000 0.031%
5.4.8 THE NATIONAL YOUTH DEVELOPMENT AGENCY, YOUTH LABOUR CENTRES
The National Youth Development Agency (NYDA) undertakes its work through multiple ways.84 It performs a secretarial function for the National Youth Service (NYS) and provides grants and vouchers to small businesses through the Market Linkages Programme to support greater youth employment in the following areas: accounting services, car washing, branding, printing, sewing, mechanical work, etc.85
The NYDA runs a database for unemployed youth (between the ages of 15 and 35 years) who are seeking employment opportunities, which is managed by its Education and Skills Development Unit. In the 2018/19 financial year, 5 474 jobs were facilitated. The bulk of these were in the retail (42%) and services (22%) sectors (public and private). In the public sector, placements are through the SETAs (with apprenticeships and learnerships).86
Table 9: Performance of Selected Public Sector Led Youth-Focused Labour Market Interventions / NEET figures based on youth between the ages of 15-34 from Stats SA QLFS Q1 2019
Sources: National Treasury, DLRRD, NYDA and Rand Water
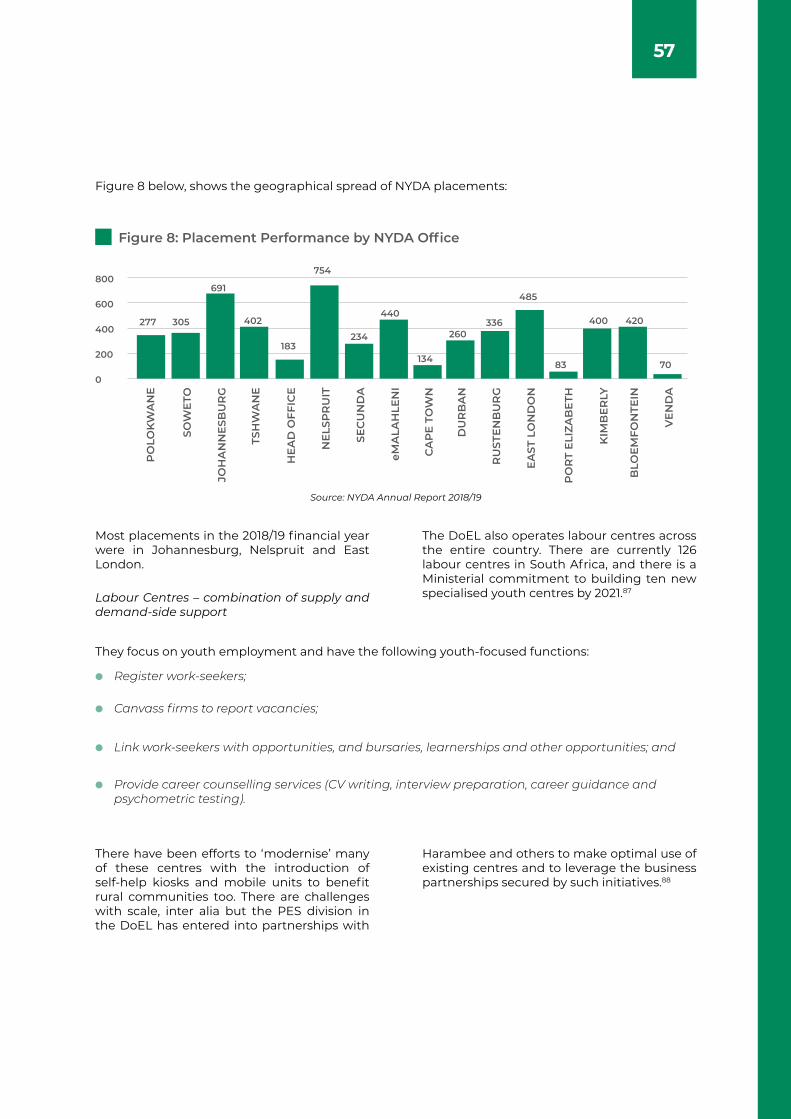
57
Most placements in the 2018/19 financial year were in Johannesburg, Nelspruit and East London.
Labour Centres – combination of supply and demand-side support
The DoEL also operates labour centres across the entire country. There are currently 126 labour centres in South Africa, and there is a Ministerial commitment to building ten new specialised youth centres by 2021.87
There have been efforts to ‘modernise’ many of these centres with the introduction of self-help kiosks and mobile units to benefit rural communities too. There are challenges with scale, inter alia but the PES division in the DoEL has entered into partnerships with
Harambee and others to make optimal use of existing centres and to leverage the business partnerships secured by such initiatives.88
They focus on youth employment and have the following youth-focused functions:
Register work-seekers;
Canvass firms to report vacancies;
Link work-seekers with opportunities, and bursaries, learnerships and other opportunities; and
Provide career counselling services (CV writing, interview preparation, career guidance and psychometric testing).
Figure 8: Placement Performance by NYDA Office
Source: NYDA Annual Report 2018/19
PO
LOK
WA
NE
SOW
ETO
JOH
AN
NE
SBU
RG
TSH
WA
NE
HE
AD
OFF
ICE
NE
LSP
RU
IT
SEC
UN
DA
eMA
LAH
LEN
I
CA
PE
TO
WN
DU
RB
AN
RU
STE
NB
UR
G
EA
ST L
ON
DO
N
PO
RT
ELI
ZAB
ETH
KIM
BE
RLY
BLO
EM
FON
TEIN
VE
ND
A
277 305
691
402
183
754
234
440
134
260336
485
83
400 420
70
800
600
400
200
0
Figure 8 below, shows the geographical spread of NYDA placements:
58
Recommendation
There is an urgent need to connect all these measures and initiatives to create a coherent job creation and youth employment package and programme for South Africa, and to attend to the duplication of several simultaneous efforts and databases across the private and public sectors. Efforts need to be instituted to develop and widely disseminate a youth employment policy package rather than the current approach which is far from being an integrated policy mix.
Greater communication efforts, in the case of the YETI, need to be undertaken to popularize the incentive among qualifying small- and medium-sized enterprises, and these communication efforts need to be complemented by measures to reduce the administrative burden of compliance on these enterprises through the simplification of the PAYE/UIF submission process for small enterprises.
Policies aimed at getting young people into work, like the YETI, need to be co-articulated with learnerships, internship programmes and empowerment legislation (as in the case of the YES) and facilitated through one ‘regulatory window’ so firms can see the benefits of compliance. This could be done through a common application process that triggers a YETI response and an impact on sector scorecards.
Encourage greater use of algorithms, analysis and sharing of datasets within and outside government to ‘geographically’ map employment opportunities to the location of young people on registered databases (be it Harambee or ESSA) in order to facilitate greater employee experience and job retention among the youth, many of whom suffer from the spatial division of South Africa which leads to high numbers of discouraged work-seekers.
Facilitate innovative private-public partnerships that use the existing assets and operational models of medium-sized and large businesses to socialise and underwrite the costs of job search. An interesting examples that exists is that Uber has offered free rides for those who bag an interview. Greater exploration of the NDP proposal on work-seeker transport (and other) vouchers is required at a systemic level to serve as a reactivation mechanism for many unemployed and discouraged work seekers.
5.4.9 YOUTH EMPLOYMENT SERVICES (YES)
The Youth Employment Service (YES) is a new initiative between business, government, labour and civil society, which was launched in 2018. It is aimed at creating one million work opportunities for young people in a context where there are six million young people who are unemployed. Under the programme, companies and businesses create one-year paid positions for young people between the ages of 18 and 35 years with a minimum stipend of R3 500 a month.
The incentives to participate includes the demand-side employment tax incentive and transformation recognition incentives, via B-BBEE scorecards.89 Figures show that 490 companies have already signed up to the YES programme with a commitment of 27 854 work opportunities.90
59
5.5 STABILISING THE LABOUR ENVIRONMENT, IMPROVING DISPUTE RESOLUTION AND SHOP FLOOR/WORKPLACE RELATIONS
5.5.1 LABOUR RELATIONS CLIMATE – MANAGING STRIKE ACTION AND PROLONGED INDUSTRIAL DISPUTES
The NDP describes labour relations as having become “fraught in the past few years” citing “[R]educed negotiating capacity, the re-emergence of non-workplace issues in negotiations, and the rise of general mistrust between the parties” as the key contributing factors.91
While there was a significant decline in strike action during the first decade of democracy, there was a significant increase in working days lost to strike action after 2006 and a resurgence of prolonged strikes, often marked by violence, lawlessness, and a disregard for court orders. The Department of Labour identified wage inequality and increased casualisation in the labour market associated with declining conditions of employment as contributing to the increased levels of strikes in this period.
Concerns about the resurgence of prolonged strikes led to a reconsideration of aspects of the legislative model such as those regulating collective bargaining and strikes with a view to achieving greater labour market stability in 2012. Certain modifications to the legislative structure of organisational rights were introduced by the 2014 LRA Amendment Act. This addressed provisions that had allowed employers and trade unions to utilise threshold agreements to exclude minority trade unions from acquiring organisational rights, which had been widely criticised and had contributed to the volatile industrial relations climate at mines such as Lonmin prior to the Marikana massacre.
In his State of the Nation address on 17 June 2014, President Zuma called for the social partners to deliberate on the state of the labour relations environment and to address the issues of low wages, wage inequality, and violent as well as protracted strikes. A high-level labour indaba chaired by Deputy President Ramaphosa adopted the Ekurhuleni Declaration on 4 November 2014, recording the agreement of the Nedlac constituencies to address the issues of labour market stability and wage inequality. The agreement on labour market stability encompassed issues ranging from the promotion of employment and social protection, prolonged strikes, violence during strikes, collective bargaining to the role of the state in collective bargaining and strikes.
The commitment to address wage inequality required the social partners to engage on the adoption of a national minimum wage. Subsequently, an Accord on Collective Bargaining and Industrial Action which sought to address strike violence, intimidation, and the harm caused by prolonged strike action, while recognising the constitutional right to strike and the statutory right of employers to lock out was adopted. The Accord records commitments by organised business and organised labour as well as a range of key role-players such as the CCMA, bargaining councils, the South African Police Services, the Private Security Regulatory Authority, and SETAs. A subsequent negotiation process in Nedlac led to the adoption of a draft Code of Good Practice on Picketing, Collective Bargaining, and Strikes.
The Code seeks to address what has been described as the absence of constructive engagement strategies in South African labour relations.92 Its starting point is that serious measures are needed to induce a behaviour change in the way trade unions, employers and significant employers’ organisations engage with each other in the collective bargaining process. Its purposes include strengthening and promoting orderly collective bargaining, recognising the importance of workplace democracy and dialogue, promoting effective and constructive dispute prevention and dispute resolution, and promoting steps to prevent prolonged or violent industrial action. The Code explicitly recognises the need for the development of skilled negotiators on behalf of both employers and workers and contains a draft agreement in terms of which employers and trade unions agree to bargain in good faith.
The draft National Minimum Wage Bill together with the LRA and BCEA Amendment Bills were published for public comment in November 2017. These laws came into effect on 1 January 2019 after an extensive parliamentary process. This represented the most significant pact on the content of labour legislation since the early post-apartheid era.
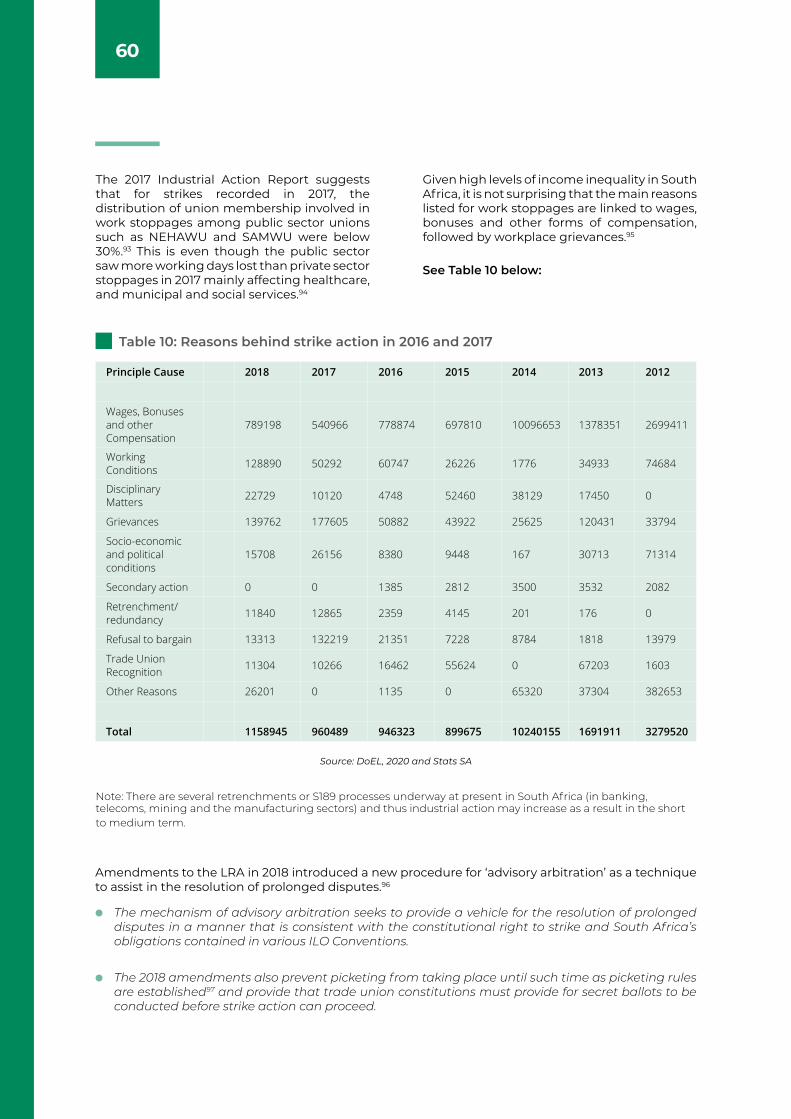
60
The 2017 Industrial Action Report suggests that for strikes recorded in 2017, the distribution of union membership involved in work stoppages among public sector unions such as NEHAWU and SAMWU were below 30%.93 This is even though the public sector saw more working days lost than private sector stoppages in 2017 mainly affecting healthcare, and municipal and social services.94
Given high levels of income inequality in South Africa, it is not surprising that the main reasons listed for work stoppages are linked to wages, bonuses and other forms of compensation, followed by workplace grievances.95
See Table 10 below:
Table 10: Reasons behind strike action in 2016 and 2017
Principle Cause 2018 2017 2016 2015 2014 2013 2012
Wages, Bonuses and other Compensation
789198 540966 778874 697810 10096653 1378351 2699411
Working Conditions 128890 50292 60747 26226 1776 34933 74684
Disciplinary Matters 22729 10120 4748 52460 38129 17450 0
Grievances 139762 177605 50882 43922 25625 120431 33794
Socio-economic and political conditions
15708 26156 8380 9448 167 30713 71314
Secondary action 0 0 1385 2812 3500 3532 2082
Retrenchment/ redundancy 11840 12865 2359 4145 201 176 0
Refusal to bargain 13313 132219 21351 7228 8784 1818 13979
Trade Union Recognition 11304 10266 16462 55624 0 67203 1603
Other Reasons 26201 0 1135 0 65320 37304 382653
Total 1158945 960489 946323 899675 10240155 1691911 3279520
Source: DoEL, 2020 and Stats SA
Amendments to the LRA in 2018 introduced a new procedure for ‘advisory arbitration’ as a technique to assist in the resolution of prolonged disputes.96
The mechanism of advisory arbitration seeks to provide a vehicle for the resolution of prolonged disputes in a manner that is consistent with the constitutional right to strike and South Africa’s obligations contained in various ILO Conventions.
The 2018 amendments also prevent picketing from taking place until such time as picketing rules are established97 and provide that trade union constitutions must provide for secret ballots to be conducted before strike action can proceed.
Note: There are several retrenchments or S189 processes underway at present in South Africa (in banking, telecoms, mining and the manufacturing sectors) and thus industrial action may increase as a result in the short to medium term.
61
The NDP’s observation about the fraught state of labour relations remains valid. For instance, the CCMA’s 2016/2017 Annual Report describes the labour market as being in ‘distress’ and characterised by ‘conflict and dispute’. Legislative developments have sought to address certain of the causes of workplace tension including casualisation and the abuse of organisational rights agreements. The provisions that flowed from the Agreement on Labour Market Stability only came into effect at the start of 2019. However, primary triggers of industrial conflict such as wage inequality, inadequate service delivery and the inadequacy of social wage benefits have
not been significantly addressed. While there are significant fluctuations in strike levels from year to year, there is no overall trend to indicate decreased levels of industrial dispute. There has been no decrease in the level of collective bargaining disputes referred to the CCMA or declining adversarialism in the workplace.
Our discussion of the CCMA below, makes concrete recommendations to enhance the capacity of the CCMA to contribute to labour market stability and enhanced workplace relationships.
The statutory mandate to conciliate all disputes referred to the CCMA poses several challenges:
The CCMA is required to provide expeditious dispute resolution in many rights’ disputes which proceeds to arbitration if not settled (some cases are referred to the Labour Court).102
In the case of large-scale retrenchments, the CCMA is required to facilitate the process of consultation, inter alia, in order to minimise job-losses.103
The CCMA is also required to mediate unresolved collective bargaining (mutual interest) disputes. These range from disputes involving single employers to disputes arising out of sectoral bargaining in major sectors of the economy.
The CCMA has the power to intervene in public interest disputes that may negatively affect labour market stability, even if the parties have not referred a dispute to the CCMA. During 2018 – 2019, there were 180 such interventions.
5.5.2 COMMISSION FOR CONCILIATION, MEDIATION AND ARBITRATION (CCMA)
The NDP notes that the primary function of the CCMA is to provide ‘cheap, quick, accessible, and informal dispute resolution’ support. It emphasises the importance of the CCMA’s training and capacity building function in enhancing bargaining and labour relations skills. It concludes that the operational efficiencies of the CCMA are important for the effective operation of the labour market and recommended that it receive additional support although it did not specify what form it should take. The CCMA has sought to align its strategic goals to those of the NDP.98 The CCMA has developed proactive strategies to assist parties to prevent disputes and build negotiating capacity and constructive workplace relations.
Background
The CCMA is responsible for dispute resolution (conciliation and arbitration), dispute prevention, institution-building, and training. It regulates the dispute resolution functions of bargaining councils as well as private dispute resolution agencies through accrediting, subsidising, and monitoring their activities.99 The CCMA receives in excess of 190 000 dispute referrals annually, making it the largest labour dispute resolution agency in the world (in terms of caseload). The CCMA maintains an electronic case management system which is used to schedule hearings and processes and provides extensive labour market trends data. Two-thirds of cases concern unfair dismissal complaints.100 While there have been attempts (legislative amendments) to reduce the CCMA’s dismissal caseload, these have not had a major impact.101
62
The CCMA’s is engaged with its stakeholders in two projects emanating from the Job Summit Framework Agreement:105
The CCMA is funded by the national fiscus, but current levels are insufficient to meet its expanded and critical labour relations mandate.106 The pressure on its resources has been exacerbated by the expansion of its jurisdiction without an equivalent increase in funding. The CCMA, like other public institutions, has been encouraged to develop additional revenue streams and currently generates 1% of its income from services. The national director has indicated that the CCMA has inadequate capacity to perform its expanded mandate.
There is a significant tension between the scale of the CCMA’s activities in pursuit of its two mandatory functions (conciliation and arbitration) and its potential to expand the pursuit of its broader mandate within the labour market which includes dispute prevention and capacity building.107 While dispute prevention has received an increased emphasis, which is strengthened in its 2020 – 2024 strategy, its capacity to intervene to rebuild negotiating capacity within the labour market and promote healthy labour relations is constrained by available resources.108 Currently only 1.5% of its budget is allocated to these activities, including the promotion of the 2019 Collective Bargaining Code.
In January 2019, the CCMA’s jurisdiction was expanded to include adjudicating disputes under the National Minimum Wage Act (Act No. 9 of 2018) and claims under the BCEA for low-paid workers. This increased its caseload by approximately 13%, since the beginning of 2019. The CCMA’s jurisdiction has been expanded on several occasions by legislation to include arbitrating several categories of disputes that did not form part of its initial mandate. The expansion of its jurisdiction has not been matched by an equivalent increase in resources.104
Since 2019, the CCMA must appoint Advisory Arbitration Panels to make recommendations to resolve prolonged industrial disputes, and to play a more active role in the regulation of strike ballots and picketing during strikes.
It is therefore proposed that the CCMA Governing Body should develop a proposal to expand the dispute prevention functions and to ensure that a greater level of resources is earmarked specifically for dispute prevention activities. As part of this process, the issue of whether funds available through the National Skills Fund and SETAs can be utilised for dispute prevention and negotiation training activities should be explored.109
5.5.3 THE CCMA/BUSA LABOUR ADVICE TOOL FOR SMALL BUSINESSES
5.5.4 THE TEMPORARY EMPLOYEE/EMPLOYER RELIEF SCHEME (TERS)
RECOMMENDATION
This represents the most direct implementation of the recommendations to ease the regulatory burden of small
businesses. The tool enhances the capacity of small businesses to deal with issues of labour law. (see section 6.8)
The TERS replaced the Training Lay-off Scheme which was initially established during the recession in 2008. A single adjudicating committee110 reviews claims by businesses
that are in financial distress and provides benefits during a training lay-off of up to three months.
63
Functioning
After considerable delays, new rules regulating the Labour Court were expected to come into effect in early 2020.112 This is the first revision to the rules since 2001. The promulgation of the rules has been delayed by the failure of the Department of Justice and Constitutional Development to provide funds for the functioning of the Rules Board.
Resources should be made available to integrate the case management system of the Labour Court with that of the CCMA.
Resources should be made available to ensure that the draft revised rules of the Labour Court are implemented as a matter of urgency.
The caseload of the Labour Court has continued to increase, especially in Johannesburg (Gauteng), which has 11 full-time judges and an annual caseload of at least 10 000 cases. It is estimated that a case takes an average of 18 - 24 months to be completed. The Labour Court has introduced a practice manual to promote efficient dispute resolution and introduce case management by judges to minimise delaying tactics by some legal practitioners.113
There is a shortage of court venues in Johannesburg which has prevented the appointment of additional judges. The responsibility for leasing additional facilities rests with the Department of Justice and Constitutional Development.
Considering the substantial caseload of both the Labour Court and the LAC, its structure, in terms of which there is a single Judge President that heads both institutions, is not optimal. The court has therefore proposed that there should be an institutional separation between the LC and LAC and that each court should have its own Judge President and Deputy Judge President. While this change will require amendments to the LRA, it will not involve additional resources to implement.
The Labour Court does not have a case management system that is equivalent to that of the CCMA. This is necessary for alignment, administrative ease and to reduce the time it takes to resolve disputes referred to the Labour Court by the CCMA.114
5.5.5 LABOUR COURT AND LABOUR APPEAL COURT
5.5.6 BARGAINING COUNCILS
RECOMMENDATION
The NDP recommended a review of the funding model and operational functionality of the Labour Court (LC) and the Labour Appeal Court (LAC).111 The Plan did not specify
by whom or how this review should be conducted. There has been no significant alteration to the functioning of the institutions since 2012.
The NDP recommended steps to strengthen existing bargaining councils. Sectoral bargaining councils carry out collective
bargaining and dispute resolution functions in several sectors, covering about 2.5 million workers.
64
Bargaining councils established for public sector staff cover approximately 1.2 million workers.115
The establishment of private sector bargaining councils is voluntary and thus not required by law. Where such councils exist, it only covers about 15% of workers in the private sector.116
Since 2013, bargaining councils have also been established in the civil engineering sector (2013) and the private security sector (2018), assisted by the CCMA.
The Metal and Engineering Industries Bargaining Council (MEIBC), the largest bargaining council in the private sector, was placed under the control of an administrator in 2017 to rehabilitate the council due to insolvency and poor functioning occasioned by maladministration and the collapse of its dispute resolution functions.117
Several bargaining councils have been subject to strategies of destabilisation by employer organisations opposing them.
There is extremely limited co-ordination between bargaining councils and no formal structure for this purpose.
The 2018 LRA Amendment Act (Act No. 8 of 2018) contains provisions dealing with the renewal and extension of funding agreements to provide greater financial stability.
The DoEL should consult with bargaining councils to ascertain areas where co-ordination would be beneficial.
From 2020, the recording of bargaining council cases/disputes will be integrated into the CCMA case management system to promote effective dispute resolution.
5.5.7 LABOUR INSPECTION AND ENFORCEMENT SERVICE
Two significant developments seek to strengthen the operation of bargaining councils:
Recommendation:
The NDP calls for more effective enforcement of compliance with minimum wage rules and other basic conditions of employment. It also calls for implementing and monitoring health and safety regulations. These issues are stated without any further elucidation in the text of the NDP and there is no discussion of the operations of the DoEL.118
The Integrated Enforcement Services (IES) within the DoEL consists of a combination of specialist and general inspectors and operates from the DoEL’s provincial offices
and Labour Centres. Matters that cannot be resolved through voluntary compliance or via a compliance order are referred to dedicated IES units to institute legal proceedings. The enforcement process was streamlined by the BCEA Amendment Act (Act No. 20 of 2013). There was a 20% increase in the budget allocation for IES between 2011/12 and 2015/2016 which included a budget for the training of its inspectors and towards a process of professionalising the labour inspectorate. The approved establishment was increased from 1356 posts in 2012 to 1735 in 2016.
65
The draft Occupational Health and Safety Amendment Bill should be prioritised in order to modernise health and safety enforcement.
5.5.8 NATIONAL ECONOMIC DEVELOPMENT AND LABOUR COUNCIL (NEDLAC)
Recommendation:
Steps towards professionalising the labour inspectorate have involved higher entry qualifications for the post of inspector and improving terms and conditions of service for inspectors in order to attract and retain suitably qualified staff.
In 2013, government ratified the Labour Inspectorate Convention 1947 (No. 181) at the recommendation of the ILO, however progress towards improving the efficiency of inspections in recent years has been constrained by reduced budgetary allocations to the IEA against the backdrop of a depressed economy. This has had a negative impact on its ability to further increase the number of inspectors needed and to fill vacancies. A review conducted by the ILO in 2017 further indicated that reforms have been slow in the area of occupational health and safety (OHS) giving rise to a strong sense by senior management within IES that the inspectorate has not been able to adequately respond to current OHS developments.
The DoEL also faces a critical shortage of health and safety inspectors and government has had to rely on the outsourcing of OSH inspection services which are not well regulated.119
There have been extensive delays in the updating of the Occupational Health and
Safety Act (OHSA) (Act No. 181 of 1993). The need to amend the Act was first mooted in the late 1990s after the passage of the Mine Health and Safety Act (Act No. 29 of 1996). The Occupational Health and Safety Amendment Bill was tabled in Nedlac in 2015 but has yet to be tabled in Parliament. A study on the adequacy of resources available for effective labour inspections made extensive recommendations to increase the efficiency of the IES including ten recommendations to address the difficulties that the IES is facing.120
An overview of studies on enforcement concludes that employers are able to violate the law with relative certainty that they will not be caught and that even if they are, the prescribed penalties are low. It concludes that the high-level violation of basic employment conditions is a consequence of the large power disparities between employers and employees in a job-scarce economy.121
In his 2019 Budget Vote speech, the Minister announced that the DoEL had carried out 167 000 inspections but that it does not have the capacity to do so at every workplace. The DoEL is due to recruit an additional 200 inspectors in order to enforce the national minimum wage and a further 500 health and safety inspectors, funded through the Compensation Fund. A budget of R628 million has been set aside for the financial year.
Nedlac is a statutory body made up of multiple stakeholders that is mandated by law to consider legislation and policies related to the labour market prior to it being tabled in Parliament. The Nedlac founding documents and constitution permits the constituencies representing organised business and organised labour to determine the criteria for the admission of additional participants or stakeholders. Numerous developments have emerged that have influenced not only the functioning of Nedlac, but also, its relevance and suitability today.
Firstly, the social and political environment has changed since 1994. Nedlac was established at a time when there was a strong and unified trade union movement. That is no longer the case with significant trade union fragmentation having taken place. in addition, fewer formally employed workers in the private sector (in a country with high unemployment) are union members now compared to 1994. Divisions in the labour movement have also presented certain representation and relevance challenges. Similarly, among the business sector, small businesses want representation at Nedlac too, resulting in an ‘insider-outsider’ divide.
66
On representation: The Minister has suggested that there is a need to revisit the founding protocols of Nedlac to encourage greater inclusivity. This will not only build greater credibility for future social pacts, but it will also facilitate social buy-in. This applies to both the labour and the business constituencies as well as for representation in the community chamber. There is currently a task team charged with this matter, within Nedlac.
Easing the rules for probation in order to promote hiring;
Simplifying pre-dismissal procedures in cases involving poor performance or misconduct;
Reducing the regulatory burden on small employers in respect of dismissals; and
That senior managers earning above a specified income level (R300 000 per annum) should be precluded from referring dismissal cases to the CCMA.
On organisational effectiveness: The Minister stated at the 2019 Nedlac summit that it was important to fill crucial vacancies (especially that of the Executive Director and the CFO). While this is important, there is also a compelling need to strengthen the capacity of the Nedlac secretariat especially in areas of policy research, agenda-setting and general administration.
On funding: If the broader goals of achieving social pacts are to be achieved, appropriate funding mechanisms for research and policy development must be secured.
5.6 CLARIFYING DISMISSAL AND RETRENCHMENT PROVISIONS IN THE LABOUR RELATIONS ACT122
5.6.1 DISMISSAL
Recommendations re. Nedlac’s role in facilitating consensus and social dialogue on key labour market and economic policy matters:
The NDP makes several recommendations in respect of dismissal practices and proposes:
Secondly, though notwithstanding the relevance concern mentioned above, Nedlac achieved some success with the NMW process. Critics argue it has failed to facilitate meaningful social pacts that are now required to navigate opposing views on key labour market and economic policy matters. This also brings into question its current organisational efficiency and capacity to undertake time consuming social dialogues.
Third, the process of effectively developing and piloting policy and draft labour legislation
through Nedlac requires extensive policy and technical expertise, particularly from the government side which assumes primary responsibility for these processes. On the one hand, these resources are most effectively deployed in the case of high-profile legislation (such as the LRA, BCEA and the NMWA). On the other hand, the processes of amending statutes (such as COIDA and the OHSA) have been extensively delayed for many years with negative consequences.
67
It was envisaged that the Code would be regularly revised by Nedlac to reflect evolving case law. This would provide guidance to employers and employees, allow for flexible interpretation of the rules, and minimise transaction costs associated with dismissal.
The Code has remained unchanged except for a single amendment dealing with probation (introduced in 2002 via amendments to the LRA).
The CCMA’s Governing Body has published Guidelines for Arbitrators dealing with Misconduct Cases to promote more consistent decision-making by arbitrators in dismissal cases. The guidelines came into force in 2012, were revised in 2015, and are due to be revised again in 2020.124
The issues identified by the NDP have previously been the subject of Nedlac negotiations. However, either consensus was not achieved by the social partners or draft legislative provisions formulated in Nedlac were rejected or modified during the parliamentary process. Some of the issues raised by the NDP could be addressed by revising the Code of Good Practice: Unfair Dismissal while others would require amendments to the LRA. This distinction is not made explicit in the NDP.
Background
Protection against unfair dismissal was established by the then Industrial Court during
the 1980’s under apartheid, and subsequently codified in the LRA. The post-apartheid reforms of unfair dismissal law sought to protect worker rights, reduce the costs of disputes, and prevent dismissal disputes, which often lead to strikes. The general provisions in the statute are supplemented by a Code of Good Practice: Unfair Dismissal (the Code) which was intended to promote certainty, while at the same time allowing for a flexible application of the law by permitting small businesses to comply with a less formalised procedure.123 Despite this, many employers continued to utilise formalised internal procedures.
Representatives of all social partners interviewed for this review support updating the Code. Revising it would address the NDP’s concern to clarify employers’ obligations in respect of dismissal and would allow for separate simple procedures for small businesses.
Impact on labour market
Several studies of the last two decades have concluded that while the South African labour regulatory environment is not particularly onerous when compared to other middle-income countries, there is a perception that it is more onerous to employers, thus influencing labour market behaviour.125 This has been described as the “hassle” factor associated with hiring employees and has contributed to a perception of a rigid labour market, among both local and international firms.126 A recent study has also pointed out that labour law service providers have a commercial interest in painting a dark picture of labour law regulation to clients.127 A limitation of these papers and comparative indices is that they do not take account of the way legislation is interpreted.128
The perception of rigidity is driven to a large
extent by the ease with which employees may refer dismissal disputes to conciliation or arbitration at the CCMA or bargaining council (as the case may be) and the risks and costs associated with such proceedings.129 Irrespective of the outcome, which is mostly commonly a small financial settlement, the employer will have to spend time and resources defending the claim. The employee will be entitled to apply for unemployment benefits, although these will be extremely limited in the light of the short service of the employee.
Probation
The NDP highlighted the issue of employment probation periods as a matter requiring attention and called for a policy intervention that reflects the intention of probation. It went on to propose that to ease entry into formal work opportunities, unfair dismissal protection should not apply to employees on probation for a period of up to six months.130 . There is significant support among labour lawyers and economists for the introduction of such a qualifying period before employees are eligible to receive ordinary protection against unfair dismissal.131
68
The introduction of such a provision would require amendments to the LRA. Likewise, the NDP’s proposal that an unfair dismissal could only be reversed on grounds of substantive unfairness would require legislative amendment.132 The Labour Appeal Court has warned arbitrators to be hesitant about setting aside probation decisions and standards.
The issue of probation has an extensive policy history.133 Previous proposals by the DoEL to minimise employers’ obligations during probation periods have been resisted by organised labour due to a concern that employers could exploit any reduced level of protection by rolling over probation contracts.
Concerns about pre-dismissal procedures are most strongly felt by small businesses who lack HR practitioners to manage probation performance. An employer who terminates an employee’s employment during probation because of concerns about their ability to perform their tasks or their suitability, faces a significant probability that the employee will refer a dispute to the CCMA or bargaining council. The referral does not carry any costs for an employee, other than those associated
with completing the referral forms and travelling to the CCMA. An argument can therefore be made that a revision for probation as suggested by the NDP is a greater necessity for small and new businesses.
While the topic is described as including the clarification of retrenchment provisions, there is no discussion of this in the NDP. Any change to retrenchment provisions would require a legislative amendment as those are regulated in detail in the statue. Trade unions such as COSATU have called for changes to the retrenchment provisions in the LRA including an increase in the statutory severance pay. Issues related to dismissal law are highly contested. Any resolution should therefore be tailored to minimise the impact on the rights of existing employees. Nevertheless, there is substantial evidence that a reduction of employer risk during an initial period of employment would promote new employment opportunities.
The extent to which the provisions of the Unemployment Insurance Act (Act No. 63 of 2001) could be revised to provide a larger benefit for employees who lose their employment during probation has not been explored and should form a part of future deliberations.
5.6.2 RESTRICTION OF RIGHTS OF HIGHER-PAID EMPLOYEES
The NDP proposed that access to the CCMA in dismissal cases should be restricted for senior managers earning more than R300 000 per annum. The NDP states that the rationale for this is that these employee’s contracts better regulate dismissal procedures.
The NDP does not specify whether it envisages a restriction on their substantive rights or merely to require them to refer cases to other forums such as private arbitration or the Labour Court. No rationale for the R300 000 threshold is provided. A limitation on employee’s rights at the proposed income level is likely to be severely disruptive and would increase the caseload of the Labour
Court massively and delay the resolution of disputes in that forum. There have been several previous proposals to limit the protection of higher-paid workers against unfair dismissal protection and limit their access to the CCMA. In particular, a proposal in the 2012 LRA Amendment Bill to limit the protection of higher-paid employees against unfair dismissal to reduce the caseload of the CCMA was agreed at Nedlac but rejected by the parliamentary Portfolio Committee.134
Any restrictions on access to the CCMA for a defined group of employees as envisaged by the NDP can only be introduced by an amendment to the LRA.
69
Our primary recommendation is that a revised Code of Good Practice: Unfair Dismissal should be prioritised.
The extension of bargaining council agreements.
The time required for dispute settlement procedures.
The procedural requirements for disciplinary and productivity dismissals.
The minimum standards set out in the BCEA around wage determinations, paid leave, overtime and retrenchment pay.
The failure to do so to date appears to be an issue of resources and/or prioritisation rather than any opposition by any stakeholder. While the LRA envisaged that Nedlac would update the Code, there is a lack of certainty as to who should ‘trigger’ the process.
The Minister of Employment and Labour should place the need for the Code of Good Practice: Unfair Dismissal and the Code of Good Practice: Dismissal Based on Operational Requirements to be updated on the Nedlac agenda as a matter of urgency.
The revised Code should deal expressly with the obligations of small businesses in respect of dismissal in a separate section in clear terms, thus contributing to a reduction of the regulatory burden of small businesses.
This would allow Nedlac to determine a method for a draft to be prepared for its consideration.
One possible mechanism would be for a panel of expert lawyers, including representatives of each of the social partners, to be appointed to prepare drafts to be considered by Nedlac. This process would not alter the existing law but would codify binding judicial decisions, particularly those of the Labour Appeal Court.
As the preceding discussion indicates certain of the proposals in the NDP cannot be achieved by revising the Code and require statutory amendments. These include the proposals concerning probation and a limit on the rights of higher paid employees to bring unfair dismissal cases to the CCMA.
If these issues are to be taken further, the CCMA should be requested to conduct an in-depth study of unfair dismissal referrals to form the basis for engagements by the social partners. This should include issues related to retrenchment which are raised, but not discussed by the NDP.
5.6.3 REVIEWING REGULATIONS AND STANDARDS FOR SMALL BUSINESSES
RECOMMENDATION
The NDP highlights the significance of reducing the regulatory burden for small businesses. Proposals to address the problems encountered by small businesses in respect of dismissal law are dealt with earlier in this review. The NDP also highlights the need to simplify or eliminate reporting requirements in terms of the Skills Development Act (SDA) and the EEA for small businesses. However, both the SDA and EEA already exclude certain small businesses from relevant provisions and
the recommendations does no more than describe the current law.135
According to a report commissioned by the Department of Small Business Development prepared by Trade and Industrial Policy Strategies (TIPS) in 2017, 19% of businesses surveyed raised labour regulation as a burden. According to the report, the main issues of concern in the interface between labour regulations and small businesses are:
70
Fifty percent of the levy can be recovered in the form of a quarterly mandatory SETA grant and a compliant employer may, in addition, apply for discretionary grants.
Regulations that would reduce the mandatory grant from 50% to 20% have been set aside by the Labour Court on two occasions and the level of payment is a matter of ongoing controversy.137
The SDL is paid by employers with an annual payroll of more than R500 000 and is collected by SARS.
The threshold for paying the SDL has not been adjusted in line with inflation. It was initially set at R250 000 in 1998 and was adjusted to R500 000 in 2005.138
In theory, the recovery of the SDL seeks to incentivise planned training activities.
There are significant exclusions for small businesses from labour legislation. These include a ministerial determination in respect of businesses with fewer than ten employees under the BCEA. In addition, the new provisions concerning fixed-term contracts and part-time employees introduced in 2015 do not apply to employers with less than ten employees or employers with less than 50 employees during the first two years of operation.
The COIDA and the OHSA which govern workplace injury or disease are prescriptive across all types of enterprises, without a specific classification for small businesses. Other challenges faced by small businesses, according to the TIPS report, involve the failure of the SETAs to support small business training needs in return for levy payments, the high level and unpredictability of COIDA payments and the onerous registration process to apply for a private employment agency.136
The TIPS report suggests that the threshold at which the skills levy should be payable should be increased to at least R1 million (payroll), and that SETAs should be assisted to develop more appropriate training models for small businesses. The Davis Tax Committee’s Second and Final Report on Small and Medium Enterprises (2016) for the Minister of Finance previously recommended a substantial increase in the SDL threshold as
well as reforms to make the skills system more accessible to small businesses.
While a substantial adjustment in the threshold is appropriate, this should be accompanied by a provision enabling the Minister of Higher Education to adjust the threshold annually by notice, in line with inflation.139
5.6.4 SKILLS DEVELOPMENT LEVY
5.6.5 REGISTRATION OF PRIVATE EMPLOYMENT AGENCIES
Regulations in terms of the ESA have yet to be finalised and implemented. However, considering the considerable risk of private agencies exploiting low-paid workers, an exclusion for small businesses would not be appropriate. This is particularly the case as operating an employment agency does not require a large core staff.
It is however probable that a significant reduction of the regulatory burden of small businesses could be achieved by harmonising the “red tape” requirements for registration and contributions arising from the SDA, UIF and COIDA.
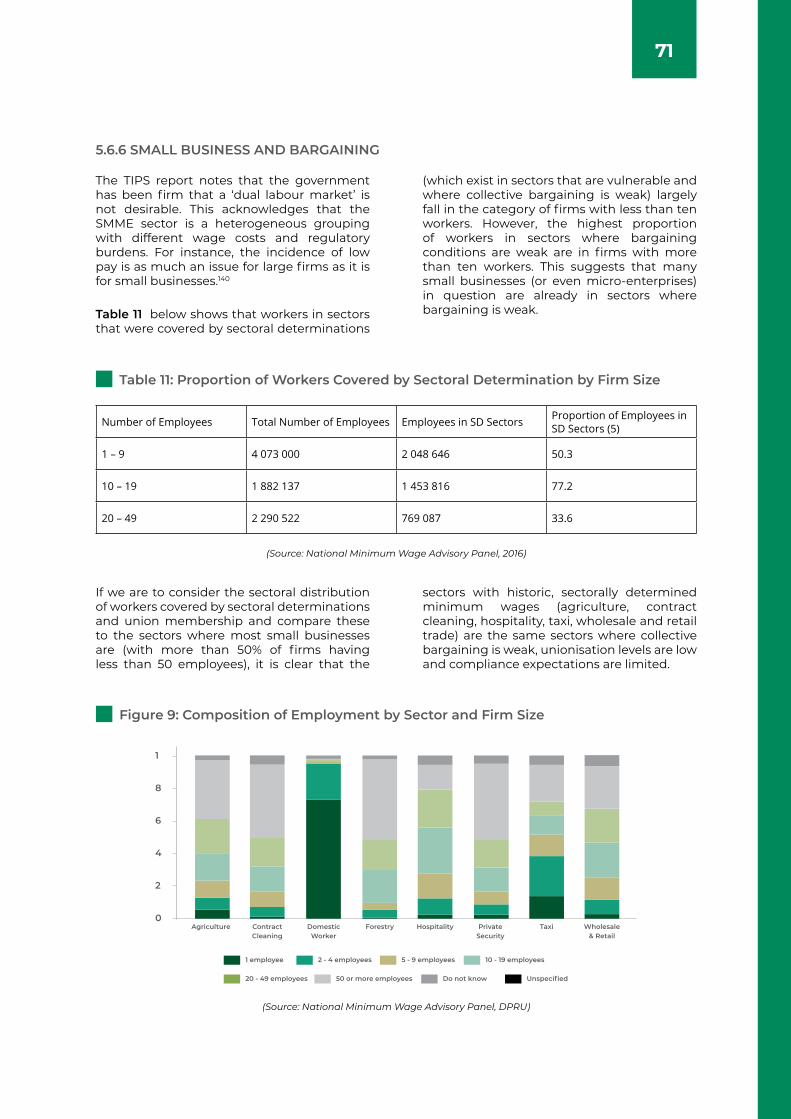
71
5.6.6 SMALL BUSINESS AND BARGAINING
The TIPS report notes that the government has been firm that a ‘dual labour market’ is not desirable. This acknowledges that the SMME sector is a heterogeneous grouping with different wage costs and regulatory burdens. For instance, the incidence of low pay is as much an issue for large firms as it is for small businesses.140
Table 11 below shows that workers in sectors that were covered by sectoral determinations
(which exist in sectors that are vulnerable and where collective bargaining is weak) largely fall in the category of firms with less than ten workers. However, the highest proportion of workers in sectors where bargaining conditions are weak are in firms with more than ten workers. This suggests that many small businesses (or even micro-enterprises) in question are already in sectors where bargaining is weak.
If we are to consider the sectoral distribution of workers covered by sectoral determinations and union membership and compare these to the sectors where most small businesses are (with more than 50% of firms having less than 50 employees), it is clear that the
sectors with historic, sectorally determined minimum wages (agriculture, contract cleaning, hospitality, taxi, wholesale and retail trade) are the same sectors where collective bargaining is weak, unionisation levels are low and compliance expectations are limited.
Table 11: Proportion of Workers Covered by Sectoral Determination by Firm Size
Figure 9: Composition of Employment by Sector and Firm Size
(Source: National Minimum Wage Advisory Panel, 2016)
(Source: National Minimum Wage Advisory Panel, DPRU)
Number of Employees Total Number of Employees Employees in SD Sectors Proportion of Employees in SD Sectors (5)
1 – 9 4 073 000 2 048 646 50.3
10 – 19 1 882 137 1 453 816 77.2
20 – 49 2 290 522 769 087 33.6
1 employee
20 - 49 employees
2 - 4 employees
50 or more employees
5 - 9 employees
Do not know
10 - 19 employees
Unspecified
Agriculture Contract Cleaning
Domestic Worker
Forestry Hospitality Private Security
Taxi Wholesale & Retail
1
8
6
4
2
0
72
5.6.7 AFFIRMATIVE ACTION
5.6.8 EXTENDING BARGAINING COUNCIL AGREEMENTS
5.6.9 BUSA-CCMA WEB TOOL
The draft Employment Equity Amendment Bill of 2019, published for public comment on 21 September 2018, excludes all private sector employers with less than 50 employees from the affirmative action obligations in the
EEA. Currently, employers with less than 50 employees whose turnover exceeds a specific threshold, determined on a sectoral basis, are required to implement affirmative action plans.
This issue is not explicitly dealt with in the NDP. The National Treasury Economic Policy Unit’s 2019 economic recovery document suggests that the extension of collective bargaining wage agreements to small businesses raise labour costs without a concomitant increase in productivity. The paper also suggests that this, alongside the NMW inhibits long-term sustainability of SMMEs and contributes to rising youth unemployment.
The bargaining council extension issue remains a matter of controversy and there is
an opposing view that the position of small employers in bargaining councils is adequately dealt with by exemptions. An ILO study, for instance, argues that the key manufacturing sector bargaining councils granted exemptions for over 90% of applications.141 In addition, documents such as the National Treasury report do not consider the impact of its recommendations in different sectors. Less than 500 000 employees are potentially covered by bargaining council extension.
The CCMA and Business Unity South Africa (BUSA) collaborated in 2019 to launch a free-to-use web tool aimed at assisting small businesses with labour compliance matters.142 The development of the web tool followed a study which showed that small businesses struggle with labour relations and that this is a key impediment to formalising businesses and hiring more staff. Available data shows
that small businesses have made limited use of this facility since its launch. A recent academic study concluded that imperfect knowledge of labour law regulation hinders job creation among small businesses and that free access to a specialised website led to higher levels of employment among the small businesses monitored.143
Legislative amendments to the SDLA to increase the threshold for exclusion for small business from payment of the Skills Development Levy should be expedited.
Greater resources should be devoted to the updating and publicising of the CCMA-BUSA web tool.
RECOMMENDATIONS

Chapter
06
74
IDENTIFYING EFFECTIVE ROUTES TO MORE EQUITABLE WAGE DETERMINATIONS IN THE PRIVATE SECTOR
6.1 WHO DETERMINES WAGES IN SOUTH AFRICA?
The NDP suggests that wage determination in the private sector needs to be more conducive to employment and equity considerations and ought to ensure a fair division of earnings to provide affordable wages that support an economic expansion and strong links between wage and productivity growth in a context of extreme inequality.
Moreover, in a context of crisis levels of under- and unemployment, the interface between the social and the workplace or shop-floor wage is an important consideration. The NDP also proposes the achievement of a social floor including the social wage and measures to reduce inflation of basic commodities.144
Below we consider some of the issues that the NDP suggests are crucial to achieve not
only equitable wage structures but also the reduction of price inflation on basic commodities and an effective social wage.
We, firstly, consider how wages are determined in the South African labour market by looking at the role of collective agreements. Secondly, we consider, interest earnings inequality, and measures aimed at a fair distribution of earnings within firms. Thirdly, we discuss the commitment expected from firms (set out in the NDP) to higher levels of investment and labour absorption and sharing of gains from productivity and growth. Lastly, we consider the commitment embedded throughout the NDP of lowering the cost drivers for poor households, and how state interventions in the area of administered prices have responded to the task of creating a social floor in a context of widespread joblessness.
There are numerous studies that have been undertaken that consider the impact between wages and employment growth on efficiency and equity considerations.
Wages are influenced by patterns of labour demand, which in turn are influenced by industrial structure, general growth conditions and firm-level behaviour.145 How these wages are set (interfacing with the drivers of labour demand) must be aligned to national
employment and growth considerations. The objectives of the NDP interface with concrete conditions and relations of power and exchange. These determine the terms on which many South Africans engage and interface with the labour market.
A helpful place to begin is to consider how wages (and changes to those wages) are determined in South Africa.
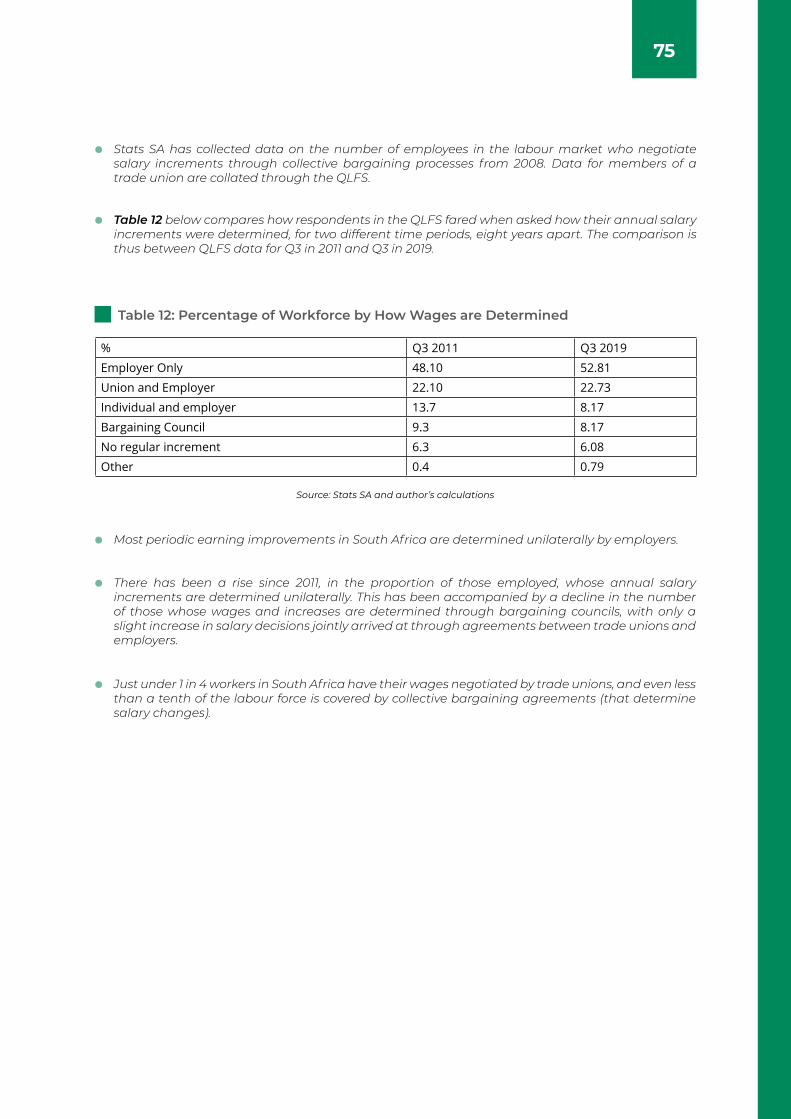
75
Stats SA has collected data on the number of employees in the labour market who negotiate salary increments through collective bargaining processes from 2008. Data for members of a trade union are collated through the QLFS.
Most periodic earning improvements in South Africa are determined unilaterally by employers.
There has been a rise since 2011, in the proportion of those employed, whose annual salary increments are determined unilaterally. This has been accompanied by a decline in the number of those whose wages and increases are determined through bargaining councils, with only a slight increase in salary decisions jointly arrived at through agreements between trade unions and employers.
Just under 1 in 4 workers in South Africa have their wages negotiated by trade unions, and even less than a tenth of the labour force is covered by collective bargaining agreements (that determine salary changes).
Table 12 below compares how respondents in the QLFS fared when asked how their annual salary increments were determined, for two different time periods, eight years apart. The comparison is thus between QLFS data for Q3 in 2011 and Q3 in 2019.
Table 12: Percentage of Workforce by How Wages are Determined
Source: Stats SA and author’s calculations
% Q3 2011 Q3 2019
Employer Only 48.10 52.81
Union and Employer 22.10 22.73
Individual and employer 13.7 8.17
Bargaining Council 9.3 8.17
No regular increment 6.3 6.08
Other 0.4 0.79
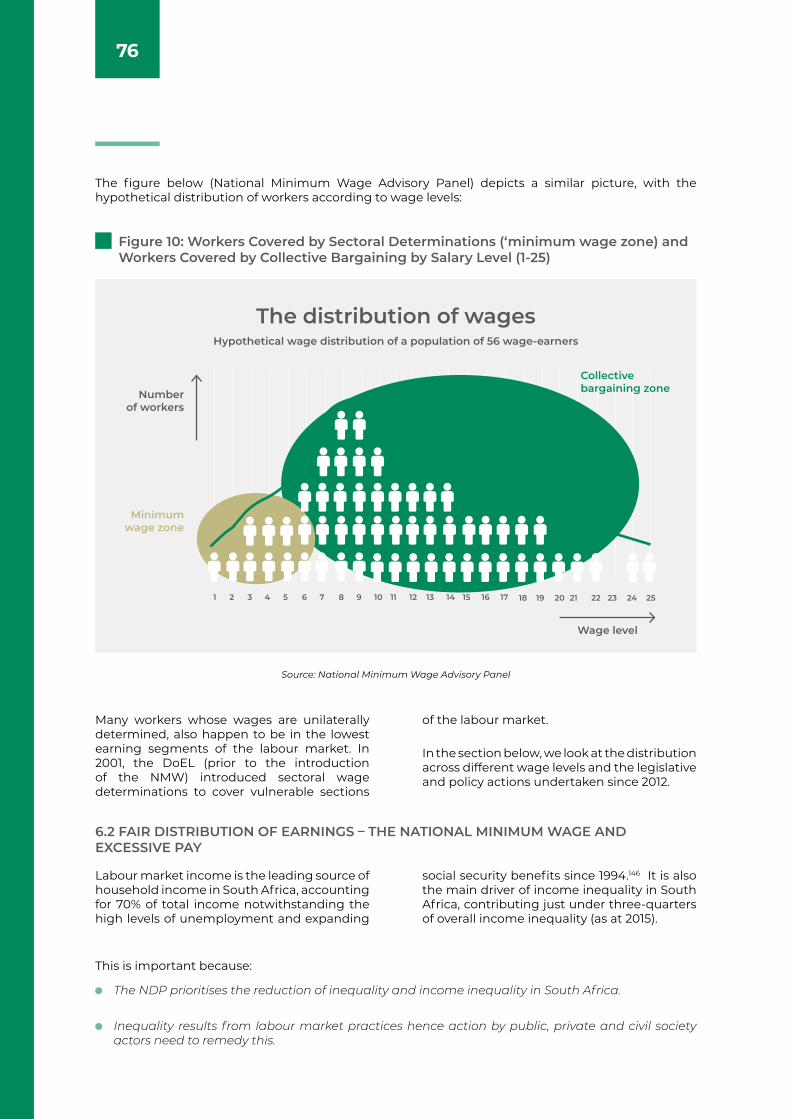
76
The figure below (National Minimum Wage Advisory Panel) depicts a similar picture, with the hypothetical distribution of workers according to wage levels:
This is important because:
The NDP prioritises the reduction of inequality and income inequality in South Africa.
Inequality results from labour market practices hence action by public, private and civil society actors need to remedy this.
Figure 10: Workers Covered by Sectoral Determinations (‘minimum wage zone) and Workers Covered by Collective Bargaining by Salary Level (1-25)
The distribution of wagesHypothetical wage distribution of a population of 56 wage-earners
Number of workers
1 2 3 4 5 6 7 8 9 10 11 12 13 14 15 16 17 18 19 20 21 22 23 24 25
Wage level
Collective bargaining zone
Minimum wage zone
Source: National Minimum Wage Advisory Panel
Many workers whose wages are unilaterally determined, also happen to be in the lowest earning segments of the labour market. In 2001, the DoEL (prior to the introduction of the NMW) introduced sectoral wage determinations to cover vulnerable sections
of the labour market.
In the section below, we look at the distribution across different wage levels and the legislative and policy actions undertaken since 2012.
6.2 FAIR DISTRIBUTION OF EARNINGS – THE NATIONAL MINIMUM WAGE AND EXCESSIVE PAY
Labour market income is the leading source of household income in South Africa, accounting for 70% of total income notwithstanding the high levels of unemployment and expanding
social security benefits since 1994.146 It is also the main driver of income inequality in South Africa, contributing just under three-quarters of overall income inequality (as at 2015).
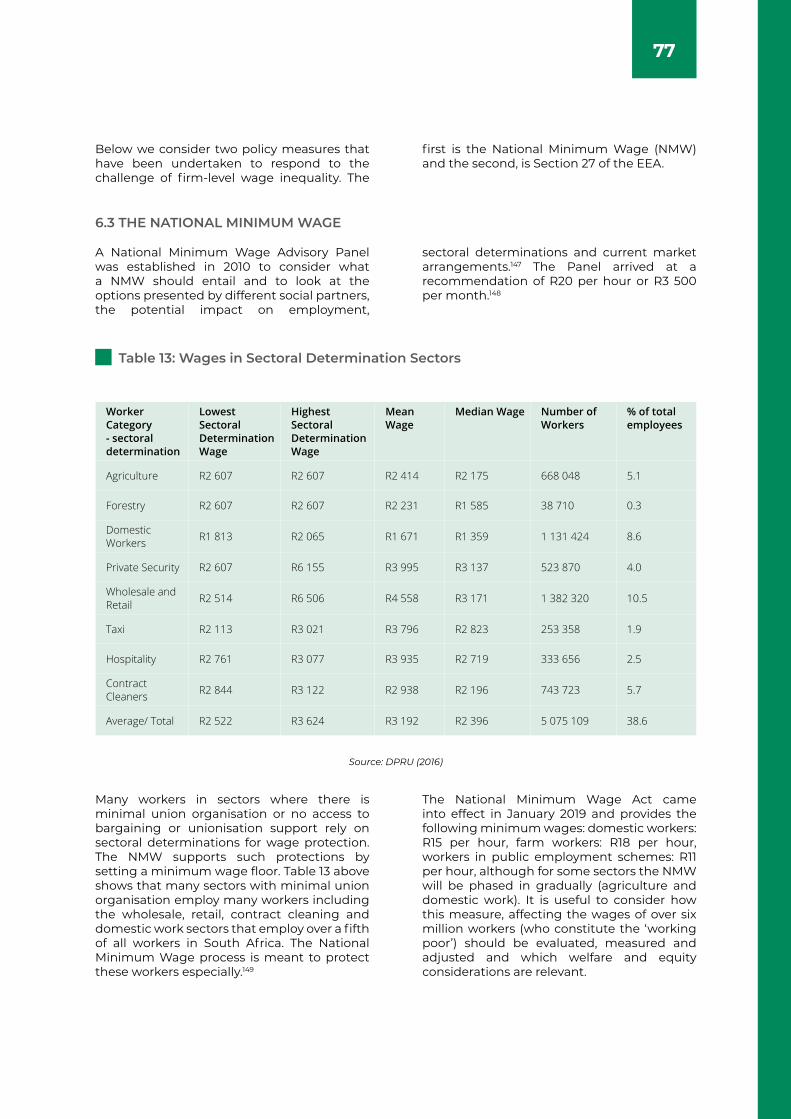
77
Table 13: Wages in Sectoral Determination Sectors
Source: DPRU (2016)
6.3 THE NATIONAL MINIMUM WAGE
A National Minimum Wage Advisory Panel was established in 2010 to consider what a NMW should entail and to look at the options presented by different social partners, the potential impact on employment,
sectoral determinations and current market arrangements.147 The Panel arrived at a recommendation of R20 per hour or R3 500 per month.148
Many workers in sectors where there is minimal union organisation or no access to bargaining or unionisation support rely on sectoral determinations for wage protection. The NMW supports such protections by setting a minimum wage floor. Table 13 above shows that many sectors with minimal union organisation employ many workers including the wholesale, retail, contract cleaning and domestic work sectors that employ over a fifth of all workers in South Africa. The National Minimum Wage process is meant to protect these workers especially.149
The National Minimum Wage Act came into effect in January 2019 and provides the following minimum wages: domestic workers: R15 per hour, farm workers: R18 per hour, workers in public employment schemes: R11 per hour, although for some sectors the NMW will be phased in gradually (agriculture and domestic work). It is useful to consider how this measure, affecting the wages of over six million workers (who constitute the ‘working poor’) should be evaluated, measured and adjusted and which welfare and equity considerations are relevant.
Below we consider two policy measures that have been undertaken to respond to the challenge of firm-level wage inequality. The
first is the National Minimum Wage (NMW) and the second, is Section 27 of the EEA.
Worker Category - sectoral determination
Lowest Sectoral Determination Wage
Highest Sectoral Determination Wage
Mean Wage
Median Wage Number of Workers
% of total employees
Agriculture R2 607 R2 607 R2 414 R2 175 668 048 5.1
Forestry R2 607 R2 607 R2 231 R1 585 38 710 0.3
Domestic Workers R1 813 R2 065 R1 671 R1 359 1 131 424 8.6
Private Security R2 607 R6 155 R3 995 R3 137 523 870 4.0
Wholesale and Retail R2 514 R6 506 R4 558 R3 171 1 382 320 10.5
Taxi R2 113 R3 021 R3 796 R2 823 253 358 1.9
Hospitality R2 761 R3 077 R3 935 R2 719 333 656 2.5
Contract Cleaners R2 844 R3 122 R2 938 R2 196 743 723 5.7
Average/ Total R2 522 R3 624 R3 192 R2 396 5 075 109 38.6
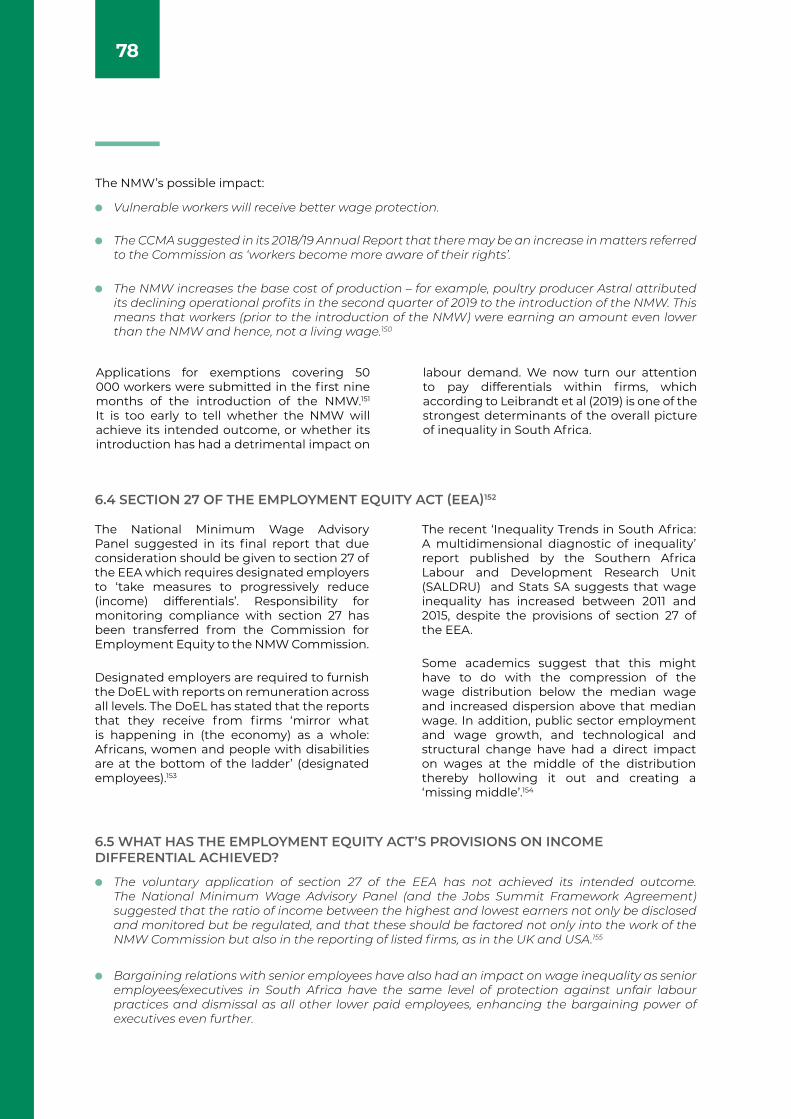
78
The NMW’s possible impact:
Vulnerable workers will receive better wage protection.
The voluntary application of section 27 of the EEA has not achieved its intended outcome. The National Minimum Wage Advisory Panel (and the Jobs Summit Framework Agreement) suggested that the ratio of income between the highest and lowest earners not only be disclosed and monitored but be regulated, and that these should be factored not only into the work of the NMW Commission but also in the reporting of listed firms, as in the UK and USA.155
Bargaining relations with senior employees have also had an impact on wage inequality as senior employees/executives in South Africa have the same level of protection against unfair labour practices and dismissal as all other lower paid employees, enhancing the bargaining power of executives even further.
The CCMA suggested in its 2018/19 Annual Report that there may be an increase in matters referred to the Commission as ‘workers become more aware of their rights’.
The NMW increases the base cost of production – for example, poultry producer Astral attributed its declining operational profits in the second quarter of 2019 to the introduction of the NMW. This means that workers (prior to the introduction of the NMW) were earning an amount even lower than the NMW and hence, not a living wage.150
6.4 SECTION 27 OF THE EMPLOYMENT EQUITY ACT (EEA)152
6.5 WHAT HAS THE EMPLOYMENT EQUITY ACT’S PROVISIONS ON INCOME DIFFERENTIAL ACHIEVED?
The National Minimum Wage Advisory Panel suggested in its final report that due consideration should be given to section 27 of the EEA which requires designated employers to ‘take measures to progressively reduce (income) differentials’. Responsibility for monitoring compliance with section 27 has been transferred from the Commission for Employment Equity to the NMW Commission.
Designated employers are required to furnish the DoEL with reports on remuneration across all levels. The DoEL has stated that the reports that they receive from firms ‘mirror what is happening in (the economy) as a whole: Africans, women and people with disabilities are at the bottom of the ladder’ (designated employees).153
The recent ‘Inequality Trends in South Africa: A multidimensional diagnostic of inequality’ report published by the Southern Africa Labour and Development Research Unit (SALDRU) and Stats SA suggests that wage inequality has increased between 2011 and 2015, despite the provisions of section 27 of the EEA.
Some academics suggest that this might have to do with the compression of the wage distribution below the median wage and increased dispersion above that median wage. In addition, public sector employment and wage growth, and technological and structural change have had a direct impact on wages at the middle of the distribution thereby hollowing it out and creating a ‘missing middle’.154
Applications for exemptions covering 50 000 workers were submitted in the first nine months of the introduction of the NMW.151 It is too early to tell whether the NMW will achieve its intended outcome, or whether its introduction has had a detrimental impact on
labour demand. We now turn our attention to pay differentials within firms, which according to Leibrandt et al (2019) is one of the strongest determinants of the overall picture of inequality in South Africa.
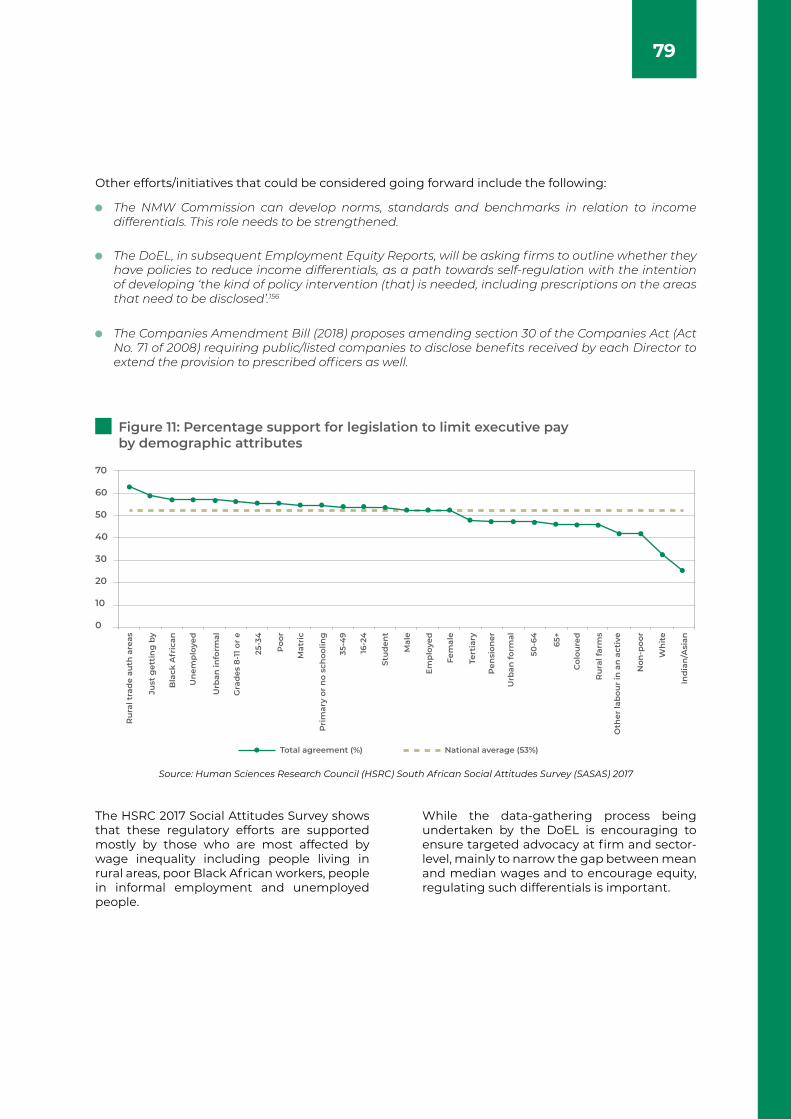
79
Other efforts/initiatives that could be considered going forward include the following:
The NMW Commission can develop norms, standards and benchmarks in relation to income differentials. This role needs to be strengthened.
The DoEL, in subsequent Employment Equity Reports, will be asking firms to outline whether they have policies to reduce income differentials, as a path towards self-regulation with the intention of developing ‘the kind of policy intervention (that) is needed, including prescriptions on the areas that need to be disclosed’.156
The Companies Amendment Bill (2018) proposes amending section 30 of the Companies Act (Act No. 71 of 2008) requiring public/listed companies to disclose benefits received by each Director to extend the provision to prescribed officers as well.
The HSRC 2017 Social Attitudes Survey shows that these regulatory efforts are supported mostly by those who are most affected by wage inequality including people living in rural areas, poor Black African workers, people in informal employment and unemployed people.
While the data-gathering process being undertaken by the DoEL is encouraging to ensure targeted advocacy at firm and sector-level, mainly to narrow the gap between mean and median wages and to encourage equity, regulating such differentials is important.
Figure 11: Percentage support for legislation to limit executive pay by demographic attributes
Source: Human Sciences Research Council (HSRC) South African Social Attitudes Survey (SASAS) 2017
70
60
50
40
30
20
10
0
Ru
ral t
rad
e au
th a
reas
Just
get
tin
g b
y
Bla
ck A
fric
an
Un
emp
loye
d
Urb
an in
form
al
Gra
des
8-1
1 or
e
25-3
4
Poo
r
Mat
ric
Pri
mar
y or
no
sch
oolin
g
35-4
9
16-2
4
Stu
den
t
Mal
e
Em
plo
yed
Fem
ale
Tert
iary
Pen
sion
er
Urb
an fo
rmal
50-6
4
65+
Col
oure
d
Ru
ral f
arm
s
Oth
er la
bou
r in
an
act
ive
Non
-poo
r
Wh
ite
Ind
ian
/Asi
an
Total agreement (%) National average (53%)
80
The CEE identified the following contributing factors for the slow pace of race and gender transformation:161
Resistance by many employers to the notion of employment equity, mainly because employment equity is not recognised as a business imperative that is integrated in business strategies;
The absence of prescribed equity targets or benchmarks for all sectors;
Inadequate monitoring by employees and trade unions of compliance with agreed targets set out in employment equity plans; and
The absence of financial consequences for non-compliance.162
6.6 OTHER EMPLOYMENT EQUITY-RELATED ISSUES
The CEE has expressed concern that the regulatory strategy for the implementation of equity in the workplace has not been effective in achieving transformation in the private sector.157 For example, in 2018, 25 years after apartheid, ‘65.5% of top management positions (continued to be occupied) by Whites, followed by Africans at 15.1%, Indians at 9.7%, and Coloureds at 5.3%, with foreign nationals at 3.4%’.158
Africans represented most of the unskilled workforce at 83.7%, followed by Coloureds at 11.0%, foreign nationals at 3.5%, Whites at 1.1%, and Indians at 0.8%.159
There is a significant difference in the figures for top management positions in government
and the private sector:
In government, Africans hold 76% of top management positions, Whites hold 8.9%. Whereas, in the private sector, Whites occupying 69.6% of top management positions, and Africans hold 11.8%.160
The CEE report also reflects that transformation in terms of gender has been slow: Only 40.2% of top management positions in 2018 were occupied by Black African women, followed by White women at 37.4%, Indian women at 9.4%, and Coloured women at 10%, with foreign national women at 3.0%.
To address this, section 53 of the EEA (which requires employers to obtain compliance certificates in order to conduct business with government) will be implemented.163 For example, the Broad-Based Black Economic Empowerment Act (Act No. 53 of 2003) creates significant incentives for employers to comply with transformation goals in terms of the B-BBEE Codes of Practice, this in turn encourages compliance.
The CEE has also recommended that the Minister of Employment and Labour be given the power to establish sectoral employment equity targets. The Employment Equity Amendment Bill, 2018164 that gives effect to these and other proposals was published for comment in September 2018.165
The proposal to allow the Minister to identify national economic sectors and establish
numerical sectoral targets represents a significant shift in the regulatory approach to ensuring affirmative action in the workplace. Significant capacity will be required to implement this.166
In 2018, the South African Human Rights Commission (SAHRC) published a report titled ‘Achieving Substantive Economic Equality through Rights-based Radical Socio-economic Transformation in South Africa’. The report attributes the lack of progress in respect of affirmative action to the definition of ‘designated groups’167 in the EEA. The SAHRC has stated that the definition is, in fact, not in compliance with our constitutional or even international law obligations and recommends that the EEA be amended accordingly.
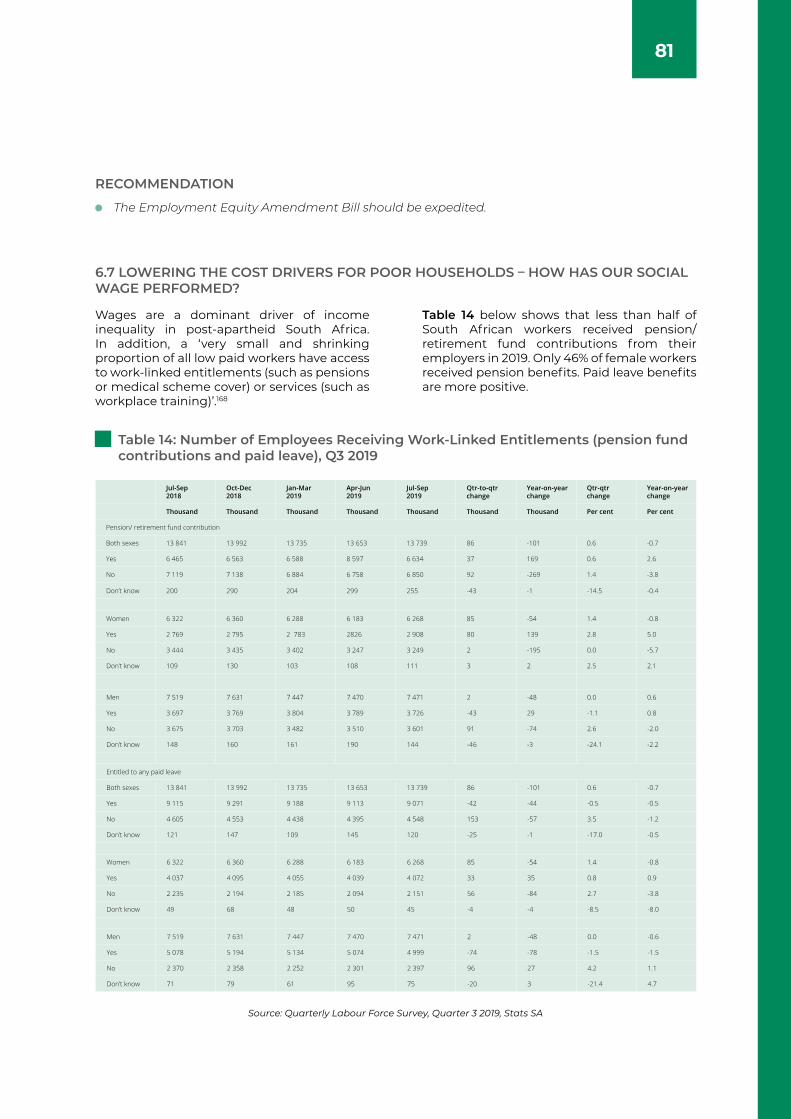
81
RECOMMENDATION
The Employment Equity Amendment Bill should be expedited.
6.7 LOWERING THE COST DRIVERS FOR POOR HOUSEHOLDS – HOW HAS OUR SOCIAL WAGE PERFORMED?
Wages are a dominant driver of income inequality in post-apartheid South Africa. In addition, a ‘very small and shrinking proportion of all low paid workers have access to work-linked entitlements (such as pensions or medical scheme cover) or services (such as workplace training)’.168
Table 14 below shows that less than half of South African workers received pension/retirement fund contributions from their employers in 2019. Only 46% of female workers received pension benefits. Paid leave benefits are more positive.
Table 14: Number of Employees Receiving Work-Linked Entitlements (pension fund contributions and paid leave), Q3 2019
Source: Quarterly Labour Force Survey, Quarter 3 2019, Stats SA
Jul-Sep2018
Oct-Dec2018
Jan-Mar2019
Apr-Jun2019
Jul-Sep2019
Qtr-to-qtrchange
Year-on-yearchange
Qtr-qtrchange
Year-on-yearchange
Thousand Thousand Thousand Thousand Thousand Thousand Thousand Per cent Per cent
Pension/ retirement fund contribution
Both sexes 13 841 13 992 13 735 13 653 13 739 86 -101 0.6 -0.7
Yes 6 465 6 563 6 588 8 597 6 634 37 169 0.6 2.6
No 7 119 7 138 6 884 6 758 6 850 92 -269 1.4 -3.8
Don’t know 200 290 204 299 255 -43 -1 -14.5 -0.4
Women 6 322 6 360 6 288 6 183 6 268 85 -54 1.4 -0.8
Yes 2 769 2 795 2 783 2826 2 908 80 139 2.8 5.0
No 3 444 3 435 3 402 3 247 3 249 2 -195 0.0 -5.7
Don’t know 109 130 103 108 111 3 2 2.5 2.1
Men 7 519 7 631 7 447 7 470 7 471 2 -48 0.0 0.6
Yes 3 697 3 769 3 804 3 789 3 726 -43 29 -1.1 0.8
No 3 675 3 703 3 482 3 510 3 601 91 -74 2.6 -2.0
Don’t know 148 160 161 190 144 -46 -3 -24.1 -2.2
Entitled to any paid leave
Both sexes 13 841 13 992 13 735 13 653 13 739 86 -101 0.6 -0.7
Yes 9 115 9 291 9 188 9 113 9 071 -42 -44 -0.5 -0.5
No 4 605 4 553 4 438 4 395 4 548 153 -57 3.5 -1.2
Don’t know 121 147 109 145 120 -25 -1 -17.0 -0.5
Women 6 322 6 360 6 288 6 183 6 268 85 -54 1.4 -0.8
Yes 4 037 4 095 4 055 4 039 4 072 33 35 0.8 0.9
No 2 235 2 194 2 185 2 094 2 151 56 -84 2.7 -3.8
Don’t know 49 68 48 50 45 -4 -4 -8.5 -8.0
Men 7 519 7 631 7 447 7 470 7 471 2 -48 0.0 -0.6
Yes 5 078 5 194 5 134 5 074 4 999 -74 -78 -1.5 -1.5
No 2 370 2 358 2 252 2 301 2 397 96 27 4.2 1.1
Don’t know 71 79 61 95 75 -20 3 -21.4 4.7
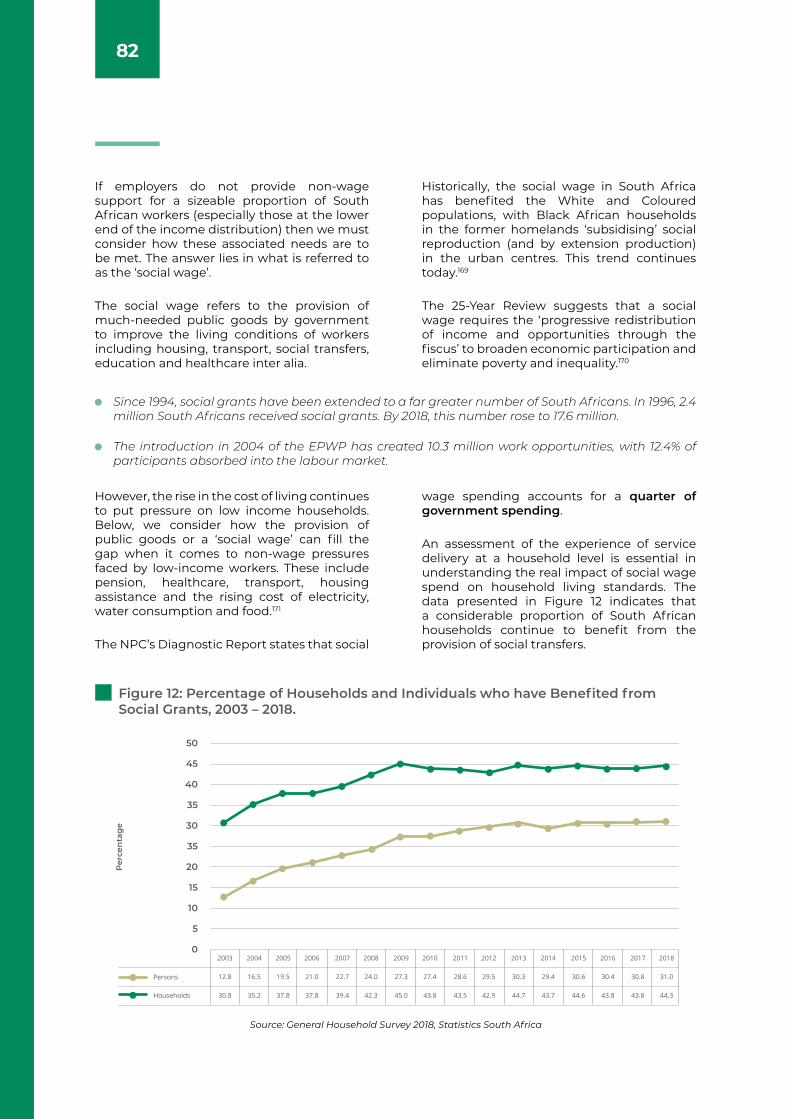
82
Since 1994, social grants have been extended to a far greater number of South Africans. In 1996, 2.4 million South Africans received social grants. By 2018, this number rose to 17.6 million.
The introduction in 2004 of the EPWP has created 10.3 million work opportunities, with 12.4% of participants absorbed into the labour market.
If employers do not provide non-wage support for a sizeable proportion of South African workers (especially those at the lower end of the income distribution) then we must consider how these associated needs are to be met. The answer lies in what is referred to as the ‘social wage’.
The social wage refers to the provision of much-needed public goods by government to improve the living conditions of workers including housing, transport, social transfers, education and healthcare inter alia.
Historically, the social wage in South Africa has benefited the White and Coloured populations, with Black African households in the former homelands ‘subsidising’ social reproduction (and by extension production) in the urban centres. This trend continues today.169
The 25-Year Review suggests that a social wage requires the ‘progressive redistribution of income and opportunities through the fiscus’ to broaden economic participation and eliminate poverty and inequality.170
However, the rise in the cost of living continues to put pressure on low income households. Below, we consider how the provision of public goods or a ‘social wage’ can fill the gap when it comes to non-wage pressures faced by low-income workers. These include pension, healthcare, transport, housing assistance and the rising cost of electricity, water consumption and food.171
The NPC’s Diagnostic Report states that social
wage spending accounts for a quarter of government spending.
An assessment of the experience of service delivery at a household level is essential in understanding the real impact of social wage spend on household living standards. The data presented in Figure 12 indicates that a considerable proportion of South African households continue to benefit from the provision of social transfers.
Figure 12: Percentage of Households and Individuals who have Benefited from Social Grants, 2003 – 2018.
Source: General Household Survey 2018, Statistics South Africa
50
45
40
35
30
35
20
15
10
5
0
Per
cen
tag
e
2003
Persons
Households
12.8
30.8
2004
16.5
35.2
2005
19.5
37.8
2006
21.0
37.8
2007
22.7
39.4
2008
24.0
42.3
2009
27.3
45.0
2010
27.4
43.8
2011
28.6
43.5
2012
29.5
42.9
2013
30.3
44.7
2014
29.4
43.7
2015
30.6
44.6
2016
30.4
43.8
2017
30.8
43.8
2018
31.0
44.3
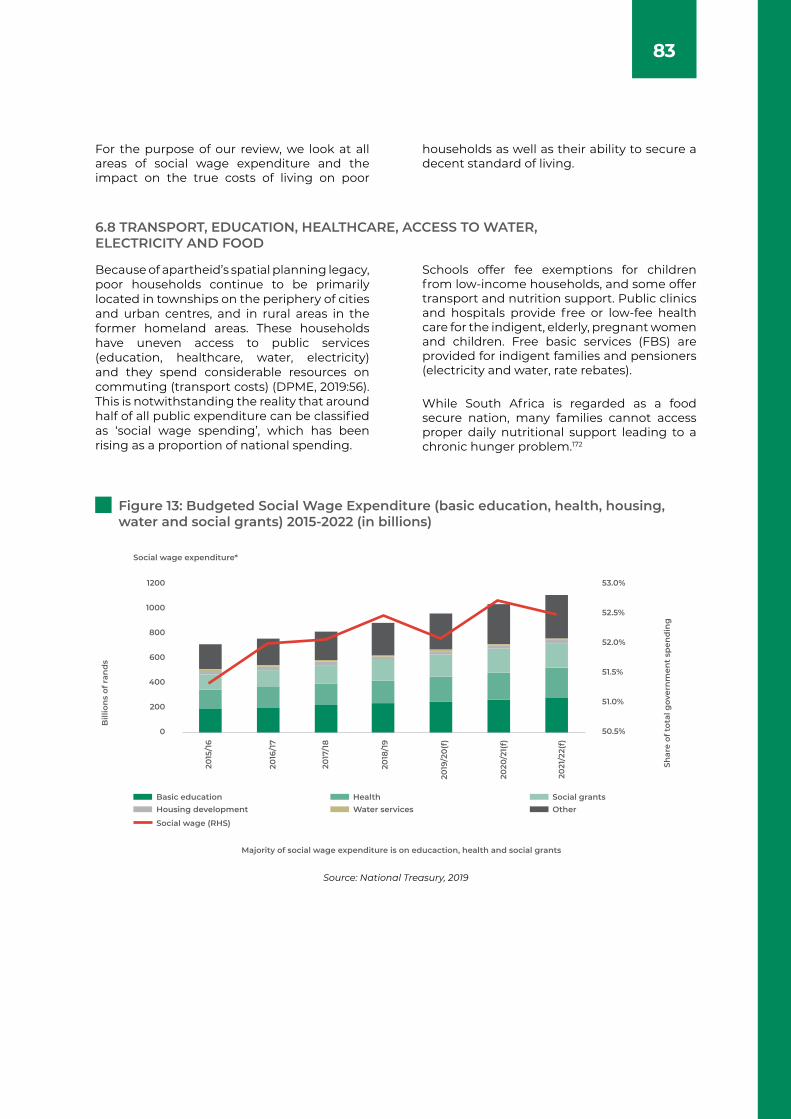
83
6.8 TRANSPORT, EDUCATION, HEALTHCARE, ACCESS TO WATER, ELECTRICITY AND FOOD
Because of apartheid’s spatial planning legacy, poor households continue to be primarily located in townships on the periphery of cities and urban centres, and in rural areas in the former homeland areas. These households have uneven access to public services (education, healthcare, water, electricity) and they spend considerable resources on commuting (transport costs) (DPME, 2019:56). This is notwithstanding the reality that around half of all public expenditure can be classified as ‘social wage spending’, which has been rising as a proportion of national spending.
Schools offer fee exemptions for children from low-income households, and some offer transport and nutrition support. Public clinics and hospitals provide free or low-fee health care for the indigent, elderly, pregnant women and children. Free basic services (FBS) are provided for indigent families and pensioners (electricity and water, rate rebates).
While South Africa is regarded as a food secure nation, many families cannot access proper daily nutritional support leading to a chronic hunger problem.172
For the purpose of our review, we look at all areas of social wage expenditure and the impact on the true costs of living on poor
households as well as their ability to secure a decent standard of living.
Figure 13: Budgeted Social Wage Expenditure (basic education, health, housing, water and social grants) 2015-2022 (in billions)
Source: National Treasury, 2019
Social wage expenditure*
Majority of social wage expenditure is on educaction, health and social grants
1200
1000
800
600
400
200
0
53.0%
52.5%
52.0%
51.5%
51.0%
50.5%
Bill
ion
s of
ran
ds
2015
/16
2016
/17
2017
/18
2018
/19
2019
/20
(f)
2020
/21(
f)
2021
/22(
f)
Shar
e of
tot
al g
over
nm
ent
spen
din
g
Basic education Health Social grantsHousing development Water services Other
Social wage (RHS)
84
6.9 GAPS IN THE SOCIAL WAGE
An effective social wage (in order to contain the cost drivers for poor households) ought to include measures that reduce the impact on poorer households of price fluctuations
for basic goods, including food (zero-rating food products), and while this is being done through indigent support of the cost of electricity and water, more can be done.
A key social protection challenge rests with semi-skilled and even skilled workers who have a job (even if low-paying) and are thus ineligible for many of the programmes and social benefits discussed above – in other
words, the ‘working poor’. Many of these workers must pay for basic, secondary and university education, healthcare, transport, housing, electricity, food and water.
The 25-Year Review analyses COIDA as part of its discussion of the social wage. It notes that “there have been negative ramifications associated with the enforcement of COIDA such as informalisation of work; massive unemployment; untransformed workplaces and negative attitudes of employers, increase in foreign workers particularly in the hospitality industry, and lack of adequate instruments.176
COIDA has not been materially amended since 1994. The Compensation for Occupational Injuries and Diseases Amendment Bill (giving effect to a policy promoting the rehabilitation and reintegration of injured workers, developed in 2010-2011177) was published in late 2018 for public comment. It finally proposes the inclusion of domestic workers.178
Gaps in social assistance for the unemployed and the informally employed: There is no social assistance for those who are able-bodied and unemployed between the ages of 19 and 59 years.
Gaps in pension provision: More than half of people employed in South Africa do not have an employer-provided or subsidised pension/retirement fund.
Uneven provision, and poor access, and quality of early childhood development (ECD) services: A key challenge in the labour market begins prior to children even entering the basic education system.
Weak co-ordination of transport and human settlements provision: Where people live and where they work, and the wide physical gap between the two remain a cause for concern.
Welfare system and the weak coverage of social workers: There has been weak absorption of social work graduates into the welfare system. In 2019, 4 000 social workers (and recipients of DSD bursaries) were not placed. This limits the ability of the state to respond to the psycho-social challenges in communities, which influence local levels of gender-based violence, substance abuse and crime.
The 25-Year Review states that 49% of 3-year olds, and 29% of 4-year olds did not participate in ECD programmes and 13% of 5-6-year olds did not receive ECD-related learning.
Kerr (2015) calculated the effective tax on hourly earnings that time and monetary costs of commuting impose on poor households. The study found that the spatial organisation of South Africa disincentivises people from working far from where they live, which accounts for why many opt out of job-seeking.174
Moreover, most poor South Africans (71% in 2013) use minibus taxis that receive very minor public subsidies.175
Other gaps in social wage provision flagged in the 25-Year Review include:173
85
6.10 AN ETHICAL, DEVELOPMENTAL AND CAPABLE STATE
RECOMMENDATION
The NDP talks about an ‘ethical, developmental and capable state’ able to provide an effective social wage. This requires a level of capacity and capability to implement a critical service delivery mandate but the 25-Year Review indicates that the capacity of the state is limited and uneven, especially at a local level. In addition, corruption, state capture and the SASSA crisis point to the challenges that come with weakening capacity within the state and how that situation intersects with patronage politics at multiple levels.
Some social wage functions have been delegated to non-state actors with disastrous consequences (SASSA is just one example). This is not to suggest that the delivery of social wage functions by private providers is generally undesirable but that extensive outsourcing of the delivery of basic services (which is a state obligation) is a concern.
Moreover, it is a concern because the redistributory promise of the delivery of social services is often undermined by how these services are delivered, with the logic of outsourcing creating a disempowering political economy.179
In the case of the Net1 - SASSA debacle, how the service was delivered (through a third-party financial services firm) effectively disempowered and indebted many citizens who were cross-sold all manner of products. The introduction of a district centred government development model may result in greater co-ordination between the different levels of government to achieve improved service delivery outcomes. This should be closely monitored and key lessons documented in a process of continuous learning. Below we look at some recommendations.
The NMW Commission should be capacitated to set norms, standards, regulations on pay differentials across the economy, alongside the DoEL.
On employment equity: Section 53 compliance certificates should be included as a requirement in state procurement bids to ensure compliance with empowerment injunctions in industries that work with the state.
On social wage interventions: Consider contributory insurance schemes for those in informal employment, the precariously employed and the unemployed.
Build public-private partnerships for the CWP and EPWP that equip participants with marketable skills and an interface with the private sector but which also allows for co-financing and underwriting of the labour costs required for socially necessary and desirable projects. (See APPENDIX 4)


Chapter
07
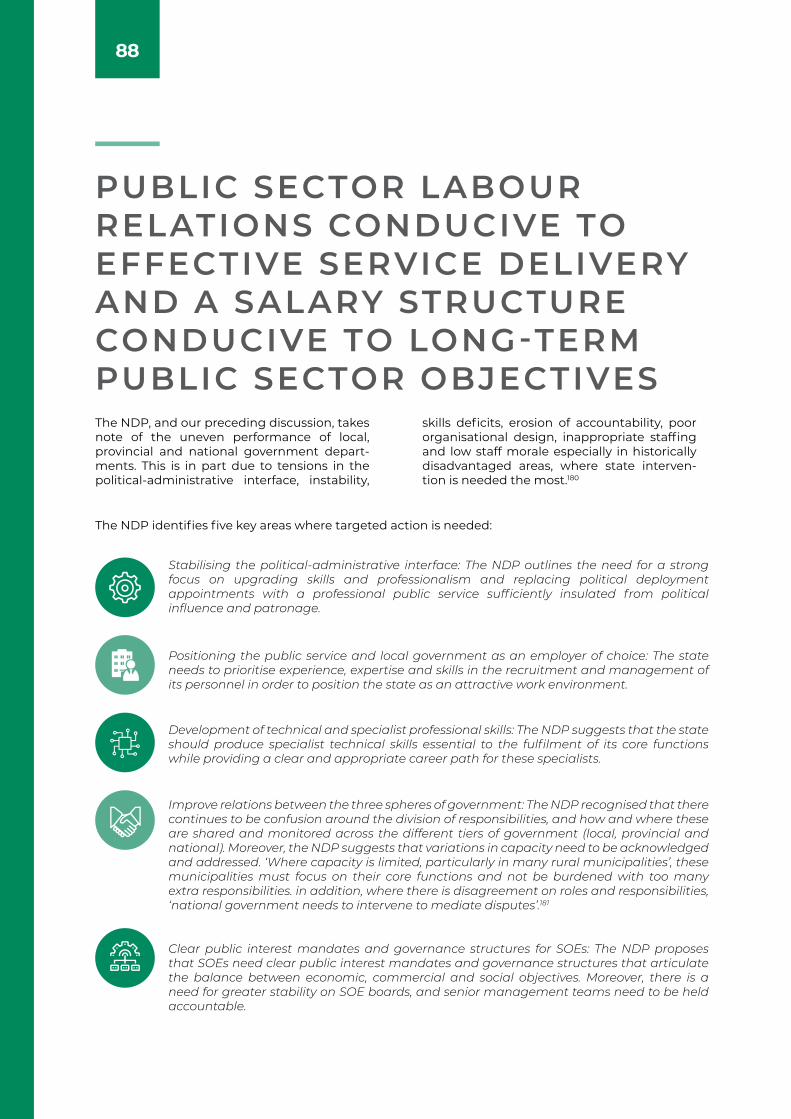
88
PUBLIC SECTOR LABOUR RELATIONS CONDUCIVE TO EFFECTIVE SERVICE DELIVERY AND A SALARY STRUCTURE CONDUCIVE TO LONG-TERM PUBLIC SECTOR OBJECTIVES The NDP, and our preceding discussion, takes note of the uneven performance of local, provincial and national government depart-ments. This is in part due to tensions in the political-administrative interface, instability,
skills deficits, erosion of accountability, poor organisational design, inappropriate staffing and low staff morale especially in historically disadvantaged areas, where state interven-tion is needed the most.180
Stabilising the political-administrative interface: The NDP outlines the need for a strong focus on upgrading skills and professionalism and replacing political deployment appointments with a professional public service sufficiently insulated from political influence and patronage.
Positioning the public service and local government as an employer of choice: The state needs to prioritise experience, expertise and skills in the recruitment and management of its personnel in order to position the state as an attractive work environment.
Clear public interest mandates and governance structures for SOEs: The NDP proposes that SOEs need clear public interest mandates and governance structures that articulate the balance between economic, commercial and social objectives. Moreover, there is a need for greater stability on SOE boards, and senior management teams need to be held accountable.
Development of technical and specialist professional skills: The NDP suggests that the state should produce specialist technical skills essential to the fulfilment of its core functions while providing a clear and appropriate career path for these specialists.
Improve relations between the three spheres of government: The NDP recognised that there continues to be confusion around the division of responsibilities, and how and where these are shared and monitored across the different tiers of government (local, provincial and national). Moreover, the NDP suggests that variations in capacity need to be acknowledged and addressed. ‘Where capacity is limited, particularly in many rural municipalities’, these municipalities must focus on their core functions and not be burdened with too many extra responsibilities. in addition, where there is disagreement on roles and responsibilities, ‘national government needs to intervene to mediate disputes’.181
The NDP identifies five key areas where targeted action is needed:
89
Between the 2006/07 - 2017/18 period, the number of personnel in the public service rose by 15%, with provincial administrations accounting for most of that growth. Headcount rose in the first five years through to 2012 and stabilised between 2011/12 - 2017/18 due to budget rationalisation (National Treasury, 2018:53).
Table 15 below shows the personnel changes that occurred between the 2006 - 2018 period.
In both 2006/7 and 2017/18 most posts were in education, followed by the health sector but health was the fastest growing employer during the period 2006 – 2018. SAPS personnel increased from 155 000 in 2006 to 190 000 in 2018.
The Eastern Cape, Limpopo, Mpumalanga experienced declines in headcount between 2011 and 2018.
The largest decline in fulltime equivalent roles (which have implications for employee benefit structures as well) happened in KwaZulu-Natal.
The Eastern Cape (11 789 posts lost between 2011 – 2018) also had the highest poverty rate in South Africa as at 2015, with the lowest reduction in poverty levels. (DPME, 2018).
With a relatively large population, KwaZulu-Natal experienced the largest decline in public servant posts in the same period (17 340 posts). Both provinces rely on public sector employment to boost local economic growth.182
7.1 PUBLIC SECTOR LABOUR CONTEXT
The debate about the public service is about two related issues: The first involves the scale of the need for public goods (especially in historically disadvantaged communities) and how the state is organised to effectively respond to this challenge. The second is about the size of the public sector and its impact on fiscal resources.
Both issues influence the size, location, resourcing and priorities of the state and frame the terrain within which the state, as an employer, engages its employees.
These proposals are relevant in the context of creating a capable, professional and responsive state, by 2030.
Below we review how labour market dynamics
within the public service could influence the attainment of the objectives outlined above. We consider labour relations within the public service, wage setting, performance, and the management of essential services.
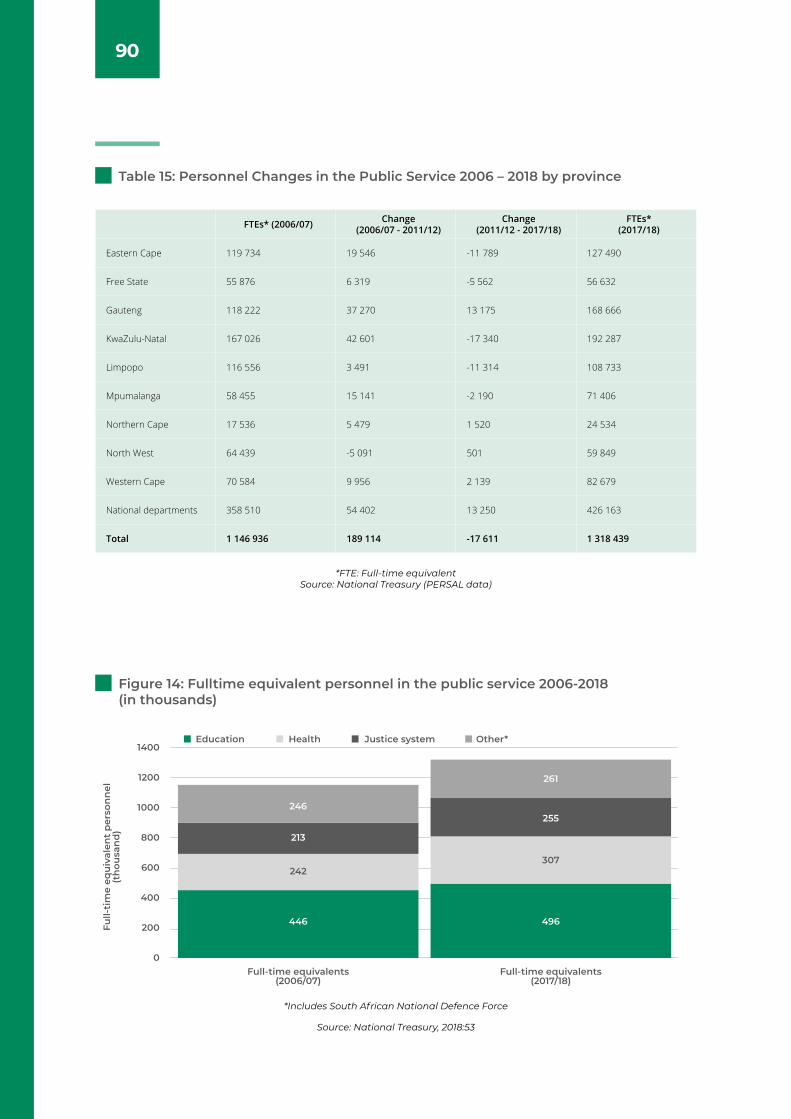
90
Table 15: Personnel Changes in the Public Service 2006 – 2018 by province
Figure 14: Fulltime equivalent personnel in the public service 2006-2018 (in thousands)
Source: National Treasury, 2018:53
*Includes South African National Defence Force
*FTE: Full-time equivalent Source: National Treasury (PERSAL data)
FTEs* (2006/07) Change (2006/07 - 2011/12)
Change (2011/12 - 2017/18)
FTEs* (2017/18)
Eastern Cape 119 734 19 546 -11 789 127 490
Free State 55 876 6 319 -5 562 56 632
Gauteng 118 222 37 270 13 175 168 666
KwaZulu-Natal 167 026 42 601 -17 340 192 287
Limpopo 116 556 3 491 -11 314 108 733
Mpumalanga 58 455 15 141 -2 190 71 406
Northern Cape 17 536 5 479 1 520 24 534
North West 64 439 -5 091 501 59 849
Western Cape 70 584 9 956 2 139 82 679
National departments 358 510 54 402 13 250 426 163
Total 1 146 936 189 114 -17 611 1 318 439
1400
1200
1000
800
600
400
200
0
Full-
tim
e eq
uiv
alen
t p
erso
nn
el(t
hou
san
d)
Full-time equivalents(2006/07)
Education Health
246
261
255
307
496
213
242
446
Justice system Other*
Full-time equivalents(2017/18)

91
7.2 REMUNERATION
Average remuneration in the public sector is higher than the rest of the economy (see Figure 15 below). One of the reasons for this,
according to the National Treasury, is ‘because a larger proportion of public servants have tertiary qualifications’.183
This rising skill intensity of the public service intersects with other factors in a manner that has ‘professionalised’ and ‘upskilled’ the public
sector but with uneven capacity in service or frontline delivery.184
Figure 15: Average (%) remuneration growth in the public service and the rest of the economy
Table 16: Distribution of Personnel by Salary Grade 1-16 (excl. SANDF)
Source: Stats SA and National Treasury, 2019
Source: National Treasury (PERSAL data)
1. Excludes SANDF
10
9
8
7
6
5
4
Per
cen
tag
e ch
ang
e(y
ear-
on-y
ear)
2011/12
Main budget Rest of the economy
2012/13 2013/14 2014/15 2015/16 2016/17 2017/18 2018/19
Grade 2006/07 (nominal)
2006/07 (in 2018 rand)
2018/19 Compound annual growth rate
(nominal)
Compound annual growth rate
(real)
1 R44 253 R89 705 R130 379 9.4% 3.2%
2 R58 812 R119 217 R159 827 8.7% 2.5%
3 R69 747 R141 385 R194 845 8.9% 2.7%
4 R83 124 R168 501 R237 818 9.2% 2.9%
5 R101 200 R205 143 R258 312 8.1% 1.9%
6 R120 002 R243 256 R317 240 8.4% 2.2%
7 R151 147 R306 389 R375 960 7.9% 1.7%
8 R181 134 R367 177 R448 039 7.8% 1.7%
9 R221 102 R448 197 R539 935 7.7% 1.6%
10 R280 757 R569 124 R687 120 7.7% 1.6%
11 R346 959 R703 320 R887 808 8.1% 2.0%
12 R440 097 R892 121 R964 954 6.8% 0.7%
13 R548 380 R1 111 620 R1 212 238 6.8% 0.7%
14 R642 820 R1 303 061 R1 442 967 7.0% 0.9%
15 R792 154 R1 605 776 R1 765 435 6.9% 0.8%
16 R992 563 R2 012 025 R2 169 585 6.7% 0.6%
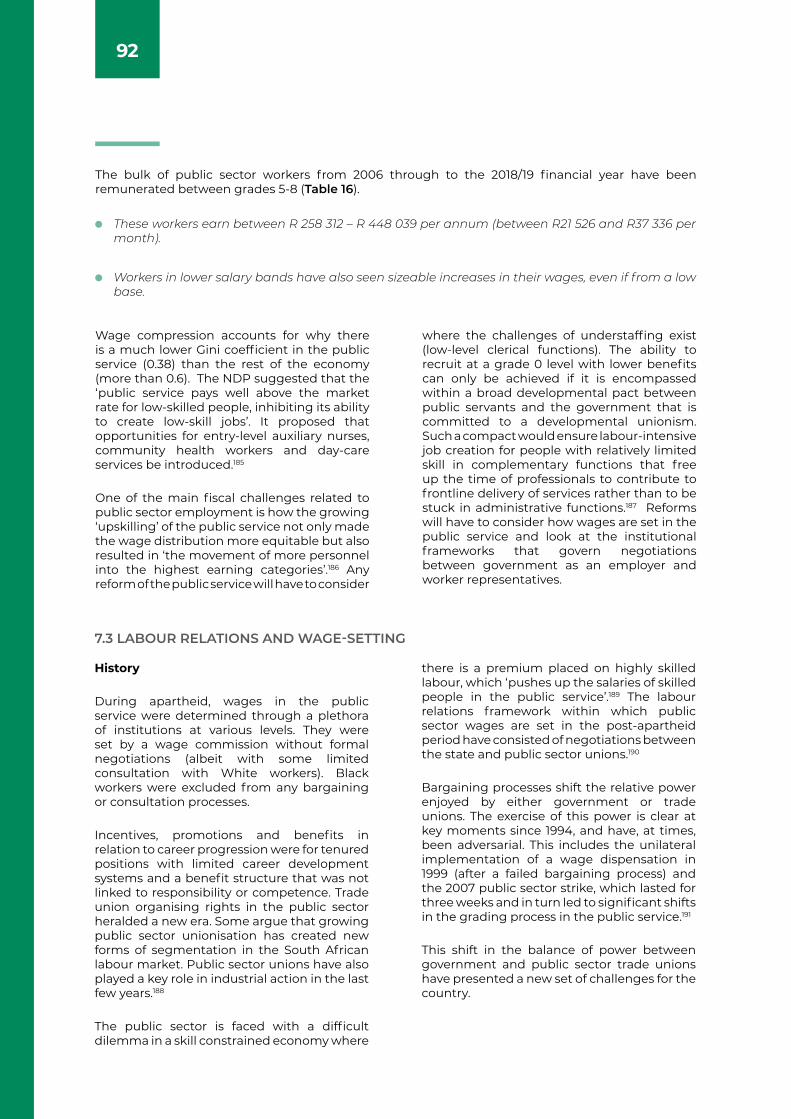
92
Wage compression accounts for why there is a much lower Gini coefficient in the public service (0.38) than the rest of the economy (more than 0.6). The NDP suggested that the ‘public service pays well above the market rate for low-skilled people, inhibiting its ability to create low-skill jobs’. It proposed that opportunities for entry-level auxiliary nurses, community health workers and day-care services be introduced.185
One of the main fiscal challenges related to public sector employment is how the growing ‘upskilling’ of the public service not only made the wage distribution more equitable but also resulted in ‘the movement of more personnel into the highest earning categories’.186 Any reform of the public service will have to consider
where the challenges of understaffing exist (low-level clerical functions). The ability to recruit at a grade 0 level with lower benefits can only be achieved if it is encompassed within a broad developmental pact between public servants and the government that is committed to a developmental unionism. Such a compact would ensure labour-intensive job creation for people with relatively limited skill in complementary functions that free up the time of professionals to contribute to frontline delivery of services rather than to be stuck in administrative functions.187 Reforms will have to consider how wages are set in the public service and look at the institutional frameworks that govern negotiations between government as an employer and worker representatives.
The bulk of public sector workers from 2006 through to the 2018/19 financial year have been remunerated between grades 5-8 (Table 16).
These workers earn between R 258 312 – R 448 039 per annum (between R21 526 and R37 336 per month).
Workers in lower salary bands have also seen sizeable increases in their wages, even if from a low base.
7.3 LABOUR RELATIONS AND WAGE-SETTING
History
During apartheid, wages in the public service were determined through a plethora of institutions at various levels. They were set by a wage commission without formal negotiations (albeit with some limited consultation with White workers). Black workers were excluded from any bargaining or consultation processes.
Incentives, promotions and benefits in relation to career progression were for tenured positions with limited career development systems and a benefit structure that was not linked to responsibility or competence. Trade union organising rights in the public sector heralded a new era. Some argue that growing public sector unionisation has created new forms of segmentation in the South African labour market. Public sector unions have also played a key role in industrial action in the last few years.188
The public sector is faced with a difficult dilemma in a skill constrained economy where
there is a premium placed on highly skilled labour, which ‘pushes up the salaries of skilled people in the public service’.189 The labour relations framework within which public sector wages are set in the post-apartheid period have consisted of negotiations between the state and public sector unions.190
Bargaining processes shift the relative power enjoyed by either government or trade unions. The exercise of this power is clear at key moments since 1994, and have, at times, been adversarial. This includes the unilateral implementation of a wage dispensation in 1999 (after a failed bargaining process) and the 2007 public sector strike, which lasted for three weeks and in turn led to significant shifts in the grading process in the public service.191
This shift in the balance of power between government and public sector trade unions have presented a new set of challenges for the country.
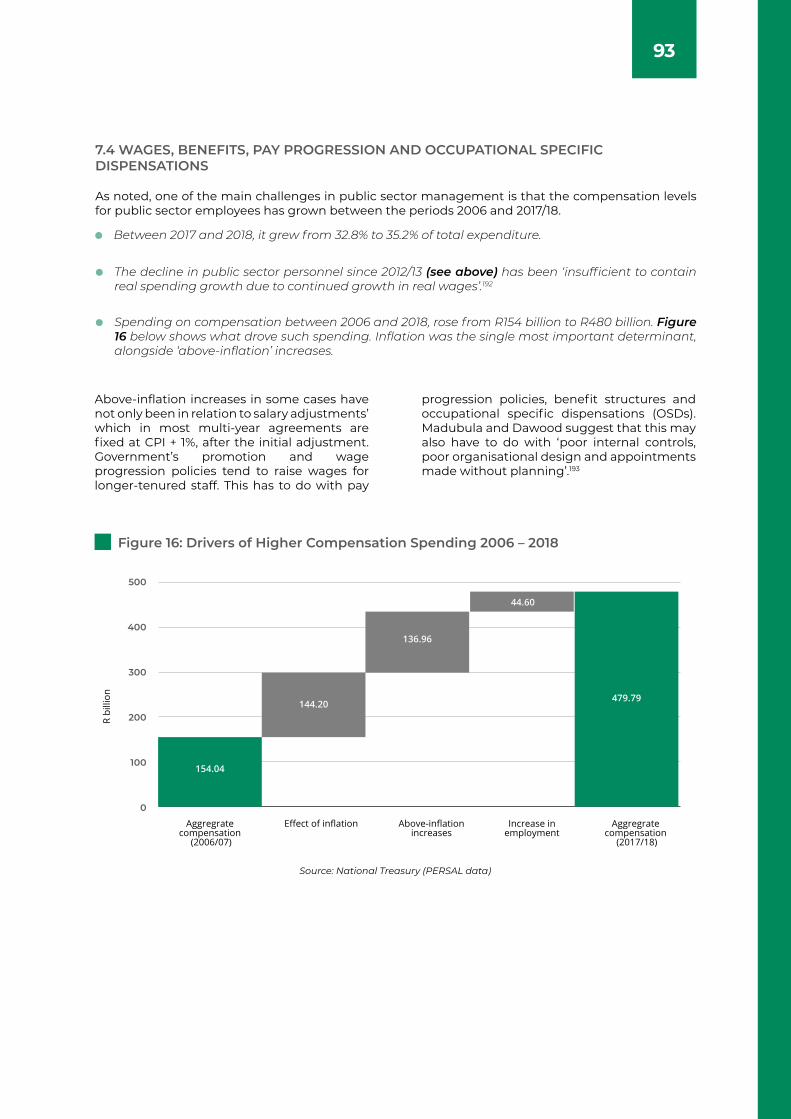
93
Between 2017 and 2018, it grew from 32.8% to 35.2% of total expenditure.
The decline in public sector personnel since 2012/13 (see above) has been ‘insufficient to contain real spending growth due to continued growth in real wages’.192
Spending on compensation between 2006 and 2018, rose from R154 billion to R480 billion. Figure 16 below shows what drove such spending. Inflation was the single most important determinant, alongside ‘above-inflation’ increases.
7.4 WAGES, BENEFITS, PAY PROGRESSION AND OCCUPATIONAL SPECIFIC DISPENSATIONS
Above-inflation increases in some cases have not only been in relation to salary adjustments’ which in most multi-year agreements are fixed at CPI + 1%, after the initial adjustment. Government’s promotion and wage progression policies tend to raise wages for longer-tenured staff. This has to do with pay
progression policies, benefit structures and occupational specific dispensations (OSDs). Madubula and Dawood suggest that this may also have to do with ‘poor internal controls, poor organisational design and appointments made without planning’.193
As noted, one of the main challenges in public sector management is that the compensation levels for public sector employees has grown between the periods 2006 and 2017/18.
Figure 16: Drivers of Higher Compensation Spending 2006 – 2018
Source: National Treasury (PERSAL data)
500
400
300
200
100
0
Aggregrate compensation
(2006/07)
R bi
llion
154.04
144.20
136.96
479.79
44.60
Aggregrate compensation
(2017/18)
Effect of inflation Above-inflation increases
Increase in employment
94
7.5 PAY PROGRESSION POLICIES
The doubling of the number of workers at salary levels 9-16 between 2006 and 2018 has meant that the state is now paying even higher salaries and benefits. Pay progression has become automatic, with very little deliberation on performance in the latest Public Service Co-ordinating Bargaining Council (PSCBC) agreement on salary adjustments and improvements in conditions of service (covering the period 2018-2021). The agreement agrees to
‘(equalize) pay progression across the public service at 1.5%’.
Pay progression policies, especially in light of budgetary shifts, need to be aligned to a discussion on performance expectations in the three-year period governing the agreement and reporting on this to the PSCBC after the lapse of the agreement, which would allow for clawback provisions in case of weaker than agreed on performance.
Pay progressions (which is different from inflation linked salary increases) occur when an employee progresses a salary notch within the salary scale applicable to him/her. It is a system that applies to all permanently employed workers in the public service. Progression is not automatic but is based on an assessment
measuring performance. In the case of the education sector (except for educators and TVET lecturers) when employees qualify for a pay progression, the nominal value of their salaries increases by 1.5%. The impact of this has in turn changed the composition of the public service, per Table 17 below:
Table 17: Salary Levels in the Public Service 2006-2018
Source: National Treasury, 2018
Salary Level 2006/07 2017/18
Level 1-4 31% 19%
Level 9-16 10% 21%
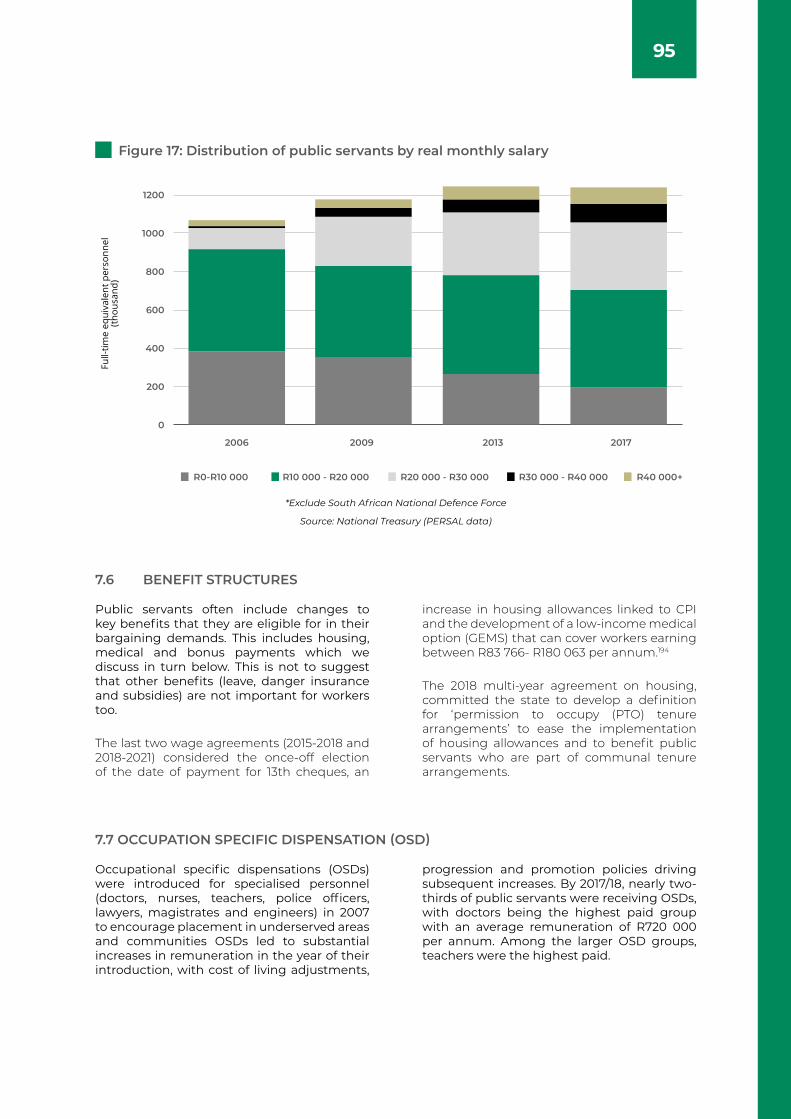
95
7.6 BENEFIT STRUCTURES
Public servants often include changes to key benefits that they are eligible for in their bargaining demands. This includes housing, medical and bonus payments which we discuss in turn below. This is not to suggest that other benefits (leave, danger insurance and subsidies) are not important for workers too.
The last two wage agreements (2015-2018 and 2018-2021) considered the once-off election of the date of payment for 13th cheques, an
increase in housing allowances linked to CPI and the development of a low-income medical option (GEMS) that can cover workers earning between R83 766- R180 063 per annum.194
The 2018 multi-year agreement on housing, committed the state to develop a definition for ‘permission to occupy (PTO) tenure arrangements’ to ease the implementation of housing allowances and to benefit public servants who are part of communal tenure arrangements.
Figure 17: Distribution of public servants by real monthly salary
Source: National Treasury (PERSAL data)
1200
1000
800
600
400
200
0
Full-
time
equi
vale
nt p
erso
nnel
(thou
sand
)
2006
R0-R10 000 R10 000 - R20 000 R20 000 - R30 000 R30 000 - R40 000 R40 000+
2009 2013 2017
*Exclude South African National Defence Force
7.7 OCCUPATION SPECIFIC DISPENSATION (OSD)
Occupational specific dispensations (OSDs) were introduced for specialised personnel (doctors, nurses, teachers, police officers, lawyers, magistrates and engineers) in 2007 to encourage placement in underserved areas and communities OSDs led to substantial increases in remuneration in the year of their introduction, with cost of living adjustments,
progression and promotion policies driving subsequent increases. By 2017/18, nearly two-thirds of public servants were receiving OSDs, with doctors being the highest paid group with an average remuneration of R720 000 per annum. Among the larger OSD groups, teachers were the highest paid.
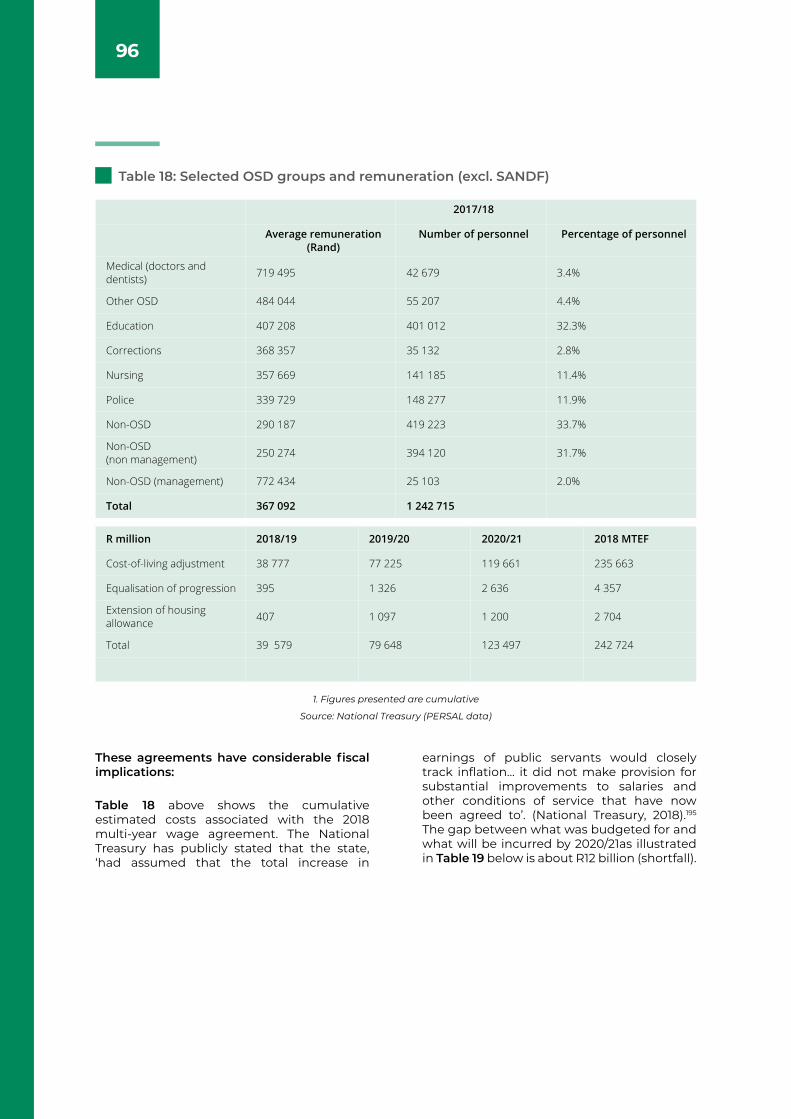
96
These agreements have considerable fiscal implications:
Table 18 above shows the cumulative estimated costs associated with the 2018 multi-year wage agreement. The National Treasury has publicly stated that the state, ‘had assumed that the total increase in
earnings of public servants would closely track inflation… it did not make provision for substantial improvements to salaries and other conditions of service that have now been agreed to’. (National Treasury, 2018).195 The gap between what was budgeted for and what will be incurred by 2020/21as illustrated in Table 19 below is about R12 billion (shortfall).
Table 18: Selected OSD groups and remuneration (excl. SANDF)
Source: National Treasury (PERSAL data)
1. Figures presented are cumulative
2017/18
Average remuneration (Rand)
Number of personnel Percentage of personnel
Medical (doctors and dentists) 719 495 42 679 3.4%
Other OSD 484 044 55 207 4.4%
Education 407 208 401 012 32.3%
Corrections 368 357 35 132 2.8%
Nursing 357 669 141 185 11.4%
Police 339 729 148 277 11.9%
Non-OSD 290 187 419 223 33.7%
Non-OSD (non management) 250 274 394 120 31.7%
Non-OSD (management) 772 434 25 103 2.0%
Total 367 092 1 242 715
R million 2018/19 2019/20 2020/21 2018 MTEF
Cost-of-living adjustment 38 777 77 225 119 661 235 663
Equalisation of progression 395 1 326 2 636 4 357
Extension of housing allowance 407 1 097 1 200 2 704
Total 39 579 79 648 123 497 242 724
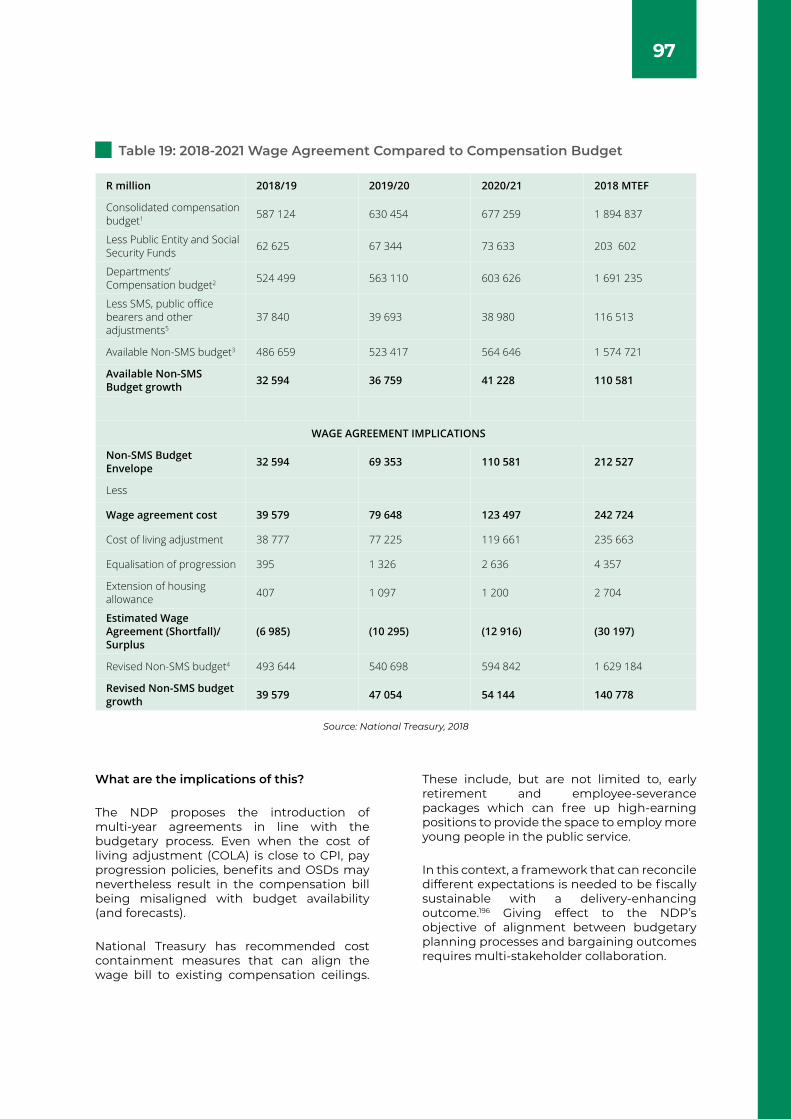
97
What are the implications of this?
The NDP proposes the introduction of multi-year agreements in line with the budgetary process. Even when the cost of living adjustment (COLA) is close to CPI, pay progression policies, benefits and OSDs may nevertheless result in the compensation bill being misaligned with budget availability (and forecasts).
National Treasury has recommended cost containment measures that can align the wage bill to existing compensation ceilings.
These include, but are not limited to, early retirement and employee-severance packages which can free up high-earning positions to provide the space to employ more young people in the public service.
In this context, a framework that can reconcile different expectations is needed to be fiscally sustainable with a delivery-enhancing outcome.196 Giving effect to the NDP’s objective of alignment between budgetary planning processes and bargaining outcomes requires multi-stakeholder collaboration.
Table 19: 2018-2021 Wage Agreement Compared to Compensation Budget
Source: National Treasury, 2018
R million 2018/19 2019/20 2020/21 2018 MTEF
Consolidated compensation budget1 587 124 630 454 677 259 1 894 837
Less Public Entity and Social Security Funds 62 625 67 344 73 633 203 602
Departments’ Compensation budget2 524 499 563 110 603 626 1 691 235
Less SMS, public office bearers and other adjustments5
37 840 39 693 38 980 116 513
Available Non-SMS budget3 486 659 523 417 564 646 1 574 721
Available Non-SMS Budget growth 32 594 36 759 41 228 110 581
WAGE AGREEMENT IMPLICATIONS
Non-SMS Budget Envelope 32 594 69 353 110 581 212 527
Less
Wage agreement cost 39 579 79 648 123 497 242 724
Cost of living adjustment 38 777 77 225 119 661 235 663
Equalisation of progression 395 1 326 2 636 4 357
Extension of housing allowance 407 1 097 1 200 2 704
Estimated Wage Agreement (Shortfall)/ Surplus
(6 985) (10 295) (12 916) (30 197)
Revised Non-SMS budget4 493 644 540 698 594 842 1 629 184
Revised Non-SMS budget growth 39 579 47 054 54 144 140 778
98
7.8 REVIEWING PUBLIC BARGAINING STRUCTURES AND CLARIFYING WHAT ESSENTIAL SERVICES ENTAILS
7.8.1 SEPARATE CHAMBERS: A DIFFERENT APPROACH TO PUBLIC SERVICE BARGAINING
7.8.2 CLARIFYING DISPUTE RESOLUTION: ESSENTIAL SERVICES
RECOMMENDATION
In this discussion, we consider two related proposals within the NDP: a sector-based approach to collective bargaining within the
public service and clarifying what essential services entails.197
The NDP suggests, that the PSCBC should be divided into separate chambers by occupation and skill level. Many industrial disputes and work stoppages in the public sector occur because of the complication of bargaining being undertaken on behalf of multiple sectors, occupations and functions without due regard for context-specific issues.198 The rationale for this is to have an education chamber that can speak to school improvement plans, and a health chamber
discussing stockouts.
Since 2012, there has been limited progress towards creating targeted and separate bargaining platforms for different occupational and skill categories. According to Bobby Godsell, this is because many of the social partners have abdicated responsibility leading to a reversal in labour relations not only within the state but outside of it too.199
The NDP suggests that the current system of dispute resolution in the public service, ‘neither discourages strike action, nor inspires confidence in other ways of addressing disputes and grievances’.203
To achieve an effective labour climate or environment the NDP suggests that there needs to be a clear and appropriate determination of sanctions when minimum service level agreements are not upheld and
where essential services are at risk. However, at present, there is insufficient consensus on what an essential service is, and what it is not.204
The NDP adopts the approach that teachers should be classified as an essential service. The implementation of such a recommendation would require an amendment to the definition of an essential service in the LRA.
The proposal of creating different bargaining chambers has not received widespread support, notwithstanding the rationale.200
What is clear, is that the scope of bargaining councils (even in instances where a sectoral focus exists) need to be reviewed.201 There
is a need for greater oversight over the functioning of bargaining chambers, with clear terms of reference that outlines the division of responsibilities contained in agreements signed with public sector worker representatives.202
A service whose interruption endangers the life, personal safety or health of the whole or any part of the population
The Parliamentary Service
The South African Police Service
The LRA defines an essential service as follows:
99
7.8.3 THE DEBATE ON ESSENTIAL SERVICES
The Essential Services Committee (ESC) of the CCMA reviews disputes about whether a service is essential or not. The ESC ratifies collective agreements governing minimum
services for activities deemed as essential services and determines whether a service is essential.
In terms of the legal framework governing the provision of essential services, disputes must be settled by arbitration and strike/lockout action is unprotected (and not a criminal offence). Registered trade unions and employers may conclude collective agreements on the maintenance of a minimum service within an essential service. Strike or lockouts may take place as long as an agreed upon minimum service is maintained.
International labour standards do not preclude a country from criminalising industrial action
although the introduction of such a provision is not feasible in South Africa. Also, dismissal while legal, is not a feasible remedy for public service employers in large, national, unprotected strikes where management must dismiss everyone, or no one.
Public sector trade unions have criticised the state for refusing to negotiate minimum service agreements, while the government has argued that these unions have tacitly or explicitly encouraged unprotected strikes.
The 2018 LRA Amendment Act has clarified, as suggested by the NDP, that a ‘minimum service’ refers to the minimum number of employees that are part of an essential service,
who may not strike, to ensure that the ‘life, personal safety or health of the community or part of the community is not endangered’.
The governing party at its 2012 policy conference noted that education services had to be protected from disruption. At its 2013 lekgotla, the governing party stated that the disruption of schooling due to industrial action and service delivery protests impacts negatively on the quality of education provided and that consideration had to therefore be given to whether education should be classified as an essential service.
The absence of minimum service agreements coupled with a lack of confidence in compulsory arbitration as a mechanism for dispute resolution has contributed to some dysfunction.
The legitimacy of the ESC is also undermined by the fact that there were no representatives of government. Amendments to the LRA in 2014 addressed a number of these concerns by including public sector employers and trade unions in the operations of the ESC.
Hearings are conducted by specialist panels, comprising three to five members familiar with a sector.
The ESC may direct parties in an essential service sector to negotiate a minimum service agreement and, if they fail to do so, determine its content. However, this power is seldom exercised in the public sector because, unless the parties voluntarily participate in hearings, the ESC does not have the information necessary to make an informed determination of the level of service required at a workplace.
Labour representatives, and especially the South African Democratic Teachers’ Union do not support such a classification because while limiting strike action, it does not address systemic issues such as ‘overcrowded classrooms, school violence, inadequate infrastructure and learning materials, and under-qualified teachers’.205
Since the publication of the NDP in 2012, this has been a contentious matter.
100
While there has not been a major nation-wide public service strike since 2009, there are frequent strikes over localised issues, particularly in the health sector, where minimum services are not maintained. In 2018, the ESC considered whether certain aspects of the education sector should be declared an essential as a result of a referral by the Democratic Alliance, an opposition party. The ESC ruled that school managers and support staff are not considered essential services but that limited categories of boarding house staff, sanatorium services and security guards at boarding schools were to be considered essential services. The proposal to classify teachers as an essential service would require the enactment of legislation which would, undoubtedly, be subject to constitutional challenge. It has been criticised for conflating the need to enhance management and co-operation with classification of a service as essential.
Parties to the Public Services Bargaining Council agreed to an Accord on Collective Bargaining at a 2018 indaba. Parties supported a 2010 declaration adopted at a public service summit which had called for a review of bargaining structures with a view to develop structures suitable for the public sector while jealously guarding centralised bargaining processes.
Finally, other public entities, listed in Schedule 3A to the Public Finance Management Act (Act No. 1 of 1999), which are wholly or partly state-funded engage in separate collective bargaining processes. The incorporation of all public entities into a centralised bargaining structure would promote greater consistency in wage-setting within the public sector. This would require a legislative amendment.
RECOMMENDATION
Employers and trade unions in the public sector should identify any aspects of the bargaining structure that require legislative change and table these at Nedlac.
The ESC should continue to engage with the employers and trade unions on the negotiation of minimum service agreements.

Chapter
08
102
THE EXPANDED PUBLIC WORKS PROGRAMME - A CASE STUDY
A rich historical context led to the creation of the EPWP.206 The goal of the EPWP has from its inception been a combination of income relief, skills transfer and social security. The NDP also envisages the creation of two million work opportunities by 2030 through the EPWP.
Is this target adequate and can it be achieved? Clearly, the fiscal and budgetary resources available and allocated for this purpose, greatly influences progress:
Based on current and historical EPWP data, the 2030 target is likely to be achieved. However, this does not provide enough indication of the programme’s impact, relative to its objective. In addition, the target was set with fulltime equivalent roles in mind to meaningfully address unemployment and labour market marginalisation. More attention should be directed at continuous employment relationships and the labour law implications of this, especially in the home-based care
and early childhood development sectors. In addition, there should be a focus on opportunities to support nutrition education and provision as part of the basic education system to directly address community needs and challenges. This sector also employs women mainly, which is positive.207 This issue thus requires greater consideration beyond just numerical targets to include, for example, institutional change.
(See also Appendix 4)
Only the social sector and the community works programme have achieved their numerical targets.
To date:
The infrastructure sector has the highest variance in terms of work opportunities.
Set (and amend) numerical targets in line with MTEF allocations to ensure budgetary alignment.
Secure private funds to increase the number of people that can benefit from the EPWP and to support potential pathways into training and thereafter formal employment opportunities.
The non-profit organisation sector has the highest variance in terms of full-time equivalent roles.
RECOMMENDATIONS FROM THE FIRST THREE PHASES OF IMPLEMENTING THE EPWP INCLUDE:
103
Even with the recent process to adopt a National Minimum Wage, the Advisory Panel set up by the negotiating parties at Nedlac found that while it is ideal for the national minimum wage to apply to all employees, it was not ‘practicable nor desirable’ at present.212
In instances where EPWP workers have worked for more than three months on
municipal projects (example: Lungile Mtshali Project in Ekurhuleni), they have called for pay rationalisation and equal conditions of work when compared to fulltime municipal employees. Along with the ‘One Wage Campaign’ to include EPWP workers in the ambit of the National Minimum Wage, this will test the full articulation of the EPWP and its role to provide income relief alongside other social objectives.
Training opportunities and the upskilling potential of the EPWP correlates with labour demand and investment conditions.208
The EPWP offers significant possibilities to enhance the skills of those in the social sector, even as a pathway to formal care work in both the public and private sectors.
Clarification of the role and function the EPWP: The 25-Year Review found that only 12.4% of EPWP participants in the period concerned found permanent employment and 4.8% set up their own businesses while the overwhelming majority (47.8%) found temporary employment with 14% going into the education and training system.
It is recommended that in a context of subdued labour demand, the EPWP should continue to play an income relief and employment guarantee function without having to also play a labour activation and/or upskilling function.
Target-setting, not only in terms of beneficiaries employed but the hours worked and training goals, must be realistic and aligned with budgetary process, through the MTEF.
Private sector involvement in the funding and implementation of the EPWP needs to be considered to create potential pathways into relevant and sector-specific training and employment opportunities.
EPWP workers have been paid ‘substantially lower wages than their counterparts’ employed by provincial or local administrations.211
Several government departments, entities and agencies do not have the capacity to implement and report fully on EPWP projects. Concerns have been raised about the reporting of many municipalities and the impact this has on the integrity of data provided to government.
The EPWP’s wage-setting mechanisms create certain challenges in respect of affordability (fiscal sustainability) and promoting decent work. The EPWP has, at times, eroded labour conditions in the public sector, created new forms of exclusion and undermined the agenda of decent work.209
Skinner and Valodia also caution against differentiating between conditions of work in the ‘first’ and the ‘second’ economy in South Africa. This is because public employment schemes, and associated work conditions are not covered by key labour law provisions and collective bargaining agreements.210
Lessons:
RECOMMENDATIONS
104
In line with the proposals and objectives of the NDP, we compared the South African experience, with labour market policy, regulation and outcomes in Germany, Kenya and India, in the following areas:
See APPENDIX 6.
The NMWC and DoEL must consider how the wages and conditions of work in public employment schemes are progressively brought into alignment with other low-wage sectors to ensure decent work and address wage equity concerns.
Beneficiary selection procedures should be clear, transparent and easily understood. Intergovernmental relations could be used to mine data located in other departments and ministries to better target households in real need and to ensure that selection processes are not open to bias and political interference.
Public sector issues – share of employment, relative share of public budgets dedicated to wages etc.
Industrial relations issues – right to strike, collective bargaining and wage determination, social dialogue and dispute resolution mechanisms.
Skills development, lifelong learning and career advancement pathways – apprentice and learnership systems, re-skilling, post-retrenchment support, inter alia.
Future of work - interface of labour market issues with technology and innovation ecosystems, platform work and regulation, inter alia.
8.1 INTERNATIONAL BENCHMARKING

Chapter
09
106
CONCLUDING REMARKS AND POLICY RECOMMENDATIONS
We start our conclusion with a brief discussion of the premises underlying the NDP’s labour market vision.
A responsive labour market, the NDP suggests, should create opportunities and work for all while ensuring human rights, labour standards and democratic representation. There should be a progressive realisation of the vision of decent work over time in an expanding economy with rising skills levels. The need to balance job creation imperatives with those of equity has been a central feature of debates about labour market regulation in which the Government has previously described its approach as one of regulated flexibility.
The NDP states that the emphasis should be placed on mass access to jobs while maintaining standards where decent jobs exist in the early phase of the path towards 2030. It proposed creating additional job opportunities in the formal sector, particularly for youth and first-time job seekers, through employment in labour-intensive sectors and by removing disincentives to employment for small businesses.
The progress towards these objectives has been uneven. Labour demand, on the back of weaker growth and investment, has been weak, preventing the expansion of formal sector jobs while post-school education and training institutional failures need to be corrected through greater alignment between existing training capability in the private sector and the industrial and trade priorities of the country. Transitions into the labour market continue to exhibit zig-zag characteristics with unclear career pathways. Some of the practical proposals
in the NDP to facilitate these transitions and workplace matching (training vouchers, placement subsidies etc.) have not been implemented. Of the interventions that have been implemented, the Youth Employment Tax Incentive has been extended from an expected 2019 cut-off date, to 2029. According to evidence from literature, the YETI has not facilitated an impact on the scale necessary to absorb many of those unemployed and discouraged.
While there has been progress in social wage spending (now constituting half of the national budget), gaps remain in accessing contributory insurance schemes, such as the UIF, for those in informal sector employment and of those informally employed in the formal sector. Wage inequality is a major driver of inequality in South Africa and equitable wage determination in the private sector remains a concern. While the National Minimum Wage Commission (NMWC) has been tasked with monitoring earnings inequality, much more needs to be done to regulate pay differentials within firms using existing legislative instruments.
The development of the NDP’s proposals overlapped with a significant legislative reform process which came into effect in 2015. These changes included a new set of provisions to protect employees placed by Temporary Employment Services/labour brokers which had been a significant controversy for a decade and was a topic addressed by the NDP. Other issues dealt with in this legislation included the enforcement of minimum standards, the operation of the CCMA and the Labour Courts and a significant restructuring of the Essential Services Committee, a topic addressed by the NDP in its discussion of public service labour relations.
107
The NDP highlights the regulation of unfair dismissal, particularly rules surrounding probation, as negatively impacting on the creation of new jobs. While there is a substantial support for such proposals, it has been resisted by trade unions and there has been no significant change in the law in this area although the courts have cautioned arbitrators against interfering in employers’ probation decisions. However, as suggested, greater certainty could be obtained, parti-cularly for small employers, by the Nedlac social partners updating the relevant Codes of Good Practice. Any further reform in respect of probation or other proposals made by the NDP, such as limiting the right of high-paid employees to refer cases to the CCMA, would require amendments to the LRA.
There has been no comprehensive reform dealing with the position of small employers. The most significant initiative, the BUSA – CCMA toolkit, that provides advice and assistance to this category of employers and reduces the transactional costs of labour law for these employers should have its impact monitored. Two further initiatives identified which would reduce the administrative obligation on employers is the increase of the threshold at which employment equity obligations apply and at which the Skills Development Levy must be paid.
The package of legislation which came into effect on 1 January 2019 represents the most significant initiative addressing labour market
regulation in the period since the NDP was published. This involved the enactment of the NMW Act, coupled with the amendments to the LRA to promote greater labour market stability and to the BCEA to promote effective enforcement. This pact flowed from an extensive research and negotiation process.
The amendments to the LRA seek to address the high level of adversarialism which re-emerged in collective labour relations. The available information and interviews suggest that this is still a dominant feature of the labour market. Our primary recommenda-tion is that the CCMA should be enabled to dedicate a greater portion of its resources to dispute prevention and capacity-building initiatives with employers and trade unions.
The most significant labour market institu-tions all have differing levels of resource de-ficiencies. While budgetary pressures will continue to exist, there are mechanisms to enhance efficacy within these constraints. For example, greater efficiency could be achieved in the Labour Court, which continues to suffer from having insufficient judges, by linking its administrative systems with those of the CCMA and by implementing its new draft rules. If the effective implementation of health and safety in the workplace is to be achieved, as suggested by the NDP, it would require that greater resources are devoted to updating legislation and regulations as well as utilising the reserves of the Compensation Fund to appoint and train additional inspectors.
108
A number of commentators have criticised the NDP for failing to address employment creation in the informal sector, as well as the extension of greater protection and security to current informal sector workers.213 We associate ourselves with this analysis and are of the view that the ongoing project to promote and expand decent work envisaged by the NDP should therefore take account of deve-lopments that have been highlighted in the period since the publication of the NDP. These include the extension of protection to informal sector workers as proposed by ILO Recom-mendation 204, ‘Transition from the Informal to the Formal Economy’,214 the protection of digital platform workers as discussed in the ‘Work for a Brighter Future’ report released by the ILO’s Global Commission on the Future of Work in January 2019215 and the impact of climate change on the labour market.
We are also of the view that in order to implement the NDP’s vision in respect of lifelong learning, there is a need to address deficiencies in the regulatory framework and point to areas in which the Unemployment Insurance Act could be used to empower employees during periods of transition between within the labour market.
The NDP argues for the need for public sector labour relations to be conducive to delivery and employment objectives. In this regard it highlights aspects of the structure of the public service bargaining councils as well as the role of essential service agreements. The NDP’s proposal that education be declared to be an essential service reflected a response to the crisis of management and labour relations in that sector which is not consistent with our labour relations framework and is not favoured by the principal actors. While there is broad recognition of the need for minimum service level agreements to be concluded, the modalities of achieving this have remained elusive and few have been concluded in key public services.
While the NDP has made wide-ranging suggestions concerning labour market reform, its proposals have not been subject to any comprehensive debate in Nedlac or similar forums. While the Plan recognises the values of broad social pacts to implement its vision, its discussion of the labour market falls short of any concrete suggestions on the trade-offs and concessions that would underscore such a pact.
We wish to conclude by identifying those processes which should be prioritised to implement the vision of the NDP. These are:
The revision of the Codes of Good Practice: Unfair Dismissal, which falls within the responsibility of the Minister of Employment and Labour, and Nedlac;
The revision of the threshold at which small business are required to pay the Skills Development Levy.
The transition into the labour market (especially for the youth and other inexperienced work-seekers) continue to exhibit disruptions and non-linear pathways and therefore the interventions proposed (from school driver programmes, to work-seeker training vouchers and subsidies for placement) should be investigated and, where suitable and feasible, implemented with urgency. These interventions should be framed within the existing National Pathway Management System.
The development of plans dealing with shocks to the demand and supply-side of the labour market, such as forced migration, climate change, automation and pandemics (such as Covid-19). Moreover, these measures need to protect the vulnerable position of low-skilled workers in the South African labour market by encouraging regularisation of employment relationships and strengthening of social security pathways (i.e. access to contributory insurance, occupational health and safety provisions inter alia)
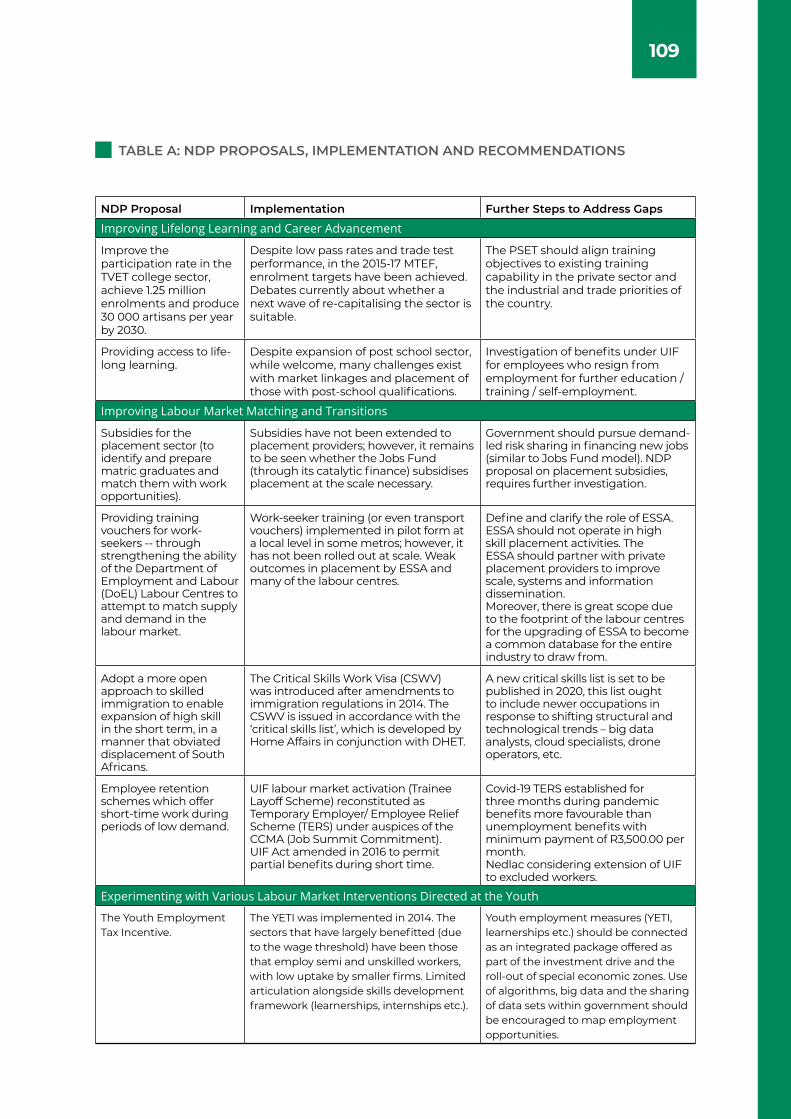
109
TABLE A: NDP PROPOSALS, IMPLEMENTATION AND RECOMMENDATIONS
NDP Proposal Implementation Further Steps to Address Gaps
Improving Lifelong Learning and Career Advancement
Improve the participation rate in the TVET college sector, achieve 1.25 million enrolments and produce 30 000 artisans per year by 2030.
Despite low pass rates and trade test performance, in the 2015-17 MTEF, enrolment targets have been achieved. Debates currently about whether a next wave of re-capitalising the sector is suitable.
The PSET should align training objectives to existing training capability in the private sector and the industrial and trade priorities of the country.
Providing access to life-long learning.
Despite expansion of post school sector, while welcome, many challenges exist with market linkages and placement of those with post-school qualifications.
Investigation of benefits under UIF for employees who resign from employment for further education / training / self-employment.
Improving Labour Market Matching and Transitions
Subsidies for the placement sector (to identify and prepare matric graduates and match them with work opportunities).
Subsidies have not been extended to placement providers; however, it remains to be seen whether the Jobs Fund (through its catalytic finance) subsidises placement at the scale necessary.
Government should pursue demand-led risk sharing in financing new jobs (similar to Jobs Fund model). NDP proposal on placement subsidies, requires further investigation.
Providing training vouchers for work-seekers -- through strengthening the ability of the Department of Employment and Labour (DoEL) Labour Centres to attempt to match supply and demand in the labour market.
Work-seeker training (or even transport vouchers) implemented in pilot form at a local level in some metros; however, it has not been rolled out at scale. Weak outcomes in placement by ESSA and many of the labour centres.
Define and clarify the role of ESSA. ESSA should not operate in high skill placement activities. The ESSA should partner with private placement providers to improve scale, systems and information dissemination. Moreover, there is great scope due to the footprint of the labour centres for the upgrading of ESSA to become a common database for the entire industry to draw from.
Adopt a more open approach to skilled immigration to enable expansion of high skill in the short term, in a manner that obviated displacement of South Africans.
The Critical Skills Work Visa (CSWV) was introduced after amendments to immigration regulations in 2014. The CSWV is issued in accordance with the ‘critical skills list’, which is developed by Home Affairs in conjunction with DHET.
A new critical skills list is set to be published in 2020, this list ought to include newer occupations in response to shifting structural and technological trends – big data analysts, cloud specialists, drone operators, etc.
Employee retention schemes which offer short-time work during periods of low demand.
UIF labour market activation (Trainee Layoff Scheme) reconstituted as Temporary Employer/ Employee Relief Scheme (TERS) under auspices of the CCMA (Job Summit Commitment). UIF Act amended in 2016 to permit partial benefits during short time.
Covid-19 TERS established for three months during pandemic benefits more favourable than unemployment benefits with minimum payment of R3,500.00 per month.Nedlac considering extension of UIF to excluded workers.
Experimenting with Various Labour Market Interventions Directed at the Youth
The Youth Employment Tax Incentive.
The YETI was implemented in 2014. The sectors that have largely benefitted (due to the wage threshold) have been those that employ semi and unskilled workers, with low uptake by smaller firms. Limited articulation alongside skills development framework (learnerships, internships etc.).
Youth employment measures (YETI, learnerships etc.) should be connected as an integrated package offered as part of the investment drive and the roll-out of special economic zones. Use of algorithms, big data and the sharing of data sets within government should be encouraged to map employment opportunities.

110
NDP Proposal Implementation Further Steps to Address Gaps
Experimenting with Various Labour Market Interventions Directed at the Youth
Provide a subsidy to the placement sector to identify, prepare and place matric graduates into work opportunities. The placement company will be paid upon successful placement.
No subsidy has been provided to the placement sector, aside from the demand-led risk sharing approach of the Jobs Fund (through the funding of Harambee). There are strides through the National Pathway Management Network in the Presidency and the commitment received from the private sector to place two million youth in one year paid work experience opportunities linked to the YES programme.
The priority ought to be to quantify the number of youth with part qualifications, provide those with workplace training and matching to private sector. There is scope to include private placement sector in National Pathway Management Network, as a step towards collaboration envisaged in NDP.
Expand learnerships and make training vouchers directly available to work-seekers.
The training voucher scheme seems impractical at this point, as even a significant number of those who have received training in artisanal areas, have been unable to complete their qualifications due to lack of experiential and workplace learning.
Policies aimed at getting young people into work, like the YETI need to be co-articulated with learnerships, internship programmes and empowerment legislation (as in the case of the YES) and facilitated through one ‘regulatory window’ so firms can see the benefits of compliance. This could be done through a common application process; that triggers a YETI response and an impact on sector scorecards.
Free driver training lessons for school-leavers.
Driver training (outside Model C and private schools) has not occurred. A programme for school-leavers in no-fee schools, was started by the Gauteng Education Department.
Partnerships between Department of Basic Education/Transport with private sector operators and auto manufacturers to roll this programme out at scale. Facilitate innovative private and public private interventions that use existing assets of private sector to socialise and underwrite the costs of the job search for youth.
Clarifying Dismissal and Retrenchment Provisions in the Labour Relations ActDismissal provisions in LRA to be simplified / probation rules changed
CCMA has published and revised guidelines for Arbitrations on Misconduct for Arbitrators to promote consistent decision making.
Nedlac should prioritise revising the Code of Good Practice: Unfair Dismissal in line with binding court decisions. This should include a separate section for small business.Research for a policy proposal to examine additional changes to the law concerning dismissal, should be undertaken.
An effective approach to regulating TESs
Legislation providing additional protection for low-paid workers placed by TES came into effect on 1 January 2015.Parliament reduced the period for temporary placements from 6 months to 3 months.
Greater monitoring and review of section 198A protections for vulnerable workers, and the ability of workers to access these rights is needed.
Senior managers earning above R 300 000 to be excluded from ambit of CCMA.
Proposal to limit unfair dismissal rights of employees earning in excess of R 1.2 million agreed at Nedlac in 2012 but rejected by Parliament.
Limitation of rights of highly paid employees in respect of unfair dismissal to be considered as part of LRA amendment process.
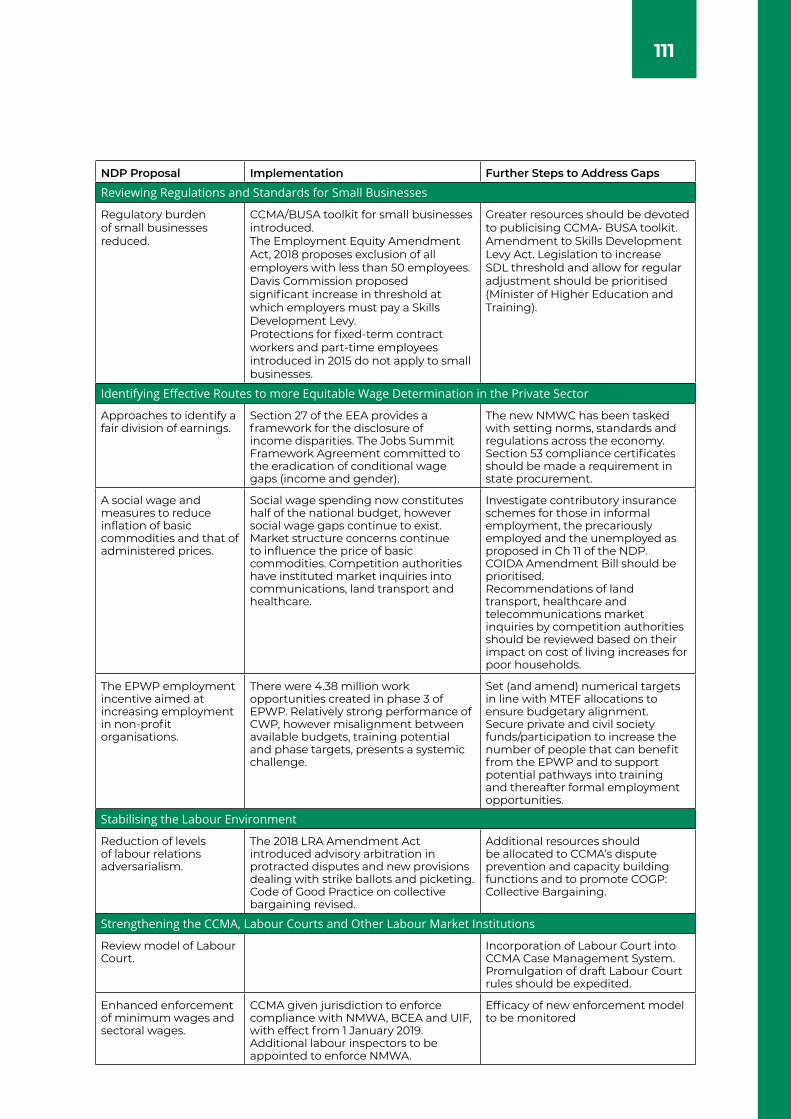
111
NDP Proposal Implementation Further Steps to Address Gaps
Reviewing Regulations and Standards for Small Businesses
Regulatory burden of small businesses reduced.
CCMA/BUSA toolkit for small businesses introduced. The Employment Equity Amendment Act, 2018 proposes exclusion of all employers with less than 50 employees. Davis Commission proposed significant increase in threshold at which employers must pay a Skills Development Levy.Protections for fixed-term contract workers and part-time employees introduced in 2015 do not apply to small businesses.
Greater resources should be devoted to publicising CCMA- BUSA toolkit. Amendment to Skills Development Levy Act. Legislation to increase SDL threshold and allow for regular adjustment should be prioritised (Minister of Higher Education and Training).
Identifying Effective Routes to more Equitable Wage Determination in the Private Sector
Approaches to identify a fair division of earnings.
Section 27 of the EEA provides a framework for the disclosure of income disparities. The Jobs Summit Framework Agreement committed to the eradication of conditional wage gaps (income and gender).
The new NMWC has been tasked with setting norms, standards and regulations across the economy. Section 53 compliance certificates should be made a requirement in state procurement.
A social wage and measures to reduce inflation of basic commodities and that of administered prices.
Social wage spending now constitutes half of the national budget, however social wage gaps continue to exist. Market structure concerns continue to influence the price of basic commodities. Competition authorities have instituted market inquiries into communications, land transport and healthcare.
Investigate contributory insurance schemes for those in informal employment, the precariously employed and the unemployed as proposed in Ch 11 of the NDP.COIDA Amendment Bill should be prioritised. Recommendations of land transport, healthcare and telecommunications market inquiries by competition authorities should be reviewed based on their impact on cost of living increases for poor households.
The EPWP employment incentive aimed at increasing employment in non-profit organisations.
There were 4.38 million work opportunities created in phase 3 of EPWP. Relatively strong performance of CWP, however misalignment between available budgets, training potential and phase targets, presents a systemic challenge.
Set (and amend) numerical targets in line with MTEF allocations to ensure budgetary alignment. Secure private and civil society funds/participation to increase the number of people that can benefit from the EPWP and to support potential pathways into training and thereafter formal employment opportunities.
Stabilising the Labour Environment
Reduction of levels of labour relations adversarialism.
The 2018 LRA Amendment Act introduced advisory arbitration in protracted disputes and new provisions dealing with strike ballots and picketing.Code of Good Practice on collective bargaining revised.
Additional resources should be allocated to CCMA’s dispute prevention and capacity building functions and to promote COGP: Collective Bargaining.
Strengthening the CCMA, Labour Courts and Other Labour Market Institutions
Review model of Labour Court.
Incorporation of Labour Court into CCMA Case Management System. Promulgation of draft Labour Court rules should be expedited.
Enhanced enforcement of minimum wages and sectoral wages.
CCMA given jurisdiction to enforce compliance with NMWA, BCEA and UIF, with effect from 1 January 2019.Additional labour inspectors to be appointed to enforce NMWA.
Efficacy of new enforcement model to be monitored
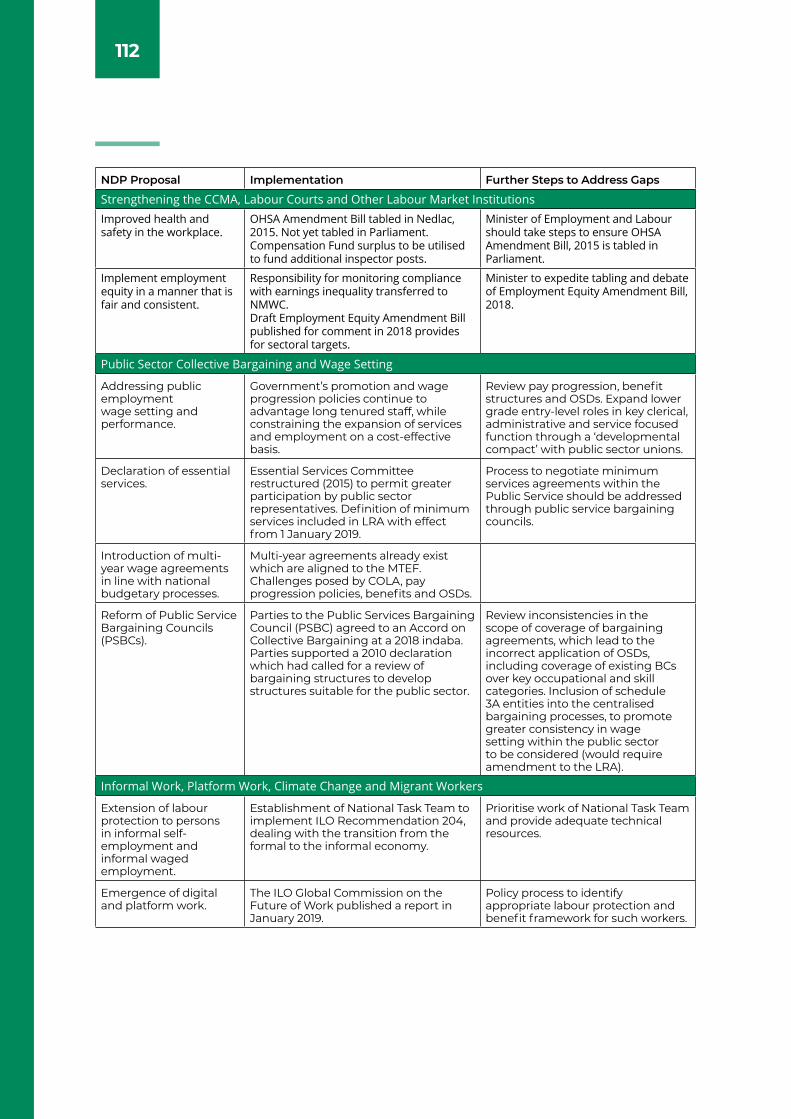
112
NDP Proposal Implementation Further Steps to Address Gaps
Strengthening the CCMA, Labour Courts and Other Labour Market InstitutionsImproved health and safety in the workplace.
OHSA Amendment Bill tabled in Nedlac, 2015. Not yet tabled in Parliament. Compensation Fund surplus to be utilised to fund additional inspector posts.
Minister of Employment and Labour should take steps to ensure OHSA Amendment Bill, 2015 is tabled in Parliament.
Implement employment equity in a manner that is fair and consistent.
Responsibility for monitoring compliance with earnings inequality transferred to NMWC.Draft Employment Equity Amendment Bill published for comment in 2018 provides for sectoral targets.
Minister to expedite tabling and debate of Employment Equity Amendment Bill, 2018.
Public Sector Collective Bargaining and Wage Setting
Addressing public employment wage setting and performance.
Government’s promotion and wage progression policies continue to advantage long tenured staff, while constraining the expansion of services and employment on a cost-effective basis.
Review pay progression, benefit structures and OSDs. Expand lower grade entry-level roles in key clerical, administrative and service focused function through a ‘developmental compact’ with public sector unions.
Declaration of essential services.
Essential Services Committee restructured (2015) to permit greater participation by public sector representatives. Definition of minimum services included in LRA with effect from 1 January 2019.
Process to negotiate minimum services agreements within the Public Service should be addressed through public service bargaining councils.
Introduction of multi-year wage agreements in line with national budgetary processes.
Multi-year agreements already exist which are aligned to the MTEF. Challenges posed by COLA, pay progression policies, benefits and OSDs.
Reform of Public Service Bargaining Councils (PSBCs).
Parties to the Public Services Bargaining Council (PSBC) agreed to an Accord on Collective Bargaining at a 2018 indaba. Parties supported a 2010 declaration which had called for a review of bargaining structures to develop structures suitable for the public sector.
Review inconsistencies in the scope of coverage of bargaining agreements, which lead to the incorrect application of OSDs, including coverage of existing BCs over key occupational and skill categories. Inclusion of schedule 3A entities into the centralised bargaining processes, to promote greater consistency in wage setting within the public sector to be considered (would require amendment to the LRA).
Informal Work, Platform Work, Climate Change and Migrant Workers
Extension of labour protection to persons in informal self-employment and informal waged employment.
Establishment of National Task Team to implement ILO Recommendation 204, dealing with the transition from the formal to the informal economy.
Prioritise work of National Task Team and provide adequate technical resources.
Emergence of digital and platform work.
The ILO Global Commission on the Future of Work published a report in January 2019.
Policy process to identify appropriate labour protection and benefit framework for such workers.
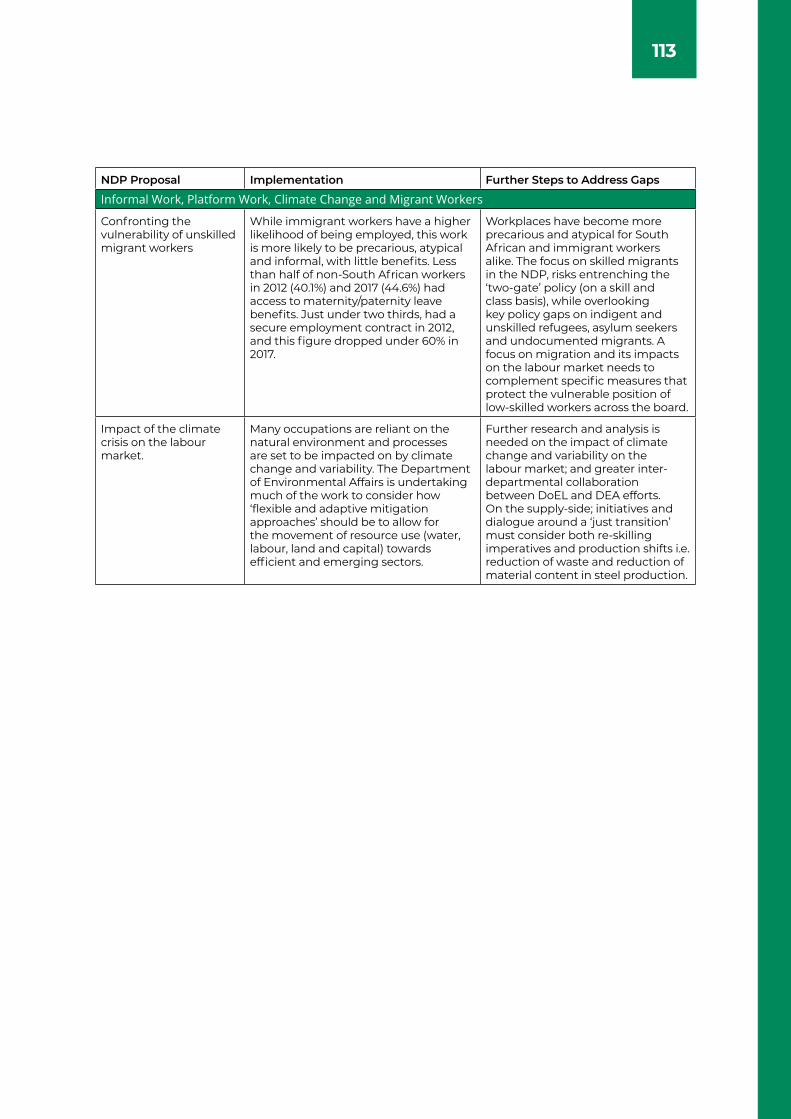
113
NDP Proposal Implementation Further Steps to Address Gaps
Informal Work, Platform Work, Climate Change and Migrant Workers
Confronting the vulnerability of unskilled migrant workers
While immigrant workers have a higher likelihood of being employed, this work is more likely to be precarious, atypical and informal, with little benefits. Less than half of non-South African workers in 2012 (40.1%) and 2017 (44.6%) had access to maternity/paternity leave benefits. Just under two thirds, had a secure employment contract in 2012, and this figure dropped under 60% in 2017.
Workplaces have become more precarious and atypical for South African and immigrant workers alike. The focus on skilled migrants in the NDP, risks entrenching the ‘two-gate’ policy (on a skill and class basis), while overlooking key policy gaps on indigent and unskilled refugees, asylum seekers and undocumented migrants. A focus on migration and its impacts on the labour market needs to complement specific measures that protect the vulnerable position of low-skilled workers across the board.
Impact of the climate crisis on the labour market.
Many occupations are reliant on the natural environment and processes are set to be impacted on by climate change and variability. The Department of Environmental Affairs is undertaking much of the work to consider how ‘flexible and adaptive mitigation approaches’ should be to allow for the movement of resource use (water, labour, land and capital) towards efficient and emerging sectors.
Further research and analysis is needed on the impact of climate change and variability on the labour market; and greater inter-departmental collaboration between DoEL and DEA efforts. On the supply-side; initiatives and dialogue around a ‘just transition’ must consider both re-skilling imperatives and production shifts i.e. reduction of waste and reduction of material content in steel production.
114
ENDNOTES1. “National Development Plan 2030: Our future - make it work” https://www.gov.za/documents/
national-development-plan-2030-our-future-make-it-work NDP, 2012: 138
2. NDP, 2012:138
3. NDP, 2012: 463
4. NDP, 2012: 135
5. NDP, 2012: 136
6. Section 27 was amended to transfer the functions of the Employment Conditions Commission in respect of reporting and monitoring of disproportionate income differentials to the National Minimum Wage Commission (NMWC). September 21, 2018.
National Minimum Wage Advisory Panel (2016). “A National Minimum Wage for South Africa”. NEDLAC
7. Simons and Simons, Class and Colour in South Africa 1850 – 1950 (at page 43).
8. Vusi Gumede and Molefi Mohautse, (2018). “Economic and Social Inequalities in Democratic South Africa”.
https: //www.vusigumede.com/content/VUSIGUMEDE%202018/papers/Social%20&%20Economic%20Inequalities%20in%20SA%20Book%20Chapter.pdf
9. Du Toit, Industrial democracy in South Africa’s transition [1997] LDD 4 - http://www.saflii.org/za/journals/LDD/1997/4.html
10. Constitution of South Africa, 1996. Section 23: Everyone has the right to fair labour practices. Every worker has the right to form and join a trade union; to participate in the activities and programmes of a trade union; and to strike. https://www.justice.gov.za/legislation/constitution/SAConstitution-web-eng.pdf
11. Owen Crankshaw, Changes in the racial division of labour during the apartheid era, Journal of Southern African studies, Volume 22, 1996 - Issue 4. Pages 633-656. https://www.tandfonline.com/doi/abs/10.1080/03057079608708516
12. H Bhorat and S Khan, (2018). “Structural Change and Patterns of Inequality in the South African Labour Market”. Working Paper 201801, DPRU, University of Cape Town (UCT).
http://www.dpru.uct.ac.za/wp-201801-structural-change-and-patterns-inequality-south-african-labour-market
13. NDP, 2012: 42
14. COSATU and the PSA both point out that the NDP makes several errors in its discussion of the public service bargaining councils.
COSATU: Summary of Critique of the NDP, March 2013. www.cosatu.org.za
F Fourie (2018). “Creating jobs, reducing poverty: Is ‘formalising’ the informal sector the answer?”, REDI3x3. www.hsrcpress.ac.za/books/the-south-african-informal-sector-providing-jobs-reducing-poverty.
15. ILO Recommendation 204, Transition from the Informal to the Formal Economy https://www.ilo.org/ilc/ILCSessions/previous-sessions/104/texts-adopted/WCMS_377774/lang--en/index.htm
16. http://streetnet.org.za/2015/06/19/international-labour-organization-adopts-historical-labour-standard-to-tackle-the-informal-economy/
17. AgriSA has stated that since January 2018; 31 000 jobs have been lost in provinces severely affected by the drought in South Africa. (AgriSA, 2019).
18. Du Toit, R. (2005) A review of labour markets in South Africa: career guidance and employment services. (Commissioned by SIDA, October). http://repository.hsrc.ac.za/handle/20.500.11910/6981
115
19. The DHET Annual Report for 2017/18 suggests that this might have to do with CET procurement having to go through TVET colleges, which made it ‘unresponsive’ http://www.dhet.gov.za/Commissions%20Reports/DHET%20Annual%20Report%20%202017_18%20.pdf
20. DHET Annual Report, 2019: 108
21. According to the DHET Annual Performance Plan 2019/20, there were 1 036 984 students enrolled in the 2017 academic year, a 2.3% improvement on 2014 figures (969 155).
http://www.dhet.gov.za/Strategic%20Plans/Annual%20Perfomance%20Plans/Department%20of%20Higher%20Education%20and%20Training%202018_19%20Annual%20Performance%20Plan.pdf
http://www.dhet.gov.za/SiteAssets/Media%20Release%20and%20Statements%202019/DHET%202019_20%20Annual%20Performance%20Plan.pdf
22. With the SPU increasing from 124 students in 2014, through to 1063 students in 2017.
23. Between 2014 and 2017, there was a 10.8% rise in the number of Research Masters graduates, from 7 229 in 2014, to 8010 graduates in the 2017 academic year. DHET APP.
http://www.dhet.gov.za/SiteAssets/Media%20Release%20and%20Statements%202019/DHET%202019_20%20Annual%20Performance%20Plan.pdf
24. This was introduced in 2000 and is overseen by DHET and various SETAs.
25. Analysis Of SETA Performance & Challenges, Higher Education, Science And Technology, 19 April 2011. Available at: pmg.org.za
26. National Skills Fund, Annual Report 2018/2019:32
http://www.dhet.gov.za/NSF%20DOCUMENTS/NSF%202018-19%20Annual%20Report.pdf
27. This exacerbated the structural and operational challenges that the South African vocational training system is confronted with. ‘ (T)he problems run throughout. They relate to the materials that were there, they relate to the lecturers, they relate to the fact that we have developed this fantasy that we are 4IR institutions. I do not know what that involves, but high-tech teaching and learning methodologies in institutions that do not even have computers. Except for one lab?’ (Marock, 2019. Interview, 13 November 2019).
28. ‘… (W)e’ve had recapitalisation before in the history of the last 25 years. They will run it (in a way) that means for any particular trade you cannot do it across colleges, so you’ll have two institutions that have got that recapitalisation. We spend a lot of the NSF money and buy lots of toys. And then what happens when the machinery goes out of date? We can’t keep recapitalising. So, I don’t think it is a sustainable solution. (Marock, 2019. Interview, 13 November 2019).
29. The aims of the LAP were to create employment and business opportunities, skill and re-skill the unemployed (or those with the prospect of being unemployed) to combat long term unemployment. https://pmg.org.za/committee-meeting/21292/
30. T Lamati (DG, DoEL): Parliamentary Briefing on Department of Labour’s 2015/16 Annual Report, NCOP Economic and Business Development, 31 January 2017. https://pmg.org.za/committee-meeting/23895/
31. The NDP noted that the UIF’s coverage was limited and that less than 5% of the unemployed were receiving unemployment benefits at any given time. Also, that 55% of the unemployed had never worked and therefore did not qualify for benefits and that 44% of unemployed people who had previous work experience had been unemployed for longer than one year and had therefore exhausted their benefits.
32. NDP, Chapter 7
NDP, Chapter 7
116
33. “Transforming the Present — Protecting the Future”. Report of the Committee of Inquiry into a Comprehensive System of Social Security for South Africa (Taylor Committee Report). March 2002. https://sarpn.org/CountryPovertyPapers/SouthAfrica/march2002/report/Transforming_the_Present.pdf
The Taylor Report described the UIF as retaining the form of a fund catering the limited requirements of a historically privileged workforce not seriously threatened by unemployment. Its recommendations included the extension of social insurance where administratively feasible, social grants, and indirect social protection through the facilitation of favourable labour market transitions. It concluded that there are close linkages between direct protection (conventional social security measures such as UIF) and indirect protection (active labour market-type policies), and institutions to coordinate these policies in the long-term should be constructed. In early 2007, the government published proposals for social security and retirement reforms that included mandatory participation in a national social security system for employees up to an earnings threshold that would provide basic retirement, unemployment, and death and disability benefits. This envisaged the incorporation of both the UIF and Compensation Fund into a broader national security system. A NEDLAC stakeholder task force and an inter-ministerial committee was established to guide the policy process on the institutional framework for the development of a comprehensive social security scheme.
See: “Comprehensive Social Security Reforms in South Africa”, Portfolio Committee Presentation, Department of Social Development. 14 June 2017. https://pmg.org.za/committee-meeting/24609/
The UIA 2001 modernised the existing system of unemployment, maternity, illness, and dependant’s benefits. The UIA’s scope was extended to high wage earners, as well as to domestic workers, which resulted in over 650 000 private employers registering with the UIF. The collection of contributions through the South African Revenue Services (SARS), which is regulated by the Unemployment Insurance Contributions Act (Act No. 4 of 2002) has contributed to the improved solvency of the Fund. The incorporation of higher paid employees into the Fund and the prohibition on employees who resign from claiming unemployment benefits also contributed to the accumulation of surpluses. Section 4(2) UICA, Act 4 of 2002.
34. A Govindjee, 2011 Stellenbosch Law Review, “Activation in the Context of The Unemployment Insurance System in South Africa”.
MP Olivier and A Govindjee, “A Critique of the Unemployment Insurance Amendment Bill”. PELJ 2015(18)7.
35. NDP, 2012: 113
36. TIPS, “Using the UIF Surplus as part of a stimulus package”. 2016. Policy Brief 1. www.tips.org.za: The surplus stood at R56 billion on 31 March 2011; R120 billion on 31 March 2016 and R130 billion on 31 March 2017 per the Department of Labour Annual Report for the UIF, 31 March 2017. Contributions have exceeded benefits paid out by more than 100% in each year since the early 2000s, excluding 2009-2010 when the surplus was reduced to 86% of benefits, despite the massive increase in layoffs due to the recession. In each of these years, the UIF obtained a surplus of contributions over benefits of between R6 billion and R9 billion (in 2015 Rands). A proposal by the National Treasury to grant a contribution holiday to employers and employees in 2015 was withdrawn as a result of opposition by the trade unions and the Fund officials.
37. The total exclusion of all persons who resign from claiming benefits violates the applicable international standards as provided in the Employment Promotion and Protection against Unemployment ILO Convention 168 of 1988. This, in article 20(b) and (c), permits employees to be deprived of benefits if they deliberately contribute to their own dismissal or leave employment voluntarily without just cause. The UIA can therefore be criticised for not permitting employees to establish that a resignation was ‘for just cause’ such as seeking further training, becoming self-employed or caring for children or a partner.
https://www.ilo.org/dyn/normlex/en/f?p=NORMLEXPUB:12100:0::NO::P12100_INSTRUMENT_ID:312313
38. The state will not make monthly contributions but will compensate the UIF on a ‘pay as you go’ basis, if public servants claim benefits.
117
39. The Equality Court has ruled that the failure to pay benefits to refugees who otherwise qualify for benefits is unlawful. Saddiq v Department of Labour and Others (Equality Court, Unreported, Case: EQ 04/2017). https://www.cliffedekkerhofmeyr.com/en/news/publications/2018/Employment/employment-alert-12-february-asylum-seekers-seek-uif.html
40. Section 5(d) of the UIAA, 2016. Unemployment Insurance Amendment Act (Act No. 10 of 2016)
41. The UIF established a labour activation programme which had a budget of R400 million in 2015-2016 to implement programmes for the training of the unemployed. In that period, 3 258 beneficiaries received training through these schemes. UIF Annual Report 2015, page 64. https://www.ufiling.co.za/docs/annualreport2015_part1.pdf and UIF 2017 https://www.ufiling.co.za/docs/annualreport_2017.pdf
42. Section 12(1B) of the UIAA, 2016. Unemployment Insurance Amendment Act (Act No. 10 of 2016)
43. Employees are entitled to the additional benefits if they have earned enough credits in the previous four-year cycle and these are paid at a flat rate of 20% of earnings. Employees are now entitled to one day of benefits for every four days worked.
44. Section 12(3)(c). Unemployment Insurance Amendment Act (Act No. 10 of 2016)
45. Section 24(6). Unemployment Insurance Amendment Act (Act No. 10 of 2016)
46. COSATU Statement (Matthew Parks):
https://www.politicsweb.co.za/politics/signing-of-the-unemployment-insurance-amendment-ac
47. ESSA is a national system that operates through 125 labour centres across the nine provinces. The ESSA programme falls under the Public Employment Services division of the DoEL.
48. Section 6 of the Employment Services (Act No. 4 of 2014).
49. Sections 7(1) and (2) of the Employment Services (Act No. 4 of 2014).
50. National Treasury Annual Report, 2019 (Page 253):
http://www.treasury.gov.za/publications/annual%20reports/national%20treasury/nt%20annual%20report%202018-19.pdf
51. National Treasury Annual Report, 2019: 254 (as above).
52. From an institutional perspective, many of the challenges within the ESSA, were captured in a study conducted on behalf of the DoEL. See: C.H. Prinsloo et al, “An assessment of the implementation of the Employment Services of South Africa
(ESSA)”, 2011
http://www.hsrc.ac.za/en/research-outputs/view/5554
53. From an institutional perspective, many of the challenges within the ESSA, were captured in a study conducted on behalf of the DoEL. See: C.H. Prinsloo et al, “An assessment of the implementation of the Employment Services of South Africa (ESSA)”, 2011
http://www.hsrc.ac.za/en/research-outputs/view/5554 .
54. Mncwango et al (2016) asked, ‘why does there seem to be voluntary withdrawal of work-seekers from the very sectors and jobs that require low-level skills and hence have been targeted for labour-absorbing growth’? The 2014 study’s findings are based on 2 934 responses from work-seekers registered on the ESSA database. The results of the study considered the attitudinal factors that influence decisions around labour market participation. These attitudinal factors are important considerations in ‘(informing) how we can encourage groups with specific experiences to participate in the labour market’.
B Mncwango, M Visser, S Ngandu and A Paterson (2016) “Understanding occupational choices of low-skilled workers in South Africa”. HSRC Policy Brief.
55. Mncwango et al (2016) asked, ‘why does there seem to be voluntary withdrawal of work-seekers from the very sectors and jobs that require low-level skills and hence have been targeted for labour-absorbing growth’? The 2014 study’s findings are based on 2 934 responses from work-seekers registered on the ESSA database. The results of the study considered the attitudinal factors that influence decisions around labour market participation. These attitudinal factors are important considerations in ‘(informing) how we can encourage groups with specific experiences to participate in the labour market’.
118
B Mncwango, M Visser, S Ngandu and A Paterson (2016) “Understanding occupational choices of low-skilled workers in South Africa”. HSRC Policy Brief.
56. R du Toit, (2005). “Review of Labour Markets in South Africa”. Employment & Economic Policy Research Programme, HSRC, October 2005.
57. If one considers the 2017/18 figures of vacancies registered by employers and work-seeker registrations using digital channels stood at 21% and 27% of all database entries respectively. (DoEL, 2018:56). These figures might seem very low; however, it is a considerable improvement from 2% of work-seekers registering via online channels in the 2013/14 financial year.
58. The Jobs Fund was announced by former President Jacob Zuma in the 2011 State of the Nation Address. R9 billion was set aside, and the Fund launched in June 2011. https://www.sahistory.org.za/archive/2011-president-zuma-state-nation-address-10-february-2011
59. The projects funded are at multiple levels (national, provincial and local), across sectors and with different combinations of matched and grant funding. The Jobs Fund operates as a ‘challenger fund’, allocating matching grants following a competitive, open and transparent process, overseen by an independent investment committee (National Treasury Annual Report, 2019:169) Enterprise development and work-seeker support projects constitute the bulk of approvals and employment and training opportunities. http://www.jobsfund.org.za/
60. Projects run between 3-5 years with a 2-year monitoring window.
61. The current funding ratio of the Jobs Fund is 1:1.8. Put simply, every rand spent by the National Treasury, the project partners spend nearly two Rands: Jobs Fund: National Treasury briefing, Standing Committee on Appropriations, 5 March 2019: https://pmg.org.za/committee-meeting/28021/
See:https://www.fin24.com/Economy/jobs-fund-how-were-putting-sa-to-work-20190414-2 and National Treasury Annual Report, 2019:177.
62. National Treasury Annual Report 2018-2019.
http://www.treasury.gov.za/publications/annual%20reports/national%20treasury/nt%20annual%20report%202018-19.pdf
63. P Benjamin, “Law and Practice of Private Employment Agency Work in South Africa”. ILO Working Paper No. 292 (2013)
https://www.ilo.org/wcmsp5/groups/public/---ed_dialogue/--sector/documents/publication/wcms_231442.pdf
64. R du Toit, (2005). “Review of Labour Markets in South Africa”. Employment & Economic Policy Research Programme, HSRC.
65. The NDP proposed that where employees are placed by TESs for longer than six months, the respective agency and the client (company) should be jointly liable for any unfair dismissal and/or unfair labour practice. The protection of low-paid vulnerable employees placed by agencies has been one of the most notable areas of controversy in the labour market arena and was the subject of an extended policy debate which culminated in the enactment of changes to the LRA which came into effect on 1 January 2015.
66. The Bill tabled in Parliament that was approved by Cabinet, after an extensive negotiation process in NEDLAC, set this period at six months. There was no agreement on this issue at NEDLAC. The reduction of the period of “temporary work” from six months (as proposed by the Department of Labour and approved by Cabinet) to three months during the parliamentary recess has restricted the use of agency placements as a mechanism for reducing employer risk during probation months.
67. LRA, Section 198A (1)(c) read with (6) to (8)
68. LRA, Section 198A (5)
69. The employment Tax Incentive in South Africa Input by the Department of Labour to the Standing Committee on Finance (SCoF), Department of Labour, RSA, 2017. www/dol.gov.za
70. However widespread speculation that this would reduce employment have not materialised.
71. The placement of workers by TESs had returned to pre-2015 levels (before the legislative amendments).
119
The definition of ‘deemed’ was subject to further legal challenge in 2018 resolved by a Constitutional Court decision in 2018. TESs had argued that this creates “joint employment” in which both clients and the TESs are employers, and either can exercise these responsibilities. The Constitutional Court ruled that Section 198(3)(b) makes the client with whom the employee is placed the sole employer for the purposes of the LRA, if the employee works for longer than three months. For the purposes of other statutes such as the BCEA, the parties may regulate responsibility by contract. If the client elects to continue to pay the employee through the agency, the agency will remain the employer, but the client will be jointly and severally liable and the employee can hold either liable for non-payments or other breaches of the BCEA and other statutes. This formulation removes the financial incentive for the employment of employees through TESs as a means of reducing wages and depriving employees or employment security but allows employers to utilise TESs where it contributes to administrative efficiency.
See: H Bhorat and A Lilenstein, (2018). “From Regulatory Amendments to Employment Shifts: The Temporary Employment Services Sector in South Africa”.
https: //apso.org.za/images/documents/research/From-Regulatory-Amendments-to-Employment-Shifts-TES-Update-2018-.pdf
72. More than 50% of young people in the 15-24 age category are unemployed. Jukka Pirttilä & Amina Ebrahim, “Can a wage subsidy system help reduce 50 per cent youth unemployment?: Evidence from South Africa”. WIDER Working Paper Series wp-2019-28. And see Stats SA 2019- http://www.statssa.gov.za/
73. The incentive is designed to disincentivise a ‘race to the bottom’ where employers benefit indefinitely from paying relatively lower wages: Bhorat, H. and Khan, S. (2018) See note 12 above.
74. Ranchod and Finn used QLFS data in a ‘difference-in-difference’ study to identify the impact of the tax incentive on the probabilities. of young work-seekers accessing work. See: Ranchod, V., and A. Finn (2016). “Estimating the Short Run Effects of South Africa’s Employment Tax Incentive on Youth Employment Probabilities Using a Difference-indifferences Approach”. Southern Africa Labour and Development Research Unit (SALDRU) Working Paper 134. University of Cape Town.
75. Odendaal, P. (2016). “A comparative analysis of the Employment Tax Incentive Act, No. 26 of 2013”. Master’s Thesis. University of Cape Town.
76. Considering the incentive between 2013/4 and 2016, found that at the end of 2015, R2.5billion had been claimed in the incentive, supporting the creation of 686 402 jobs, which was 5.1% of total employment in the South African labour market.
77. H Bhorat, and S Khan. (2018). See note 12 above.
Bhorat, H., et al. (2016). ‘Investigating the Feasibility of a National Minimum Wage for South Africa’. Development Policy Research Unit Working Paper 201601. Cape Town: Development Policy Research Unit, University of Cape Town.
78. The authors arrived at these findings using the Post-Apartheid Labour Market Series (PALMS) 3.2 and administrative tax data based on PAYE reports from SARS. Ebrahim and Pirttila, 2019:13
79. However, these jobs, as Moeletsi (2017) shows, have come at a fiscal cost. T Moeletsi (--). “South Africa’s Youth Unemployment and the Employment Tax Incentive: An Empirical Re-evaluation”, Supervised by Gareth Roberts, University of Witwatersrand, Faculty of Commerce, Law and Management, August 2017. https://pdfs.semanticscholar.org/dd59/f1d79f89c5e44e7ee996d33f4c258e8f59d9.pdf
80. It is instructive if we are to consider that, as Ngandu et al show, that firms in tradable sectors are least likely to employ inexperienced youth. “Employer characteristics and youth employment outcomes in the formal sector in South Africa”, WIDER Working Paper 82/2018,
UNU-WIDER - https://doi.org/10.35188/UNU-WIDER/2018/524-4
81. Ngandu et al, 2018:22
82. Work done by the NPC, Singizi Consulting and the Rebel Group on youth labour market transitions found that when these programmes are analysed at an aggregate level.
83. During the recent budget vote for the DoEL, the Minister of Labour and Employment, Thulas Nxesi suggested that the government in the 2019/20 financial year would establish 10 specialised youth centres to complement the existing 126 labour centres. https://www.gov.za/speeches/department-employment-and-labour-budget-vote-28-10-jul-2019-0000
84. The National Youth Development Agency (NYDA) is a public agency set up to confront the challenges faced by young South Africans.
120
The NYDA was established by the National Youth Development Agency Act No.54 of 2008. It was established as a single and unitary structure after many of its predecessor organisations (such as the Umsobomvu Youth Fund) were brought together under one umbrella.
https://www.gov.za/about-government/contact-directory/soe/soe/national-youth-development-agency
http://www.nyda.gov.za/Portals/0/Downloads/Publications/NYDA_AnnualReport2017-18.pdf
86. NYDA Annual Report, 2018-2019:51. In the 2018/19 financial year, 1103 youth-owned small businesses were provided with grant funding, mostly in the services sector – salons, spas, car washes and catering businesses. http://www.nyda.gov.za/Portals/0/Downloads/Publications/NYDA%20ANNUAL%20REPORT%20201819%20LR%20FNL%202.pdf
NYDA Annual Report, 2018-2019:52
87. Minister Thulas Nxesi: Employment and Labour Department Budget Vote 2019/20, 10 July 2019.
https: //www.gov.za/speeches/department-employment-and-labour-budget-vote-28-10-jul-2019-0000
88. Marock, Interview 2019.
89. Firms either create these opportunities within their organisation or finance a placement in a small business. On 28 August 2018, the Youth Employment Service (YES) was gazetted for implementation through Section 9(1) of the B-BBEE Act. This meant that businesses who are part of the initiative, and who meet their YES targets and comply with other regulations, have an opportunity to move up a level on their B-BBEE scorecard.
90. Nedbank have already, either directly or indirectly, employed over 3500 young people as part of the initiative. As one responded suggested, ‘as the scheme (becomes) more refined and better understood’, more companies may take up the initiative.
91. National Planning Commission (NPC). 2012.
92. P Madlala and C Govender (2018). “Current collective engagement stakeholder strategies for South African labour relations”. SA Journal of Human Resource Management 16 (0).
93. Industrial Action Report 2017.
http://www.labour.gov.za/DocumentCenter/Reports/Annual%20Reports/Industrial%20Action%20Annual%20Report/2017/iar2017.pdf
94. DoEL Annual Report, 2017: 8
95. Industrial Action Report 2017, Page 9.
http://www.labour.gov.za/DocumentCenter/Reports/Annual%20Reports/Industrial%20Action%20Annual%20Report/2017/iar2017.pdf
96. Advisory arbitration may be invoked if a strike or lockout is no longer functional to collective bargaining, in that it has continued for a protracted period and no resolution appears imminent; there is a threat, or imminent threat that constitutional rights may be violated by the threat or use of violence; or if the strike has or may lead to or exacerbate a national or local crisis. The responsibility for appointing an advisory arbitration panel rests with the National Director of the CCMA, who must appoint a panel if directed to do so by the Minister of Labour, the Labour Court or if the parties to the dispute agree. A trade union or employer organisation that is a party to the dispute is required to consult with its members over the advisory award and, if it elects to reject it, provide reasons for that decision.
97. Section 69(6A-6C). Picketing rules may be agreed in advance in a collective agreement binding on the trade union or agreed upon during the conciliation process. In the absence of agreed rules, the CCMA or bargaining council conciliator must determine the rules at the time of issuing the certificate of non-resolution in respect of the dispute. A set of default picketing rules is attached to the draft Code of Good Practice: Collective Bargaining, Industrial Action and Picketing to guide the conciliator in determining the rules. A set of default picketing rules is attached to the draft Code of Good Practice: Collective Bargaining, Industrial Action and Picketing to guide the conciliator in determining the rules.
98. CCMA Annual Report 2016-2017 at page 24. See also: CCMA Strategic NDP 2015-2016 / 2019-2020 at 14. These are reflected in its strategic objectives of enhancing the labour market to advance stability and growth, advance good practices at work and build knowledge and skills. http://www.ccma.org.za/ and http://ccmarecovery.syncrony.com/About-Us/Reports-Plans/Annual-Reports/id/468
121
99. The CCMA was established in 1995 as an independent dispute resolution agency governed by a tripartite governing body. The governing body is regarded as an effective institution for social dialogue where social partners have appointed senior representatives to serve as members. (Bronstein, 2009) However, the CCMA has expressed concern that it is not directly engaged in NEDLAC processes that involve legislative reforms affecting the CCMA.
100. In earlier years, the CCMA Annual Report 2018-19 states that approximately 80% of cases referred to the CCMA concerned dismissal. This percentage has declined because of the CCMA’s increased jurisdiction.
101. For example, the concept of “inquiry by an arbitrator” introduced in 2004 seeks to prevent the duplication of internal inquiries and arbitration hearings. However, employers and trade unions make minimal use of this technique.
102. In 2016-2017, 188 449 disputes were referred to the CCMA of which 5 038 were classified as being “mutual interest” (collective bargaining) disputes (CCMA Annual Report 2016-2017 at page 9).
103. This requires the facilitation of up to four meetings between the parties. The involvement of the CCMA in the large-scale retrenchments prior to termination notices being issued enhances its capacity to contribute to job security.
104. Issues that have been added to the mandate of the CCMA are: operational requirements; dismissals involving an individual employee or an employer with less than 10 employees (2002 LRA Amendments); and unfair discrimination cases involving a claim of sexual harassment or brought by an employee earning less than the BCEA earnings threshold (2003 EEA Amendment Act). These categories of cases were initially within the exclusive jurisdiction of the Labour Court, but the amendments allow them to be referred either the CCMA or the Labour Court.
• In 2015, a new category of disputes was created for low paid agency workers, fixed term contract employees and part-time employees. The expansion of the CCMA’s jurisdiction to cover the NMWA and the BCEA brings the operation of the CCMA and DOEL’s inspectorate into close conjunction. Both employees and labour inspectors may refer matters to the CCMA.
• Previously, the Department of Labour’s inspectors had brought very few enforcement claims under the BCEA to the Labour
Court. During the period January – August 2019 (8 months), there were a total of 23 026 referrals of disputes involving the BCEA and NMWA, constituting 13% of the CCMA’s caseload. which had contributed to the low levels of compliance with minimum wages set by sectoral determinations.
• These amendments were designed to make the enforcement of the minimum wage and basic conditions of employment more accessible and efficient and require the CCMA to perform functions previously exercised by the Labour Court.
105. https://www.gov.za/sites/default/files/gcis_documents/Jobs_Summit_FrameWork_Agreement.pdf
106. The DoEL grant to the CCMA constitutes 97% of the total budget, to pursue its strategic and organisational mandate. It is insufficient to fund all organisational activities, and motivations for additional funding have been submitted in response to the increased caseload. Currently the CCMA generates one percent of its revenue from services rendered. It also generates a further two percent of its income from interest generated on short term fixed investment income.
107. Examples of such interventions by the CCMA are included in APPENDIX 7.
108. Approximately 1.5% of the CCMA’s budget is devoted to this aspect of its mandate.
109. In 2018 – 2019, the CCMA delivered 37 effective Negotiating Skills capacity building interventions, including five with Bargaining Councils. It delivered four transformation of workplace relations projects at strategically targeted workplaces. DoEL Annual Report 2018 – 2019, page 31.
http://www.labour.gov.za/DocumentCenter/Reports/Annual%20Reports/Departmental%20Annual%20Reports/2018/Annual%20Report201819.pdf
The CCMA’s key workplace transformation training interventions, for CCMA users in all regions, focus on building workplace relationships; managing workplace conflict; negotiation skills. CCMA Commissioners are provided with training courses focusing on disputes under the EEA, application of the NMW, and other recent legislative amendments, application of specific LRA provisions such as Section 189A-D, short courses on sector specific topics, SAQA based training.
110. Comprising representatives of the CCMA, the Economic Development Department, Productivity SA, and the Unemployment Insurance Fund has been established to adjudicate.
122
111. Proposals to expand the CCMA’s powers to charge fees in respect of cases referred to it by high-paid employees have been rejected.
112. Rules are available at: www.saslaw.org.za
113. Van Niekerk, A. “Speedy social justice: Streamlining the statutory dispute resolution processes”. 2015 36 ILJ 837- 841.
The absence of case data makes it difficult to analyse the caseload of the Labour Court. However, there is extensive evidence from the case-law and public statements by judges to indicate that a significant portion of litigation in the Labour Court is either obstructive or involves an abuse of process This is true of both the public and private sectors. See also: N Whitear and H Kruuse, (2019). “Obiter - The ethics of legal practitioners in resource-scarce institutions - PM Mashishi v Z Mdlala”. Obiter.
114. The Judge President of the Labour Courts and the Director of the CCMA made joint representations to Parliament for the repeal of section 143(5) of the LRA.
115. Du Toit, D et al. 2015. Labour Relations Law: A comprehensive guide (6th edition). LexisNexis: Durban. At page 51.
116. Established in terms of sections 27 to 34 of the LRA.
117. Solidarity & Others v MEIBC & Others (2017) 38 ILJ 2109 (LC)
118. It is responsible for monitoring and enforcing compliance with the BCEA, UIF Act, EEA, and OHSA.
119. “RSA Decent Work Country Programme 2018-2023”, ILO, June 2018.
120 Adequacy of Resources for Effective Inspections to be Conducted within the South African Labour Market, DoEL, March 2017. www.labour.gov.za
121. Mandela Initiative 2018: https://mandelainitiative.org.za/
122. An amendment to the law would be needed to alter any retrenchment provisions. The relevant heading includes a reference to ‘retrenchment’ provisions, but this is not discussed in the text.
123. The Code of Good Practice was intended to promote certainty, while at the same time allowing for a flexible application of the law by permitting small businesses to comply with a less formalised procedure. This provides less flexibility for small businesses in situations of retrenchments. In contrast, the consultation procedure that employers are required to follow before operational requirements dismissals is expressly regulated in the statute. This approach (LRA) has been described as a ‘trade-off’ between the interests of organised labour and business that was negotiated at NEDLAC. Trade unions were attracted by the notion of quick arbitrations without the expense of lawyers and which offered a real prospect of reinstatement for their members. Employers saw their gains as including the relatively short referral period, a simplification of their obligations in respect of internal disciplinary inquiries, and a cap on compensation awards.
A Van Niekerk, (2007). “Regulating Flexibility and Small Business: Revisiting the LRA and BCEA-A Response to Halton Cheadle’s Concept Paper”. DPRU Working Paper No. 07/119 https://papers.ssrn.com/sol3/papers.cfm?abstract_id=982064
124. CCMA GUIDELINES: MISCONDUCT ARBITRATIONS.
Available at: https://www.worklaw.co.za/SearchDirectory/PDF/Codeofgoodpractice/CCMA-Guidelines-Misconduct-arbitrations_Feb2015.pdf
125. Of the OECD’s twenty-nine members, only the United States had less restrictive laws than South Africa on hiring and hours of work.
While South Africa’s dismissal laws are given a less flexible rating, they are more flexible than the average for OECD countries and more flexible than countries such as Brazil, China and India. While these studies point to a significant level of flexibility in South Africa, there is a widespread and incorrect perception that our labour market is highly regulated. D Collier, and P Benjamin, (2015) “Measuring Labour Market Efficiency” in S. Merry et al (eds) The Quiet Power of Indicators: Measuring Governance, Corruption and the Rule of Law, Cambridge, New York. S Hayter, Reinecke, and Torres, R. & International Labour Office. (2001). South Africa.
126. H Bhorat, P Lundall, and S Rospabe, (2002) “The South African labour market in a globalizing world: Economic and Legislative Considerations”. Employment Paper 2002/32. International Labour Organisation.
https://www.researchgate.net/publication/228396694_The_South_African_labour_market_in_a_globalizing_world_Economic_and_legisatve_considerations
127. M Bertrand and B Crépon (2019). ‘Teaching Labor Laws: Evidence from a Randomized Control Trial
123
in South Africa’. University of Chicago, Booth School of Business, January 2019. Unpublished.
128. H Bhorat and H Cheadle (2009). ‘Labour Reform in South Africa: Measuring Regulation and a Synthesis of Policy Suggestions’. DPRU Working Paper 09/139, University of Cape Town (UCT).
Bhorat, H., and J. Hodge (1999). ‘Decomposing Shifts in Labour Demand in South Africa’. The South African Journal of Economics, 67(3): 155–68.
129. In 2017–18, there were approximately 17,000 awards, of which 63 per cent were in favour of employers. Over the life of the CCMA, the proportion of awards made in favour of employers has increased indicating that employers are becoming more conversant with the substantive and procedural requirements of a fair dismissal. However, two factors contribute to employees not receiving the benefits of awards in their favour: a high level of review applications brought in the Labour Court which take up to 2 years to resolve and the difficulties associated with the enforcement of the arbitration awards against non-compliant employers. Amendments seeking to address these issues were included in both the 2002 and 2014 LRA Amendment Acts, but the issues remain problematic and the need for further amendments has been raised by both the Labour Court and the CCMA.
• For example: Between 70 - 80% of disputes referred to the CCMA each year concern dismissals. Currently, the CCMA processes some 140 000 unfair dismissal cases annually. This figure excludes public service, local government, and private sector employees, as well as employees covered by 35 private sector Bargaining Councils, who are also accredited to facilitate disputes. It was envisaged by lawmakers (via the LRA) that reinstatement would be the primary remedy for workers dismissed without a valid and fair reason (i.e. substantively unfair).
• In practice, a relatively small number of employees are reinstated. This is true of both settlement agreements (10%) and Arbitration Awards (17%). Of the 140 000 dismissal disputes referred to the CCMA annually, roughly 2 000 result in an award of reinstatement. It is not known what proportion of these return to work with their former employer, but anecdotal evidence from the case law indicates that this is often a highly contested process.
• The low level of reinstatement orders has persisted despite the CCMA emphasising its importance as the primary remedy in its Guidelines for Misconduct Arbitrations and in its Job Retention Strategy. Reasons cited for the low level of reinstatement include the fact that a high proportion of cases are in the domestic work context (affecting mostly African women) or small businesses, where reinstatement may not be workable or appropriate. In addition, it is estimated that only 30% of dismissed workers seek reinstatement.
• The most common remedy for an unfairly dismissed worker is financial compensation. The average compensation award received in terms of an arbitration is four months’ remuneration. This applies to substantively unfair dismissals. The level of compensation in cases where there is only a procedural irregularity is significantly lower, and Arbitrators may decline to award compensation in such a case.
P Benjamin, (2007). “The Impact of the Decisions of the Labour Courts on the Operation of the CCMA”. Unpublished memo. School of Law: University of Cape Town (UCT).
130. NDP, 134-5.
131. The position in South Africa is often contrasted with countries such as the UK where there is a qualifying period for employers to receive full unfair dismissal protection. During this period, which is currently two years, but has been as short as six months, employees are protected against automatically unfair dismissals such as discrimination and anti-union victimisation but do not have the “ordinary” unfair dismissal protections.
See: A Van Niekerk, (2007).
H Cheadle, (2006). “Regulated Flexibility and Small Business: Revisiting the LRA and the BCEA”. DPRU, University of Cape Town. Working Paper 06/109. http://www.dpru.uct.ac.za/wp-06109-regulated-flexibility-and-small-business-revisiting-lra-and-bcea
H Bhorat and H Cheadle (2009). Note 132 above.
Working Paper 09/139, University of Cape Town (UCT)
https: //www.researchgate.net/publication/254401649_Labour_Reform_in_South_Af rica_Measuring_Regulation_and_a_Synthesis_of_Policy_Suggestions 2009
J Levinsohn. ‘How a wage subsidy can alleviate South Africa’s youth unemployment’. The Conversation. 18 Sept. 2015.
A Altbeker. “Harambee Youth Employment Accelerator: A Public-Private Partnership Aimed at Increasing the Employment Prospects of Marginalised Young People in South Africa”. In Bhorat et al. Oxford Companion to Economics of South Africa (2014).
124
132. The position in South Africa is often contrasted with countries such as the United Kingdom (UK) where there is a qualifying period for employers to receive full unfair dismissal protection. During this period, which is currently two years, but has been as short as six months, UK employees are protected against automatically unfair dismissals such as discrimination and anti-union victimisation but do not enjoy ‘ordinary’ unfair dismissal protections.
133. In 2000, the Department of Labour proposed that the statute should regulate probation expressly, as there was a concern that arbitrators and judges were giving insufficient recognition to the provisions on probation in Code. This change was not made following trade union opposition.
• The Code was revised in 2002 by including terminology to the effect that a termination during probation could be justified on “less-compelling grounds” than would otherwise apply.
• This formulation has been criticised because it gives insufficient guidance and because it only applies to the employees’ performance and suitability for employment. In addition, the procedural obligations to counsel employees on their performance during probation are difficult to comply with for all but the largest of employers.
• This concern, which is most evident in sectors such as security and contract cleaning, has to a large extent been addressed by the new legislative framework for fixed-term contracts introduced in 2015.
• These amendments aimed at preventing long-term abuses of triangular employment and fixed-term contracts have also limited the period during which these forms of employment could be used for probationary purposes, to three months.
• A lack of clarity concerning employer obligations during an initial period of probation, coupled with the high level of referral of dismissal disputes to the CCMA and the associated risks, serves to discourage employers from engaging new employees.
See: H Cheadle, (2006) Note 135 above.
134. A proposal in 2000 to permit the CCMA to charge a user fee to higher-paid employees was rejected at NEDLAC.
• This proposal would both have enabled the CCMA to raise supplemental revenue, as well as limit its caseload.
• A proposal contained in the 2012 LRA Amendment Bill to limit the protection of higher-paid employees in respect of unfair dismissal to reduce the caseload of the CCMA was agreed at NEDLAC, but rejected by the Parliamentary Portfolio Committee on the erroneous basis that it violated the constitutional protection of equality.
• The memorandum justifying the amendment argued that, the limitation of the rights of senior management and professional employees will both contribute to employer flexibility and lessening inequality by reducing the bargaining power of senior employees.
See:
A. H Bhorat and H Cheadle (2009). Note 132 above.
B. P Benjamin, (2007). The Impact of the Decisions of the Labour Courts on the Operation of the CCMA. Unpublished memo. School of Law: University of Cape Town (UCT).
135. The CCMA in the 2015 / 2016 financial year undertook a study considering the CCMA’s caseload and referral trends. The study found that an estimated 60% of the CCMA’s referrals originate from small businesses (CCMA Annual Report, 2016). http://ccmarecovery.syncrony.com/About-Us/Reports-Plans/Annual-Reports
This revealed some long-standing issues relating to the labour regulation challenges faced by small business. The first, is that small businesses are faced with key capacity challenges when it comes to labour relations and this has an upward impact on the CCMA’s caseload. The second, and more importantly for the purposes of job creation, these capacity challenges (especially in relation to labour regulation) are a key impediment to the formalisation of small businesses and their willingness to employ additional workers.
136. TIPS: “Final Report: Regulatory Burdens on Small Business: Options For Improvement”, Trade and Industrial Policy Strategies, April 2017. https://www.tips.org.za/
137. The Skills Development Levies Act (No. 9 of 1999) (SDLA) requires employers to pay a Skills Development Levy of 1% of their payroll.
125
138. As a result, smaller businesses are increasingly required to pay the SDL. The level of administration involved does not make it feasible for employers substantially above the threshold, to recover mandatory grants. The failure to adjust the SDL threshold since 2005 is especially anomalous because SDLA has been amended on numerous occasions.
139. In this regard, it must be noted that the Minister is already empowered to alter the rate at which the SDL is calculated.
140. I Valodia, D Francis. 2016. “How the Search for a National Minimum Wage Laid Bare South Africa’s Faultline’s”. The Conversation, November 2016. https://theconversation.com/how-the-search-for-a-national-minimum-wage-laid-bare-southafricas-faultlines-69382
141. S Godfrey, (2018). “Multi-employer collective bargaining in South Africa”. ILO Working Paper. Conditions of Work and Employment
Series, No. 97.
142. This is a project resulting from the Presidential Jobs Summit, 2018. The tool went live in January 2019, with its launch phase having up to date information on the National Minimum Wage Act and other labour laws. The tool also has other resources such as contract templates, information sheets and guides on labour law requirements. The next phase of the tool (to be launched in 2019/20) will focus on building sound workplace relationships, job retention (with support from Productivity SA) and support aimed at ensuring greater compliance with employment equity provisions (CCMA, 2019: 16).
143. The authors of this study suggest that further research should be undertaken in respect of “rent-seeking” behaviour by providers of labour law and HR services. They point out that their conclusions are consistent with an approach in terms of which external providers paint a “dark” picture of labour law requirements for the benefits of their practice. “Labour regulation and demand for workers in South Africa”. M Bertrand and B Crépon. https://www.povertyactionlab.org/evaluation/labor-regulation-and-demand-workers-south-africa
144. NDP, 2012:133
145. D Mazumdar and D van Seventer, (2002-03) “A Decomposition of Growth of the Real Wag Rate for South Africa. 1970 – 2000”.
DPRU. Working Paper 02/63, University of Cape Town (UCT). https://open.uct.ac.za/handle/11427/7204
See also: M Altman, “Wage Determination in South Africa: What Do We Know?” Transformation: Critical Perspectives on Southern Africa 60(1): 89. January 2006.
146. Stats SA, 2019
147. Following from the publication of the NDP in 2012, former President Jacob Zuma in his 2014 State of the Nation Address urged social partners (government, business, labour and community) at NEDLAC to explore issues of wage inequality alongside the contentious issue of violence around strikes and the duration of these industrial actions. Social partners then convened a Labour Relations Indaba which subsequently arrived at the Ekurhuleni Declaration. The Declaration, for the purposes of our discussion suggested that ‘wages are the most important component of income for South Africa’s working people’ (Valodia et al, 2016:14) Moreover, the declaration suggested that alongside chronic unemployment, a legacy of low wages was one of the biggest drivers of poverty and inequality. At the Indaba, the constituents committed to engaging on the modalities of introducing a national minimum wage and for our purposes in the subsequent discussion also exploring ways of reducing pay differentials. A wage inequality task team was then established, which coordinated the work towards the Ekurhuleni commitments. https://www.gov.za/state-nation-address-2014
148. This level in 2016, fell above the pay of 6.2million workers or just under 48% of the workforce, including 90.7% of domestic workers and 84.5% of agricultural workers.
See: I Valodia et al, (2016). “A National Minimum Wage for South Africa - Recommendations on Policy and Implementation National Minimum Wage Panel Report To The Deputy President”.
http://www.treasury.gov.za/publications/other/NMW%20Report%20Draft%20CoP%20FINAL.PDF
126
149. Following from the publication of the NDP in 2012, former President Jacob Zuma in his 2014 State of the Nation Address urged social partners (government, business, labour and community) at NEDLAC to explore issues of wage inequality alongside the contentious issue of violence around strikes and the duration of these industrial actions. Social partners then convened a Labour Relations Indaba which subsequently arrived at the Ekurhuleni Declaration. The Declaration, for the purposes of our discussion suggested that ‘wages are the most important component of income for South Africa’s working people’ (Valodia et al, 2016:14) Moreover, the declaration suggested that alongside chronic unemployment, a legacy of low wages was one of the biggest drivers of poverty and inequality. At the Indaba, the constituents committed to engaging on the modalities of introducing a national minimum wage and for our purposes in the subsequent discussion also exploring ways of reducing pay differentials. A wage inequality task team was then established, which coordinated the work towards the Ekurhuleni commitments. https://www.gov.za/state-nation-address-2014
This level in 2016, fell above the pay of 6.2million workers or just under 48% of the workforce, including 90.7% of domestic workers and 84.5% of agricultural workers.
See: I Valodia et al, (2016). “A National Minimum Wage for South Africa - Recommendations on Policy and Implementation National Minimum Wage Panel Report To The Deputy President”.
http://www.treasury.gov.za/publications/other/NMW%20Report%20Draft%20CoP%20FINAL.PDF
150. Astral Integrated Report, for the year ended 30 September 2019.
https: //www.astralfoods.com/assets/Documents/Investor%20Centre/2019/Astral-annual-report-2019.pdf
151. Of 443 applications affecting 50 640 workers, 284 were granted, 2 were withdrawn, 132 were refused, 10 had outstanding documents, and 16 were still being audited. DoEL, 2019.
152. Section 27 of the Employment Equity Act: Section 27: Every designated employer, when reporting in terms of Section 21(1) and (2), must submit a statement, as prescribed, to the Employment Conditions Commission established by Section 59 of the Basic Conditions of Employment Act, on the remuneration and benefits received in each occupational category and level of that employer’s workforce.
153. Mkalipi, 2019. Interview
154. Martin Wittenberg and Andrew Kerr (2019). “Wage determination in South Africa: The case of the union wage premium since the end of apartheid” REDI3x3 Working Paper 56.
https://www.redi3x3.org/sites/default/files/Wittenberg%20%26%20Kerr%202019%20REDI3x3%20Working%20Paper%2056%20The%20union%20wage%20premium%20in%20SA.pdf
H Bhorat, Op-ed: Financial Mail, 27 June 2019. https://www.businesslive.co.za/fm/opinion/on-my-mind/2019-06-27-haroon-bhorat-sas-missing-middle/
155. I Valodia, D Collier, A Cawe, M Lijane, S Koyana, M Leibbrandt, D Francis (2016) “A National Minimum Wage for South Africa”. Paper prepared for NEDLAC. http://new.nedlac.org.za/wp-content/uploads/2016/11/NMW-Report-Draft-CoP-FINAL1.pdf
I Valodia, and D Francis (2016). ‘How the search for a national minimum wage laid bare South Africa’s Faultline’s’.
https://theconversation.com/how-the-search-for-a-national-minimum-wage-laid-bare-south-africas-faultlines-69382
Jobs Summit, 2018: http://nedlac.org.za/jobs-summit-2018/
156. Mkalipi, August 2019. Interview
157. The 2018-2019 CEE Annual Report measures transformation against national economically active population (EAP) by population group which is 78% percent African, 9.6% coloured, 2.7% Indian, and 9% White. CEE report 2018-2019 14 citing Statistics South Africa, Quarterly Labour Force Survey (QLFS) (Quarter 3 2018). CEE 2019
https://www.gov.za/sites/default/f iles/19th%20CEE%20REPORT%20SUMMARY%20FACT%20SHEET%2021.06.2019.pdf
https://www.labourguide.co.za/workshop/1692-19th-cee-annual-report/file
127
158. CEE report 20.18-2019 The statistics are derived from the 27 485 employment equity reports submitted to the government in 2018 by designated employers who employed a total of 7 415 876 employees.
http://www.engineeringnews.co.za/article/transformation-lagging-in-private-sector-minister-calls-for-crackdown-on-culprits-2019-08-27/rep_id:4136
159. Section 12(1B) of the UIAA, 2016. Unemployment Insurance Amendment Act (Act No. 10 of 2016)
160. According to the DHET Annual Performance Plan 2019/20, there were 1 036 984 students enrolled in the 2017 academic year, a 2.3% improvement on 2014 figures (969 155).
http://www.dhet.gov.za/Strategic%20Plans/Annual%20Perfomance%20Plans/Department%20of%20Higher%20Education%20and%20Training%202018_19%20Annual%20Performance%20Plan.pdf
http://www.dhet.gov.za/SiteAssets/Media%20Release%20and%20Statements%202019/DHET%202019_20%20Annual%20Performance%20Plan.pdf
161. CEE 2015-2016 and 2017-2018 Annual Reports:
https://www.abp.org.za/wp-content/uploads/2019/07/Commission-for-Employment-Equity-Annual-Report-2015_2016.pdf
https://www.abp.org.za/wp-content/uploads/2018/07/Commission-for-Employment-Equity-18th-Annual-Report.pdf
162. Commission for Employment Equity Annual Report 2016–2017, 4.
163. NDP, 2012: 136.
164. See GN 992 GG 41922 of 21 September 2018.
https://www.greengazette.co.za/documents/national-gazette-41922-of-21-september-2018-vol-639_20180921-GGN-41922
And see GN 993 GG 41923 of 21 September 2018.
https://www.greengazette.co.za/documents/national-gazette-41923-of-21-september-2018-vol-639_20180921-GGN-41923
Note: These racial classifications are used by Stats SA and are included in the EEA.
165. In August 2019, the Minister announced that it would be fast-tracked, because of the slow pace of workplace transformation required the government to ‘resort to harsh measures to ensure transformation’ in workplaces. A 20-year review of the implementation of the EEA also emphasises the lack of progress made in relation to the equitable representation of Africans, coloureds and persons with disabilities in the middle to upper occupational levels, relative to the demographics of the EAP. Women have still been poorly represented at senior management level, and people with disabilities are poorly represented across all sectors of the economy. The 20-year Review emphasises the following:
• Most employers deliberately set low targets with long-term benchmarks as there were no visible incentives or sanctions for non-compliance;
• Employers still benefited unfairly financially by accessing state contracts despite non-compliance and a lack of commitment and willingness to transform and create equal opportunities for many designated groups in their organisations, several; and
• Penalties for non-compliance that had been increased by the 2013 amendments to the EEA had not yielded positive results as most of the non-compliant employers were prepared to pay fines for non-compliance in out-of-court settlements.
https://www.dpme.gov.za/publications/20%20Years%20Review/Pages/Background-Reports.aspx
166. It is also proposed to amend the EEA to clarify that a designated employer’s compliance with its obligations to implement affirmative action may be measured against the demographic profile of either the national or regional EAP. In addition, compliance may be measured against an employer’s compliance with sectoral targets set by the Minister in terms of Section15A.
128
167. Section 27 of the EEA provides that a “designated employer” means--
• an employer who employs 50 or more employees;
• an employer who employs fewer than 50 employees, but has a total annual turnover that is equal to or above the applicable annual turnover of a small business in terms of Schedule 4 to this Act;
• a municipality, as referred to in Chapter 7 of the Constitution;
• an organ of state as defined in Section 239 of the Constitution, but excluding local spheres of government, the National Defence Force, the National Intelligence Agency and the South African Secret Service; and
• an employer bound by a collective agreement in terms of Section 23 or 31 of the Labour Relations Act, which appoints it as a designated employer in terms of this Act, to the extent provided for in the agreement;
“designated groups” means—
• black people, women and people with disabilities - “black people”-- is a generic term which means Africans, Coloureds and Indians.
168. Altman and Valodia, 2006:5 - Where to for the South African Labour Market? Some ‘Big Issues’ Article (PDF Available) in Transformation Critical Perspectives on Southern Africa 60(1):1-5 · January 2006.
169. H Wolpe (1972) “Capitalism and Cheap Labour Power in South Africa: from segregation to apartheid”, in Economy & Society. 425.
170. DPME Annual Report, 2018-2019:52.
https://www.dpme.gov.za/publications/Strategic%20Plan%20and%20Annual%20Reports/DPME%20Annual%20Report%202018_2019.pdf
171. Coleman suggests that notwithstanding some gains in the provision of a social wage in the democratic period, non-wage pressures continue to be a huge issue for low paid workers’ (Coleman, N (2013) “Towards new collective bargaining, wage and social protection strategies in South Africa. Learning from the Brazilian experience”. Global Labour University Working Paper no.17, International Labour Organization (ILO), Geneva.
172. One in four people suffer hunger, with poor households having to spend nearly 50% of their income on food. Food insecurity was more pronounced in the relatively poorer provinces of the Eastern Cape and Limpopo. However, this is not just a rural phenomenon but also a challenge to many people living in urban informal settlements and townships. Oxfam, (2014) “Hidden Hunger in South Africa, The Faces of Hunger and Malnutrition in a Food-Secure Nation” https://www.oxfam.org/en/research/hidden-hunger-south-africa
173. DPME Annual Report, 2019:59
174. Kerr, A. (2015). “Tax(i)ing the poor? Commuting costs in South Africa”. A Southern Africa Labour and Development Research Unit Working Paper Number 156. Cape Town: SALDRU, University of Cape Town
175. The recent Land Transport Market Inquiry by the Competition Commission has raised these issues, and more needs to be done to disincentivise urban sprawl in the planning of human settlements and transport route networks. This not only has adverse impacts on household incomes, but also on firm level productivity and the quality of life enjoyed by many poor households. Public Passenger Transport Market Inquiry http://www.compcom.co.za/public-passenger-transport-market-inquiry-2/
176. Department of Labour 2017, Strategic Plan 2014-2019. www.dl.gov.za
177. The COIDA Compensation Fund reported in 2010 - 2011 that it had developed a draft rehabilitation, reintegration, and return-to-work policy. UIF Strategic Plan 2011 available at https://pmg.org.za/committee-meeting/12812/
178. In 2019, the North Gauteng High Court held that the continued exclusion of domestic workers from COIDA was unconstitutional and has ruled that this order should operate retrospectively. Mahlangu and Another v Minister of Labour and Others (unreported). Gauteng Division, Pretoria. Case No.: 79180/15, 23 May 2019.
129
https://www.seri-sa.org/index.php/latest-news/917-litigation-update-high-court-declares-the-exclusion-of-domestic-workers-from-legislation-aimed-at-protecting-workers-as-unconstit-utional-24-may-2019
179. Christopher Webb (2016), Profiting from Poverty in South Africa.
http://roape.net/2016/08/30/profiting-poverty-debt-finance-social-grants-south-africa/
180. NDP, 2012:364
181. NDP, 2012: 366
182. These provinces have a larger proportion employed people than in urban provinces (Coleman, 2019). New recruitment may not have grown at a rate comparable to the scale of those who left. For instance, the Free State had less than a thousand employees in 2018 than 2006/7 (but having lost more than 5000 employees since 2011). There was an increase of over 13 000 employees in national departments due to the reorganisation of key functions within national departments (National Treasury Annual Report, 2019).
183. National Treasury Annual Report, 2019:60
184. The Minister of Public Service and Administration, Senzo Mchunu suggested that despite a growing discourse on a bloated public service, ‘if you go to any hospital, they talk about shortages… which are frontline services for the people of South Africa, it’s hard to find any bloated situation’ Mchunu, 2019 https://www.gov.za/speeches/public-service-and-administration-24-jul-2019-0000
185. In this regard, in the 2019 February Budget, delivered by Minister Tito Mboweni, R1 Billion has been dedicated to raise the wages of community health workers to R3 500. National Treasury (PERSAL data) and NPC, 2012:132
186. The number of public servants earning R1 million a year increased from 9 600 in 2006/7 to 29 000 in 2018/19, increasing spending on this category of workers from R5.8billion to R38 billion respectively. Medium Term Budget Policy Statement 2019 (page 60), National Treasury, Republic of South Africa, 30 October 2019.
http://www.treasury.gov.za/documents/mtbps/2019/mtbps/FullMTBPS.pdf
https://www.businesslive.co.za/bd/economy/2019-10-30-read-in-full-tito-mbowenis-2019-medium-term-budget-speech/
187. E K Hassen, M Altman (2019). ‘Employment scenarios for the public service in South Africa’.
https://www.researchgate.net/publication/331639693_Employment_scenarios_for_the_public_service_in_South_Africa
Mchunu, 2019
188. “Paper tigers to leap frogging?” EK Hassen, South African Labour Bulletin (SALB) 27 (2), 18-21.
189. NDP, 2012:132
190. The system currently operates on a three-year multi-term agreement that adjusts salaries and outlines improvements in the conditions of service over a three-year period. This is done to align the agreements to the medium-term expenditure framework (MTEF) time horizon. This is done through a negotiation process between public sector unions and the state at the Public Service Co-ordinating Bargaining Council (which consists of the DPSA and the following public sector unions – SADTU, NEHAWU, POPCRU, DENOSA, PSA, NAPTOSA, HOSPERSA/NUPSAW/NATU and SAPU) (PBSC, 2017).
191. Altman and Hassen, “Public service employment and job creation in South Africa”. Unpublished report, 2010. Centre for Employment, Poverty and Growth, HSRC.
192. National Treasury Annual Report, 2018: 51
193. Madubula, N and Dawood, G. 2013. “Managing the provincial wage bill to contain fiscal stress and build a capable State”, Chapter 4, Submission for the 2014/15 Division of Revenue 2014/15).
194. DPSA Annual Report, 2017-18
http://www.dpsa.gov.za/dpsa2g/documents/institutional/DPSA%20Annual%20Report%202017_2018.pdf
195. National Treasury Annual Report, 2017-2018
http://www.treasury.gov.za/publications/annual%20reports/national%20treasury/nt%20annual%20report%202017-18.pdf
130
196. The Minister of Public Service and Administration suggested “…on this matter (of early retirement, severance packages and grade 0), there are matters that are at the Bargaining Chamber. We want to go back to them, on the issue of early retirements so that we understand one another, and we are all on board on this matter. We have agreed that we must go back to the employer and explains ourselves” (Mchunu, Interview, 02 September 2019).
197. In a context where the National Planning Commission (NPC) felt that, ‘the current system of managing disputes in essential services such as health, education and policing does not enable public-sector productivity’. NDP, 2012: 133
198. For e.g. a former NPC Commissioner (Bobby Godsell) said ‘… it seems to me that the education unions should be as concerned about the quality of education as parents are – that’s what I mean by developmental unionism. It’s taking ownership of consequences and seeing yourself as a partner in delivering good service …’ (Godsell, Interview, 21 October 2019).
199. ‘… I would have to say that in both the private and public sector, I think labour relations in 2019 are worse than they were in 1989. The major reason for this is that leadership in both sectors have abdicated collective bargaining to low level, poorly trained and disempowered messengers’ (Godsell, Interview, 21 October 2019),
200. The Draft Bill on Public Administration Management, was tabled for public comment in June 2013, suggests that the ‘existing bargaining councils in the public administration will remain as separate bargaining councils, each with their own jurisdiction’ (DPSA Annual Report, 2013:128): http://www.dpsa.gov.za/dpsa2g/documents/institutional/2012-2013%20DPSA%20Annual%20Report.pdf)
Currently, these bargaining councils are built on three pillars of bargaining at central level in the PSCBC, sectoral bargaining platforms in sectoral councils and bargaining in provincial and parliamentary chambers. To what degree the current arrangement gives effect to the NDP proposal on separate chambers is open to debate. For instance, the General Public Service Sectoral Bargaining Council (GPSSBC) deals with matters that are not covered through sectoral bargaining in the councils for Education and Labour Relations, the Public Health and Social Development Sector or the Safety and Security Sectoral Bargaining Council. This suggests that sector-specific bargaining occurs, which is then centralised at PSCBC level. Perhaps the main challenge, relates to gaps in coverage. https://www.pscbc.co.za/
https://www.pscbc.co.za/index.php?option=com_docman&view=list&layout=table&slug=annual-reports&own=0&Itemid=273
As a senior official in the DPSA suggested, there remain some challenges in the functioning of these bargaining councils. Various inconsistencies in the scope of coverage remain, with an example made of administrative staff within the police service who did not receive sector-specific benefits negotiated in the sector, which focused on uniformed staff. In other cases, similar occupations were treated differently, such as nurses who are employed by the Department of Correctional Services, who fall under the scope of the health sector bargaining outcomes, yet school-based nurses do not. Ndaba suggested that this also had an impact on the incorrect application of OSDs, which led to financial difficulty (PMG, 2012). https://pmg.org.za/committee-meeting/14732/ See: Minister on Public Service Wage Negotiations 2012; Offices of the Premiers: Evaluation by Public Service Commission, 21 August 2012; Public Service Coordinating & Bargaining Council, and Centre for Public Service Innovation: Ministry & Entity briefings, 6 March2012
https://pmg.org.za/committee-meeting/14085/
201. COSATU and the PSA both point out that the NDP makes several errors in its discussion of the public service bargaining councils.
COSATU: Summary of Critique of the NDP, March 2013. www.cosatu.org.za
PSA: The Place of Labour in the Implementation of the NDP. Undated.
202. COSATU and the PSA both point out that the NDP makes several errors in its discussion of the public service bargaining councils. COSATU: Summary of Critique of the NDP, March 2013. www.cosatu.org.za PSA: The Place of Labour in the Implementation of the NDP. Undated.
203. NDP, 2012:133
204. https://www.nationalplanningcommission.org.za/
205. “… (it is) about bargaining about different issues. I would have thought that you would put together a school improvement plan on the collective bargaining table and get people to buy into this –
131
governing bodies, principals and the role of the district office’.
B Godsell, Interview, 21 October 2019. SADTU Press Release, 2013: http://www.sadtu.org.za/docs/pr/2013/pr0204.html
206. The early lessons and experiences from the RDP informed the expansion of the EPWP into a cross-cutting programme that is now implemented by all spheres of government and state-owned enterprises. The expansion in 2004 consolidated and expanded the early RDP ‘public works programme’ into a broad programme encompassing multiple activities (Samson, 2007). It is widely accepted that the EPWP in its current form grew out of the call for a Basic Income Grant (BIG).
207. The DBE and the Tiger Brands Foundation (TBF) have partnered to provide low cost and nutritious breakfasts in low-fee schools as part of the National School Nutrition Programme (NSNP). TBF provides breakfasts and monitors and provides relevant school specific data to the DBE, to strengthen the planning and institutional capacity of the DBE.
https://www.gov.za/minister-basic-education-and-ceo-tiger-brands-serve-10-millionth-breakfast
208. ‘… The point is, in a context of such depressed labour demand. The aim of the program is to provide employment in say, in the first phase was, the idea was that people would get skills that would provide a pathway into employment. But what’s been recognised is that if there’s no labour demand, then it can’t achieve that … public employment programmes are not a good mechanism for skilling people; and it’s difficult and expensive to integrate meaningful skills development in public employment…’ (Philips, Interview, 6 August 2019)
209. Samson, M., 2007, ‘When public works programmes create “Second Economy” conditions’, Africanus 37(2), 244–256. And see: Extended Public Works Programme & Job Creation Parliamentary Briefing, 14 September 2009
https://pmg.org.za/committee-meeting/10800/
210. I Valodia, L Lebani, C Skinner and R Devey (2002). “Low-waged and informal employment in South Africa”. Transformation: Critical Perspectives on Southern Africa.
211. Samson, M., 2007, ‘When public works programmes create “Second Economy” conditions’, Africanus 37(2), 244–256.
212. As such the Advisory Panel recommended that based on existing Ministerial sector determinations and fiscal considerations, that EPWP workers be excluded from the R20 / hour NMW proposed in 2016 (Valodia et al, 2016: 75). The EPWP has expanded into areas that were previously managed by local municipalities and other organs of state, and as such, the conditions within the EPWP ‘represent the thin edge of a fundamental transformation of the nature of public sector employment’.
Samson, M., 2007, ‘When public works programmes create “Second Economy” conditions’, Africanus 37(2), 244–256 (at 254). See https://mg.co.za/article/2016-11-28-how-the-search-for-a-national-minimum-wage-laid-bare-south-africas-faultlines/
213. F Fourie (2018). “Creating jobs, reducing poverty: Is ‘formalising’ the informal sector the answer?”, REDI3x3. www.hsrcpress.ac.za/books/the-south-african-informal-sector-providing-jobs-reducing-poverty.
214. ILO Recommendation 204, Transition from the Informal to the Formal Economy
https://www.ilo.org/ilc/ILCSessions/previous-sessions/104/texts-adopted/WCMS_377774/lang--en/index.htm
215. Work for a brighter future – Global Commission on the Future of Work International Labour Office – Geneva: ILO, 2019.
https://www.ilo.org/wcmsp5/groups/public/---dgreports/---
cabinet/documents/publication/wcms_662410.pdf
Also See:
https://harambee.co.za/
132
Altbeker, A. (2015). Harambee Youth Employment Accelerator: a Public-Private Partnership Aimed at Increasing the Employment Prospects of Marginalised Young People in South Africa. https://inclusive.growthlab.cid.harvard.edu/files/movingdevelopment/files/anthony_altbeker_harambee_youth_employment_accelerator_51.pdf
Altman, M. (2006). Wage Determination in South Africa: What Do We Know? IBSS Listed Journal, 60(1), 137. https://doi.org/ISSN 0258-7696
Altman, M., & Valodia, I. (2006). Where to for the South African labour market? Some ‘big issues.’ IBSS Listed Journa, 01, 137. https://doi.org/ISSN 0258-7696
Astral. (2009). Astral Intergrated Report: Annual Report. https://www.astralfoods.com/assets/Documents/Investor Centre/2019/Astral-annual-report-2019.pdf
Benjamin, P. (2013). Law and Practice of Private Employment Agency Work in South Africa (No. 292; 2013/292). https://www.ilo.org/wcmsp5/groups/public/---ed_dialogue/--sector/documents/publication/ wcms_231442.pdf
Benjamin, P., & Debbie, C. (2015). Measuring Labor Market Effi ciency. file:///C:/Users/Noluthando.Qwelani/Downloads/CollierandBenjaminChapterMeasuringLabourMarketEfficiency.pdf
Bhorat, H. (2019, June 27). HAROON BHORAT: SA’s missing middle. Financialisationmail, 1. https://www.businesslive.co.za/fm/opinion/on-my-mind/2019-06-27-haroon-bhorat-sas-missing-middle/
Bhorat, H., & Cheadle, H. (2009a). Labour Reform in South Africa: Measuring Regulation and a Synthesis of Policy Suggestions (No. 9; 09/139). https://citeseerx.ist.psu.edu/viewdoc/download?doi=10.1.1.570.9970&rep=rep1&type=pdf
Bhorat, H., & Cheadle, H. (2009b). Labour Reform in South Africa: Measuring Regulation and a Synthesis of Policy Suggestions (No. 09; 09/139). https://doi.org/ISBN No.: 978-1-920055-74-5
Bhorat, H., & Hodge, J. (1999). Decomposing Shifts in Labour Demand in South Africa’. The South African Journal of Economics. The South African Journal of Economics, 67(3), 155–168.
Bhorat, H., Jourdan, B., Kanbur, R., Rooney, C., Stanwix, B., & Woolard, I. (2015). Investigating the Feasibility of a National Minimum Wage for South Africa. https://ideas.repec.org/p/ctw/wpaper/201601.html
Bhorat, H., & Kan, S. (2018). Structural Change and Patterns of Inequality in the South African Labour Market (No. 01; 201801). https://doi.org/978-1-920633-18-9
Burger, P., Burger, R., Charman, A., Martha, C., Cichello, P., Ben, C., Andries, D. T., Katherina, G., Michael, G., Murray, L., Neil, L., Nwabisa, M., David, N., Leif, P., Kate, P., Eddie, R., Rogan, M., & Roubaud, F. (2018). The South African Informal Sector: Creating jobs, reducing poverty (F. C. S. Fourie (ed.)). HSRC Press. https://www.hsrcpress.ac.za/books/the-south-african-informal-sector-providing-jobs-reducing-poverty
Cassim, A., & Casale, D. (2018). How large is the wage penalty in the labour broker sector? (No. 48; 48/2018). https://doi.org/10.35188/UNU-WIDER/%0A2018/490-2
CCMA. (2016). Annual Report 2016/17. https://www.ccma.org.za/About-Us/Reports-Plans/Annual-Reports
Cheadle, H. (2006). Regulated Flexibility and Small Business: Revisiting the LRA and the BCEA”. DPRU, University of Cape Town (No. 06; 06/109).
Commission for Employment and Equity. (2015). 16th Commission for Employment Equity Annual Report 2015-2016. https://www.abp.org.za/wp-content/uploads/2019/07/Commission-for-Employment-Equity-Annual-Report-2015_2016.pdf
Commission for Employment and Equity. (2017). 18th Commission for Employment Equity Annual Report 2017-2018. https://www.abp.org.za/wp-content/uploads/2018/07/Commission-for-Employment-Equity-18th-Annual-Report.pdf
REFERENCES
133
Commission for Employment and Equity. (2018). 19th Commission for Employment Equity Annual Report 2018-2019. https://doi.org/ISBN: 978-0-621-47368-1
Commission for Employment and Equity. (2019). 20th Commission for Employment Equity Annual report 2019 - 20. http://www.labour.gov.za/DocumentCenter/Reports/Annual Reports/Employment Equity/2019 -2020/20thCEE_Report_.pdf
Conradie, B., Giles, G., Godfrey, S., Cooper, C., Cohen, T., Steenkamp, A., & Du Tiot, D. (2015). Labour Relations Law: A Comprehensive Guide (6th ed). LexisNexis.
Crankshaw, O. (1996). Changes in the racial division of labour during the apartheid era. Journal of Southern African Studies, 22(4), 633–656. https://www.tandfonline.com/doi/abs/10.1080/03057079608708516
DBE. (2013). Minister of Basic Education and CEO of Tiger Brands serve the 10 millionth breakfast. South African Governement. https://www.gov.za/minister-basic-education-and-ceo-tiger-brands-serve-10-millionth-breakfast
Department of Labour. (2018). Department of Labour Annual Report 2018/2019. https://www.gov.za/documents/department-labour-annual-report-20182019-26-aug-2019-0000
Department of Labour Annual Report. (2017). Department of Labour Annual Report 2017/2018. https://doi.org/ISBN: 978-0-621-46597-6
Department of Social Development. (2017). Comprehensive Social Security Reforms in South Africa. Parliamentary Monitoring Group (PMG). https://pmg.org.za/committeemeeting/24609/
DHET. (2017). DHET Annual Report for 2017/18. https://www.dhet.gov.za/Commissions Reports/DHET Annual Report 2017_18 .pdf
DHET. (2018a). DHET Annual Report 2018/19. http://www.dhet.gov.za/Strategic Plans/Annual Perfomance Plans/Department of Higher Education and Training 2018_19 Annual Performance Plan.pdf
DHET. (2018b). National Skills Fund Annual Report 2018/19. Department of Higher Education and Training
DHET. (2019a). Annual Perfromance Plan 2019/20. https://www.dhet.gov.za/SiteAssets/Media Release and Statements 2019/DHET 2019_20 Annual Performance Plan.pdf
DHET. (2019b). DHET Annual Report for 2019/20. http://www.dhet.gov.za/SiteAssets/Media Release and Statements 2019/DHET 2019_20 Annual Performance Plan.pdf
DoL. (2017). The Employment Tax Incentive in South Africa Input by the Department of Labour to the Standing Committee on Finance (SCoF). pmg.org.za%3Efiles
DPME. (2019). DPME Annual Report 2018/19. https://www.gov.za/documents/department-planning-monitoring-and-evaluation-annual-report-20182019-11-nov-2019-0000?gclid=Cj0KCQiAs5eCBhCBARIsAEhk4r5xImjF-2CxUXJMTuOO_9FqrpcP25zG6Lo-tF3xic6V1yMZA4Wsh-QaAroYEALw_wcB
DPSA. (2012). DPSA Annual Report 2012-13. http://www.dpsa.gov.za/dpsa2g/documents/institutional/2012-2013 DPSA Annual Report.pdf
DPSA. (2017). DPSA Annual Report 2017/18. http://www.dpsa.gov.za/dpsa2g/documents/institutional/DPSA Annual Report 2017_2018.pdf
Du Toit, D. (1997). “Industrial democracy in South Africa’s transition” [1997] LDD 4. Law, Democracy & Development Law Journal, 29. http://www.saflii.org/za/journals/LDD/1997/4.html
Du Toit, R. (2005). A review of labour markets in South Africa: career guidance and employment services. HSRC, 10, 30. http://hdl.handle.net/20.500.11910/6981
Godfrey, S. (2018). Multi-employer collective bargaining in South Africa”. ILO Working Paper. Conditions of Work and Employment (No. 97; 1018/97). https://www.ilo.org/wcmsp5/groups/public/---ed_protect/---protrav/---travail/documents/publication/wcms_632263.pdf
Govindjee, A., & Olivier, M. P. (2015). A CRITIQUE OF THE UNEMPLOYMENT INSURANCE AMENDMENT BILL, 2015. SAFLII, 18(7), 2. https://doi.org/eISSN 1727-3781
Gumede, V., & Mohautse, M. (2018). Economic and Social Inequalities in Democratic South Africa. In Social and Economic Inequalities (p. 25). https://www.vusigumede.com/content/VUSIGUMEDE 2018/
134
papers/Social %0A& Economic Inequalities in SA Book Chapter.pdf%0A
Guthrie, T. (2002). Transforming the Present — Protecting the Future”. Report of the Committee of Inquiry into a Comprehensive System of Social Security for South Africa (Vol. 18).
HAROON, B., & SAFIA, K. (2018). Structural Change and Patterns of Inequality in the South African Labour Market (No. 201801). https://doi.org/978-1-920633-18-9
Hassen, E.-K., & Altman, M. (2010a). Employment scenarios for the public service in South Africa. Journal of Southern African Studies (JOU), 1. file:///C:/Users/Noluthando.Qwelani/Downloads/GOV_EMP031_HassenAltman_public_service_employment_scenarios_jan10.pdf
Hassen, E.-K., & Altman, M. (2010b). Public Service Employement and Job Creation in South Africa. https://www.gtac.gov.za/publications-and-resources/hsrc-employment-research-papers
ILO. (2015a). international-labour-organization-adopts-historical-labourstandard-to-tackle-the-informal-economy. International Labour Organisation. https://www.ilo.org/ilc/ILCSessions/previous-sessions/104/media-centre/news/WCMS_375615/lang--en/index.htm
ILO. (2015b). Recommendation No. 204 concerning the Transition from the Informal to the Formal Economy. International Labour Organisation. https://www.ilo.org/ilc/ILCSessions/previous-sessions/104/texts-adopted/WCMS_377774/lang--en/index.htm
ILO. (2018). Republic of South Africa Decent Work Country Programme 2018 - 2023. https://www.ilo.org/wcmsp5/groups/public/---ed_mas/---program/documents/genericdocument/wcms_674579.pdf
ILO. (2019). Work for a brighter future – Global Commission on the Future of Work. https://doi.org/ISBN 978-92-2-132796-7
Jukka, P., & Ebrahim, A. (2019). Can a wage subsidy system help reduce 50 per cent youth unemployment?: Evidence from South Africa (No. 37; 2019-28). https://doi.org/978-92-9256-662-3
Kerr, A. (2015). Tax(i)ing the poor? Commuting costs in South Africa (No. 156).
Kerr, A., & Wittenburg, M. (2009). Wage determination in South Africa: The case of the union wage premium since the end of apartheid (No. 56; 2009/56). www.REDI3x3.org
Kruuse, H., & Whitear, N. (2019). The ethics of legal practitioners in resource-scarce institutions - PM Mashishi v Z Mdlala [2018] 17 BLLR 693 (LC); (2018) 39 ILJ 1607 (LC). Obiter, 40(2). https://journals.co.za/doi/pdf/10.10520/EJC-1936eafa89
Lamati, L. (2013). NDP Critique Summary. COSATU.
Levinsohn, J. (2015, September 18). How a wage subsidy can alleviate South Africa’s youth unemployment. The Conversation, 5. https://theconversation.com/how-a-wage-subsidy-can-alleviate-south-africas-youth-unemployment-46902
Lundall, P., & Bhorat, H. (2002). The South African labour market in a globalizing world: Economic and legislative considerations (Vol. 32). https://citeseerx.ist.psu.edu/viewdoc/download?doi=10.1.1.570.9970&rep=rep1&type=pdf
Madlala, P. C., & Govender, C. M. (1018). Current collective engagement stakeholder strategies for South African labour relations. SA Journal of Human Resource Management, 16(06), 14. https://sajhrm.co.za/index.php/sajhrm/article/view/909/1440
Madubula, N., & Dawood, G. (2013). Managing the provincial wage bill to contain fiscal stress and build a capable State (p. 17). http://citeseerx.ist.psu.edu/viewdoc/download?doi=10.1.1.434.4263&rep=rep1&type=pdf
Makgetla, N. (2016). Using the UIF Surplus as part of a stimulus package. www.tips.org. za
Marianne, B., & Bruno, C. (2020). Teaching Labor Laws: Evidence From a Randomized Control Trial in South Africa [University of Chicago]. https://www.povertyactionlab.org/sites/default/files/research-paper/working-paper_604_Teaching-Labor-Laws_South-Africa_Apr2020_1.pdf
Mazumdar, D., & van Seventer, D. (2002). A Decomposition of Growth of the Real Wage Rate for South Africa: 1970 - 2000 (No. 02; 02-063). https://doi.org/ISBN 0-7992-2116-3
Mncwango, B., Visser, M., & Ngandu, S. (2016). Understanding occupational choices of low-skilled workers in South Africa. http://hdl.handle.net/20.500.11910/10215
135
Moeletsi, T. (2017). South Africa’s Youth Unemployment and the Employment Tax Incentive: An Empirical Re-evaluation [University of Witwatersrand]. https://pdfs.semanticscholar.org/dd59/ f1d79f89c5e44e7ee996d33f4c258e8f59d9.pdf
National Minimum Wage Panelist. (2016). A National Minimum Wage for South Africa.
National Planning Commission. (2012a). Economy and Employment. In National Development Plan- Our Future Make it work (pp. 136–463). South African Governement.
National Planning Commission. (2012b). Overview. In National Development Plan- Our Future Make it work (p. 42). South African Governement. https://www.gov.za/issues/national-development-plan-2030
National Planning Commission. (2012c). Positioning South Africa in the World. In National Development Plan- Our Future Make it work (pp. 235–259). South African Governement. https://www.gov.za/issues/national-development-plan-2030
National Planning Commission. (2012d). Social Protection. In National Development Plan- Our Future Make it work (pp. 364–366). South African Governement. https://www.gov.za/issues/national-development-plan-2030
National Treasury. (2017). 2017 Medium Term Budget Policy Statement (Issue 26 October). www.treasury.gov.za
National Treasury. (2018). 2018/19 National Treasury Annual Report Vote 7. https://www.gov.za/documents/national-treasury-annual-report-20182019-20-sep-2019-0000
National Treasury. (2019). National Treasury Annual Report 2019/2018. http://www.treasury.gov.za/publications/annual reports/national treasury/nt annual report 2018-19.pdf
Ngandu, S., & Chisadza, C. (2018). Employer characteristics and youth employment outcomes in the formal sector in South (No. 82; 82/2018).
Constitutional Court of South Africa, (2007). http://www.saflii.org/za/cases/ZACC/2007/15.pdf
NIEKERK, A. VAN. (2007). Regulating Flexibility and Small Business: Revisiting the LRA and BCEA-A Response to Halton Cheadle’s Concept Paper (No. 07; 07/119). https://doi.org/ISBN: 978-1-920055-41-7
NIEKERK, A. VAN. (2015). Speedy Social Justice: Streamlining the Statutory Dispute Resolution Processes. Juta, 837, 837. https://heinonline.org/HOL/LandingPage?handle=hein.journals/iljuta40&div=83&id=&page=
Nxesi, T. (2019). Employment and Labour Dept Budget Vote 2019/20. South African Governement; Department of Labour. https://www.gov.za/ speeches/department-employment-and-labour-budget-vote-28-10-jul-2019-0000
NYDA. (2017). Annual Report 2017/18. http://www.nyda.gov.za/Portals/0/Downloads/Publications/NYDA_AnnualReport2017-18.pdf
NYDA. (2018). NYDA Annual Report, 2018-2019. http://www.nyda.gov.za/Portals/0/Downloads/Publications/NYDA ANNUAL REPORT 201819 LR FNL 2.pdf
Odendaal, P. J. L. (2015). A comparative analysis of the Employment Tax Incentive Act, No. 26 of 2013 [University of Cape Town]. https://open.uct.ac.za/handle/11427/20727
Parks, M. (2017). Signing of the Unemployment Insurance Amendment Act welcomed – COSATU. Politicsweb. https://www.politicsweb.co.za/politics/signing-of-the-unemployment-insurance-amendment-ac
PMG. (2011). Analysis Of SETA Performance & Challenges: Higher Education, Science And Technology, 19 April 2011. Parliamentary Monitoring Group (PMG). https://pmg.org.za/committee-meeting/12912/
PMG. (2012). Minister on Public Service Wage Negotiations 2012; Offices of the Premiers: Evaluation by Public Service Commission. Parliamentary Monitoring Group (PMG). https://pmg.org.za/committee-meeting/14732/
PMG. (2017). Department of Labour on its 2015/16 Annual Report. Parliamentary Monitoring Group (PMG). https://pmg.org.za/committee-meeting/23895/
PMG. (2019). Jobs Fund: National Treasury briefing. Parliamentary Monitoring Group (PMG). https://pmg.org.za/committee-meeting/28021/
136
Prinsloo, C. H., F.Arends, J.Roodt, J.Erasmus, G.Mokgatle, & K.Joynt. (2011). n assessment of the implementation of the Employment Services of South Africa (ESSA). EMPLOYMENT CREATION, EMPLOYMENT SERVICES OF SOUTH AFRICA (ESSA), UNEMPLOYMENT
PSA. (2015). The Place of Labour in the Implementation of the National Development Plan. https://www.psa.co.za/docs/default-source/psa-documents/psa-opinion/ndp-2_final_12_december_2015.pdf?sfvrsn=48d28dd_3
Ranchhod, V., & Finn, L. (2016). Estimating the Short Run Effects of South Africa’s Employment Tax Incentive on Youth Employment Probabilities Using a Difference-indifferences Approach (No. 134). https://docplayer.net/48748751-The-dimensions-of-youth-unemployment-in-south-africa.html
Samson, M. (2007). When public works programmes create “Second Economy” conditions’, Africanus. Unisa Press, Africanus(2), pp 244-256. https://doi.org/ISSN 0304.615X
SERI. (2019, May 24). High Court declares the exclusion of domestic workers from legislation aimed at protecting workers as unconstitutional. Socio-Economic Rights Institute of South Africa, 4. https://www.seri-sa.org/index.php/latest-news/917-litigation-update-high-court-declares-the-exclusion-of-domestic-workers-from-legislation-aimed-at-protecting-workers-as-unconstitutional-24-may-2019
Simons, M., & Simons, J. A. (1969). Class and Colour in South Africa 1850-1950 (R. Segal (ed.)). Penguin Books. https://www.sahistory.org.za/archive/class-and-colour-south-africa-1850-1950-h-j-and-r-e-simons
Smith, C. (2019). Jobs Fund: How we’re putting SA to work. Fin 24. https://www.news24.com/fin24/Economy/jobs-fund-how-were-putting-sa-to-work-20190414-2
South African Government. (639). National Gazette No. 41922. https://www.greengazette.co.za/documents/national-gazette-41922-of-21-september-2018-vol639_20180921-GGN-41922
South African Government. (2011). 2011 - President Zuma, State of the Nation Address. South African History Online. https://www.sahistory.org.za/archive/2011-president-zuma-state-nation-address-10-february-2011
The Nelson Manela Initiative. (2018). The Mandela Initiative: Dialogue and Action t Overcome Poverty and Inequality. Webfactory. https://mandelainitiative.org.za/
The Presidency. (2014). State of the Nation Address 2014. South African Governement. https://www.gov.za/state-nation-address-2014
The Presidency. (2018). Presidential Jobs Summit. FRAMEWORK AGREEMENT, 84. https://www.tralac.org/documents/resources/by-country/south-africa/2299-presidential-jobs-summit-framework-agreement-october-2018/file.html
TIPS. (2017). Special edition: the state of small business in south africa small business and industrial policy.
UIF. (2011). Unemployment Insurance Fund (UIF), Compensation Fund, National Economic Development and Labour Council (Nedlac) 2011 Strategic Plans. Parliamentary Monitoring Group (PMG). https://pmg.org.za/committee-meeting/12812/
UIF. (2015). Unemployment Insurance Fund (UIF) 2014/2015. https://doi.org/978-0-621-43641-9
UIF. (2017). Unemployement Insurance Fund 2017/18. https://static.pmg.org.za/UIF_annual_Report_20172018.pdf
Valodia, I., Debbie, C., Cawe, A., Mamokete, L., Koyana, S., & Francis, D. (2016). A National Minimum Wage for South Africa: Recommendations on Policy and Iplementation.
Valodia, I., & Francis, D. (2016, November 28). How the search for a national minimum wage laid bare South Africa’s faultlines. The Convocation, 5. https://theconversation.com/how-the-search-for-a-national-minimum-wage-laid-bare-south-africas-faultlines-69382
Watkins, G. (2017). COMMISSION FOR EMPLOYMENT EQUITY ANNUAL REPORT 2016 - 2017. Workinfo.Com. https://www.workinfo.com/index.php/articles/item/1804-commission-for-employment-equity-annual-report-2016-2017
Webb, C. (2016, August 30). Profiting from Poverty in South Africa. A Review of African Political Economy, 4. http://roape.net/2016/08/30/profiting-poverty-debt-finance-social-grants-south-africa/

137
Wolpe, H. (1995). Capitalism and Cheap Labour Power in South Africa. In W. Beinart & S. Dubow (Eds.), Segregation and Apartheid in Twentieth Century South Africa (1st Editio, p. 31). https://doi.org/10.1080/03085147200000023
Yengeni, L. (2015). UIF Labour Activation Programme: Department of Labour briefing. Parliamentary Monitoring Group (PMG). https://pmg.org.za/committee-meeting/21292/
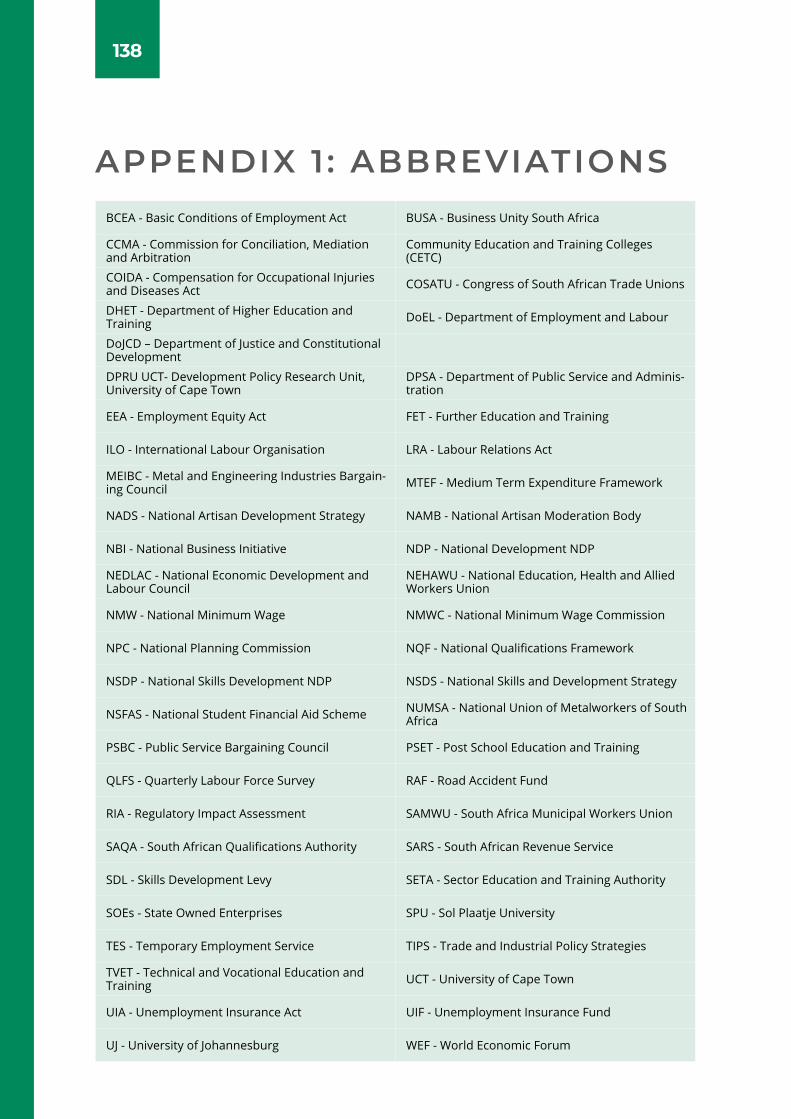
138
APPENDIX 1 : ABBREVIATIONS BCEA - Basic Conditions of Employment Act BUSA - Business Unity South Africa
CCMA - Commission for Conciliation, Mediation and Arbitration
Community Education and Training Colleges (CETC)
COIDA - Compensation for Occupational Injuries and Diseases Act COSATU - Congress of South African Trade Unions
DHET - Department of Higher Education and Training DoEL - Department of Employment and Labour
DoJCD – Department of Justice and Constitutional Development
DPRU UCT- Development Policy Research Unit, University of Cape Town
DPSA - Department of Public Service and Adminis-tration
EEA - Employment Equity Act FET - Further Education and Training
ILO - International Labour Organisation LRA - Labour Relations Act
MEIBC - Metal and Engineering Industries Bargain-ing Council MTEF - Medium Term Expenditure Framework
NADS - National Artisan Development Strategy NAMB - National Artisan Moderation Body
NBI - National Business Initiative NDP - National Development NDP
NEDLAC - National Economic Development and Labour Council
NEHAWU - National Education, Health and Allied Workers Union
NMW - National Minimum Wage NMWC - National Minimum Wage Commission
NPC - National Planning Commission NQF - National Qualifications Framework
NSDP - National Skills Development NDP NSDS - National Skills and Development Strategy
NSFAS - National Student Financial Aid Scheme NUMSA - National Union of Metalworkers of South Africa
PSBC - Public Service Bargaining Council PSET - Post School Education and Training
QLFS - Quarterly Labour Force Survey RAF - Road Accident Fund
RIA - Regulatory Impact Assessment SAMWU - South Africa Municipal Workers Union
SAQA - South African Qualifications Authority SARS - South African Revenue Service
SDL - Skills Development Levy SETA - Sector Education and Training Authority
SOEs - State Owned Enterprises SPU - Sol Plaatje University
TES - Temporary Employment Service TIPS - Trade and Industrial Policy Strategies
TVET - Technical and Vocational Education and Training UCT - University of Cape Town
UIA - Unemployment Insurance Act UIF - Unemployment Insurance Fund
UJ - University of Johannesburg WEF - World Economic Forum
139
APPENDIX 2: LIST OF RESPONDENT INTERVIEWS
Elias Kubheka (NUMSA)
Stephen Rathai (Department of Employment and La-bour)
Adv Luvuyo Boro (Essential Service Commit-tee)
Joyce Nkopane (Essential Service Committee) Anthony Altbeker (Consultant)
Rob Urquhart (Harambee Youth Employment Accelera-tor)
Carmel Marock (Singizi Consulting/Jobs Sum-mit)
Dr Carin Runciman (UJ) Ebrahim Khalil-Hassen (Independent Re-searcher)
Afzal Soodedaar (MEIBC Administrator) Isobel Frye (National Minimum Wage Com-mission)
Bobby Godsell (formerly National Planning Commission) Kate Phillip (TIPS)
Tanya Cohen (BUSA) Matthew Parks (COSATU)
Kaizer Moyane (Nedbank / BUSA) Minister Senzo Mchunu (DPSA)
Prof Haroon Bhorat (DPRU, UCT) Prof Richard Levin (DPSA)
Thembinkosi Mkalipi (Department of Employment and Labour)
Virgil Seafield (Department of Employment and Labour)
Laurie Warwick (CCMA) William Thompson (CCMA)
140
APPENDIX 3: A CASE STUDY ON EMPLOYMENT CREATION INCENTIVES THE HARAMBEE YOUTH EMPLOYMENT ACCELERATOR215
Harambee is a non-profit social enterprise founded in 2011 by Yellowwoods Social Investments. It partners with businesses, government, young work-seekers and others who are committed to building solutions and innovations to solve the challenges of youth unemployment. Harambee is also a recipient of the Jobs Fund, and since 2013, has received over R400 million in funding.
In the last seven years, Harambee has supported over 600 000 young work-seekers, partnered with 500 businesses, and facilitated pathways to work experiences for over 100 000 young work-seekers. While the initiative is far from the scale necessary to make a systemic dent on youth unemployment figures, there are valuable lessons that are instructive for policy development.
Demand-side Interventions
First, the Harambee approach considers which sectors are employing people with relatively limited skills (Matric or a Grade 9 certificate) followed by a brief training and mentoring process with a focus on developing psycho-so-cial skills and general functional attributes.215
Second, Harambee’s model is built on strong partnerships with industry stake-holders. Using rigorous matching tools and behavioural readiness programmes, suitability assessments are undertaken, and training is provided to prepare for interviews. Here the focus is less on previous work experience (if at all) or content knowledge, instead it is about fostering a dynamic understanding of young people.
• Industry partners (employers) are briefed on any other issue that may influence the ability of a work seeker to perform that job – for example, transport, learning and/or health needs, to reduce new hire turnover, improve retention rates and create a more inclusive workplace.
• At first, Harambee partnered with companies in ‘consumer facing’ industries in the finance, business services, retail and hospitality sectors. Now, these partners-hips also include sectors dealing with data science, Business Process Outsourcing (BPO), wholesale and trade.215
Third, Harambee has invested heavily in the collation of data to better understand the transition and work placement ecosystem of South Africa. Data is used to build algorithms that can triangulate and map where work-see-kers are and their proximity to work opportu-nities in the country.
• This is important, as geographic distance is one of the key socio-economic drivers of greater or lower participation by young people in the South African labour market.
• Apartheid spatial planning has meant that most work-seekers live far from urban centres and work hubs, requiring them to travel long distances daily, using public transport (bus, train) or private mini-bus taxis, neither of which is free. A recent study undertaken by Harambee and the University of Johannesburg found that work-seekers spend an average R500 a month on transport and data costs alone.215
• Data connectivity is also expensive in South Africa and most low-income work-seekers live in areas without unlimited data access or free wi-fi hubs/zones.215
Without addressing multiple socio-econo-mic factors also affecting job seeking and retention including safety for women and young girls using public/private transport, then skills development and the traditional pathways for job seeking, alone will not be effective for young people seeking work.215
141
Lessons from Harambee
• Socio-demographic attributes – it is important to examine who work-seekers are, and where they live versus where the work and training opportunities are.
• Behavioural attributes – behavioural and psycho-social attributes influence how younger work-seekers are socialised and oriented into the world of work.
• Distinction between high and low complexity jobs – there are different pathways into high and low complexity jobs, and for retention purposes too.
• Scale and complementarity – not all work-seekers need a ‘Harambee-type’ intervention. In some instances, young work-seekers require only short-term bridging interventions that are aimed at overcoming information asymmetries associated with job searching, even in non-urban centres (including opportunity identification, interview preparation, con-nectivity). However, this requires access to public facilities (libraries, rent offices, post offices, municipal centres inter alia) that can become effective touchpoints for in-formation-sharing in multiple languages.
EXPLORE DATA SCIENCES ACADEMY – A PARTNERSHIP WITH BCX
In September 2017, Telkom’s IT services subsidiary, BCX announced an investment of R50m in a new data sciences academy – Explore Data Sciences Academy (EDSA).
• EDSA planned to create 300 year-long internships over a period of three years, in response to the growing demand for ‘big data’ analytical skills.215
• The programme trains data scientists and analysts over one year without requiring any prior actuarial or data science expertise.215
Programmes of this nature will be important to scale up going forward, especially as learning coding, undertaking data analysis and other data collation and related skills become greater a priority, even for the basic education system.
THE INSTALLATION, REPAIR AND MAINTENANCE INITIATIVE – JOBS SUMMIT
Flowing from the 2018 Jobs Summit, Harambee and the National Business Initiative (NBI) jointly initiated and piloted a programme aimed at creating pathways for TVET college graduates into ‘installation, repair and maintenance’ occupations, across a wide range of sectors.215
To date, 438 TVET college students have been trained under this programme with a 58% job placement rate. The Ekurhuleni East TVET College has joined the initiative, and other TVET colleges may join shortly too.
However, the size of this initiative will not meet the scale required to achieve the targets set out in the NDP (30 000 artisans annually, by 2030). One way of addressing this is to link this type of initiative with investment funding available for special economic zones (SEZs) in the automotive and electronics sectors.
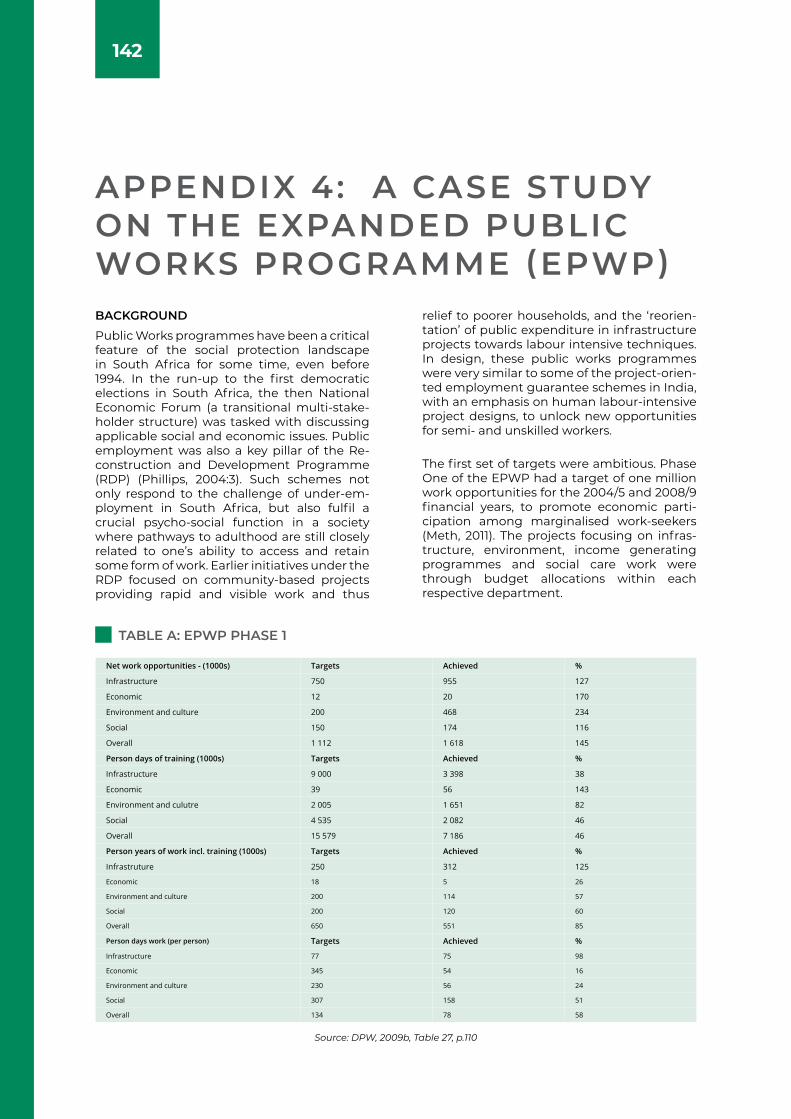
142
APPENDIX 4: A CASE STUDY ON THE EXPANDED PUBLIC WORKS PROGRAMME (EPWP)BACKGROUND
Public Works programmes have been a critical feature of the social protection landscape in South Africa for some time, even before 1994. In the run-up to the first democratic elections in South Africa, the then National Economic Forum (a transitional multi-stake-holder structure) was tasked with discussing applicable social and economic issues. Public employment was also a key pillar of the Re-construction and Development Programme (RDP) (Phillips, 2004:3). Such schemes not only respond to the challenge of under-em-ployment in South Africa, but also fulfil a crucial psycho-social function in a society where pathways to adulthood are still closely related to one’s ability to access and retain some form of work. Earlier initiatives under the RDP focused on community-based projects providing rapid and visible work and thus
relief to poorer households, and the ‘reorien-tation’ of public expenditure in infrastructure projects towards labour intensive techniques. In design, these public works programmes were very similar to some of the project-orien-ted employment guarantee schemes in India, with an emphasis on human labour-intensive project designs, to unlock new opportunities for semi- and unskilled workers.
The first set of targets were ambitious. Phase One of the EPWP had a target of one million work opportunities for the 2004/5 and 2008/9 financial years, to promote economic parti-cipation among marginalised work-seekers (Meth, 2011). The projects focusing on infras-tructure, environment, income generating programmes and social care work were through budget allocations within each respective department.
TABLE A: EPWP PHASE 1
Source: DPW, 2009b, Table 27, p.110
Net work opportunities - (1000s) Targets Achieved %
Infrastructure 750 955 127
Economic 12 20 170
Environment and culture 200 468 234
Social 150 174 116
Overall 1 112 1 618 145
Person days of training (1000s) Targets Achieved %
Infrastructure 9 000 3 398 38
Economic 39 56 143
Environment and culutre 2 005 1 651 82
Social 4 535 2 082 46
Overall 15 579 7 186 46
Person years of work incl. training (1000s) Targets Achieved %
Infrastruture 250 312 125
Economic 18 5 26
Environment and culture 200 114 57
Social 200 120 60
Overall 650 551 85
Person days work (per person) Targets Achieved %
Infrastructure 77 75 98
Economic 345 54 16
Environment and culture 230 56 24
Social 307 158 51
Overall 134 78 58
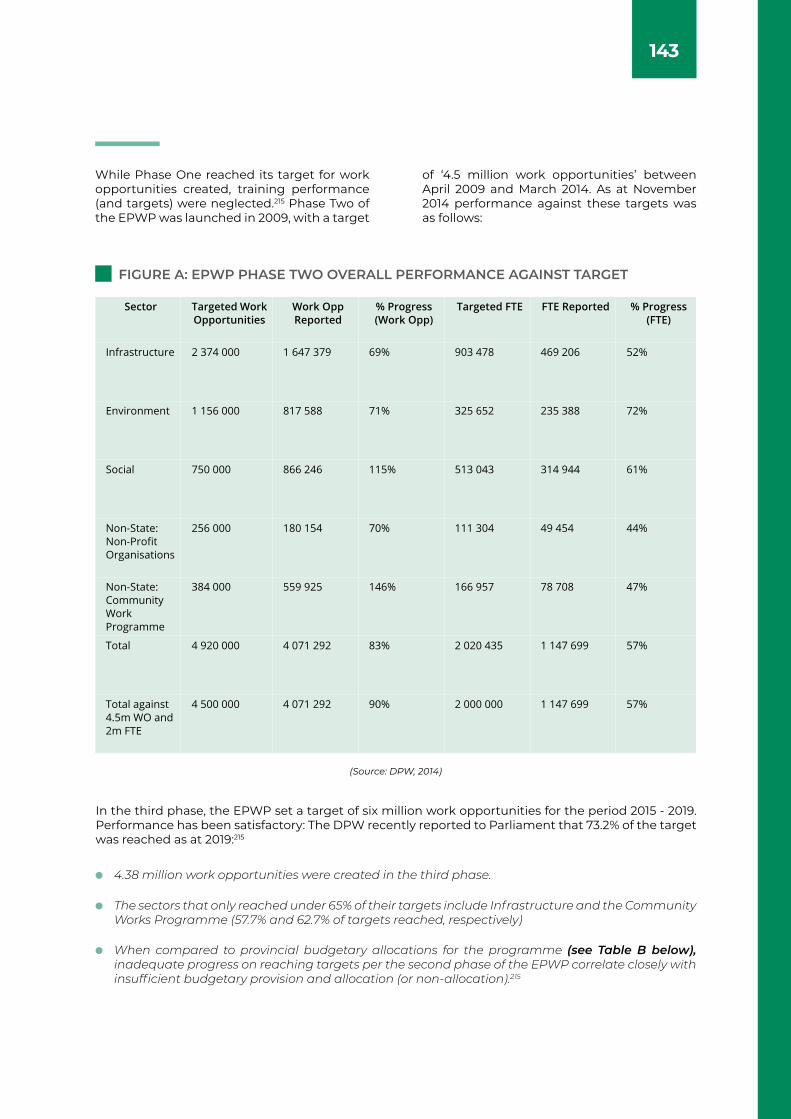
143
While Phase One reached its target for work opportunities created, training performance (and targets) were neglected.215 Phase Two of the EPWP was launched in 2009, with a target
of ‘4.5 million work opportunities’ between April 2009 and March 2014. As at November 2014 performance against these targets was as follows:
FIGURE A: EPWP PHASE TWO OVERALL PERFORMANCE AGAINST TARGET
Sector Targeted Work Opportunities
Work Opp Reported
% Progress (Work Opp)
Targeted FTE FTE Reported % Progress (FTE)
Infrastructure 2 374 000 1 647 379 69% 903 478 469 206 52%
Environment 1 156 000 817 588 71% 325 652 235 388 72%
Social 750 000 866 246 115% 513 043 314 944 61%
Non-State: Non-Profit Organisations
256 000 180 154 70% 111 304 49 454 44%
Non-State: Community Work Programme
384 000 559 925 146% 166 957 78 708 47%
Total 4 920 000 4 071 292 83% 2 020 435 1 147 699 57%
Total against 4.5m WO and 2m FTE
4 500 000 4 071 292 90% 2 000 000 1 147 699 57%
4.38 million work opportunities were created in the third phase.
When compared to provincial budgetary allocations for the programme (see Table B below), inadequate progress on reaching targets per the second phase of the EPWP correlate closely with insufficient budgetary provision and allocation (or non-allocation).215
The sectors that only reached under 65% of their targets include Infrastructure and the Community Works Programme (57.7% and 62.7% of targets reached, respectively)
In the third phase, the EPWP set a target of six million work opportunities for the period 2015 - 2019. Performance has been satisfactory: The DPW recently reported to Parliament that 73.2% of the target was reached as at 2019:215
(Source: DPW, 2014)
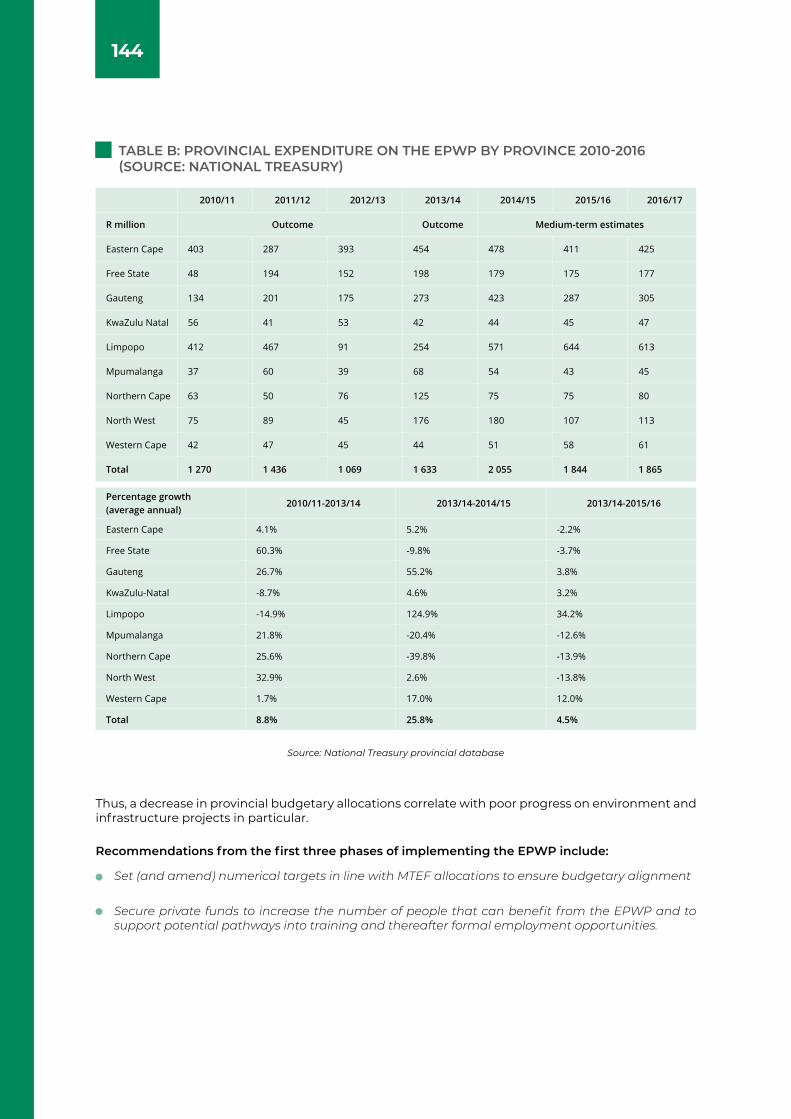
144
TABLE B: PROVINCIAL EXPENDITURE ON THE EPWP BY PROVINCE 2010-2016 (SOURCE: NATIONAL TREASURY)
Set (and amend) numerical targets in line with MTEF allocations to ensure budgetary alignment
Secure private funds to increase the number of people that can benefit from the EPWP and to support potential pathways into training and thereafter formal employment opportunities.
Thus, a decrease in provincial budgetary allocations correlate with poor progress on environment and infrastructure projects in particular.
Recommendations from the first three phases of implementing the EPWP include:
2010/11 2011/12 2012/13 2013/14 2014/15 2015/16 2016/17
R million Outcome Outcome Medium-term estimates
Eastern Cape 403 287 393 454 478 411 425
Free State 48 194 152 198 179 175 177
Gauteng 134 201 175 273 423 287 305
KwaZulu Natal 56 41 53 42 44 45 47
Limpopo 412 467 91 254 571 644 613
Mpumalanga 37 60 39 68 54 43 45
Northern Cape 63 50 76 125 75 75 80
North West 75 89 45 176 180 107 113
Western Cape 42 47 45 44 51 58 61
Total 1 270 1 436 1 069 1 633 2 055 1 844 1 865
Percentage growth (average annual)
2010/11-2013/14 2013/14-2014/15 2013/14-2015/16
Eastern Cape 4.1% 5.2% -2.2%
Free State 60.3% -9.8% -3.7%
Gauteng 26.7% 55.2% 3.8%
KwaZulu-Natal -8.7% 4.6% 3.2%
Limpopo -14.9% 124.9% 34.2%
Mpumalanga 21.8% -20.4% -12.6%
Northern Cape 25.6% -39.8% -13.9%
North West 32.9% 2.6% -13.8%
Western Cape 1.7% 17.0% 12.0%
Total 8.8% 25.8% 4.5%
Source: National Treasury provincial database
145
APPENDIX 5: HISTORY OF LABOUR BROKERS IN SOUTH AFRICALABOUR BROKERS
Budlender (2013) considers two distinct business models in the private sector placement industry. The first, is the recruitment and placement of individuals in permanent or temporary employment. The second, relates to what is colloquially referred to as ‘labour broking’, or ‘agency work’ interna-tionally. For the purposes of our discussion, we will consider (even in the context of long-term placements) both business models under the term Temporary Employment Services (TES). Much of the social dialogue and legislative shifts around the placement sector in the last few years have focused on regulating ‘rogue elements’ within the TES sector. The term is also that often used in the empirical literature (see Bhorat, 2015 and Leibrandt and Ranchod, 2015), especially insofar as it is a significant employer of unskilled and semi-skilled workers and the youth. While employing a crucially vulnerable segment of the economically active population (those with limited skill and youth), national statistical exercises do not probe whether workers are employed through TES (Bhorat et al, 2016). This is an area of concern.
We also consider these TES workers, as the bulk of unskilled production workers more likely than others, use the services of TES firms to access employment opportunities (Rankin, 2011). The notion that TES is the preserve of unskilled and ‘exploitable’ workers, Bhorat (2015) suggests is not borne out by the data. To the contrary, more than half of the 784 434 workers employed in the TES sub-sector in 2014, were sales and services workers, while 26% were elementary workers. Bhorat also suggests that the data indicates that the TES sector is absorbing young workers at a rate far greater than the finance and business services sectors. Viewed in this way, the sector is a crucial entry channel for young workers into the labour market. However, as Dickinson (2016) shows, the TES system, and its triangular employment relationship has become a means to by-pass labour legislation through the creation of ‘permanent-ca-sual’ employees. This has contributed to the
precarity of employment in South Africa and even added to the calls by labour federation, COSATU for the total ban of labour brokers. The literature however is not unanimous about the role of TES in bypassing labour legislation and the view of some (see Bhorat, 2018) is that employers have ‘voted with their feet’ in a context of prohibitive labour legislation. While not wishing to entertain the divergent views at length, suffice to say that the TES sector in South Africa presents some dilemmas for policy.
How policy from 2012 has engaged these dilemmas to regulate the TES sector
The most important of these are the amendments to s189 of the LRA. The concept of a labour broker was introduced into South African law in 1983 to regulate the placement of temporary workers who might work for several employers in a single year. The 1995 LRA retained this formulation while renaming labour brokers as Temporary Employment Services.215
A fee-charging agency is the employer of persons it places to work with clients if it assumed responsibility for remunerating these employees. The client was made jointly liable for breaches of statutory basic conditions of employment and minimum wages, collective agreements, and arbitration awards. Most sig-nificantly, the liability requirement for labour brokers to register with the Department of Labour was omitted (Van Eck, 2010), seemingly unintentionally. There was an enormous growth in the number of employees placed by labour brokers, particularly in the period after 2000. The practice of labour broking also became a very significant cause of industrial disputes and strikes. There is disagreement as to the extent to which the increase of the TES sector represents a growth in employment through the creation of new jobs or reflects a displacement of existing employees into more vulnerable work.
146
The growth of the agency employer has been associated without a “hollowing out” of management in terms of which human resources and industrial relations functions were previously performed within businesses are outsourced to external consultants. (Altbeker, 2016) A study commissioned by the Department of Labour concluded that strategies of externalising work (outsourcing and labour broking) were the major drivers of informalisation of work in South Africa. Labour broking was utilised to reduce standard employment in order to reduce labour costs and minimise the risks associated with employment, unfair dismissal protections (Bezuidenhout et al, 2004).215
Hiring employees through TES on a long-term basis was not confined to the private sector. For example, the Post Office imposed a moratorium on direct employment in 2000 and filled some 8,000 posts by employing workers through many labour brokers (Dickinson, 2015). A 2008 report commissioned by the Department of Labour suggested that labour brokers who act as employers of sub-contrac-ted lower-paid workers should be outlawed, an approach that had been adopted in Namibia (Webster et al, 2008).215 This proposal gained the support of the then Minister of Labour and was adopted as a campaign by the labour movement, particularly COSATU.
In late 2010, the Department of Labour published a Bill to amend the LRA which would have outlawed labour broking but also excluded many other employees from the LRA. The publication of these Bills was accompanied by a Regulatory Impact Assessment (RIA) which had been requested by the Cabinet as a result of controversies over the approach adopted (Benjamin et al, 2010). The Bill was opposed by organised employers and trade unions (Benjamin et al, 2010) and was withdrawn in early 2011.
A policy process to review labour legislation, including issues on non-standard work, commenced at Nedlac in 2011. Consensus was not reached on key issues at the stage that and draft legislation was submitted to be tabled in Parliament and published for public comment in April 2012 prior to the publication of the NDP. After a lengthy Parlia-mentary process, significant changes to the law dealing with non-standard employment were enacted by Parliament and came into effect on 1 January 2015.
The model for regulating TES introduced by the 2014 LRA Amendment Act, which came into effect on 1 January 2015, has retained the approach that TESs are deemed to be the employers of workers they place with clients. The provisions dealing with joint and several liability introduced in 1995 were strengthened to ensure that employees could hold both clients and agencies liable. These amendments also seek to promote trade unionism among placed workers by permitting the exercise of organisational rights at the client’s workplace and not exclusively at the workplace of the TES, as was previously the case.215
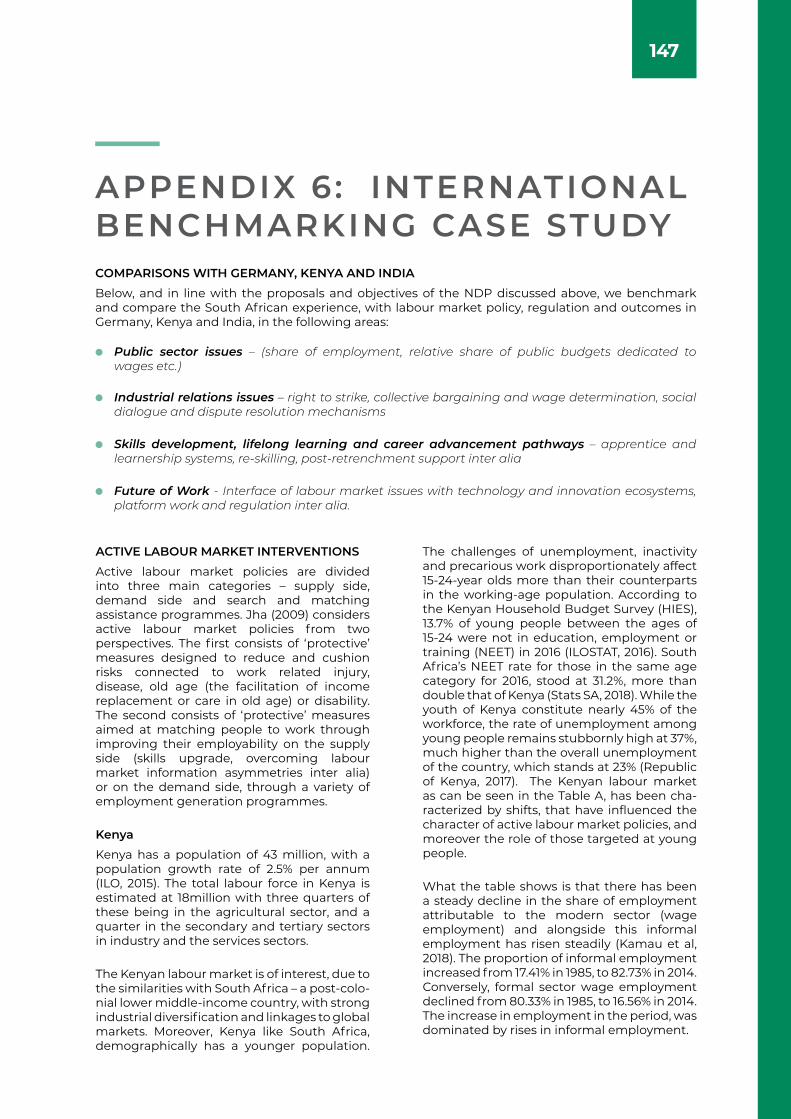
147
APPENDIX 6: INTERNATIONAL BENCHMARKING CASE STUDY COMPARISONS WITH GERMANY, KENYA AND INDIA
Below, and in line with the proposals and objectives of the NDP discussed above, we benchmark and compare the South African experience, with labour market policy, regulation and outcomes in Germany, Kenya and India, in the following areas:
ACTIVE LABOUR MARKET INTERVENTIONS
Active labour market policies are divided into three main categories – supply side, demand side and search and matching assistance programmes. Jha (2009) considers active labour market policies from two perspectives. The first consists of ‘protective’ measures designed to reduce and cushion risks connected to work related injury, disease, old age (the facilitation of income replacement or care in old age) or disability. The second consists of ‘protective’ measures aimed at matching people to work through improving their employability on the supply side (skills upgrade, overcoming labour market information asymmetries inter alia) or on the demand side, through a variety of employment generation programmes.
Kenya
Kenya has a population of 43 million, with a population growth rate of 2.5% per annum (ILO, 2015). The total labour force in Kenya is estimated at 18million with three quarters of these being in the agricultural sector, and a quarter in the secondary and tertiary sectors in industry and the services sectors.
The Kenyan labour market is of interest, due to the similarities with South Africa – a post-colo-nial lower middle-income country, with strong industrial diversification and linkages to global markets. Moreover, Kenya like South Africa, demographically has a younger population.
The challenges of unemployment, inactivity and precarious work disproportionately affect 15-24-year olds more than their counterparts in the working-age population. According to the Kenyan Household Budget Survey (HIES), 13.7% of young people between the ages of 15-24 were not in education, employment or training (NEET) in 2016 (ILOSTAT, 2016). South Africa’s NEET rate for those in the same age category for 2016, stood at 31.2%, more than double that of Kenya (Stats SA, 2018). While the youth of Kenya constitute nearly 45% of the workforce, the rate of unemployment among young people remains stubbornly high at 37%, much higher than the overall unemployment of the country, which stands at 23% (Republic of Kenya, 2017). The Kenyan labour market as can be seen in the Table A, has been cha-racterized by shifts, that have influenced the character of active labour market policies, and moreover the role of those targeted at young people.
What the table shows is that there has been a steady decline in the share of employment attributable to the modern sector (wage employment) and alongside this informal employment has risen steadily (Kamau et al, 2018). The proportion of informal employment increased from 17.41% in 1985, to 82.73% in 2014. Conversely, formal sector wage employment declined from 80.33% in 1985, to 16.56% in 2014. The increase in employment in the period, was dominated by rises in informal employment.
Public sector issues – (share of employment, relative share of public budgets dedicated to wages etc.)
Industrial relations issues – right to strike, collective bargaining and wage determination, social dialogue and dispute resolution mechanisms
Skills development, lifelong learning and career advancement pathways – apprentice and learnership systems, re-skilling, post-retrenchment support inter alia
Future of Work - Interface of labour market issues with technology and innovation ecosystems, platform work and regulation inter alia.
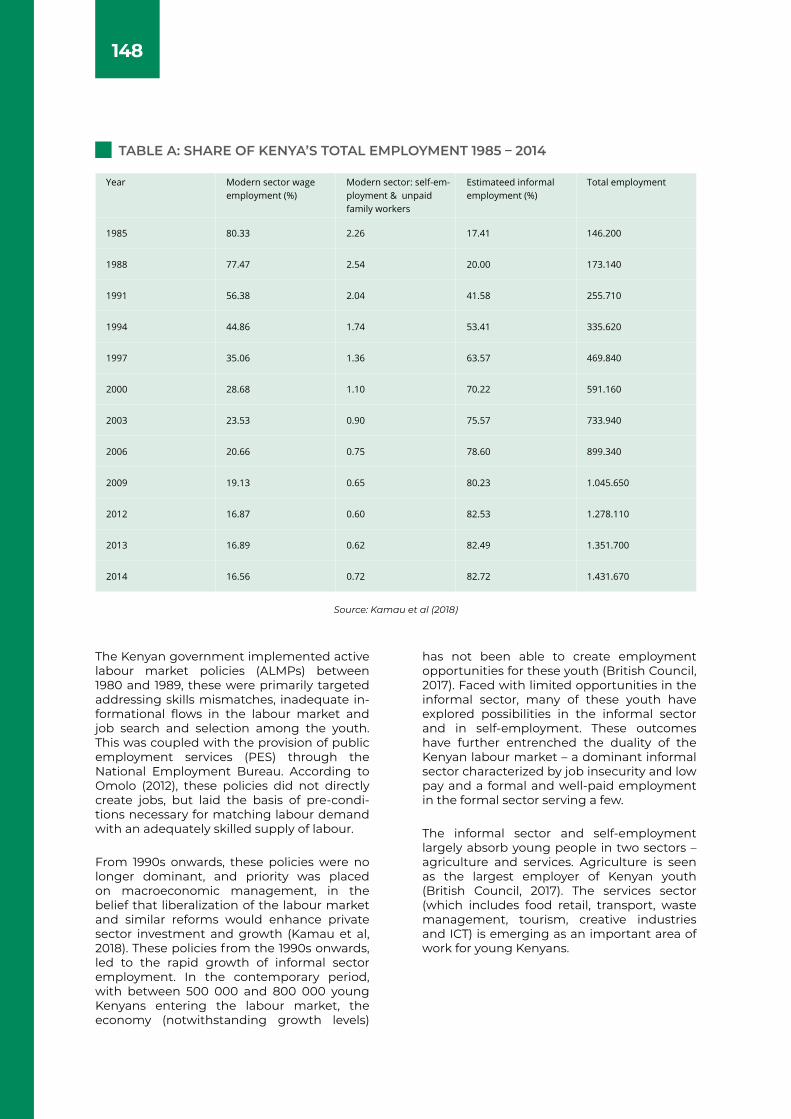
148
The Kenyan government implemented active labour market policies (ALMPs) between 1980 and 1989, these were primarily targeted addressing skills mismatches, inadequate in-formational flows in the labour market and job search and selection among the youth. This was coupled with the provision of public employment services (PES) through the National Employment Bureau. According to Omolo (2012), these policies did not directly create jobs, but laid the basis of pre-condi-tions necessary for matching labour demand with an adequately skilled supply of labour.
From 1990s onwards, these policies were no longer dominant, and priority was placed on macroeconomic management, in the belief that liberalization of the labour market and similar reforms would enhance private sector investment and growth (Kamau et al, 2018). These policies from the 1990s onwards, led to the rapid growth of informal sector employment. In the contemporary period, with between 500 000 and 800 000 young Kenyans entering the labour market, the economy (notwithstanding growth levels)
has not been able to create employment opportunities for these youth (British Council, 2017). Faced with limited opportunities in the informal sector, many of these youth have explored possibilities in the informal sector and in self-employment. These outcomes have further entrenched the duality of the Kenyan labour market – a dominant informal sector characterized by job insecurity and low pay and a formal and well-paid employment in the formal sector serving a few.
The informal sector and self-employment largely absorb young people in two sectors – agriculture and services. Agriculture is seen as the largest employer of Kenyan youth (British Council, 2017). The services sector (which includes food retail, transport, waste management, tourism, creative industries and ICT) is emerging as an important area of work for young Kenyans.
TABLE A: SHARE OF KENYA’S TOTAL EMPLOYMENT 1985 – 2014
Source: Kamau et al (2018)
Year Modern sector wage employment (%)
Modern sector: self-em-ployment & unpaid family workers
Estimateed informal employment (%)
Total employment
1985 80.33 2.26 17.41 146.200
1988 77.47 2.54 20.00 173.140
1991 56.38 2.04 41.58 255.710
1994 44.86 1.74 53.41 335.620
1997 35.06 1.36 63.57 469.840
2000 28.68 1.10 70.22 591.160
2003 23.53 0.90 75.57 733.940
2006 20.66 0.75 78.60 899.340
2009 19.13 0.65 80.23 1.045.650
2012 16.87 0.60 82.53 1.278.110
2013 16.89 0.62 82.49 1.351.700
2014 16.56 0.72 82.72 1.431.670
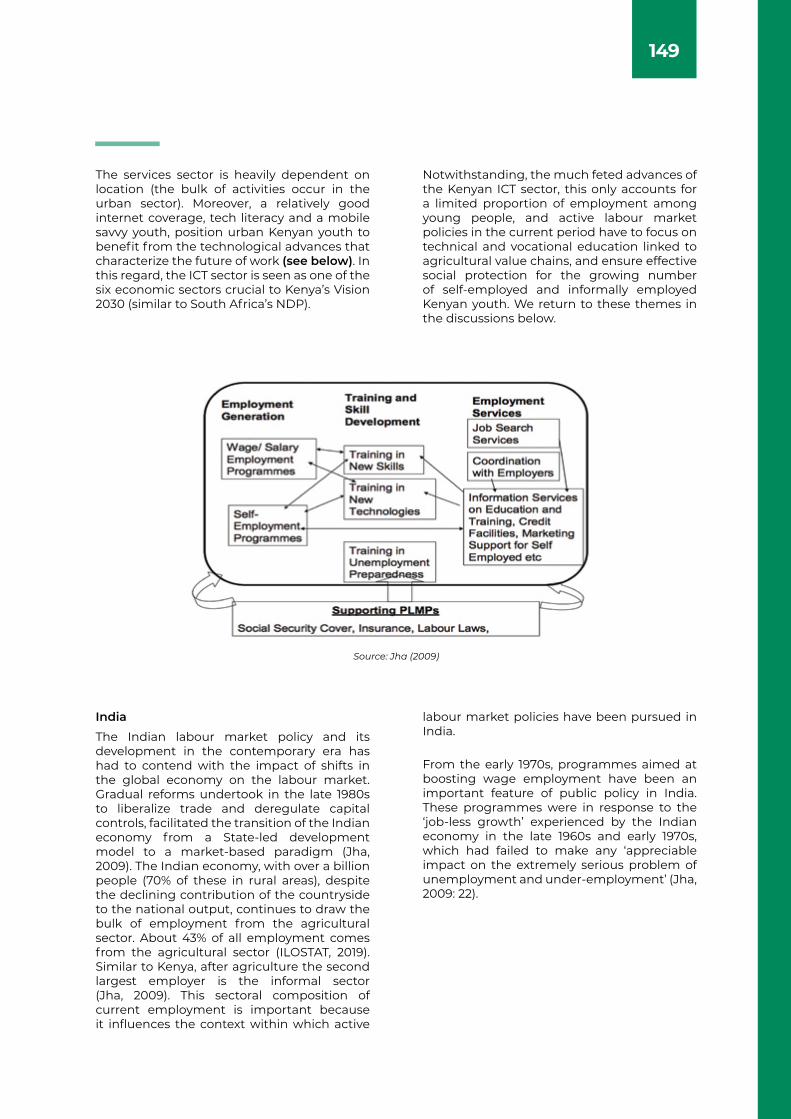
149
The services sector is heavily dependent on location (the bulk of activities occur in the urban sector). Moreover, a relatively good internet coverage, tech literacy and a mobile savvy youth, position urban Kenyan youth to benefit from the technological advances that characterize the future of work (see below). In this regard, the ICT sector is seen as one of the six economic sectors crucial to Kenya’s Vision 2030 (similar to South Africa’s NDP).
Notwithstanding, the much feted advances of the Kenyan ICT sector, this only accounts for a limited proportion of employment among young people, and active labour market policies in the current period have to focus on technical and vocational education linked to agricultural value chains, and ensure effective social protection for the growing number of self-employed and informally employed Kenyan youth. We return to these themes in the discussions below.
India
The Indian labour market policy and its development in the contemporary era has had to contend with the impact of shifts in the global economy on the labour market. Gradual reforms undertook in the late 1980s to liberalize trade and deregulate capital controls, facilitated the transition of the Indian economy from a State-led development model to a market-based paradigm (Jha, 2009). The Indian economy, with over a billion people (70% of these in rural areas), despite the declining contribution of the countryside to the national output, continues to draw the bulk of employment from the agricultural sector. About 43% of all employment comes from the agricultural sector (ILOSTAT, 2019). Similar to Kenya, after agriculture the second largest employer is the informal sector (Jha, 2009). This sectoral composition of current employment is important because it influences the context within which active
labour market policies have been pursued in India.
From the early 1970s, programmes aimed at boosting wage employment have been an important feature of public policy in India. These programmes were in response to the ‘job-less growth’ experienced by the Indian economy in the late 1960s and early 1970s, which had failed to make any ‘appreciable impact on the extremely serious problem of unemployment and under-employment’ (Jha, 2009: 22).
Source: Jha (2009)
150
The Maharastra Employment Guarantee Scheme (later the National Rural Employment Guarantee Programme)
From humble beginnings as an experiment in the late 1960s, the Maharastra Employee Guarantee Scheme (EGS) has developed into one of the most important poverty alleviation programmes in India. Initially starting in the province of Maharastra, it has now been expanded, since 2005 into the Mahatma Gandhi National Rural Employment Guarantee Programme (NREGP). The first phase kicked off in 2006, initially covering the poorest 200 districts. It later included all districts by 2008, to become the largest public employment programme in the world. It provided work to 57.8million unskilled citizens during the 2014/15 financial year.
How did it manage to achieve this, and what key design features can South Africa learn from?
The NREGP is a demand-based and self-tar-geting programme for rural households (who constitute the bulk of Indian society) who need income support (ILO, 2016). Every state implements its own programme which is jointly funded by the Ministry of Rural Development. This multi-agency approach, with multi-level processes, also influences which work programmes are selected. The Gram Sabha (village assembly) is responsible for recommending appropriate projects and the elected Gram Panchayat (village committee) is responsible for decision-ma-king, planning and implementation (ILO, 2016).
The programme also overcomes challenges of work selection, geographical distance and structural features of this work, all issues that are relevant in South Africa. For instance, work in the NREGP has to be provided within a fi-ve-kilometre radius and it has to be provided within 15 days of a worker’s application. If these conditions are not met, monetary compensation in the form of a travel allowance or in the case of work not being provided, an unemployment cash benefit must be provided. Moreover, those contracted to oversee and plan public employment projects, are discouraged from appointing ‘contractors and labour replacing machinery’, and 40% of project costs can be used for material, skilled labour and administration, with the remainder ring-fenced for beneficia-ries providing unskilled manual work.
The National Employment Services (NES)
The NES in India is very similar to the Public Employment Service (PES) unit in the Department of Employment and Labour (DoEL) in South Africa. The primary objective of the NES is the placement of jobseekers through regular formal employment or self-employment. Measures aimed at improving the employability of jobseekers (counselling, provision of market information, vocational guidance inter alia) are embedded within the NES (Government of India, 2017). This is done through the following;
• Compilation and dissemination of labour market information on vacancies, employment opportunities, type of qualifications requirement for various occupation and employment trends in key sectors, industries etc.
• Notification (by employers) of vacancies and registration of jobseekers on the supply side.
• Creation, management and maintenance of a database for labour market planning and management and the provision of career counselling and vocational guidance.
The NES, working alongside ‘Employment Exchanges’ (who collect and maintain the information required to achieve the objectives above), is able to play this matching function due to the Employment Exchanges (Compulsory Notification of Vacancies) Act of 1959. This Act requires all public sector entities and private sector players employing 25 or more workers to list their vacancies. This Act, in order to feed into the labour market information system, also requires employers in filing their ‘returns’ (called ER-I and ER-II) to provide information on recruitment mode for vacancies in that reporting period, occupational distribution of employees and the educational requirements for those occupations (Government of India, 2017).
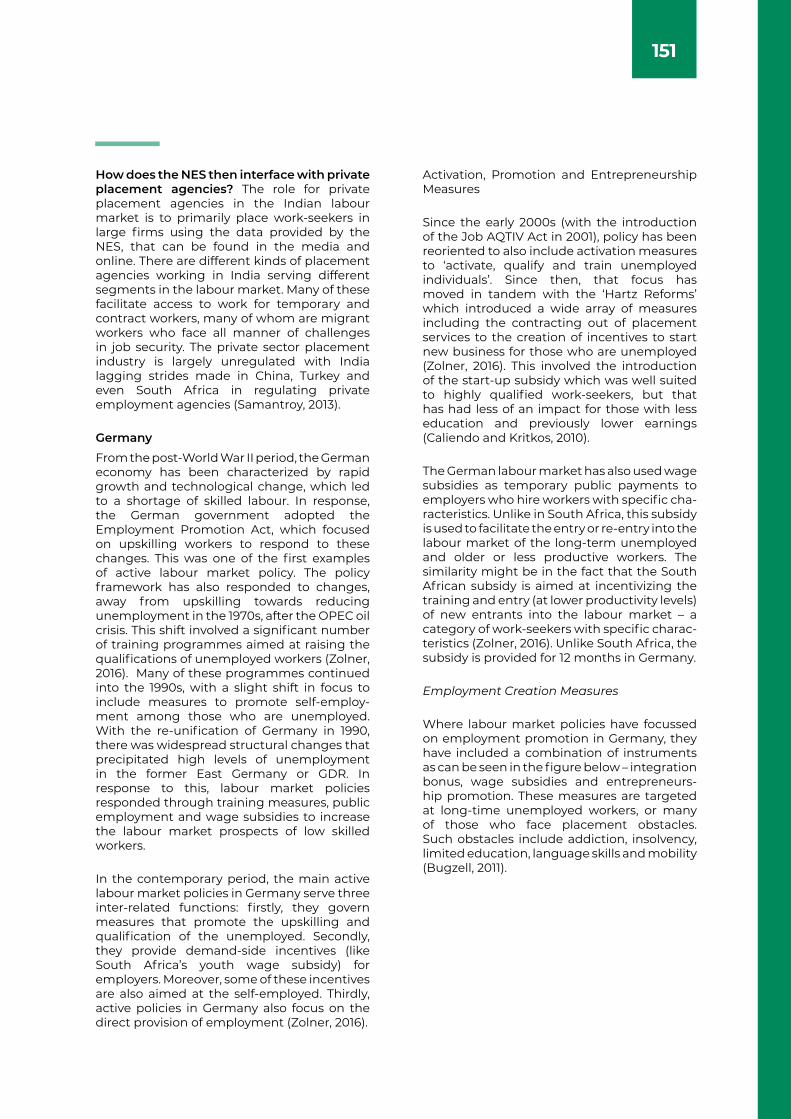
151
How does the NES then interface with private placement agencies? The role for private placement agencies in the Indian labour market is to primarily place work-seekers in large firms using the data provided by the NES, that can be found in the media and online. There are different kinds of placement agencies working in India serving different segments in the labour market. Many of these facilitate access to work for temporary and contract workers, many of whom are migrant workers who face all manner of challenges in job security. The private sector placement industry is largely unregulated with India lagging strides made in China, Turkey and even South Africa in regulating private employment agencies (Samantroy, 2013).
Germany
From the post-World War II period, the German economy has been characterized by rapid growth and technological change, which led to a shortage of skilled labour. In response, the German government adopted the Employment Promotion Act, which focused on upskilling workers to respond to these changes. This was one of the first examples of active labour market policy. The policy framework has also responded to changes, away from upskilling towards reducing unemployment in the 1970s, after the OPEC oil crisis. This shift involved a significant number of training programmes aimed at raising the qualifications of unemployed workers (Zolner, 2016). Many of these programmes continued into the 1990s, with a slight shift in focus to include measures to promote self-employ-ment among those who are unemployed. With the re-unification of Germany in 1990, there was widespread structural changes that precipitated high levels of unemployment in the former East Germany or GDR. In response to this, labour market policies responded through training measures, public employment and wage subsidies to increase the labour market prospects of low skilled workers.
In the contemporary period, the main active labour market policies in Germany serve three inter-related functions: firstly, they govern measures that promote the upskilling and qualification of the unemployed. Secondly, they provide demand-side incentives (like South Africa’s youth wage subsidy) for employers. Moreover, some of these incentives are also aimed at the self-employed. Thirdly, active policies in Germany also focus on the direct provision of employment (Zolner, 2016).
Activation, Promotion and Entrepreneurship Measures
Since the early 2000s (with the introduction of the Job AQTIV Act in 2001), policy has been reoriented to also include activation measures to ‘activate, qualify and train unemployed individuals’. Since then, that focus has moved in tandem with the ‘Hartz Reforms’ which introduced a wide array of measures including the contracting out of placement services to the creation of incentives to start new business for those who are unemployed (Zolner, 2016). This involved the introduction of the start-up subsidy which was well suited to highly qualified work-seekers, but that has had less of an impact for those with less education and previously lower earnings (Caliendo and Kritkos, 2010).
The German labour market has also used wage subsidies as temporary public payments to employers who hire workers with specific cha-racteristics. Unlike in South Africa, this subsidy is used to facilitate the entry or re-entry into the labour market of the long-term unemployed and older or less productive workers. The similarity might be in the fact that the South African subsidy is aimed at incentivizing the training and entry (at lower productivity levels) of new entrants into the labour market – a category of work-seekers with specific charac-teristics (Zolner, 2016). Unlike South Africa, the subsidy is provided for 12 months in Germany.
Employment Creation Measures
Where labour market policies have focussed on employment promotion in Germany, they have included a combination of instruments as can be seen in the figure below – integration bonus, wage subsidies and entrepreneurs-hip promotion. These measures are targeted at long-time unemployed workers, or many of those who face placement obstacles. Such obstacles include addiction, insolvency, limited education, language skills and mobility (Bugzell, 2011).
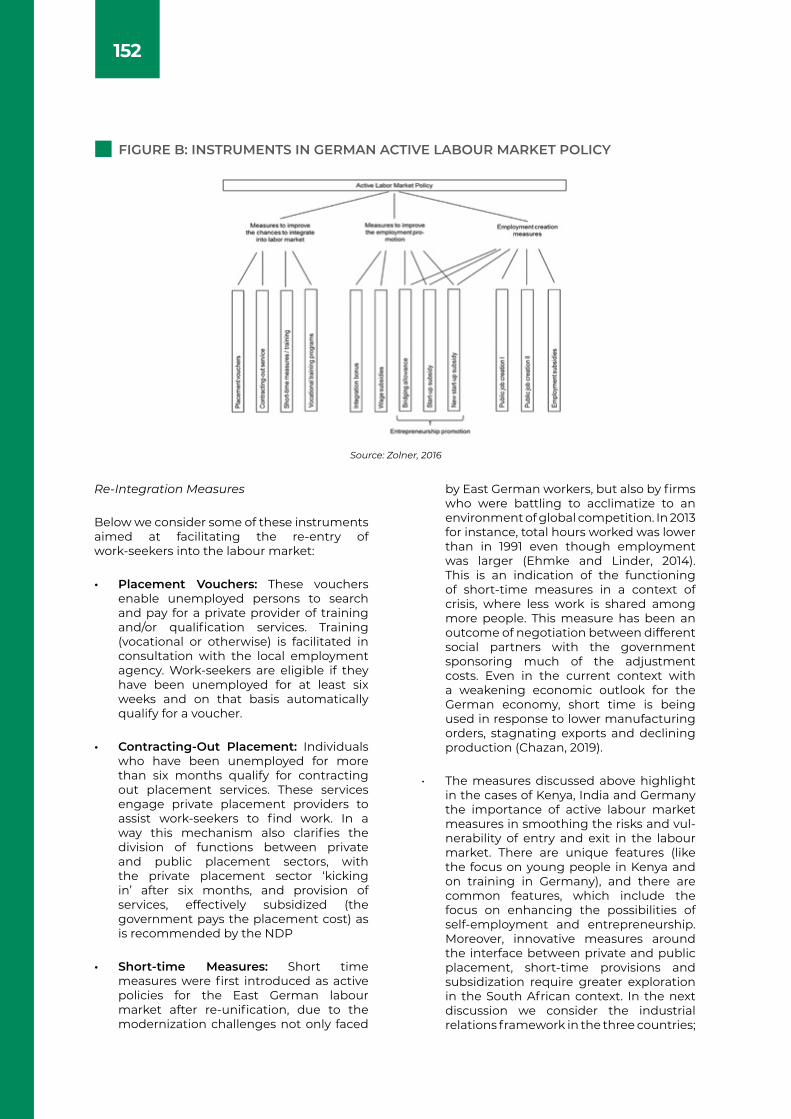
152
Re-Integration Measures
Below we consider some of these instruments aimed at facilitating the re-entry of work-seekers into the labour market:
• Placement Vouchers: These vouchers enable unemployed persons to search and pay for a private provider of training and/or qualification services. Training (vocational or otherwise) is facilitated in consultation with the local employment agency. Work-seekers are eligible if they have been unemployed for at least six weeks and on that basis automatically qualify for a voucher.
• Contracting-Out Placement: Individuals who have been unemployed for more than six months qualify for contracting out placement services. These services engage private placement providers to assist work-seekers to find work. In a way this mechanism also clarifies the division of functions between private and public placement sectors, with the private placement sector ‘kicking in’ after six months, and provision of services, effectively subsidized (the government pays the placement cost) as is recommended by the NDP
• Short-time Measures: Short time measures were first introduced as active policies for the East German labour market after re-unification, due to the modernization challenges not only faced
by East German workers, but also by firms who were battling to acclimatize to an environment of global competition. In 2013 for instance, total hours worked was lower than in 1991 even though employment was larger (Ehmke and Linder, 2014). This is an indication of the functioning of short-time measures in a context of crisis, where less work is shared among more people. This measure has been an outcome of negotiation between different social partners with the government sponsoring much of the adjustment costs. Even in the current context with a weakening economic outlook for the German economy, short time is being used in response to lower manufacturing orders, stagnating exports and declining production (Chazan, 2019).
• The measures discussed above highlight in the cases of Kenya, India and Germany the importance of active labour market measures in smoothing the risks and vul-nerability of entry and exit in the labour market. There are unique features (like the focus on young people in Kenya and on training in Germany), and there are common features, which include the focus on enhancing the possibilities of self-employment and entrepreneurship. Moreover, innovative measures around the interface between private and public placement, short-time provisions and subsidization require greater exploration in the South African context. In the next discussion we consider the industrial relations framework in the three countries;
FIGURE B: INSTRUMENTS IN GERMAN ACTIVE LABOUR MARKET POLICY
Source: Zolner, 2016
153
INDUSTRIAL RELATIONS - CONCERNS
Kenya
Kenya’s labour market has one of the most ins-titutionalized industrial relations frameworks in Africa, however there has been a spate of non-compliance with collective agreements in recent years, accompanied by layoffs, this has weakened confidence in the Kenyan labour market. Kenya has five sets of labour laws which govern industrial relations in the East African nation (all enacted in 2007). These are the Employment Act of 2007, the Labour Relations Act of 2007, the Labour Institutions Act of 2007, the Work Injury Benefits Act of 2007 and the Occupational Safety and Health Act of 2007. Moreover, the Trade Unions Act, Trade Disputes Act and Industrial Relations charter govern industrial relations and the organization of worker re-presentation (ILO, 2015). All these Acts govern the setting of wages, conditions of work and provide guidance around the procedures for dismissal, safety and the maintenance of employment records (Otieno, 2015).
Collective Bargaining
Wages in Kenya are set at three levels. The first, is through ‘minimum wages’ set for the whole economy through Wage Councils, the second involves collective bargaining agreements that set wages in the private sector, and Collective Bargaining and Administered (CBA) agreements which set wages in the public service (Owidhi, 2016). For the purposes of our discussions here we consider the latter two forms of bargaining which have a crucial influence on the nature of industrial relations in the Kenyan labour market.
The Trade Disputes Act governs how collective agreements are arrived at between trade unions and employer organizations in Kenya. The parties to these agreements in many cases are the industrial associations (on the employer side) organized under the Federation of Kenyan Employers (FKE) and sector-based trade unions (and general unions). The FKE is made up of 13 sectoral employer associations and some 2000 individual and enterprise members (Fashoyin, 2010).
What issues are placed on the bargaining table? One can see from the table below, that the issues that are bargained about consist of a combination of wage and conditions of work-related matters, and social and benefits related issues (leave, training, allowances and termination etc.).
Source: Fashoyin (2010)
There are 37 registered trade unions in Kenya, with 35 of these affiliated to the national Con-federation of Trade Unions – or COTU(K). The levels of unionization in Kenya have declined since the mid-1990s, due to increasing dismissals, retrenchments and outsourcing. Interestingly, in response to the growing ca-sualisation of work in the large agricultural sector, social partners agreed in the CBA for 2007-09 that temporary labour beyond three months of engagement would see affected workers entitled to maternity leave and other benefits and provided with priority to be elevated to a permanent status when vacancies occurred (Fashoyin, 2010). This is quite like the amendments to s198 of the LRA in South Africa, albeit with marked differences. What this also suggests is the role of the CBAs as a platform for economy-wide dialogue on issues facing different social partners.
Collective bargaining and tripartite social dialogue are closely related and mutually reinforcing. In the Kenyan experience, CBAs not only determine conditions of work for workers in the public service, but also provide an institutional platform for social dialogue between government, labour and employers on labour market and related issues that affect the entire economy (Fashoyin, 2010). A recent example of this is the determination of the minimum wage in Kenya.
154
Industrial Conflict
Recent strikes in the Kenyan labour market (especially in the education and healthcare sector) are an indication that the existing conflict resolution mechanisms embedded within these pieces of legislation are proving ineffective in resolving industrial conflict. Gathongo and van der Walt (2018) argue that many of these challenges have to do with the current dual dispute resolution system in Kenya. These challenges include protracted timeframes to resolve dismissal disputes and the lack of clear regulation around conciliation timeframes (Gathongo and van der Walt, 2018). The responsibility for the resolution of disputes in the Kenyan system, unlike in the German one, largely rests with the government through the Ministry of Labour, without an independent statutory body like the CCMA, which is envisaged in the 2007 Kenyan Labour Relations Act. This lack of independent dispute resolution mechanisms has led to criticisms of the lack of impartiality in the system and, especially in the case of the public service, has led to increases in strikes and lockouts (Gathongo and van der Walt, 2018).
Essential Services
Not all workers in Kenya have the right to initiate and undertake strike action. According to the Trade Disputes Act and the relevant Proclamations, the following occupational categories are defined as ‘essential services’
• Water, Sanitation and Electricity Services
• Health Services
• Air Traffic Control Services and Civil Aviation Telecommunications services
• Meteorological Services
• Rail and Ports Authorities
• Local Government Authorities
• Suppliers and Distributors of fuel, petrol, oil, power and energy
• Public Transport Services
• Teaching Services
These occupational categories consist of some of the most qualified (and politically aware) workers in the Kenyan economy, who also constitute a sizeable proportion of workers who are members of trade unions. This creates considerable tensions as can be seen in the 100-day long strike by medical doctors in Kenya which effectively paralyzed the country’s public health system. Moreover, the use of coercive tactics by the Kenyan government to get the medical professionals
to return to work raises questions around the balance between ensuring essential provision of public services, and the human rights of workers in essential services sector and their right to strike. We return to some of these themes in our discussion on recommenda-tions.
India
In the immediate post-independence period in India, the industrial relations framework has been premised on ensuring ‘industrial peace’. In this context, there was an implicit social compact between unions, employers and the government, premised on key trade-offs. In the post-independence period, four laws governed industrial relations: The Trade Union Act of 1926, the Industrial Employment Act of 1976, the Industrial Disputes Act of 1947 and the Contract Labour Act.
Job security was provided to workers in return for industrial peace and both employers and unions accepted the legitimacy of state regulation of the workplace (Sunder, 2010). This system was faced with several limitations, many of which related to balancing two competing objectives and interests. This involved, ensuring firm competitiveness and retaining capital in India, alongside ensuring decent wages and conditions of work for labour. The evolution of industrial relations in the post-independence period has also been incremental and adaptive, in response to endogenous political economy conside-rations (Bhattacherjee, 2018). One of these considerations has been how many workers are covered by this legislation. Sharma (2010) suggests that with the rise in precarious employment that labour laws apply to under 10% of all workers and in some industries even less. This is plausible if one considers the size of agricultural employment (with low levels of unionization) and the size of the informal sector in India. This fact notwithstanding, there have been heated debates in India about the rigidity of its labour laws and the impact this has had on employment growth. Moreover, many of the historic labour laws have been ambiguous in their definitional scope which has opened the system up to litigation. In response to this, and the increasing pressure from large industry, the informalization of work and the declining influence of trade unions, the Modi government instituted labour reforms recently, which are set to have a considerable impact on the Indian labour market.
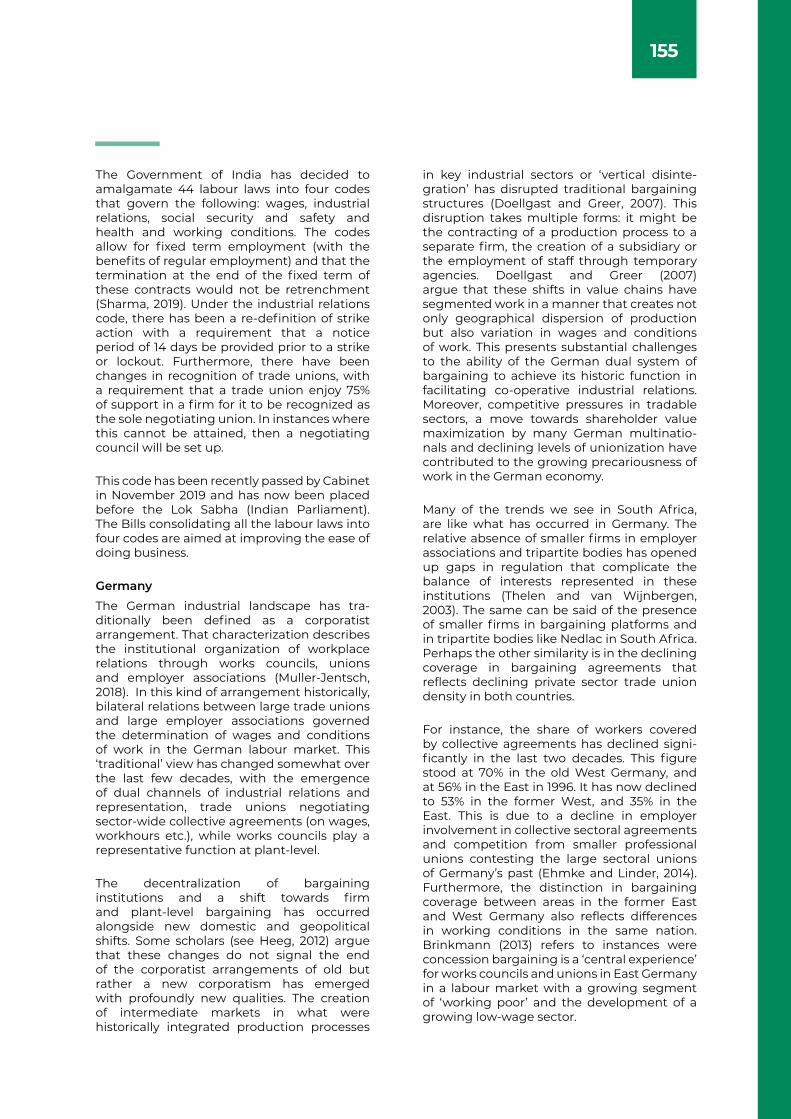
155
The Government of India has decided to amalgamate 44 labour laws into four codes that govern the following: wages, industrial relations, social security and safety and health and working conditions. The codes allow for fixed term employment (with the benefits of regular employment) and that the termination at the end of the fixed term of these contracts would not be retrenchment (Sharma, 2019). Under the industrial relations code, there has been a re-definition of strike action with a requirement that a notice period of 14 days be provided prior to a strike or lockout. Furthermore, there have been changes in recognition of trade unions, with a requirement that a trade union enjoy 75% of support in a firm for it to be recognized as the sole negotiating union. In instances where this cannot be attained, then a negotiating council will be set up.
This code has been recently passed by Cabinet in November 2019 and has now been placed before the Lok Sabha (Indian Parliament). The Bills consolidating all the labour laws into four codes are aimed at improving the ease of doing business.
Germany
The German industrial landscape has tra-ditionally been defined as a corporatist arrangement. That characterization describes the institutional organization of workplace relations through works councils, unions and employer associations (Muller-Jentsch, 2018). In this kind of arrangement historically, bilateral relations between large trade unions and large employer associations governed the determination of wages and conditions of work in the German labour market. This ‘traditional’ view has changed somewhat over the last few decades, with the emergence of dual channels of industrial relations and representation, trade unions negotiating sector-wide collective agreements (on wages, workhours etc.), while works councils play a representative function at plant-level.
The decentralization of bargaining institutions and a shift towards firm and plant-level bargaining has occurred alongside new domestic and geopolitical shifts. Some scholars (see Heeg, 2012) argue that these changes do not signal the end of the corporatist arrangements of old but rather a new corporatism has emerged with profoundly new qualities. The creation of intermediate markets in what were historically integrated production processes
in key industrial sectors or ‘vertical disinte-gration’ has disrupted traditional bargaining structures (Doellgast and Greer, 2007). This disruption takes multiple forms: it might be the contracting of a production process to a separate firm, the creation of a subsidiary or the employment of staff through temporary agencies. Doellgast and Greer (2007) argue that these shifts in value chains have segmented work in a manner that creates not only geographical dispersion of production but also variation in wages and conditions of work. This presents substantial challenges to the ability of the German dual system of bargaining to achieve its historic function in facilitating co-operative industrial relations. Moreover, competitive pressures in tradable sectors, a move towards shareholder value maximization by many German multinatio-nals and declining levels of unionization have contributed to the growing precariousness of work in the German economy.
Many of the trends we see in South Africa, are like what has occurred in Germany. The relative absence of smaller firms in employer associations and tripartite bodies has opened up gaps in regulation that complicate the balance of interests represented in these institutions (Thelen and van Wijnbergen, 2003). The same can be said of the presence of smaller firms in bargaining platforms and in tripartite bodies like Nedlac in South Africa. Perhaps the other similarity is in the declining coverage in bargaining agreements that reflects declining private sector trade union density in both countries.
For instance, the share of workers covered by collective agreements has declined signi-ficantly in the last two decades. This figure stood at 70% in the old West Germany, and at 56% in the East in 1996. It has now declined to 53% in the former West, and 35% in the East. This is due to a decline in employer involvement in collective sectoral agreements and competition from smaller professional unions contesting the large sectoral unions of Germany’s past (Ehmke and Linder, 2014). Furthermore, the distinction in bargaining coverage between areas in the former East and West Germany also reflects differences in working conditions in the same nation. Brinkmann (2013) refers to instances were concession bargaining is a ‘central experience’ for works councils and unions in East Germany in a labour market with a growing segment of ‘working poor’ and the development of a growing low-wage sector.
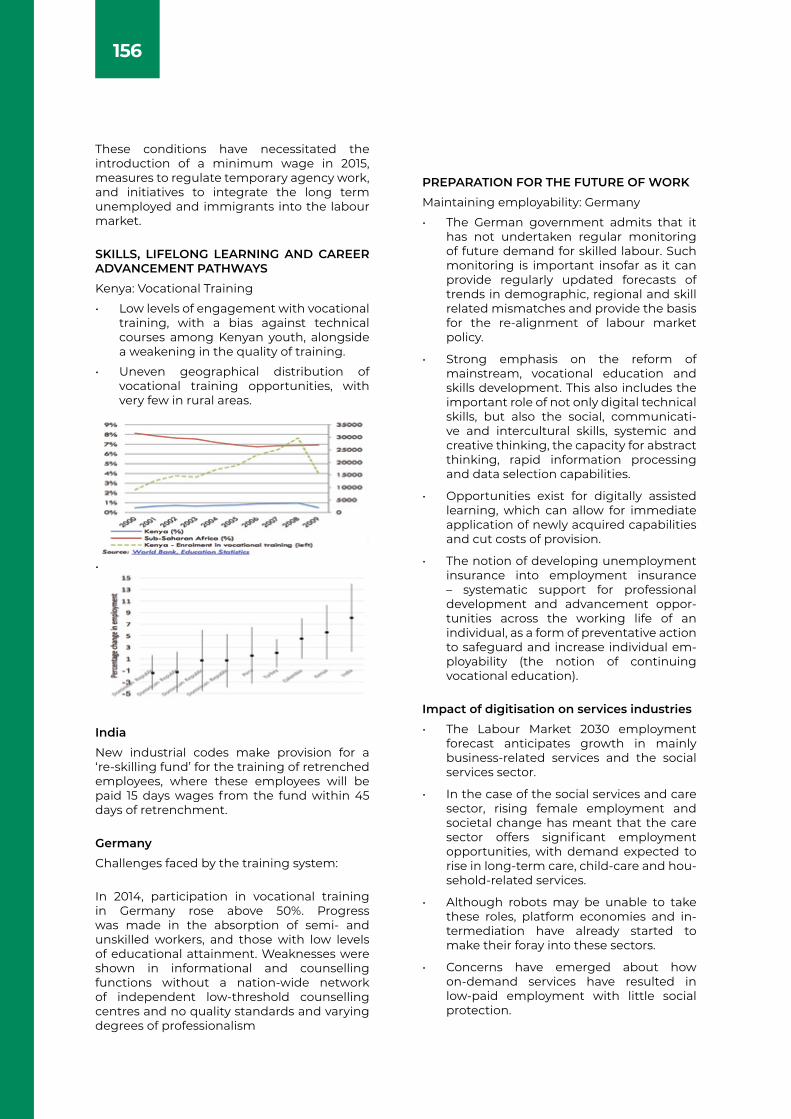
156
These conditions have necessitated the introduction of a minimum wage in 2015, measures to regulate temporary agency work, and initiatives to integrate the long term unemployed and immigrants into the labour market.
SKILLS, LIFELONG LEARNING AND CAREER ADVANCEMENT PATHWAYS
Kenya: Vocational Training
• Low levels of engagement with vocational training, with a bias against technical courses among Kenyan youth, alongside a weakening in the quality of training.
• Uneven geographical distribution of vocational training opportunities, with very few in rural areas.
•
•
•
•
•
•
•
•
India
New industrial codes make provision for a ‘re-skilling fund’ for the training of retrenched employees, where these employees will be paid 15 days wages from the fund within 45 days of retrenchment.
Germany
Challenges faced by the training system:
In 2014, participation in vocational training in Germany rose above 50%. Progress was made in the absorption of semi- and unskilled workers, and those with low levels of educational attainment. Weaknesses were shown in informational and counselling functions without a nation-wide network of independent low-threshold counselling centres and no quality standards and varying degrees of professionalism
PREPARATION FOR THE FUTURE OF WORK
Maintaining employability: Germany
• The German government admits that it has not undertaken regular monitoring of future demand for skilled labour. Such monitoring is important insofar as it can provide regularly updated forecasts of trends in demographic, regional and skill related mismatches and provide the basis for the re-alignment of labour market policy.
• Strong emphasis on the reform of mainstream, vocational education and skills development. This also includes the important role of not only digital technical skills, but also the social, communicati-ve and intercultural skills, systemic and creative thinking, the capacity for abstract thinking, rapid information processing and data selection capabilities.
• Opportunities exist for digitally assisted learning, which can allow for immediate application of newly acquired capabilities and cut costs of provision.
• The notion of developing unemployment insurance into employment insurance – systematic support for professional development and advancement oppor-tunities across the working life of an individual, as a form of preventative action to safeguard and increase individual em-ployability (the notion of continuing vocational education).
Impact of digitisation on services industries
• The Labour Market 2030 employment forecast anticipates growth in mainly business-related services and the social services sector.
• In the case of the social services and care sector, rising female employment and societal change has meant that the care sector offers significant employment opportunities, with demand expected to rise in long-term care, child-care and hou-sehold-related services.
• Although robots may be unable to take these roles, platform economies and in-termediation have already started to make their foray into these sectors.
• Concerns have emerged about how on-demand services have resulted in low-paid employment with little social protection.
157
APPENDIX 7: CCMA WORKPLACE TRAINING INTERVENTIONS ACROSS MULTIPLE SECTORS – 2019
This note is prepared using data obtained directly from CCMA’s Dispute Prevention & Workplace Outreach Unit* / *For confidentia-lity purposes, the names of the CCMA’s clients are not disclosed here.
1: University X: Awareness Raising Campaign on Equity in the Workplace and Sexual Harassment
Public tertiary institutions have experienced an increase in the number of complaints related to sexual harassment as well as race discrimination and racism involving staff members. Increasing media reports about such complaints also created the risk of reputational damage. The CCMA approach four tertiary institutions to assist in addressing some of these challenges through awareness raising campaigns. Each institution reacted to the CCMA’s offer differently, with some arguing that they would attend to this internally without ‘external’ support and assistance from the CCMA. One institution with multiple campuses agreed to an on-going partnership with CCMA that will focus on interventions that address transformation (broadly defined) in the workplace. As a result, several CCMA offices across various provinces are assisting on the project, with campus visits that involved workshops focusing on sexual harassment and racism. Trade unions including NEHAWU also assisted to ensure that its members across staffing and salary levels attended and participated in these training workshops. In addition, the Commission for Gender Equality (CGE) worked in partnership with the CCMA (re. gender and sexual harassment training). This project is likely to be repeated annually.
2: Coal Mine Y– Transformation of Workplace Relations
As a result of an increase in the number of referrals and complaints from workers at Mine Y, the CCMA office in the Province identified the need to address a substantial disconnect in the relationship between management
and organised labour (trade union) especially in relation to collective bargaining. Several engagements were held with the HR division of the mining company and trade union re-presentatives to understand the conflict that underpinned the formal relationship between management and workers. As a result, the CCMA and the companies HR head proposed a Human Resources and Leadership Development Intervention Programme for the second half of 2019. This resulted in a service level agreement for thirteen sessions (approximately R 220 000 in total). The sessions focused on leadership development within the HR division of the mining company and on strengthening the relationship between management and organised labour focusing on building trust, respect and consistency in the workplace in line with the objectives of the LRA, with a focus on the processes for collective bargaining, conflict management and discipline in the workplace. The project involved engagement with approximately 200 participants (with a satisfaction rating of 4.8/5), with a substantial decrease in CCMA referrals during that period. Crucially, both parties were trusting of the CCMA and more open and flexible in their engagements with the CCMA. In 2020 – 2021, the mining company has requested the CCMA to support a second project for both management and organised labour relating to the rules for engaging in collective bargaining and agreement setting.
3: Sectoral Bargaining Council 1 – Building Workplace Relations (BWR)
A ‘Building Workplace Relations’ (BWR) intervention was facilitated by CCMA com-missioners with the employers and labour representatives who belong to a large and prominent bargaining council in the fourth quarter of 2019 due to low levels of trust affecting the relationship of members of Bargaining Council Z.
158
Twenty-three people attended and participated in a workshop using focus groups and a plenary format that enabled all repre-sentatives to agree that they needed to act in a manner that would sustain the functioning of the bargaining council to ensure stability and growth of the relevant industry, which affects the economic growth of the country.
4: Sectoral Bargaining Council 2 - Building Workplace Relations (BWR)
A ‘Building Workplace Relations’ (BWR) intervention was facilitated by CCMA com-missioners with the employers and labour representatives who belong to a large and prominent bargaining council in the fourth quarter of 2019. The General Secretary assisted to set the tone and context of the intervention. Twenty-five people representing both employers and labour attended and participated in the workshop, where they defined their relationship as sub-optimal. After further engagement through a workshop format, both management and labour agreed to deploy members to work in one of three task teams that will develop workplans focusing on improving collective bargaining, governance and support services. Action plans have been developed to improve relations between the parties and to promote the sustainability of the said bargaining council. This resulted in a consensual framework for a plan of action that will also serve to catalyse further constructive engagement, with a recognition by the parties about the importance of the work of the bargaining council, its mandate and significance for the South African economy.


www.nationalplanningcommission.org.za


![[PPT]PowerPoint Presentation - Trinity College, Dublin · Web viewSpecial Tutorial programme Professor Deirdre Murphy Trinity College Labour & Delivery Objectives Normal Labour Abnormal](https://img.pdfslide.us/doc/110x75/5b00989f7f8b9a6a2e8ce3d1/pptpowerpoint-presentation-trinity-college-viewspecial-tutorial-programme-professor.jpg)