Embed Size (px)
Citation preview

Meeting Report on Reconsidering, Refining, and Extending the WHO IYCF Indicators 1
MEETING REPORTon Reconsidering, Refining, and Extending the World Health Organization Infant and Young Child Feeding Indicators
5+
June 20- 22, 2017New York
MEETING REPORTon Reconsidering, Refining, and Extending the World Health Organization Infant and Young Child Feeding Indicators
5+
June 20- 22, 2017New York
MEETING REPORTon Reconsidering, Refining, and Extending the World Health Organization Infant and Young Child Feeding Indicators
5+
June 20- 22, 2017New York
MEETING REPORTon Reconsidering, Refining, and Extending the World Health Organization Infant and Young Child Feeding Indicators
June 20- 22, 2017
New York
Meeting Report on Reconsidering, Refining, and Extending the WHO IYCF Indicators 2
Acknowledgements
The consultation was coordinated and organized by: For the coordination and organization of the meeting, Chika Hayashi, Julia Krasevec and Vrinda Mehra from UNICEF, Larry Grummer-Strawn and Kuntal Saha from WHO, Mary Arimond, Megan Deitchler and Sandra Remancus from FANTA/FHI 360, and Erin Milner and Anne Peniston from USAID. For the drafting of the meeting report, Shibani Kulkarni with inputs from Mary Arimond, Megan Deitchler, Erin Milner and Julia Krasevec. For background work and analysis on Minimum Diet Diversity/Minimum Meal Frequency/Minimum Acceptable Diet in preparation for the meeting, Mary Arimond, Joanne Arsenault, Teresa Shama, Xiaoyi An, and Vrinda Mehra. Participants and presenters at the consultation meetings held in New York 22-24 June 2017 provided invaluable inputs to formulate the recommendations and next steps.
The consultation was largely made possible with the generous financial contribution of USAID/FANTA, and related background work and additional support was funded by UNICEF, WHO, and the Bill and Melinda Gates Foundation.

Meeting Report on Reconsidering, Refining, and Extending the WHO IYCF Indicators 3
Contents
List of Annexes 4
List of Acronyms 5
Introduction 6
Meeting Agenda 7
List of Participants 11
1. Summary of Opening Presentations 12
1.1 WHO IYCF Guideline Development Process 121.2 Background on IYCF indicators 121.3 UNICEF IYCF Programming 12
2. Minimum Diet Diversity (MDD): Current Definition and Measurement, Issues, and Alternative Definitions 12
2.1 MDD: Updating the indicator food groups to include breast milk 122.2 MDD: Interpretation of the Indicator 182.3 MDD: Revisiting Fruit and Vegetable Groupings 182.4 MDD: Revisiting Tricky Decisions on Categorizing Items into Food Groups 18
3. Operationalizing MDD Using Quantitative 24-Hour Recall 20
Summary of Options and Rationale 20Summary of Discussion 20Summary of Final Decision and Way Forward 20
4. Minimum Meal Frequency: Current Definition, What it Measures, Issues, and Alternate Definitions 21
Summary of Options and Rationale 21Summary of Discussion 21Operationalization of MMF from the quantitative 24-hour-recall 22Summary of final decisions and way forward 22
5. MAD: Current Definition, What it Measures, Issues, Alternate Definition 22
Summary of Decision and Way Forward 22
6. Sharing of Lessons and Recommendations from Implementing the Indicators in DHS, MICS, and other Surveys 23
1. Demographic and Health Surveys 232. Multiple Indicator Cluster Survey (MICS) 233. ENSAUT & MICS Survey Differences in IYCF Questionnaires in Mexico 24
7. Group Work Outcomes 24
Conclusion 27
ANNEXES 28
Meeting Report on Reconsidering, Refining, and Extending the WHO IYCF Indicators 4
List of Annexes
Annex 1: Opening PresentationsPresentation 1: WHO Guideline Development ProcessPresentation 2: Measuring Infant and Young Child Complementary Feeding Practices: Indicators, Current Practice
and Research GapsPresentation 3: Update on UNICEF Infant and Young Child Feeding Guidance and Tools
Annex 2: Topical Presentations
Presentation 1: Minimum Meal FrequencyPresentation 2: Minimum Acceptable Diet(The presentation on Minimum Diet Diversty is not included in this report)
Annex 3: Survey-Related PresentationsPresentation 1: The Demographic and Health Surveys Program: Experience with Child Feeding IndicatorsPresentation 2: Multiple Indicator Cluster Survey- IYCFPresentation 3: ENSANUT and MICS (ENIM- Mexico) Survey Differences in Infant & Young Child Feeding Practices
Questionnaires
Annex 4: Group Work Presentation 1: Infant and Young Child Feeding Indicators: Ages 0-6 months (and continued breastfeeding)Presentation 2: Looking for Indicators of Healthy Eating among Primary School-Age Children: A Short Journey from
Kahnawake to OuagadougouPresentation 3: Thoughts on indicators for adolescent nutrition
Annex 5: Background notes Background note 1: Rationale for developing indicators of healthy food habits for school-age children by
Olivier Receveur, PhD, MPH, DtPBackground note 2: Commentary on developing indicators for adolescent nutrition Prepared for the Technical Consultation to Reconsider, Refine, and Extend Child Feeding Indicators by
Chessa K Lutter, PhD

Meeting Report on Reconsidering, Refining, and Extending the WHO IYCF Indicators 5
List of Acronyms
ASF Animal-Source Food
BFHI Baby Friendly Hospital Initiative
CF Complementary Feeding
DHS Demographic and Health Surveys
EBF Exclusive Breastfeeding
GSHS Global School-Based Student Health Survey
HIC High-income countries
IYCF Infant and Young Child Feeding
LIC Low-income countries
LMIC Low- and middle-income countries
LNS Lipid-based Nutrient Supplement
MAD Minimum Acceptable Diet
MICS Multiple Indicator Cluster Survey
MDD Minimum Diet Diversity
MMF Minimum Meal Frequency
NHANES National Health and Nutrition Examination Survey
WHA World Health Assembly
WHO World Health Organization
Meeting Report on Reconsidering, Refining, and Extending the WHO IYCF Indicators 6
Introduction
The global Infant and Young Child Feeding (IYCF) Indicators were published in 2008 and related operational guide was introduced in 2010. In the years since their introduction, IYCF indicators have been used on a national scale to understand trends and monitor progress in child nutrition practices through the large-scale surveys such as the Demographic and Health Surveys (DHS) and the Multiple Indicator Cluster Survey (MICS). The indicators have also been extensively used in smaller settings for descriptive purposes, and for evaluating and measuring program goals related to child nutrition.
After nearly a decade of using the IYCF indicators, it is essential to understand the issues related to their use and operationalization, and if there is a need for modification within the context of nutrition transition in several developing countries. Additionally, the World Health Assembly (WHA) has adopted the Minimum Acceptable Diet (MAD), one of the WHO IYCF indicators, as a part of the Global Nutrition Monitoring Framework for measuring nutrition progress. Use of MAD in high-income countries (HIC) would require additional guidance on operationalization of the indicators, which are currently used primarily in low- and middle-income countries (LMIC) through the DHS and MICS data. Also, while guidance is available on nutrition and feeding for early childhood from 0-23 months, there are currently no valid indicators to effectively measure child feeding in the preschool and school-going age group.
A technical consultation was convened by UNICEF, FHI 360, USAID, and WHO to discuss the above-mentioned issues related to the current IYCF indicators, particularly those related to complementary feeding. The consultation reviewed current issues and challenges, proposed potential modifications, and discussed and suggested the initial scope of work on diet-related indicators for children beyond 24 months through adolescence.
The following report summarizes the discussions related to the modification of IYCF indicators for minimum diet diversity (MDD), minimum meal frequency (MMF), and MAD. It also highlights issues presented as they relate to collecting and operationalizing these indicators in the field through DHS, MICS and other surveys. Lastly, the report presents the discussions on additional issues and way forward for feeding and nutrition indicators in three main age groups: 0-5 months, 24-59 months, and school-age children.

Meeting Report on Reconsidering, Refining, and Extending the WHO IYCF Indicators 7
TechnicalConsultationtoReconsider,Refine,andExtendChildFeedingindicatorsAgenda
Time Agendatopic ExpectedOutcomesDay1 8:00am Breakfastandregistration Chair JaneBadham,Facilitator8:30am Welcomeandopeningremarks
PriscillaIdele,UNICEFMeganDietchler,FANTAFrancescoBranca,WHOErinMilner,USAIDIntroductions
9:00–9:15am Overview,AgendaandexpectedresultsoftheconsultationChikaHayashi
9:15–9:25am FacilitatorRulesJaneBadham
9:25-10:25am UpdateoninfantandchildfeedingguidelinesWHOguidelinedevelopmentprocessPuraSolonBackgroundonIYCFindicatorsMarieRuelUNICEFInfantandYoungChildFeedingprogrammingguideFranceBegin
10:25–10:45am CoffeeBreak10:45-11:45am MDD:Currentdefinition,whatitmeasures,issues,
alternatedefinitions• Implicationsforbreastfeedingandnon-
breastfeedingchildren• DiscussionifandhowtomakeMDDfairwhen
comparingbreastfedandnon-breastfedPresentationbyMaryArimond
11:45–11:55am Energizer11:55–12:55pm MDDsessioncontinued:
• OperationalizingMDDusingquantitative24hrrecalldataPresentationbyMaryArimond
AgreementonanyrevisionstoMDDDefinition
12:55-1:55pm Lunch
Meeting Agenda

Meeting Report on Reconsidering, Refining, and Extending the WHO IYCF Indicators 8
Time Agendatopic ExpectedOutcomes1:55–2:50pm MMF:Currentdefinition,whatitmeasures,issues,
alternatedefinitions.• Implicationsforbreastfeedingandnon-
breastfeedingchildren• Review3alternatedefinitions
PresentationbyVrindaMehra
AgreementonanyrevisionstoMMFDefinition
2:50-3:35pm MAD:Currentdefinition,whatitmeasures,issues,alternatedefinitions.
• Implicationsforbreastfeedingandnon-breastfeedingchildrenoncorrectingtheerror
• Review4alternatedefinitions• SummarizingMDD,MMF,MAD
PresentationbyJuliaKrasevec
AgreementonanyrevisionstoMADDefinition
3:35-4:30pm SharingoflessonsandrecommendationsfromusersofIYCFmonitoringandoperationalguide(withcoffeebreak)PresentationbyJuliaKrasevecfollowedbydiscussion
Facilitateddiscussion
Day2 8:00am Breakfast Chair JaneBadham,Facilitator8:30–9:30am Presentationon5+yearschildren:primaryschooland
adolescents
PresentationbyChessaLutterPresentationbyOlivierReceveur
Discussiononcurrentissuesandprioritiesfor5+(schoolage)children
9:30–10:00am Presentationon6-59monthsoldchildrenPresentationbyMarieRuel
Discussiononcurrentissuesandprioritiesfor6-59montholds
10:00–10:20am CoffeeBreak10:20–11.20am Presentationonmonitoringbreastfeeding,and
feedingof0-6monthsPresentationbyLarryGrummer-StrawnPresentationbyIpsos
DiscussiononcurrentissuesandpossiblesolutionstoimproveBFmonitoring
11:20-12:15pm SharingoflessonsandrecommendationsfromimplementingtheindicatorsinMICS,DHSandothersurveys.Discussionondatacollection
PresentationbyMICSPresentationbyDHS

Meeting Report on Reconsidering, Refining, and Extending the WHO IYCF Indicators 9
12:15-1:15pm Lunch1:15–3:00pm Sharingoflessonsandrecommendationsfromsurveys
(continued)PresentationonMexicoSurvey:TeresaShamahLevyIssuesandPotentialChangestoFoodCategoriesforDiscussionPresentationbyMaryArimondDiscussion
3:00–3:20pm CoffeeBreak3:20–4:30pm Discussiononspecificquestionsinstandardized
surveys.(MICSwilljoinbyskype)
6.00–8.00pm GroupDinner(Optional)
Day3 8:00am Breakfast Chair JaneBadham,Facilitator8:30–8:40am Groupworkinstructions
Jane
8:40-10:45am GROUPWORKEstablishmentofaprioritizedagendaforimprovementand/ordevelopmentofnewindicatorsonchildfeeding
Group1:first6monthsoflifeGroup2:for6-59monthsGroup3:forolder/schoolagedchildren5+yearsold
1sthouringroup30mininanothergroup30minbackinoriginalgroup
10:45–11:00am CoffeeBreak11:00–12:00pm PlenaryPresentationsofGroupWork
Establishmentofaprioritizedagendaforimprovementand/ordevelopmentofindicatorsfor0-6monthsold
Presentationbygroupsonfirst6monthsoflife.Discussionandconsensusonprioritiesforfirst6monthsoflife
Identifymonitoringgaps.Discussworkplantoimprovemonitoringfor0-6monthold,explorenewindicators
12:00–1:00pm Establishmentofaprioritizedagendaforimprovementand/ordevelopmentofindicatorsfor6-59monthsold
Presentationbygroupsontoddlers(6-59months).Discussionandconsensusonpriorities6-59monthsold
Identifymonitoringgaps.Discussworkplantoimprovemonitoringfor6-59monthold,explorenewindicators

Meeting Report on Reconsidering, Refining, and Extending the WHO IYCF Indicators 10
1:00–2:00pm Lunch2:00-3:00pm Establishmentofaprioritizedagendafor
improvementand/ordevelopmentofindicatorsfor5+yearsold
Presentationbygroupsonolder/schoolagechildren.Discussionandconsensusonprioritiesforolder/schoolagechildren5+yearsold
Identifymonitoringgaps.Discussworkplantoimprovemonitoringfor5+old,explorenewindicators
3:00–3:20pm CoffeeBreak3:20–4:00pm Recapofprioritiesfornewindicatordevelopmentand
nextstepsJuliaKrasevecandMaryArimond
4:00pm Endofmeeting
Meeting Report on Reconsidering, Refining, and Extending the WHO IYCF Indicators 11
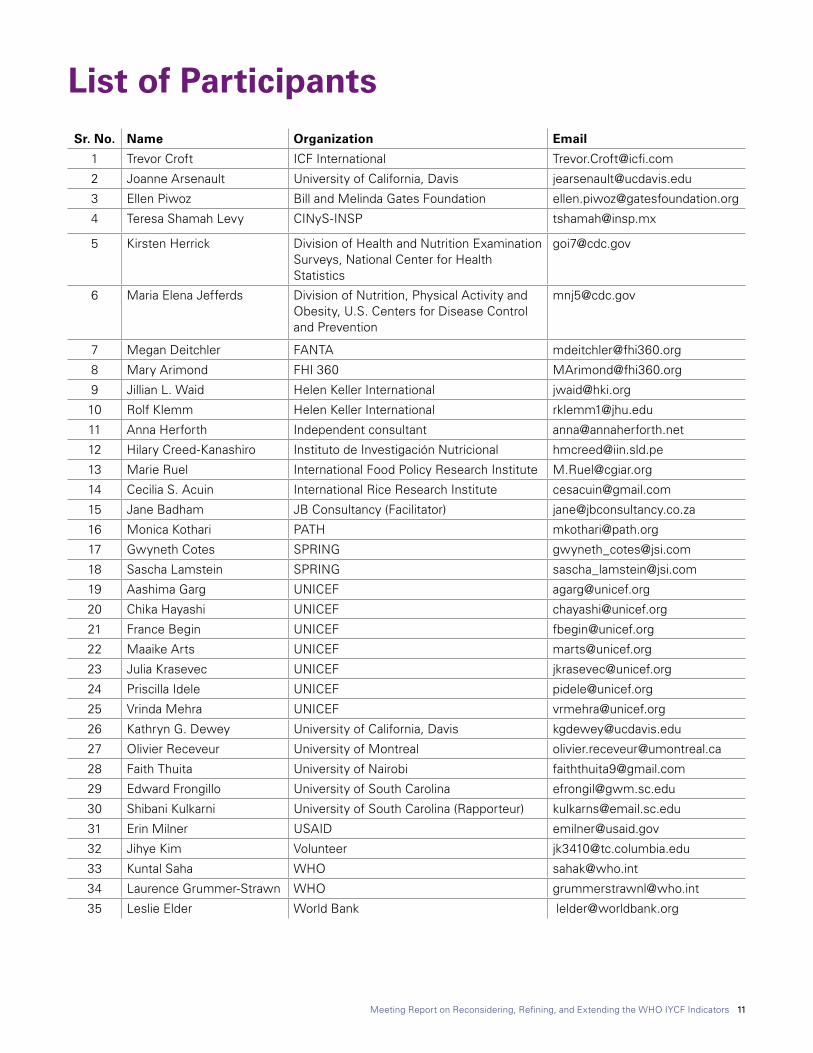
List of ParticipantsSr. No. Name Organization Email
1 Trevor Croft ICF International [email protected]
2 Joanne Arsenault University of California, Davis [email protected]
3 Ellen Piwoz Bill and Melinda Gates Foundation [email protected]
4 Teresa Shamah Levy CINyS-INSP [email protected]
5 Kirsten Herrick Division of Health and Nutrition Examination Surveys, National Center for Health Statistics
6 Maria Elena Jefferds Division of Nutrition, Physical Activity and Obesity, U.S. Centers for Disease Control and Prevention
7 Megan Deitchler FANTA [email protected]
8 Mary Arimond FHI 360 [email protected]
9 Jillian L. Waid Helen Keller International [email protected]
10 Rolf Klemm Helen Keller International [email protected]
11 Anna Herforth Independent consultant [email protected]
12 Hilary Creed-Kanashiro Instituto de Investigación Nutricional [email protected]
13 Marie Ruel International Food Policy Research Institute [email protected]
14 Cecilia S. Acuin International Rice Research Institute [email protected]
15 Jane Badham JB Consultancy (Facilitator) [email protected]
16 Monica Kothari PATH [email protected]
17 Gwyneth Cotes SPRING [email protected]
18 Sascha Lamstein SPRING [email protected]
19 Aashima Garg UNICEF [email protected]
20 Chika Hayashi UNICEF [email protected]
21 France Begin UNICEF [email protected]
22 Maaike Arts UNICEF [email protected]
23 Julia Krasevec UNICEF [email protected]
24 Priscilla Idele UNICEF [email protected]
25 Vrinda Mehra UNICEF [email protected]
26 Kathryn G. Dewey University of California, Davis [email protected]
27 Olivier Receveur University of Montreal [email protected]
28 Faith Thuita University of Nairobi [email protected]
29 Edward Frongillo University of South Carolina [email protected]
30 Shibani Kulkarni University of South Carolina (Rapporteur) [email protected]
31 Erin Milner USAID [email protected]
32 Jihye Kim Volunteer [email protected]
33 Kuntal Saha WHO [email protected]
34 Laurence Grummer-Strawn WHO [email protected]
35 Leslie Elder World Bank [email protected]

Meeting Report on Reconsidering, Refining, and Extending the WHO IYCF Indicators 12
1. Summary of Opening Presentations1.1 WHO IYCF Guideline Development Process
Larry Grummer-Strawn from the WHO presented an update of the WHO IYCF Guidelines. The update on the guidelines is in the initial stages and will undergo a rigorous 2-year process. The update will address issues of measurement of indicators related to breastfed and non-breastfed children. The update will also focus on indicators that include overweight and undernutrition, and incorporate guidelines related to sugar and milk intake as well las the quality of fat in children’s diet. The update will provide further clear guidance and specificity on indicators related to complementary feeding (CF). For more information please see attached presentation in Annex 1, Presentation 1.
1.2 Background on IYCF indicators
Marie Ruel from the International Food Policy and Research Institute (IFPRI) presented a brief background on the IYCF indicators and the need to revise specific CF indicators because of issues related to conceptualization, measurement, and validity. For more information, please see attached presentation in Annex 1, Presentation 2.
1.3 UNICEF IYCF Programming
France Begin from UNICEF provided a brief overview IYCF programming efforts by UNICEF. Discussion included statistics from the global report: From the First Hour of Life. The IYCF programming guide from 2011 is currently being updated and to be released by the end of the year. Several IYCF tools available for the programmers and general public including ProPAN, IYCF e-learning course with Cornell University and IYCF counseling package by UNICEF were discussed. UNICEF strategic plan to include strategies to improve diet diversity and fortified foods was also discussed. For more information, please see the attached presentation in Annex 1, Presentation 3.
2. Minimum Diet Diversity (MDD): Current Definition and Measurement, Issues, and Alternative DefinitionsCurrent Definition of MDD: The proportion of children aged 6-23 months who during the last day or night received foods from four or more of the following seven food groups: 1) grains, roots, and tubers; 2) legumes and nuts; 3) dairy products (milk, yogurt, cheese, infant formula); 4) flesh foods (meat, fish, poultry and liver/organ meats); 5) eggs; 6) vitamin-A rich fruits and vegetables; and 7) other fruits and vegetables. MDD is a proxy indicator for mean micronutrient density adequacy of the diet1 and is measured by counting the number of food groups a child received in the last day or night. Validation studies show that infants and young children who consumed at least four of the seven groups were more likely to have diets that were higher in micronutrient density.
Mary Arimond from FHI 360 provided an overview of MDD, the main issues requiring possible modification, validation studies, possible options for modification, and data analysis results from the possible modifications.
2.1 MDD: Updating the indicator food groups to include breast milk
IssueThe current indicator does not include breast milk as a part of the diet diversity food groups and hence breastfeeding is not “counted” as a part of the child’s diet. Because the cut-off for minimum diet diversity is 4+ food groups for both breast-fed and non-breastfed children, non-breastfed children are favored as infant formula is included under the dairy food group. Despite specific instruction against comparing breastfed and non-breastfed children, experience has shown that such comparisons are often made, which make assessment between breastfed and non-breastfed children unfair and inconsistent. To address this, four options were presented to the technical consultation:
Option 1: Allow breast milk to count as dairy food in the 7-point score for MDDRationale: This would eliminate current advantage for non-breastfed children. Breastfed children would always receive at least one point for their diet diversity.
1 Mean micronutrient density adequacy refers to the micronutrient den-sity adequacy averaged across a set of micronutrients (excluding iron), for which each had been capped at 100%. This was based on the original analyses done prior to the adoption of the MDD indicator. For simplicity, micronutrient density is used throughout the remainder of the report.
Meeting Report on Reconsidering, Refining, and Extending the WHO IYCF Indicators 13
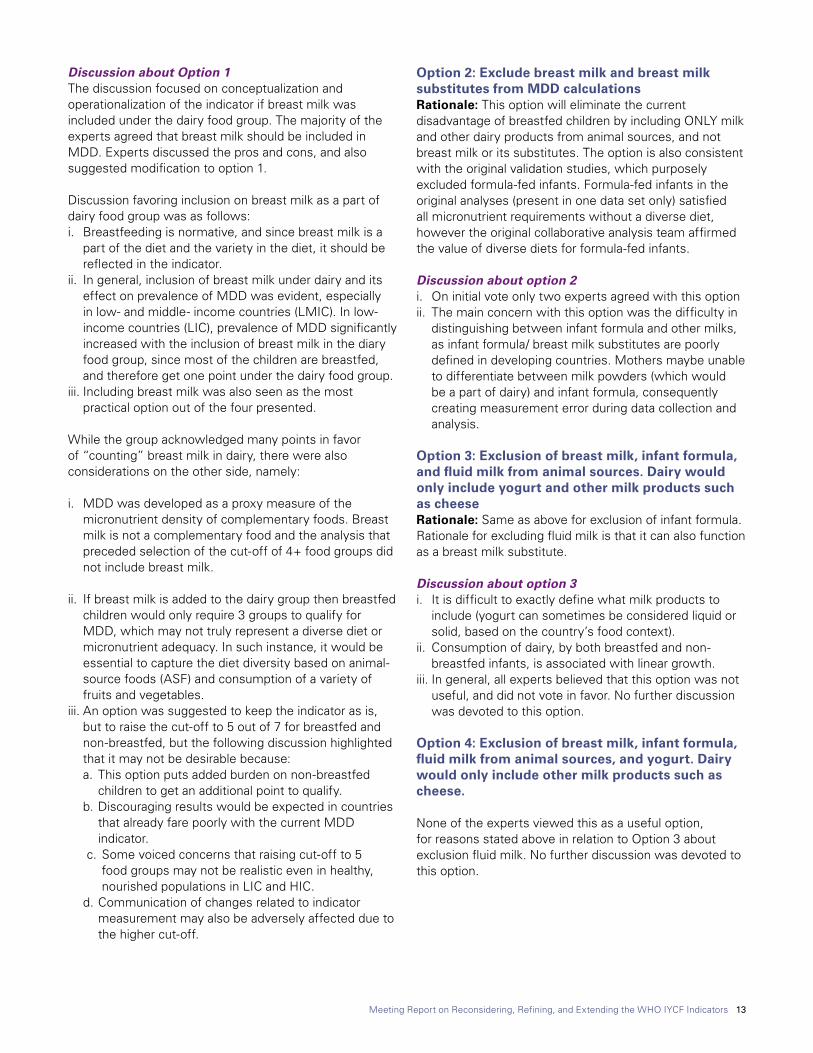
Discussion about Option 1The discussion focused on conceptualization and operationalization of the indicator if breast milk was included under the dairy food group. The majority of the experts agreed that breast milk should be included in MDD. Experts discussed the pros and cons, and also suggested modification to option 1.
Discussion favoring inclusion on breast milk as a part of dairy food group was as follows:i. Breastfeeding is normative, and since breast milk is a
part of the diet and the variety in the diet, it should be reflected in the indicator.
ii. In general, inclusion of breast milk under dairy and its effect on prevalence of MDD was evident, especially in low- and middle- income countries (LMIC). In low-income countries (LIC), prevalence of MDD significantly increased with the inclusion of breast milk in the diary food group, since most of the children are breastfed, and therefore get one point under the dairy food group.
iii. Including breast milk was also seen as the most practical option out of the four presented.
While the group acknowledged many points in favor of “counting” breast milk in dairy, there were also considerations on the other side, namely:
i. MDD was developed as a proxy measure of the micronutrient density of complementary foods. Breast milk is not a complementary food and the analysis that preceded selection of the cut-off of 4+ food groups did not include breast milk.
ii. If breast milk is added to the dairy group then breastfed children would only require 3 groups to qualify for MDD, which may not truly represent a diverse diet or micronutrient adequacy. In such instance, it would be essential to capture the diet diversity based on animal-source foods (ASF) and consumption of a variety of fruits and vegetables.
iii. An option was suggested to keep the indicator as is, but to raise the cut-off to 5 out of 7 for breastfed and non-breastfed, but the following discussion highlighted that it may not be desirable because:a. This option puts added burden on non-breastfed
children to get an additional point to qualify. b. Discouraging results would be expected in countries
that already fare poorly with the current MDD indicator.
c. Some voiced concerns that raising cut-off to 5 food groups may not be realistic even in healthy, nourished populations in LIC and HIC.
d. Communication of changes related to indicator measurement may also be adversely affected due to the higher cut-off.
Option 2: Exclude breast milk and breast milk substitutes from MDD calculationsRationale: This option will eliminate the current disadvantage of breastfed children by including ONLY milk and other dairy products from animal sources, and not breast milk or its substitutes. The option is also consistent with the original validation studies, which purposely excluded formula-fed infants. Formula-fed infants in the original analyses (present in one data set only) satisfied all micronutrient requirements without a diverse diet, however the original collaborative analysis team affirmed the value of diverse diets for formula-fed infants.
Discussion about option 2i. On initial vote only two experts agreed with this optionii. The main concern with this option was the difficulty in
distinguishing between infant formula and other milks, as infant formula/ breast milk substitutes are poorly defined in developing countries. Mothers maybe unable to differentiate between milk powders (which would be a part of dairy) and infant formula, consequently creating measurement error during data collection and analysis.
Option 3: Exclusion of breast milk, infant formula, and fluid milk from animal sources. Dairy would only include yogurt and other milk products such as cheeseRationale: Same as above for exclusion of infant formula. Rationale for excluding fluid milk is that it can also function as a breast milk substitute.
Discussion about option 3i. It is difficult to exactly define what milk products to
include (yogurt can sometimes be considered liquid or solid, based on the country’s food context).
ii. Consumption of dairy, by both breastfed and non-breastfed infants, is associated with linear growth.
iii. In general, all experts believed that this option was not useful, and did not vote in favor. No further discussion was devoted to this option.
Option 4: Exclusion of breast milk, infant formula, fluid milk from animal sources, and yogurt. Dairy would only include other milk products such as cheese.
None of the experts viewed this as a useful option, for reasons stated above in relation to Option 3 about exclusion fluid milk. No further discussion was devoted to this option.
Meeting Report on Reconsidering, Refining, and Extending the WHO IYCF Indicators 14
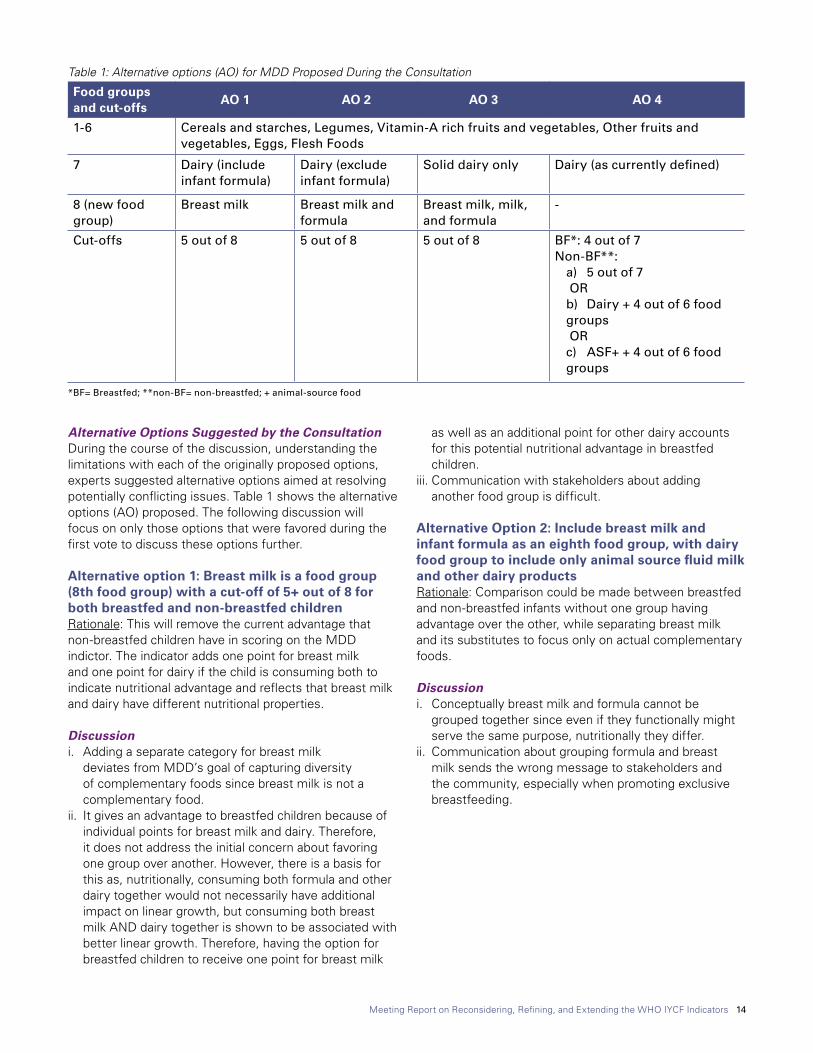
Alternative Options Suggested by the ConsultationDuring the course of the discussion, understanding the limitations with each of the originally proposed options, experts suggested alternative options aimed at resolving potentially conflicting issues. Table 1 shows the alternative options (AO) proposed. The following discussion will focus on only those options that were favored during the first vote to discuss these options further.
Alternative option 1: Breast milk is a food group (8th food group) with a cut-off of 5+ out of 8 for both breastfed and non-breastfed children Rationale: This will remove the current advantage that non-breastfed children have in scoring on the MDD indictor. The indicator adds one point for breast milk and one point for dairy if the child is consuming both to indicate nutritional advantage and reflects that breast milk and dairy have different nutritional properties.
Discussion i. Adding a separate category for breast milk
deviates from MDD’s goal of capturing diversity of complementary foods since breast milk is not a complementary food.
ii. It gives an advantage to breastfed children because of individual points for breast milk and dairy. Therefore, it does not address the initial concern about favoring one group over another. However, there is a basis for this as, nutritionally, consuming both formula and other dairy together would not necessarily have additional impact on linear growth, but consuming both breast milk AND dairy together is shown to be associated with better linear growth. Therefore, having the option for breastfed children to receive one point for breast milk
as well as an additional point for other dairy accounts for this potential nutritional advantage in breastfed children.
iii. Communication with stakeholders about adding another food group is difficult.
Alternative Option 2: Include breast milk and infant formula as an eighth food group, with dairy food group to include only animal source fluid milk and other dairy productsRationale: Comparison could be made between breastfed and non-breastfed infants without one group having advantage over the other, while separating breast milk and its substitutes to focus only on actual complementary foods.
Discussioni. Conceptually breast milk and formula cannot be
grouped together since even if they functionally might serve the same purpose, nutritionally they differ.
ii. Communication about grouping formula and breast milk sends the wrong message to stakeholders and the community, especially when promoting exclusive breastfeeding.
Table 1: Alternative options (AO) for MDD Proposed During the Consultation
Food groups and cut-offs
AO 1 AO 2 AO 3 AO 4
1-6 Cereals and starches, Legumes, Vitamin-A rich fruits and vegetables, Other fruits and vegetables, Eggs, Flesh Foods
7 Dairy (include infant formula)
Dairy (exclude infant formula)
Solid dairy only Dairy (as currently defined)
8 (new food group)
Breast milk Breast milk and formula
Breast milk, milk, and formula
-
Cut-offs 5 out of 8 5 out of 8 5 out of 8 BF*: 4 out of 7Non-BF**:
a) 5 out of 7 ORb) Dairy + 4 out of 6 food groups ORc) ASF+ + 4 out of 6 food groups
*BF= Breastfed; **non-BF= non-breastfed; + animal-source food
Meeting Report on Reconsidering, Refining, and Extending the WHO IYCF Indicators 15
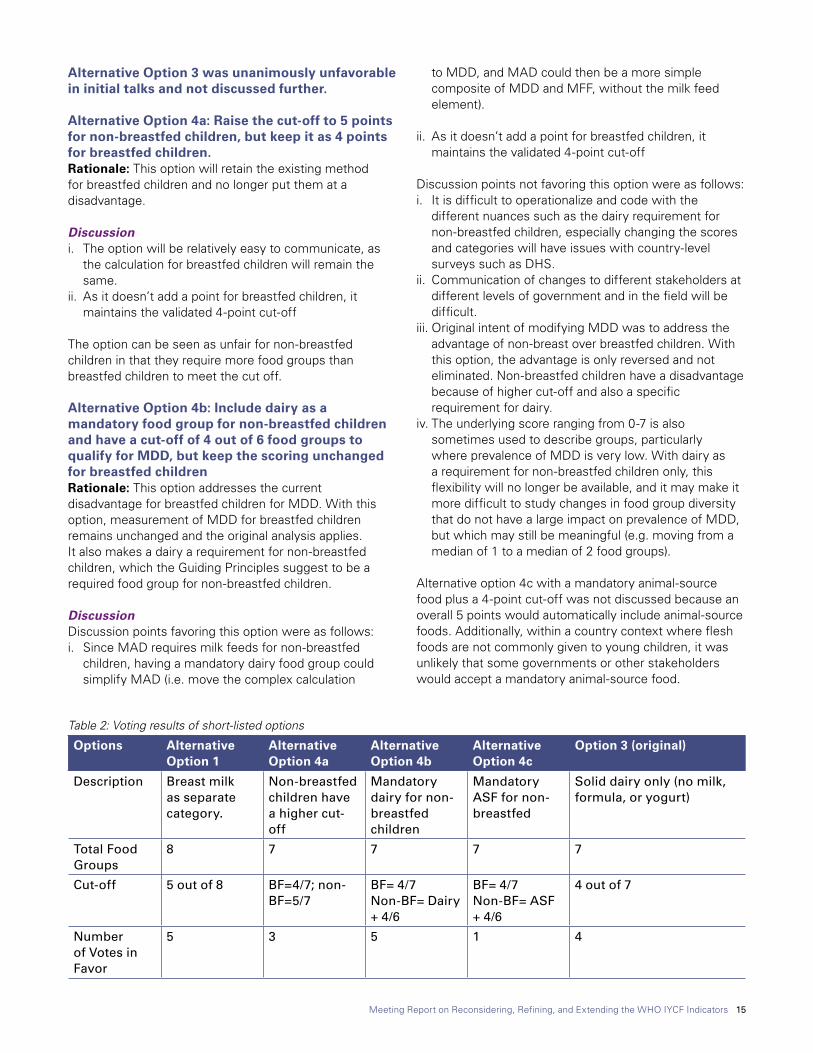
Alternative Option 3 was unanimously unfavorable in initial talks and not discussed further.
Alternative Option 4a: Raise the cut-off to 5 points for non-breastfed children, but keep it as 4 points for breastfed children.Rationale: This option will retain the existing method for breastfed children and no longer put them at a disadvantage.
Discussioni. The option will be relatively easy to communicate, as
the calculation for breastfed children will remain the same.
ii. As it doesn’t add a point for breastfed children, it maintains the validated 4-point cut-off
The option can be seen as unfair for non-breastfed children in that they require more food groups than breastfed children to meet the cut off.
Alternative Option 4b: Include dairy as a mandatory food group for non-breastfed children and have a cut-off of 4 out of 6 food groups to qualify for MDD, but keep the scoring unchanged for breastfed childrenRationale: This option addresses the current disadvantage for breastfed children for MDD. With this option, measurement of MDD for breastfed children remains unchanged and the original analysis applies. It also makes a dairy a requirement for non-breastfed children, which the Guiding Principles suggest to be a required food group for non-breastfed children.
DiscussionDiscussion points favoring this option were as follows:i. Since MAD requires milk feeds for non-breastfed
children, having a mandatory dairy food group could simplify MAD (i.e. move the complex calculation
to MDD, and MAD could then be a more simple composite of MDD and MFF, without the milk feed element).
ii. As it doesn’t add a point for breastfed children, it maintains the validated 4-point cut-off
Discussion points not favoring this option were as follows:i. It is difficult to operationalize and code with the
different nuances such as the dairy requirement for non-breastfed children, especially changing the scores and categories will have issues with country-level surveys such as DHS.
ii. Communication of changes to different stakeholders at different levels of government and in the field will be difficult.
iii. Original intent of modifying MDD was to address the advantage of non-breast over breastfed children. With this option, the advantage is only reversed and not eliminated. Non-breastfed children have a disadvantage because of higher cut-off and also a specific requirement for dairy.
iv. The underlying score ranging from 0-7 is also sometimes used to describe groups, particularly where prevalence of MDD is very low. With dairy as a requirement for non-breastfed children only, this flexibility will no longer be available, and it may make it more difficult to study changes in food group diversity that do not have a large impact on prevalence of MDD, but which may still be meaningful (e.g. moving from a median of 1 to a median of 2 food groups).
Alternative option 4c with a mandatory animal-source food plus a 4-point cut-off was not discussed because an overall 5 points would automatically include animal-source foods. Additionally, within a country context where flesh foods are not commonly given to young children, it was unlikely that some governments or other stakeholders would accept a mandatory animal-source food.
Table 2: Voting results of short-listed options
Options Alternative Option 1
Alternative Option 4a
Alternative Option 4b
Alternative Option 4c
Option 3 (original)
Description Breast milk as separate category.
Non-breastfed children have a higher cut-off
Mandatory dairy for non-breastfed children
Mandatory ASF for non-breastfed
Solid dairy only (no milk, formula, or yogurt)
Total Food Groups
8 7 7 7 7
Cut-off 5 out of 8 BF=4/7; non-BF=5/7
BF= 4/7Non-BF= Dairy + 4/6
BF= 4/7Non-BF= ASF + 4/6
4 out of 7
Number of Votes in Favor
5 3 5 1 4

Meeting Report on Reconsidering, Refining, and Extending the WHO IYCF Indicators 16
The pros and cons for the originally proposed options and alternative options suggested in the meeting were discussed over the course of two days and were further shortlisted. Voting results for options that got one or more votes are described in Table 2. Alternative options 1, 4a, and original option 3 were discussed further. Similar issues about conceptual ideas of favoring breastfed or non-breastfed were examined. Ease of operationalization and communication was discussed as well. Original option 3 was disqualified because specific difficulty in operationalizing and measuring consumption on only solid dairy products. Another round of voting of the remaining two options i.e. alternative option 1 and 4a resulted in an almost split vote of 9 and 10 experts favoring the each of options, respectively.
On the last day of the consultation, four possible options (two originally proposed options and two alternative options with a split vote) were discussed on specific
issues of simplicity, conceptual justification, measurement issues, nutritional requirements, equality among breastfed and non-breastfed children, and issues with time series disruption with regards to previous rounds of DHS and MICS. This information is presented in Table 3. Mary Arimond presented the original table and modifications were made to the report based on the surrounding discussion.
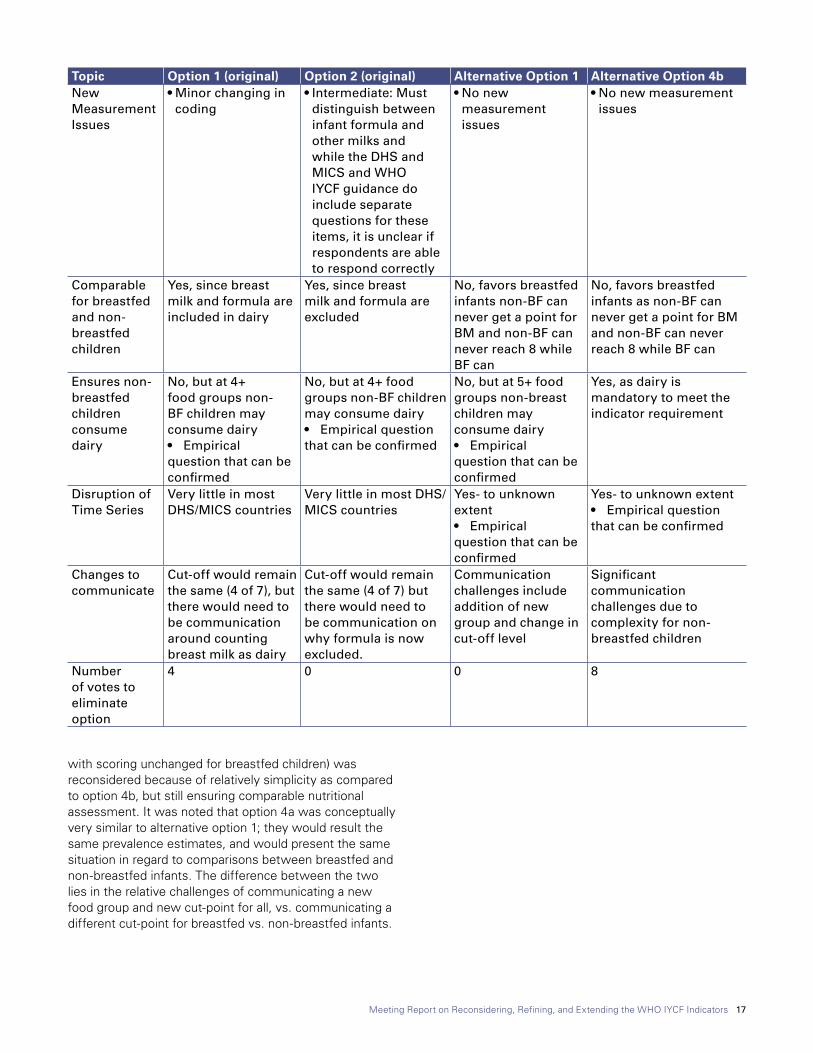
A final vote was called to eliminate options that would be unsuited based on the side-by-side comparison. Original option 1 and alternative option 4b were eliminated based on the potential complexity in measurement, operationalization, and possible issues with changes that would need to be communicated to stakeholder at international, national and local level.
Additionally, alternative option 4a (which only raises the cut-off for non-breastfed children to 5 out of 7,
Table 3: Comparison, brief discussion, and voting results of short-listed optionsTopic Option 1 (original) Option 2 (original) Alternative Option 1 Alternative Option 4bDescription Include breast milk
in dairy food group and both Bf and non-Bf require minimum of 4/7
Exclude formula and breast milk from calculations and require minimum of 4/7 for both Bf and non-BF
Include breast milk as an eight food group, with a 5/8 cut-off for all children
Mandatory dairy plus 4/6 groups to qualify for MDD for non-Bf while retaining 4/7 for BF
Simplicity • Same cut-off for BF and non-BF
• Same cut off as current indicator
• Easy to calculate• Can use sameunderlying score
to generate other descriptive statistics
• Same cut-off for BF and non-BF
• Same cut off as current indicator
• Easy to calculate• Can use same
underlying score to generate other descriptive statistics
• Same cut off for BF and non-BF
• Different cut off than current indicator
• Easy to calculate• Can use same
underlying score to generate other descriptive statistics
• Different cut-off for BF and non-BF
• Same cut off as current indicator for BF only
• Complicated calculation as different cut-off and calculation for non-BF, similar to current MAD
• Must calculate separate score to generate other descriptive statistics.
Conceptual Justification
• No, since breast milk is grouped with formula
• Breastfed children need only 3 groups to qualify for MDD which is insufficient and not aligned with the analysis the original indicators were based on
• Yes, since only complementary foods are counted
• Aligns with the main intent of capturing diversity of CF and is supported by the original analysis
• Yes, as does not equate BM with formula or other dairy and specifically creates a separate group for BM , which allows breastfed children who also consume dairy to get one point for dairy in addition to one point for BM which is linked with evidence on linear growth
• Yes, separates breast milk and formula
• Aligns with guiding principles of required dairy for non-breastfed children
• For breastfed infants, supported by original analysis
Meeting Report on Reconsidering, Refining, and Extending the WHO IYCF Indicators 17
Topic Option 1 (original) Option 2 (original) Alternative Option 1 Alternative Option 4bNew MeasurementIssues
• Minor changing in coding
• Intermediate: Must distinguish between infant formula and other milks and while the DHS and MICS and WHO IYCF guidance do include separate questions for these items, it is unclear if respondents are able to respond correctly
• No new measurement issues
• No new measurement issues
Comparable for breastfed and non-breastfed children
Yes, since breast milk and formula are included in dairy
Yes, since breast milk and formula are excluded
No, favors breastfed infants non-BF can never get a point for BM and non-BF can never reach 8 while BF can
No, favors breastfed infants as non-BF can never get a point for BM and non-BF can never reach 8 while BF can
Ensures non-breastfed children consume dairy
No, but at 4+ food groups non-BF children may consume dairy• Empirical question that can be confirmed
No, but at 4+ food groups non-BF children may consume dairy• Empirical question that can be confirmed
No, but at 5+ food groups non-breast children may consume dairy• Empirical question that can be confirmed
Yes, as dairy is mandatory to meet the indicator requirement
Disruption of Time Series
Very little in most DHS/MICS countries
Very little in most DHS/MICS countries
Yes- to unknown extent• Empirical question that can be confirmed
Yes- to unknown extent• Empirical question that can be confirmed
Changes to communicate
Cut-off would remain the same (4 of 7), but there would need to be communication around counting breast milk as dairy
Cut-off would remain the same (4 of 7) but there would need to be communication on why formula is now excluded.
Communication challenges include addition of new group and change in cut-off level
Significant communication challenges due to complexity for non-breastfed children
Number of votes to eliminate option
4 0 0 8
with scoring unchanged for breastfed children) was reconsidered because of relatively simplicity as compared to option 4b, but still ensuring comparable nutritional assessment. It was noted that option 4a was conceptually very similar to alternative option 1; they would result the same prevalence estimates, and would present the same situation in regard to comparisons between breastfed and non-breastfed infants. The difference between the two lies in the relative challenges of communicating a new food group and new cut-point for all, vs. communicating a different cut-point for breastfed vs. non-breastfed infants.

Meeting Report on Reconsidering, Refining, and Extending the WHO IYCF Indicators 18
Summary of Final Decision and Way Forward for Dairy Food Group Options for MDD
Experts agreed that selection of any one option for the dairy group for the MDD indicator would require more discussion beyond the current consultation. The group agreed that taking into account all the discussions; the Secretariat could take the final decision.2 The group further agreed that they could support any of the options of Option 2, Alternative option 1, and Alternative option 4a (as AO4a was seen as almost equivalent to AO 1).
2.2 MDD: Interpretation of the Indicator
Issue: MDD was validated as a proxy of micronutrient density, however, it would be important to assess if MDD should be considered more broadly as diverse diets are also likely related to better diet quality as a whole, important for reflecting development of healthy eating habits among infants and young children, and providing other essential nutritional components such as fiber and phytochemicals. Broadening the interpretation of MDD has implications for classification of other foods such as fortified food supplements and use of MDD in high-income countries (HIC).
Discussion: No decision was needed on this issue. General discussion provided support for the value of food-group diversity, beyond solely as a proxy for micronutrient density.
2.3 MDD: Revisiting Fruit and Vegetable Groupings
Issue: Despite clear guidance on classifying Vitamin-A rich fruits and vegetables, operationalizing this indicator has been challenging in the field. Sometimes foods not rich in Vitamin A are classified under this food group leading to error. Additionally, a child can get two points total for eating only fruits from the two food groups, which can be an easy way to reach the required four points without consuming any vegetables. Also, there is less consistency in measurement across countries, as fruit and vegetable intake in HIC is not differentiated per the WHO 2010 criterion for Vitamin A rich fruits and vegetables.
2 The post-meeting decision was to select Alternative Option 1, which is to create an eighth food group for breast milk and have a score of 5/8 food groups for both breastfed and non-breastfed children. The reason for this decision was largely based on the rationale discussed during the meeting which can be summarized as follows: (i) Breast milk is not combined with other milks, but kept as an important separate food group for this age group; (ii) It no longer puts breastfed children at a disadvantage: while there is an apparent disadvantage to non-BF children with the new definition, it is somewhat justifiable and we can communicate that while a non-BF child cannot have a point for breastmilk, the optimal diet for their age would have breastmilk; (iii) While the concept of complementary feeding as something – apart from breast milk – is lost, the concept of the indicator reflect-ing different food groups a child of this age should eat can be communicated as the would include breastmilk; (iv) Difference between younger and older age groups may be minimized: Older kids are less likely to get breast milk than younger kids; therefore less older children will get the 8th food group (BM) than younger children. So, we may not see such a difference between older and younger breastfed kids as seen with the current defini-tion; and (v) Still ensures a diverse diet: By raising the cut-off but adding breast milk as the new food group, the indicator still ensures that infant gets a diverse diet.
Option1: No change to the original foods groupsRationale: No disruption to measurement, operationalization, and use.
Option 2: Change the food groups with one fruit food group and one vegetable food group. Rationale: This categorization will award one point each for fruits and vegetable consumption thus representing a more diverse diet. It will also simplify data collection and eliminate errors in data collection due to categorization of vitamin-A rich foods. It will align with the data collected in HIC and make the process of measurement and operationalization more standardized across the board.
Discussion Experts appreciated the issue and challenges faced in the field, but agreed that categories should remain unchanged because the underlying concept is to capture micronutrient density and allowing separate categories for vitamin-A rich fruits and vegetables, and other fruits and vegetables may help strengthen associations to nutrient density. If categories are changed, the current discussion about potentially changing MDD would be invalid and we would require renewed discussions and more options. In order to fully capture fruit and vegetable consumption, forming a different indicator would be more appropriate and would need to be discussed at a later time.
2.4 MDD: Revisiting Tricky Decisions on Categorizing Items into Food Groups
Issue: Categorization of certain foods into the MDD food groups can be challenging based on their specific role in providing micronutrients such as specialized fortified foods, lipid-based nutrient supplements etc., which help in meeting micronutrient needs, but may have issues in classifying based on the major ingredients in the foods. The following foods were discussed and summary of the discussion is presented below:
1. Fortified Infant Foods: These foods provide adequate micronutrients, however, there may be confusion or difficulty in easily classifying them under the seven food groups for MDD. For example, fortified infant foods may have fat as their main ingredient, but cannot be categorized in any food group since fats is not a food group category. Further, there can also be an issue about what should be considered as the
Meeting Report on Reconsidering, Refining, and Extending the WHO IYCF Indicators 19
main ingredient. Should it be based on a specific quantity ingredients or the first ingredient? The general consensus among experts was to follow the current WHO IYCF recommendation (2010) to classify the foods based on their main ingredient because:i. Currently, there isn’t a strong argument or empirical
evidence to support modifying the categorization of these foods
ii. Main ingredient is easy to identify, but for the smaller ingredients, nutritional information and/ or ingredient list may not be available. Therefore, categorization based on quantity may not be possible across countries.
iii. Fortified foods, especially large-scale fortified foods, should not be added to MDD, as it may be antithetical to the message of having greater diet diversity.
iv. As recommended in WHO 2010, a separate question on coverage or use of fortified foods should be added to the questionnaires, which can also cover large-scale fortification and foods such as lipid-based nutrient supplement (LNS).
General consensus: Classify fortified infant foods based on the main ingredient per the existing WHO IYCF guidelines.
2. Sweetened dairy food and beverages: Diet quality of these foods is mixed due to high sugar content. Categorization of these foods under the dairy food group may go against the conceptual and nutritional justification. Additionally, in developing countries, sweetened dairy foods may be marketed as having dairy but the actual dairy content maybe negligible. The related discussion highlighted the following points: i. Experts appreciated that this food category will
require more nuanced attention due to variability of products and information available across countries, especially for data collection and analysis. Efforts may need to be geared for more specific data collection including brand names and list of ingredients.
ii. Hundreds of sweetened dairy products are available and it would make it difficult for enumerators and data analysts to assess which foods to classify under dairy if a brand name isn’t available. DHS may have the ability to collect the brand name of products, but MICS does not have a provision for brand name inclusion in their questionnaires.
iii. WHO guidelines (2010) have a separate category for sweets, which includes the category “any other sweets”. Adding sweetened dairy foods and beverages to that category should be at the discretion of the country for national surveys. Additional category of sweet dairy beverages can also be considered.
General Consensus: Countries should take the final decision on inclusion of sweet dairy products such as ice cream and dairy-based puddings in either dairy or other sweet foods. An additional category for sweetened dairy beverages could also be included in the questionnaires, to allow countries to capture all sugar-sweetened beverages. Categorizing these foods in either way would be unlikely to substantially change the prevalence of MDD; the group advised that sweetened dairy beverages should still be counted as dairy, and it was judged that the proportion of children consuming sweetened dairy desserts (ice cream, custard) and no other dairy is likely to be small.
3. Sweetened fruits: While these foods may provide fruits, they may have very high sugar content, and therefore may not be suitable to categorize in MDD. The following points were discussed: i. Fruit consumption cannot be accurately determined
as fruit desserts may have syrup and therefore how much fruit is actually provided to the child cannot be easily assessed.
ii. The current WHO guidelines (2010) already have sweet category, which includes common desserts such as jams, pies, pastries etc. under which sweetened fruits could be categorized.
iii. Other sweet dishes could be categorized under fruits based on how they are prepared, a decision that can be made at the country-level; however, some guidance should be provided to the country on what can be considered as fruit. A repository of fruit dishes/ recipes would be useful for categorized sweetened fruit.
Summary for future consideration: Sweetened fruits could be categorized under the already existing “fruits and vegetables” and/or “vitamin A rich fruits and vegetables” category but also if a mixed dish it could fall under the “sweets” category. For example, if a mixed food such as apple pie is part of the previous day’s intake, the apple pie could simply be put under sweets category with no break up of main ingredients, but this could be at the discretion of the country.
4. Grains and tuber-based savory snacks: The main issue with these foods is the low micronutrient and high fat and/or sodium content, which may not be suitable to be counted under MDD. The following points were discussed.
i. Excluding savory snacks would not affect the prevalence of MDD since most children would be consuming some kind of staple cereal or starch.
ii. A separate category would be useful for enumerators during data collection to put the snacks in one group such as ‘savory snacks’.
iii. Country-level decisions have to be made on what foods would be categorized as snacks.
General consensus: Create a separate category for savory snacks to include grain- and tuber-based savory snacks.
Meeting Report on Reconsidering, Refining, and Extending the WHO IYCF Indicators 20
5. Processed meats: While processed meats may provide micronutrients and proteins, high sodium and fat content makes them unhealthy to be categorized under the MDD food groups.
General consensus: While this discussion was short due to limited time, the general consensus was to put these food items under meats as they provide proteins and micronutrients, unless used as a condiment, in other words, used as a seasoning to provide flavor in very small amounts (e.g. fish powder, bacon bits, chilies)that would not provide nutrients such as proteins or micronutrients in sufficient quantities to count as one of the 7 food groups.
6. Mixed dishes with one main ingredient: The main issue with these foods is to discern the specific ingredients from the mixed ingredients that should be categorized in the food groups. The following points were discussed: i. Recall of smaller quantities of foods in mixed dishes
is less likely, therefore all ingredients may not be known in a mixed dish
ii. Visibility of ingredients may or may not indicate consumption of that ingredient based on color, texture, and size. Therefore visibility may not be a reliable indicator to determine the consumption of all the ingredients in a mixed dish.
iii. Concerns were raised about selective eating of ingredients in a dish. For example. Picking “good” foods or liked or disliked foods can affect intake but not be accounted if recall is not correct.
iv. There was agreement on the issue that if there is substantial mixed food, (e.g. rice and beans) then include both ingredients in the respective food groups.
General consensus: Categorize foods according to main ingredient unless multiple ingredients, which can be considered as main ingredients (e.g. rice and beans).
7. Minor ingredients in mixed dishes, often added flavor, or coating, garnish
General Consensus: without much discussion that these foods should not be included in the MDD food groups
3. Operationalizing MDD Using Quantitative 24-Hour RecallSummary of Options and Rationale
Data collection for quantitative 24-hour recalls differ among countries. For example, in the U.S. NHANES, foods can be linked to recipes and therefore ingredient information is available, while in the U.K., only a subset of composite dishes are disaggregated, while others are coded and described based on major ingredients e.g. spaghetti with tomato sauce. Therefore, is it sufficient to focus on main ingredients for MDD or also capture the minor ingredients? In addition, is it important to have a specified minimum quantity for the ingredient to be included in the MDD food groups?
While the two questions were posed separately, it was noted that the two questions were in fact interrelated and were discussed together.
Summary of Discussion
The experts generally agreed that use of the quantitative 24-hour recall data should be based on the information available in each case. Wherever disaggregate data are available, it would be best to include all known ingredients to calculate MDD at the ingredient level. For example, the U.S. NHANES data can be disaggregated; therefore, use ingredients from recipes for MDD calculation. In countries where recipe data are unavailable categorize based on the main ingredient. The decision to use disaggregated data and the level of disaggregated data will depend on the country. To determine if minimum quantity is required, discussion focused on understanding what would be the appropriate minimum quantity, at the food level. The summary of the discussion is as follows:
i. The group generally favored requiring a minimum quantity for a food to count in the score. Considering amounts usually recommended across the age range – i.e. when introducing foods at 6 months, and up to 23 months, the group favored keeping the minimum quite small, so that it could be realistic even for the youngest.
ii. A vote to decide the minimum quantity between 10g and 15g, revealed 10g for an ingredient each time it was consumed as the favorable option (11 votes for 10g vs. 4 votes for 15g).
Summary of Final Decision and Way Forward
Calculation of MDD based on quantitative 24-hour recall should be based on the available data. If disaggregated
Meeting Report on Reconsidering, Refining, and Extending the WHO IYCF Indicators 21
data are available, all available ingredients should be used for calculation or else the main ingredient approach should be followed. The minimum quantity to be used whenever possible was decided as 10g (2 teaspoons) at the specific food level (not food group category) each time it was fed.
4. Minimum Meal Frequency: Current Definition, What it Measures, Issues, and Alternate DefinitionsThe minimum meal frequency (MMF) indicator captures the caloric sufficiency of a child’s diet. It is measured as the proportion of breastfed and non-breastfed children 6–23 months of age who receive solid, semi-solid, or soft foods (but also including milk feeds for non-breastfed children) the minimum number of times or more• Minimum solid, semi-solid, or soft foods for breastfed
children: 2 (6-8 months); 3 (9-23 months)• Minimum solid, semi-solid, or soft foods (including
formula) for non-breastfed children: 4 (6-23 months)
There are three main issues with the current MMF indicator:i. It allows for any feeds for a non-breastfed child i.e. the
child can have four or more milk/ formula feeds, or four or more solid feeds to qualify for this indicator, but the Guiding Principles (and other guidance) advises the introduction of semi-solid foods at ~6 months; fluid only diets are not recommended
ii. Operationalizing MMF with quantitative-24 hour recall data: What is the best way to separate meals (according to times/ meal times- breakfast, lunch, bdinner)? If meals are time stamped, what is sufficient amount of time to separate two feeding episodes?
iii. How should milk feeds that occur within the same meal with other solid foods be addressed?
Summary of Options and Rationale
Options for reconsidering MMF for non-breastfed children• No changes to be made
• Option 1: Evaluate MMF in a more complex manner to involve a separate requirement for milk feeds and solid feeds, with different requirements according younger infants, and older infants and toddlers.
Rationale: More comparable to breastfed children and represents a more nutritionally adequate diet. This option moves the complexity currently found in MAD (where milk feeds are considered separated) into MMF ; this raises the possibility of simplifying MAD to a simple composite of MDD and MFF (i.e. dropping milk feed criterion from MAD).
• Option 2: Disallow milk feeds, and count only solid/semisolid/ soft feeds per the age groups for breastfed children
Rationale: This would eliminate the issue of milk feeds for non-breastfed children, and only measure solid foods provided to the child that is comparable to breastfed children, however, energy requirement may not be met with only 2-3 solid feeds.
• Option 3: Disallow milks, and count only solid/semisolid/ soft feeds, but keep the same minimum number of 4 meals for non-breastfed children
Rationale: This would eliminate the issue of milk feeds while ensuring energy adequacy. However, energy intakes could be excessive with 4 solids feeds and a substantial number of milk feeds. Also, 4 solid feeds may be excessive among the youngest age group, whose diets are dominated by milk feeds.
See Annex 2, Presentation 1 for more information and graphics on the above-mentioned options.
Summary of Discussion
An initial show of hands highlighted that more than half of the experts were in favor of Option 1, which suggested opting a similar count of solid and milk feeds for non-breastfed child in an age-appropriate manner (6-8 months & 9-23 months) as the breastfed in children in the original indicator. The remaining votes were split between staying with the current indicator and option 2, which focused only on solid feeds and disallows milk feeds.
A modified option 2 was suggested early on: To ask a yes/no question about if the child had milk feeds, and then asking the mother about the number of solid feeds. This would account for both milk and solid feeds but also help to indicate the desired number of semi-solid feeds received to meet MMF. The group noted that if the modified option were selected, it would suggest that only three solid feeds might be adequate along with one milk feed, but that could provide insufficient energy. It could also suggest solid feeds are better than liquid feeds, which is not the case. Those in favor of the modified option argued this option addresses the concern of all milk or only solid feeds. In general, experts suggested that modified option could create more confusion for data collection and operationalize.
Changing MDD as well as MMF would set the bar too high, and will pose great challenges in communicating the changes effectively to different stakeholders. The original aim of MMF was energy intake, irrespective of the form of food. There was empirical evidence to show that a minimum of four feeds is essential based of age and gastric capacity. We would require further

Meeting Report on Reconsidering, Refining, and Extending the WHO IYCF Indicators 22
evidence to determine the required number of milk and solid feeds if other options are to be considered. If only energy requirement is the concern then there is no need for change in MMF. After understanding the basis for original MMF, most experts agreed to keep the indicator unchanged, but also noted that further data analysis can be done to confirm if energy requirement is met with all the options that were suggested. Specifically, one participant indicated that evidence from the Philippines suggests that IYC are not getting enough energy when not getting any milk feeds (even as young as 8 months), additional analysis could be helpful to provide evidence for suggested revisions in future. It was also highlighted that based on infant formula nutrient composition; if only 4 infant formula feedings were fed in a day, that would not result in sufficient energy intake. Therefore this issue might be taken up in future with additional analysis.
Operationalization of MMF from the quantitative 24-hour-recall
General discussion highlighted that differentiating milk feeds from solid feeds was not an issue, whether time stamped or counted through meals. The counting of feeding episodes was also discussed, and as is currently done, the number of feeding episodes could be counted and meals would not need to be distinguished from snacks.
Summary of final decisions and way forward
Experts unanimously decided that since MMF was a proxy for energy adequacy, the indicator should not be changed to avoid confusion and complexity in operationalization and communication with other stakeholders. However, as one participant mentioned that some evidence from the Philippines suggested that IYC are not getting enough energy when not getting any milk feeds (even as young as 8 months), and as 4 formula feeds a day would not meet the energy requirement based on infant formula nutrient composition, additional analysis could be helpful to provide evidence for suggested revisions in future.
5. MAD: Current Definition, What it Measures, Issues, Alternate DefinitionThe minimum acceptable diet indicator captures a child’s diet as a proxy of energy adequacy and micronutrient density, combined, while for non-BF children also whether they received at least 2 milk feeds. It thus measures the proportion of children who receive minimum acceptable diet with different requirements for breastfed and non-breastfed children.
• Breastfed children: Children aged 6-23 months who meet the MDD AND MMF in the previous 24 hours.
• Non-breastfed children: Children aged 6-23 who meet MDD (based on 4 out of 6 food groups after removal of dairy) AND MMF AND received at least 2 milk feeds in the previous 24 hours.
Issuesi. The WHO guidelines Part 2 (2010) provide incorrect
information for operationalization of the MDD component of MAD for non-breastfed children. Should this be corrected?
ii. MAD is not a composite of MDD and MFF for non-breastfed children but it is for breastfed children. Analysis from DHS and MICS show that the rates for the 3 indicators, when compared side by side, may not make sense in some contexts, especially where continued breastfeeding rates are low. For more information, please see Annex 2, Presentation 2. Would it be useful to change MAD to a composite for both breastfed and non-breastfed children?
Summary of Discussioni. Summary of discussion for correction of WHO
guidelinesa. Experts unanimously agreed that the guidelines
should be changed to correct the error.
ii. Summary of discussion on MAD as composite indicatora. Experts noted that when originally constructed,
it was clear that there can be no one indicator to inform the “acceptable” diet, hence a composite indicator was created, albeit different for the non-breastfed than a true composite.
b. Better communication/ language clarity is required to think about MAD as a separate indicator all together even if it is made up of MDD and MMF.
c. Most experts agreed that there was no strong rationale for changing MAD. In addition, as modifications to MDD were still being debated at the meeting (i.e. decisions on MDD were still to be made), it was not timely to make any decision on MAD.
Summary of Decision and Way Forward
Final decision of MAD was to correct the mistake in the manual for operationalization of MAD. More discussion is needed on what MAD best reflects once consensus is achieved on MDD modification, but agreed that it should be a composite variable of MDD and MFF, plus milk feeds for non-breastfed children.
Meeting Report on Reconsidering, Refining, and Extending the WHO IYCF Indicators 23
6. Sharing of Lessons and Recommendations from Implementing the Indicators in DHS, MICS, and other Surveys1. Demographic and Health Surveys
Trevor Croft from ICF International presented on the DHS by providing background information on components of DHS, and then specifically informed about data collection related to IYCF indicators (See Annex 3, Presentation 1). DHS data collection was compared to other USAID-funded surveys such as Food for Peace (FFP) and Feed the Future (FEEDBACK). The IYCF questionnaire was explained with clarification about data collection for mixed dishes and trivial quantities. DHS and FFP use a list-based approach to collect information on food consumption, while FEEDBACK uses an open recall of foods in the past 24 hours followed by a list-based approach. Some key points for data collection include:
i. IYCF indicators have evolved over several rounds of surveys since initiation of DHS.
ii. DHS, FFP, and FEEDBACK adapt their questionnaires to the country context through discussion and stakeholder meetings and training workshops.
iii. Enumerator issues for each type of survey:a. DHS: List-based questions can sometimes be
repetitive, but since these are yes/no questions, they are relatively simple for data collection.
b. FFP: List-based recall is simple, but there is more error in getting correct estimates of food frequency
c. FEEDBACK: It has longer module for IYCF than DHS or FFP, which is cumbersome and requires more probing. Data collection is often rushed for this module, without extensive probing, which can be an issue for collecting information on food frequency
Questions for Clarification and Discussion
i. How are questionnaires adapted to the country-context, especially for a list-based survey versus a recall-based survey? What is the communication like with the stakeholders- is it more centralized or at a regional level?a. DHS works at the central government level to adapt
questionnaire, with the understanding that they would be knowledgeable in any regional differences or issues to consider for adaptation. This can be challenging at times, but it is important to work with the available resources and get the most out of it.
ii. What is the future of DHS? What are the expectations from long-term activities?a. In terms of capacity, USAID will support DHS until
every country has “graduated” to be self-sufficient technically to conduct the surveys. For example, Peru needs little technical assistance to conduct its DHS.
b. In terms of funding, DHS will be rebid next summer for the next round.
iii. How would pictorial depiction through digital technology help with IYCF data collection, in terms of showing pictures of formula, processed foods etc.?a. Some digital technology is already in use for some
components of gathering reproductive health data, but not in IYCF. Technologically it is possible to use tablets to show pictures of foods for data collection.
iv. Are there some IYCF indicators more difficult than others to operationalize?a. MDD, MMF, and MAD are the three most difficult
indicators to operationalize. b. It was difficult to operationalize when the indicators
were introduced; however, the technique has now been refined and easy to operate.
c. Individuals working with DHS IYCF data may not be nutrition specialists, which make MDD, MMF, and MAD more difficult to operationalize, at least in the initial phases.
2. Multiple Indicator Cluster Survey (MICS)
Bo Robert Beshanki-Pederson from the Global MICS Team presented via Skype on the MICS, especially about the IYCF Module (See Annex 3, Presentation 2). The IYCF module has evolved through several rounds of MICS, with MICS-5 having a comprehensive set of questions to calculate 14 of the 15 WHO IYCF indicators (iron rich foods cannot be calculated). MICS-6, the current round has further modifications to the IYCF module. Specific field issues discussed were:i. Question regarding solid, semi-solid (mushy) foods
consistently performs poorly due to lack of proper distinction between solid and semi-solid foods. Question needs to be reworded for more clarity.
ii. There can be recall bias, especially if respondent is not the caregiver of the child.
iii. MICS-5 has a few customized question to capture more information about mixed foods
iv. To facilitate better recall, new probes have been added. Its evaluation has yielded mixed results.
v. Adding new questions to existing modules can be challenging, and requires additional time, effort, training, and validation.
vi. A suggested way forward for better data collection was to use pictures through computer-assisted personal interviewing (CAPI) technology.
Meeting Report on Reconsidering, Refining, and Extending the WHO IYCF Indicators 24
vii. Better collaboration with other stakeholders and partners would be essential for tool development, tabulations, monitoring, and training.
viii. The group generally expressed that there was a need for better collaboration between DHS and MICS since data are used to measure same IYCF indicators.
3. ENSAUT & MICS Survey Differences in IYCF Questionnaires in Mexico
Theresa Shamah Levy from Instituto Nacional de Salud Pública (INSP) presented on IYCF questionnaires and data collection for two Mexican National Surveys to compare and contrast technical differences in survey methodology, question wording and probes, classification of foods- beverages, fruits and vegetables, dairy and plain water. A comparison of estimates was presented for the two surveys with certain differences in prevalence estimates. Certain trade-offs of adding or changing questions to ENSAUT in terms losing comparability to other options were discussed. (See Annex 3, Presentation 3)
Comment: There was no discussion specific to this presentation or MICS presentation. Out of the three presentations, discussion was mainly focused on DHS, which is described in the DHS section
7. Group Work OutcomesTo focus on specific age groups and to discuss related nutrition issues in measurement, the experts were divided into three work groups to focus on three age groups: 0-6 months, 6-59 months, and 5-plus years. A presentation was given for each age group to lay out specific measurement issues that need attention. A summary of discussion is presented below: 0-6 months age groupThe presentation for this age group focused on possible modifications to the existing breastfeeding indicators (See Annex 4, Presentation 1). A summary of group discussion related each indicator is explained:
i. Early Initiation of Exclusive Breastfeeding (EBF): Current DHS/MICS surveys first ask if the child was ever breastfed. Asking about the time of putting child to the breast after birth follows a positive response to the ever breastfed question, but not for a negative response. Should this skip pattern be changed, whereby the question about early initiation is asked before the ever breastfed question?a. Only a small proportion of women would be
affected if a change were made to the skip pattern.b. There can be possible cognitive issues in answering
the question if the skip pattern is changed, causing error.
c. The group decided to NOT change the skip pattern.
ii. Prelacteal Feeds (Supplemental Feeding in First Three Days of Life): The indicator should ideally involve any food (drinks or food) given to the child in the first three days of life and not only liquids as is currently asked. The question does not provide information on if the supplementation was before or after breast milk initiation.a. Experts agreed that better clarity in wording is
needed to indicate the foods (solid/semi-solids) and liquids are used to capture ALL supplementation in the first three days. Therefore, it was also essential to change the term ‘prelacteal feeds’, which can be interpreted differently in various settings.
b. Timing of supplementation can affect breastfeeding (supply, technique-latching), therefore it was important to assess early supplementation.
c. Since this question is asked differently in DHS and MICS, there was a need to harmonize the question to make it more consistent and comparable.
d. The question is currently asked only to breastfed children, but should be expanded to non-breastfed children as well.
e. The group agreed that adding a new indicator for feeding on the first three days of life to include all foods and liquids to be asked to all children irrespective of their breastfeeding status is important.
iii. Baby Friendly Hospital Initiative (BFHI): At present, there are no standard indicators that assess the observance of the Ten Steps to Successful Breastfeeding, but there are several questions in MICS that can help to obtain information related to BFHI. In addition, current questions focus on the mother’s perspective at BFHI, but there is no facility-based approach to assess a set standard of care. Discussion focused on current efforts in guidelines for BFHI and possible sources of data collection:a. WHO/UNICEF are in the process of providing new
guidance on BFHI and Technical Expert Advisory Group on Nutrition Monitoring (TEAM) is in the process of developing new indicators for BFHI coverage.
b. Possible way to collect data from a health-systems or facility perspective could be to get information from facility-based surveys such as Service Provision Assessment (SPA) Survey, however, getting the information only from facilities is not reliable. It is essential to think about ways of connecting facility-based data and population-based data, and validating it.
c. More information from MICS can be obtained by adding more questions to get at the quality of BFHI, but this would require consensus from experts, and time and resources.
d. The group agreed that new information is needed, but it would be essential to wait for the new WHO

Meeting Report on Reconsidering, Refining, and Extending the WHO IYCF Indicators 25
guidelines to align the possibly new indicators and data collections efforts accordingly. The group also agreed that since facility-based perspective is crucial, it would be first be important to know the coverage of BFHI. Therefore, related questions need to be included in large-scale surveys to get that information.
iv. Non-breastmilk feedings in the first six months: Current EBF indicator only assesses if the child is exclusively breastfed or not, but provides no information on what other foods are given to the child if s/he is not exclusively breastfed. There are considerable variations across countries on what is given in the first 6 months of life. Having an understanding of what other foods/liquids are provided in early infancy would be crucial for targeted, country-specific interventions and messaging. Therefore, should there be other indicators to assess the prevalence of non-breastmilk feedings such as water, infant formula, semi-solid foods, etc.?a. The data are already available on the consumption of
other foods and therefore could be used to calculate their prevalence.
b. It is important to determine the foods to be included for prevalence calculation. For example, prevalence for those given plain water, prevalence of those given formula, other milks etc.
c. It would be important to finalize these decisions after reviewing Codex for specific categories of infant formula and follow-on formula in older children.
d. It would be also essential to include non-breastfed child for this modification, and be reported on all children.
e. The group agreed that information of food/ liquid consumption other than breast milk is needed, but it was essential to define the categories for prevalence calculations and to review Codex to have the specific information on infant formula.
v. Alternative indicators of exclusive breastfeeding: The current EBF indicator captures the prevalence of EBF at one point in time, but does not provide much information on adherence of EBF. Is there a need to change the current standard EBF indicator?a. There might be sampling issues, which might affect
the prevalence estimates and confidence intervals if the indicator is changed.
b. Considering the relative small sample size for children 0-6 months, very few countries can show statistical change over time in EBF trends.
c. The group agreed that measuring adherence to EBF is not a priority, and while more attention and work to improve exclusive breastfeeding estimates would be useful, it would be premature to make any changes now as it might create more confusion and lead to communication issues with the stakeholders.
vi. Median Duration of EBF: Median duration of EBF was proposed for discussion as an additional indicator of EBF. The group discussion pros and cons of this option:a. Pros: Having the median duration of EBF indicator
aligns with current EBF recommendation and is easier to understand on the population level.
b. Cons: • Median is not a dichotomous indicator;
dichotomous indicators that can be expressed in terms of prevalence are sometimes required
• Calculations will involve going beyond six mix months, which may send conflicting messages for EBF beyond six months.
• Median will only provide information on 50% of the children, therefore the additional function and use of this indicator was questioned.
• It does not resolve the issues of 24-hour recall bias.
c. The group agreed that this could be added as an optional indicator, but that it was essential to clarify the exact interpretation of the measure.
vii. Broaden the age group for continued breastfeeding: The current age range for continued breastfeed is narrow (12-15 months and 20-23 months), which encompasses a smaller sample size, which increases the confidence interval of estimates. Broadening the age to 12-23 months would be useful for increasing precision of estimates, and will also allow to disaggregate the data as needed. a. The group agreed that broadening the age
group to 12-23 months would be useful as an additional indicator, and also suggested that the original indicators could be maintained if using disaggregated into 3 equal age groups of 12-15, 16-19 and 20-23 months.
viii. Other issues: The group discussed other issues, which could be measured for a better understanding of coverage of IYCF resources, especially for working women. Indicators to estimate expressed breast milk may also be useful. The group agreed that none of the current IYCF indicators needed to be removed, but it was essential to understand how the bottle-feeding indicator was operationalized consistently.
24-59 months age groupWhile the age group was preschool children, the presentation focused on additional issues to explore data collection for CF indicators because there was limited information on indicators for preschool age group to have an in-depth discussion. CF indicators were not applicable to this group because of diet changes such as decrease in breastfeeding; children in this age group are already weaned and no longer require breast milk or formula for nutritional needs. Instead the presentation focused on CF, specifically acknowledging the need to include ways

Meeting Report on Reconsidering, Refining, and Extending the WHO IYCF Indicators 26
to improve recall bias, addressing social desirability as mothers are often knowledgeable about the appropriate IYCF messages due to behavior change communication programs, inclusion of indicators that address overweight and obesity in early childhood, and understanding and measuring issues related to food safety.
The group discussion that followed focused on the need to collect better data on the 24-59 months age group. i. The group acknowledged that this is a difficult age
group to collect data, as the children were likely to away from their mothers but still not old enough to self-report on feeding practices.
ii. There are currently no indicators or guidelines for food and nutrition in this age group.
iii. Since obesity is a growing issue in developing countries, one avenue to explore would the consumption of unhealthy foods for which:a. Existing tools could be reviewed and collated to
assess questions for potential indicators. b. Consumption of fruits and vegetables should be
a core indicator to assess eating habits, however, further discussion is required for number of servings, frequency, and variety of fruits and vegetables. It would also be essential to focus on appropriate messaging for healthy eating.
c. It would be necessary to discuss food groups for diet diversity in children. Should it be 5 food groups for children in comparison to 10 food groups for adults? This would require further research for creating a ‘gold standard’ and would require further validation.
d. Promotion of health eating habits would be essential for the pre-school children for developing any related indicators. The focus for toddlers has been on responsive feeding, which is likely to contribute to eating habits in pre-school children. Therefore, the effect of early feeding on eating habits for pre-school children should be taken into consideration. A consultation on development of simple tools to promoting health eating is required, and should include experts working with preschool-age children.
e. More information is needed to understand the requirement of animal source foods, especially dairy products to answer if dairy products are needed for preschool children, and to determine the frequency, amount, and variety needed.
f. It would be essential to understand the food environment and related policies, especially with regards to food marketing targeted for children. It would also be important to understand the coverage and exposure to such marketing efforts, and how that affects eating habits and food intake.
g. An additional suggestion was made related to MMF which was to look into whether excessive intake could be assessed in a similar manner given that MMF currently assesses minimum caloric sufficiency but not the other end of the spectrum.
5-plus years age groupOlivier Receveur presented on the issues related food and nutrition in children 5 years and older, and provided examples of studies in Canada to assess healthy behavior in school-going children (See Annex 4, Presentation 2). Given time limitations and restricting of the agenda to allow more time for discussions on MDD, a presentation by Chessa Lutter who was to join remotely had to be cancelled but participants were requested to go through the powerpoint outside of the meeting ours as preparation for this group work. The following group discussion focused on monitoring of child eating, current efforts to understand child eating practices, gaps and issues, and possible avenues for improved measurement of eating habits in this age group. The discussion is explained below:
Current efforts to monitor child eating in school-going children:i. There are several surveys that capture different aspects
for child eating habits such as: a. Global School-Based Student Health Survey
(GSHS) for older children (13-17 years), which has information on anthropometry, food security, and eating habits.
b. The U.S. has the Youth Risk Behavior Surveillance System (YRBSS – https://www.cdc.gov/healthyyouth/data/yrbs/index.htm), which includes questions on fruit and vegetable intake as well as unhealthy food consumption for middle school and high school students.
c. Focus Resources on Effective School Health, Nutrition, and Hygiene (FRESH) and Nutrition Friendly School Initiative (NFSI) by WHO/UNICEF provide frameworks to support healthy school environment to address double burden of malnutrition.
d. World Food Program is interested in using something like the IYCF module, adapted for school-going children in its survey, but the process is still in the initial stages.
e. In Guatemala, a diet diversity study was done in school-age children, where data from older children was self-reported while the mothers provided information for the younger children. This study provided some information about meals, beverages, and unhealthy snacks.
f. Young Lives Study in India also evaluates diet diversity and assesses physical activity in school-going children; therefore those tools could be reviewed and adapted.
Meeting Report on Reconsidering, Refining, and Extending the WHO IYCF Indicators 27
g. Mexico has a measured for measuring physical activity but it is not validated.
Issues and Gaps in Knowledge and Data Collectioni. There are currently no standard indicators, and we
would need more data to understand and develop new set of indicators.
ii. Data collection is difficult, especially in younger school-age children because of data quality issues with self-report.
iii. In certain contexts, getting consent may be an issue, especially in school-based surveys where privacy maybe be compromised. Adolescents are more conscious about body image, which may make it difficult obtained anthropometric assessment. Data collection needs to be more ‘adolescent-friendly’.
iv. To avoid above-mentioned issues with school-based surveys, a possible option is to do home surveys, but it would involve additional technical and logistical issues, which may not be easy to resolve.
v. Indicators should not only focus on eating habits but also on self-efficacy related to food preparation, knowledge and awareness of healthy eating habits, sociodemographic characteristics, social constraints and facilitators linked to healthy eating, and school environment. Indicators should also assess coverage and content/ components of school health and nutrition programs.
Way Forward
i. Discussions could be focused on adding questions to existing tools and development on new indicators.
ii. The recent round of MICS contains a module for children 7-14 years old. This could be a potential avenue to add questions related to child eating habits.
iii. Many Educational Management Information System (EMIS) have questionnaires that are completed by the school principals. This could be a resource to add school environment questions. CDC has information for U.S.-based schools that could be shared with EMIS.
iv. Multisectoral involvement would be essential for assessing this age group’s eating habits and can draw from experience in multisectoral involvement in IYCF.
v. It would be essential to have a guiding conceptual framework for informing programs.
vi. Indicators for healthy eating should focus on: healthy foods, unhealthy/ processed foods, sugar-sweetened beverages, milk consumption, and possible creation of healthy eating index.
vii. Indicators should reflect gender differences in healthy eating habits, especially in the adolescent age group.
viii. Understanding the school curriculum with respect food and nutrition can also be a potential avenue for promoting improved eating habits.
Next steps
i. WHO to communicate the decision to report on MDD rather than MAD through the WHA
ii. UNICEF and WHO to make a final decision on MDD definition change based on inputs from discussions during the meeting
iii. WHO and UNICEF to oversee to finalization of the operational guidance for reporting on MDD through WHA (once step ii is completed)
iv. UNICEF and WHO to develop a prioritized list and follow up on discussions and recommendations with regard to development of new indicators for all age groups in the short, medium and long time frame
v. WHO and UNICEF to follow up on making the correction to the MAD calculation in the manual (once other short term changes are agreed to)
vi. UNICEF to pursue continued coordination between MICS and DHS
ConclusionThe technical consultation resulted in several discussions, decisions, and next steps. For modification of MDD for comparing breastfed and non-breastfed infants, three options were shortlisted and the Secretariat was tasked with reaching a final decision in the immediate future. With respect to quantitative 24-hour-recall and MDD calculation, specific food quantity of 10g per food each time it was consumed was recommended where information was available, and use of disaggregated data was advised when available. Country-level discretion was also recommended for this option. For MMF, experts almost unanimously agreed to keep the indicator unchanged, but suggested that further analyses could be helpful to determine if all current variations of the indicator would provide adequate energy intake for non-breastfed children. For MAD, experts agreed to correct the error in the WHO guidelines for calculating MAD but that no further changes should be made at present. The consultation provided an opportunity to understand field use and operationalization of IYCF indicators through large-scale surveys such as DHS and MICS. Group work and discussions led to recognizing gaps in knowledge in child nutrition, especially in older age groups, and highlighted important areas for further exploration and research.

Meeting Report on Reconsidering, Refining, and Extending the WHO IYCF Indicators 28
ANNEXES
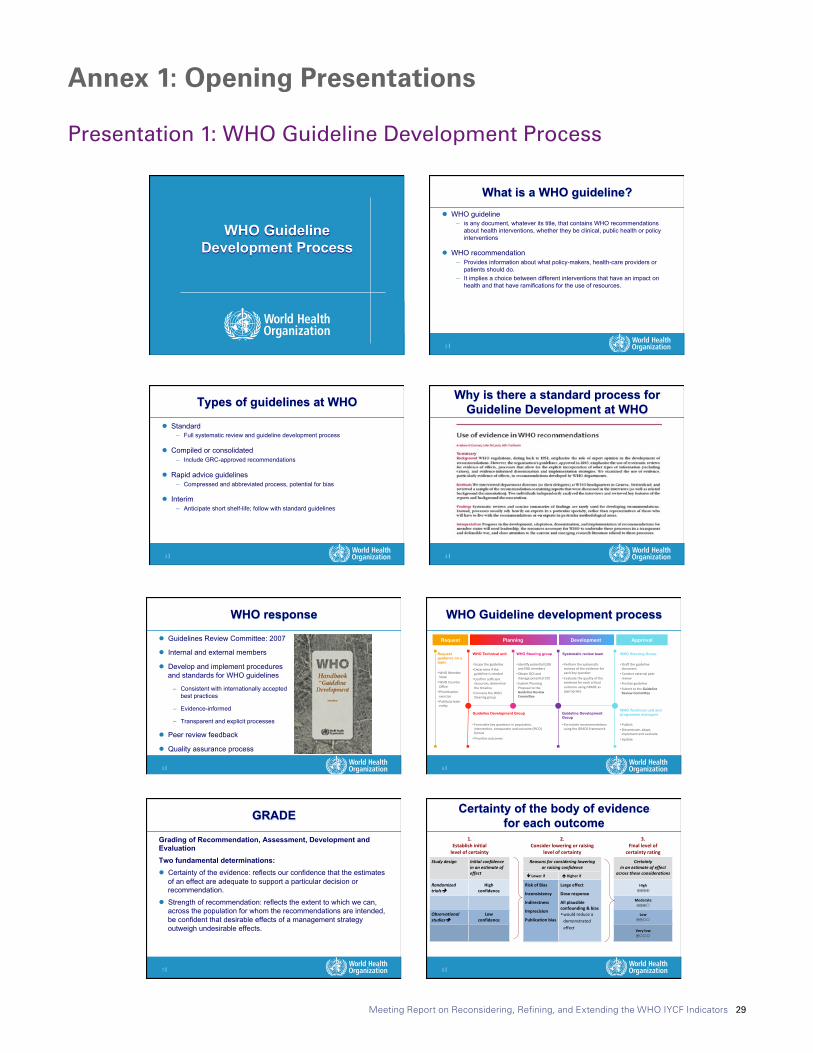
Meeting Report on Reconsidering, Refining, and Extending the WHO IYCF Indicators 29
World Health Organization 29 August 2017
1
1 |
WHO Guideline Development Process
2 |
What is a WHO guideline? l WHO guideline
– is any document, whatever its title, that contains WHO recommendations about health interventions, whether they be clinical, public health or policy interventions
l WHO recommendation – Provides information about what policy-makers, health-care providers or
patients should do. – It implies a choice between different interventions that have an impact on
health and that have ramifications for the use of resources.
3 |
Types of guidelines at WHO
l Standard – Full systematic review and guideline development process
l Compiled or consolidated – Include GRC-approved recommendations
l Rapid advice guidelines – Compressed and abbreviated process, potential for bias
l Interim – Anticipate short shelf-life; follow with standard guidelines
4 |
Why is there a standard process for Guideline Development at WHO
Annex 1: Opening Presentations
Presentation 1: WHO Guideline Development Process
World Health Organization 29 August 2017
2
5 |
WHO response
l Guidelines Review Committee: 2007
l Internal and external members
l Develop and implement procedures and standards for WHO guidelines
– Consistent with internationally accepted best practices
– Evidence-informed
– Transparent and explicit processes
l Peer review feedback
l Quality assurance process
6 |
Request Approval
Request guidance on a topic
WHO Technical unit WHO Steering group Systematic review team WHO Steering Group
Guideline Development Group Guideline Development Group
• WHOMemberState
• WHOCountryOffice
• Priori6za6onexercise
• Public/privateen6ty
Planning Development
• Formulatekeyques6onsinpopula6on,interven6on,comparatorandoutcome(PICO)format
• Priori6zeoutcomes
• Formulaterecommenda6onsusingtheGRADEframework
• Scopetheguideline• Determineiftheguidelineisneeded
• Confirmsufficientresources;determinethe6meline
• ConvenetheWHOSteeringgroup
• Iden6fypoten6alGDGandERGmembers
• ObtainDOIandmanagepoten6alCOI
• SubmitPlanningProposaltotheGuidelineReviewCommi/ee
• Performthesystema6creviewsoftheevidenceforeachkeyques6on
• Evaluatethequalityoftheevidenceforeachcri6caloutcomeusingGRADEasappropriate
• DraQtheguidelinedocument
• Conductexternalpeerreview
• Finalizeguideline• SubmittotheGuidelineReviewCommi/ee
WHO Technical unit and programme managers
• Publish• Disseminate,adapt,implementandevaluate
• Update
WHO Guideline development process
7 |
Grading of Recommendation, Assessment, Development and Evaluation Two fundamental determinations: l Certainty of the evidence: reflects our confidence that the estimates
of an effect are adequate to support a particular decision or recommendation.
l Strength of recommendation: reflects the extent to which we can, across the population for whom the recommendations are intended, be confident that desirable effects of a management strategy outweigh undesirable effects.
GRADE
8 |
Certainty of the body of evidence for each outcome
1.Establishinitial
levelofcertainty
2.Considerloweringorraising
levelofcertainty
3.Finallevelof
certaintyrating
Studydesign Initialconfidenceinanestimateofeffect
Reasonsforconsideringloweringorraisingconfidence
Certaintyinanestimateofeffect
acrosstheseconsiderationsêLowerif éHigherif
Randomizedtrialsè
Highconfidence
RiskofBias
Inconsistency
Indirectness
Imprecision
Publicationbias
Largeeffect
Doseresponse
Allplausibleconfounding&bias• wouldreduceademonstratedeffect
High⊕⊕⊕⊕
Moderate⊕⊕⊕�
Observationalstudiesè
Lowconfidence
Low⊕⊕��
Verylow⊕���
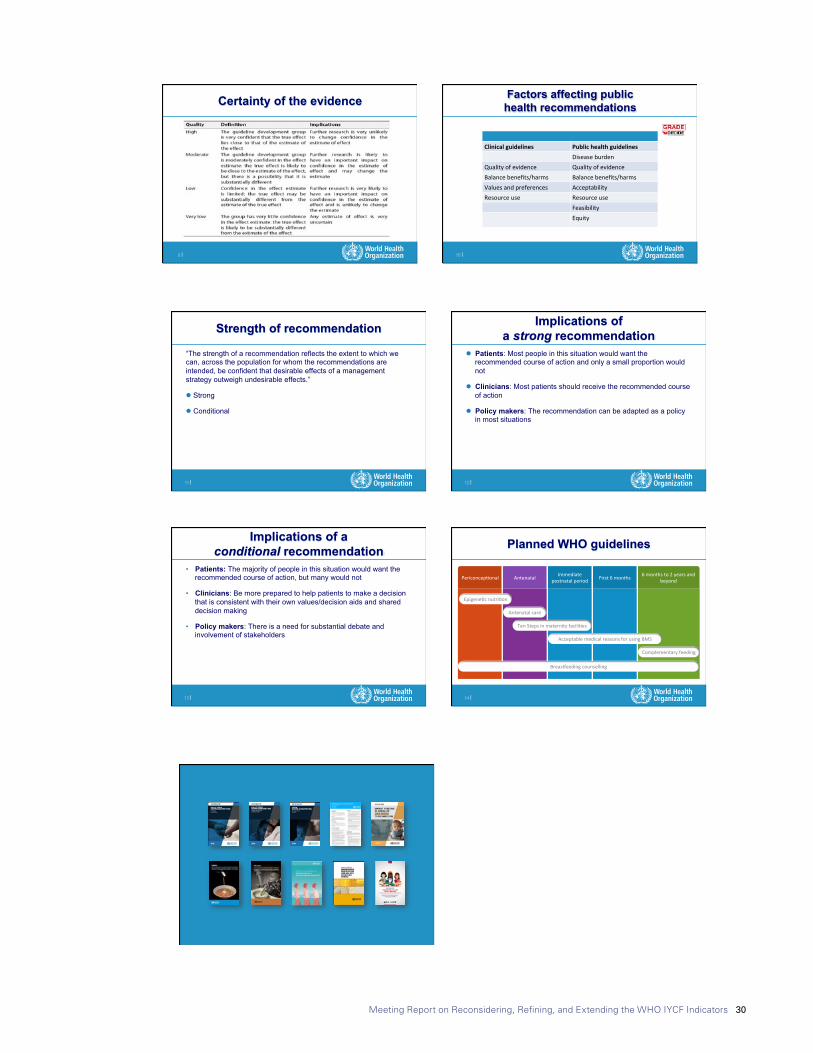
Meeting Report on Reconsidering, Refining, and Extending the WHO IYCF Indicators 30
World Health Organization 29 August 2017
3
9 |
Certainty of the evidence
10 |
Factors affecting public health recommendations
Clinicalguidelines PublichealthguidelinesDiseaseburden
Qualityofevidence QualityofevidenceBalancebenefits/harms Balancebenefits/harmsValuesandpreferences AcceptabilityResourceuse Resourceuse
FeasibilityEquity
11 |
Strength of recommendation
“The strength of a recommendation reflects the extent to which we can, across the population for whom the recommendations are intended, be confident that desirable effects of a management strategy outweigh undesirable effects.”
l Strong
l Conditional
12 |
Implications of a strong recommendation
l Patients: Most people in this situation would want the recommended course of action and only a small proportion would not
l Clinicians: Most patients should receive the recommended course of action
l Policy makers: The recommendation can be adapted as a policy in most situations
World Health Organization 29 August 2017
4
13 |
Implications of a conditional recommendation
• Patients: The majority of people in this situation would want the recommended course of action, but many would not
• Clinicians: Be more prepared to help patients to make a decision that is consistent with their own values/decision aids and shared decision making
• Policy makers: There is a need for substantial debate and involvement of stakeholders
14 |
AntenatalPericoncep6onal Immediatepostnatalperiod
6monthsto2yearsandbeyond
Epigene6cnutri6on
Antenatalcare
AcceptablemedicalreasonsforusingBMS
Complementaryfeeding
TenStepsinmaternityfacili6es
First6months
Planned WHO guidelines
BreasYeedingcounselling

Meeting Report on Reconsidering, Refining, and Extending the WHO IYCF Indicators 31
Presentation 2: Measuring Infant and Young Child Complementary Feeding Practices: Indicators, Current Practice and Research Gaps
8/29/17
1
Click to edit Master title style
Shenggen Fan, April 2015
Measuring Infant and Young Child Complementary Feeding Practices: Indicators, Current Practice and Research Gaps Marie Ruel Director | Poverty, Health and Nutrition | IFPRI
Click to edit Master title style
Shenggen Fan, April 2015
Key Milestones in Infant and Young Child Feeding (IYCF) practices
§ Review of scientific knowledge on CF (1998)
§ WHO Guiding Principles for CF of: • Breastfed (BF) child
(2003) • Non BF child (2005)
§ WHO Indicators for measuring IYCF practices (2008)
Click to edit Master title style
Shenggen Fan, April 2015
Taking Stock on Indicators of CF practices
§ What is the status of CF indicators?
§ How have they been used so far and what are some of the key findings?
§ What are the strengths and weaknesses of the indicators?
Ø Suggestions for way forward
Click to edit Master title style
Background on IYCF and related indicators
8/29/17
2
Click to edit Master title style
Shenggen Fan, April 2015
10 Guiding Principles for Complementary Feeding of the Breastfed Child 1. Duration of exclusive
BF & age of introduction of CF
2. Continued BF 3. Responsive feeding
4. Safe preparation & storage of CF
5. Amount of CF needed
6. Food consistency 7. Meal frequency energy
density 8. Nutrient content of CF 9. Use of supplements or
fortified products 10. Feeding during & after
illness
WHO 2003
Click to edit Master title style
Shenggen Fan, April 2015
The Continuum of Infant and Child Feeding
0-6 mo 6-9 mo 9-12 mo 12-24 mo
• Exclusive BF
• Initiate breastfeeding soon after birth
• Feed colostrum
• Avoid prelacteal feeds
• Avoid bottle-feeding
• Continue BF
• Introduce variety of CF, including animal foods
• Feed CF foods 2-3 times/d + snacks
• Avoid bottle-feeding
• Continue BF
• Increase amount, variety, frequency of CF, including animal foods
• Feed complementary foods 3-4 times/d + snacks
• Avoid bottle- feeding
• Continue BF
• Continue to give a variety of foods, complete transition to family diet
• Feed complementary foods 3-4 times/d + snacks
• Avoid bottle-feeding
Click to edit Master title style
Shenggen Fan, April 2015
Measuring CF Practices is Complex….
§ CF practices are multi-dimensional
§ Include a number of inter-related practices
§ Dynamic, change rapidly within short age intervals
§ Their effects on child outcomes are likely to be cumulative
§ Complement breastmilk intake (largely variable)
Click to edit Master title style
Shenggen Fan, April 2015
WHO IYCF Indicators for Breastfed Child
§ 8 core indicators:
• 3 BF practices • 5 CF practices
§ 7 optional indicators (all focused on BF practices)

Meeting Report on Reconsidering, Refining, and Extending the WHO IYCF Indicators 32
8/29/17
2
Click to edit Master title style
Shenggen Fan, April 2015
10 Guiding Principles for Complementary Feeding of the Breastfed Child 1. Duration of exclusive
BF & age of introduction of CF
2. Continued BF 3. Responsive feeding
4. Safe preparation & storage of CF
5. Amount of CF needed
6. Food consistency 7. Meal frequency energy
density 8. Nutrient content of CF 9. Use of supplements or
fortified products 10. Feeding during & after
illness
WHO 2003
Click to edit Master title style
Shenggen Fan, April 2015
The Continuum of Infant and Child Feeding
0-6 mo 6-9 mo 9-12 mo 12-24 mo
• Exclusive BF
• Initiate breastfeeding soon after birth
• Feed colostrum
• Avoid prelacteal feeds
• Avoid bottle-feeding
• Continue BF
• Introduce variety of CF, including animal foods
• Feed CF foods 2-3 times/d + snacks
• Avoid bottle-feeding
• Continue BF
• Increase amount, variety, frequency of CF, including animal foods
• Feed complementary foods 3-4 times/d + snacks
• Avoid bottle- feeding
• Continue BF
• Continue to give a variety of foods, complete transition to family diet
• Feed complementary foods 3-4 times/d + snacks
• Avoid bottle-feeding
Click to edit Master title style
Shenggen Fan, April 2015
Measuring CF Practices is Complex….
§ CF practices are multi-dimensional
§ Include a number of inter-related practices
§ Dynamic, change rapidly within short age intervals
§ Their effects on child outcomes are likely to be cumulative
§ Complement breastmilk intake (largely variable)
Click to edit Master title style
Shenggen Fan, April 2015
WHO IYCF Indicators for Breastfed Child
§ 8 core indicators:
• 3 BF practices • 5 CF practices
§ 7 optional indicators (all focused on BF practices)
8/29/17
3
Click to edit Master title style
Shenggen Fan, April 2015 WHO 2008
5 WHO CF Indicators for Breastfed Child
INDICATOR § Timing of introduction of
solid semi-solid and soft foods
§ Minimum dietary diversity (MDD)
§ Minimum meal frequency (MMF)
§ Minimum acceptable diet (MAD)
§ Consumption of iron-rich/ iron-fortified foods
MEASURES § Optimal timing of
introduction of CF foods
§ Micronutrient adequacy of diet
§ Energy adequacy of diet
§ Composite indicator (BF + MDD + MMF)
§ Adequacy of iron intake
Click to edit Master title style
Shenggen Fan, April 2015
§ For use in large surveys for: • Population-level assessments • Population targeting • Monitoring & evaluation
§ Had to be simple and practical, yet valid and reliable
§ This limits dimensions of CF practices that can be captured
§ Were meant to be used as a full set to reflect multi-dimensional nature of IYCF
Purpose of 2008 WHO Indicators
Click to edit Master title style
Shenggen Fan, April 2015
BF
CF
0-5 mo 6-8 mo 9-23 mo
Continued Continued
Timely introduction
Quantity of CF: - Meal frequency
Quality of CF: - Dietary diversity + iron foods
Hygiene/food safety
Responsive feeding
Feeding during illness
Texture/consistency
Exclusive
CF Indicators versus Guiding Principles Click to edit Master title style
How have the WHO CF indicators been used so far?
8/29/17
4
Click to edit Master title style
Shenggen Fan, April 2015
For Population-Level Assessments and Country Comparisons
§ Reveals grossly inadequate CF practices, esp. SS-Africa, South Asia • < 30% MAD • Few countries with > 30% MDD • Poorer practices (younger, rural,
less educated mothers, poorer)
§ Pooled analysis (46DHS): • < 33% MDD • ~50% meeting MMF • 21% MAD • Africa & Asia fare worst than LA
Indicators have helped unveil the severe problem of poor IYCF practices globally
WHO 2010 Country Profiles
Click to edit Master title style
Shenggen Fan, April 2015
For Monitoring & Evaluation of Programs
§ In the past, programs aimed at improving IYCF assessed impact on child anthropometry • Likely due to lack of standard
IYCF indicators
§ Indicators helped measure & document impacts on practices (often more achievable outcome) • E.g. A&T, agriculture-
nutrition programs; social protection programs
0 20 40 60 80 100
Consumption of iron-rich foods
Minimum acceptable diet
Minimum meal frequency
Minimum dietary diversity
Timely introduction of
solid, semi-solid
%
A&T-I Endline A&T-NI Endline
Availability of IYCF indicators has led to their use for M&E and stimulated investments in
programs aimed at improving IYCF
Menon et al. in press
Click to edit Master title style
Shenggen Fan, April 2015
§ Extensive analysis of association between dietary diversity and child antropometry
• Robust results – strong DD, consistent associations with linear growh, controlling for energy intake and SES
§ New studies looking at associations between broader set of IYCF and child anthropometry
• Pooled analysis (14 DHS) – associations between MDD, iron rich foods and stunting; between MMF and underweight
• Country analyses (8 studies) confirmed association between DD and HAZ (3 countries); MAD and stunting in 4 countries.
§ New studies look at determinants of CF practices (e.g. special issue of MCN on patterns and determinants of CF practices in South Asia)
For Research on Determinants and Consequences of Poor IYCF Practices
IYCF indicators have been used extensively to address important gaps in knowledge and
understand patterns, determinants and consequences of poor IYCF practices
Click to edit Master title style
What are the strengths and weaknesses of the WHO CF Indicators?

Meeting Report on Reconsidering, Refining, and Extending the WHO IYCF Indicators 33
8/29/17
4
Click to edit Master title style
Shenggen Fan, April 2015
For Population-Level Assessments and Country Comparisons
§ Reveals grossly inadequate CF practices, esp. SS-Africa, South Asia • < 30% MAD • Few countries with > 30% MDD • Poorer practices (younger, rural,
less educated mothers, poorer)
§ Pooled analysis (46DHS): • < 33% MDD • ~50% meeting MMF • 21% MAD • Africa & Asia fare worst than LA
Indicators have helped unveil the severe problem of poor IYCF practices globally
WHO 2010 Country Profiles
Click to edit Master title style
Shenggen Fan, April 2015
For Monitoring & Evaluation of Programs
§ In the past, programs aimed at improving IYCF assessed impact on child anthropometry • Likely due to lack of standard
IYCF indicators
§ Indicators helped measure & document impacts on practices (often more achievable outcome) • E.g. A&T, agriculture-
nutrition programs; social protection programs
0 20 40 60 80 100
Consumption of iron-rich foods
Minimum acceptable diet
Minimum meal frequency
Minimum dietary diversity
Timely introduction of
solid, semi-solid
%
A&T-I Endline A&T-NI Endline
Availability of IYCF indicators has led to their use for M&E and stimulated investments in
programs aimed at improving IYCF
Menon et al. in press
Click to edit Master title style
Shenggen Fan, April 2015
§ Extensive analysis of association between dietary diversity and child antropometry
• Robust results – strong DD, consistent associations with linear growh, controlling for energy intake and SES
§ New studies looking at associations between broader set of IYCF and child anthropometry
• Pooled analysis (14 DHS) – associations between MDD, iron rich foods and stunting; between MMF and underweight
• Country analyses (8 studies) confirmed association between DD and HAZ (3 countries); MAD and stunting in 4 countries.
§ New studies look at determinants of CF practices (e.g. special issue of MCN on patterns and determinants of CF practices in South Asia)
For Research on Determinants and Consequences of Poor IYCF Practices
IYCF indicators have been used extensively to address important gaps in knowledge and
understand patterns, determinants and consequences of poor IYCF practices
Click to edit Master title style
What are the strengths and weaknesses of the WHO CF Indicators?
8/29/17
5
Click to edit Master title style
Shenggen Fan, April 2015
§ Simple, practical, relatively easy to use in large-scale surveys
§ Measure some key dimensions of CF practices
§ Measure age-specific CF practices § Useful for the purposes for which they were
designed (population-level assessment, M&E, population targeting)
Strengths of WHO CF Indicators Click to edit Master title style
Shenggen Fan, April 2015
§ Most have not been validated against gold standard (except DD)
§ For some, unclear if they reflect underlying construct they are meant to measure • Esp. MMF, timing of introduction of CF, MAD, iron-rich
foods § Based on 24-h recall – subject to recall error and bias § Do not capture dynamic nature of CF or usual practice § Rely on unverified assumptions related to breast milk
intake and nutrient contribution § Include only a subset of dimensions of CF; do not include
indicators related to prevention of overweight/obesity
Some Weaknesses of WHO CF Indicators
Click to edit Master title style
The Way Forward
Click to edit Master title style
Shenggen Fan, April 2015
§ Need to revisit existing set of indicators and carry out relevant validation studies
§ Verify underlying assumptions and adjust indicators: • Energy density (for MMF) • Differentiation of snacks and meals (for MMF) • Food consumed in small amounts (for MDD)
§ Assess magnitude of error/bias due to recall § Revisit missing indicators/dimensions of CF, including
overweight/obesity prevention § Develop simplified, technology-smart 24-h dietary
assessment method to quantify nutrient intake from CF
Time to Revisit our Set of CF Indicators
8/29/17
6
Click to edit Master title style
Shenggen Fan, April 2015
Conclusions
§ WHO CF indicators have been immensely useful – to measure, document, raise awareness, stimulate investments and action
§ They have been used
extensively for all the purposes for which they were designed and more
§ Almost 10 years after their release, it is time to revisit them, improve them, develop new ones and promote their appropriate use

Meeting Report on Reconsidering, Refining, and Extending the WHO IYCF Indicators 34
Presentation 3: Update on UNICEF Infant and Young Child Feeding Guidance and
8/29/17
1
Update on UNICEF
Infant and Young
Child Feeding
Guidance and Tools
Inter-agency consultation on child feeding indicators
New York, 20-22 June, 2017
France Bégin Senior Nutrition Advisor
Programme Division, UNICEF
From the First Hour of Life report
• First ever global report on the quality of complementary foods and feeding for children 6-23 mo LMICs à high media and partners’ attention.
§ Only 1 in 4 children aged 6-23
mo in LMICs is fed a diet that meets the minimum diversity (at least 4 food groups).
§ Only 1 in 6 children aged 6-23
mo in LMICs is fed a diet that meets the minimum frequency and diversity for healthy growth and development.
UNICEF IYCF PROGRAMMING GUIDE
• Iden,fiesthecoreIYCFprogrammingcomponentsandhighlightskeyprocessesforimplementa,on
• Decisionframeworkforimprovingqualityofcomplementaryfeeding
• Revisedguidancewillbesplitintoseparate,stand-alonemodules
• Willincludeguidanceonresponsivefeedingands,mula,on
• UseofrecommendedIYCFindicatorstoassessprogramoutcomes
• GuidancetopaymoreaLen,ontopre-lactealfeeding,iron-richandiron-for,fiedfoods,snacks,unhealthyfoods,etc.whenassessingIYCFprac,ces
UNDERREVISION
UNICEF IYCF tools
Ø UNICEF- Cornell University e-learning course
Ø ProPAN (with PAHO) • Comprehensive tool to design and assess interventions to
improve IYCF
Ø Series of Complementary Feeding videos (in progress)• Appropriate,mingoftheintroduc,onofcomplementaryfoods• Feedingfrequencyandpor,onsize• Foodconsistencyandprepara,onincludinghygieneinfoodprepara,onandstorage
• Foodchoice/dietarydiversity• Responsivefeeding• FeedingduringandaUerchildillnesses
8/29/17
2
ProPAN Modules
I
• Assessment• Caregiversurvey ●Opportunis,cobserva,on• 24hrdietaryrecall ●Semi-structuredinterview• MarketSurvey ●FoodaLributesexercise
II • RecipeCrea,onandTrialsofRecommenda,ons
III • DevelopingInterven,ons
IV • MonitoringandEvalua,on
Community IYCF counselling package now used in 66 countries
Other IYCF tools with UNICEF collaboration
Ø UNICEFcollaborateswithWHOforupda,ngandrepackagingoftheIYCFCounsellingCoursesatfacilitylevel(nowintheirfinalstages)• Addi,onofcounsellingcards• Improvedlearningmethodologies• StrengthenedSupervisionmodule
Ø Incollabora,onwithSPRING,establishmentofaDigitalImageBankwithIYCFCounsellingCardsimagesandadapta,ons
• TobelaunchedbeforeSeptember
UNICEF Strategic Plan 2018-21
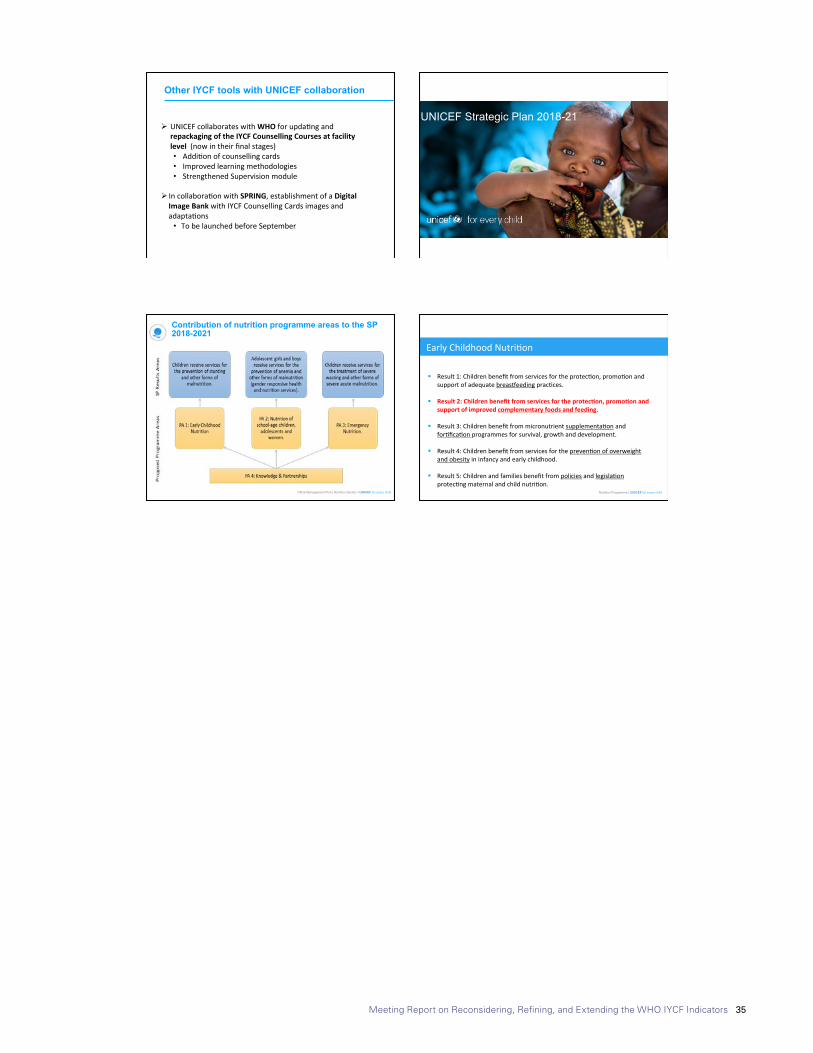
Meeting Report on Reconsidering, Refining, and Extending the WHO IYCF Indicators 35
8/29/17
3
Contribution of nutrition programme areas to the SP 2018-2021
9
Office Management Plan | Nutrition Section | UNICEF for every child
EarlyChildhoodNutri,on§ Result1:Childrenbenefitfromservicesfortheprotec,on,promo,onandsupportofadequatebreas`eedingprac,ces.
§ Result2:ChildrenbenefitfromservicesfortheprotecHon,promoHonandsupportofimprovedcomplementaryfoodsandfeeding.
§ Result3:Childrenbenefitfrommicronutrientsupplementa,onandfor,fica,onprogrammesforsurvival,growthanddevelopment.
§ Result4:Childrenbenefitfromservicesforthepreven,onofoverweightandobesityininfancyandearlychildhood.
§ Result5:Childrenandfamiliesbenefitfrompoliciesandlegisla,onprotec,ngmaternalandchildnutri,on.
Nutrition Programme | UNICEF for every child
8/29/17
2
ProPAN Modules
I
• Assessment• Caregiversurvey ●Opportunis,cobserva,on• 24hrdietaryrecall ●Semi-structuredinterview• MarketSurvey ●FoodaLributesexercise
II • RecipeCrea,onandTrialsofRecommenda,ons
III • DevelopingInterven,ons
IV • MonitoringandEvalua,on
Community IYCF counselling package now used in 66 countries
Other IYCF tools with UNICEF collaboration
Ø UNICEFcollaborateswithWHOforupda,ngandrepackagingoftheIYCFCounsellingCoursesatfacilitylevel(nowintheirfinalstages)• Addi,onofcounsellingcards• Improvedlearningmethodologies• StrengthenedSupervisionmodule
Ø Incollabora,onwithSPRING,establishmentofaDigitalImageBankwithIYCFCounsellingCardsimagesandadapta,ons
• TobelaunchedbeforeSeptember
UNICEF Strategic Plan 2018-21

Meeting Report on Reconsidering, Refining, and Extending the WHO IYCF Indicators 36
Annex 2: Topical Presentations
Presentation 1: Minimum Meal Frequency
8/29/17
1
Minimum Meal Frequency Vrinda Mehra, Julia Krasevec and Mary Arimond
Technical Consulta=on on Child Feeding Indicators June 20-22, 2017
Outline • Background
• Why the focus on Minimum Meal Frequency?
• Introduc=on of ques=ons to the consulta=on
• Present available data and results
• Discussion and decision making
Background
Minimum meal frequency was developed as a proxy for energy intake of infants and
young children.
For breasRed infants, recommended minimum number of feedings was based on
Ø Average breastmilk energy intake
Ø Including only solid/semi-solid foods
For non-breasRed infants and young children, feeding frequency
Ø Includes milk-only feeds, other foods and combina<on of milk feeds and other foods
Why the focus on Minimum Meal Frequency?
Current indicator is opera=onalized differently for breasRed and non-breasRed infants and young children.
8/29/17
2
Bringing breasRed infants at par with non-breasRed IYC in terms of 4 meals per day by assuming 2 breasReeds for 6-8 months and
1 breasReed for 9-23 months.
Current indicator may not always result in posi=ve feeding pa[erns for non-breasRed IYC.
• Addi=onally, it is necessary to define “milk feeds” in the context of quan=ta=ve surveys.
Ø To decide whether milk feeds that accompany solid/semi-solid foods would count toward frequency (i.e.,
double-coun=ng the feeding episode, as in current WHO 2010 model ques=onnaire).
Ø If only “milk-only” feeds should be added to solid/semi-solid foods to a[ain minimum meal frequency.
Ø Currently DHS and MICS methodology ask about number of milk feeds and solid feeds separately and later
add them together.
Ø This further has implica=ons for MAD where non-breasRed IYC are required to have 2 milk feeds but the
MMF is not separated to count only solid-semi solid feeds.
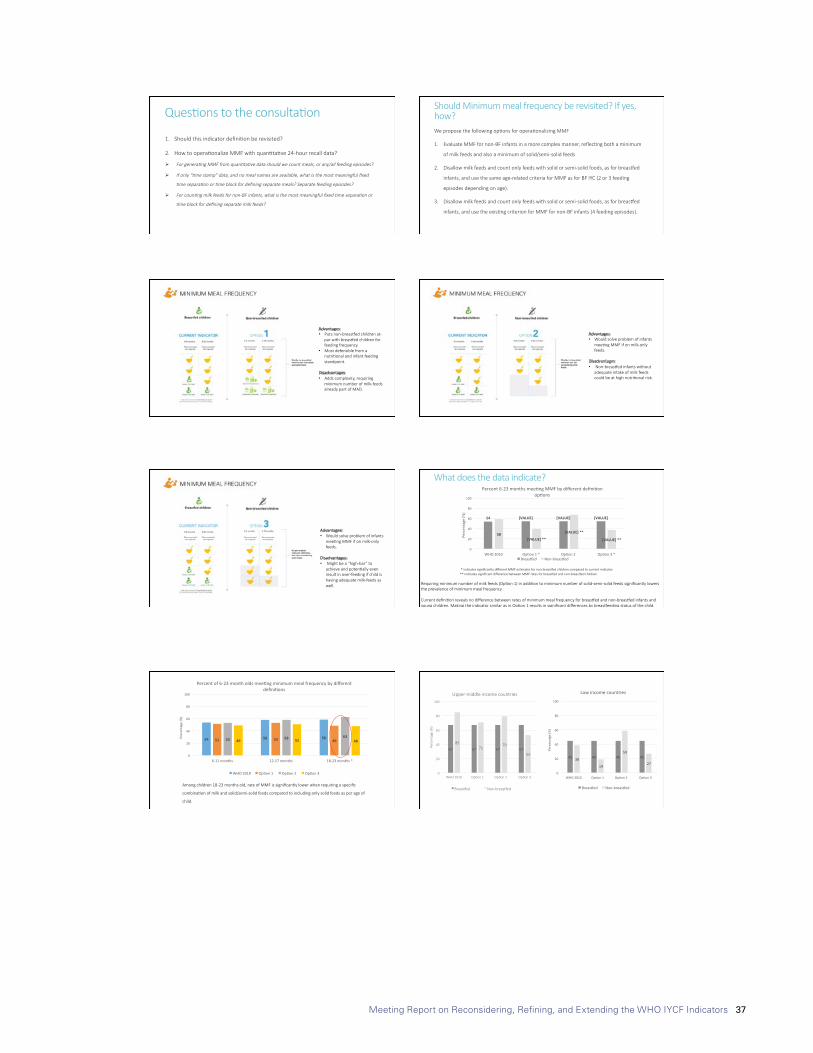
Meeting Report on Reconsidering, Refining, and Extending the WHO IYCF Indicators 37
8/29/17
3
Ques=ons to the consulta=on
1. Should this indicator defini=on be revisited?
2. How to opera=onalize MMF with quan=ta=ve 24-hour recall data?
Ø For genera<ng MMF from quan<ta<ve data should we count meals, or any/all feeding episodes?
Ø If only “<me stamp” data, and no meal names are available, what is the most meaningful fixed
<me separa<on or <me block for defining separate meals? Separate feeding episodes?
Ø For coun<ng milk feeds for non-BF infants, what is the most meaningful fixed <me separa<on or
<me block for defining separate milk feeds?
Should Minimum meal frequency be revisited? If yes, how? We propose the following op=ons for opera=onalizing MMF
1. Evaluate MMF for non-BF infants in a more complex manner, reflec=ng both a minimum
of milk feeds and also a minimum of solid/semi-solid feeds
2. Disallow milk feeds and count only feeds with solid or semi-solid foods, as for breasRed
infants, and use the same age-related criteria for MMF as for BF IYC (2 or 3 feeding
episodes depending on age).
3. Disallow milk feeds and count only feeds with solid or semi-solid foods, as for breasRed
infants, and use the exis=ng criterion for MMF for non-BF infants (4 feeding episodes).
Advantages: • Puts non-breasRed children at-
par with breasRed children for feeding frequency.
• Most defensible from a nutri=onal and infant feeding standpoint.
Disadvantages: • Adds complexity, requiring
minimum number of milk-feeds already part of MAD.
Advantages: • Would solve problem of infants
mee=ng MMF if on milk-only feeds.
Disadvantages: • Non-breasRed infants without
adequate intake of milk feeds could be at high nutri=onal risk.
8/29/17
4
Advantages: • Would solve problem of infants
mee=ng MMF if on milk-only feeds.
Disadvantages: • Might be a “high-bar” to
achieve and poten=ally even result in over-feeding if child is having adequate milk-feeds as well.
What does the data indicate?
* indicates significantly different MMF es=mates for non-breasRed children compared to current indicator ** indicates significant difference between MMF rates for breasRed and non-breasRed children
Requiring minimum number of milk feeds (Op=on 1) in addi=on to minimum number of solid-semi-solid feeds significantly lowers the prevalence of minimum meal frequency. Current defini=on reveals no difference between rates of minimum meal frequency for breasRed and non-breasRed infants and young children. Making the indicator similar as in Op=on 1 results in significant differences by breasReeding status of the child.
54 [VALUE] [VALUE] [VALUE]
58[VALUE]**
[VALUE]**
[VALUE]**
0
20
40
60
80
100
WHO2010 Op0on1* Op0on2 Op0on3*
Perc
enta
ge(%
)
Percent6-23monthsmee0ngMMFbydifferentdefini0onop0ons
BreasKed Non-breasKed
Among children 18-23 months old, rate of MMF is significantly lower when requiring a specific
combina=on of milk and solid/semi-solid feeds compared to including only solid feeds as per age of
child.
54 58 5851 53 4953 58 6349 51 48
0
20
40
60
80
100
6-11months 12-17months 18-23months*
Perc
enta
ge(%
)
Percentof6-23montholdsmee0ngminimummealfrequencybydifferentdefini0ons
WHO2010 Op0on1 Op0on2 Op0on3
67 67 67 67
85 71
79
53
0
20
40
60
80
100
WHO 2010 Op=on 1 Op=on 2 Op=on 3
Perc
enta
ge (%
)
Upper-middle income countries
BreasRed Non-breasRed
45 45 45 4538
19
59
27
0
20
40
60
80
100
WHO2010 Op0on1 Op0on2 Op0on3
Perc
enat
ge(%
)
Lowincomecountries
BreasKed Non-breasKed
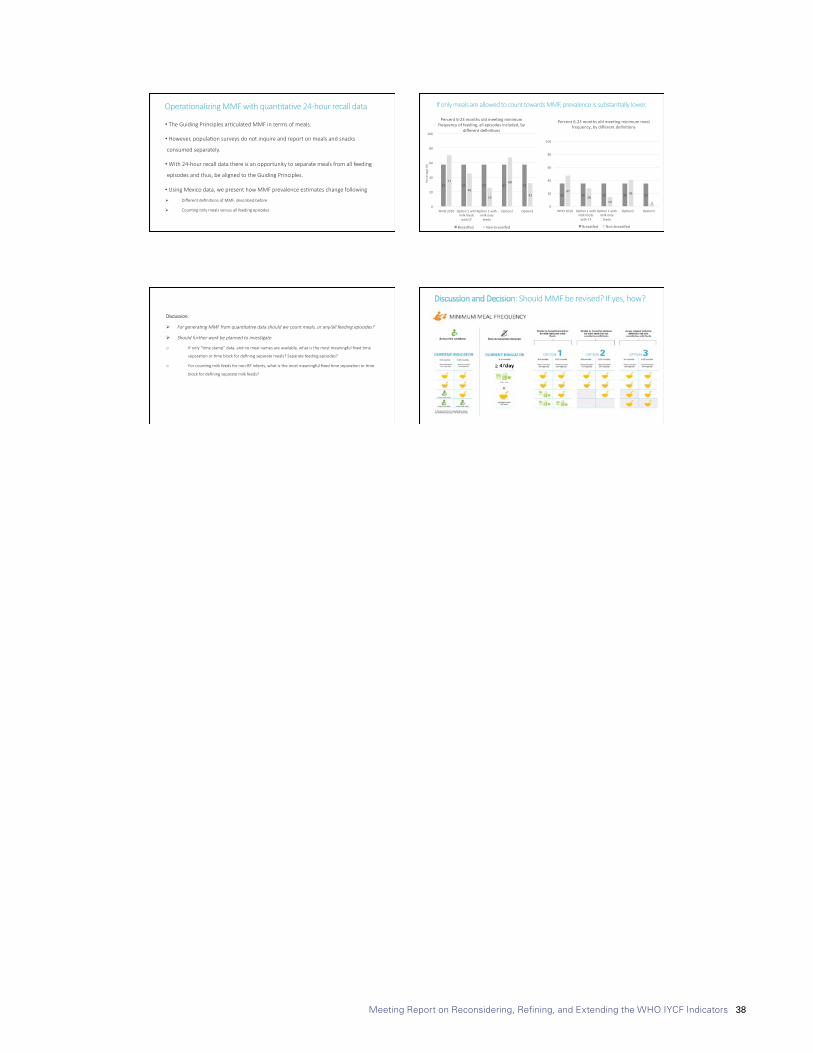
Meeting Report on Reconsidering, Refining, and Extending the WHO IYCF Indicators 38
8/29/17
5
Opera=onalizing MMF with quan=ta=ve 24-hour recall data
• The Guiding Principles ar=culated MMF in terms of meals.
• However, popula=on surveys do not inquire and report on meals and snacks
consumed separately.
• With 24-hour recall data there is an opportunity to separate meals from all feeding
episodes and thus, be aligned to the Guiding Principles.
• Using Mexico data, we present how MMF prevalence es=mates change following
Ø Different defini=ons of MMF, described before
Ø Coun=ng only meals versus all feeding episodes
57 57 57 57 5771
46
25
68
32
0
20
40
60
80
100
WHO2010 Op0on1withmilkfeedswithCF
Op0on1withmilkonly
feeds
Op0on2 Op0on3
Perc
enta
ge(%
)
Percent6-23monthsoldmee0ngminimumfrequencyoffeeding,allepisodesincluded,by
differentdefini0ons
BreasKed Non-breasKed
35 35 35 35 3547
2814
41
30
20
40
60
80
100
WHO2010 Op0on1withmilkfeedswithCF
Op0on1withmilkonly
feeds
Op0on2 Op0on3
Percent6-23monthsoldmee0ngminimummealfrequency,bydifferentdefini0ons
BreasKed Non-breasKed
If only meals are allowed to count towards MMF, prevalence is substan=ally lower.
Discussion:
Ø For genera<ng MMF from quan<ta<ve data should we count meals, or any/all feeding episodes?
Ø Should further work be planned to inves<gate
o If only “=me stamp” data, and no meal names are available, what is the most meaningful fixed =me
separa=on or =me block for defining separate meals? Separate feeding episodes?
o For coun=ng milk feeds for non-BF infants, what is the most meaningful fixed =me separa=on or =me
block for defining separate milk feeds?
Discussion and Decision: Should MMF be revised? If yes, how?
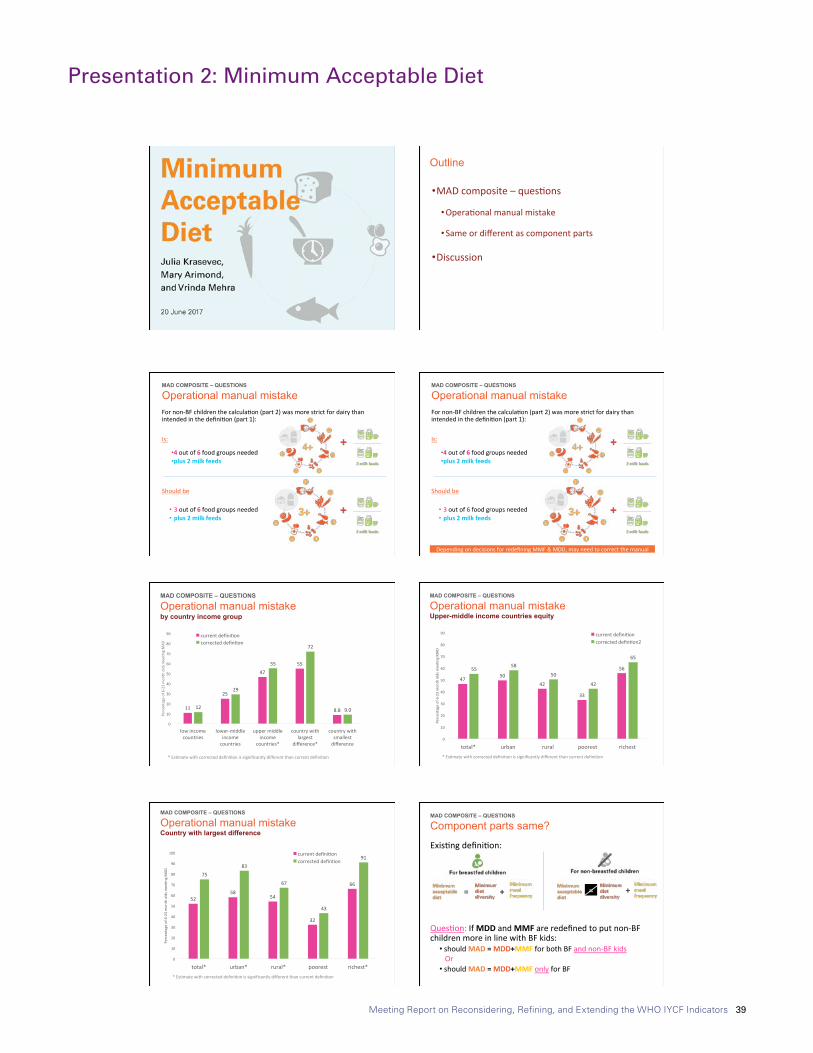
Meeting Report on Reconsidering, Refining, and Extending the WHO IYCF Indicators 39
Presentation 2: Minimum Acceptable Diet
8/29/17
1
Outline
• MADcomposite–ques6ons
• Opera6onalmanualmistake
• Sameordifferentascomponentparts
• Discussion
MAD COMPOSITE – QUESTIONS
Operational manual mistake Fornon-BFchildrenthecalcula6on(part2)wasmorestrictfordairythanintendedinthedefini6on(part1):Is:
• 4outof6foodgroupsneeded• plus2milkfeeds
Shouldbe
• 3outof6foodgroupsneeded• plus2milkfeeds
MAD COMPOSITE – QUESTIONS
Operational manual mistake Fornon-BFchildrenthecalcula6on(part2)wasmorestrictfordairythanintendedinthedefini6on(part1):Is:
• 4outof6foodgroupsneeded• plus2milkfeeds
Shouldbe
• 3outof6foodgroupsneeded• plus2milkfeeds
DependingondecisionsforredefiningMMF&MDD,mayneedtocorrectthemanual
8/29/17
2
MAD COMPOSITE – QUESTIONS
Operational manual mistake by country income group
11
25
4755
8.812
29
55
72
9.0
0
10
20
30
40
50
60
70
80
90
lowincomecountries
lower-middleincomecountries
uppermiddleincome
countries*
countrywithlargest
difference*
countrywithsmallestdifference
Percentageof6-23mon
tholdsm
ee6n
gMAD
currentdefini6oncorrecteddefin6on
*Es6matewithcorrecteddefini6onissignificantlydifferentthancurrentdefini6on
MAD COMPOSITE – QUESTIONS
Operational manual mistake Upper-middle income countries equity
4750
42
33
565558
50
42
65
0
10
20
30
40
50
60
70
80
90
total* urban rural poorest richest
Percentageof6-23mon
tholdsm
ee6n
gMAD
currentdefini6oncorrecteddefin6on2
*Es6matewithcorrecteddefini6onissignificantlydifferentthancurrentdefini6on
5258
54
32
66
7583
67
43
91
0
10
20
30
40
50
60
70
80
90
100
total* urban* rural* poorest richest*
Percentageof6-23mon
tholdsm
ee6n
gMAD
currentdefini6oncorrecteddefin6on
*Es6matewithcorrecteddefini6onissignificantlydifferentthancurrentdefini6on
MAD COMPOSITE – QUESTIONS
Operational manual mistake Country with largest difference
Exis6ngdefini6on:
Ques6on:IfMDDandMMFareredefinedtoputnon-BFchildrenmoreinlinewithBFkids:
• shouldMAD=MDD+MMFforbothBFandnon-BFkidsOr• shouldMAD=MDD+MMFonlyforBF
MAD COMPOSITE – QUESTIONS
Component parts same?
== + +

Meeting Report on Reconsidering, Refining, and Extending the WHO IYCF Indicators 40
8/29/17
3
MAD COMPOSITE – QUESTIONS
Component part same? Bangladesh DHS 2011
MAD COMPOSITE – QUESTIONS
Component part same? Bangladesh DHS 2011
MAD COMPOSITE – QUESTIONS
Component part same? Serbia MICS 2014
MAD COMPOSITE – QUESTIONS
Component part same? Serbia MICS 2014
8/29/17
3
MAD COMPOSITE – QUESTIONS
Component part same? Bangladesh DHS 2011
MAD COMPOSITE – QUESTIONS
Component part same? Bangladesh DHS 2011
MAD COMPOSITE – QUESTIONS
Component part same? Serbia MICS 2014
MAD COMPOSITE – QUESTIONS
Component part same? Serbia MICS 2014
8/29/17
4
WealthQuin<le
MAD COMPOSITE – QUESTIONS
Component part same? Serbia MICS 2014
WealthQuin<le
MAD COMPOSITE – QUESTIONS
Component part same? Serbia MICS 2014
WealthQuin<le
MAD COMPOSITE – QUESTIONS
Component part same? Serbia MICS 2014
MAD COMPOSITE – QUESTIONS
Component part same?
8/29/17
4
WealthQuin<le
MAD COMPOSITE – QUESTIONS
Component part same? Serbia MICS 2014
WealthQuin<le
MAD COMPOSITE – QUESTIONS
Component part same? Serbia MICS 2014
WealthQuin<le
MAD COMPOSITE – QUESTIONS
Component part same? Serbia MICS 2014
MAD COMPOSITE – QUESTIONS
Component part same?
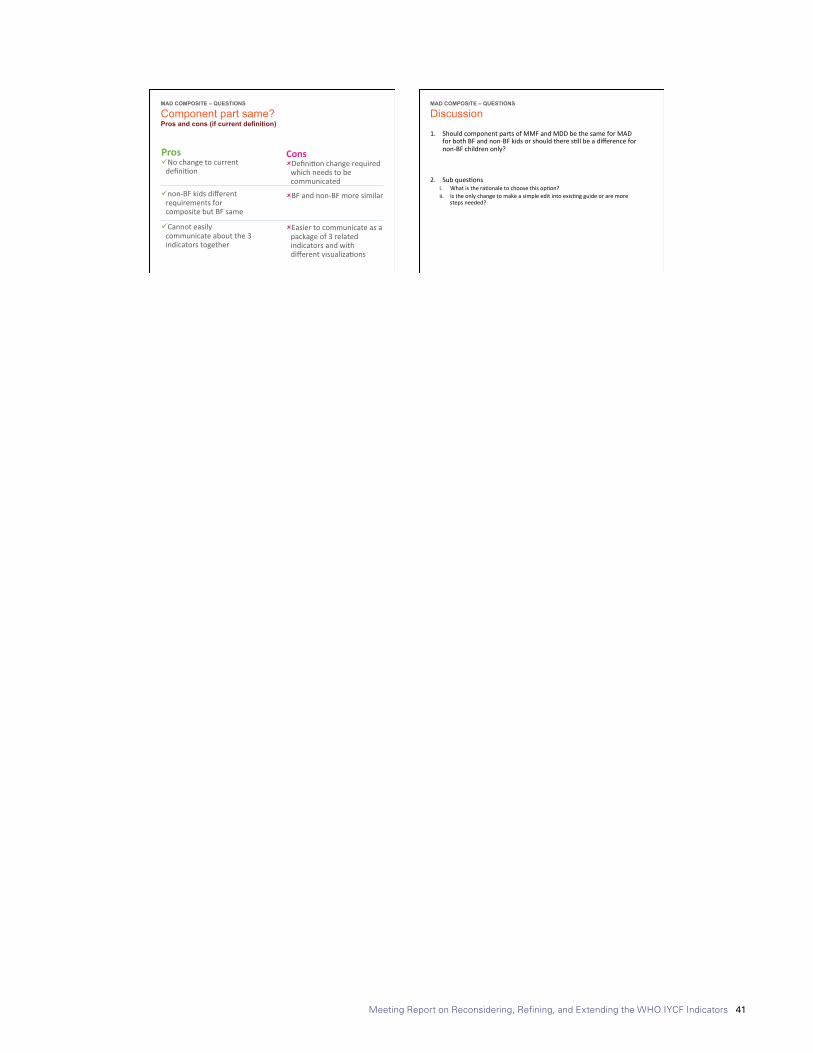
Meeting Report on Reconsidering, Refining, and Extending the WHO IYCF Indicators 41
8/29/17
5
Prosü Nochangetocurrentdefini6on
ü non-BFkidsdifferentrequirementsforcompositebutBFsame
ü Cannoteasilycommunicateaboutthe3indicatorstogether
Consû Defini6onchangerequiredwhichneedstobecommunicated
û BFandnon-BFmoresimilar
û Easiertocommunicateasapackageof3relatedindicatorsandwithdifferentvisualiza6ons
MAD COMPOSITE – QUESTIONS
Component part same? Pros and cons (if current definition)
1. ShouldcomponentpartsofMMFandMDDbethesameforMADforbothBFandnon-BFkidsorshouldtheres6llbeadifferencefornon-BFchildrenonly?
2. Subques6onsi. Whatisthera6onaletochoosethisop6on?ii. Istheonlychangetomakeasimpleeditintoexis6ngguideoraremore
stepsneeded?
MAD COMPOSITE – QUESTIONS
Discussion
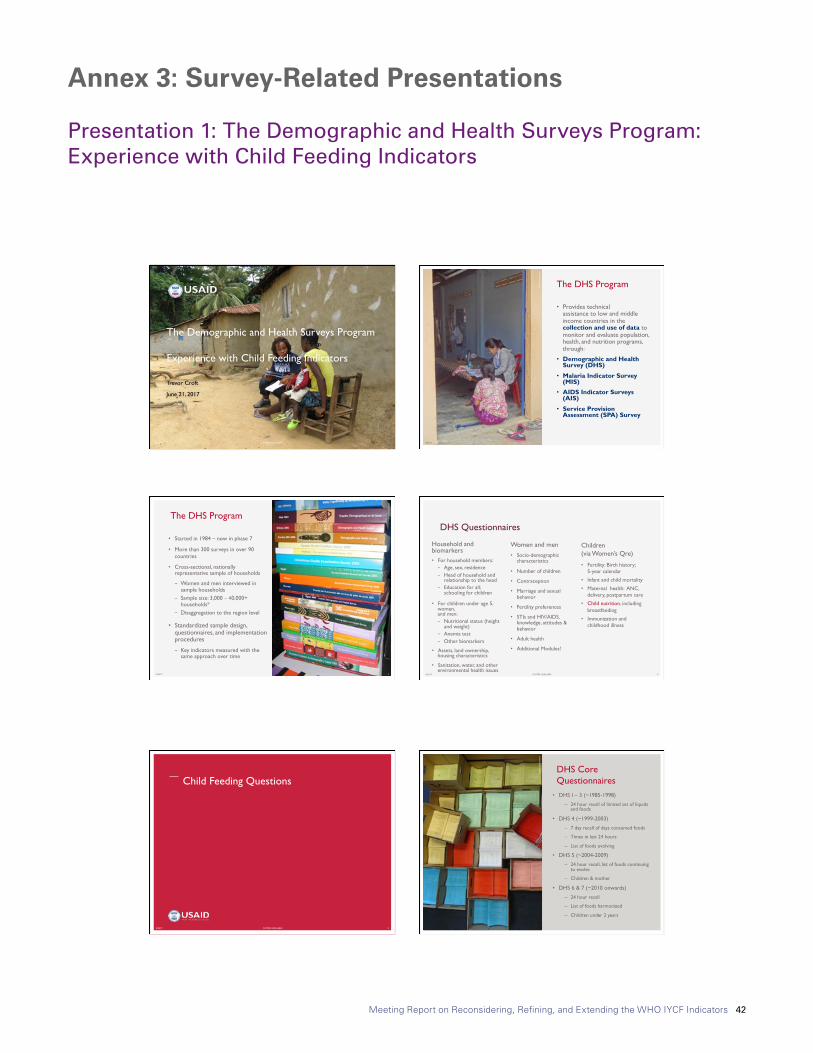
Meeting Report on Reconsidering, Refining, and Extending the WHO IYCF Indicators 42
Annex 3: Survey-Related Presentations
Presentation 1: The Demographic and Health Surveys Program: Experience with Child Feeding Indicators
8/29/17
1
8/29/17 FOOTER GOES HERE 1
The Demographic and Health Surveys Program Experience with Child Feeding Indicators
Trevor Croft
June 21, 2017
8/29/17 2
• Provides technical assistance to low and middle income countries in the collection and use of data to monitor and evaluate population, health, and nutrition programs, through:
• Demographic and Health Survey (DHS)
• Malaria Indicator Survey (MIS)
• AIDS Indicator Surveys (AIS)
• Service Provision Assessment (SPA) Survey
The DHS Program
© IC
F In
tern
atio
nal
8/29/17 3
• Started in 1984 – now in phase 7
• More than 300 surveys in over 90 countries
• Cross-sectional, nationally representative sample of households
− Women and men interviewed in sample households
− Sample size: 3,000 −40,000+ households*
− Disaggregation to the region level
• Standardized sample design, questionnaires, and implementation procedures
− Key indicators measured with the same approach over time
The DHS Program
© IC
F In
tern
atio
nal
Household and biomarkers • For household members:
− Age, sex, residence − Head of household and
relationship to the head − Education for all;
schooling for children
• For children under age 5, women, and men: − Nutritional status (height
and weight) − Anemia test − Other biomarkers
• Assets, land ownership, housing characteristics
• Sanitation, water, and other environmental health issues
Children (via Women’s Qre)
• Fertility: Birth history; 5-year calendar
• Infant and child mortality
• Maternal health: ANC, delivery, postpartum care
• Child nutrition, including breastfeeding
• Immunization and childhood illness
8/29/17 FOOTER GOES HERE 4
DHS Questionnaires
Women and men • Socio-demographic
characteristics
• Number of children
• Contraception
• Marriage and sexual behavior
• Fertility preferences
• STIs and HIV/AIDS, knowledge, attitudes & behavior
• Adult health
• Additional Modules!
8/29/17
2
Child Feeding Questions
8/29/17 FOOTER GOES HERE 5 8/29/17 6
• DHS I – 3 (~1985-1998)
– 24 hour recall of limited set of liquids and foods
• DHS 4 (~1999-2003)
– 7 day recall of days consumed foods
– Times in last 24 hours
– List of foods evolving
• DHS 5 (~2004-2009)
– 24 hour recall, list of foods continuing to evolve
– Children & mother
• DHS 6 & 7 (~2010 onwards)
– 24 hour recall
– List of foods harmonized
– Children under 2 years
DHS Core Questionnaires
© IC
F In
tern
atio
nal
8/29/17 FOOTER GOES HERE 7
Breastfeeding questions
8/29/17 FOOTER GOES HERE 8
Child feeding questions - asked for the youngest child under 2 years living with their mother

Meeting Report on Reconsidering, Refining, and Extending the WHO IYCF Indicators 43
8/29/17
3
8/29/17 FOOTER GOES HERE 9 8/29/17 FOOTER GOES HERE 10
Experience of The DHS Program, Food for Peace (FFP), Feed the Future (FEEDBACK)
8/29/17 FOOTER GOES HERE 11
• DHS: List-based collection of list of food items. Open-ended/meal based collection method considered too long and complicated for DHS.
– Youngest child under 2 years of age living with mother
– Mostly tablet based surveys.
– Time: ~10 minutes for feeding questions.
• FFP: List-based collection. Length of questionnaire and length of interview led to choice.
– All children under 2 years of age living in household
– Some paper, some tablet surveys.
– Time: ~10-20 minutes for module.
• FEEDBACK: Open recall of foods in last 24 hours throughout the day until child went to sleep at night. Followed by list-based approach to check for additional food items.
– All children under 2 years of age living in household
– Mix of paper and tablet surveys.
– Time: ~20-30 minutes for module.
8/29/17 FOOTER GOES HERE 12
Collection method
8/29/17
4
• DHS: Survey design visit with questionnaire adaptation meetings with stakeholders (donors, ministries, implementing partners and others)
• FFP: 3-4 day questionnaire adaptation workshop with stakeholders, includes working session on food items
• FEEDBACK: Customization by implementing partner with local nutrition specialist
Review process, pretesting, and pilot test revisions as needed.
8/29/17 FOOTER GOES HERE 13
Adaptation of questionnaires
• DHS: 2-3 hours for child feeding questions in 4-5 week training, including practice. Separate field practice with full questionnaire.
• FFP: half day for child feeding module, including in training practice
• FEEDBACK: One day on children’s module with different scenarios and paper questionnaire and tablet versions, including in training practice
Review process, pretesting, and pilot test revisions as needed in each case.
8/29/17 FOOTER GOES HERE 14
Training duration
• DHS: List-based questions can become repetitive, but yes/no questions are simpler than those capturing frequency. More practical than earlier questions collecting more detail.
• FFP: Recall of foods not considered too difficult. Frequency of feeds more error prone.
• FEEDBACK: Module is long and can be a burden on respondents. Tendency to rush through the module without sufficient probing. Collection of frequency posed challenge – extensive probing needed.
8/29/17 FOOTER GOES HERE 15
Enumerator issues
• DHS: When mixed dishes are mentioned by respondent, interviewers probe for each food item in the dish.
• FFP: Similarly interviewers probe for ingredients of mixed dishes
• FEEDBACK: As part of open-recall probing done to ask for ingredients. Interviewers generally local and are familiar with dishes
8/29/17 FOOTER GOES HERE 16
Mixed dishes
8/29/17
2
Child Feeding Questions
8/29/17 FOOTER GOES HERE 5 8/29/17 6
• DHS I – 3 (~1985-1998)
– 24 hour recall of limited set of liquids and foods
• DHS 4 (~1999-2003)
– 7 day recall of days consumed foods
– Times in last 24 hours
– List of foods evolving
• DHS 5 (~2004-2009)
– 24 hour recall, list of foods continuing to evolve
– Children & mother
• DHS 6 & 7 (~2010 onwards)
– 24 hour recall
– List of foods harmonized
– Children under 2 years
DHS Core Questionnaires
© IC
F In
tern
atio
nal
8/29/17 FOOTER GOES HERE 7
Breastfeeding questions
8/29/17 FOOTER GOES HERE 8
Child feeding questions - asked for the youngest child under 2 years living with their mother
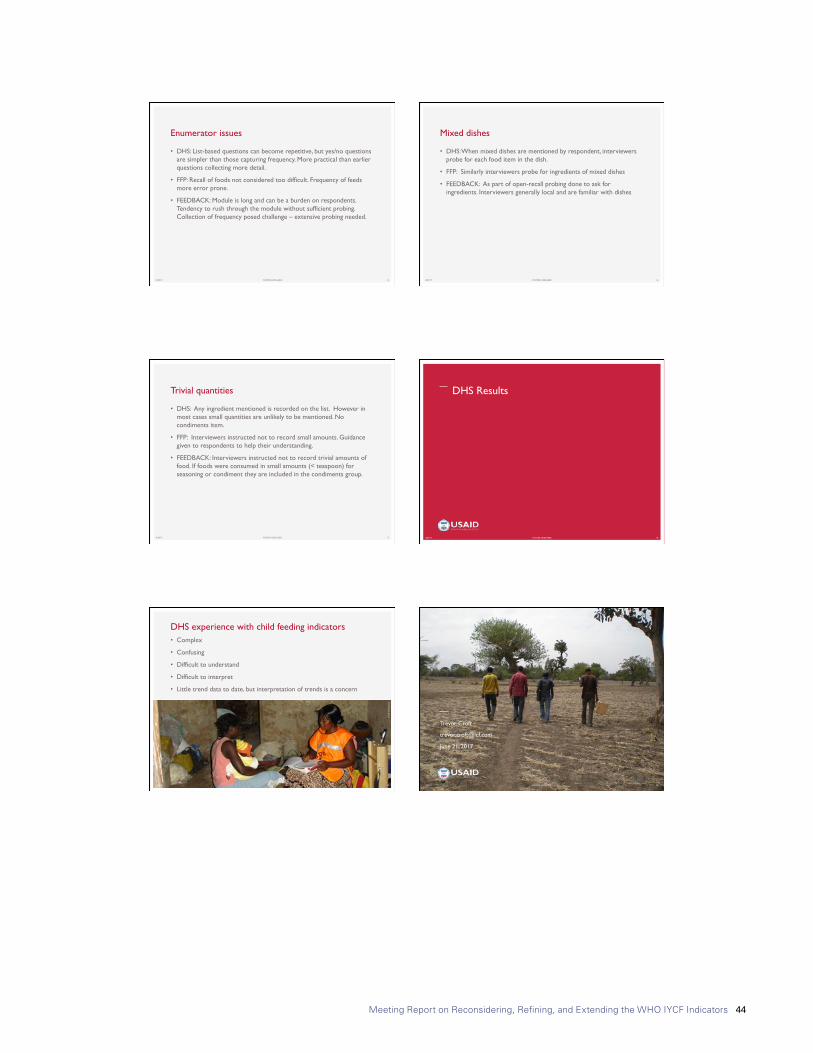
Meeting Report on Reconsidering, Refining, and Extending the WHO IYCF Indicators 44
8/29/17
5
• DHS: Any ingredient mentioned is recorded on the list. However in most cases small quantities are unlikely to be mentioned. No condiments item.
• FFP: Interviewers instructed not to record small amounts. Guidance given to respondents to help their understanding.
• FEEDBACK: Interviewers instructed not to record trivial amounts of food. If foods were consumed in small amounts (< teaspoon) for seasoning or condiment they are included in the condiments group.
8/29/17 FOOTER GOES HERE 17
Trivial quantities DHS Results
8/29/17 FOOTER GOES HERE 18
• Complex
• Confusing
• Difficult to understand
• Difficult to interpret
• Little trend data to date, but interpretation of trends is a concern
8/29/17 19
DHS experience with child feeding indicators
© IC
F In
tern
atio
nal
8/29/17 20
Trevor Croft
June 21, 2017
FOOTER GOES HERE
8/29/17
4
• DHS: Survey design visit with questionnaire adaptation meetings with stakeholders (donors, ministries, implementing partners and others)
• FFP: 3-4 day questionnaire adaptation workshop with stakeholders, includes working session on food items
• FEEDBACK: Customization by implementing partner with local nutrition specialist
Review process, pretesting, and pilot test revisions as needed.
8/29/17 FOOTER GOES HERE 13
Adaptation of questionnaires
• DHS: 2-3 hours for child feeding questions in 4-5 week training, including practice. Separate field practice with full questionnaire.
• FFP: half day for child feeding module, including in training practice
• FEEDBACK: One day on children’s module with different scenarios and paper questionnaire and tablet versions, including in training practice
Review process, pretesting, and pilot test revisions as needed in each case.
8/29/17 FOOTER GOES HERE 14
Training duration
• DHS: List-based questions can become repetitive, but yes/no questions are simpler than those capturing frequency. More practical than earlier questions collecting more detail.
• FFP: Recall of foods not considered too difficult. Frequency of feeds more error prone.
• FEEDBACK: Module is long and can be a burden on respondents. Tendency to rush through the module without sufficient probing. Collection of frequency posed challenge – extensive probing needed.
8/29/17 FOOTER GOES HERE 15
Enumerator issues
• DHS: When mixed dishes are mentioned by respondent, interviewers probe for each food item in the dish.
• FFP: Similarly interviewers probe for ingredients of mixed dishes
• FEEDBACK: As part of open-recall probing done to ask for ingredients. Interviewers generally local and are familiar with dishes
8/29/17 FOOTER GOES HERE 16
Mixed dishes
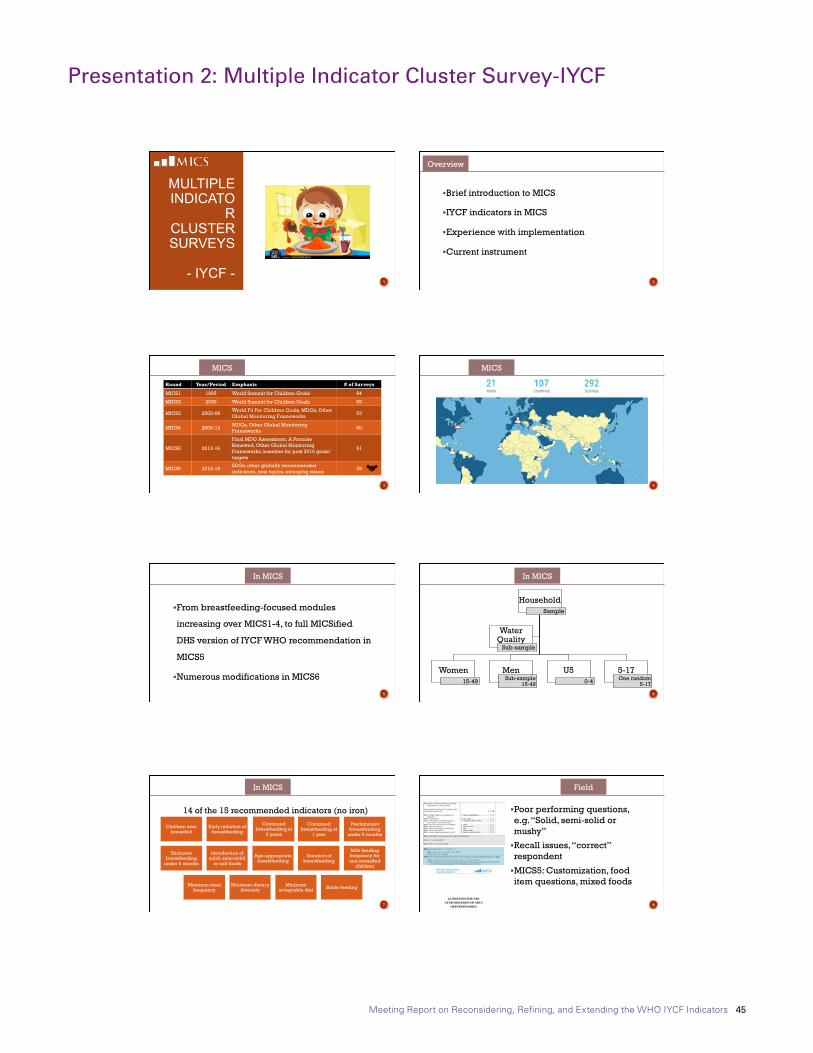
Meeting Report on Reconsidering, Refining, and Extending the WHO IYCF Indicators 45
Presentation 2: Multiple Indicator Cluster Survey-IYCF
8/29/17
1
MULTIPLE INDICATO
R CLUSTER SURVEYS
- IYCF -
1
§ Brief introduction to MICS
§ IYCF indicators in MICS
§ Experience with implementation
§ Current instrument
2
Overview
3
Round Year/Period Emphasis # of Surveys
MICS1 1995 World Summit for Children Goals 64
MICS2 2000 World Summit for Children Goals 65
MICS3 2005-09 World Fit For Children Goals, MDGs, Other Global Monitoring Frameworks 53
MICS4 2009-13 MDGs, Other Global Monitoring Frameworks 60
MICS5 2013-16
Final MDG Assessment, A Promise Renewed, Other Global Monitoring Frameworks, baseline for post 2015 goals/targets
51
MICS6 2016-19 SDGs, other globally recommended indicators, new topics, emerging issues 39
MICS
4
MICS
8/29/17
2
§ From breastfeeding-focused modules
increasing over MICS1-4, to full MICSified
DHS version of IYCF WHO recommendation in
MICS5
§ Numerous modifications in MICS6
5
In MICS
6
Household Sample
Women 15-49
Men Sub-sample
15-49
U5 0-4
5-17 One random
5-17
Water Quality
Sub-sample
In MICS
14 of the 15 recommended indicators (no iron)
7
Children ever breastfed
Early initiation of breastfeeding
Continued breastfeeding at
2 years
Continued breastfeeding at
1 year
Predominant breastfeeding
under 6 months
Exclusive breastfeeding
under 6 months
Introduction of solid, semi-solid
or soft foods
Age-appropriate breastfeeding
Duration of breastfeeding
Milk feeding frequency for non-breastfed
children
Minimum meal frequency
Minimum dietary diversity
Minimum acceptable diet Bottle feeding
In MICS
§ Poor performing questions, e.g. “Solid, semi-solid or mushy”
§ Recall issues, “correct” respondent
§ MICS5: Customization, food item questions, mixed foods
8
Field

Meeting Report on Reconsidering, Refining, and Extending the WHO IYCF Indicators 46
8/29/17
3
§ “New approach” – adopting proper recall
§ Rewording items, probes
§ CAPI improvements
§ As in MICS5, Nutrition ~11 tables: 8 on IYCF 9
MICS6
§ New modules, new questionnaire, time consuming measurements, pressure for more § New methods and topics § Revisiting methods not adequately validated § Some ideas for you to consider:
§ Economy: Why are we collecting information on 2 year old children?
§ Tools: Utilise CAPI - can pictorials work? § Method: Does (good) survey data match gold standard? Fresh
validation? Easier groups? § Training: Collaboration? 10
MICS6
Multiple Indicator Cluster Surveys
§ Web: mics.unicef.org
§ E-mail: [email protected]
Attila Hancioglu
Global MICS Coordinator
Bo Robert Beshanski-Pedersen
Household Survey Consultant
Global MICS Team
11

Meeting Report on Reconsidering, Refining, and Extending the WHO IYCF Indicators 47
Presentation 3: ENSANUT and MICS (ENIM- Mexico) Survey Differences in Infant & Young Child Feeding Practices Questionnaires
8/29/17
1
ENSANUT AND MICS (ENIM- MEXICO)
SURVEY DIFFERENCES IN INFANT & YOUNG
CHILD FEEDING PRACTICES
QUESTIONNAIRES
Dra. Teresa Shamah Levy 2017, June 21
CONTENT DIFFERENCES BETWEEN QUESTIONNARIES Ø Staff training differences Ø Different grouping foods Ø Different sample groups that may
influence the prevalence of exclusive breastfeeding
Ø Recommendations
MAIN METHODOLGICAL ASPECTS CHARACTERISTIC ENSANUT MICS-ENIM
Based on last Census, updated with household
Sample frame listing only household members listing
Cluster size 36 households 25 households
Information collected 1 random child <5 years old
all children <5 years old.
informant Ø Mother or Primary caregiver
Ø Women 12 years old or older
Ø Low education and socioeconomic level
Ø Only the mother Ø Women 15 years old
or older Ø High education and
socioeconomic level
Sample weight Non-standardized Standardized
1. PREVIOUS INTAKE QUESTION ACCURACY ENSANUT
“What did you consume at any time yesterday or last night ?” Ø Training includes probing techniques to ensure accurate recall of food intake, asking for food/liquids consumed in every meal
Ø Staff trained in 24Hrs recall
MICS-ENIM “What did you consume during the day or night, inside or outside your home?” Ø Training includes probing te c hn ique s t o en su re accurate recall of food intake
8/29/17
2
2. FOOD GROUPING DIFFERENCES BETWEEN SURVEYS THAT IS, TO CLASSIFY THE FOOD IN SUCH A WAY THAT BOTH SURVEYS COULD BE COMPARED
ENSANUT Ø The categories of other liquids and other foods could not be obtained
Ø It was asked about non-nutritive liquids in a generic way (soft d r i n k s , j u i c e s , t e a s ) , n o t discriminated by certain types
Ø I t wa s a s ke d a b o u t t h e con sumpt ion o f f r u i t s and vegetables as a food group
MICS-ENIM Ø The category of other liquids
includes nutritious liquids
Ø It was asked about certain fruits source of Vitamin A and fruit or vegetables, in general
….2. FOOD GROUPING DIFFERENCES BETWEEN SURVEYS THAT IS, TO CLASSIFY THE FOOD IN SUCH A WAY THAT BOTH SURVEYS CAN BE COMPARED. ENSANUT
Ø Specified white meats or red meats information was asked only generically
Ø T h e d a i r y wa s n o t separated, but considered as a group
MICS-ENIM Ø It was asked about all types of meats, viscera or fish
Ø For dairy, there are two groups: yogurt or cheese
Ø If other types of fermented dairy drinks were consumed was not recalled (e.g. yakult or danonino)
3. THERE ARE NO SIGNIFICANT DIFFERENCES ON EXCLUSIVE BREASTFEEDING IN CHILDREN UNDER 6 MONTHS BETWEEN SURVEYS WHEN CONSUMPTION OF SELECTED FOODS WERE NOT CONSIDERED: Eggs, Liquids (excluding water and rehydration oral fluids),
Non-maternal milk
It can be seen that the estimates of the surveys do not seem very different
Survey
ExclusiveBres/eeding*
CI 95% NChild
ENSANUT2012 35.3% 31.0% 39.9% 853
MICS-ENIM2015 33.7% 26.7% 41.6% 666
ENSANUT-MC2016 30.7% 20.2% 43.7% 140
*Derived from this analysis, the way to collect data between surveys on the consumption of plain water and non-maternal milk should be observed.
3. THE ESTIMATES FOR THE CONSUMPTION OF SELECTED MILKS ENSANUT Ø It was asked about the consumption of all kinds of milk (not only powdered or fresh), and the formula was generically called “infant formula“
MICS- ENIM Ø They asked about formula for babies and for any other types of milk
This group may be underestimated in children younger than 6 months: (non-consumers ENSANUT MC 33.2% vs. ENIM 35.8%)

Meeting Report on Reconsidering, Refining, and Extending the WHO IYCF Indicators 48
8/29/17
3
4 . D E R I V E D F R O M T H E QUESTIONING ABOUT WATER CONSUMPTION IN ENSANUT AND ENIM_MICS, THIS GROUP COULD B E U N D E R E S T I M A T E D I N CHILDREN UNDER 6 MONTHS IN ENIM Non-consumers ENSANUT MC 25.9% vs. ENIM 66.0%
5. RELEVANCE OF PLAIN WATER AND MILK CONSUMPTION IN CHILDREN <6 MONTHS
Ø Points around milk and water consumption are very relevant due to the fact that the decline in the prevalence of exclusive breastfeeding reported by ENSANUT of 7.9 pp between 2006 and 2012 is explained by the increase in water consumption (4pp) and the introduction of the formula(5pp)
PLEASE TAKE INTO ACCOUNT THAT:
The ENSANUT MC 2016 shows several strengths;
1. Same sample design methodology as former surveys
2. Same methodology of data collection between ENSANUTS
3. Personnel trained in the application of instruments for collecting dietary data (e.g. 24hrs Rec), which ensures a higher-quality survey during the interview
González de Cosío T, Escobar-Zaragoza L, González-Castell LD, Rivera-Dommarco JA. Prácticas de alimentación infantil y deterioro de la lactancia materna en México. Salud Publica Mex 2013;55 supl 2:S170-S179.
LIMITATIONS OF ENSANUT Ø Small sample size in ENSANUT MC 2016
Ø The breastfeeding and Food Feeding Practices questionnaires are part of a whole survey that involves many more sections
Ø The application of the ENSANUT is done over the entire population
Ø The budget to include other items in the survey is very high; therefore, to disaggregate food groups would be impractical
Ø If we want to introduce another questionnaire, we could lose the comparison with the 4 previous surveys
8/29/17
2
2. FOOD GROUPING DIFFERENCES BETWEEN SURVEYS THAT IS, TO CLASSIFY THE FOOD IN SUCH A WAY THAT BOTH SURVEYS COULD BE COMPARED
ENSANUT Ø The categories of other liquids and other foods could not be obtained
Ø It was asked about non-nutritive liquids in a generic way (soft d r i n k s , j u i c e s , t e a s ) , n o t discriminated by certain types
Ø I t wa s a s ke d a b o u t t h e con sumpt ion o f f r u i t s and vegetables as a food group
MICS-ENIM Ø The category of other liquids
includes nutritious liquids
Ø It was asked about certain fruits source of Vitamin A and fruit or vegetables, in general
….2. FOOD GROUPING DIFFERENCES BETWEEN SURVEYS THAT IS, TO CLASSIFY THE FOOD IN SUCH A WAY THAT BOTH SURVEYS CAN BE COMPARED. ENSANUT
Ø Specified white meats or red meats information was asked only generically
Ø T h e d a i r y wa s n o t separated, but considered as a group
MICS-ENIM Ø It was asked about all types of meats, viscera or fish
Ø For dairy, there are two groups: yogurt or cheese
Ø If other types of fermented dairy drinks were consumed was not recalled (e.g. yakult or danonino)
3. THERE ARE NO SIGNIFICANT DIFFERENCES ON EXCLUSIVE BREASTFEEDING IN CHILDREN UNDER 6 MONTHS BETWEEN SURVEYS WHEN CONSUMPTION OF SELECTED FOODS WERE NOT CONSIDERED: Eggs, Liquids (excluding water and rehydration oral fluids),
Non-maternal milk
It can be seen that the estimates of the surveys do not seem very different
Survey
ExclusiveBres/eeding*
CI 95% NChild
ENSANUT2012 35.3% 31.0% 39.9% 853
MICS-ENIM2015 33.7% 26.7% 41.6% 666
ENSANUT-MC2016 30.7% 20.2% 43.7% 140
*Derived from this analysis, the way to collect data between surveys on the consumption of plain water and non-maternal milk should be observed.
3. THE ESTIMATES FOR THE CONSUMPTION OF SELECTED MILKS ENSANUT Ø It was asked about the consumption of all kinds of milk (not only powdered or fresh), and the formula was generically called “infant formula“
MICS- ENIM Ø They asked about formula for babies and for any other types of milk
This group may be underestimated in children younger than 6 months: (non-consumers ENSANUT MC 33.2% vs. ENIM 35.8%)
Meeting Report on Reconsidering, Refining, and Extending the WHO IYCF Indicators 49
8/29/17
4
RECOMMENDATIONS THERE ARE NO ERRONEOUS OR PERFECT DATA IN A SURVEY; THEREFORE, IT IS SUGGESTED
Ø To review data collection methodologies (strengths, weaknesses)
Ø To review collection instruments (e.g. type of questions, food groups)
Ø To review characteristics of the study population
WHEN PREVALENCES CHANGE DRASTICALLY:
To analyze success cases in other countries:
“Brazil increased the exclusive breastfeeding practice from 3.1% in 1975 to 41% in 2008 (1.1 pp / year)”. This was achieved thanks to the involvement of government authorities, decision makers, regulation and control of formulas marketing and distribution, political will, education, civil actors, among others
Marina Ferreira Rea. Chap.8.5. Caso de Brasil como ejemplo del involucramiento exitoso de tomadores de decisión. In: Lactancia materna en México. […]. Academia Nacional de Medicina de México (ANMM). 2016
THANKS TO: DINORAH GONZALEZ
SONIA HERNÁNDEZ FILIPA DE CASTRO
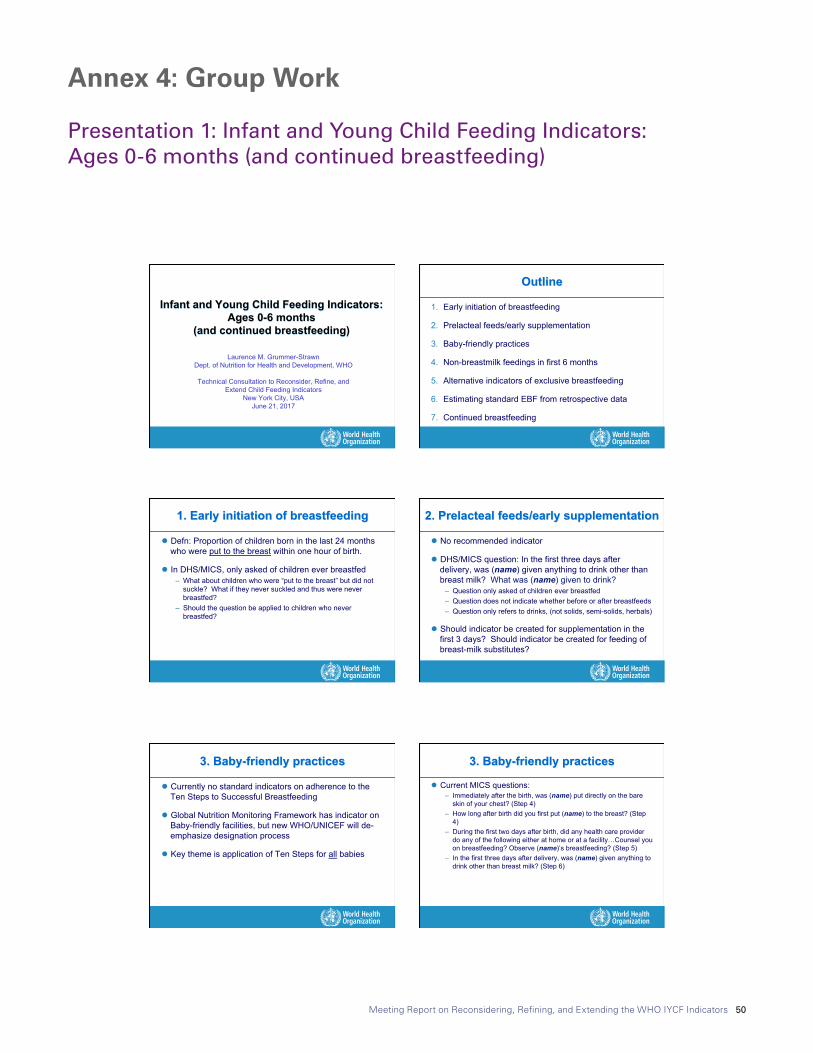
Meeting Report on Reconsidering, Refining, and Extending the WHO IYCF Indicators 50
Annex 4: Group Work
Presentation 1: Infant and Young Child Feeding Indicators: Ages 0-6 months (and continued breastfeeding)
8/29/17
1
Laurence M. Grummer-Strawn Dept. of Nutrition for Health and Development, WHO
Technical Consultation to Reconsider, Refine, and
Extend Child Feeding Indicators New York City, USA
June 21, 2017
Infant and Young Child Feeding Indicators: Ages 0-6 months
(and continued breastfeeding)
Outline
1. Early initiation of breastfeeding
2. Prelacteal feeds/early supplementation
3. Baby-friendly practices
4. Non-breastmilk feedings in first 6 months
5. Alternative indicators of exclusive breastfeeding
6. Estimating standard EBF from retrospective data
7. Continued breastfeeding
1. Early initiation of breastfeeding
l Defn: Proportion of children born in the last 24 months who were put to the breast within one hour of birth.
l In DHS/MICS, only asked of children ever breastfed – What about children who were “put to the breast” but did not
suckle? What if they never suckled and thus were never breastfed?
– Should the question be applied to children who never breastfed?
2. Prelacteal feeds/early supplementation
l No recommended indicator
l DHS/MICS question: In the first three days after delivery, was (name) given anything to drink other than breast milk? What was (name) given to drink?
– Question only asked of children ever breastfed – Question does not indicate whether before or after breastfeeds – Question only refers to drinks, (not solids, semi-solids, herbals)
l Should indicator be created for supplementation in the first 3 days? Should indicator be created for feeding of breast-milk substitutes?
8/29/17
2
3. Baby-friendly practices
l Currently no standard indicators on adherence to the Ten Steps to Successful Breastfeeding
l Global Nutrition Monitoring Framework has indicator on Baby-friendly facilities, but new WHO/UNICEF will de-emphasize designation process
l Key theme is application of Ten Steps for all babies
3. Baby-friendly practices
l Current MICS questions: – Immediately after the birth, was (name) put directly on the bare
skin of your chest? (Step 4) – How long after birth did you first put (name) to the breast? (Step
4) – During the first two days after birth, did any health care provider
do any of the following either at home or at a facility…Counsel you on breastfeeding? Observe (name)’s breastfeeding? (Step 5)
– In the first three days after delivery, was (name) given anything to drink other than breast milk? (Step 6)
3. Baby-friendly practices
l US Pregnancy Risk Assessment Monitoring System questions:
– Hospital staff gave me information about breastfeeding (Step 3) – My baby stayed in the same room with me at the hospital (Step 7) – Hospital staff told me to breastfeed whenever my baby wanted
(Step 8) – Hospital staff gave my baby a pacifier (Step 9) – The hospital gave me a telephone number to call for help with
breastfeeding (Step 10)
l Should indicator be created on adherence to WHO/UNICEF recommendations for facility breastfeeding care?
4. Non-breastmilk feedings in first 6 months
l EBF indicator only indicates that something other than breast-milk was fed.
l Intervention would be quite different if: – Breastfeeding stops before 6 months – Water is widely given – Infant formula is used – Solid foods start early
l Information is captured in area graphs
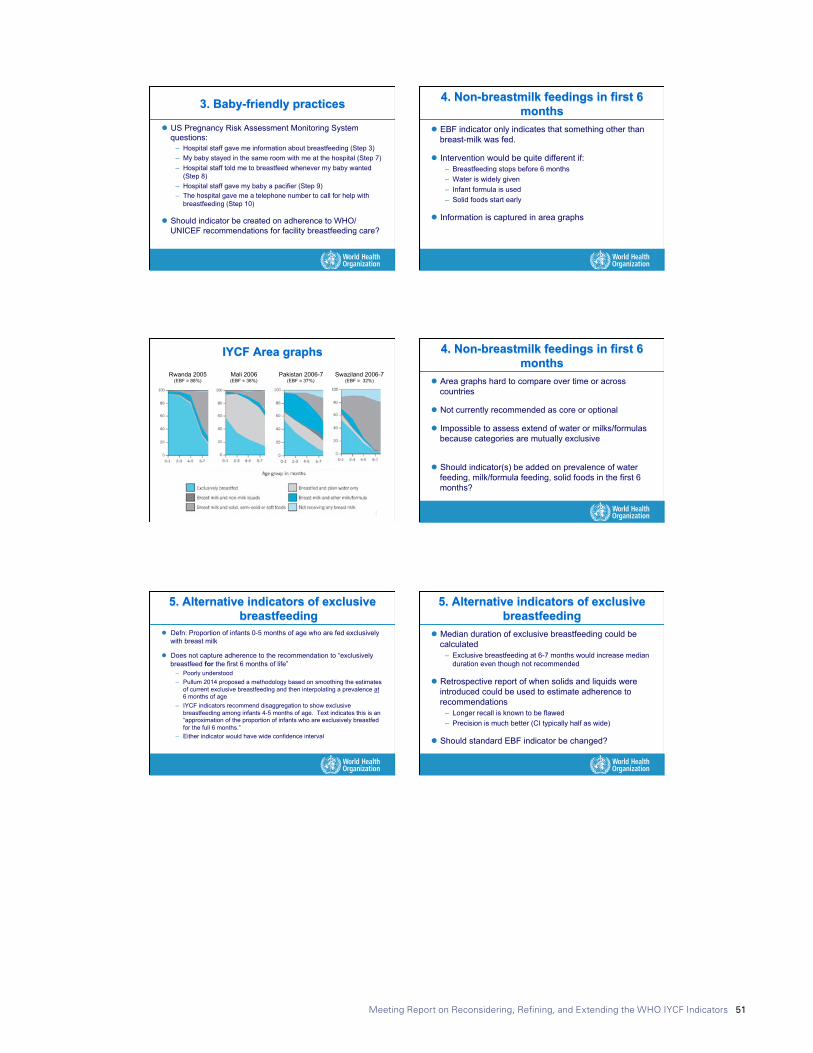
Meeting Report on Reconsidering, Refining, and Extending the WHO IYCF Indicators 51
8/29/17
2
3. Baby-friendly practices
l Currently no standard indicators on adherence to the Ten Steps to Successful Breastfeeding
l Global Nutrition Monitoring Framework has indicator on Baby-friendly facilities, but new WHO/UNICEF will de-emphasize designation process
l Key theme is application of Ten Steps for all babies
3. Baby-friendly practices
l Current MICS questions: – Immediately after the birth, was (name) put directly on the bare
skin of your chest? (Step 4) – How long after birth did you first put (name) to the breast? (Step
4) – During the first two days after birth, did any health care provider
do any of the following either at home or at a facility…Counsel you on breastfeeding? Observe (name)’s breastfeeding? (Step 5)
– In the first three days after delivery, was (name) given anything to drink other than breast milk? (Step 6)
3. Baby-friendly practices
l US Pregnancy Risk Assessment Monitoring System questions:
– Hospital staff gave me information about breastfeeding (Step 3) – My baby stayed in the same room with me at the hospital (Step 7) – Hospital staff told me to breastfeed whenever my baby wanted
(Step 8) – Hospital staff gave my baby a pacifier (Step 9) – The hospital gave me a telephone number to call for help with
breastfeeding (Step 10)
l Should indicator be created on adherence to WHO/UNICEF recommendations for facility breastfeeding care?
4. Non-breastmilk feedings in first 6 months
l EBF indicator only indicates that something other than breast-milk was fed.
l Intervention would be quite different if: – Breastfeeding stops before 6 months – Water is widely given – Infant formula is used – Solid foods start early
l Information is captured in area graphs 8/29/17
3
IYCF Area graphs Rwanda 2005
(EBF = 88%) Mali 2006 (EBF = 38%)
Pakistan 2006-7 (EBF = 37%)
Swaziland 2006-7 (EBF = 32%)
4. Non-breastmilk feedings in first 6 months
l Area graphs hard to compare over time or across countries
l Not currently recommended as core or optional
l Impossible to assess extend of water or milks/formulas because categories are mutually exclusive
l Should indicator(s) be added on prevalence of water feeding, milk/formula feeding, solid foods in the first 6 months?
5. Alternative indicators of exclusive breastfeeding
l Defn: Proportion of infants 0-5 months of age who are fed exclusively with breast milk
l Does not capture adherence to the recommendation to “exclusively breastfeed for the first 6 months of life”
– Poorly understood – Pullum 2014 proposed a methodology based on smoothing the estimates
of current exclusive breastfeeding and then interpolating a prevalence at 6 months of age
– IYCF indicators recommend disaggregation to show exclusive breastfeeding among infants 4-5 months of age. Text indicates this is an “approximation of the proportion of infants who are exclusively breastfed for the full 6 months.”
– Either indicator would have wide confidence interval
5. Alternative indicators of exclusive breastfeeding
l Median duration of exclusive breastfeeding could be calculated
– Exclusive breastfeeding at 6-7 months would increase median duration even though not recommended
l Retrospective report of when solids and liquids were introduced could be used to estimate adherence to recommendations
– Longer recall is known to be flawed – Precision is much better (CI typically half as wide)
l Should standard EBF indicator be changed?
8/29/17
3
IYCF Area graphs Rwanda 2005
(EBF = 88%) Mali 2006 (EBF = 38%)
Pakistan 2006-7 (EBF = 37%)
Swaziland 2006-7 (EBF = 32%)
4. Non-breastmilk feedings in first 6 months
l Area graphs hard to compare over time or across countries
l Not currently recommended as core or optional
l Impossible to assess extend of water or milks/formulas because categories are mutually exclusive
l Should indicator(s) be added on prevalence of water feeding, milk/formula feeding, solid foods in the first 6 months?
5. Alternative indicators of exclusive breastfeeding
l Defn: Proportion of infants 0-5 months of age who are fed exclusively with breast milk
l Does not capture adherence to the recommendation to “exclusively breastfeed for the first 6 months of life”
– Poorly understood – Pullum 2014 proposed a methodology based on smoothing the estimates
of current exclusive breastfeeding and then interpolating a prevalence at 6 months of age
– IYCF indicators recommend disaggregation to show exclusive breastfeeding among infants 4-5 months of age. Text indicates this is an “approximation of the proportion of infants who are exclusively breastfed for the full 6 months.”
– Either indicator would have wide confidence interval
5. Alternative indicators of exclusive breastfeeding
l Median duration of exclusive breastfeeding could be calculated
– Exclusive breastfeeding at 6-7 months would increase median duration even though not recommended
l Retrospective report of when solids and liquids were introduced could be used to estimate adherence to recommendations
– Longer recall is known to be flawed – Precision is much better (CI typically half as wide)
l Should standard EBF indicator be changed?

Meeting Report on Reconsidering, Refining, and Extending the WHO IYCF Indicators 52
8/29/17
4
6. Estimating standard EBF from retrospective data
l Many countries do not report exclusive breastfeeding among infants 0-5 months of age
l Can information collected through retrospective questions be used to estimate standard indicator
– Percent of infants exclusively breastfed up to 3 months – Percent of infants exclusively breastfed at each age from 0-5
months
l WHO contract to examine datasets that collected information in both ways
6. Estimating standard EBF from retrospective data
Average prevalence of exclusive breastfeeding at each month from 0-5 months based on retrospective report of first feeds other than breast milk
Pro
porti
on o
f inf
ants
0-5
mon
ths
excl
usiv
ely
brea
stfe
d in
pas
t 24
hour
s
R2 = .93
7. Continued breastfeeding
l Defn: Proportion of children 12-15 (or 20-23) months of age who are fed breast milk
– Large confidence intervals due to tight age range (typically impossible to do subgroup analysis)
– Averages ages are 14.0 months and 22.0 months (only 8 months apart)
l Alternatives: – 0-11 and 12-23 months – 6-17 and 18-29 months (would require increased data
collection)
l Should indicator be changed?
Summary of Possible Changes
Requires change to
questionnaire
Would affect trends
Ask early initiation questions for infants never breastfed
Skip logic only Slightly
Indicator on feeding in first few days No New BFHI indicators Yes New Indicators on feedings in first six months No New Exclusive breastfeeding up to 6 months No Yes Median duration of exclusive breastfeeding No New Broader age groupings for continued breastfeeding
No Yes
8/29/17
4
6. Estimating standard EBF from retrospective data
l Many countries do not report exclusive breastfeeding among infants 0-5 months of age
l Can information collected through retrospective questions be used to estimate standard indicator
– Percent of infants exclusively breastfed up to 3 months – Percent of infants exclusively breastfed at each age from 0-5
months
l WHO contract to examine datasets that collected information in both ways
6. Estimating standard EBF from retrospective data
Average prevalence of exclusive breastfeeding at each month from 0-5 months based on retrospective report of first feeds other than breast milk
Pro
porti
on o
f inf
ants
0-5
mon
ths
excl
usiv
ely
brea
stfe
d in
pas
t 24
hour
s
R2 = .93
7. Continued breastfeeding
l Defn: Proportion of children 12-15 (or 20-23) months of age who are fed breast milk
– Large confidence intervals due to tight age range (typically impossible to do subgroup analysis)
– Averages ages are 14.0 months and 22.0 months (only 8 months apart)
l Alternatives: – 0-11 and 12-23 months – 6-17 and 18-29 months (would require increased data
collection)
l Should indicator be changed?
Summary of Possible Changes
Requires change to
questionnaire
Would affect trends
Ask early initiation questions for infants never breastfed
Skip logic only Slightly
Indicator on feeding in first few days No New BFHI indicators Yes New Indicators on feedings in first six months No New Exclusive breastfeeding up to 6 months No Yes Median duration of exclusive breastfeeding No New Broader age groupings for continued breastfeeding
No Yes 8/29/17
5
Thank you!
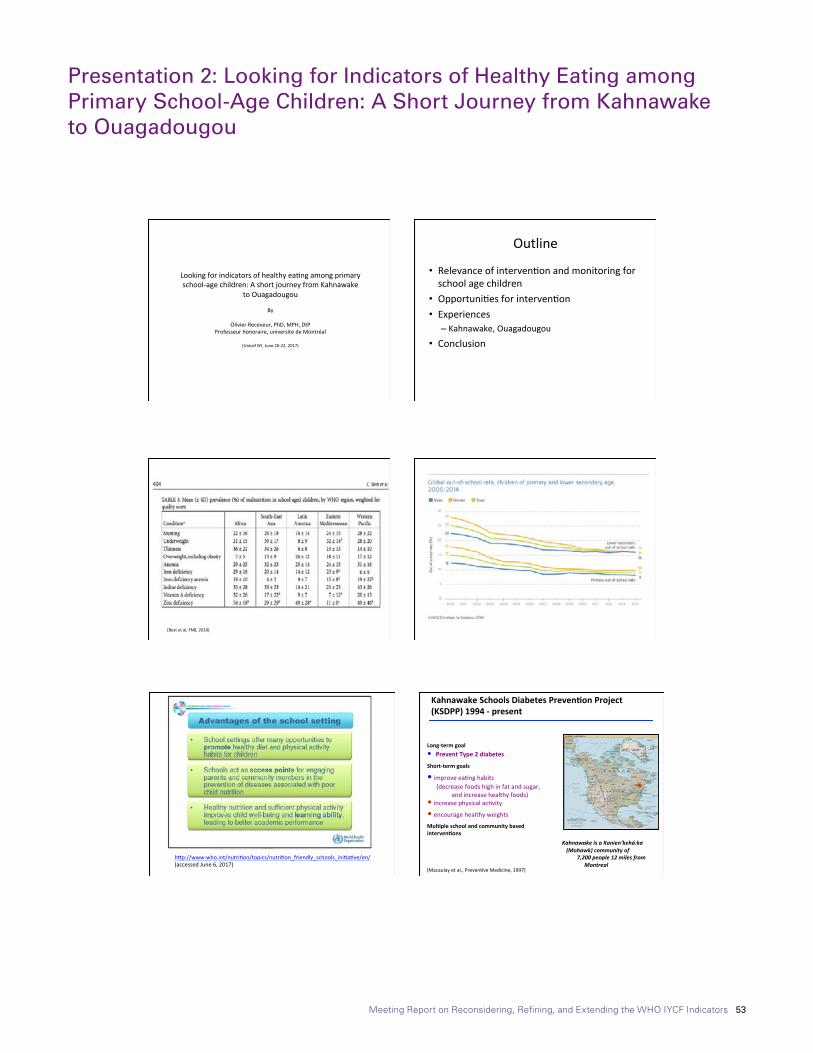
Meeting Report on Reconsidering, Refining, and Extending the WHO IYCF Indicators 53
Presentation 2: Looking for Indicators of Healthy Eating among Primary School-Age Children: A Short Journey from Kahnawake to Ouagadougou
8/29/17
1
Lookingforindicatorsofhealthyea9ngamongprimaryschool-agechildren:AshortjourneyfromKahnawake
toOuagadougouBy
OlivierReceveur,PhD,MPH,DtPProfesseurhonoraire,universitédeMontréal
(UnicefNY,June20-22,2017)
Outline
• Relevanceofinterven9onandmonitoringforschoolagechildren
• Opportuni9esforinterven9on• Experiences
– Kahnawake,Ouagadougou
• Conclusion
(Bestetal,FNB,2010)
8/29/17
2
hXp://www.who.int/nutri9on/topics/nutri9on_friendly_schools_ini9a9ve/en/(accessedJune6,2017)
KahnawakeSchoolsDiabetesPreven5onProject(KSDPP)1994-present
Long-termgoal• PreventType2diabetesShort-termgoals
• improveea9nghabits(decreasefoodshighinfatandsugar,
andincreasehealthyfoods)• increasephysicalac9vity• encouragehealthyweights
Mul5pleschoolandcommunitybasedinterven5ons
KahnawakeisaKanien’kehá:ka (Mohawk)communityof 7,200people12milesfrom Montreal
(Macaulayetal.,Preven9veMedicine,1997)
1994
(n=322)1998
(n=259)2002
(n=291)
Age and sex-adjusted means (std err)
Physical activity frequency
(no. of 15-minute episodes in last 7 days)
22.53
(0.93)33.06 (1.02)
22.27
(0.96)
Television watching on school days*
2.62 (0.06)
2.78 (0.06)
2.67
(0.06)
Television and video watching on Saturdays* * Higher numbers means less TV
2.81 (0.04)
2.89
(0.04)
2.74
(0.04)
Physical Activity and Fitness
(Paradisetal.,Pediatrics,2005)
1994
(n=322)1998
(n=259)2002
(n=291)
Age and sex-adjusted means (std err)
Sugar consumption index (Soft drink, candy, sugar cereals)
2.22 (0.07)
1.60 (0.08)
1.29
(0.07)
Fat consumption index (hot dogs, fries, chips)
1.28 (0.05)
1.24 (0.05)
0.84
(0.05)
Fruit and vegetable consumption index (All F/V including juices)
2.91 (0.07)
2.03 (0.08)
1.87
(0.07)
Change in Diet
(Paradisetal.,Pediatrics,2005)
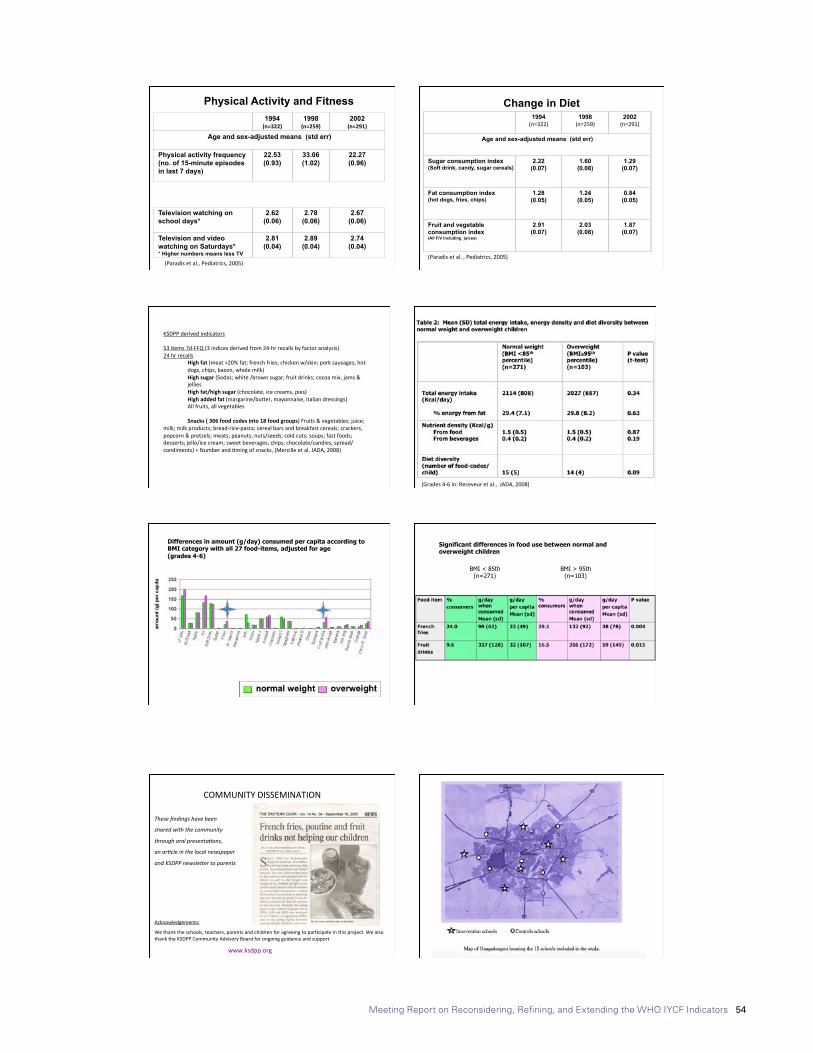
Meeting Report on Reconsidering, Refining, and Extending the WHO IYCF Indicators 54
8/29/17
3
KSDPPderivedindicators53items7d-FFQ(3indicesderivedfrom24-hrrecallsbyfactoranalysis)24hrrecalls
Highfat(meat>20%fat;frenchfries;chickenw/skin;porksausages;hotdogs,chips,bacon,wholemilk)Highsugar(Sodas;white/brownsugar;fruitdrinks;cocoamix,jams&jelliesHighfat/highsugar(chocolate,icecreams,pies)Highaddedfat(margarine/buXer,mayonnaise,italiandressings)Allfruits,allvegetables
Snacks(306foodcodesinto18foodgroups)Fruits&vegetables;juice;
milk;milkproducts;bread-rice-pasta;cerealbarsandbreakfastcereals;crackers,popcorn&pretzels;meats;peanuts;nuts/seeds;coldcuts;soups;fastfoods;desserts;jello/icecream;sweetbeverages;chips;chocolate/candies,spread/condiments)+Numberand9mingofsnacks,(Mercilleetal,JADA,2008)
(Grades4-6in:Receveuretal.,JADA,2008)
Differences in amount (g/day) consumed per capita according to BMI category with all 27 food-items, adjusted for age (grades 4-6)
Significant differences in food use between normal and overweight children
BMI < 85th (n=271)
BMI > 95th (n=103)
8/29/17
2
hXp://www.who.int/nutri9on/topics/nutri9on_friendly_schools_ini9a9ve/en/(accessedJune6,2017)
KahnawakeSchoolsDiabetesPreven5onProject(KSDPP)1994-present
Long-termgoal• PreventType2diabetesShort-termgoals
• improveea9nghabits(decreasefoodshighinfatandsugar,
andincreasehealthyfoods)• increasephysicalac9vity• encouragehealthyweights
Mul5pleschoolandcommunitybasedinterven5ons
KahnawakeisaKanien’kehá:ka (Mohawk)communityof 7,200people12milesfrom Montreal
(Macaulayetal.,Preven9veMedicine,1997)
1994
(n=322)1998
(n=259)2002
(n=291)
Age and sex-adjusted means (std err)
Physical activity frequency
(no. of 15-minute episodes in last 7 days)
22.53
(0.93)33.06 (1.02)
22.27
(0.96)
Television watching on school days*
2.62 (0.06)
2.78 (0.06)
2.67
(0.06)
Television and video watching on Saturdays* * Higher numbers means less TV
2.81 (0.04)
2.89
(0.04)
2.74
(0.04)
Physical Activity and Fitness
(Paradisetal.,Pediatrics,2005)
1994
(n=322)1998
(n=259)2002
(n=291)
Age and sex-adjusted means (std err)
Sugar consumption index (Soft drink, candy, sugar cereals)
2.22 (0.07)
1.60 (0.08)
1.29
(0.07)
Fat consumption index (hot dogs, fries, chips)
1.28 (0.05)
1.24 (0.05)
0.84
(0.05)
Fruit and vegetable consumption index (All F/V including juices)
2.91 (0.07)
2.03 (0.08)
1.87
(0.07)
Change in Diet
(Paradisetal.,Pediatrics,2005)
8/29/17
4
COMMUNITYDISSEMINATION
Thesefindingshavebeen
sharedwiththecommunity
throughoralpresenta8ons,
anar8cleinthelocalnewspaper
andKSDPPnewsle>ertoparents
Acknowledgements:
Wethanktheschools,teachers,parentsandchildrenforagreeingtopar9cipateinthisproject.WealsothanktheKSDPPCommunityAdvisoryBoardforongoingguidanceandsupport
www.ksdpp.org
(Dabonéetal.,Nutr.J,2011) Dabonéetal.,GlobalHealthPromo9on,2013

Meeting Report on Reconsidering, Refining, and Extending the WHO IYCF Indicators 55
8/29/17
4
COMMUNITYDISSEMINATION
Thesefindingshavebeen
sharedwiththecommunity
throughoralpresenta8ons,
anar8cleinthelocalnewspaper
andKSDPPnewsle>ertoparents
Acknowledgements:
Wethanktheschools,teachers,parentsandchildrenforagreeingtopar9cipateinthisproject.WealsothanktheKSDPPCommunityAdvisoryBoardforongoingguidanceandsupport
www.ksdpp.org
(Dabonéetal.,Nutr.J,2011) Dabonéetal.,GlobalHealthPromo9on,2013
8/29/17
5
QuoAdien«LePays»du8juillet2010
QuoAdien«Sidwaya»du29juillet2010
Twomainlessons
1-Meaningfullindicatorsofhealthyea8ngcanbecreatedfrom24-hrrecallsforchildren9-12yoa2-Collec8nganthropometryandfoodrelateddatacanbeamobilizingac8vityinprimaryschools
8/29/17
5
QuoAdien«LePays»du8juillet2010
QuoAdien«Sidwaya»du29juillet2010
Twomainlessons
1-Meaningfullindicatorsofhealthyea8ngcanbecreatedfrom24-hrrecallsforchildren9-12yoa2-Collec8nganthropometryandfoodrelateddatacanbeamobilizingac8vityinprimaryschools

Meeting Report on Reconsidering, Refining, and Extending the WHO IYCF Indicators 56
Presentation 3: Thoughts on indicators for adolescent nutrition11/27/17
1
Thoughts on indicators for adolescent nutrition
Technical Consultation to Reconsider, Refine, and Extend Child Feeding indicators
UNICEF, NYJune 21, 2017
Chessa K Lutter, PhDVisiting Research Professor
School of Public Health, University of Maryland
Adolescence – background
• Critical time for biological, psychosocial and intellectual growth – also of vulnerability and transition
• Time of dramatic physical changes – approximately 50% of adult weight and 20% of adult height gained
• Sometimes referred to as a “second window of opportunity” to foster healthy growth and prevention of or recuperation from undernutrition, overweight or obesity
Adolescence – background
• Defined as a person between 10 and 19 years of age
• Of the estimated 1.2 billion adolescents, 90% live in low or middle-income countries (LMICs) - more than half live in Asia
• Risk of pregnancy three times greater in LMICs
• Globally adolescents represent 16% of the world’s population - in sub-Saharan Africa they represent 23% of the population
Adolescence – background• Adolescents in LMICs have not escaped the effects of the
nutrition transition & exposure to obesogenic environments that include access to sugar-sweetened beverages (SSBs), fast foods, and food products high in salt, sugar and fat
• The nutritional and disease profiles are shifting from underweight and infectious diseases toward those characterized by overweight/obesity and chronic diseases
• However, in some Asian and African countries the prevalence of thinness (BMI < 18.5) is still high
• Micronutrient deficiencies, particularly iron deficiency are prevalent among all BMI categories
Adolescent anthropometry – female adolescents 15-19 years of age
• Since 2002, 67 DHS surveys in LMICs have been conducted and show very different epidemiologic profiles among countries
• The prevalence of thinness is greater in low-income countries (LICs) compared to middle-income countries (MICs) and most prevalent in countries in Africa and the South-East Asia
• The prevalence of overweight (BMI 25-29.9) and obesity (BMI >=30) is greater in MICs and most prevalent in Latin America and the Eastern Mediterranean
• In general, the higher the prevalence of thinness in a country the lower the prevalence of overweight/obesity
Countries with the highest prevalence of thinness or overweight/obesity among female adolescents 15 to
19 years of ageThinness Overweightandobesity
Country % Country %India 46.8 Egypt 52.3
Yemen 36.4 Turkey 29.5Ethiopia 36.1 Jordan 24.8Senegal 34.5 Swaziland 24.3
Timor-Leste 33.4 Nicaragua 22.9
Niger 30.5 Bolivia 22.8
Bangladesh 31.0 Peru 22.8
Madagascar 28.3 DominicanRep 22.0Cambodia 27.5 Honduras 21.0GambiaandMyanmar
27.0 Lesotho 18.3
Source: DHS data from 66 surveys conducted since 2002, courtesy of Monica Kothari.
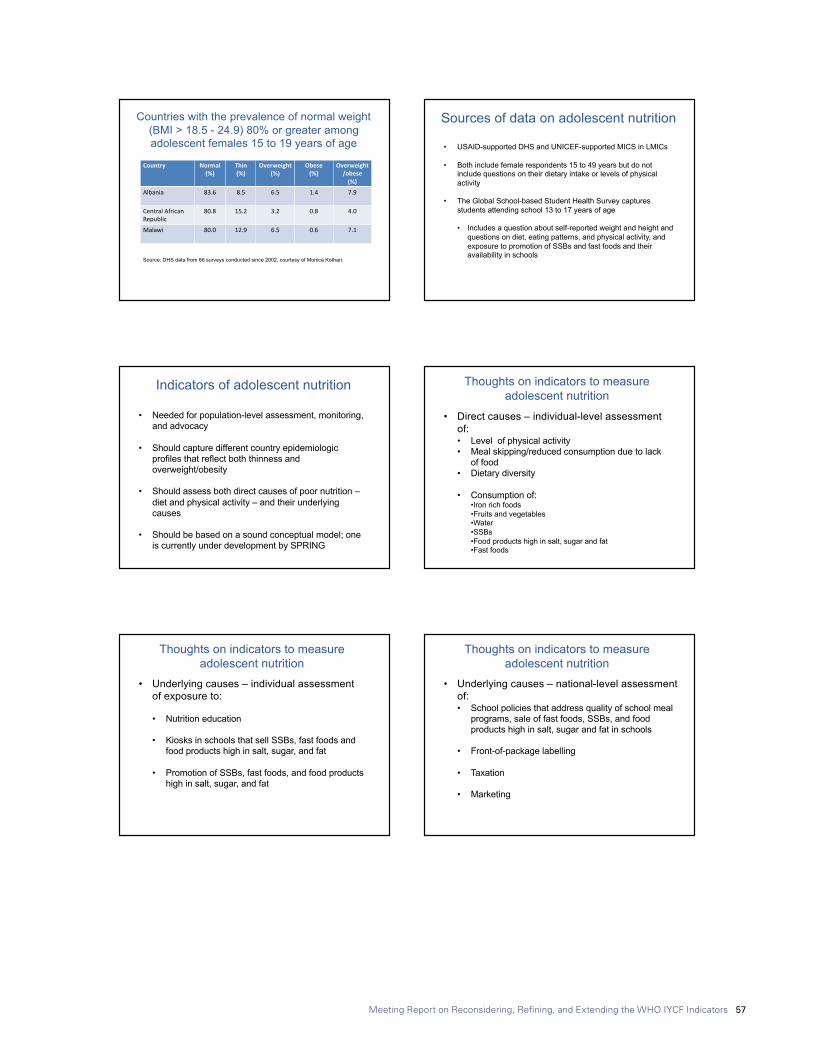
Meeting Report on Reconsidering, Refining, and Extending the WHO IYCF Indicators 57
11/27/17
2
Countries with the prevalence of normal weight (BMI > 18.5 - 24.9) 80% or greater among adolescent females 15 to 19 years of age
Source: DHS data from 66 surveys conducted since 2002, courtesy of Monica Kothari.
Country Normal(%)
Thin(%)
Overweight(%)
Obese(%)
Overweight/obese(%)
Albania 83.6 8.5 6.5 1.4 7.9
CentralAfricanRepublic
80.8 15.2 3.2 0.8 4.0
Malawi 80.0 12.9 6.5 0.6 7.1
Sources of data on adolescent nutrition
• USAID-supported DHS and UNICEF-supported MICS in LMICs
• Both include female respondents 15 to 49 years but do not include questions on their dietary intake or levels of physical activity
• The Global School-based Student Health Survey captures students attending school 13 to 17 years of age
• Includes a question about self-reported weight and height and questions on diet, eating patterns, and physical activity, and exposure to promotion of SSBs and fast foods and their availability in schools
Indicators of adolescent nutrition
• Needed for population-level assessment, monitoring, and advocacy
• Should capture different country epidemiologic profiles that reflect both thinness and overweight/obesity
• Should assess both direct causes of poor nutrition –diet and physical activity – and their underlying causes
• Should be based on a sound conceptual model; one is currently under development by SPRING
Thoughts on indicators to measure adolescent nutrition
• Direct causes – individual-level assessment of:• Level of physical activity• Meal skipping/reduced consumption due to lack
of food• Dietary diversity
• Consumption of:•Iron rich foods•Fruits and vegetables•Water•SSBs•Food products high in salt, sugar and fat•Fast foods
Thoughts on indicators to measure adolescent nutrition
• Underlying causes – individual assessment of exposure to:
• Nutrition education
• Kiosks in schools that sell SSBs, fast foods and food products high in salt, sugar, and fat
• Promotion of SSBs, fast foods, and food products high in salt, sugar, and fat
Thoughts on indicators to measure adolescent nutrition
• Underlying causes – national-level assessment of:• School policies that address quality of school meal
programs, sale of fast foods, SSBs, and food products high in salt, sugar and fat in schools
• Front-of-package labelling
• Taxation
• Marketing
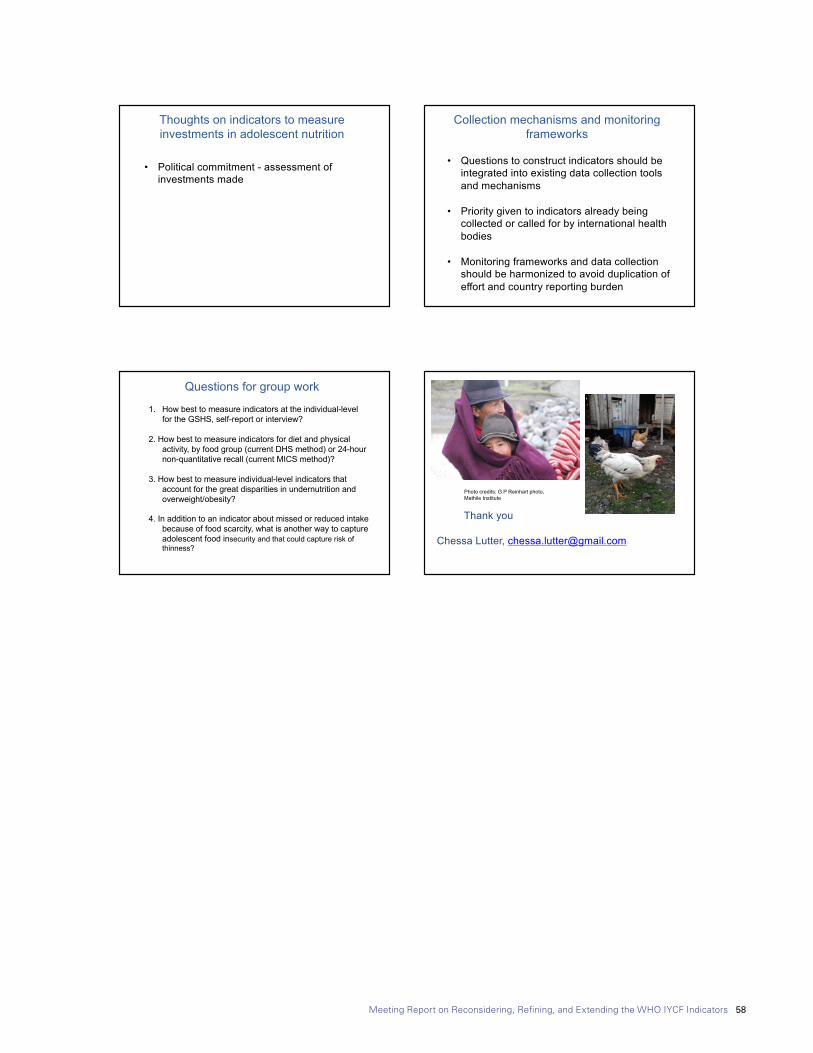
Meeting Report on Reconsidering, Refining, and Extending the WHO IYCF Indicators 58
11/27/17
3
Thoughts on indicators to measure investments in adolescent nutrition
• Political commitment - assessment of investments made
Collection mechanisms and monitoring frameworks
• Questions to construct indicators should be integrated into existing data collection tools and mechanisms
• Priority given to indicators already being collected or called for by international health bodies
• Monitoring frameworks and data collection should be harmonized to avoid duplication of effort and country reporting burden
Questions for group work
1. How best to measure indicators at the individual-level for the GSHS, self-report or interview?
2. How best to measure indicators for diet and physical activity, by food group (current DHS method) or 24-hour non-quantitative recall (current MICS method)?
3. How best to measure individual-level indicators that account for the great disparities in undernutrition and overweight/obesity?
4. In addition to an indicator about missed or reduced intake because of food scarcity, what is another way to capture adolescent food insecurity and that could capture risk of thinness?
Thank you
Chessa Lutter, [email protected]
Photo credits: G.P Reinhart photo, Mathile Institute
Meeting Report on Reconsidering, Refining, and Extending the WHO IYCF Indicators 59
Annex 5: Background notes
Background note 1: Rationale for developing indicators of healthy food habits for school-age children by Olivier Receveur, PhD, MPH, DtP
Rationale for developing indicators of healthy food habitsfor school-age children
byOlivier Receveur, PhD, MPH, DtP
(Professeur Honoraire, Université de Montréal, Canada)
1 Note: School-age is approximately defined as 6-18 years of age, a definition overlapping with WHO definition of “adolescents” which include youth 10-19 years.
In 2000, at the World Education Forum in Dakar, international agencies agreed on a common framework to Focus Resources on Effective School Health Nutrition and Hygiene (FRESH) to help ensure children enroll and stay in schools, to make schools healthier and where children learn to be healthy (SCC/SCN, 2002).
Children 6-12 years of age make up 11.9% of world population and youth 13-19 years old 11.3% for a total of 1.7 billion people (UN, 2015)1.
Ten years ago, adolescents were still considered a “neglected, difficult- to- measure, hard-to-reach” population (SCN, 2006); a reality that may persist in part for youth in age of attending secondary school but is not the case any longer for the younger as universal primary education is now within reach with 91% of children presently attending primary school (UNESCO, 2016). Increase secondary school attendance will likely follow although currently 17% of lower secondary school-age children are out of school. Furthermore, 37% are not attending the last 3 years of secondary school, with more urban boys of greater socioeconomic levels doing so compared to rural girls of lesser means (UNESCO, 2016).
Monitoring health and nutrition of all school-age children is now in position of taking advantage of near complete attendance for primary school, and growing attendance later on in secondary school, keeping in mind that school based monitoring for older children may not be representative of all youth.
Nutritional status of school-age childrenIn 2010, an extensive review of primary school-age children from 79 countries concluded, based on the often limited data available, that malnutrition is a public health issue in developing countries and countries in transition. Over five WHO regions, prevalence of thinness ranged from 6% (Latin America) to 36% (Africa), overweight including obesity from 7% (Africa) to 26% (Latin America), vitamin A deficiency from 7% (Eastern Mediterranean) to 32 % (Africa), iodine deficiency 14% (Latin America) to 43% (Western Pacific), zinc deficiency 11% (Eastern Mediterranean) to 54% (Africa), and anemia affected at least 24% of children in all regions (Best et al, 2010). Comparable data are lacking for secondary school-age children, but the immediate effects of undernutrition cannot be ignored as far as morbidity, school attendance and school performance are concerned; neither can the increase risk of complications of early pregnancies for most deficiency diseases and growth retardation. Furthermore, in adulthood, 70% of deaths from non-communicable diseases are linked to risk factors that start in adolescence. An action plan to combat obesity in children, while at the same time fighting undernutrition, has recently been submitted to the 70th World Health Assembly (WHO, 2017a). Attention to better eating and physical activity for school-age children is part of a global strategy to end malnutrition in all its forms (IFPRI, 2016), as is the need for more and better data to monitor progress towards healthy eating habits throughout the life cycle (Global Panel, 2015).
Data available at the school levelThe school settings provide highly relevant environments to combat the double burden of malnutrition and develop health behaviors that will have long lasting impact for the
Meeting Report on Reconsidering, Refining, and Extending the WHO IYCF Indicators 60
children, their parents and the communities at large, given the central societal roles these institutions perform. Data are now being systematically collected to document national strategic leadership and the implementation of school health policies, safe learning environments, skills-based health education, and health and nutrition services. These internationally comparable data, collected through document reviews, key informants interviews and focus groups, have been recently formalised through wide ranging collaborations in the FRESH Monitoring and Evaluation Guidance (FRESH, 2013), which provide checklists with valuable indicators of the development of supportive environments, policies, and programmes.
Data available at the individual levelFor school-age children and youth, health outcome data related to food habits and physical activity can be collected individually through household or school based surveys.
Household surveys generating internationally comparable data on food habits of school-age children are presently scarce. The DHS and MICS, the two main large household-based international health surveys using respondents 15 years of age and older, do not include data on school-age children food habits or physical activity levels. Individual surveys providing internationally comparable data include the Global School-based Student Health Survey (GSHS) for children 13-17 years of age; an in-class self-administered anonymous questionnaire with self-reported height and weight and frequency of consumption of selected foods and beverages. Results for 93 countries have been published (WHO, 2017b). For primary school age children, no internationally comparable data are available. Some countries such as the United States have a sophisticated survey system in place including height and weight measurements, extensive dietary records with 24-h recalls, and targeted food frequency questions for certain foods and beverages collected periodically in representative samples of the population. These data (NHANES) are collected through proxies for children aged 6-11y and self-reported for participants 12 years of age and older (CDC, 2017). On another hand, the European WHO region has put in place since 2007 a widespread school-based data collection effort (COSI), to measure height and weight in children 6-10 years of age; self-administer questionnaires with limited dietary behavior variables, such as the taking of a breakfast (WHO, 2016) and more detailed food frequency questions are left as an option to be filled at home by the student’s caregiver. However no worldwide data on common indicators of healthy food habits or physical activity are available for primary-school-aged children.
Indicators development While proceeding with FRESH checklists (FRESH, 2013) will provide most valuable data at the school-level, much work needs to be done to develop appropriate and practical indicators of healthy food habits and adequate physical activity at the individual level. At the World Health Assembly this May 2017, based on the need to curve the obesity epidemic, and taking into account that many countries have undernutrition to combat as well, it was proposed to collect height and weight data, and develop interventions based on nutrient-profiles and food-based guidance. Developing indicators that will allow dietary habits comparisons over time and place are therefore the object of current attention (WHO, 2017).
Among various indicator developments to be considered, developing Minimum Dietary Diversity and Minimum Meal Frequency scores as obtained for young children (WHO, 2008) may be of particular interest to add individual data to the current school-level checklists. These individual data would be obtained in schools with an in-person questionnaire consisting of a short dietary open-list and a few physical activity questions to 5th or 6th graders in primary schools (time where the child is cognitively able to complete the interview), and similarly in one or two grades in secondary schools; height and weight would be measured. Logistically, selecting students in one or two grades rather than all students would be more manageable; linking school and individual levels data collection efforts and associating them ideally with health promotion activities within the schools around the time of data collection could also be considered.
Another option, not necessarily mutually exclusive with the previous, could involve collecting the same anthropometric and questionnaire data by adding modules to the DHS or MICS, to aim specifically at 15-19 years respondents. Taking advantage of the recent inclusion to the MICS of a 20 minutes in-person interview on foundational learning skills for 7-14 years old children could present an opportunity (MICS, 2017); whether those school-age children will be readily accessible within the household remains however to be confirmed since they may be at school rather than at home and thereby biasing the final samples.
Other options can certainly be considered to meet the many logistical constraints of obtaining meaningful data with school-age children, now that most children are accessible through the schools systems and that recent developments have been fruitful in articulating what healthy eating habits may be, in spite of the wide variations in practices around the globe and the difficulties of obtaining reliable and detailed enough dietary data.

Meeting Report on Reconsidering, Refining, and Extending the WHO IYCF Indicators 61
Bibliography
Best et al, 2010. The nutritional status of school-aged children: Why should we care. Food and Nutrition Bulletin, vol.31, no3, p. 400-417. The United Nations University.
CDC, 2017. NHANES questionnaires, datasets and related documentation . https://wwwn.cdc.gov/nchs/nhanes/ (accessed May 25, 2017)
FRESH, 2013. Monitoring and Evaluation Guidance for School Health Programs. www.unesco.org/new/health-education (accessed May 24, 2017)
Global Panel, 2015. Improved metrics and data are needed for effective food system policies in the post-2015 era. Technical Brief, UK: Global Panel on Agriculture and Food Systems for Nutrition
IFPRI, 2016. Global Nutrition Report. From Promise to Impact: Ending Malnutrition by 2030. Washington. DC, USA.
MICS, 2017. Questionnaire for Children age 5-17 (26 May 2017). http://mics.unicef.org/tools?round=mics6 (Accessed May 27, 2017)
SCC/SCN, 2002. School-Age Children: Their Health and Nutrition, Number 25 (http://www.unsytem.org/scn)
SCC/SCN. 2006. Adolescence: A Pivotal Stage in the Life Cycle. Number 31(http://www.unsytem.org/scn)
UN, 2015. United Nations, Department of Economic and Social Affairs, Population Division. World Population Prospects. The 2015 Revision, Custom Data acquired via Websites.
UNESCO, 2016. Leaving no one behind: How far on the way to universal primary and secondary education. Policy Paper 27/Fact Sheet 37.
WHO, 2008. Indicators for assessing infant and young child feeding practices. Part 1 Definitions. Conclusions of a concensus meeting held 6-8 November 2007 in Washington, DC, USA.
WHO, 2016. Childhood Obesity Surveillance Initiative (COSI). Data collection procedures. www.euro.who.int/__data/assets/pdf_file/0006/333906/COSI-procedures-en.pdf (accessed May 27, 2017)
WHO, 2017a. Report of the Commission on Ending Childhood Obesity: implementation plan. Report by the secretariat. A70/31. www.who.int/end-childhood-obesity/news/draft-implementation/en/ (accessed May 25, 2017)
WHO, 2017b. Global School-Based Student Health Survey (GSHS). http://www.who.int/chp/gshs/methodology/en/ (accessed May 23, 2017)
(5/31/17)

Meeting Report on Reconsidering, Refining, and Extending the WHO IYCF Indicators 62
Commentary on developing indicators for adolescent nutrition Prepared for the Technical Consultation to Reconsider, Refine, and
Extend Child Feeding Indicators
UNICEF, New York, June 20-22, 2017
Chessa K Lutter, PhDUniversity of Maryland School of Public Health
1 Data from one country were excluded because of a small sample.
Background
Adolescence is a critical time for nurturing biological, psychosocial, and intellectual growth. It is also a time of dramatic physical changes where approximately 50% of adult body weight and 20% of adult height are gained [1]. Sometimes referred to as a “second window of opportunity”, the adolescent period provides an opening to improve life-long nutrition and health behaviors and outcomes. Yet, it is also a period of vulnerability and transition, where adolescents experience increasing autonomy and independence from their families and are influenced by the broader community and global environment. Policies, programs and interventions to influence adolescent diet, eating patterns, and levels of physical activity to support good nutrition and health behaviors have the potential to contribute to healthy growth and the prevention of or recuperation from undernutrition, overweight or obesity.
The World Health Organization (WHO) defines adolescents persons between 10 and 19 years of age [2]. For females, these years may include the beginning of puberty and one or more pregnancies. Of the estimated 1.2 billion adolescents, 90% live in low-and middle-income countries (LMIC) and half live in Asia. In LMICs, an adolescent girl’s risk of pregnancy is three times greater than in a high-income country (HIC) [3]. Globally adolescents make up 16% of the world’s population; however, in sub-Saharan Africa they represent nearly one-quarter of the population.
Adolescents in LMICs have not escaped the effects of the nutrition transition, which is occurring on a global level [4]. Obesogenic environments are increasingly common, where sugar-sweetened beverages (SSBs) and food products high in salt, sugar and fat are widely promoted, available, and accessible, and levels of physical activity (both occupational and recreational) are low. As children become adolescents, their
physical activity levels decrease between approximately 1% and up to 20% per year [5]. Increased globalization and urbanization shifts the nutritional and disease profiles from those characterized by undernutrition and infectious disease towards those characterized by overweight and obesity and chronic diseases associated with excess body weight [6]. At the same time, many adolescents enter this time in their lives suffering from undernutrition. Micronutrient deficiencies, particularly iron deficiency, are prevalent among normal weight, overweight and obese adolescents as well [7].
Thinness, overweight and obesity among adolescents
Globally far more persons are overweight or obese than underweight [8]. With respect to adolescent females 15 to 19 years of age, very different epidemiologic profiles exist among countries. Sixty-seven countries have had a DHS survey since 2002 all of which were in LMICs.1 Of these 37 were in the African Region, 9 were in the Americas Region, 5 were in the South-East Asia Region, 5 were in the Eastern Mediterranean Region, 1 was in the Western Pacific Region, and 9 were in the European Region. In some countries, primarily in Africa and Southeast Asia, the prevalence of thinness (BMI < 18.5) far exceeds the prevalence of overweight and obesity, whereas in other countries, primarily in Latin America and the Eastern Mediterranean, the prevalence of overweight (BMI >= 25.0 - 29.9) and obesity (BMI >= 30) is greater than the prevalence of thinness. In general, the higher the prevalence of thinness in a country, the lower the prevalence of overweight and obesity. Low-income countries (LICs) have more thinness than middle-income countries (MICs) whereas MICs have more overweight and obesity than LICs.
The prevalence of thinness is highest in India (46.8%) and lowest in Egypt (0.6%). Eight countries have a prevalence of thinness greater than 30% (Bangladesh, Ethiopia, Eritrea,
Background note 2: Commentary on developing indicators for adolescent nutrition
Meeting Report on Reconsidering, Refining, and Extending the WHO IYCF Indicators 63
India, Niger, Senegal, Timor-Leste, and Yemen). Another 18 countries, primarily in Africa, have a prevalence of thinness between 20% and 30%. The prevalence of overweight is highest in Egypt (37.4%) and lowest in Madagascar (0.9%). Fifteen countries have a prevalence of overweight and obesity greater than 15% (Bolivia, Cameroon, Colombia, Dominican Republic, Egypt, Gabon, Guatemala, Guyana, Honduras, Jordan, Lesotho, Nicaragua, Peru, Swaziland, and Turkey). Six countries have a prevalence of obesity greater than 5% (Dominican Republic, Egypt, Guyana, Honduras, Jordan, and Swaziland). Of these, none have a prevalence greater than 7% except Egypt where 17.6% of adolescent girls 15 to 19 years of age are obese.
Sources of data
Nationally representative household surveys that include adolescents from 10 to 19 years old generate internationally comparable data on anthropometry, dietary intake and eating practices are virtually nonexistent. The United States and Mexico are two exceptions where periodic nationally representative surveys provide information on nutritional status, diet and eating practices and permit analysis of trends. In Mexico, data from these surveys has been used to successfully advocate for public policies to improve nutrition. More and better data are needed to adequately describe and monitor adolescent nutrition, with respect to anthropometry, dietary intake and eating practices, their determinants, and policies for the prevention of undernutrition, and overweight and obesity.
The USAID-supported Demographic and Health Surveys (DHS) and UNICEF-supported Multiple Indicator Cluster Surveys (MICS) include female respondents 15 to 49 years of age and older and so capture the latter half of the adolescent period. However, they do not include questions on dietary intake or levels of physical activity. Both surveys also include Men’s Questionnaire targeting men 15 to 49 (or up to 59) years of age, thus also capturing the latter half of the adolescent period for males. The MICS has now also added a questionnaire for children aged 5-17 years but nutrition is not included.
Another source of data for adolescents is The Global School-based Student Health Surveys (GSHS), which is used to gather information on adolescents 13 to 17 years of age attending school. Its 2013 Core-expanded Questions include self-reported categorical questions on weight (very underweight, slightly underweight, about the right weight, slightly overweight, and very overweight) and about dietary behaviors such as meal skipping and exercise. It includes questions about the consumption of milk, salty foods, foods high in fat, fruit juices, and SSBs and fast food [9]. It also has a section on the role of media and advertising, including exposure to advertisements for SSBs and fast foods and their availability in schools. A section on knowledge, attitudes, skills and sources of information asks questions about exposure to nutrition
2 A conceptual model for the direct and underlying determinants of adolescent nutrition is currently being developed by a Technical Advisory Group appointed and coordinated by the SPRING Project.
education regarding the benefits of healthy eating and eating more fruits and vegetables. The survey has been administered in 94 countries and the questionnaire available in English and Spanish.
Nutrition indicators for adolescents
Indicators for adolescent nutrition are needed for population-level assessment, monitoring, and advocacy as adolescent nutrition has not been, but should become a priority for investment and action. They need to capture the different country epidemiologic profiles that reflect both thinness and overweight/obesity. They need to assess not only the immediate causes of poor adolescent nutrition – diet, eating practices and physical activity -- but importantly their underlying determinants to stimulate policies, programs and interventions. Importantly, their development should be based on a sound conceptual model.2 Indicators to measure the direct causes of low body mass index, overweight and obesity and iron deficiency could include the individual-level assessment of physical activity, dietary diversity, and meal skipping/reduced consumption because of food insecurity. It could also include questions about consumption of: · Iron-rich foods· Fruits and vegetables· Water· SSBs· Food products high in salt, sugar, and/or fat (junk foods)· Fast foods
Indicators to measure some underlying causes of overweight and obesity could include individual-level assessment of exposure to: · Nutrition education or messages about how to make healthy
food and beverage choices and avoid bad ones· Kiosks or vending machines in schools that sell SSBs and
food products high in salt, sugar, and fat· Promotion of SSBs, fast foods, and food products high in salt,
sugar, and fat
Indicators to measure policies, programs and interventions could include national-level assessment of policies, laws, funding programs and/or regulations related to: · School nutrition, addressing the quality of school meal
programs, time and space for physical activity, and sale of fast foods, SSBs and food products high in salt, sugar and fat in schools
· Front-of-package labeling to identify beverages and food products high in salt, sugar, and fat, which uses an evidence-informed model that demonstrates consumer understanding of the model
· Taxation of SSBs and food products high in salt, sugar and fat · Marketing of SSBs and food products high in salt, sugar
and fat

Meeting Report on Reconsidering, Refining, and Extending the WHO IYCF Indicators 64
An indicator to assess political commitment to adolescent nutrition could include assessment of investments made.
To the extent possible, questions to construct adolescent nutrition indicators should be integrated into already existing data collection tools and mechanism, such as the DHS, MICS, and GSHS. Consideration should also be given to indicators already being used or called for by international health bodies. For example, national-level indicators to prevent child and adolescent obesity are articulated in the Plan of Action for the Prevention Child and Adolescent Obesity approved by the Directing Council of the Pan American Health Organization (PAHO) in 2014 [10]. Indicators to assess implementation of the WHO Report of the Commission on Ending Childhood Obesity: implementation Plan, endorsed by the World Health in May 2017 [11], have not yet been developed. However, the Plan recommends many of the actions included in PAHO’s Plan of Action and therefore, may use similar indicators. To the extent possible, monitoring frameworks and data collection should be harmonized to avoid duplication of efforts and burden to countries with respect to reporting.
Questions for group work
1. How best to measure indicators at the individual-level for the GSHS, self-report or interview?
2. How best to measure indicators for diet and physical activity, by food group (current DHS method) or 24-hour non-quantitative recall (current MICS method)?
3. How best to measure individual-level indicators that account for the great disparities in undernutrition and overweight/obesity?
4. In addition to an indicator for missed or reduced intake because of food scarcity, what is another way to capture adolescent food insecurity and that could capture risk of thinness?
Acknowledgements
Dr Monica Kothari generously provided a table on the anthropometry of adolescent females 15 to 19 years of age from DHS surveys from which the descriptive data were derived.
References
1. World Health Organization, Physical status: the use and interpretation of anthropometry. Report of a WHO Expert Committee, in WHO Technical Report Series 854. 1995. World Health Organization: Geneva.
2. World Health Organization. http://www.who.int/topics/adolescent_health/en/. Accessed June 4, 2017.
3. Black, R.E., et al., Maternal and child undernutrition and overweight in low-income and middle-income countries. The Lancet, June 6, 2013. Http://dx.doi.org/10.1016/S01140-6736(13)60937-X.
4. Popkin, B.M., Global nutrition dynamics: the world is shifting rapidly toward a diet linked with noncommunicable diseases. Am J Clin Nutr, 2006. 84 (2): p. 289-298.
5. McMurray, R.G. and et al, Influence of physical activity on change in weight status as children become adolescents. International Journal of Pediatric Obesity, 2008. 3: p. 69-77.
6. Monteiro, C.A., W.L. Conde, and B.M. Popkin, The burden of disease from undernutrition and overnutrition in countries undergoing rapid nutrition transition: a view from Brazil. Am J Public Health, 2004. 94 (3): p. 433-434.
7. IFC International, Nutritional Status of Women and Children: A 2014 update on nutritional status by sociodemographic and water, sanitation, and hygiene (WASH) indicators collected in Demographic and Health Surveys. December 2014. Rockville, Maryland. https://dhsprogram.com/pubs/pdf/NUT6/NUT6.pdf. Accessed June 13, 2017.
8. NCD Risk Factor Collaboration (NCD-RisC), Worldwide trends in diabetes since 1980: a pooled analysis of 751 population-based studies with 4.4 million participants. The Lancet, 2016 Apr. 9(10027):387: p. 1513-30. doi: 10.1016/S0140-6736(16)00618-8. Epub 2016 Apr 6.
9. World Health Organization. Global School-based Student Health Survey (GSHS) 2013 Core-expanded Questions. 2013. http://www.who.int/chp/gshs/GSHS_Core_Expanded_Questions_2013_English.pdf?ua=1. Accessed June 14, 2017.
10. Pan American Health Organization. Plan of Action for the Prevention of Obesity in Children and Adolescents CD53/9. October 2014. Pan American Health Organization: Washington DC. http://www.paho.org/hq/index.php?option=com_ content&view=article&id=1471&Itemid= 40013&lang=en. Accessed June 12, 2017.
11. World Health Organization, WHO Report of the Commission on Ending Childhood Obesity: implementation plan. 2017. World Health Organization: Geneva. http://apps.who.int/gb/ebwha/pdf_files/WHA70/A70_31-en.pdf?ua=1. Accessed June 12, 2017.