Embed Size (px)
Citation preview

Engineering a Greener SchoolInterface 2015 – Jan Weaver – [email protected]
Environmental problems are engineering problems. Learn how to use age appropriate engineering problem-solving approaches to help your students design ways to make your schoolyard wildlife friendly (K-2), and your school more energy-wise (3-5), more water-wise (6-8) or less polluting (9-12). Connections to reading, writing, speaking and listening skills included. Subjects: Math, Science, Engineering, Literacy
The Engineering Process
Engineering is the use of scientific, economic, social and practical principles and knowledge to solve a problem. A process is a list of steps needed to produce a particular outcome. So the engineering process uses scientific, economic, social and practical principles and knowledge to figure out the steps needed to solve a problem.
The main difference between science and engineering is the goal. In science the main goal is to find out something new about the universe (including the earth, humans, society, etc.). In engineering the goal is to solve a specific problem. Other than the goal, there is a lot of overlap in the two disciplines, both in the way they are done and in their interdependence. Science depends on engineering to create new tools so scientists can make new discoveries, and engineering depends on science to make new discoveries so engineers can create new tools.
Greener Schools
All schools, even if by accident, engage in practices that are green. These include things like providing a safe and healthy environment for students and staff, providing outdoor activity time for all students, recycling paper or containers, or finding ways to reduce energy costs. All schools also have the potential to take additional steps to become greener.
Ways that schools can be greener -- http://www2.ed.gov/programs/green-ribbon-schools/index.html
Areas of Green
Easy (probably already doing it) Moderately Challenging Challenging
Footprint – Drinking water meets local, state and federal standards– Program to monitor and control lead in drinking water– Recycling is in place– Hazardous Materials are eliminated or reduced, any existing materials covered by a management policy– Anti-idling policy in place, posted and enforced
– Reduce energy use and greenhouse gases– Reduce water use (gal/sq ft/year)– Convert to a water efficient landscape– Implement green cleaning practices and use green cleaning products– Students use alternative transportation to get to school– Safe and Walkable Routes to school
– Energy Star Certification and Facility Energy Matrix– Alternative energy– Green new construction– Procurement policies for furniture, other supplies and equipment, recycled and/or chlorine free paper, electronics, and/or sustainably or locally produced food
Health – ASHRE standard or local code for ventilation systems is met– Chemical management policy in place (purchasing policy, inventory, tracking and monitoring and safe disposal– School has 150 minutes of outdoor or PE time per week for each student
– Moisture control program in place– USDA Healthier U.S. School program in place- Sunwise program in place– Policies to monitor and control Radon, CO, Mercury and Tobacco Smoke–Asthma management program in place–Integrated Pest Management (IPM) plan in place
– Ventilation systems for exhausting contaminants from laboratory or shop exercises– Removing CCA treated wood from the facility– Indoor Air Quality Tools
Education – There is environmental education (integrated across subjects) in at least some grades– Students in at least some grades have a meaningful outdoor experience– Students score proficient or better on science assessments– School is partnering with local academic, businesses, organizations and agencies and/or other schools to help advance their own or another school’s progress in becoming green
– There is environmental education (integrated across subjects) in all grades– Students in all grades have a meaningful outdoor experience– Environmental and Sustainability Professional Development for teachers– There are student initiated Community projects– Outdoor classroom that is used
– Students take environmental science or environmental assessments and do well
– Number of students enrolled in AP Environmental Science who score 3 or better– An environmental literacy or sustainability literacy graduation requirement –– Scores on civics assessments
Interface 2015 – Engineering a Greener School – http://www.missourigreenschools.org/investigations.html

A Process for Engineering a Greener School
Main Step1. Identify Problem what is the issue? what specific part is the
problemidentify any constraints or criteria for the solution
2. Come Up With Solutions
gather facts and theories from what you know, what you look up, what you measure – be sure to measure the thing you want to change!
create a conceptual model of the steps leading to the problem, figure out what other information you need
gather more information, revise model, if necessary, reformulate problem making it bigger or smaller
use the model to generate possible solutions (steps where interventions would change the outcome)
3. Choose a Solution (or Solutions)
estimate tradeoffs between effectiveness, achievability, cost, fairness and sustainability
do more research if needed on tradeoffs
4. Plan Carrying Out the Solution
who will be responsible what will it cost and where will the money come from
how will it be done – location, tools, procedures
when will it happen, how often will it have to be repeated
5. Carry Out the Plan present the plan get support carry it out6. Measure Results measure the thing you
wanted to change to see if it changed
evaluate the effectiveness of your solution – if effective, see if you can do it more cheaply, if not, see step 1.
Glossary of Problem Solving Terms
aestheticsthe creation and appreciation of beauty; in designing solutions, considering the appeal of the product, process or system to those who will use it, carry it out or have to sustain it
alternate solutiona solution different from the one everyone thinks of first, multiple alternate solutions should be developed and compared to find the most effective, achievable, cheap, fair and sustainable solution
brainstorm an individual or group creative exercise involving free association between words or ideas
conceptual model a model made up of concepts (abstract generalizations) that can be mental or an image
constraint a physical, social or financial limit to what can be achieved
engineering the use of scientific, economic, social and practical principles and knowledge to solve a problemenvironmental impact
how new products, processes or systems will affect the environment (public health, other species, biogeochemical cycles and processes)
ethics concepts of right and wrong conduct; e.g. fair distribution of the costs and benefits of a proposed project
feasibility the potential of a proposed project to be successful
interdependentwhen the outcome of one event is dependent on other conditions or events; in some cases the other conditions or events may not be controllable and/or the interdependent relationship is unknown
iteration repeating a process to achieve a goal using the results of one run through as the starting point of the next run through
modela simplified representation of a thing, process or system used to make predictions about it; a model may be physical, mathematical or conceptual
process the steps needed to create (or recreate) a particular outcome given particular starting conditions
reliability the ability of a product, process or system to repeat its performance under the same conditions with minimal variation
reverse engineering extracting knowledge or design information from an existing product, process or system and using it to create something similar
riskthe potential of losing something of value – money, time, life, health, sense of identity, the respect of others, a feeling of security, etc.
social impact how new products, processes or systems will affect individuals and groups
sustainabilitythe ability of a process or system to continue indefinitely within its larger system; e.g. grocery stores within the U.S. economy, pollination within an ecological community, classroom learning within a school
synectics*
a creative technique using analogy and metaphor to place oneself directly in the problem or issue one is trying to address to ensure that even apparently trivial aspects are considered: e.g. putting yourself in someone else’s shoes; imagining the path in which water, energy or a commodity would flow
system a set of interacting or interdependent components forming an integrated whole
tame problema problem where all the possible outcomes can be mapped, interdependence is minimal, requirements are fixed and the need or wants of relevant parties don’t matter; e.g. chess, math problems, puzzles, some engineering problems
trade offa situation that involves losing one quality or aspect of something in return for another quality or aspect, if one thing goes up, the other must go down
trigger word a creative technique using a word or phrase to bring to mind other words or phraseswicked or messy problem
a problem that resists resolution because of incomplete information, complex interdependencies, changing requirements and/or the conflicting needs and wants of relevant parties; e.g. environmental problems, social problems
Interface 2015 – Engineering a Greener School – http://www.missourigreenschools.org/investigations.html

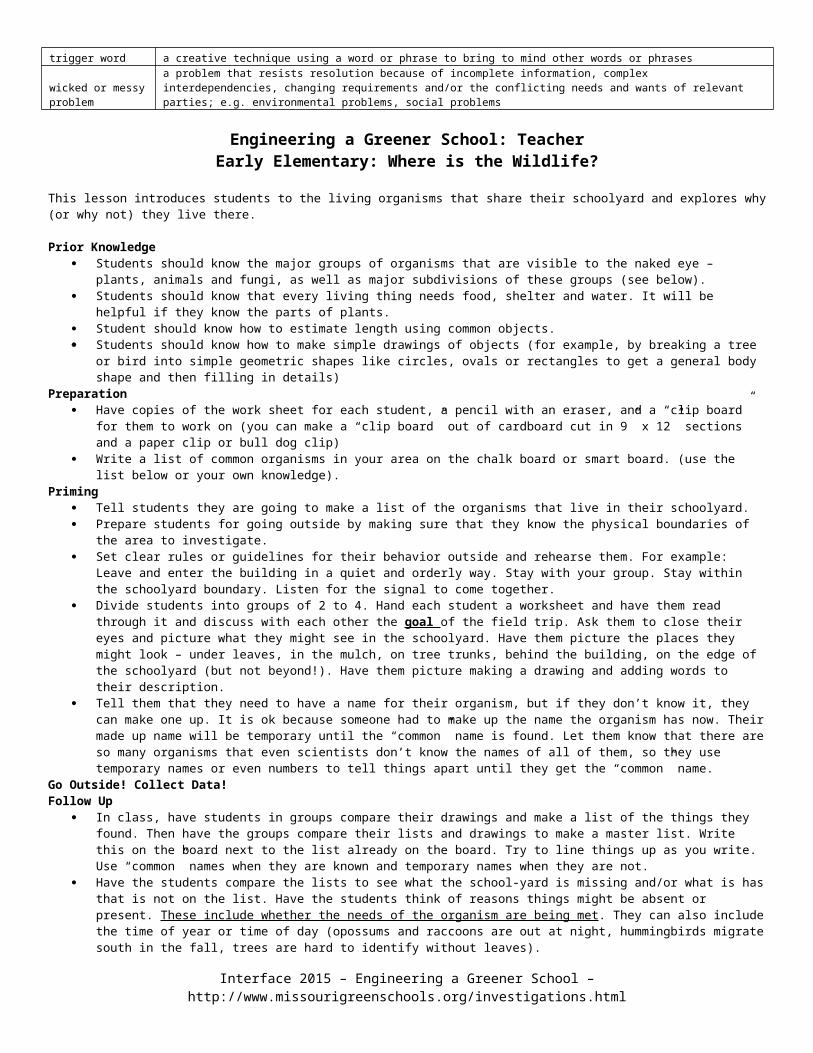
Engineering a Greener School: TeacherEarly Elementary: Where is the Wildlife?
This lesson introduces students to the living organisms that share their schoolyard and explores why (or why not) they live there.
Prior Knowledge Students should know the major groups of organisms that are visible to the naked eye – plants, animals and fungi, as well as
major subdivisions of these groups (see below). Students should know that every living thing needs food, shelter and water. It will be helpful if they know the parts of plants. Student should know how to estimate length using common objects. Students should know how to make simple drawings of objects (for example, by breaking a tree or bird into simple geometric
shapes like circles, ovals or rectangles to get a general body shape and then filling in details) Preparation
Have copies of the work sheet for each student, a pencil with an eraser, and a “clip board” for them to work on (you can make a “clip board” out of cardboard cut in 9” x 12” sections and a paper clip or bull dog clip)
Write a list of common organisms in your area on the chalk board or smart board. (use the list below or your own knowledge).Priming
Tell students they are going to make a list of the organisms that live in their schoolyard. Prepare students for going outside by making sure that they know the physical boundaries of the area to investigate. Set clear rules or guidelines for their behavior outside and rehearse them. For example: Leave and enter the building in a quiet
and orderly way. Stay with your group. Stay within the schoolyard boundary. Listen for the signal to come together. Divide students into groups of 2 to 4. Hand each student a worksheet and have them read through it and discuss with each
other the goal of the field trip. Ask them to close their eyes and picture what they might see in the schoolyard. Have them picture the places they might look – under leaves, in the mulch, on tree trunks, behind the building, on the edge of the schoolyard (but not beyond!). Have them picture making a drawing and adding words to their description.
Tell them that they need to have a name for their organism, but if they don’t know it, they can make one up. It is ok because someone had to make up the name the organism has now. Their made up name will be temporary until the “common” name is found. Let them know that there are so many organisms that even scientists don’t know the names of all of them, so they use temporary names or even numbers to tell things apart until they get the “common” name.
Go Outside! Collect Data! Follow Up
In class, have students in groups compare their drawings and make a list of the things they found. Then have the groups compare their lists and drawings to make a master list. Write this on the board next to the list already on the board. Try to line things up as you write. Use “common” names when they are known and temporary names when they are not.
Have the students compare the lists to see what the school-yard is missing and/or what is has that is not on the list. Have the students think of reasons things might be absent or present. These include whether the needs of the organism are being met. They can also include the time of year or time of day (opossums and raccoons are out at night, hummingbirds migrate south in the fall, trees are hard to identify without leaves).
Ask the students if there are any plants, animals or fungi students would like to see in their schoolyard that aren’t there? If they suggest some things, discuss why those things don’t live in the schoolyard.
Assessments Have each student write a short report about an organism they found that includes a picture, where they found it, what they
think it needs (food, water, shelter), and how many they found. Depending on their skill, they could do additional research at the library to add to their report.
Extension Students could make a list of organisms that might be able to live in the schoolyard but don’t, and research what could be
done to make a place for the organisms to live in the school yard.
Common kinds of plants, animals and fungi that might be in a Missouri school’s grounds. Plants – major subdivisions – specific examples
Trees – oak, maple Bradford pear, cedar, elm, tulip tree, redbud, birch, dogwoodShrubs or bushes – boxwood, azalea, Forsythia, barberry, rose of Sharon, juniper, yew, arborvitaeGrasses – tall fescue, fine fescue, Kentucky bluegrassFlowers – daylilies, chrysanthemums, coneflowers, phlox, yarrow, daisies, asters, bee’s balm
Animals – major subdivisions – specific examplesInsects & Spiders – butterflies, bees, wasps, caterpillars, ants, beetles, flies, web spiders, wandering spiders, jumping spidersReptiles & Amphibians – turtles, lizards, snakes, salamandersBirds – cardinals, robins, starlings, sparrows, pigeons, woodpeckers, finches, chimney swift, hummingbirdsMammals– squirrels, rabbits, opossums, raccoons, armadillos
Fungi – major subdivisions Mushroom – a fungus with a stem and a capShelf Mushroom – grows out of a tree or a log like a shelfLichen – small, patchy, flattish growth on dead wood or stone (fungal/algal symbiont)
RESOURCESMissouri Department of Conservation Field Guide - http://mdc.mo.gov/discover-nature/field-guide Missouri Botanical Garden Plant Finder - http://www.missouribotanicalgarden.org/plantfinder/plantfindersearch.aspx
Where is the Wildlife?Interface 2015 – Engineering a Greener School – http://www.missourigreenschools.org/investigations.html
Almost every place on earth has something living there. That includes your schoolyard! Your goal is to find out what lives on your schoolyard. _________________________________________________________________
Draw a picture of something living in your schoolyard. Draw one thing in each box.Write words to describe its color, size, shape or the sound it makes. Estimate its length using your pencil, clipboard, yourself or playground equipment. Count how many you see.See if you can figure out where it gets food, water and shelter.Write its name. If you don’t know the name, give it a descriptive name
After you have finished, compare your descriptions with everyone else.Make a list of everything the class saw.
Interface 2015 – Engineering a Greener School – http://www.missourigreenschools.org/investigations.html
Engineering a Greener School: TeacherUpper Elementary: Where Does the Energy Go!
This lesson explores how energy is used at your school and has students estimate how much is used.
Prior Knowledge Students should have a basic understanding of electricity, how it flows in wires to lights and appliances to where it is used. Students should know how to calculate how much energy each appliance or light uses per hour, either from reading the label
for the watts, or for volts and amperes (volts x amperes = watts), or from knowing how much energy an appliance of that type typically draws. If the appliance just lists amps, multiply it by 120 volts, which is the typical voltage of household circuits.
Students should know how to calculate kilowatt hours (kWh = [watt x hour]/1000). Students should know how to multiply kWh by the price of a kWh in your energy market. You can get the information from the
school’s energy bill, but if that is not available, use 11 cents/kWh, the average for Missouri.Preparation
Decide if your classroom is the best place for this exercise. It might be better to do it in someone else’s classroom. Decide if your students will do the data collection individually or in small groups given space constraints. If in groups, each
student should still do all calculations and assessments on their own. Well before the students do this exercise, do it yourself to identify any lights, appliances or technology that would be too
difficult for your students to check the label on. For example, the wattage of ceiling lights, of a smart board or other pieces of valuable, heavy equipment or things attached to the wall. Make a label to put on the item with the volts and amps or the watts so that students can experience data collection even if you made it a lot easier.
If at all possible, bring in a few small appliances that students could evaluate directly. For example, lamps, small fans, a radio, or a clock.
Have copies of the work sheet for each student or group, a pencil with an eraser, and a “clip board” for them to work on (you can make a “clip board” out of cardboard cut in 9” x 12” sections and a paper clip or bull dog clip).
Prepare an image of a typical energy use label on an appliance for them to see so they know what to look for. (see one here - http://energy.gov/energysaver/articles/estimating-appliance-and-home-electronic-energy-use).
Be prepared to help them figure out how many hours an item might be used, but aim to guide rather than tell them. Priming
Tell your students they are going to see how much energy the class uses every day and on what it is used Show students an example of a label and where they can find the information they need. Let them know that not all labels
carry all the information, but that it can be calculated from the other information. If the label is missing, an approximate value can be found on-line.
Walk them through collecting the data and then making the calculations using your label as an example. Go over how to conduct themselves over each part of the exercise – quiet, orderly, focused on data collection.
Go Collect Data!Follow Up
Have students compare their data sheets with each other or with other groups to see what values they got. There may be discrepancies due to the number of hours each person or group thought an item was used. That is ok. Ask them to discuss these differences with others and see if they can’t reach a consensus. If they can’t that is ok. Avoid telling them an answer.
Have them multiply the kWh by the cost of energy (11 cents is average in Missouri). Put the range of totals on the board. Then ask them to multiply the high and low values by each classroom in the building. Then ask them to multiply by 180 days. This is the range for electricity use in classrooms in your school for a year.
Ask what they think about the cost and what other things the money could be used for. Ask for ideas to reduce energy use that would not interfere with their learning.
Assessments Have students write a short report that briefly describes the question they were asking, how they answered it and the answer
they found. The report should include a table with their results. Finally, they should recommend one way to reduce energy use. Extensions
Help students figure out what their school’s energy sources are. Use the school’s bill or visit http://www.eia.gov/state/?sid=mo Have students do an energy audit of their room at home.
Appliances and their Watts per hour – these will vary with size, settings (lo vs. high, soft vs. loud, slow vs. fast) but give a reasonable range of values to work with.
Appliance Watts per hourclock 2fan 20-100window air conditioner 500-600 (when running)desk top computer & monitor 85 – 330 (less for new, LCD models)lap top 15-60smart board use tv valueprinter/copier 30-50 watts in use, 3-5 standbytelevision 70 to 300 in use, 5 standby
Interface 2015 – Engineering a Greener School – http://www.missourigreenschools.org/investigations.html
RESOURCESSaving Electricity - http://michaelbluejay.com/electricity/ - a personal page, with some attitude, but full of detailed information and explanations
Energy Information Administration Kids Page - http://www.eia.gov/kids/
National Energy Education Development Project - http://www.need.org

Where Does the Energy Go!
Everything on a wire uses electricity. Find out how much electricity is being used in your classroom.
Make a map of your classroom using the space below. Show all the lights, all the outlets and all the things plugged into the outlets (appliances and technology). After everything is mapped, look for and record information on volts, amperes or amps and watts on the lights and appliances and technology on the map.
light or appliance hours it is used / day
volts amps Watts(W= volts x amps)
kWh / day(kWh = [W x h]/1000)
For each item on your map (except the outlets), find and write down what the item is, and how many volts, amps or watts it uses per hour of operation. If there is no information for Watts, calculate it by multiplying volts by amps. Then calculate the kilowatt hours (kWh) for the total energy used by the item. Finally add up all the kWh to see how many total are used.
Total kWh = __________________
Interface 2015 – Engineering a Greener School – http://www.missourigreenschools.org/investigations.html

Engineering a Greener School: TeacherMiddle School: Where does the Water Go?
This lesson allows students to apply the concepts of impervious and pervious materials, measuring area, and calculating fractions or percentages; and introduces the concept of storm water run off and the effect on stream flow. Students will be able to apply learned skills in an authentic context that helps them make sense of the world around them.
Prior Knowledge Students should know about impervious and pervious materials. Impervious materials do not let water through, so water from
rainstorms flows off in a downhill direction, just the way a raincoat sheds rain. Pervious surfaces do let water soak into them, so water does not run off, just the way a sponge soaks up water.
Students should know about structures used to control the flow of water. See the list on the worksheet. Students should know how to measure the area of something. This includes things that are not perfect geometric shapes. Students should know how to calculate fractions.
Preparation Have copies of the work sheet for each student, a sheet of scratch paper for calculations, a pencil with an eraser, and a “clip
board” (you can make a “clip board” out of cardboard cut in 9” x 12” sections and a paper clip or bull dog clip). Students or groups of students will also need yard sticks, tape measures, string marked in meters or similar measuring tools.
Depending on your students, enlist one or more responsible persons to help wrangle them when you are outside. Prepare a map or picture of the area of the schoolyard you want them to work on. Pick out an area that would allow them to
make their measurements in about 20 or 30 minutes. You can use a screen shot of the school’s area from any on-line mapping service.
Priming Tell students they are going to map the materials and structures that cover their school-yard to see which ones let water run
off and which ones let water soak into the ground. This is important because more impervious surface increases storm water flowing into streams when it rains. Because the water ran off in the storm, it did not soak into the soil and is not able to provide water for plants or for streams during the drier parts of the year. It is better for plants and streams if storm water does not run off, but soaks into the soil.
Prepare students for going outside by making sure that they know the physical boundaries of the area to investigate. Set clear rules or guidelines for their behavior outside and rehearse them. For example: Leave and enter the building in a quiet
and orderly way. Stay with your group. Stay within the school-yard boundary. Listen for the signal to come together. Divide students into groups of 2 to 4. Hand each student a worksheet and have them read through it and discuss with each
other the goal of the field trip. Ask them to think about the materials in the school yard that would be likely to shed water like a raincoat (or are impervious) or soak water up like a sponge (or are pervious). Ask them to think about structures that would slow down or change the direction of water (changing the acceleration or direction of the forces acting on water)
Have students think about how they are going to measure the area of things that are not exactly rectangular, square, triangular or circular. If they don’t think of it themselves, suggest they break odd shapes into different kinds of geometric shapes, measure those shapes and add them together to get the actual shape.
Go Outside! Collect Data!Follow Up
In class, make a table on the board with a column for each group + 1 and four rows. In the first column write “Area” in the first row, “Impervious” in the second row, “Pervious “ in the third row and “Total” in the fourth row. In the top row, after area, put a number for each group.
Have the students send a group representative to the board to write the area for each kind of material and the total area. If they are different, briefly discuss why results could differ. If you think they can understand, calculate mean values for each area. Otherwise have them use their group’s value for the next step.
Have them calculate the fraction or percentage of the total area that is impervious surface and the fraction or percentage that is pervious. The lower the impervious fraction or percentage is, the better.
Have them think about the role of the structures in speeding up or slowing down water in the section of the schoolyard they measured. Ask them to discuss ways the water could be slowed down and diverted to the pervious surfaces so it can soak into the soil.
Assessments Have students write a short paragraph with a recommendation on how to change the flow of water to allow it to soak into the
ground. They should use the data they collected to make their case and should illustrate with a picture, map or diagram their suggested recommendation.
Extensions Have students think about the forces acting on the water, the force of gravity which pulls it downhill or downwards, and the
electromagnetic forces of the surface materials which keep it from going right to the center of the planet. The only way water can find its way through materials is if they are porous enough for electromagnetic forces to have no effect.
On a rainy day, have the students go outside and see if their ideas about where the water goes were correct.
RESOURCESHow to Manage and Control Storm Water Runoff - http://dnr.mo.gov/education/bigriver/how-to-protect-our-water/home-asyst-stormwater.pdf – Section 2 is relevant to this exercise, but the whole document provides useful information on the need to control storm water runoff
Interface 2015 – Engineering a Greener School – http://www.missourigreenschools.org/investigations.html

Where does the Water Go?Water always flows downhill. That includes in your schoolyard! Your goal is to find out where water goes in your schoolyard
Divide the area shown below into sections based on the direction that rainfall running off the surface would go (its slope). There may be only one section or several. You will need to decide based on the slope of the land. Number the sections on the picture. Draw arrows showing the direction water would flow in each section
For each section. measure the area of each different kind of surface material. Describe and/or name the material. Check if it is impervious, this means that it allows water to run off in a rainstorm. Enter your information in the table. Add up the impervious areas that would let water run off. Add up the pervious areas that would let water sink in. Add the two numbers together to get the total area.
On the image, show where there are structures which affect the flow of water. Structures street gutter – narrow depression that quickly carries
water away storm drain – an opening along a street gutter that
carries water into an underground pipe and from there to the nearest stream
rain garden – a low spot planted with flowers and shrubs to hold storm water until it can soak into the ground
grassed swale – a low spot planted with grasses to hold storm water until it can soak into the ground
permeable pavement – pavement with large enough holes to allow storm water to soak into the ground
rain gutter – a narrow trough that collects rainwater running off the edge of a roof and carries it to a downspout
downspout – a narrow pipe that carries rainwater from a gutter to the ground or to a rain barrel
rain barrel – a barrel that collects rain water from a downspout
Section Kind of Material (concrete, asphalt, grass, mulch, other) Impervious? Check if yes.
Area
Impervious Area ___________ Pervious Area _____________ Total Area ______________
www.meea.org
Interface 2015 – Engineering a Greener School – http://www.missourigreenschools.org/investigations.html

Engineering a Greener School: TeacherHigh School: Too Much of a Good Thing?
This lesson allows students to gather data from the field (their school’s parking lot), combine it with information from the internet and use statistics to draw inferences about the impact of people’s transportation choices on the environment.
Prior Knowledge Students should know about the role of carbon dioxide in trapping infrared radiation and leading to climate change. They
should also understand that cars and other vehicles are sources of carbon dioxide and other kinds of air pollution. Students should understand how to collect data, calculate a mean from it and draw inferences. They should also understand
the importance of using randomization to decide where to begin collecting data. Students should know how to use the internet to gather information on a topic.
Preparation Have copies of the work sheet for each student, a sheet of scratch paper for calculations, a pencil with an eraser, and a “clip
board” (you can make a “clip board” out of cardboard cut in 9” x 12” sections and a paper clip or bull dog clip). Depending on your students, enlist one or more responsible persons to help wrangle them when you are outside. Prepare a map or picture of the area of the parking lot you want them to work in. It should be where students park. Either in
advance or with the students, determine a way to randomize where each student begins their counting while ensuring that no cars are double counted. For example, partition the parking lot into x areas equal to the number of students or student groups. Then, within each area, choose a starting row and use a random numbers table to determine how many cars into the row a student should begin recording data.
Priming Tell students they are going to collect data to evaluate the impact of student transportation choices on the environment. If
necessary, go over the basics of climate change, the role of carbon dioxide in keeping the planet at a livable temperature and how increasing CO2 in the environment would cause more heat to be trapped.
Explain the procedure for collecting the data (see student worksheet) and in particular the importance of randomizing where they collect data.
Show students how to access http://www.fueleconomy.gov and the Power Search tool for looking up mpg and CO2 emissions for a particular vehicle.
Show students how to calculate an average. Go Outside! Collect Data!Follow Up
If students have not already done so, have them look up the mpg and CO2 for their vehicles on the internet. If students have not already done so, have them calculate the average mpg and CO2 for their data set. Put a table on the board with 3 columns (student, average mpg, average CO2) and # of students (or groups) +1 columns and
have the students (or groups) put in their averages. Then have the students calculate an average of averages. (This is only valid if each average is for the same number of cars, otherwise the averages need to be weighted.
Discuss the role that people’s choices have in the amount of CO2 produced. For example, how much control do students have over whether to drive vs. using other forms of transportation, or how much control they have over what to drive? What factors other than individual choice affect CO2. For example, what role do public transit availability, distance to school, technology investments, government rules, and peer pressure have? How can learning more about the impacts of choices (whether voluntary or forced) have on this problem?
Assessments Have each student write an abstract (like the abstract for a scientific paper) that in about 250 words gives: 1) an introduction
that explains how CO2 affects climate, the role of vehicles in producing CO2 and a reason for finding out how much students contribute to CO2; 2) a description of their methods of collecting and analyzing data; 3) a brief description of their results, including any calculations they made; and 4) what the results mean and what would be a good next question to pursue given what they now know. This abstract should incorporate points made during the discussion part of the follow up.
Extensions Have students plot the amount of CO2 (y axis) v. the mpg (x axis) and use the data to derive the formula relating them. This is
the formula that the federal website uses to generate its estimates. Estimate the total number of cars on the lot, and the average distance to school (both ways) and multiply by the overall
average to get an estimate of CO2 production per day. Figure out a way to represent the total amount of CO2 generated each day in a way that students not in class will understand. Use the http://www.fueleconomy.gov to find strategies for reducing CO2 (and driving costs!)
RESOURCESEmissions of Greenhouse Gases in the U.S. - http://www.eia.gov/environment/emissions/ghg_report/ghg_carbon.cfmEnergy Information Administration: Environment - http://www.eia.gov/environment/
Interface 2015 – Engineering a Greener School – http://www.missourigreenschools.org/investigations.html

Too Much of a Good Thing?
Carbon dioxide is essential to keeping the earth warm, but more CO2 means more warming. Your goal is to estimate how much mobile sources at your school contribute to increases in atmospheric carbon dioxide linked to global warming.
Every living thing makes waste, and for most kinds and amounts of waste, there are other organisms or natural processes that can use or recycle it. What makes a waste a pollutant is the amount being produced is too much for natural systems, there are no natural systems in place to handle it where it is released, and or its chemical and physical properties make it toxic to organisms or disruptive to natural systems.
In this case the waste is emissions from mobile sources, aka cars, trucks and vans. The EPA lists over 1100 chemicals that can be found in emissions from vehicles burning gasoline or diesel fuel. The majority of these chemicals are hydrocarbons like benzene, toluene or hexane, an average car can put out as much as one gram per mile. Some of these chemicals are quite toxic. For example, the American Petroleum Institute in 1948 listed the safe exposure to benzene as zero. Another group of pollutants are nitrogen oxides (NOx, x represents all the nitrogen oxides). Nitrogen oxides form when gasoline is burned. One of these, nitrogen dioxide (N2O) contributes to respiratory problems, especially in children, people with asthma and the elderly. The average car puts out about 1.4 grams per mile.
The most significant pollutant, although it does not have a direct effect on human health, is carbon dioxide (CO2). Its physical properties mean that it can trap heat (infrared radiation) near the earth’s surface. This is a good thing, because without it the earth would be too cold for most forms of life. However, increasing the amount of CO2 in the atmosphere increases the amount of heat that is trapped, just like adding an extra jacket traps more heat near your body. It is too much of a good thing at this point. The average car puts out about 320 grams per mile.
So, how much do drivers at your school contribute to air pollution in the form of CO2? At randomly selected points in your school parking lot, write down the make and model of ten cars, trucks or van in a row. If you can, make an educated guess about the year of the vehicle. If you can’t enter the year 3 years earlier than the current year. Be sure and do each vehicle, one after the other. Do not skip any. This will ensure you have a representative sample of what people drive.
Then go to http://www.fueleconomy.gov. This is a website hosted by the federal government that has the average mpg of over 900 vehicles. Choose Power Search. Once you enter data for make, and year if you have it, the site will generate a list of models. Pick the one you have and you will be sent to a page with tabs for fuel economy, energy and environment, safety and specs. Click on the energy and environment tab to get information about the model’s CO2 emissions. Enter it in the CO2 column.
Car # Make Model Year mpg CO2 grams/mi
Avg ------ ------ ------
What to do with this data---- Use it to calculate the average grams of CO2 per mile generated by your sample of cars. Compile everyone’s data into one data set and calculate an overall average (make sure each average uses the
same number of cars)
Interface 2015 – Engineering a Greener School – http://www.missourigreenschools.org/investigations.html

1162 compounds found in mobile source exhaustNitrous Oxide N2O 10 to 239 mg/mile >>> nitric oxide NO >>>> ozone depletion in stratosphere N2O 298 x GWP of CO2Nitrates .3 to 5.7 mg/milePentenes 12.9 to 91.8 mg/mile to > 200 butenes > 300Benzen 1.5 to 2.3 mg/mileTrimethyl pentane > 2000 dimethyl butane > 800; acetylene > 7000 mg benzene & cyclohexane 44.3 – 165.4butenes 22.7 – 134.6diesel particulate matter 10 to 22540 mg/mihexane >1000isobutene > 1500methane to 10540pentane to 1647toluene to 2999undecane to 2074diesel VOC 90 to 59,090 mg/mi
Nitric Oxide (NO) >>> nitrogen dioxide NO2– acrid toxic
Nitrogen Oxides = 1.39 grams/mile for a 21.5 mpg car so 1.39 g/m = ___/g x 21.5m/gccc
To estimate the NOx per mile use this formula: NOx grams/mi = 30 grams/gallon x vehicle miles/gallon
Interface 2015 – Engineering a Greener School – http://www.missourigreenschools.org/investigations.html

A Field Trip at Your SchoolEnergy Investigation Activities
Energy makes it possible for us to
Building Energy Sources
Which of the following sources provide energy for your building? www.epa.gov/cleanenergy/energy-and-you/how-clean .html (put in your zip code and your utility)
_____% Coal _____% Nuclear _____% Hydroelectric _____% Oil
_____% Natural Gas/Propane _____% Wood _____% Solar _____% Wind
_____% Geothermal _____% Other _____________________________
Does the building have any onsite renewable energy systems?
_____ Solar Photovoltaic _____ Solar _____ Wind _____ Geothermal
Room Lighting Information
Artificial Light
Type of Bulb # of Fixtures # Bulbs/Fixture Avg Wattage Avg Hours On per day
Energy Consumed per day (kWh)
A B C D E= AxBxCxD 1000
Compact Fluorescent (CFL)Fluorescent TubesIncandescentLight Emitting Diodes (LED)Other
Are lights controlled by motion, photo or infrared sensors?
Are all overhead lights typically on when room is in use?
Daylight
Location Adequate* with half of lights off
Adequate with all lights off
Adequate means that you can read small print easily. Can you read the words below easily?
playground caterpillar fish tank turtle library goal post principal
teacher cafeteria school bus mother father sister brother
catch run jump climb pizza ice cream salad bar milk potato bar
near windowsmiddle of the roomfar away from windowshall outside room
Was the day sunny or cloudy when you took measurements?
Ideas for Energy Sources that pollute less
Interface 2015 – Engineering a Greener School – http://www.missourigreenschools.org/investigations.html

Ideas for Lighting that use less energy
Interface 2015 – Engineering a Greener School – http://www.missourigreenschools.org/investigations.html

Interface 2015 – Engineering a Greener School – http://www.missourigreenschools.org/investigations.html