Embed Size (px)
Citation preview
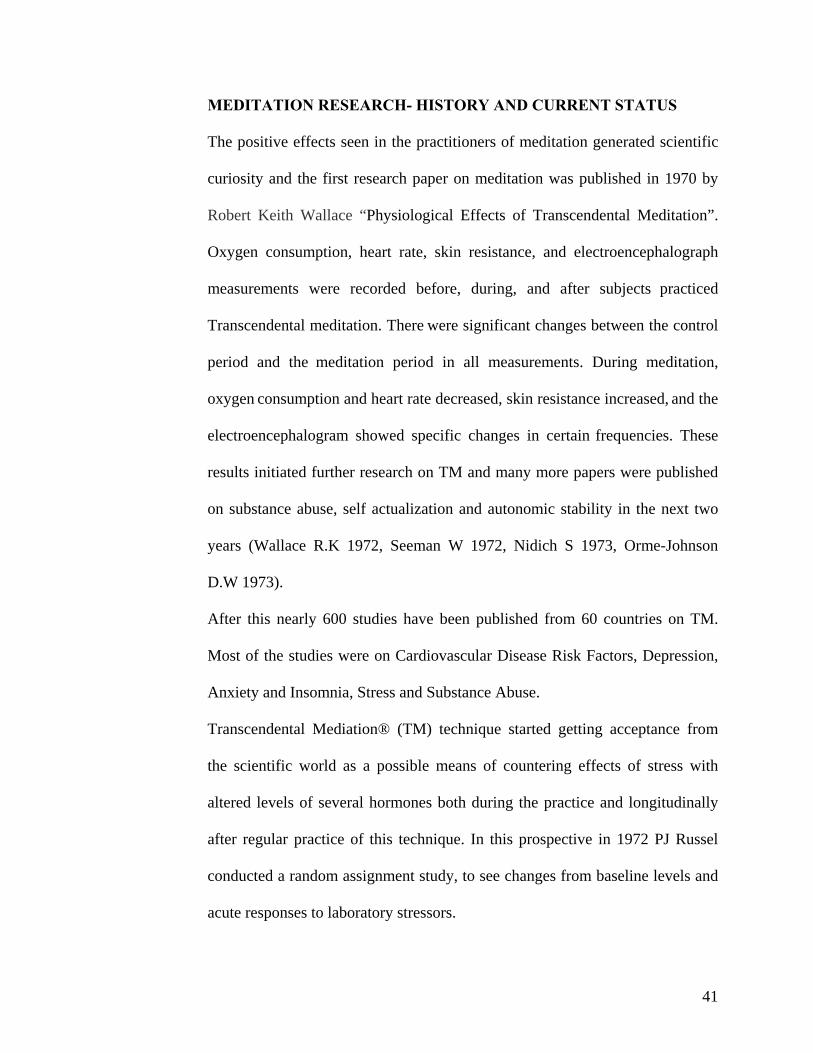
MEDITATION RESEARCH- HISTORY AND CURRENT STATUS
The positive effects seen in the practitioners of meditation generated scientific
curiosity and the first research paper on meditation was published in 1970 by
Robert Keith Wallace “Physiological Effects of Transcendental Meditation”.
Oxygen consumption, heart rate, skin resistance, and electroencephalograph
measurements were recorded before, during, and after subjects practiced
Transcendental meditation. There were significant changes between the control
period and the meditation period in all measurements. During meditation,
oxygen consumption and heart rate decreased, skin resistance increased, and the
electroencephalogram showed specific changes in certain frequencies. These
results initiated further research on TM and many more papers were published
on substance abuse, self actualization and autonomic stability in the next two
years (Wallace R.K 1972, Seeman W 1972, Nidich S 1973, Orme-Johnson
D.W 1973).
After this nearly 600 studies have been published from 60 countries on TM.
Most of the studies were on Cardiovascular Disease Risk Factors, Depression,
Anxiety and Insomnia, Stress and Substance Abuse.
Transcendental Mediation® (TM) technique started getting acceptance from
the scientific world as a possible means of countering effects of stress with
altered levels of several hormones both during the practice and longitudinally
after regular practice of this technique. In this prospective in 1972 PJ Russel
conducted a random assignment study, to see changes from baseline levels and
acute responses to laboratory stressors.
41
Four hormones, cortisol, growth hormone, thyroid-stimulating hormone and
testosterone, were studied before and after 4 months of either the TM technique
or a stress education control condition. Daily urine excretions of
catecholamines and Vanillyl Mandelic Acid (VMA) were determined in ten
male advanced meditators and ten male long-term meditators who were
subjected four times to slight physical exercise following a period of rest,
meditation or reading. Blood pressure and heart rate were measured
continuously and blood samples were taken for plasma catecholamine levels
immediately before and after the physical exercise and VMA excretions were
greater in the TM group (R. Lang, 1979). Later in 2001 Morning and evening
Catecholamine levels were studied in 19 regular practitioners of TM and
control group and in the TM group it was lower than in the control (Jose Rafael
Infante, 2001).
Lipid peroxidase levels were studied in 41 normal healthy adults who were
long- term practitioners of the technique (Robert H. Schneider 1998) and serum
lipid peroxidase levels were found to be significantly lower when compared to
the control. Robert H. Schneider et al (1995) tested the short-term efficacy and
feasibility of two stress education approaches to the treatment of mild
hypertension in older African Americans. This was a randomized, controlled,
single-blind trial with 3 months of follow-up in a primary care, inner-city health
center on 127 individuals who were aged 55 to 85 years. The reductions in the
Transcendental Meditation group were significantly greater than in the
progressive muscle relaxation group for both systolic blood pressure and
42
diastolic blood pressure. The linear trend analysis also confirmed the reduction.
A preliminary investigation of the acute effects of TM on total peripheral
resistance was conducted and was found to be decreased significantly during
TM (Vernon A. Barnes 1999).
In 2007 Maxwell V. Rainforth conducted an updated systematic review of the
published literature and identified 107 studies on stress reduction and BP in
TM. Seventeen trials with 23 treatment comparisons and 960 participants with
elevated BP met criteria for well-designed randomized controlled trials and
replicated within intervention categories. Meta-analysis was used to calculate
BP changes for biofeedback, relaxation-assisted biofeedback, progressive
muscle relaxation, stress management training, and the Transcendental
Meditation program, results indicated that among stress reduction approaches,
the Transcendental Meditation program is associated with significant
reductions in BP. In 2008 (JW Anderson) full reports of randomized controlled
trials related to Transcendental Meditation and hypertension were meta-
analyzed and the random-effects meta-analysis model for systolic and diastolic
blood pressure, indicated that Transcendental Meditation, compared to control,
was associated with significant lowering of blood pressure. When the efficacy
of transcendental meditation (TM) was evaluated on components of the
metabolic syndrome and Coronary Heart Disease (CHD), use of TM for 16
weeks in CHD patients improved blood pressure and insulin resistance,
components of the metabolic syndrome, as well as cardiac autonomic nervous
43
system tone compared with a control group receiving health education (Maura
Paul-Labrador 2006).
When 10 experienced male meditators and nine matched subjects, uninformed
of the TM procedure, were compared, after 40 minutes of practice, no
significant difference was seen between these 2 groups with respect to
carbohydrate metabolism (plasma glucose, insulin and pancreatic glucagon
concentrations), pituitary hormones (growth hormone and prolactin) or the
'stress' hormones, cortisol and total catecholamines, although meditators tended
to have higher mean catecholamine levels. Plasma free fatty acids were
significantly elevated in meditators (Cooper R 1985)
After TM, Mindfulness meditation stands second in medical research. A
randomized, wait-list controlled study was conducted on cancer patients.
Patients completed the Profile of Mood States and the Symptoms of Stress
Inventory both before and after the intervention. The intervention consisted of a
weekly meditation group lasting 1.5 hours for 7 weeks plus home meditation
practice. After the intervention, patients in the treatment group had significantly
lower scores on Total Mood Disturbance and subscales of depression, anxiety,
anger, and confusion and more vigor than control subjects. The treatment group
also had fewer overall symptoms of stress; fewer cardiopulmonary and
gastrointestinal symptoms; less emotional irritability, depression, and cognitive
disorganization; and fewer habitual patterns of stress (Michael Speca 2000).
44
Studies on Vipasana meditation showed the possible beneficial role of the
technique in sleep–wakefulness behavior in adults (Sulekha S 2006).
Authors claim that yoga practices help to retain slow wave sleep and enhance
the REM sleep state in middle age thus helping one to retain a younger
biological age as far as sleep is concerned.
Brain electrical activity was measured before and immediately after, an 8-week
training program in mindfulness meditation. Twenty-five subjects were tested
in the meditation group. A wait-list control group was tested at the same points
in time as the meditators. At the end of the 8-week period, subjects in both
groups were vaccinated with influenza vaccine. There was significant increase
in left-sided anterior activation, a pattern previously associated with positive
affect, in the meditators compared with the nonmeditators. It was also found
significantly increased in antibody titers to influenza vaccine among subjects in
the meditation compared with those in the wait-list control group (Richard J
Davidson 2003).
When the study was conducted on the effectiveness of Mindfulness-based
stress reduction (MBSR) program, it was found to be associated with increase
in mindfulness and spirituality. There were significant improvements in state
and trait mindfulness, psychological distress, and reported medical symptoms.
(Carmody 2008).
45
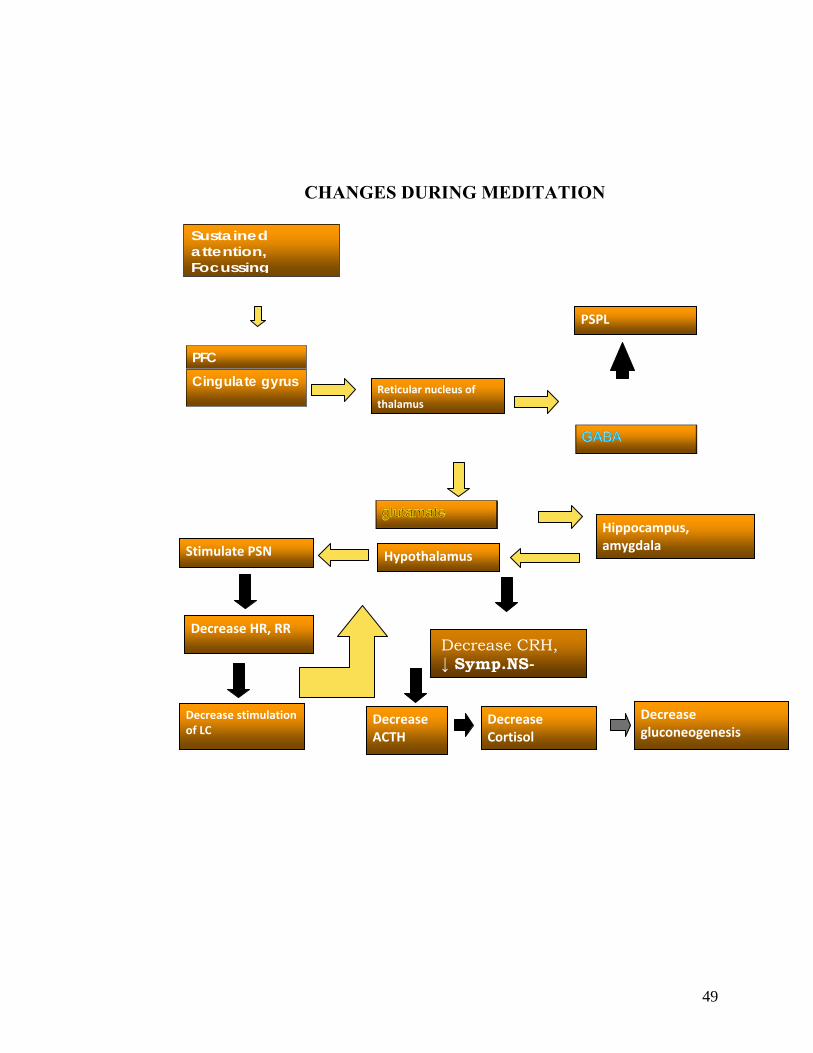
BRAIN CHANGES DURING MEDITATION
ACTIVATION OF THE PREFRONTAL AND CINGULATE CORTEX
Since meditation requires intense focus of attention, it seems appropriate that a
model for meditation begin with activation of the Pre Frontal Cortex (PFC),
particularly in the right hemisphere, as well as the cingulate gyrus.
THALAMIC ACTIVATION
Several animal studies have shown that the PFC, when activated, innervates the
reticular nucleus of the thalamus (Cornwall J 1988), particularly as part of a
more global attention network (Portas C M 1988). When excited, the reticular
nucleus secretes the inhibitory neurotransmitter GABA onto the lateral
geniculate nuclei, cutting off input to the PSPL and visual centers in proportion
to the reticular activation (Destexhe A 1998). Several studies have
hypothesized an increase in serum GABA during meditation (Elias A. N 1998).
PSPL DEAFFERENTATION
When deafferentation of the PSPL via the reticular nucleus’s GABA ergic
occurs, an individual may begin to lose his or her usual ability to spatially
define the self and help to orient the self.
46
HIPPOCAMPAL AND AMYGDALAR ACTIVATION
In addition to the complex corticothalamic activity, meditation might also be
expected to alter activity in the limbic system, especially since stimulation of
limbic structures is associated with experiences similar to those described
during meditation (Fish D R 1993, Saver J L 1997).
HYPOTHALAMIC AND AUTONOMIC NERVOUS SYSTEM CHANGES
The hypothalamus is extensively interconnected with the limbic system.
Stimulation of the right lateral amygdala has been shown to result in
stimulation of the ventromedial portion of the hypothalamus with a subsequent
stimulation of the peripheral parasympathetic system (Joseph R 1996).
Increased parasympathetic activity is associated with the subjective sensation
first of relaxation and, of a more profound quiescence (Newberg 2003).
Activation of the parasympathetic system would also cause a reduction in heart
rate and respiratory rate. All of these physiological responses have been
observed during meditation (Davis M 1992). When an individual’s breathing
and heart rate slow down, the para gigantocellular nucleus of the medulla
ceases to innervate the locus ceruleus (LC) of the pons. The paraventricular
nucleus of the hypothalamus typically secretes corticotropin-releasing hormone
47
(CRH) in response to innervation by NE from the locus ceruleus (Jevning R
1992, Walton K G 1995). This CRH stimulates the anterior pituitary to release
adreno-corticotropic hormone (ACTH) (Livesey J. H 2000). ACTH, in turn,
stimulates the adrenal cortex to produce cortisol, one of the body’s stress
hormones (Davies E 1985). Decreasing NE from the locus ceruleus during
meditation would likely decrease the production of CRH by the paraventricular
nucleus, which would ultimately decrease cortisol levels. Most studies have
found that urine and plasma cortisol levels are decreased during meditation
(Sudsuang R 1991, Jevning R 1978, Renaud L P 1996). The drop in blood
pressure associated with para-sympathetic activity during meditation practices
would be expected to relax the arterial baroreceptors leading the caudal ventral
medulla to decrease its GABAergic inhibition of the supraoptic nucleus of the
hypothalamus.
48
CHANGES DURING MEDITATION
Sustained attention, Focussing
PFC Cingulate gyrus
Decrease stimulation of LC
Decrease ACTH
Reticular nucleus of thalamus
PSPL
Hippocampus, amygdala
Decrease gluconeogenesis
Stimulate PSN
Decrease HR, RR
Hypothalamus
Decrease Cortisol
Decrease CRH, ↓ Symp.NS-
49
CRITICISMS AND LACUNAE IN MEDITATION RESEARCH
The University of Alberta Evidence-based Practice Center (UAEPC) reviewed
and synthesized the published literature on the state of the research of
meditation practices for health.
State of Research on the Therapeutic Use of Meditation Practices in
Healthcare
Eight hundred and thirteen studies provided evidence regarding the state of
research on the therapeutic use of meditation practices. Half of the studies on
meditation were published after 1994. Most of the studies were published as
journal articles. Studies were conducted mainly in North America (61 percent).
Of the 813 studies included, 67 percent were intervention studies (286 RCTs,
114 NRCTs and 147 before-and-after studies), and 33 percent were
observational analytical studies (149 cohort and 117 cross-sectional studies).
Control groups in these studies: The number of control groups used in the 668
controlled studies ranged from one to four. The majority of the studies utilized
an active, concurrent control.
Study population: The majority of studies on meditation practices have been
conducted in healthy populations.
Outcome measures: Physiological functions, particularly cardiovascular
outcomes, were the most frequently reported outcome of interest in meditation
research. Psychosocial outcomes, outcomes related to clinical events and health
50
status, cognitive and neuropsychological functions, and healthcare utilization
outcomes have also been evaluated in studies of meditation practices.
Results of the analysis: A few studies of overall poor methodological quality
were available for each comparison in the meta-analysis, most of which
reported no significant results.
The physiological and neuropsychological effects of meditation practices were
evaluated in 311 studies. The majority of studies were conducted in healthy
participants. Meta-analysis revealed that the most consistent and strongest
physiological effects of meditation practices in healthy populations occur in the
reduction of heart rate, blood pressure, and cholesterol. The strongest
neuropsychological effect is in the increase of verbal creativity. There is also
some evidence from before and after studies to support the hypothesis that
certain meditation practices decrease visual reaction time, intraocular pressure,
and increase breath holding time. The overall low methodological quality of
the studies indicated that most of the studies suffered from methodological
problems that may result in overestimations of the treatment effects or
compromise the generalizability of the study results. Particularly, the lack
of a concurrent control group in the before and after studies, results in an
inability to control for temporal trends, regression to the mean, and
sensitivity to methodological features.
So the current study was designed on a new meditation technique named
Integrated Amrita Meditation technique designed and presented to the world by
Her Holiness Mata Amritanandamayi Devi.
51
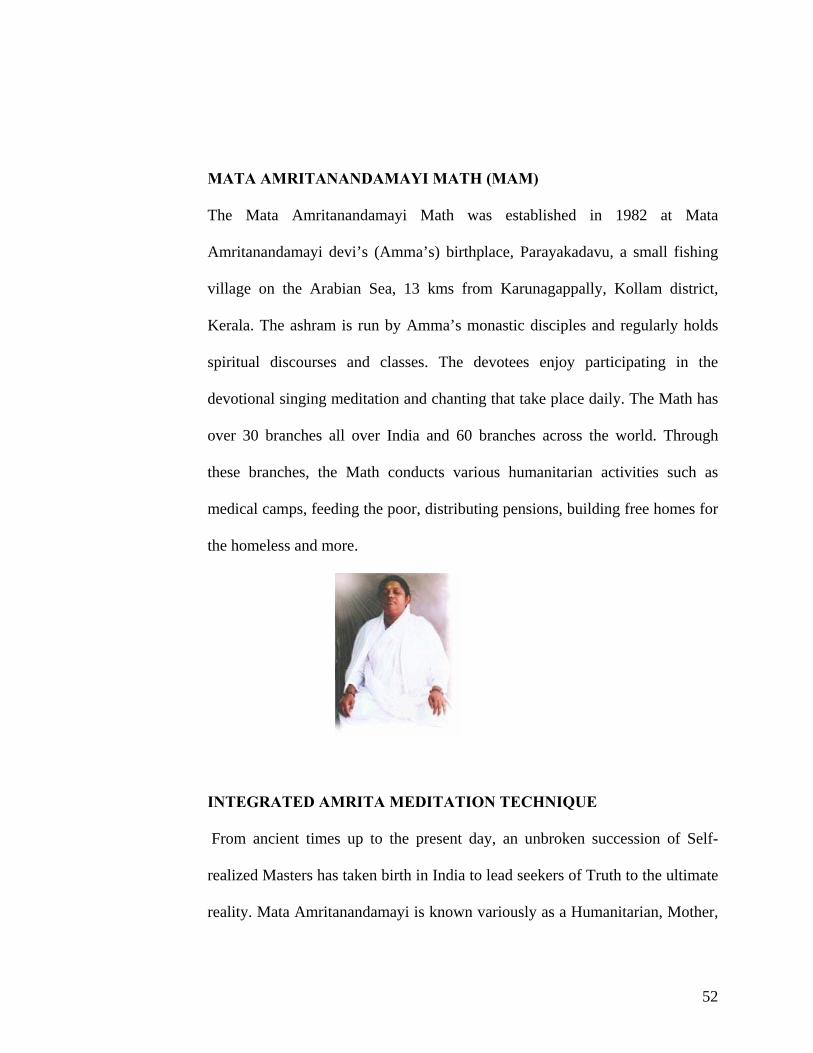
MATA AMRITANANDAMAYI MATH (MAM)
The Mata Amritanandamayi Math was established in 1982 at Mata
Amritanandamayi devi’s (Amma’s) birthplace, Parayakadavu, a small fishing
village on the Arabian Sea, 13 kms from Karunagappally, Kollam district,
Kerala. The ashram is run by Amma’s monastic disciples and regularly holds
spiritual discourses and classes. The devotees enjoy participating in the
devotional singing meditation and chanting that take place daily. The Math has
over 30 branches all over India and 60 branches across the world. Through
these branches, the Math conducts various humanitarian activities such as
medical camps, feeding the poor, distributing pensions, building free homes for
the homeless and more.
INTEGRATED AMRITA MEDITATION TECHNIQUE
From ancient times up to the present day, an unbroken succession of Self-
realized Masters has taken birth in India to lead seekers of Truth to the ultimate
reality. Mata Amritanandamayi is known variously as a Humanitarian, Mother,
52
Friend, Guru, and God by the people. She is popularly known as Amma. She
has offered herself to the world. In reality, She is beyond all such roles, her true
nature is to be the true nature of all of us the blissful divine consciousness that
pervades this universe. But out of her infinite compassion, Amma comes down
to the level of whoever is standing before her the poor, the lonely, the seeker in
order to give what is desired, what is needed.
IAM - Integrated Amrita Meditation Technique® is a powerful meditation
technique created by Amma to help people find fulfillment in spiritual as well
as materialistic life. It can be comfortably performed by anyone in just 23
minutes per day. The IAM - Integrated Amrita Meditation Technique® is
protected under a registered trade mark in order to preserve the original form of
this meditation designed and developed by Amma and to prevent misuse by
unauthorized and unqualified teachers. Therefore, at the beginning of the
course each participant is requested to sign an agreement that he or she shall
keep the course, including all written materials received as part of the course,
strictly confidential. This meditation course is meant only for a person of sound
mental health.
Amma’s disciples teach the technique in all parts of the world. IAM
Technique® is not only taught to Amma’s devotees, but also to organizations
throughout the world, including corporations, education institutions and
correctional facilities. Students of various Universities and the Indian Army
have also been introduced to this technique.
53

RESEARCH HYPOTHESIS & OBJECTIVES
SAMPLE SIZE CALCULATION
STUDY DESIGN
MATERIALS ND METHODS
54
RESEARCH HYPOTHESIS AND OBJECTIVES
Introduction to methodology: Previous studies on meditation indicates that,
not all techniques have the same effects and in most of the studies, small
sample size, suboptimal control groups, lack of long-term follow up, and
problems of adherence among participants were the factors criticized. So we
designed the current study with an aim to understand the effect of Integrated
Amrita meditation technique on physiological and psychological stress using
two control groups and of the four phases of intervention, i.e., baseline, 48
hours, 2 months, and 8 months.
Hypothesis: Our hypothesis is that IAM Meditation would reduce stress in
normal young adults and this will be reflected as changes in physiological and
psychological stress indicators.
Research question that needs to be answered through the study: Does IAM
Meditation bring any change in the response to stress?
Objective of the study:
The objective of the study is to study the changes in the immediate (48 hours),
short term and long term stress responses after IAM meditation technique
through culturally adapted psychological questionnaires, short and long term
stress coping pathways (cortisol, adrenaline) and physiological parameters like
blood pressure, heart rate, respiratory rate, GABA and IGA levels.
55
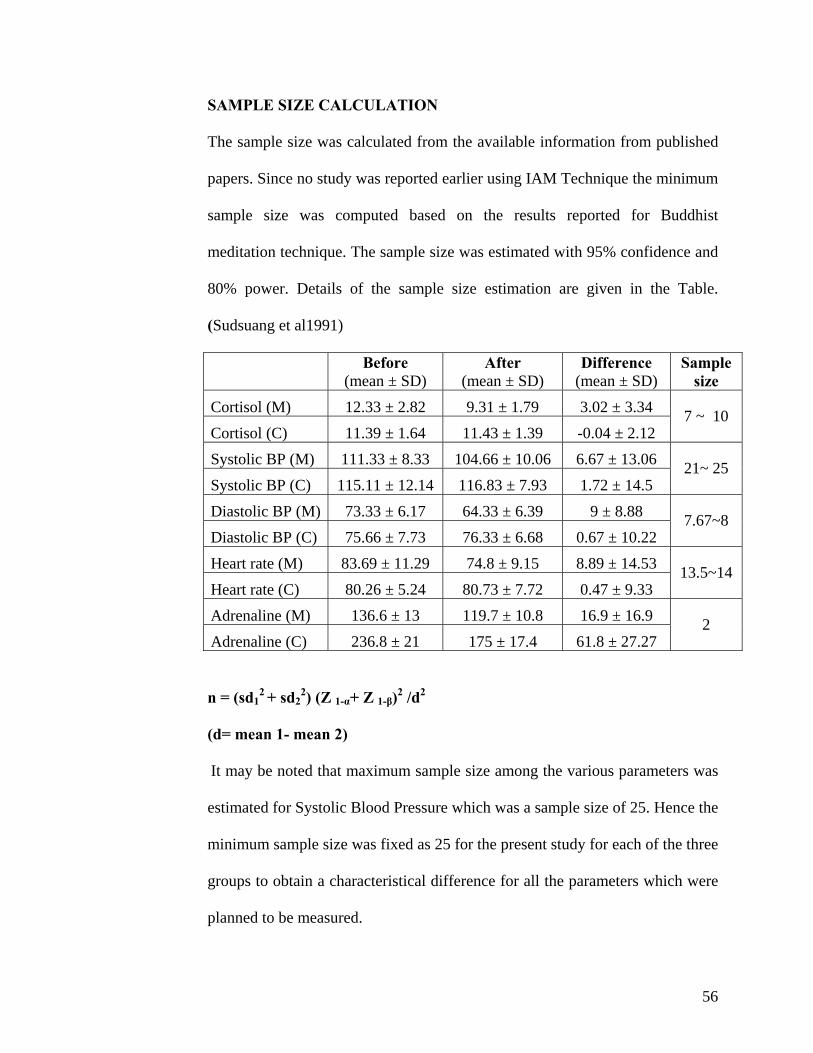
SAMPLE SIZE CALCULATION
The sample size was calculated from the available information from published
papers. Since no study was reported earlier using IAM Technique the minimum
sample size was computed based on the results reported for Buddhist
meditation technique. The sample size was estimated with 95% confidence and
80% power. Details of the sample size estimation are given in the Table.
(Sudsuang et al1991)
Before
(mean ± SD) After
(mean ± SD) Difference
(mean ± SD) Sample
size Cortisol (M) 12.33 ± 2.82 9.31 ± 1.79 3.02 ± 3.34 Cortisol (C) 11.39 ± 1.64 11.43 ± 1.39 -0.04 ± 2.12
7 ~ 10
Systolic BP (M) 111.33 ± 8.33 104.66 ± 10.06 6.67 ± 13.06 Systolic BP (C) 115.11 ± 12.14 116.83 ± 7.93 1.72 ± 14.5
21~ 25
Diastolic BP (M) 73.33 ± 6.17 64.33 ± 6.39 9 ± 8.88 Diastolic BP (C) 75.66 ± 7.73 76.33 ± 6.68 0.67 ± 10.22
7.67~8
Heart rate (M) 83.69 ± 11.29 74.8 ± 9.15 8.89 ± 14.53 Heart rate (C) 80.26 ± 5.24 80.73 ± 7.72 0.47 ± 9.33
13.5~14
Adrenaline (M) 136.6 ± 13 119.7 ± 10.8 16.9 ± 16.9 Adrenaline (C) 236.8 ± 21 175 ± 17.4 61.8 ± 27.27
2
n = (sd12 + sd2
2) (Z 1-α+ Z 1-β)2 /d2
(d= mean 1- mean 2)
It may be noted that maximum sample size among the various parameters was
estimated for Systolic Blood Pressure which was a sample size of 25. Hence the
minimum sample size was fixed as 25 for the present study for each of the three
groups to obtain a characteristical difference for all the parameters which were
planned to be measured.
56
STUDY DESIGN
The study received Institutional Ethics Committee clearance and Scientific
Advisory committee clearance before the commencement.
Two pilot studies were conducted on a working adult population. The subject
information sheet and informed consent were given to people working at
AIMS. In the first pilot, 20 employees of AIMS were recruited and randomized
into three groups (IAM, PMR, control). But out of the seven recruited for the
IAM only one person came for the first visit. When the subjects were contacted
further, it was learned that they were not comfortable with randomization and
were not sure whether they would be able to continue for eight months in the
study. In the second pilot anticipating the heavy drop out, 60 subjects were
recruited and randomized but again there was a heavy dropout and the study
could not be conducted. On further discussion with the drop out subjects of the
pilot it was found that due to work constraints they could not find time for the
practice and those who had dropped out of the control group felt that they
would not benefit from learning a relaxation technique and so were no longer
interested in the study. Finally it was decided to take college students for the
study as they are a captive audience. (Follow up was easier as we could go to
them rather than having them come to us) Ensuring compliance was also
expected to be easier as the students could be contacted at regular intervals in
their classes or hostels.
57
The original study was conducted in two campuses under the Amrita
Viswavidyapeetham. The purpose of the study and the methodology was
clearly explained through slides to the students of age group 18-21.
Any student who had practiced any relaxation technique at anytime was asked
not to participate in the study.
The volunteers were selected through a screening questionnaire i.e., Life styles
questionnaire. The exclusion criteria were alcoholics, chronic smokers and
psychiatric patients. There was only one student who had reported that she was
taking psychiatric medicine and was excluded. Subjects signed informed
consent forms prior to participation in the study.
Since we anticipated a heavy dropout of subjects after randomization, double
the required sample size was selected for the first visit. Thus one hundred and
fifty college students were randomly assigned three groups by the lottery
method. Subjects were numbered and tokens were prepared with these numbers
written on it. From this the tokens were drawn and assigned to three different
groups. The first group was trained to practice the meditation technique called
Integrated Amrita Meditation (IAM) Technique. The subjects randomized to
the second group were given training on Progressive Muscle Relaxation (PMR)
technique. The subjects randomized to the third group served as controls and
did not practice any meditation technique or do any relaxation exercises.
IAM technique was taught to the IAM group by trained instructor from the MA
Math. PMR technique was taught by a trained physiotherapist. The control
58
group was not given any special training. All the psychological, physiological
and biochemical parameters were collected after 48 hours to study the
immediate changes and again after two months of continuous practice to see the
short term effect and after eight months of regular IAM or PMR practice to
study the long term effects.
A self-maintained diary assessed compliance in both the groups. All the subjects
in the IAM and PMR groups continued regular practice of these techniques
throughout the eight month period. Apart from assessing the diaries, compliance
was also assured by frequently visiting the students at their college and hostel.
Baseline values for all the parameters were collected at 0 hours, i.e. before any
training was given to the IAM & PMR groups. (Through out the entire study all
data were collected in the morning by 8 am). Blood was collected for all the
visits and plasma was separated and stored at minus 20 degree Celsius in the
deep freezer. The tests were conducted for all the parameters in AIMS.
The data was entered in SPPSS statistical package. All subjects were followed
up for a total duration of eight months. Regular refresher courses were arranged
for IAM and PMR groups.
59
MATERIALS AND METHODS
IAM TECHNIQUE
Like any other form of meditation, IAM has its roots in the Indian Tantric
practices. It is a method for experiencing the energy of the macrocosm within
the microcosm through mastering a technique of energy movement called Prana
Sanchara. It consists of energizing exercises (yogic postures) for up to 8
minutes, a brief period of relaxation for 2 minutes and 13 minutes of
meditation. At the end of the technique the subjects are asked to remain in
silence for 5 minutes.
The components of the technique are:
Relaxation exercises/yogic postures: These exercises progressively relax the
muscles and joints and so the mind too. It also has an energizing, holistic effect.
Breathing exercises (focused breathing): These breathing exercises draw
attention to the way one breathes, prompts a more complete breathing.
Awareness: Throughout the process awareness is the main component. One is
encouraged to be aware of all the subtleties of each of the steps. One part in
particular focuses on the flow of breath.
Visualization: This is a key component of this technique as mind is focused on
an internal point, rather than on a physical object outside.
Only the first class is guided. The later practice is without the help of any
external means.
Criteria for successful practice: Belief in a spiritual master and chanting the
mantra given by the master is recommended.
60
The relaxation of the mind by this technique is expected to reduce stress and
expand thinking in general, making the subject more creative on his work or
studies.
This is the first study on the IAM Technique
PROGRESSIVE MUSCLE RALAXATION TECHNIQUE Progressive
Muscle Relaxation (or PMR) is a technique for reducing anxiety by alternately
tensing and relaxing the muscles. It was developed by American physician
Edmund in the early 1920s (Jacobson, E. 1924). Jacobson argued that since
muscular tension accompanies anxiety, one can reduce anxiety by learning how
to reduce the muscular tension. PMR has a physical and mental component.
The physical component involves the tensing and relaxing of muscle groups
over the arms, legs, face, abdomen and chest. With the eyes closed and in a
sequential pattern, a tension in a given muscle group is purposefully done for
approximately 10 seconds and then released for 20 seconds before continuing
with the next muscle group.
The mental component focuses on the difference between the feelings of the
tension and relaxation. Jacobson found that the relaxation procedure is effective
against ulcers, insomnia, and hypertension. The technique has also proven
effective in reducing acute anxiety in people with Schizophrenia. (Chen WC
2009). Jacobson's Progressive Relaxation has remained popular with modern
physiotherapists. This is a standardized relaxation technique. We have taken
this as one of the control group because IAM technique is a combination of few
61
relaxation exercises and deep meditation and we wanted to see if the effects of
the mediation are due to the muscle relaxation part of the technique or due to
the deep meditation.
PSYCHOLOGICAL INSTRUMENTS
A. Life changes stress scale
In 1967, psychiatrists Thomas Holmes and Richard Rahe examined the medical
records of over 5,000 medical patients as a way to determine whether stressful
events might cause illnesses. Patients were asked to tally a list of 43 life events
based on a relative score (Holmes TH 1967). A positive correlation of 0.118
was found between their life events and their illnesses. Their results were
published as the Social Readjustment Rating Scale (SRRS) known commonly
as the Holmes and Rahe Stress Scale. M A Miller and Rahe Recent life changes
questionnaire in scaling for the 1990 containing 73 items which is a modified
version of Holmes and Rahe scale was used in the study.
M A Miller and Rahe Recent life changes questionnaire was initially given to
the adults and college students in Kochi in South India where the study was
conducted. As the subjects reported that many items given in the scale were
irrelevant for the Indian population and many stress precipitating factors were
missing, the questionnaire was modified. The new questionnaire contained 74
items.
62
Standardization
Standardization of the new questionnaire was then done.
As a part of standardization 12 items were deleted. The Health item ‘Major
change in your usual type or amount of recreation’ was not found to be a
significant stress factor for the local population. Home and family items like
‘Parent’s divorce’, ‘A parent remarries’; personal like ‘Beginning or ending of
school’, ‘Change in political beliefs’, ‘Change in religious belief’, ‘New close
personal relationship’ and finance factors like ‘Moderate purchase’ ,
‘Foreclosure on mortgage or loan’ were insignificant stress factors for the
Indian population and were deleted. Thirteen items which were more important
in inducing stress were added like ‘An examination’ (Work), ‘Menopause’, ‘Not
having children’, ‘Not having a son’, ‘Unmarried daughter dowry problems’,
‘Unemployed child/spouse’, ‘Problems with room mate’, ‘Property dispute’
(Home and family); ‘Event that brought shame to the family or caused
humiliation’, ‘ Family member getting addicted to alcohol or drugs’ (Personal
and social) and ‘Major loss of income’, ‘Self or other family member trapped in
a financial problem’, ‘Being in a traffic accident’, ‘Being involved in a natural
or man made disaster’(Financial and other). Five items were merged into two
items (‘Child leaves home to attend college or for marriage’ & ‘Child leaves
home’, ‘Death of a child’, ‘Death of parent’ & ‘Death of a brother or sister’).
The new questionnaire (Table11 a) was given to 101 subjects (the local
population /college students) and they were asked to rate each item or to give
stress score to each item imagining how stressful each event would be if it
63
occurred in his/her life. This was analyzed for split half reliability and was
found to be have correlation coefficient 0.96. Life change units for the Indian
college students were found.
B. PERCEIVED STRESS SCALE - Sheldon Cohen
The Perceived Stress Scale (PSS) is the most widely used psychological
instrument for measuring the perception of stress. It is a measure of the degree
to which situations in one’s life are appraised as stressful. Items were designed
to tap how unpredictable, uncontrollable, and overloaded respondents find their
lives. The scale also includes a number of direct queries about current levels of
experienced stress. The PSS was designed for use in community samples with
at least a junior high school education. The items are easy to understand, and
the response alternatives are simple to grasp.
The questions in the PSS ask about feelings and thoughts during the last month.
C. BECK DEPRESSION INVENTORY
Historically, depression was described in psychodynamic terms as "inverted
hostility against the self (Beck 2009). By contrast, the BDI was developed in a
novel way for its time; by collating patients' verbatim descriptions of their
symptoms and using these to structure a scale which could reflect the intensity
or severity of a given symptom (Beck 2006).
Throughout his work, Beck drew attention to the importance of "negative
cognitions": sustained, inaccurate, and often intrusive negative thoughts about
64
the self (Allen JP2004). In his view, it was the case that these cognitions
caused depression, rather than being generated by depression. Beck developed
a triad of negative cognitions about the world, the future, and the self, which
play a major role in depression. The original BDI, first published in 1961 (Beck
1961), consisted of twenty-one questions about how the subject has been
feeling in the last week. Each question has a set of at least four possible answer
choices, ranging in intensity.
The BDI-II was a 1996 revision of the BDI (Beck 1996) developed in response
to the American Psychiatric Association's publication of the Diagnostic and
Statistical Manual of Mental Disorders, Fourth Edition, which changed many of
the diagnostic criteria for Major Depressive Disorder.
METHODS
Life Changes Questionnaire: These standardized questionnaires were given
without scores to the subjects who were randomized into the 3 groups and they
were asked to rate how stressful each event would be if it occurs in their life.
All the questionnaires were collected at baseline (before any intervention), and
again 48 hours later to assess the stress response of the subjects to each
stressful event before and after the practice of the techniques. Subsequently the
questionnaires were collected two months and eight months after
randomization. BDI & PSS were also collected at baseline (before any
intervention), and again 48 hours later and then collected 2 months and eight
months after randomization.
65
BIOCHEMICAL TESTS
A. ADRENALINE ANALYSIS
Plasma Adrenaline analysis was done by ELISA (Adrenaline EIA).
Adrenaline was extracted using a cis-diol specific affinity gel. It was then
acylated to N - acyladrenaline and converted enzymatically to N-
acylmetanephrine. Acylated Adrenaline from the sample and solid phase of
the micro titer plate compete for antiserum binding sites. The antibody bound
to solid phase was detected by an anti rabbit IgG peroxidase conjugate using a
suitable substrate. The reaction was monitored at 450 nm.
B. CORTISOL ASSAY
Cortisol was estimated by Chemiluminescent micro particle immuno assay
method. The sample and anti Cortisol coated paramagnetic micro particles are
combined to create a reaction mixture. Cortisol present in the sample binds to
the anti Cortisol coated micro particles. After incubation Cortisol acrinidium
labeled conjugate is added to the reaction mixture and trigger solutions are
added to the reaction mixture. The resulting chemiluminescent reaction is
measured as Relative Light Units (RLU).
C. IGA
IgA was analysed by turbidimetry method. IgA represents about 10 to 15 % of
the serum immunoglobulins. The most important form of IgA is the secretory
66
IgA, found in tears, sweat, saliva, milk, colostrums and gastrointestinal and
bronchial secretions.
We analyzed the plasma IgA levels. Anti-human IgA antibodies form
insoluble complexes when mixed with samples. As the scattering light of the
immunocomplexes depends of the IgA concentration in the subjects sample,
the values were quantified by comparison from a calibrator of known IgA
concentration.
D. GABA
GABA was analyzed by HPLC. GABA present in the supernatant or in a
standard solution of GABA of convenient concentration was derivatized to
phenylthiocarbamyl-GABA (PTC-GABA) following the indications of
Gunawan et al. A 100-/zl aliquot of supernatant (or of standard solution of
GABA) was dried under vacuum. The residue was dissolved in 20 /microlitre
of ethanol-watertriethylamine (2:2:1) and evaporated to dryness under
vacuum. A 30-/ microlitre volume of ethanol-watertriethylamine- PITC (7:1 :
1 : 1) was added to the residue and allowed to react for 20 min at room
temperature to form PTC-GABA. Excess reagent was then removed under
vacuum. The standard curve for GABA was determined by applying the same
procedure to four standard solutions of GABA (0.125, 0.25, 0.50 and 0.75
mM GABA).
HPLC SEPARATION AND EVALUATION OF GABA
The dry residue containing PTC-GABA was dissolved in 100/ microlitre of
the mobile phase, consisting of a mixture of 80% solution A (aqueous
67
solution of 8.205 g sodium acetate, 0.5 ml triethylamine, 0.7 ml acetic acid
and 5.0 ml acetonitrile in 1000 ml) and 20% solution B [acetonitrile-water
(60:40)], adjusted to pH 5.8. Isocratic HPLC separations were performed on a
Shimadza (Japan) apparatus. HPLC system consists of Shimadza LC – 10
ATVP Pump, a manual injector, a diode array detector SPD – M10 AVP, a
column oven CTO – 10 CTO – 10 ASVP and system controller SCL –
10AVP. Luna c – 18column was used. The mobile phase for isocratic elution
was pumped at 0.6 ml/min, at room temperature; detection was at 254 nm.
PHYSIOLOGICAL MEASUREMENTS
RECORDING OF BLOOD PRESSURE, HEART RATE,
RESPIRATORY RATE
A. Blood Pressure- The mercury sphygmomanometer method which is
considered generally as the gold standard for recording BP (Dougherty L
2008) was used in the study to record BP. The subject was allowed to relax
and BP was recorded in the upper arm in the sitting posture. For the same
subject BP was recorded twice each time and the average of the two
recordings was taken as the reading. The measurements were taken by the
same qualified nurses during all visits to minimize inter observer variability.
B. Heart Rate- HR was recorded with the elbow and forearm resting
comfortably on a table and the palm of the hand turned upward and the radial
pulse was felt and counted for 1 minute exactly.
68
C. Respiratory Rate - Examiner's fingers were placed on the subject’s
abdomen and the number of breaths or respirations in one minute was recorded.
Effort was taken to prevent people from becoming aware that their breathing
was being checked.
STATISTICAL ANALYSIS
The reliability of the LCQ stress scale was studied by computing split half
reliability coefficient. The data was analyzed using SPSS - Version 11 (SPSS
Inc, Rostock, IL) statistical package.
The within group comparison for all the parameters was done by paired t test.
The difference in the mean values of all variables between groups was done by
applying ANCOVA (repeated measures) taking four levels of observation
(visits 1, 2, 3, 4).
Note: When the analysis is done with all the time points (within group)
together only the minimum number of cases observed at a particular point will
be considered at all points reducing the sample size at each point to very
small. Also replacement of the missing values by imputation method
especially when there are many missing values may not be very valid as
imputation method itself has a lot of criticism. Hence the within group
comparison has been done for the groups separately for time points 1&2,
1&3, 1&4 so that the maximum number of cases available can be considered
for the analysis.
69

Compliance: All subjects were followed up for a total duration of eight
months. A self-maintained diary assessed compliance in both the groups. All
the subjects in the IAM and PMR groups continued regular practice of these
techniques throughout the eight months period. Practicing the technique
minimum four times a week was taken as the standard of compliance. The
compliance was found to be 85.7% in IAM and 84.4% in PMR group.
70

RESULTS & DISCUSSION
8.1 PSYCHOLOGICAL QUESTIONNAIRES
LCQ
PSS
BDI
8.2 BIOCHEMICAL VARIABLES
CORTISOL
ADRENALINE
IgA
GABA
8.3 PHYSIOLOGICAL VARIABLES
BP
HR
RR
71
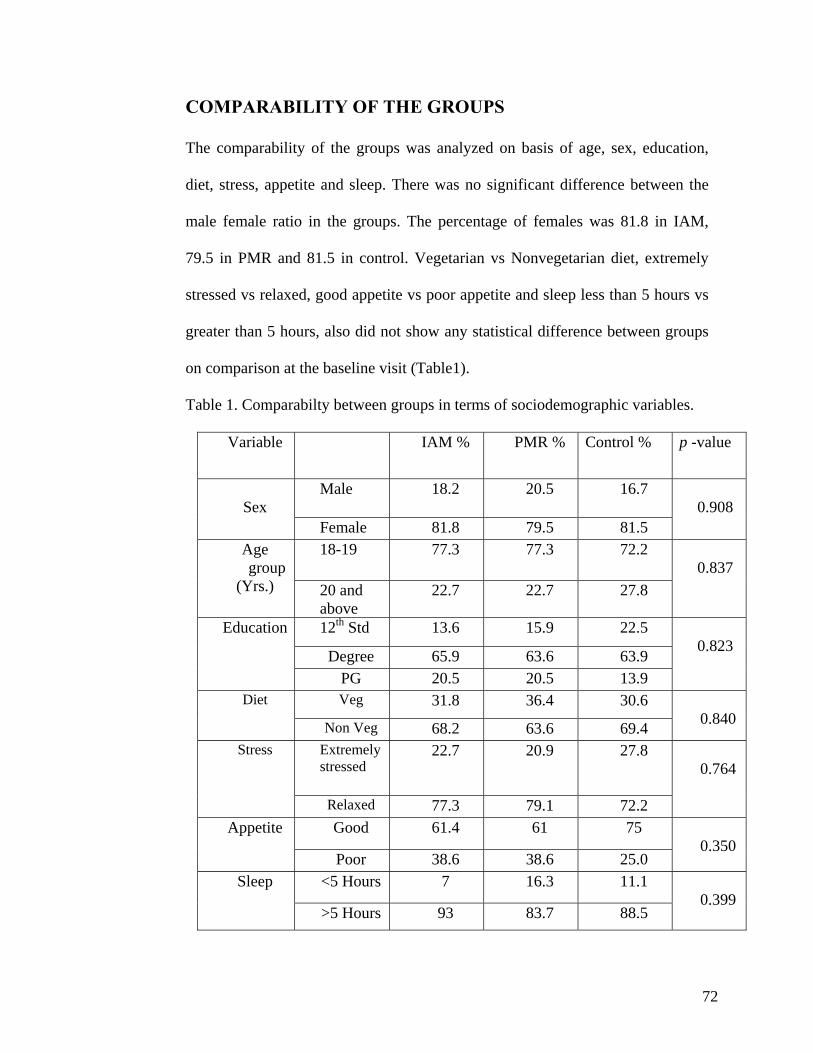
COMPARABILITY OF THE GROUPS
The comparability of the groups was analyzed on basis of age, sex, education,
diet, stress, appetite and sleep. There was no significant difference between the
male female ratio in the groups. The percentage of females was 81.8 in IAM,
79.5 in PMR and 81.5 in control. Vegetarian vs Nonvegetarian diet, extremely
stressed vs relaxed, good appetite vs poor appetite and sleep less than 5 hours vs
greater than 5 hours, also did not show any statistical difference between groups
on comparison at the baseline visit (Table1).
Table 1. Comparabilty between groups in terms of sociodemographic variables.
Variable IAM % PMR % Control % p -value
Male 18.2 20.5 16.7 Sex
Female 81.8 79.5 81.5
0.908
18-19 77.3 77.3 72.2 Age group
(Yrs.) 20 and above
22.7 22.7 27.8
0.837
12th Std 13.6 15.9 22.5
Degree 65.9 63.6 63.9
Education
PG 20.5 20.5 13.9
0.823
Veg 31.8 36.4 30.6 Diet
Non Veg 68.2 63.6 69.4
0.840
Extremely stressed
22.7 20.9 27.8 Stress
Relaxed 77.3 79.1 72.2
0.764
Good 61.4 61 75 Appetite
Poor 38.6 38.6 25.0
0.350
<5 Hours 7 16.3 11.1 Sleep
>5 Hours 93 83.7 88.5
0.399
72
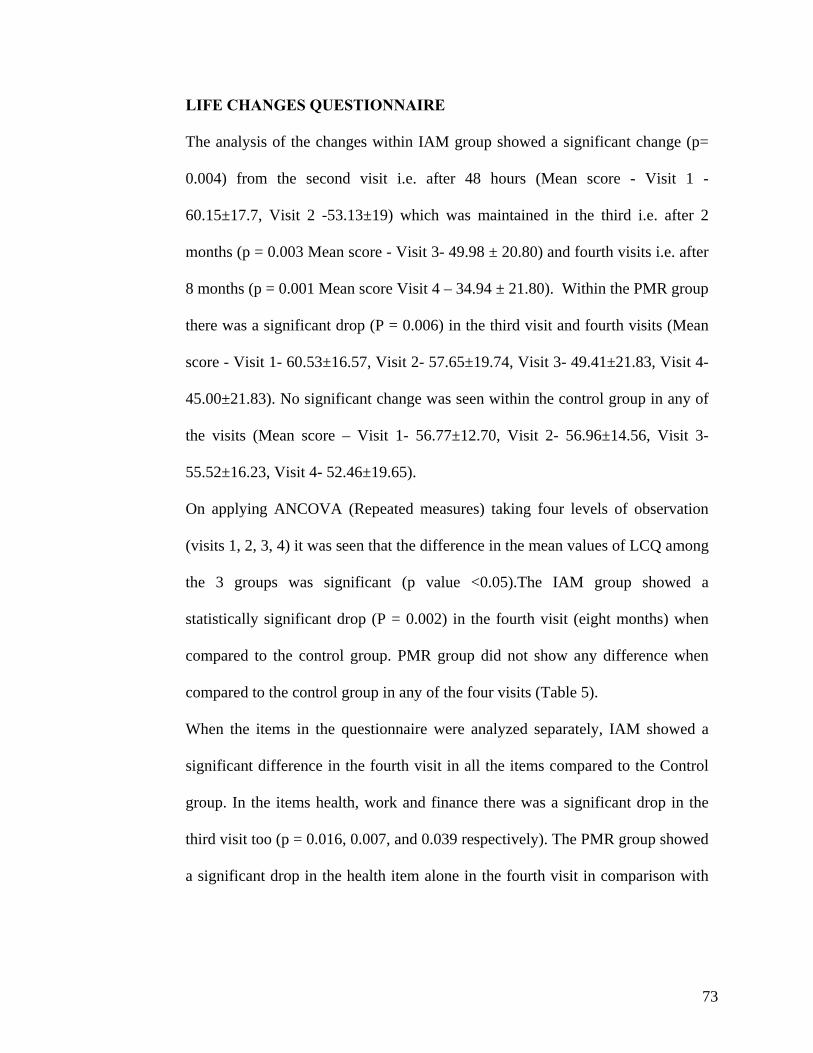
LIFE CHANGES QUESTIONNAIRE
The analysis of the changes within IAM group showed a significant change (p=
0.004) from the second visit i.e. after 48 hours (Mean score - Visit 1 -
60.15±17.7, Visit 2 -53.13±19) which was maintained in the third i.e. after 2
months (p = 0.003 Mean score - Visit 3- 49.98 ± 20.80) and fourth visits i.e. after
8 months (p = 0.001 Mean score Visit 4 – 34.94 ± 21.80). Within the PMR group
there was a significant drop (P = 0.006) in the third visit and fourth visits (Mean
score - Visit 1- 60.53±16.57, Visit 2- 57.65±19.74, Visit 3- 49.41±21.83, Visit 4-
45.00±21.83). No significant change was seen within the control group in any of
the visits (Mean score – Visit 1- 56.77±12.70, Visit 2- 56.96±14.56, Visit 3-
55.52±16.23, Visit 4- 52.46±19.65).
On applying ANCOVA (Repeated measures) taking four levels of observation
(visits 1, 2, 3, 4) it was seen that the difference in the mean values of LCQ among
the 3 groups was significant (p value <0.05).The IAM group showed a
statistically significant drop (P = 0.002) in the fourth visit (eight months) when
compared to the control group. PMR group did not show any difference when
compared to the control group in any of the four visits (Table 5).
When the items in the questionnaire were analyzed separately, IAM showed a
significant difference in the fourth visit in all the items compared to the Control
group. In the items health, work and finance there was a significant drop in the
third visit too (p = 0.016, 0.007, and 0.039 respectively). The PMR group showed
a significant drop in the health item alone in the fourth visit in comparison with
73
the control. No significant difference was seen between the IAM and PMR
groups in any of the visits (Table 5).
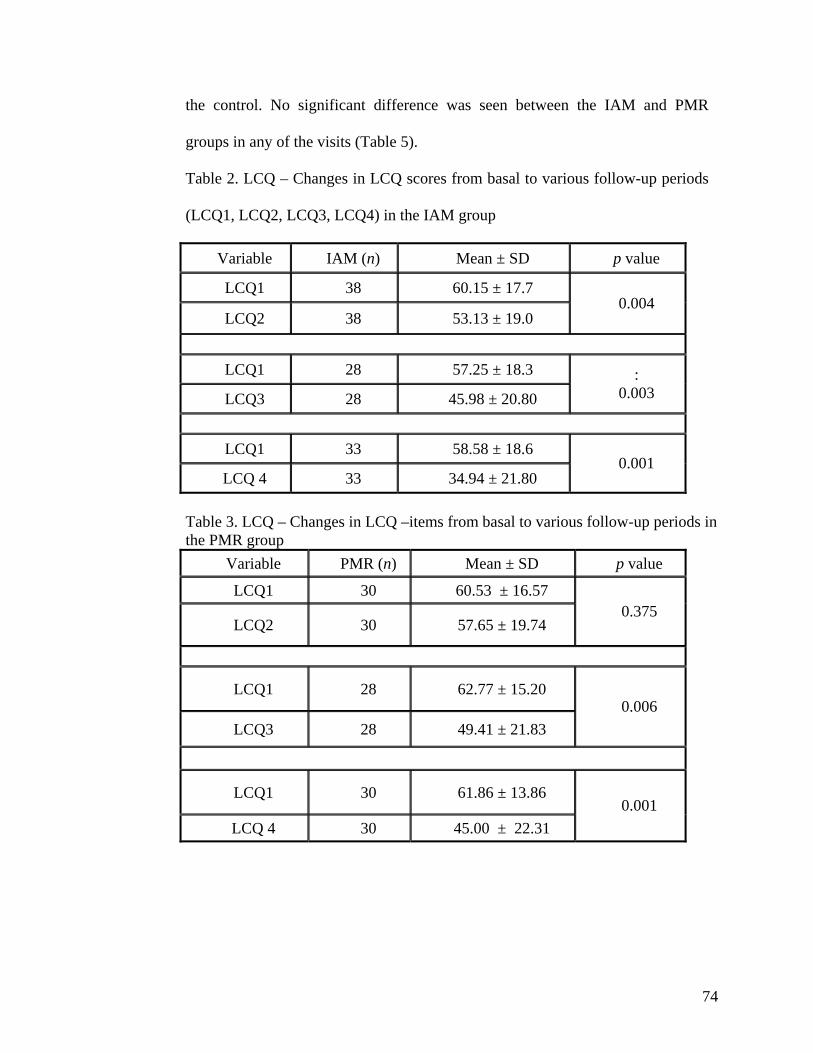
Table 2. LCQ – Changes in LCQ scores from basal to various follow-up periods
(LCQ1, LCQ2, LCQ3, LCQ4) in the IAM group
Variable IAM (n) Mean ± SD p value
LCQ1 38 60.15 ± 17.7
LCQ2 38 53.13 ± 19.0 0.004
LCQ1 28 57.25 ± 18.3
LCQ3 28 45.98 ± 20.80 :
0.003
LCQ1 33 58.58 ± 18.6
LCQ 4 33 34.94 ± 21.80 0.001
Table 3. LCQ – Changes in LCQ –items from basal to various follow-up periods in the PMR group
Variable PMR (n) Mean ± SD p value
LCQ1 30 60.53 ± 16.57
LCQ2 30 57.65 ± 19.74 0.375
LCQ1 28 62.77 ± 15.20
LCQ3 28 49.41 ± 21.83 0.006
LCQ1 30 61.86 ± 13.86
LCQ 4 30 45.00 ± 22.31 0.001
74
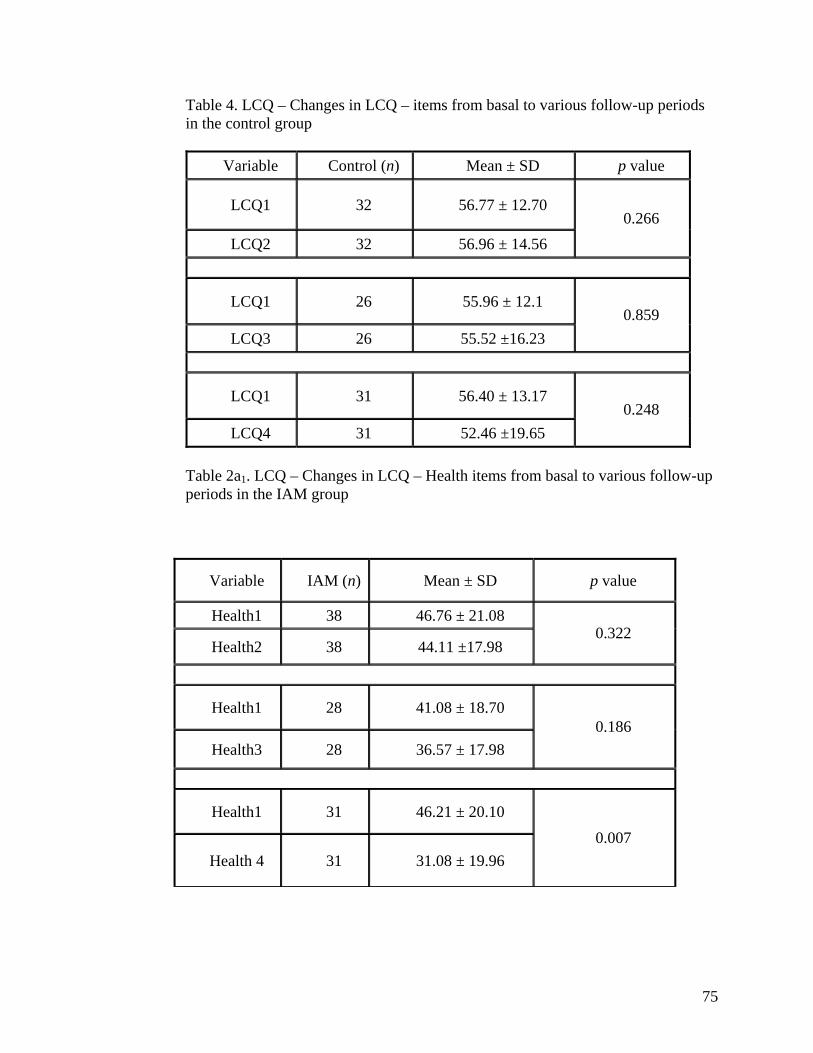
Table 4. LCQ – Changes in LCQ – items from basal to various follow-up periods in the control group
Variable Control (n) Mean ± SD p value
LCQ1 32 56.77 ± 12.70
LCQ2 32 56.96 ± 14.56 0.266
LCQ1 26 55.96 ± 12.1
LCQ3 26 55.52 ±16.23 0.859
LCQ1 31 56.40 ± 13.17
LCQ4 31 52.46 ±19.65 0.248
Table 2a1. LCQ – Changes in LCQ – Health items from basal to various follow-up periods in the IAM group
Variable IAM (n) Mean ± SD p value
Health1 38 46.76 ± 21.08
Health2 38 44.11 ±17.98 0.322
Health1 28 41.08 ± 18.70
Health3 28 36.57 ± 17.98 0.186
Health1 31 46.21 ± 20.10
Health 4 31 31.08 ± 19.96 0.007
75
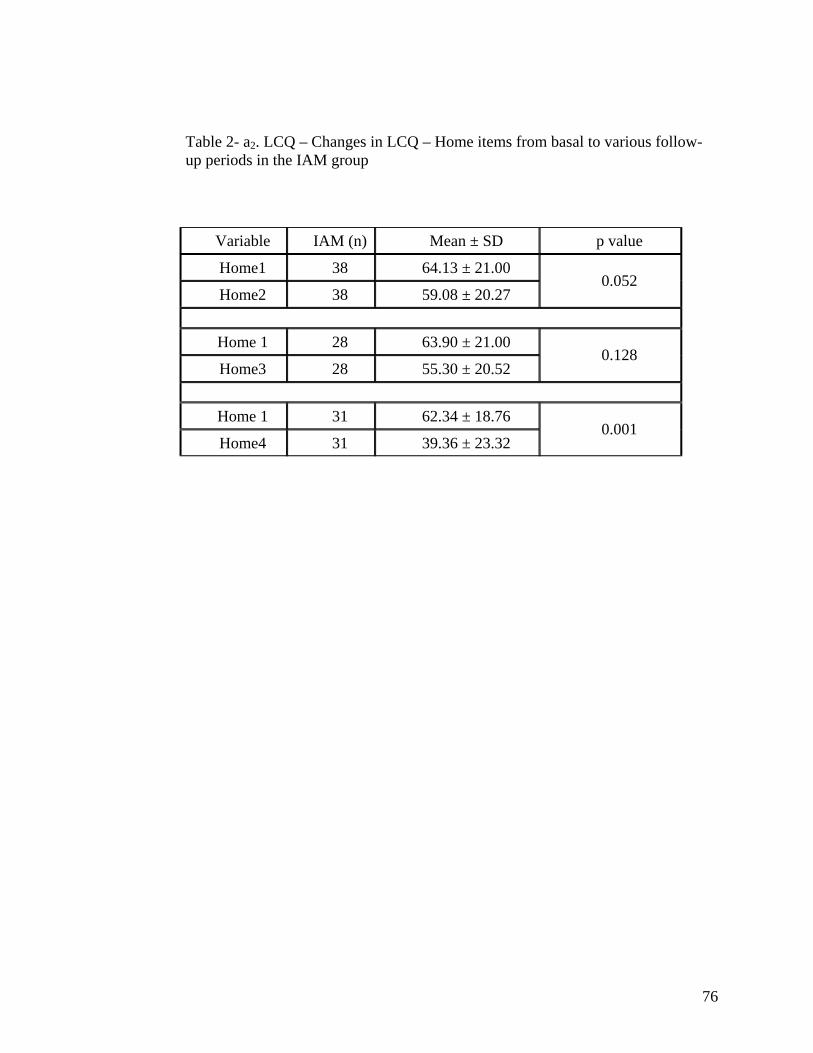
Table 2- a2. LCQ – Changes in LCQ – Home items from basal to various follow-up periods in the IAM group
Variable IAM (n) Mean ± SD p value
Home1 38 64.13 ± 21.00
Home2 38 59.08 ± 20.27 0.052
Home 1 28 63.90 ± 21.00
Home3 28 55.30 ± 20.52 0.128
Home 1 31 62.34 ± 18.76
Home4 31 39.36 ± 23.32 0.001
76
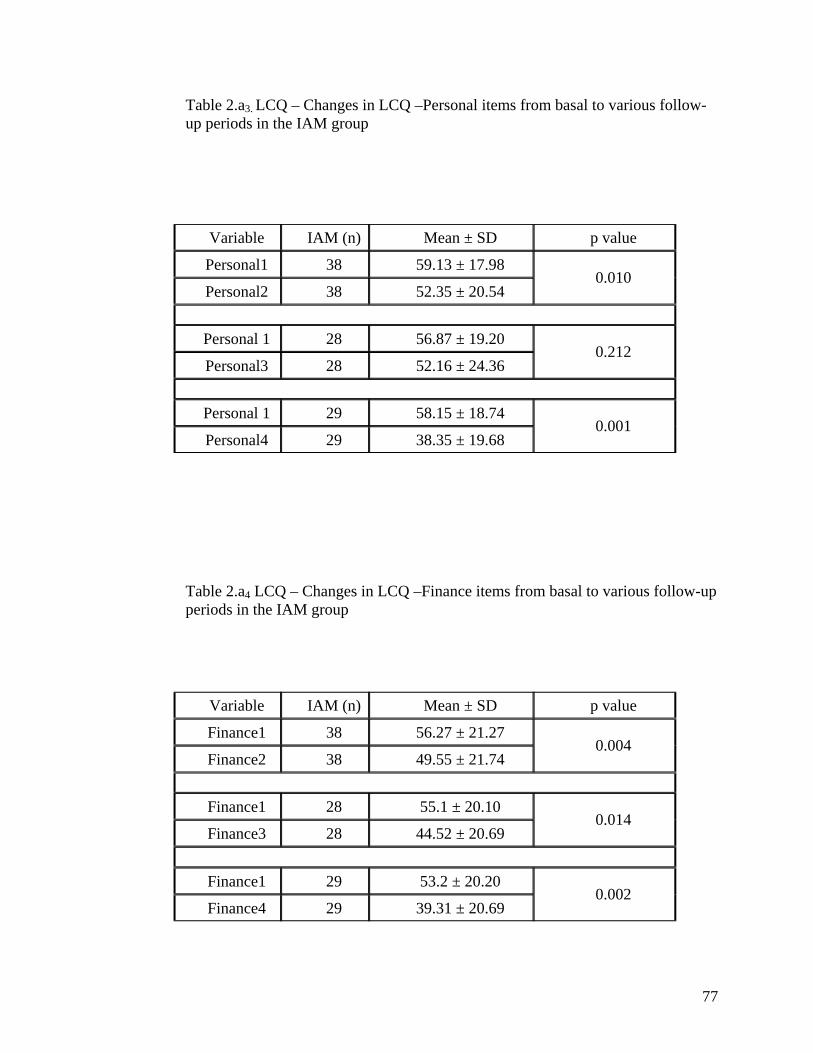
Table 2.a3. LCQ – Changes in LCQ –Personal items from basal to various follow-up periods in the IAM group
Variable IAM (n) Mean ± SD p value
Personal1 38 59.13 ± 17.98
Personal2 38 52.35 ± 20.54 0.010
Personal 1 28 56.87 ± 19.20
Personal3 28 52.16 ± 24.36 0.212
Personal 1 29 58.15 ± 18.74
Personal4 29 38.35 ± 19.68 0.001
Table 2.a4 LCQ – Changes in LCQ –Finance items from basal to various follow-up periods in the IAM group
Variable IAM (n) Mean ± SD p value
Finance1 38 56.27 ± 21.27
Finance2 38 49.55 ± 21.74 0.004
Finance1 28 55.1 ± 20.10
Finance3 28 44.52 ± 20.69 0.014
Finance1 29 53.2 ± 20.20
Finance4 29 39.31 ± 20.69 0.002
77
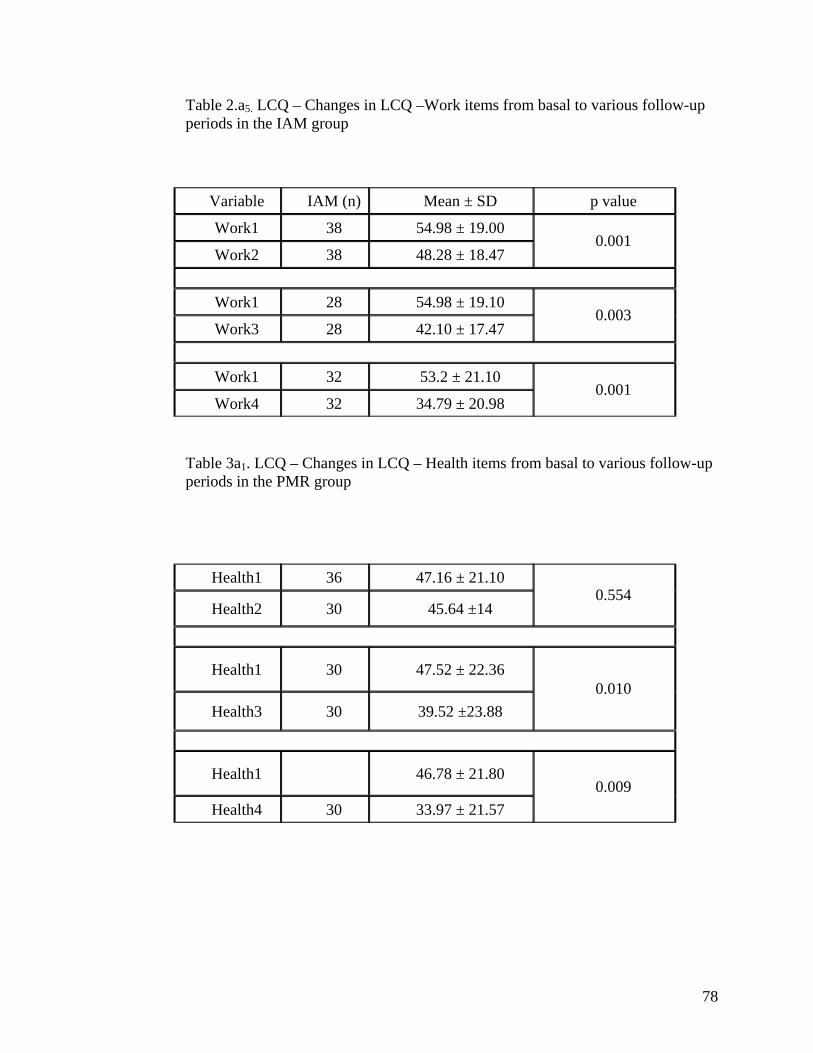
Table 2.a5. LCQ – Changes in LCQ –Work items from basal to various follow-up periods in the IAM group
Variable IAM (n) Mean ± SD p value
Work1 38 54.98 ± 19.00
Work2 38 48.28 ± 18.47 0.001
Work1 28 54.98 ± 19.10
Work3 28 42.10 ± 17.47 0.003
Work1 32 53.2 ± 21.10
Work4 32 34.79 ± 20.98 0.001
Table 3a1. LCQ – Changes in LCQ – Health items from basal to various follow-up periods in the PMR group
Health1 36 47.16 ± 21.10
Health2 30 45.64 ±14 0.554
Health1 30 47.52 ± 22.36
Health3 30 39.52 ±23.88 0.010
Health1 46.78 ± 21.80
Health4 30 33.97 ± 21.57 0.009
78
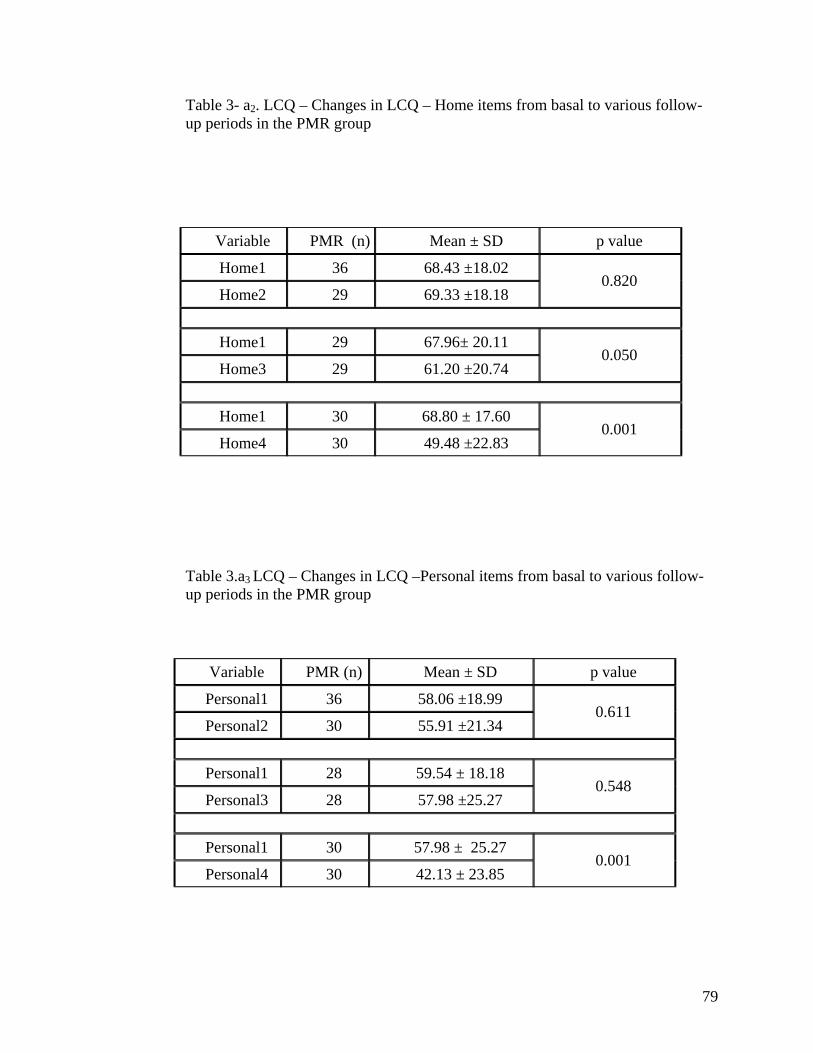
Table 3- a2. LCQ – Changes in LCQ – Home items from basal to various follow-up periods in the PMR group
Variable PMR (n) Mean ± SD p value
Home1 36 68.43 ±18.02
Home2 29 69.33 ±18.18 0.820
Home1 29 67.96± 20.11
Home3 29 61.20 ±20.74 0.050
Home1 30 68.80 ± 17.60
Home4 30 49.48 ±22.83 0.001
Table 3.a3 LCQ – Changes in LCQ –Personal items from basal to various follow-up periods in the PMR group
Variable PMR (n) Mean ± SD p value
Personal1 36 58.06 ±18.99
Personal2 30 55.91 ±21.34 0.611
Personal1 28 59.54 ± 18.18
Personal3 28 57.98 ±25.27 0.548
Personal1 30 57.98 ± 25.27
Personal4 30 42.13 ± 23.85 0.001
79
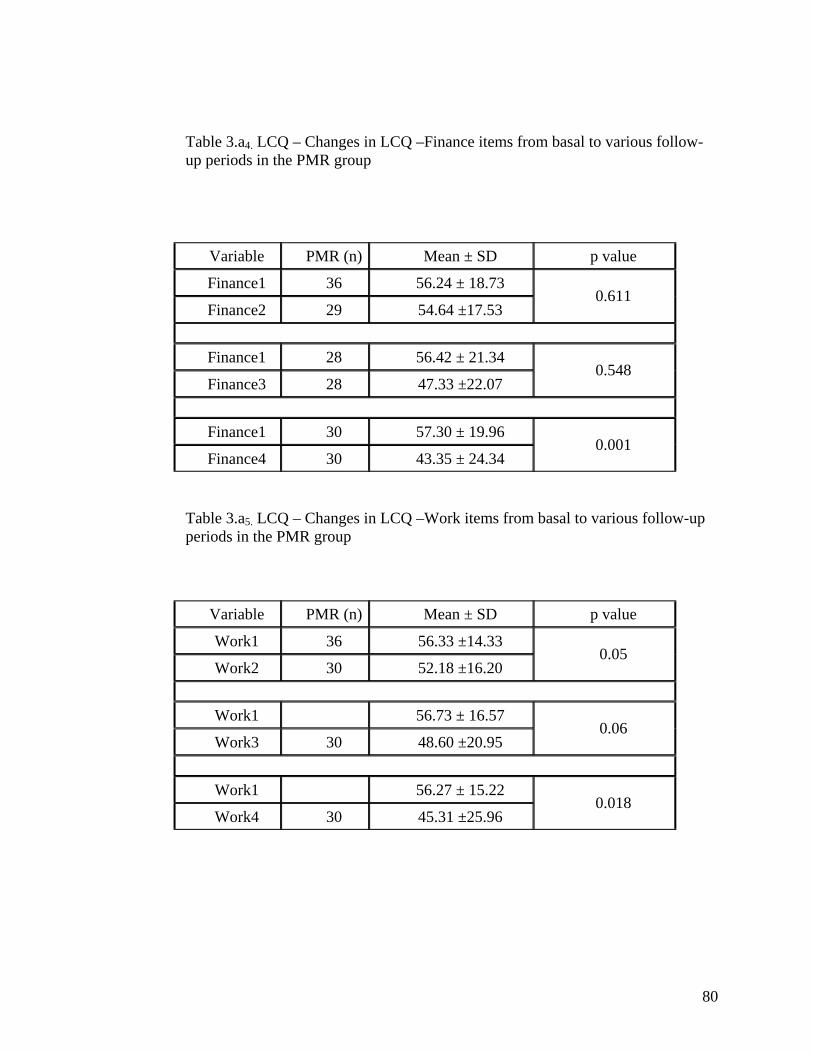
Table 3.a4. LCQ – Changes in LCQ –Finance items from basal to various follow-up periods in the PMR group
Variable PMR (n) Mean ± SD p value
Finance1 36 56.24 ± 18.73
Finance2 29 54.64 ±17.53 0.611
Finance1 28 56.42 ± 21.34
Finance3 28 47.33 ±22.07 0.548
Finance1 30 57.30 ± 19.96
Finance4 30 43.35 ± 24.34 0.001
Table 3.a5. LCQ – Changes in LCQ –Work items from basal to various follow-up periods in the PMR group
Variable PMR (n) Mean ± SD p value
Work1 36 56.33 ±14.33
Work2 30 52.18 ±16.20 0.05
Work1 56.73 ± 16.57
Work3 30 48.60 ±20.95 0.06
Work1 56.27 ± 15.22
Work4 30 45.31 ±25.96 0.018
80
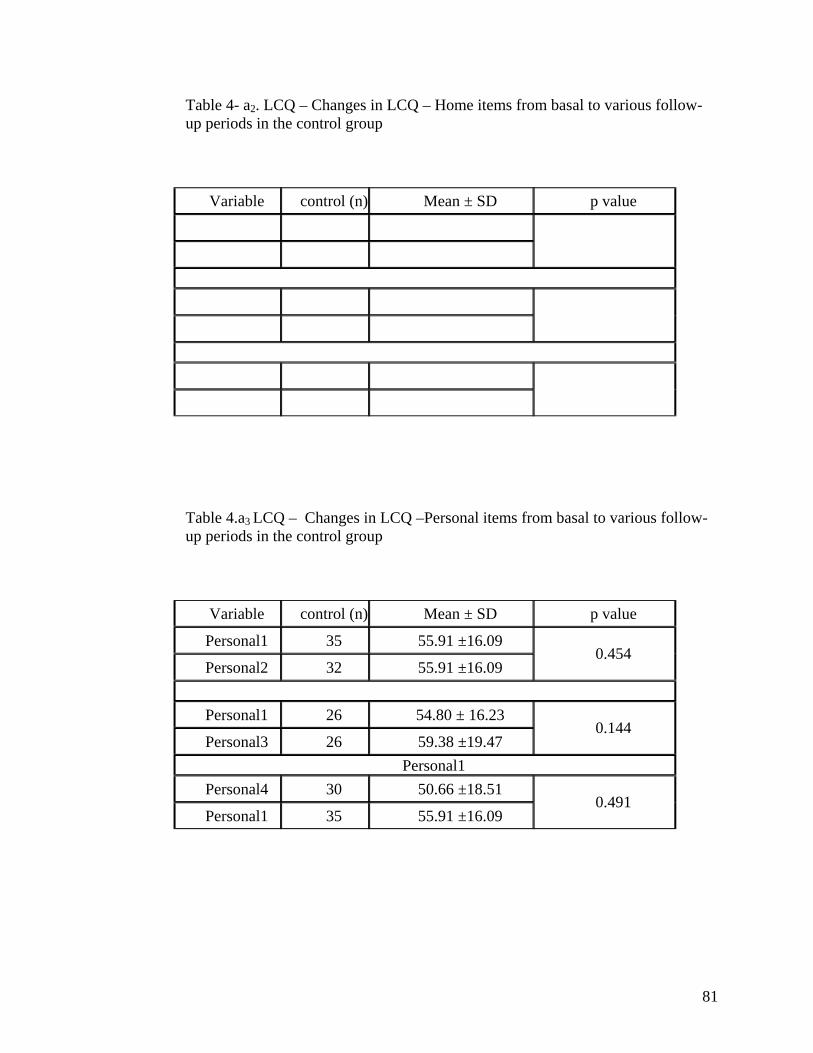
Table 4- a2. LCQ – Changes in LCQ – Home items from basal to various follow-up periods in the control group
Variable control (n) Mean ± SD p value
Table 4.a3 LCQ – Changes in LCQ –Personal items from basal to various follow-up periods in the control group
Variable control (n) Mean ± SD p value
Personal1 35 55.91 ±16.09
Personal2 32 55.91 ±16.09 0.454
Personal1 26 54.80 ± 16.23
Personal3 26 59.38 ±19.47 0.144
Personal1 Personal4 30 50.66 ±18.51
Personal1 35 55.91 ±16.09 0.491
81
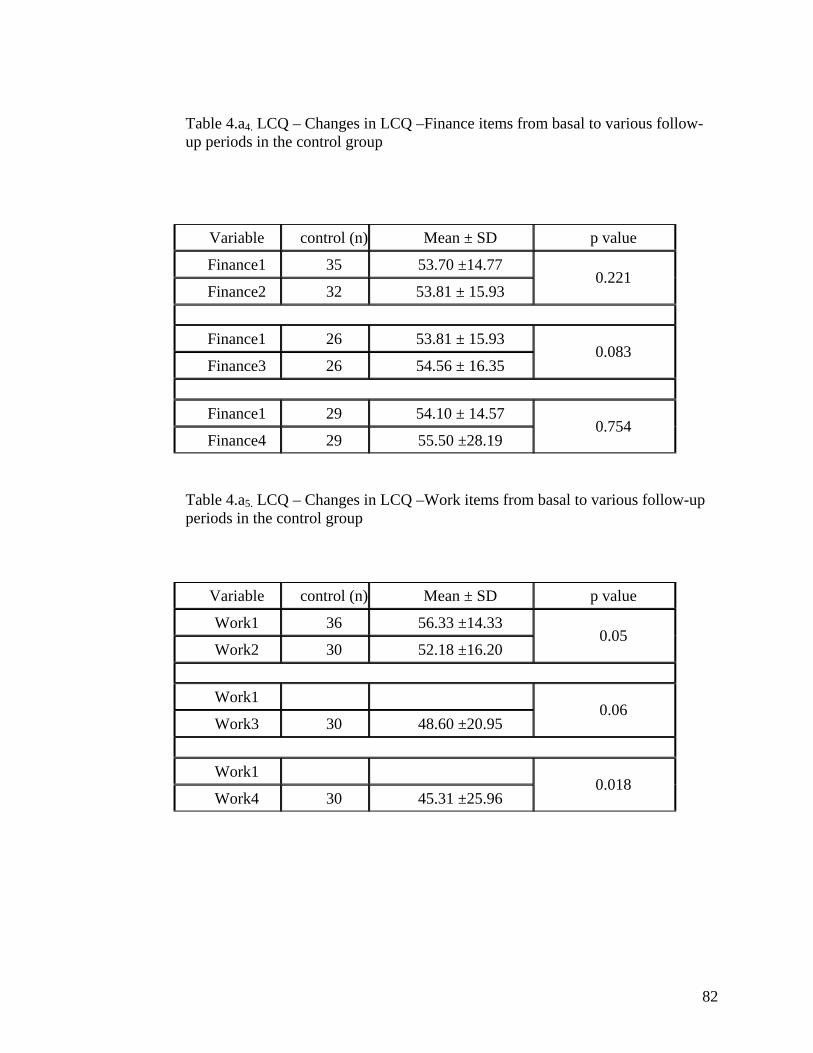
Table 4.a4. LCQ – Changes in LCQ –Finance items from basal to various follow-up periods in the control group
Variable control (n) Mean ± SD p value
Finance1 35 53.70 ±14.77
Finance2 32 53.81 ± 15.93 0.221
Finance1 26 53.81 ± 15.93
Finance3 26 54.56 ± 16.35 0.083
Finance1 29 54.10 ± 14.57
Finance4 29 55.50 ±28.19 0.754
Table 4.a5. LCQ – Changes in LCQ –Work items from basal to various follow-up periods in the control group
Variable control (n) Mean ± SD p value
Work1 36 56.33 ±14.33
Work2 30 52.18 ±16.20 0.05
Work1
Work3 30 48.60 ±20.95 0.06
Work1
Work4 30 45.31 ±25.96 0.018
82
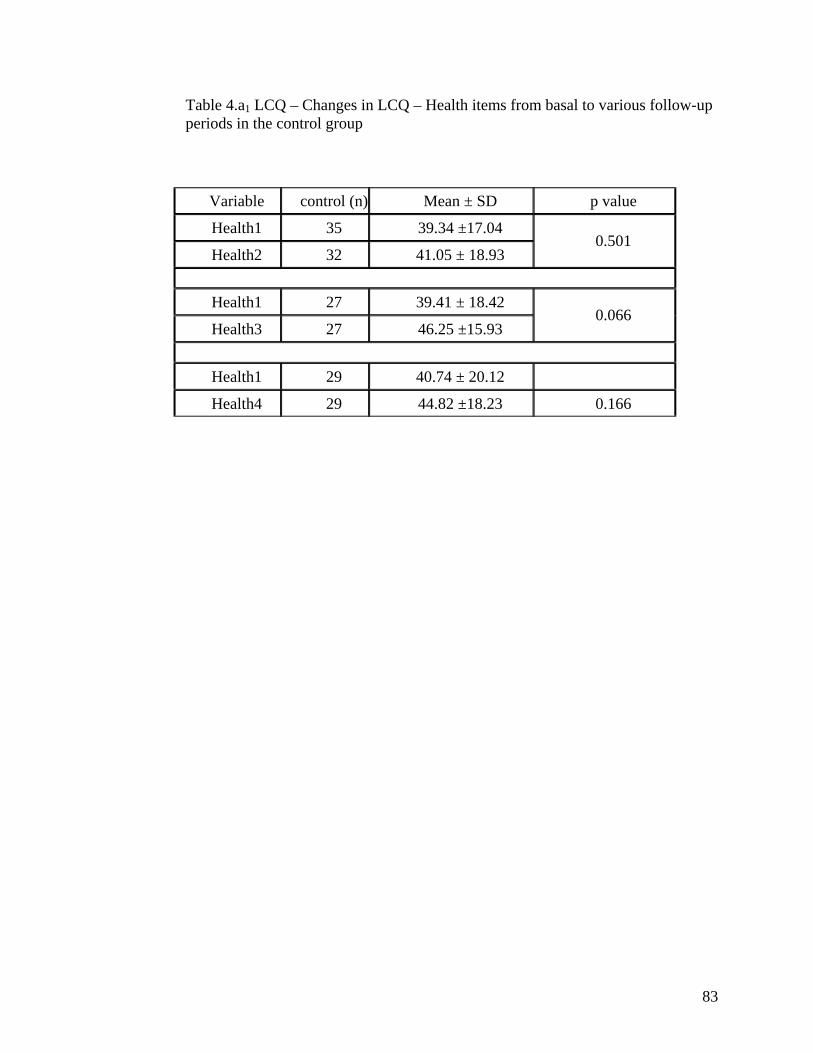
Table 4.a1 LCQ – Changes in LCQ – Health items from basal to various follow-up periods in the control group
Variable control (n) Mean ± SD p value
Health1 35 39.34 ±17.04
Health2 32 41.05 ± 18.93 0.501
Health1 27 39.41 ± 18.42
Health3 27 46.25 ±15.93 0.066
Health1 29 40.74 ± 20.12
Health4 29 44.82 ±18.23 0.166
83
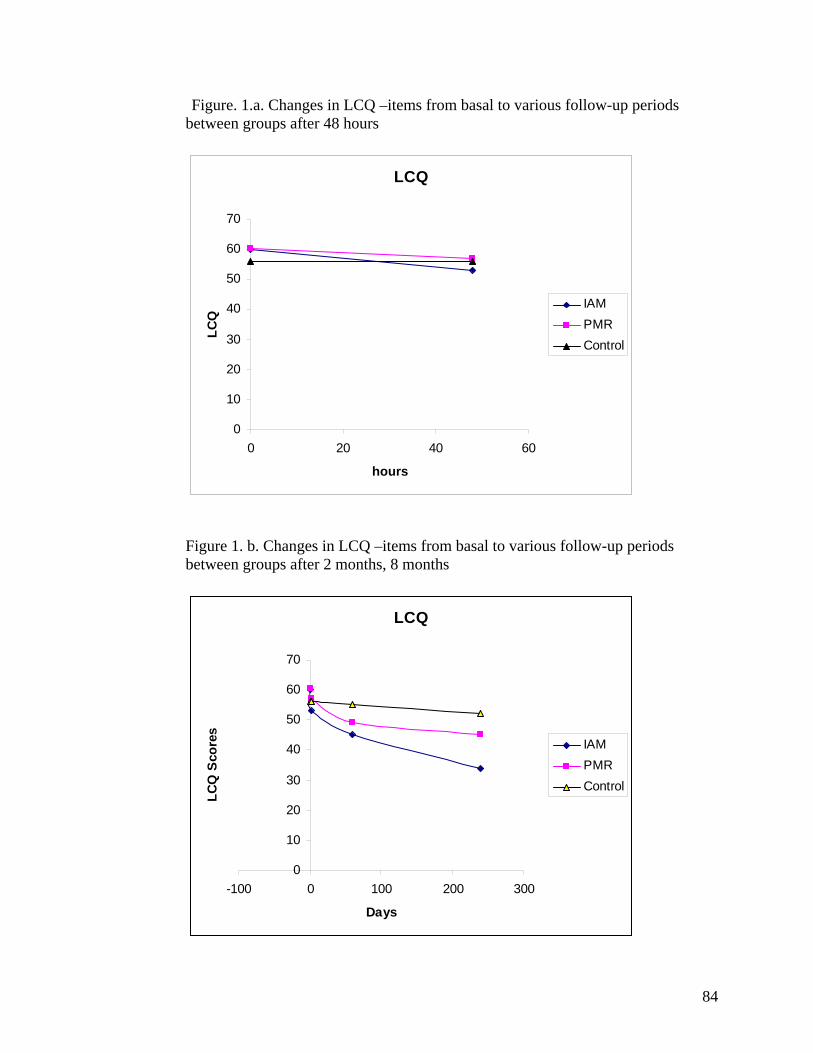
Figure. 1.a. Changes in LCQ –items from basal to various follow-up periods between groups after 48 hours
LCQ
0
10
20
30
40
50
60
70
0 20 40 60
hours
LCQ
IAMPMRControl
Figure 1. b. Changes in LCQ –items from basal to various follow-up periods between groups after 2 months, 8 months
LCQ
0
10
20
30
40
50
60
70
-100 0 100 200 300
Days
LCQ
Sco
res
IAMPMRControl
84
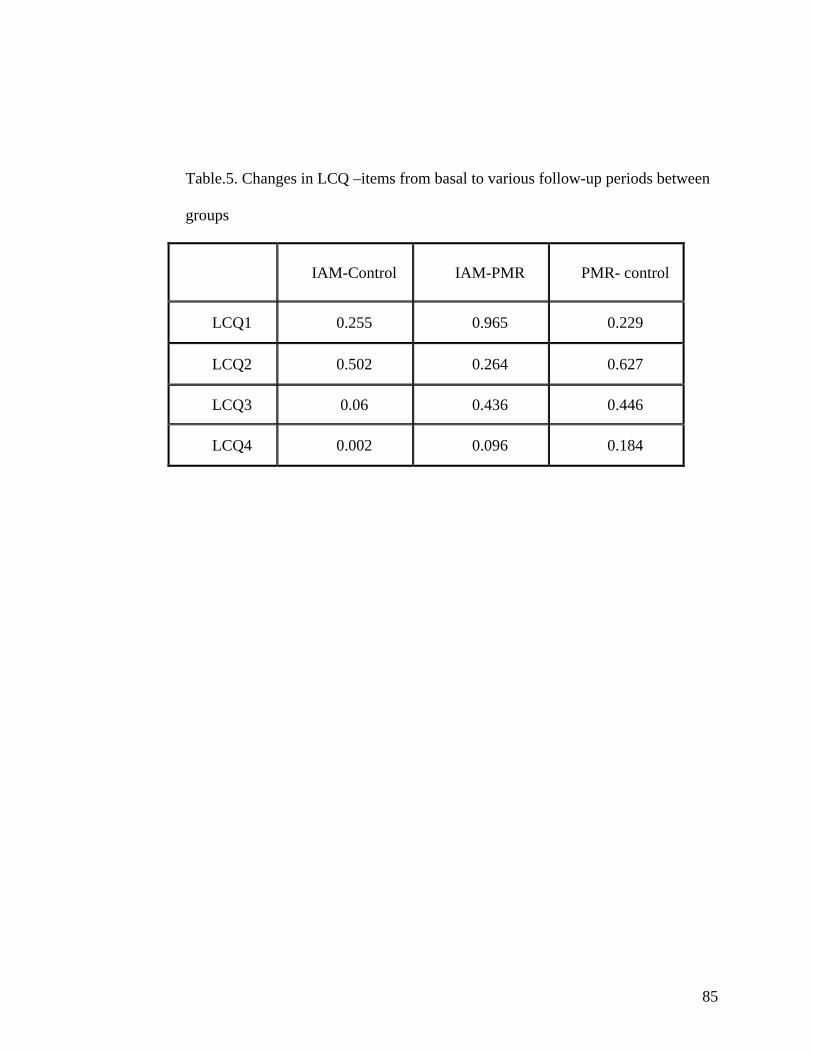
Table.5. Changes in LCQ –items from basal to various follow-up periods between
groups
IAM-Control IAM-PMR PMR- control
LCQ1 0.255 0.965 0.229
LCQ2 0.502 0.264 0.627
LCQ3 0.06 0.436 0.446
LCQ4 0.002 0.096 0.184
85
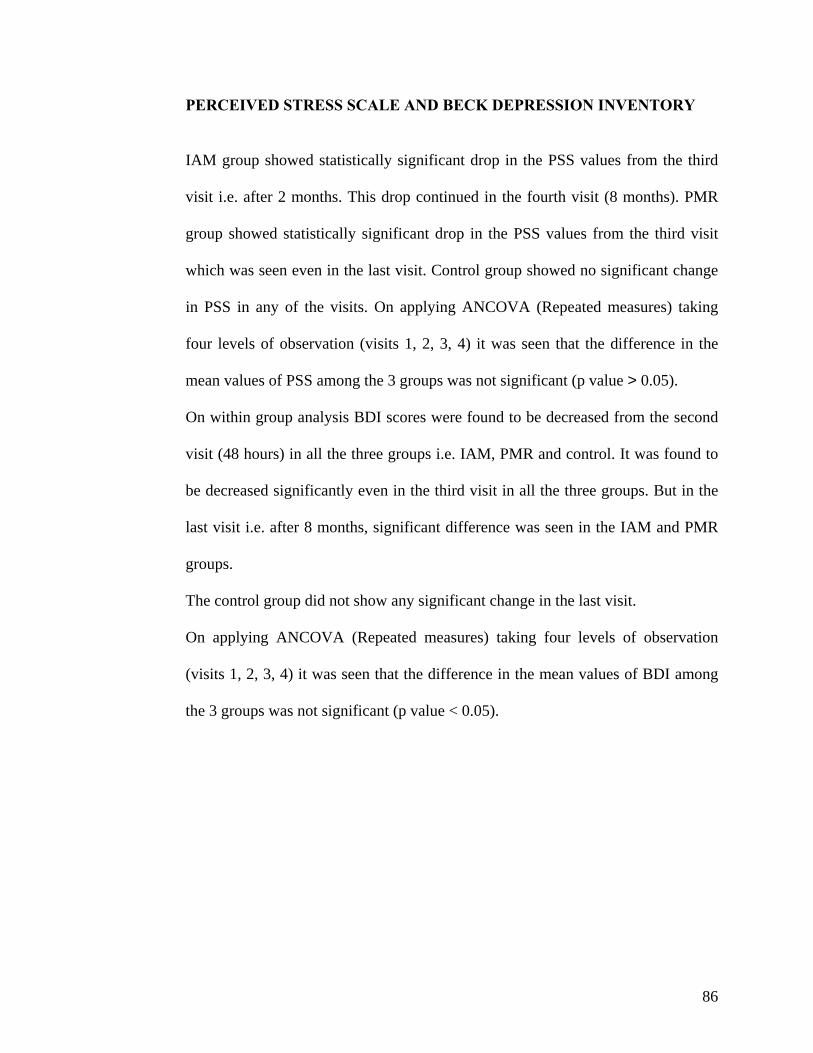
PERCEIVED STRESS SCALE AND BECK DEPRESSION INVENTORY
IAM group showed statistically significant drop in the PSS values from the third
visit i.e. after 2 months. This drop continued in the fourth visit (8 months). PMR
group showed statistically significant drop in the PSS values from the third visit
which was seen even in the last visit. Control group showed no significant change
in PSS in any of the visits. On applying ANCOVA (Repeated measures) taking
four levels of observation (visits 1, 2, 3, 4) it was seen that the difference in the
mean values of PSS among the 3 groups was not significant (p value > 0.05).
On within group analysis BDI scores were found to be decreased from the second
visit (48 hours) in all the three groups i.e. IAM, PMR and control. It was found to
be decreased significantly even in the third visit in all the three groups. But in the
last visit i.e. after 8 months, significant difference was seen in the IAM and PMR
groups.
The control group did not show any significant change in the last visit.
On applying ANCOVA (Repeated measures) taking four levels of observation
(visits 1, 2, 3, 4) it was seen that the difference in the mean values of BDI among
the 3 groups was not significant (p value < 0.05).
86
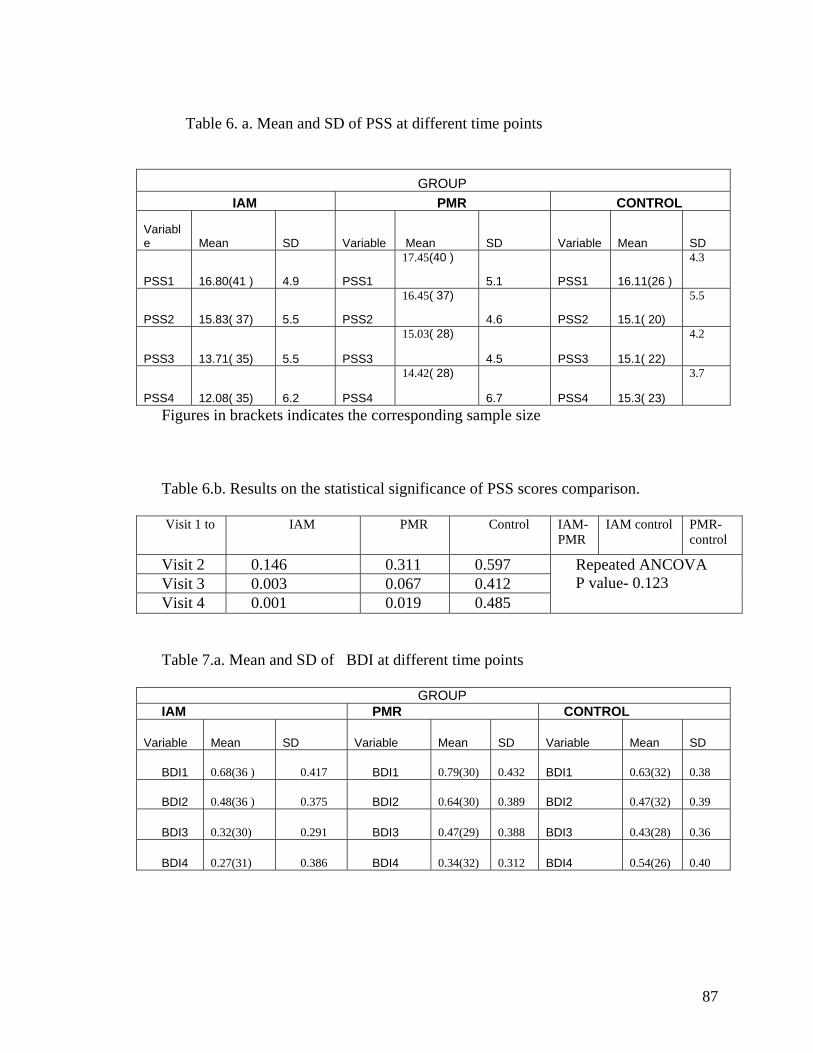
Table 6. a. Mean and SD of PSS at different time points
GROUP IAM PMR CONTROL
Variable Mean SD Variable Mean SD Variable Mean SD
PSS1 16.80(41 ) 4.9 PSS1
17.45(40 )
5.1 PSS1 16.11(26 )
4.3
PSS2 15.83( 37) 5.5 PSS2
16.45( 37)
4.6 PSS2 15.1( 20)
5.5
PSS3 13.71( 35) 5.5 PSS3
15.03( 28)
4.5 PSS3 15.1( 22)
4.2
PSS4 12.08( 35) 6.2 PSS4
14.42( 28)
6.7 PSS4 15.3( 23)
3.7
Figures in brackets indicates the corresponding sample size Table 6.b. Results on the statistical significance of PSS scores comparison. Visit 1 to IAM PMR Control IAM-
PMR IAM control PMR-
control
Visit 2 0.146 0.311 0.597 Visit 3 0.003 0.067 0.412 Visit 4 0.001 0.019 0.485
Repeated ANCOVA P value- 0.123
Table 7.a. Mean and SD of BDI at different time points
GROUP IAM PMR CONTROL
Variable Mean SD Variable Mean SD Variable Mean SD
BDI1 0.68(36 ) 0.417 BDI1 0.79(30) 0.432 BDI1 0.63(32) 0.38
BDI2 0.48(36 ) 0.375 BDI2 0.64(30) 0.389 BDI2 0.47(32) 0.39
BDI3 0.32(30) 0.291 BDI3 0.47(29) 0.388 BDI3 0.43(28) 0.36
BDI4 0.27(31) 0.386 BDI4 0.34(32) 0.312 BDI4 0.54(26) 0.40
87
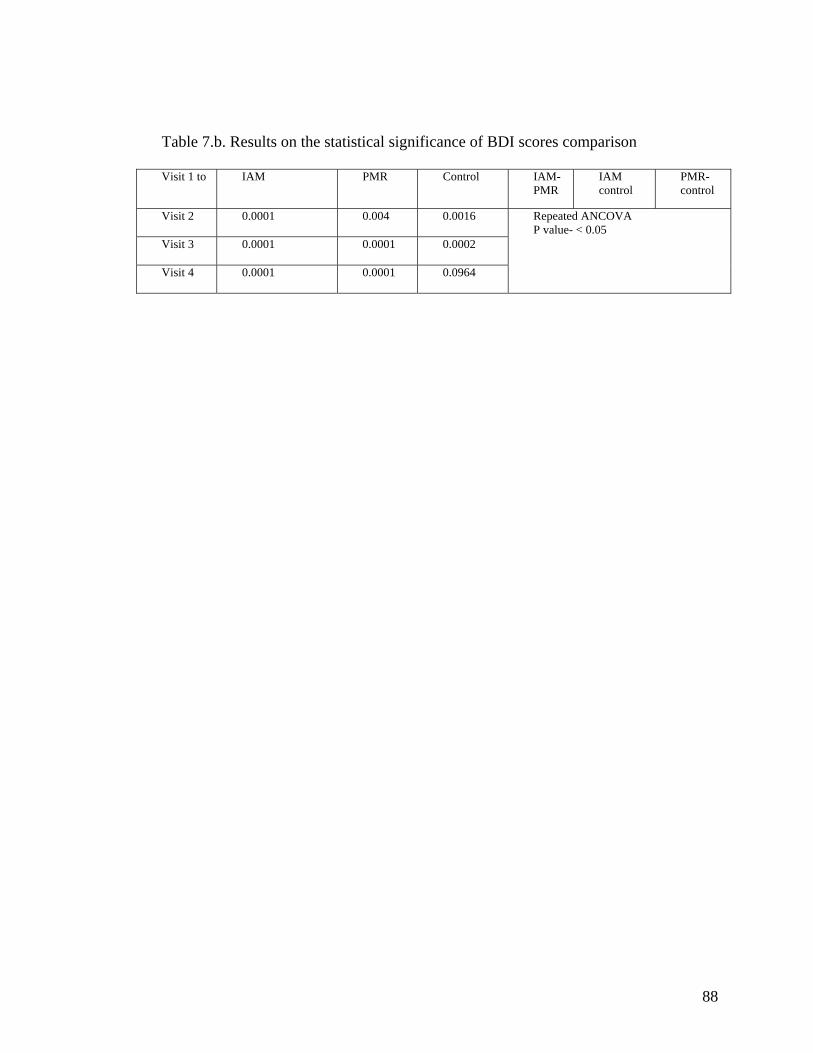
Table 7.b. Results on the statistical significance of BDI scores comparison
Visit 1 to IAM PMR Control IAM- PMR
IAM control
PMR-control
Visit 2 0.0001 0.004
0.0016
Visit 3 0.0001 0.0001 0.0002
Visit 4 0.0001 0.0001 0.0964
Repeated ANCOVA P value- < 0.05
88