Embed Size (px)
Citation preview
CY 2017 OPPS/ASC Proposed Rule
Medicare CY 2017 Outpatient Prospective Payment System (OPPS)
Proposed Rule Claims Accounting
Calculating OPPS payment rates consists of calculating relative resource costs for OPPS services
and calculating budget neutrality adjustments, which are applied to estimates of resource cost
and the conversion factor to create a budget neutral prospective payment system. The purpose of
the following discussion is to provide a detailed overview of CMS manipulation of the CY 2015
claims data to produce the proposed prospective CY 2017 OPPS payment rates. The following
information supports an already detailed discussion of data manipulation in the CY 2017
OPPS/ASC proposed rule. This discussion is divided into two parts: the traditional accounting
of claims behind the cost calculations and an accounting of claims behind the budget neutrality,
outlier, and impact calculations.
PART 1 - COST CALCULATIONS
CMS used information from 78 million single procedure (natural single), generated single
procedure (pseudo single), and generated single “session” composite claim records to set the
proposed Ambulatory Payment Classification (APC) rates to be paid under Medicare OPPS for
CY 2017.1
For the CY 2017 OPPS, we retained all HCPCS codes on the CY 2016 bypass list and proposed
to include HCPCS codes that are not on the CY 2016 bypass list that, using either CY 2016
OPPS final rule or March 2016 HOP Panel data, met the established empirical criteria for
inclusion on the bypass list. We note that, under the CY 2017 proposed packaging policy, we are
proposing to remove codes from the bypass list that we conditionally or unconditionally
packaged in the CY 2017 OPPS. We typically include codes on the bypass list that violate our
empirical criteria in response to public comment recommending certain codes be added to the
bypass list and when our clinicians believe that the service to be added would rarely have
1 Proposed CY 2017 rates are based on 2015 calendar year outpatient claims data, specifically final action claims processed through the common working file as of December 31, 2015.
1
CY 2017 OPPS/ASC Proposed Rule
packaging and that any packaging associated with the service would be very limited due to the
clinical nature of the service.
Attached is a narrative description of the accounting of claims used in the setting of payment
rates for Medicare’s 2017 Outpatient Prospective Payment System (OPPS). For the CY 2017
OPPS, we are proposing to continue to develop relative payment weights using APC geometric
mean costs.
As described in detail in the material that follows, geometric mean costs were calculated from
claims for services paid under the Medicare OPPS and cost report data for the hospitals whose
claims were used. The geometric mean costs were converted to payment weights by dividing the
geometric mean for each APC (a group of HCPCS codes) by the geometric mean cost for
proposed APC 5012, the outpatient clinic visit APC in CY 2017. As discussed in Part 2 below,
the resulting unscaled weights were scaled for budget neutrality to ensure that the recalibration of
APC weights for CY 2017 does not increase total OPPS spending. The scaled weights were
multiplied by the proposed CY 2017 OPPS conversion factor to determine the proposed national
unadjusted payment rate for the CY 2017 APCs. Calculation of payment rates for drugs and
biologicals are an exception, as their payment rates are a percentage of average sales price and
are not scaled.
We note that in section III.D. of the CY 2017 OPPS/ASC proposed rule, we are updating the
APC structure for several clinical areas. In addition, we are updating the APC numbers to which
HCPCS codes are assigned to establish a more organized structure.
This section of the claims accounting narrative is intended to help the public understand the
order in which CMS processed claims to produce the proposed CY 2017 OPPS geometric mean
costs and the reasons that not all claims could be used.
General Information:
To calculate the APC costs that form the basis of OPPS payment rates, CMS must isolate the
specific resources associated with a single unique payable procedure (which has a HCPCS code)
2
CY 2017 OPPS/ASC Proposed Rule
in each APC. Much of the following description, Pre-STAGE 1 through STAGE 3, covers the
activity by which CMS:
1) Extracts the direct charge (i.e. a charge on a line with a separately paid HCPCS code)
and the supporting charge(s) (i.e. a charge on a line with a packaged HCPCS or packaged
revenue code) for a single, major payable procedure for one unit of the procedure and
2) Packages the supporting charges with the charges for the single unit of the major
procedure to acquire a full charge for the single unit of the major procedure.
In order to calculate the costs for composite APCs, CMS must isolate the specific resources
associated with a single “session” of the composite service. Although these single session claims
have more than one payable service, the direct charge for these services would be combined with
supporting packaged charges to identify a full charge for the composite session.
CMS estimates resource costs from the billed charges by applying a cost-to-charge ratio (CCR)
to adjust the charges to cost. CMS uses the most recent CCRs in the CMS Hospital Cost Report
Information System (HCRIS) file in the calculation of the payment weights (in most cases, CCRs
based on cost reports beginning in CY 2014). Wherever possible, department CCRs rather than
each hospital’s overall CCR are applied to charges with related revenue codes (e.g. pharmacy
CCR applied to charges with a pharmacy revenue code). The order of matching department
CCRs to revenue codes is laid out in the OPPS revenue code-to-cost center crosswalk
(http://www.cms.gov/Medicare/Medicare-Fee-for-Service-Payment/HospitalOutpatientPPS/). In
general, CMS carries the following data elements from the claim through the weight setting
process: revenue code, date of service, HCPCS code, charges (for all lines with a HCPCS code
or if there is no HCPCS code, with an allowed revenue code), and units. Some specific cost
modeling calculations may require more data elements.
Definitions of terms used:
“Excluded” means the claims were eliminated from further use.
3
CY 2017 OPPS/ASC Proposed Rule
“Removed to another file” means that we removed the claims from the general process
but put the claims on another file to be used in a different process; the claims did not
remain in the main run but were not eliminated because the claims were used to model
specific costs.
“Copied to another file” means that we copied information off the claims for use in
another process but did not eliminate any of the copied information from the standard
ratesetting process.
“STAGE” means a set of activities that are done in the same run or a series of related
runs; the STAGE numbers follow the stages identified in a spreadsheet that accounts for
the claims.
“*” Indicates a component of the limited data set (LDS) available for purchase from
CMS.
Pre-STAGE 1: Identified gross outpatient claim population used for OPPS
payment and applied to the hospital CCRs.
Pulled claims for calendar year 2015 from the national claims history, n=156,217,495 records,
with a total claim count of 152,923,832. This is not the population of claims paid under OPPS,
but all outpatient claims processed by fiscal intermediaries.
Excluded claims with condition code 04, 20, 21, 77 (n=354,846). These are claims that providers
submitted to Medicare knowing that no payment will be made. For example, providers submit
claims with a condition code 21 to elicit an official denial notice from Medicare and document
that a service is not covered.
Excluded claims with more than 300 lines (n=1,391).
4
CY 2017 OPPS/ASC Proposed Rule
Excluded claims for services furnished in Maryland, Guam, US Virgin Islands, American
Samoa, and the Northern Marianas (n=2,170,860).
Balance = 146,799,719
Divided claims into three groups:
1) Claims that were not bill type 12X, 13X (hospital outpatient bill types), 14X (laboratory
specimen bill types), or 76X (CMHC bill types). Other outpatient bill types are not paid under
OPPS and, therefore, their claims were not used to set OPPS payment (n=29,819,353).
2) Bill types 12X, 13X, or 14X. 12X and 13X claims are hospital outpatient claims. Claims
with bill type 14X are laboratory specimen bill types, of which we use a subset for the limited
number of services in these claims that are paid under the OPPS (n=116,963,333).
3) Bill type 76X (CMHC). These claims are used to set the per diem partial hospitalization
rate for CMHCs (n=17,033).
Balance for Bill Types 12X, 13X, and 14X = 116,963,333
Incorporated all new Category I and III CPT codes and new Level II HCPCS codes that were
effective as of April 1, 2016 and July 1, 2016.
Applied hospital specific and, where possible, departmental specific CCRs to claims, and flagged
hospitals with CCRs that will be excluded in STAGE 1 below. We used the most recent CCRs
that were available in the CMS HCRIS system.
For the CCR calculation process, we used the same general approach that we used in developing
the final APC rates for CY 2007 and thereafter, using the revised CCR calculation that excluded
the costs of paramedical education programs and weighted the outpatient charges by the volume
of outpatient services furnished by the hospital. We refer readers to the CY 2007 OPPS/ASC
final rule with comment period for more information (71 FR 67983 through 67985). We first
5
CY 2017 OPPS/ASC Proposed Rule
limited the population of cost reports to only those hospitals that filed outpatient claims in CY
2015 before determining whether the CCRs for such hospitals were valid.
STAGE 1: Excluded claims without a valid CCR and removed claims for
procedures with unique packaging and cost calculation processes to separate
files.
Began with the set of claims with bill types 12X, 13X, and 14X, without Maryland, Guam, or
USVI, and including claims with flags for invalid CCRs set (n=116,963,333).
Excluded claims with CCRs that were flagged as invalid in Pre-STAGE 1. These included claims for hospitals without a CCR, for hospitals paid an all-inclusive rate, for critical access hospitals, for hospitals with obviously erroneous CCRs (greater than 90 or less than .0001), and for hospitals with CCRs that were identified as outliers (3 standard deviations from the geometric mean after removing erroneous CCRs) (n=1,927,828).
*Identified claims with condition code 41 and removed to another file (n=62,086). These claims were used to calculate the partial hospitalization service per diem rate for hospital-based partial hospitalization programs.
Excluded claims without a HCPCS code (n=9,822).
Removed to another file claims that contain nothing but flu vaccine and PPV vaccine services
(n=140,227).
We assessed each line on the claim to determine whether the charge was reported under a
revenue code that we allow, for purposes of OPPS rate setting, on the OPPS revenue code-to-
cost center crosswalk. If the revenue code is allowed, we applied the most specific available
hospital specific CCR to the charge on the line. See the OPPS revenue code-to-cost center
crosswalk for the hierarchy of cost centers for each revenue code; where none of the revenue
code specific cost centers applied, we used the hospital specific overall ancillary OPPS CCR to
reduce the charges on the line to costs. If the revenue code under which a charge is reported is
6
CY 2017 OPPS/ASC Proposed Rule
not allowed for OPPS rate setting, that charge is not reduced to cost nor used in calculation of the
statistics that determine the OPPS weight. Typically, the OPPS does not allow revenue codes for
OPPS rate setting that are not allowed for payment by the Integrated Outpatient Code Editor
(IOCE).
Balance = 114,823,370
Copied line items for drugs, radiopharmaceuticals, blood, and brachytherapy sources (the lines
stay on the claim but are copied off onto another file) to a separate file (n=377,835,821).
No claims were deleted. The rest of the claims process for these services is detailed at the end of
this document.
STAGE 2: Excluded claims with codes not payable under OPPS, conducted
initial split of claims into single and multiple bills, and prepared claims for
generating pseudo single claims.
As described in the proposed rule, our data development process is designed with the goal of
using appropriate cost information in setting the APC relative payment weights. This section
discusses how we develop “pseudo” single procedure claims (as defined below), with the
intention of using more appropriate data from the available claims. In some cases, the bypass
process allows us to use some portion of the submitted claim for cost estimation purposes, while
the remaining information on the claim continues to be unusable. Consistent with the goal of
using appropriate information in our data development process, we only use claims (or portions
of each claim) that are appropriate for ratesetting purposes.
The proposed APC relative weights and payments for CY 2017 in Addenda A and B to this
proposed rule (which are available via the Internet on the CMS Web site) were calculated using
claims from CY 2015 that were processed through December 31st, 2015. While prior to CY
2013 we historically based the payments on median hospital costs for services in the APC
groups, beginning with the CY 2013 OPPS, we established the cost-based relative payment
weights for the OPPS using geometric mean costs, as discussed in the CY 2013 OPPS/ASC final
7
CY 2017 OPPS/ASC Proposed Rule
rule with comment period (77 FR 68259 through 68271). For the CY 2017 OPPS NPRM, we are
proposing to use this same methodology, basing payments on geometric mean costs. Under this
methodology, we select claims for services paid under the OPPS and match these claims to the
most recent cost report filed by the individual hospitals represented in our claims data. We
continue to believe that it is appropriate to use the most current full calendar year claims data and
the most recently submitted cost reports to calculate the relative costs underpinning the APC
relative payment weights and the CY 2017 payment rates.
Proposed Use of Single and Multiple Procedure Claims
For CY 2017, in general, we are proposing to continue to use single procedure claims to set the
costs on which the APC relative payment weights are based. We generally use single procedure
claims to set the estimated costs for APCs because we believe that the OPPS relative weights on
which payment rates are based should be derived from the costs of furnishing one unit of one
procedure and because, in many circumstances, we are unable to ensure that packaged costs can
be appropriately allocated across multiple procedures performed on the same date of service.
It is generally desirable to use the data from as many claims as possible to recalibrate the APC
relative payment weights, including those claims for multiple procedures. As we have for
several years, we are proposing to continue to use date of service stratification and a list of codes
to be bypassed to convert multiple procedure claims to “pseudo” single procedure claims.
Through bypassing specified codes that we believe do not have significant packaged costs, we
are able to use more data from multiple procedure claims. In many cases, this enables us to
create multiple “pseudo” single procedure claims from claims that were submitted as multiple
procedure claims spanning multiple dates of service, or claims that contained numerous
separately paid procedures reported on the same date on one claim. We refer to these newly
created single procedure claims as “pseudo” single procedure claims.
For CY 2017, we are proposing to bypass 194 HCPCS codes that are identified in Addendum N
to this proposed rule (which is available via the Internet on the CMS Web site). Since the
inception of the bypass list, which is the list of codes to be bypassed to convert multiple
procedure claims to “pseudo” single procedure claims, we have calculated the percent of
8
CY 2017 OPPS/ASC Proposed Rule
“natural” single claims that contained packaging for each HCPCS code and the amount of
packaging on each “natural” single claim for each code. Each year, we generally retain the codes
on the previous year’s bypass list and use the updated year’s data (for CY 2017, data available
for the March 14, 2016 meeting of the Advisory Panel on Hospital Outpatient Payment (the
Panel) from CY 2015 claims processed through September 30th, 2015) to determine whether it
would be appropriate to add additional codes to the previous year’s bypass list. For CY 2017,
we are proposing to continue to bypass all of the HCPCS codes on the CY 2016 OPPS bypass
list, with the exception of HCPCS codes that we are proposing to delete for CY 2017, which are
listed in Table 1 of the proposed rule. (We refer readers to Addendum N to the CY 2017
OPPS/ASC final rule with comment period for the CY 2017 OPPS bypass list. Addendum N is
available via the Internet on the CMS Web site.) We also are proposing to remove HCPCS
codes that are not separately paid under the OPPS because the purpose of the bypass list is to
obtain more data for those codes relevant to ratesetting. Some of the codes we are proposing to
remove have packaged cost patterns associated with their natural single major claims that would
no longer meet the bypass list criterion of 5 percent or fewer of the single major claims having
packaged costs on the claim. In addition, we are proposing to add to the bypass list for CY 2017
HCPCS codes that are not on the CY 2016 bypass list that, using the March 14, 2016 Panel data
(first 9 months of CY 2015 claims), met the empirical criteria for the bypass list that are
summarized below. Finally, to remain consistent with the CY 2017 proposal to continue to
develop OPPS relative payment weights based on geometric mean costs, we also are proposing
that the packaged cost criterion continue to be based on the geometric mean cost. The entire list
proposed for CY 2017 (including the codes that remain on the bypass list from prior years) is
open to public comment in the CY 2017 OPPS/ASC proposed rule. Because we must make
some assumptions about packaging in the multiple procedure claims in order to assess a HCPCS
code for addition to the bypass list, we assumed that the representation of packaging on “natural”
single procedure claims for any given code is comparable to packaging for that code in the
multiple procedure claims. The proposed criteria for the bypass list are:
● There are 100 or more “natural” single procedure claims for the code. This number of
single procedure claims ensures that observed outcomes are sufficiently representative of
packaging that might occur in the multiple claims.
9
CY 2017 OPPS/ASC Proposed Rule
● Five percent or fewer of the “natural” single procedure claims for the code have
packaged costs on that single procedure claim for the code. This criterion results in limiting the
amount of packaging being redistributed to the separately payable procedures remaining on the
claim after the bypass code is removed and ensures that the costs associated with the bypass code
represent the cost of the bypassed service.
● The geometric mean cost of packaging observed in the “natural” single procedure
claims is equal to or less than $55. This criterion also limits the amount of error in redistributed
costs. During the assessment of claims against the bypass criteria, we do not know the dollar
value of the packaged cost that should be appropriately attributed to the other procedures on the
claim. Therefore, ensuring that redistributed costs associated with a bypass code are small in
amount and volume protects the validity of cost estimates for low cost services billed with the
bypassed service.
● The code cannot be a code for an unlisted service. Unlisted codes do not describe a
specific service and, therefore, their costs would not be appropriate for bypass list purposes.
Further, unlisted codes are not used in establishing the percent of claims contributing to the APC,
nor are their costs used in the calculation of the APC geometric mean.
As a result of the multiple imaging composite APCs that we established in CY 2009, the
program logic for creating “pseudo” single procedure claims from bypassed codes that are also
members of multiple imaging composite APCs changed. When creating the set of “pseudo”
single procedure claims, claims that contain “overlap bypass codes” (those HCPCS codes that
are both on the bypass list and are members of the multiple imaging composite APCs) were
identified first. These HCPCS codes were then processed to create multiple imaging composite
“single session” claims, that is, claims containing HCPCS codes from only one imaging family,
thus suppressing the initial use of these codes as bypass codes. However, these “overlap bypass
codes” were retained on the bypass list because, at the end of the “pseudo” single processing
logic, we reassessed the claims without suppression of the “overlap bypass codes” under our
longstanding “pseudo” single process to determine whether we could convert additional claims
to “pseudo” single procedure claims. This process also created multiple imaging composite
“single session” claims that could be used for calculating composite APC costs. “Overlap
bypass codes” that are members of the proposed multiple imaging composite APCs are identified
10
CY 2017 OPPS/ASC Proposed Rule
by asterisks (*) in Addendum N to the proposed rule (which is available via the Internet on the
CMS Web site).
Removed lines from claims that had payable status indicators both in the year the claim was
billed and in the prospective payment year, which received no payment. This line item based
trim, described in section II.A.2.c. of the CY 2017 OPPS/ASC proposed rule, was implemented
to ensure that we are using valid claims that represent the cost of payable services to set payment
rates for the prospective year. We note that we are proposing to include lines items with SI=“R”
and “U” in this trim for the CY 2017 OPPS. Having logic that requires both the status indicator
on the claim and the prospective status indicator to be payable, preserves charges for services
that would not have been paid in the claim year but for which some estimate of cost is needed for
the prospective year (n=1,493,719).
For the CY 2017 OPPS proposed rule, we are excluding line item data for pass-through drugs
and biologicals (status indicator G for CY 2015 claims data) and non-pass through drugs and
biological (status indicator K for CY 2015 claims data) that do not receive payment (n=154,241).
Prior to splitting the claims, we identified which status indicator Q2 codes (T-packaged) would
be paid when appearing with an S or V service. If a Q2 code appeared with a separately paid
procedure with a status indicator of T on the same date of service, we identified the code as
packaged. If the Q2 code appeared with a separately paid procedure(s) with a status indicator of
S or V and no other Q2 codes were on the same date of service, we forced the units to 1 and
changed the major-minor designation to major, identifying the Q2 code as separately paid. If
more than one Q2 code appeared on a claim with a separately paid procedure(s) with a status
indicator of S or V, we would rank the Q2 codes using their final rule 2016 APC designations
and associated scaled weight. We would change the major-minor designation of the Q2 code
with the highest weight to major status and force the units to 1. We designated the other Q2s on
the claim packaged, status indicator of N, and left their status as minor. Codes that are Q4s are
designated status indicator A if they are on a claim with no OPPS service assigned to status
indicator J1, J2, S, T, V, Q1, Q2, or Q3, or if modifier L1 is applied; otherwise, they are
designated status indicator N.
11
CY 2017 OPPS/ASC Proposed Rule
Divided claims into 5 groups using the indicators (major, minor, or bypass) that are assigned to
each HCPCS code. Major procedures are defined as procedure codes with status indicator J1, J2,
S, T, or V. Minor procedures are defined as procedures that have status indicator F, G, H, K, L,
N, R, or U.
1)*Single Major File: Claims with a single unit of one separately payable procedure
(SI=S, T, or V, which are called “major” procedures, including codes with status
indicator Q3); claims with one unit of a status indicator Q1 (STV-packaged) code and no
other code with a status indicator of S, T, or V on the same claim on the same date; or
claims with only one unit of a status indicator Q2 (T-packaged) code and no other code
with a status indicator of S, T, or V on the same claim on the same date. All of these
single major claims will be used in ratesetting (n=51,100,217).
We also include claims with services assigned to proposed status indicator J1 and J2 in
this category. These claims receive special processing under the CY 2017
comprehensive APC policy discussed in section II.A.2.e. of the CY 2017 OPPS/ASC
proposed rule.
2)*Multiple Major File: Claims with more than one separately payable procedure and/or
multiple units of “major” procedures, including codes with status indicator Q3; claims
with a status indicator Q2 code that has been designated as major and separately paid (no
procedure with a status indicator T on the same date of service and no higher weighted
Q2 code on the same date of service); or claims that contain conditional and independent
bilateral codes when the bilateral modifier is attached to the code. Multiple major claims
are examined carefully in STAGE 3 for dates of service and content to see if they can be
divided into simulated or “pseudo” single claims (n=21,166,217).
3)*Single Minor File: Claims with a single unit of a single HCPCS with the status
indicator of N (packaged item or service), F, G, H, K, L, R, or U (n=5,458,433). We
retain this file in case we have to make last minute changes to packaging criteria.
12
CY 2017 OPPS/ASC Proposed Rule
4)*Multiple Minor File: Claims with multiple HCPCS codes, multiple services on the
same date of service, and/or multiple units of one or more procedure codes with status
indicator of F, G, H, K, L, N, R, or U; claims containing status indicator Q1 (STV-
packaged) or status indicator Q2 (T-packaged) codes with more than one unit of the code
or more than one line of these codes on the same date of service and no other separately
paid procedures (n=28,969,306).
5) Non-OPPS claims: These claims have no services payable under OPPS on the claim
and are excluded (n=8,129,197). These claims have codes paid under other fee schedules
such as the DMEPOS fee schedule and physician fee schedule. These claims have no
major or minor procedures on them. The only procedure codes on these claims have a
status indicator other than J1, J2, S, T, V, N, F, G, H, K, L, R, or U.
STAGE 3: Generated additional single claims or “pseudo singles” from
multiple claims files
From the 18,356,021 multiple major claims without a J1 service or the J2 composite, we were
able to use 9,918,784 of those claims to create 17,790,914 pseudo single claims. Of the pseudo
single claims created, 850,115 were single “session” imaging composite claims. As noted above,
the multiple major claims already contained the proposed payment disposition of codes with
status indicator Q2 (T-packaged codes) when they appeared with S, T or V services, making
these services part of the pseudo single process. In this preliminary rule data set, pseudo single
bills were created in several different ways.
We begin by removing all line items for separately payable procedures that are thought to
contain limited packaging (bypass codes) from the multiple major claims as pseudo single
claims. Because bypass codes are thought to have limited packaging, we also used the line item
for the bypass code as a pseudo single by estimating a unit cost and weighting any descriptive
statistics.
13
CY 2017 OPPS/ASC Proposed Rule
Because some of the services on the bypass list also are included in the multiple imaging
composites, we suppressed these “overlap bypass codes,” in order to retain all pertinent imaging
HCPCS codes to identify a single session composite claim. Overlap codes are HCPCS codes that
are both on the bypass list and are members of the multiple imaging composite APCs. The
specific “overlap bypass codes” are in the Addendum N promulgated with this CY 2017
OPPS/ASC proposed rule.
We then broke claims by dates of service and reassessed each new claim for its eligibility as a
single major claim, or in the case of the multiple imaging composite APCs, a single session
claim.
We created one set of pseudo singles by taking dates of service that now had only one separately
paid service.
We created another set of pseudo single bills taking line-items within dates of service that
contain multiple major procedures with unit=1 and no additional packaging on the date of
service.
We created single session claims for estimating the multiple imaging composite APCs by
identifying dates of service that contain more than one unit of a code in the same imaging family
and no other separately payable codes. We later classified the dates of service for CT and CTA
family and MRI and MRA family into those with and without contrast to create single session
claims for the APC cost calculation.
Having identified all pseudo singles and single session claims, we reassessed the claims without
suppression of the “overlap bypass codes” under our longstanding “pseudo” single process to
determine whether we could convert additional claims to “pseudo” single claims.
For the CY 2017 OPPS, we are continuing our CY 2012 OPPS policy of including an additional
step to create pseudo single claims by treating conditionally packaged codes (identified by status
indicators Q1 and Q2) that do not meet the criteria for packaging as if they were separately
14
CY 2017 OPPS/ASC Proposed Rule
payable major codes. We then apply the pseudo single process to these claims to create single
procedure claims from them if they meet the criteria for single procedure claims.
We were not able to use 31,514,543 claims because these claims continued to contain multiple
separately payable procedures with significant packaging and could not be split (n=4,230,415) or
because the claims contained services with SI=N and no separately payable procedures on the
claim (n=27,284,128). We also were not able to use claims with the following characteristics:
major procedure with a zero cost (n= 4,459), major procedure with charges less than $1.01
(n=12,533); or packaging flag of 3 (n=59,936), suggesting token charges. We do not believe that
these charges, which were token charges as submitted by the hospital, are valid reflections of
hospital resources. We also deleted claims for which the charges equaled the revenue center
payment (that is, the Medicare payment) on the assumption that, where the charge equaled the
payment, to apply a CCR to the charge would not yield a valid estimate of relative provider cost.
We also created additional single bills from the multiple minor file. We separated status indicator
Q1 (STV-packaged) and status indicator Q2 (T-packaged) codes by date, packaged all packaged
costs, including other Q1 and Q2 costs, into the code with the highest CY 2016 payment weight
based on CY 2016 APC assignment, forced the units to one to match our policy of paying only
one unit of a code with SI=Q1 or Q2, and treated these claims as pseudo single claims. We
created 1,684,447 pseudo singles from the multiple minor claims. We were not able to use
27,284,128 multiple minor claims because these claims contained minor codes that could not be
elevated to major status when billed alone: largely drugs or packaged HCPCS coded procedures.
We were not able to use any of the 5,458,433 single minor claims because minor claims, by
definition, contain only minor codes: drugs or packaged HCPCS coded procedures. Claims with
a single Q1 or Q2 code with a single unit would have been classified as a single major in the
initial split logic.
Balance = 86,779,605 (the sum of single majors without a J1 service or the J2 composite =
48,814,987, and pseudo singles from multiple majors, multiple minors, and the single “session”
composite claims = 37,964,618).
15
CY 2017 OPPS/ASC Proposed Rule
STAGE 4: Packaged costs into the payable HCPCS codes
We package the costs 1) on lines with packaged HCPCS codes and allowed revenue codes as
shown in the revenue code-to-cost center crosswalk and 2) on lines without HCPCS but with
revenue codes on the packaged revenue code file in Table 4 of the CY 2017 OPPS/ASC
proposed rule. This included the cost for coded packaged drugs and biologicals with an ASP and
cost for other packaged drugs and biologicals, especially estimated costs associated with
uncoded pharmacy revenue codes.
We began with 86,779,605 single procedure claim records that still had costs at the line item
level. We summed the costs on the claim to complete packaging and we standardized the total
cost using 60 percent of each hospital’s IPPS pre-reclassification wage index. Specifically,
standardized cost for the single bill or single session bill = sum of estimated line costs for the
single bill or single session bill/((.6 * pre-reclassification wage index) + .4). We use the pre
reclassified wage indices for standardization because we believe that they better reflect the true
costs of items and services in the area in which the hospital is located than the post
reclassification wage indices and, therefore, would result in the most accurate unadjusted
geometric mean costs.
We left STAGE 4 with 86,779,605 single procedure claim records containing summarized costs
for the payable HCPCS and all packaged codes and revenue centers on the claim.
Balance = 86,779,605
STAGE 5: Calculated HCPCS and APC costs
We began with 86,779,605 single procedure claim records with summarized costs.
We excluded 2,933 claim records that had zero costs after summing all costs on the claim in
STAGE 4.
16
CY 2017 OPPS/ASC Proposed Rule
We excluded 963 records because CMS lacked an appropriate wage index.
We excluded 601,521 claim records that were outside +/- 3 standard deviations from the geometric mean cost for each HCPCS code.
We excluded 29 claims records that contained more than 50 units of the code on the claim.
We excluded 7,984,290 claim records from providers that used a cost allocation method of
‘‘square feet’’ to calculate CCRs used to estimate costs associated with the CT and MRI APCs.
Balance = 78,189,869
We used the balance of 78,189,869 single procedure claims records to calculate HCPCS code
geometric mean costs for the “2 times” examination and APC payment weight development.
Section 1833(t)(2) of the Act provides that, subject to certain exceptions, the items and services
within an APC group cannot be considered comparable with respect to the use of resources if the
highest median (or mean cost, if elected by the Secretary) for an item or service in the group is
more than 2 times greater than the lowest median cost for an item or service within the same
group (referred to as the “2 times rule”).
We added additional geometric mean costs calculated outside this process. We added a proposed
geometric mean per diem cost for APC 5853 (Partial Hospitalization (3 or more services per day)
for CMHCs), calculated from the bill type 76x claims from Pre-STAGE 1. We also added a
geometric mean per diem cost for APC 5863 (Partial Hospitalization (3 or more services per day)
for hospital-based PHPs), calculated from the bill type 12X or 13X claims with condition code
41 written off in STAGE 1.
We added blood geometric mean costs that were calculated with the use of a simulated
departmental CCR for blood for hospitals that do not have cost centers for blood. We added
APC geometric mean costs for composite APCs, as well as other customized or “offline”
17
CY 2017 OPPS/ASC Proposed Rule
geometric mean costs discussed in the proposed rule, such as those discussed in section II.A.f. of
the CY 2017 OPPS/ASC proposed rule. The unique assumptions behind each composite or
alternative geometric mean calculation methodology are discussed in greater detail in the CY
2017 OPPS/ASC proposed rule.
We note that, for purposes of identifying significant HCPCS codes for examination in the 2 times
rule, we consider codes that have more than 1,000 single major claims or codes that have both
greater than 99 single major claims and contribute at least 2 percent of the single major claims
used to establish the APC geometric mean cost to be significant. This longstanding definition of
when a HCPCS code is significant for purposes of the 2 times rule was selected because we
believe that a subset of 1,000 claims is negligible within the set of approximately 92 million
single procedure or single session claims we use for establishing geometric mean costs.
Similarly, a HCPCS code for which there are fewer than 99 single claims and which comprises
less than 2 percent of the single major claims within an APC will have a negligible impact on the
APC geometric mean.
18
CY 2017 OPPS/ASC Proposed Rule
PART 2 – BUDGET NEUTRALITY, OUTLIER THRESHOLD,
AND IMPACT CALCULATIONS
After converting geometric mean costs into unscaled weights by dividing the geometric mean
cost for each APC by the geometric mean cost for APC 5012, the proposed outpatient clinic visit
APC in CY 2017, we began the process of calculating budget neutrality adjustments and the
outlier threshold to determine proposed payment rates. The result of all proposed payment
policies are presented in the impact table in Section XXIV. Regulatory Impact Analysis of the
CY 2017 OPPS/ASC proposed rule. The following discussion provides greater detail about our
manipulation of the claims to calculate budget neutrality adjustments, to estimate outlier
thresholds, and to create the impact table and overall beneficiary copayment percentage. The
discussion below supplements discussion already provided in the proposed rule about calculation
of the weight scaler, the conversion factor, the hospital and CMHC outlier thresholds, and the
impact table columns.
STAGE 6: Created Summary Service Utilization Files for Current and
Prospective OPPS Year by Provider
We began the budget neutrality calculations by making the services, utilization, and APC
assignment on the CY 2015 claims look like they would if they were paid in the current OPPS
year, CY 2016, and the prospective OPPS year, CY 2017. We created a summary utilization file
for services in the CY 2015 claims database that would be paid under the 2016 OPPS and a
summary utilization file for services that would be paid under the proposed 2017 OPPS. In
essence, this step runs the claims with payable OPPS services through a mock Integrated
Outpatient Code Editor (IOCE) and Pricer for the current and prospective year and then
summarizes utilization by provider, APC, HCPCS, and status indicator. Updated July 2016 IOCE
specifications (v17.2) are available at:
https://www.cms.gov/Medicare/Coding/OutpatientCodeEdit/Downloads/2016-Jul-Integrated-
OCE-Specs.pdf
19
CY 2017 OPPS/ASC Proposed Rule
We constructed a summary utilization file for the CY 2017 OPPS proposed rule using single and
multiple bills from STAGE 2 of this document (n=106,694,173), the partial hospitalization
claims (n=62,086) from STAGE 1, and those from CMHCs (17,033) from Pre-STAGE 1. In this
summary process, we identified line-items that were not payable under OPPS, including units on
drugs and biologicals greater than the upper trim level identified in the units trim discussed in
STAGE 1, units greater than 100 for procedure codes, a status indicator that is not payable under
OPPS (SI=A, B, E, C, D, F, L, M), and 0 units on a claim line without an associated charge. We
specifically included the pseudo singles for claims with a separately paid Q2 or Q1 code created
from the multiple minor claims in STAGE 3 of the claims process. After changes in utilization
and the addition of proposed CY 2017 payment policies, we summarized these files to a single
CY 2017 summary file of 3,574,732 observations from 3,813 hospitals (including cancer and
children’s hospitals) and 49 CMHCs, which only provide one service, partial hospitalization. We
used this summary file as the basis for modeling the proposed rule CY 2017 weight in the weight
scaler calculation and estimated payment in CY 2017 in the impact table.
We also constructed a baseline summary utilization file to reflect the existing CY 2016 OPPS.
For the CY 2016 OPPS baseline file, we began with the single and multiple bills from STAGE 2,
the pseudo single claims for codes with status indicator Q1 and Q2 created from the multiple
minor claims, and the same partial hospitalization and CMHC claims listed above. We
summarized this second set of files to a single file of 3,809,716 services by hospitals and
CMHCs. We used this summary file as the basis for modeling the current CY 2016 weight in the
weight scaler calculation and estimated payment in CY 2016 of the impact table.
Utilization in both of these files includes changes for “discounting,” which is any change in
payment, applied to the line-item units for a specific service on a claim, resulting from
application of the multiple procedure discounting to services with status indicator T or the
presence of a modifier indicating that the procedure was terminated. For 2017, we used unscaled
weights, the APC geometric mean cost divided by the geometric mean cost for APC 5012, to
order services on each claim for application of multiple procedure discounting because scaled
weights are not yet available.
20
CY 2017 OPPS/ASC Proposed Rule
We took a few additional steps to prepare both files for budget neutrality calculations. We
adjusted units to accommodate changes in HCPCS descriptions and new HCPCS between 2015
and 2017. The proposed summary utilization file for the prospective CY 2017 OPPS contains
3,574,732 (including CMHCs) observations for 3,862 providers, and the proposed summary
utilization file for the current 2016 OPPS contains 3,809,716 (including CMHCs) observations
for 3,862 providers.
Each observation in these summary files includes one provider OSCAR, one HCPCS code, the
SI for the HCPCS code, the APC to which the HCPCS is assigned, and the sum of discounted
units of that HCPCS code furnished by that hospital.
Balance prospective CY 2017 = 3,574,732 HCPCS, by SI, by APC, by Provider
Balance baseline CY 2016 = 3,809,716 HCPCS, by SI, by APC, by Provider
STAGE 7: Calculated the Weight Scaler
The weight scaler is the budget neutrality adjustment for annual APC recalibration and its
calculation is discussed in section II.A. of the CY 2017 OPPS/ASC proposed rule. The weight
scaler compares total scaled weight under the current OPPS for 3,862 providers to total unscaled
weight under the prospective OPPS for the same providers, holding wage adjustment and rural
adjustment constant to the current year’s adjustments. We estimated wage adjusted weight for
each provider using the formula provided in section II.H. of the CY 2017OPPS/ASC proposed
rule without multiplying by the conversion factor, which is held constant. For example, for a
procedure with SI=S provided by an urban hospital, the total weight for a service would be
calculated:
(UNSCALED_2017_WEIGHT*.4+UNSCALED_2017_WEIGHT*.6
*CY2016_WAGE_INDEX)*TOTAL_DISCOUNTED_UNITS
For a procedure with SI=S provided by a rural sole community hospital, the total weight for a
service would be calculated:
21
CY 2017 OPPS/ASC Proposed Rule
(UNSCALED_2017_WEIGHT*.4+UNSCALED_2017_WEIGHT*.6
*CY2016_WAGE_INDEX)*TOTAL_DISCOUNTED_UNITS *1.071
For a specified covered outpatient drug with SI=K provided by any hospital, the total weight for
a service would be calculated:
UNSCALED_2017_WEIGHT*TOTAL_DISCOUNTED_UNITS
Scaling does not apply to OPPS services that have a predetermined payment amount, especially
separately paid drugs and biologicals and new technology APCs. Items with a predetermined
payment amount were included in the budget neutrality comparison of total weight across years
by using a weight equal to the payment rate divided by the CY 2017 proposed rule conversion
factor. However, scaling of the relative payment weights only applies to those items that do not
have a predetermined payment amount. Specifically, we remove the total amount of weight for
items with predetermined payment amount in the prospective year from both the prospective and
current year and calculate the weight scaler from the remaining difference. In doing this, those
services without a predetermined payment amount would be scaled by the proportional amount
not applied to the services with a predetermined payment amount. We do not make any
behavioral predictions about changes in utilization, case mix, or beneficiary enrollment when
calculating the weight scaler.
Balance prospective CY 2017 = 3,862 providers
Balance baseline CY 2016 = 3,862 providers
CY 2017 weight scaler = 1.4059
22
CY 2017 OPPS/ASC Proposed Rule
STAGE 8: Calculated the Wage and Provider Adjustments We used the same providers to estimate the budget neutrality adjustment for adopting the
proposed IPPS FY 2017 post reclassification wage index for the CY 2017 OPPS, discussed in
section II.C. of the CY 2017 OPPS/ASC proposed rule. Using the same wage-adjusted weight
formulas presented above, the wage adjustment compares differences in total scaled, proposed
CY 2017 weight providers varying only the wage index between CY 2016 and CY 2017, and
using the 2016 rural adjustment. The budget neutrality adjustment for changes in the wage index
is 1.0000. We did not make changes to our rural adjustment policy this year. Therefore, the
budget neutrality adjustment for the rural adjustment is 1.0000.
We used the same providers to estimate the budget neutrality adjustment for the proposed
dedicated cancer hospital adjustment for the CY 2017 OPPS, discussed in section II.F. of the CY
2017 OPPS/ASC proposed rule. We calculated a CY 2017 budget neutrality adjustment factor by
comparing the estimated total CY 2017 payments under section 1833(t) of the Act, including the
CY 2017 cancer hospital adjustment relative to the CY 2016 cancer hospital adjustment under
section 1833(t)(18)(B) and 1833(t)(2)(E) of the Act, to hospitals described in section
1886(d)(1)(B)(v) of the Act, excluding the TOPs adjustment. The proposed budget neutrality
adjustment for the proposed CY 2017 cancer hospital adjustment is 1.0000.
As discussed in section II.B. of the CY 2017 OPPS/ASC proposed rule, we are proposing to
make an adjustment to the OPPS conversion factor to redress the inflation in OPPS payment
rates resulting from excess packaged payment under the OPPS for laboratory tests we now
understand continue to be paid at CLFS rates outside the OPPS.
Balance CY 2017 providers = 3,862
Total wage index adjustment to the conversion factor = 1.0000
Total rural adjustment to the conversion factor = 1.0000
Total cancer hospital adjustment to the conversion factor = 1.0000
Total laboratory services adjustment to the conversion factor = 1.0003
Total budget neutrality adjustment to the conversion factor = 1.0003
23
CY 2017 OPPS/ASC Proposed Rule
STAGE 9: Calculated Hospital Outlier Threshold
We started with aggregated claims from the single and multiple bills, pseudo singles from the
multiple minor file, and partial hospitalization files to model the hospital fixed dollar hospital
outlier threshold. We used 75,996,248 claims to estimate the outlier threshold as well as
anticipated outlier payment by provider. We created a CCR for every hospital in our hospital
base file of 3,813 hospitals using the April 2016 update to the Outpatient Provider Specific File,
which contains the actual overall CCRs the fiscal intermediaries or MACs are using to make
outlier payments in CY 2015. We used internally calculated CCRs to substitute for any missing
CCRs on the April OPSF update, and we substituted the statewide CCR for providers with CCRs
greater than the 1.5 upper limit. We did not estimate the CMHC threshold this year, proposing a
CY 2017 policy of 3.4 times payment for APC 5853 (Partial Hospitalization (3 or more services
per day) for CMHCs). We are continuing to apply the standard OPPS outlier policy for all other
hospitals to the hospital-based PHP APCs.
As discussed in section II.G. of the CY 2017 OPPS/ASC proposed rule, we simulated CY 2017
costs by applying a charge inflation factor of 1.090 to charges on the CY 2015 claims and by
applying the CCR adjustment of 0.9696 to the April 2016 OPSF CCRs. We compared estimated
cost to wage adjusted payment for each separately paid service on each claim. Holding the
multiple threshold constant at 1.75 times the APC payment amount, we iterated total outlier
payment calculations, changing the size of the fixed dollar threshold each time, until total outlier
payments matched our estimate of 1.0 percent of total payment on all included claims. Using the
resulting $3,825 fixed dollar threshold, we estimated outlier payments for 2,940 hospitals for
column 5 of the impact table.
We repeated this exercise for the current year CY 2016 OPPS. We used 94,438,100 claims to
estimate the percentage of total payment attributable to outlier payments in 2016. We inflated
charges on the CY 2015 claims by an inflation factor for one year, 1.0440, and using the CCRs
from the April 2016 update to the Outpatient Provider Specific File, we estimated CY 2016 costs
and compared them to wage-adjusted CY 2016 payment for each service. Ultimately, we
24
CY 2017 OPPS/ASC Proposed Rule
estimated outlier payments for 2,986 hospitals for column 5 of the impact table. We also
estimated total outlier payments to be 0.96% of total CY 2016 OPPS payments.
Balance CY 2017 = 3,862 hospitals
Balance baseline CY 2016 = 3,862 hospitals
STAGE 10: Created the Impact Table and Calculated the Beneficiary Impact
Percentage
The impact table in section XXIV. Regulatory Impact Analysis of the CY 2017 OPPS/ASC
proposed rule compares OPPS payment for 3,862 providers in the baseline CY 2016 file to the
proposed CY 2017 OPPS payment for the same set of hospitals, in aggregate and across classes
of hospitals. We began with the summary utilization files created in STAGE 6 and recreated each
of the above total weight calculations (weight scaler, wage adjustment, rural adjustment) as
payments by adding in the conversion factor. We compared the difference in payments between
those under the CY 2017 proposed rule to the baseline CY 2016 payment and we show this result
in column 2. The detailed calculations behind the table columns are discussed in section XXIV.
of the CY 2017 OPPS/ASC proposed rule. Proposed rule payment presented in column 5 of the
impact table compares total estimated payment, including outlier payments, but excludes pass-
through payment for the current and prospective years.
In order to group types of hospitals, we constructed a file of descriptive information from the
cost report and IPPS provider files identifying different classes of hospitals. This file contains the
variables we use to model adjustments including the wage index, geographic location, and
provider type, as well as other descriptive information, such as bed size. We have complete
information for the 3,813 hospitals with any claim used to model the prospective OPPS. We do
not have complete descriptive information for the 49 CMHCs because their cost reports are not
included in HCRIS and because they are not hospitals paid under IPPS. We make available an
impact file that contains all descriptive information for the providers that we used in our
calculations, as well as estimated CY 2017 payments, including outlier payments, by provider for
25
CY 2017 OPPS/ASC Proposed Rule
the subset of 3,747 hospitals excluding children’s and cancer hospitals, which are permanently
held harmless, and 49 CMHCs for which we present detailed information in the impact table that
accompanies the CY 2017 OPPS/ASC proposed rule.
Finally, we estimated the overall beneficiary copayment percentage for the current and
prospective OPPS years. We applied the calculated, adjusted (wage, rural, and cancer)
copayment to all separately paid HCPCS, and we capped copayment at the inpatient deductible
for 2017. We summed total copayments for each year and divided by respective total payment.
We estimate that total beneficiary liability for copayments would be 18.5% percent in CY 2017.
26
CY 2017 OPPS/ASC Proposed Rule
Blood, Brachytherapy, Drugs, and Radiopharmaceutical Payment Rates
As mentioned in STAGE 1, we copied line items for drugs, radiopharmaceuticals, blood, and
brachytherapy sources (the lines stay on the claim but are copied off onto another file) to a
separate file (n=377,835,821). No claims were deleted. We use these line items to calculate per
unit per day cost information for drugs (including therapeutic radiopharmaceuticals) and blood.
We trimmed units at +/- 3 standard deviations from the geometric mean unit, and then +/- 3
standard deviations from the geometric mean unit cost, before calculating costs per unit and per
day. For drugs and biologicals, we used the April 2016 ASP plus 6 percent and multiplied that
amount by the average number of units per day for each drug or biological to arrive at its per day
cost. For items that did not have an ASP, we used CY 2015 hospital claims data to determine the
per day cost. We use per day cost to determine whether a drug or biological is packaged.
For CY 2017, we are continuing to pay for separately payable drugs and biologicals under the
OPPS at ASP plus 6 percent, based upon the statutory default described in section
1833(t)(14)(A)(iii)(II) of the Act. We refer readers to section V.B.3. of the CY 2017 OPPS/ASC
proposed rule for a complete discussion of our proposed policy to pay for separately paid drugs
and biologicals in CY 2017.
The payment rates for blood and blood products were based on simulated geometric mean costs
under a different methodology that is explained in the CY 2017 OPPS/ASC proposed rule.
27
CY 2017 OPPS/ASC Proposed Rule
Comprehensive APC Payment Rates
The comprehensive APC (C-APC) payment model is being developed to simplify reporting and
payment provision for high cost, complex outpatient procedures by accounting for all costs and
component services typically involved in the provision of the complete primary procedure.
Claims that contain at least one J1 procedure code are separated from the usual OPPS modeling
to undergo comprehensive specific modeling. The comprehensive cost modeling incorporates the
costs of a wider range of procedures into a claim’s primary service than the usual OPPS
modeling. Like OPPS modeling, costs of packaged procedure codes (status indicators N, Q1, Q2)
and packaged un-coded revenue centers are included in the claim modeled cost. Unlike OPPS
modeling, costs on the claim from major OPPS procedure codes (status indicators P, S, T, and
V), lower ranked comprehensive procedure codes (status indicator J1), non-pass-through drugs
and biologicals (status indicator K), and blood products (status indicator R) are also packaged
into the primary comprehensive procedure. Ambulance services; mammography services; pass-
through drugs and devices (status indicator G and H); brachytherapy services (status indicator
U); preventive services; corneal tissue, CRNA services, hepatitis B vaccine (status indicator F);
and influenza and pneumococcal pneumonia vaccines (status indicator L) are excluded from
comprehensive packaging.
When assigning claims reporting J1 primary services to comprehensive APCs, as configured in
the current payment year, a ranking of the primary (J1) HCPCS codes is first generated using the
comprehensive modeled geometric mean costs from claims reporting only one J1 service. The
ranking can be found in the Addendum J “Rank for Primary Assignment” table and includes the
frequency of service lines in the full OPPS claims population for reference, the frequency of
single J1 unit claims used for ranking development, the modeled comprehensive APC geometric
mean cost which determines the relative rank of C-APCs, and the modeled comprehensive
HCPCS geometric mean cost which determines the relative rank of J1 services within each C-
APC. This is a universal ranking of all J1 services that is used to initially assign all claims
reporting J1 services within the C-APCs as configured in the current payment year from highest
to lowest cost except for J1 services that map to different C-APCs as configured in the current
28
CY 2017 OPPS/ASC Proposed Rule
payment year. Comprehensive claims that report a single J1 service assign the J1 HCPCS code as
their primary. When comprehensive claims report more than 1 J1 code, the J1 service assigned to
the highest cost C-APC (or, if multiple J1 services are assigned to the same APC, then the
highest cost J1 code at the HCPCS level), as indicated by the ranking, is identified as primary for
the multiple J1 procedure claim, and the claim is mapped to the J1 identified as primary. The
“Total Frequency” parameter for J1 services indicated in the CPT and APC Cost Statistics files
indicates the number of comprehensive claims whose primary is assigned to the indicated service
after application of complexity adjustments.
C-APC claims that contain two or more J1 service units or that contain certain add-on procedure
codes may be eligible for a complexity adjustment that promotes the claim to the next higher cost
APC within the primary procedure’s clinical family. The complexity adjustments are developed
for frequently occurring combinations that significantly increase the cost of the primary
procedure claim. Eligibility of combinations for complexity adjustment is assessed using C-APC
claims that contain two or more J1 service units or that contain one J1 service unit and one
unique add-on code (from the limited list of add-on codes for primes with status indicator J1).
The combinations assigned to these claims correspond to the two highest rank J1 services
reported on the claim for J1 combinations or the claim’s only reported J1 service and add-on
service for add-on combinations. The frequency of combinations is then calculated from this
claim subset and the comprehensive geometric mean costs are modeled for each combination
using this claim subset. Combinations eligible for complexity adjustment must 1) have a
frequency of 25 or more from this claim subset and 2) have a modeled geometric mean cost that
is a factor of 2 or greater than the comprehensive geometric mean cost of the lowest significant
HCPCS in the primary procedure’s APC when modeled without the application of complexity
adjustments. Claims with primary or secondary J1 services reported with modifier -73 or -74
were excluded from the complexity adjustment evaluation. The “Complexity Adj. Evaluation”
table in Addendum J shows all combinations evaluated for complexity adjustment eligibility
along with the complexity adjusted APC to which the combination’s claims would be promoted,
the frequency of combinations from the claim subset described above, the modeled geometric
mean cost of the combinations from the claim subset described above, and the eligibility cost
threshold determined by two times the comprehensive geometric mean cost of the lowest
29
CY 2017 OPPS/ASC Proposed Rule
significant HCPCS in the primary procedure’s APC when modeled without complexity
adjustments.
Before modeling C-APC cost statistics, all comprehensive claims are assessed for complexity
adjustments based on the list of eligible combinations in the Addendum J “Complexity
Adjustments” table. Claims receiving complexity adjustments must have an eligible
combination’s primary service identified as the claim’s primary J1 service and must report the
combination’s corresponding secondary service (regardless of the other services reported).
Complexity adjusted claims are removed from modeling of the original primary service and
reassigned to the adjusted primary and described by a code of the following general type: [first 4
characters of HCPCS] + [last character of HCPCS mapped to adjustment character] (1=A, 2=B,
3=C, 4=D, 5=E, 6=G, 7=Q, 8=R, 9=S, 0=X, T=Z). All complexity adjusted claims with the same
original primary are modeled under the same adjusted primary. The adjusted primary is assigned
to the combination’s complexity adjusted APC found in the Addendum J “Complexity
Adjustments” table that corresponds to the next higher cost C-APC in the original primary
procedure’s clinical family of C-APCs relative to the claim’s original C-APC, and the claim is
modeled under this higher cost C-APC.
30
CY 2017 OPPS/ASC Proposed Rule
Comprehensive Observation Modeling
As part of the expansion of the C-APC payment policy methodology, payment for all qualifying
extended assessment and management encounters [formerly APC 8009 “Extended Assessment
and Management (EAM)” composite] will be paid through the newly created C-APC 8011
“Comprehensive Observation Services”. The status indicator of J2 is assigned to the new C–APC
8011 to distinguish between the logic required to identify the claims qualifying for the new C–
APC 8011 and the other C–APCs. A claim is qualified for C–APC 8011 when it contains a
specific combination of services performed with each other, as opposed to the presence of a
single service identified by status indicator J1 for all other C-APCs.
Claims that qualify for C-APC 8011 are separated from the usual OPPS modeling to undergo
comprehensive specific modeling. C-APC 8011 modeling claims are identified by meeting the
following criteria: 1) claim does not contain a HCPCS code with status indicator T; 2) claim
contains 8 or more units of service for G0378 (observation services, per hour); 3) claim contains
one of the following codes: G0379 (direct referral of patient for hospital observation care) on the
same date of service as G0378; 99281, 99282, 99283, 99284, 99285 (emergency department visit
for the evaluation and management of a patient (Levels 1-5)), G0380, G0381, G0382, G0383,
G0384 (type B emergency department visit (Levels 1-5)), 99291 (critical care, evaluation and
management of the critically ill or critically injured patient; first 30-74 minutes), or G0463
(hospital outpatient clinic visit for assessment and management of a patient) provided on the
same date of service or 1 day before the date of service for G0378; 4) claim does not contain a
HCPCS code with status indicator J1. If a claim reports services that qualify for C–APC 8011
modeling and reports a status indicator J1 service, then the J2 services and all other items and
services on the claim are packaged with the payment for the J1 C-APC.
All claims that meet the criteria for C-APC 8011 are used in ratesetting and to develop the
geometric mean cost of the comprehensive service based on the costs of all reported OPPS
payable services reported on the claim (excluding all preventive services and certain Medicare
Part B Inpatient services according to the comprehensive modeling policy described above).
31
CY 2017 OPPS/ASC Proposed Rule
Statewide Average Default CCRs
For CY 2017, we continue to use our standard methodology of calculating the statewide average
default CCRs using the same hospital overall CCRs that we use to adjust charges to costs on
claims data for setting the proposed CY 2017 OPPS relative payment weights. The proposed
CCRs represent the ratio of total costs to total charges for those cost centers relevant to
outpatient services from each hospital’s most recently submitted cost report, weighted by
Medicare Part B charges. We also adjust ratios from submitted cost reports to reflect the final
settled status by applying the differential between settled to submitted overall CCRs for the cost
centers relevant to outpatient services from the most recent pair of final settled and submitted
cost reports. We then weight each hospital’s CCR by the volume of separately paid line-items
on hospital claims corresponding to the year of the majority of cost reports used to calculate the
overall CCRs. We refer readers to the CY 2008 OPPS/ASC final rule with comment period (72
FR 66680 through 66682) and prior OPPS rules for a more detailed discussion of our established
methodology for calculating the statewide average default CCRs, including the hospitals used in
our calculations and our trimming criteria.
For Maryland, we used an overall weighted average CCR for all hospitals in the Nation as a
substitute for Maryland CCRs. Few hospitals in Maryland are eligible to receive payment under
the OPPS, which limits the data available to calculate an accurate and representative CCR. The
weighted CCR is used for Maryland because it takes into account each hospital’s volume, rather
than treating each hospital equally. We refer readers to the CY 2005 OPPS final rule with
comment period (69 FR 65822) for further discussion and the rationale for our longstanding
policy of using the national average CCR for Maryland. In general, observed changes in the
statewide average default CCRs between CY 2016 and CY 2017 are modest and the few
significant changes are associated with areas that have a small number of hospitals.
32
CY 2017 OPPS/ASC Proposed Rule
CCRs used in OPPS Ratesetting
Since the implementation of the OPPS, some commenters have raised concerns about potential
bias in the OPPS cost-based weights due to “charge compression,” which is the practice of
applying a lower charge markup to higher cost services and a higher charge markup to lower cost
services. As a result, the cost-based weights may reflect some aggregation bias, undervaluing
high-cost items and overvaluing low-cost items when an estimate of average markup, embodied
in a single CCR, is applied to items of widely varying costs in the same cost center. This issue
was evaluated in a report by the Research Triangle Institute, International (RTI). The RTI final
report can be found on RTI’s Web site at: http://www.rti.org/reports/cms/HHSM-500-2005-
0029I/PDF/Refining_Cost_to_Charge_ratios_200807_Final.pdf. For a complete discussion of
the RTI recommendations, public comments, and our responses, we refer readers to the CY 2009
OPPS/ASC final rule with comment period (73 FR 68519 through 68527).
We addressed the RTI finding that there was aggregation bias in both the IPPS and the OPPS
cost estimation of expensive and inexpensive medical supplies in the FY 2009 IPPS final rule
(73 FR 48458 through 45467). Specifically, we created one cost center for “Medical Supplies
Charged to Patients” and one cost center for “Implantable Devices Charged to Patients,”
essentially splitting the then current cost center for “Medical Supplies Charged to Patients” into
one cost center for low-cost medical supplies and another cost center for high-cost implantable
devices in order to mitigate some of the effects of charge compression. In determining the items
that should be reported in these respective cost centers, we adopted commenters’
recommendations that hospitals should use revenue codes established by the AHA’s NUBC to
determine the items that should be reported in the “Medical Supplies Charged to Patients” and
the “Implantable Devices Charged to Patients” cost centers. For a complete discussion of the
rationale for the creation of the new cost center for “Implantable Devices Charged to Patients,” a
summary of public comments received, and our responses to those public comments, we refer
readers to the FY 2009 IPPS final rule.
The cost center for “Implantable Devices Charged to Patients” has been available for use for cost
reporting periods beginning on or after May 1, 2009. In the CY 2013 OPPS/ASC final rule with
comment period, we determined that a significant volume of hospitals were utilizing the
33
CY 2017 OPPS/ASC Proposed Rule
“Implantable Devices Charged to Patients” cost center. Because a sufficient amount of data
from which to generate a meaningful analysis was available, we established in the CY 2013
OPPS/ASC final rule with comment period a policy to create a distinct CCR using the
“Implantable Devices Charged to Patients” cost center (77 FR 68225). We retained this policy
through CY 2016, and we are proposing to continue this practice for the CY 2017 OPPS.
In the FY 2011 IPPS/LTCH PPS final rule (75 FR 50075 through 50080), we finalized our
proposal to create new standard cost centers for “Computed Tomography (CT),” “Magnetic
Resonance Imaging (MRI),” and “Cardiac Catheterization,” and to require that hospitals report
the costs and charges for these services under these new cost centers on the revised Medicare
cost report Form CMS 2552-10. As we discussed in the FY 2009 IPPS and CY 2009 OPPS/ASC
proposed and final rules, RTI also found that the costs and charges of CT scans, MRIs, and
cardiac catheterization differ significantly from the costs and charges of other services included
in the standard associated cost center. RTI concluded that both the IPPS and the OPPS relative
payment weights would better estimate the costs of those services if CMS were to add standard
costs centers for CT scans, MRIs, and cardiac catheterization in order for hospitals to report
separately the costs and charges for those services and in order for CMS to calculate unique
CCRs to estimate the cost from charges on claims data. We refer readers to the FY 2011
IPPS/LTCH PPS final rule (75 FR 50075 through 50080) for a more detailed discussion on the
reasons for the creation of standard cost centers for CT scans, MRIs, and cardiac catheterization.
The new standard cost centers for CT scans, MRIs, and cardiac catheterization were effective for
cost report periods beginning on or after May 1, 2010, on the revised cost report Form CMS-
2552-10.
Using the HCRIS update for the Proposed 2017 cycle which we used to estimate costs in the CY
2017 OPPS ratesetting process, we were able to calculate a valid implantable device CCR for
2,952 hospitals, a valid MRI CCR for 2,105 hospitals, a valid CT scan CCR for 2,186 hospitals,
and a valid Cardiac Catheterization CCR for 1,437 hospitals.
In our CY 2014 OPPS/ASC proposed rule discussion (78 FR 43549), we noted that, for CY
2014, the estimated changes in geometric mean estimated APC cost of using data from the new
34
CY 2017 OPPS/ASC Proposed Rule
standard cost centers for CT scans and MRIs appeared consistent with RTI’s analysis of cost
report and claims data in the July 2008 final report (pages 5 and 6). RTI concluded that “in
hospitals that aggregate data for CT scanning, MRI, or nuclear medicine services with the
standard line for Diagnostic Radiology, costs for these services all appear substantially
overstated, while the costs for plain films, ultrasound and other imaging procedures are
correspondingly understated.” We also noted that there were limited additional impacts in the
implantable device-related APCs from adopting the new cost report Form CMS 2552 10 because
we had used data from the standard cost center for implantable medical devices beginning in CY
2013 OPPS ratesetting, as discussed above.
As we indicated in prior rulemaking (77 FR 68223 through 68225), once we determined that cost
report data for the new standard cost centers were sufficiently available, we would analyze that
data and, if appropriate, we would propose to use the distinct CCRs for new standard cost centers
described above in the calculation of the OPPS relative payment weights. As stated in the CY
2014 OPPS/ASC final rule with comment period (78 FR 74847), we conducted our analysis and
concluded that we should develop distinct CCRs for each of the new cost centers and use them in
ratesetting. Therefore, we began in the CY 2014 OPPS, and we are proposing to retain this
practice for the CY 2017 OPPS, to calculate the OPPS relative payment weights using distinct
CCRs for cardiac catheterization, CT scan, MRI, and implantable medical devices.
In the CY 2014 OPPS/ASC final rule with comment period (78 FR 74847), we finalized a policy
to remove claims from providers that use a cost allocation method of “square feet” to calculate
CCRs used to estimate costs associated with the CT and MRI APCs. This change allows
hospitals additional time to use one of the more accurate cost allocation methods, and thereby
improve the accuracy of the CCRs on which the OPPS relative payment weights are developed.
In Table 2 below, we display CCR values for providers based on various cost allocation
methods.
CCR STATISTICAL VALUES BASED ON USE OF DIFFERENT COST ALLOCATION
METHODS
35
CY 2017 OPPS/ASC Proposed Rule
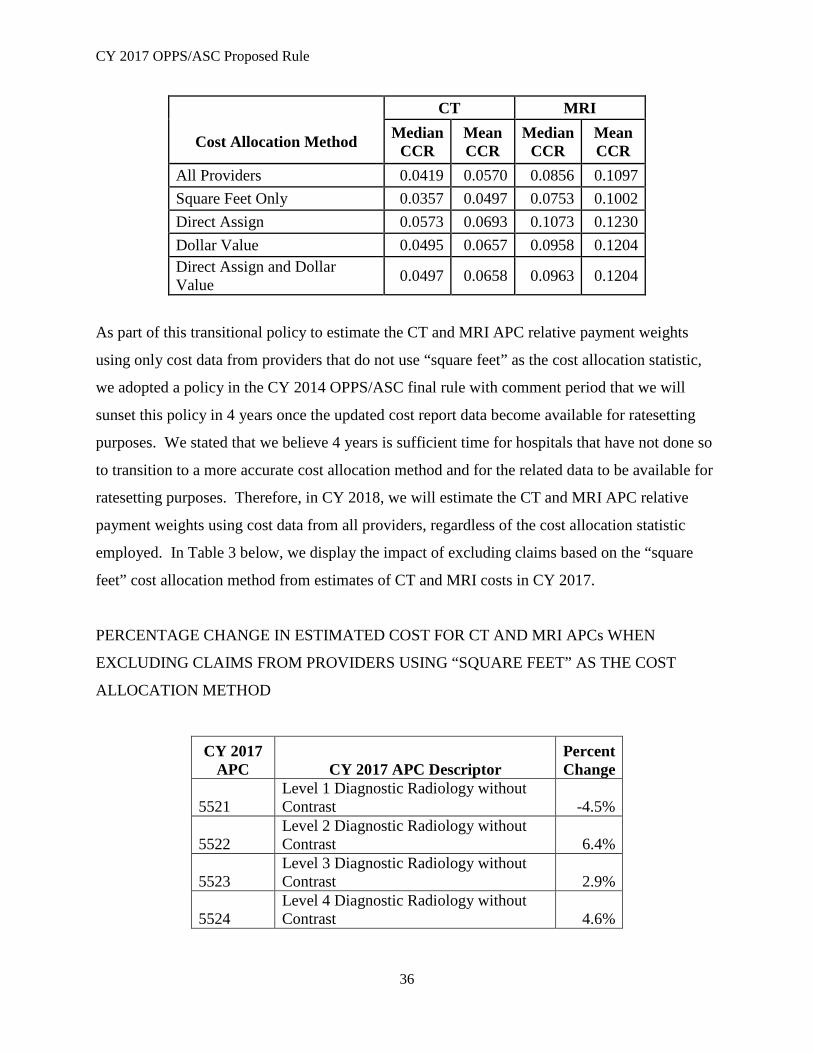
Cost Allocation Method
CT MRI Median
CCR Mean CCR
Median CCR
Mean CCR
All Providers 0.0419 0.0570 0.0856 0.1097 Square Feet Only 0.0357 0.0497 0.0753 0.1002 Direct Assign 0.0573 0.0693 0.1073 0.1230 Dollar Value 0.0495 0.0657 0.0958 0.1204 Direct Assign and Dollar Value 0.0497 0.0658 0.0963 0.1204
As part of this transitional policy to estimate the CT and MRI APC relative payment weights
using only cost data from providers that do not use “square feet” as the cost allocation statistic,
we adopted a policy in the CY 2014 OPPS/ASC final rule with comment period that we will
sunset this policy in 4 years once the updated cost report data become available for ratesetting
purposes. We stated that we believe 4 years is sufficient time for hospitals that have not done so
to transition to a more accurate cost allocation method and for the related data to be available for
ratesetting purposes. Therefore, in CY 2018, we will estimate the CT and MRI APC relative
payment weights using cost data from all providers, regardless of the cost allocation statistic
employed. In Table 3 below, we display the impact of excluding claims based on the “square
feet” cost allocation method from estimates of CT and MRI costs in CY 2017.
PERCENTAGE CHANGE IN ESTIMATED COST FOR CT AND MRI APCs WHEN
EXCLUDING CLAIMS FROM PROVIDERS USING “SQUARE FEET” AS THE COST
ALLOCATION METHOD
CY 2017 Percent APC CY 2017 APC Descriptor Change
5521 Level 1 Diagnostic Radiology without Contrast -4.5%
5522 Level 2 Diagnostic Radiology without Contrast 6.4%
5523 Level 3 Diagnostic Radiology Contrast
without 2.9%
5524 Level 4 Diagnostic Radiology without Contrast 4.6%
36
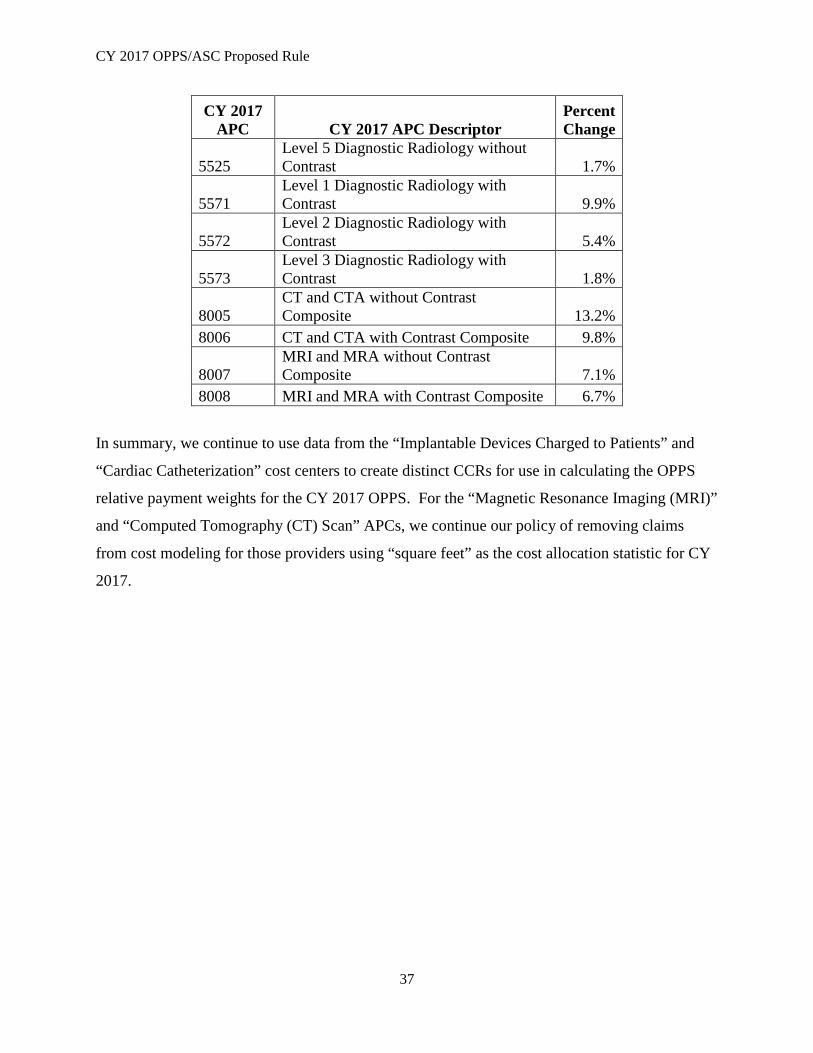
CY 2017 OPPS/ASC Proposed Rule
CY 2017 APC CY 2017 APC Descriptor
Percent Change
5525 Level 5 Diagnostic Radiology without Contrast 1.7%
5571 Level 1 Diagnostic Radiology with Contrast 9.9%
5572 Level 2 Diagnostic Radiology with Contrast 5.4%
5573 Level 3 Diagnostic Radiology with Contrast 1.8%
8005 CT and CTA without Contrast Composite 13.2%
8006 CT and CTA with Contrast Composite 9.8%
8007 MRI and MRA without Contrast Composite 7.1%
8008 MRI and MRA with Contrast Composite 6.7%
In summary, we continue to use data from the “Implantable Devices Charged to Patients” and
“Cardiac Catheterization” cost centers to create distinct CCRs for use in calculating the OPPS
relative payment weights for the CY 2017 OPPS. For the “Magnetic Resonance Imaging (MRI)”
and “Computed Tomography (CT) Scan” APCs, we continue our policy of removing claims
from cost modeling for those providers using “square feet” as the cost allocation statistic for CY
2017.
37
CY 2017 OPPS/ASC Proposed Rule
Revenue Code Use in OPPS Ratesetting
As noted in the CY 2008 OPPS/ASC final rule with comment period (72 FR 66606), for the CY
2008 OPPS, we adopted an APC Panel recommendation that CMS should review the final list of
packaged revenue codes for consistency with OPPS policy and ensure that future versions of the
I/OCE edit accordingly. As we have in the past, we continue to compare the final list of
packaged revenue codes that we adopt for CY 2017 to the revenue codes that the I/OCE will
package for CY 2017 to ensure consistency.
In the CY 2009 OPPS/ASC final rule with comment period (73 FR 68531), we replaced the
NUBC standard abbreviations for the revenue codes listed in Table 2 of the CY 2009 OPPS/ASC
proposed rule with the most current NUBC descriptions of the revenue code categories and
subcategories to better articulate the meanings of the revenue codes without changing the list of
revenue codes. In the CY 2010 OPPS/ASC final rule with comment period (74 FR 60362
through 60363), we finalized changes to the packaged revenue code list based on our
examination of the updated NUBC codes and public comment on the CY 2010 proposed list of
packaged revenue codes.
For CY 2017, as we did for CY 2016, we reviewed the changes to revenue codes that
were effective during CY 2014 for purposes of determining the charges reported with revenue
codes but without HCPCS codes that we would propose to package for CY 2017. We believe
that the charges reported under the revenue codes listed in Table 4 below continue to reflect
ancillary and supportive services for which hospitals report charges without HCPCS codes.
Therefore, for CY 2017, we continue to package the costs that we derive from the charges
reported without HCPCS codes under the revenue codes displayed in the table below for
purposes of calculating the geometric mean costs on which the proposed CY 2017 OPPS/ASC
payment rates are based.
38
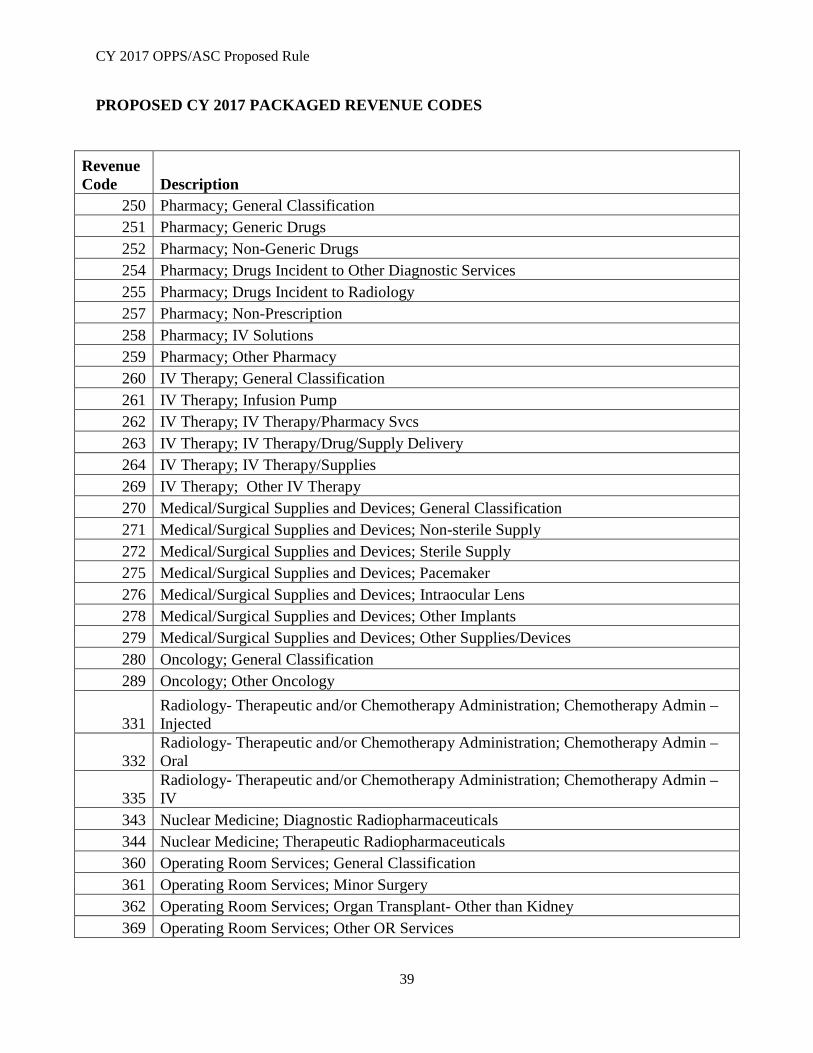
CY 2017 OPPS/ASC Proposed Rule
PROPOSED CY 2017 PACKAGED REVENUE CODES
Revenue Code Description
250 Pharmacy; General Classification 251 Pharmacy; Generic Drugs 252 Pharmacy; Non-Generic Drugs 254 Pharmacy; Drugs Incident to Other Diagnostic Services 255 Pharmacy; Drugs Incident to Radiology 257 Pharmacy; Non-Prescription 258 Pharmacy; IV Solutions 259 Pharmacy; Other Pharmacy 260 IV Therapy; General Classification 261 IV Therapy; Infusion Pump 262 IV Therapy; IV Therapy/Pharmacy Svcs 263 IV Therapy; IV Therapy/Drug/Supply Delivery 264 IV Therapy; IV Therapy/Supplies 269 IV Therapy; Other IV Therapy 270 Medical/Surgical Supplies and Devices; General Classification 271 Medical/Surgical Supplies and Devices; Non-sterile Supply 272 Medical/Surgical Supplies and Devices; Sterile Supply 275 Medical/Surgical Supplies and Devices; Pacemaker 276 Medical/Surgical Supplies and Devices; Intraocular Lens 278 Medical/Surgical Supplies and Devices; Other Implants 279 Medical/Surgical Supplies and Devices; Other Supplies/Devices 280 Oncology; General Classification 289 Oncology; Other Oncology
331 Radiology- Therapeutic and/or Chemotherapy Administration; Chemotherapy Admin – Injected
332 Radiology- Therapeutic and/or Chemotherapy Administration; Chemotherapy Admin – Oral
335 Radiology- Therapeutic and/or Chemotherapy Administration; Chemotherapy Admin – IV
343 Nuclear Medicine; Diagnostic Radiopharmaceuticals 344 Nuclear Medicine; Therapeutic Radiopharmaceuticals 360 Operating Room Services; General Classification 361 Operating Room Services; Minor Surgery 362 Operating Room Services; Organ Transplant- Other than Kidney 369 Operating Room Services; Other OR Services
39
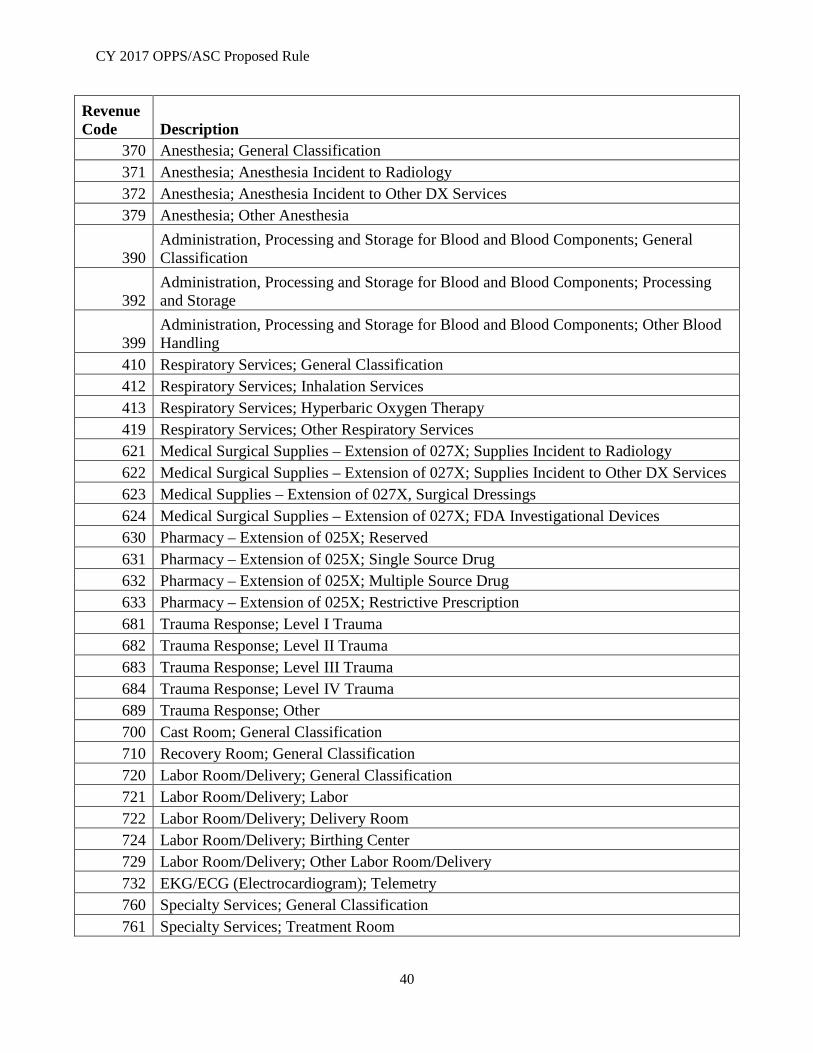
CY 2017 OPPS/ASC Proposed Rule
Revenue Code Description
370 Anesthesia; General Classification 371 Anesthesia; Anesthesia Incident to Radiology 372 Anesthesia; Anesthesia Incident to Other DX Services 379 Anesthesia; Other Anesthesia
390 Administration, Processing and Storage for Blood and Blood Components; General Classification
392 Administration, Processing and Storage for Blood and Blood Components; Processing and Storage
399 Administration, Processing and Storage for Blood and Blood Components; Other Blood Handling
410 Respiratory Services; General Classification 412 Respiratory Services; Inhalation Services 413 Respiratory Services; Hyperbaric Oxygen Therapy 419 Respiratory Services; Other Respiratory Services 621 Medical Surgical Supplies – Extension of 027X; Supplies Incident to Radiology 622 Medical Surgical Supplies – Extension of 027X; Supplies Incident to Other DX Services 623 Medical Supplies – Extension of 027X, Surgical Dressings 624 Medical Surgical Supplies – Extension of 027X; FDA Investigational Devices 630 Pharmacy – Extension of 025X; Reserved 631 Pharmacy – Extension of 025X; Single Source Drug 632 Pharmacy – Extension of 025X; Multiple Source Drug 633 Pharmacy – Extension of 025X; Restrictive Prescription 681 Trauma Response; Level I Trauma 682 Trauma Response; Level II Trauma 683 Trauma Response; Level III Trauma 684 Trauma Response; Level IV Trauma 689 Trauma Response; Other 700 Cast Room; General Classification 710 Recovery Room; General Classification 720 Labor Room/Delivery; General Classification 721 Labor Room/Delivery; Labor 722 Labor Room/Delivery; Delivery Room 724 Labor Room/Delivery; Birthing Center 729 Labor Room/Delivery; Other Labor Room/Delivery 732 EKG/ECG (Electrocardiogram); Telemetry 760 Specialty Services; General Classification 761 Specialty Services; Treatment Room
40
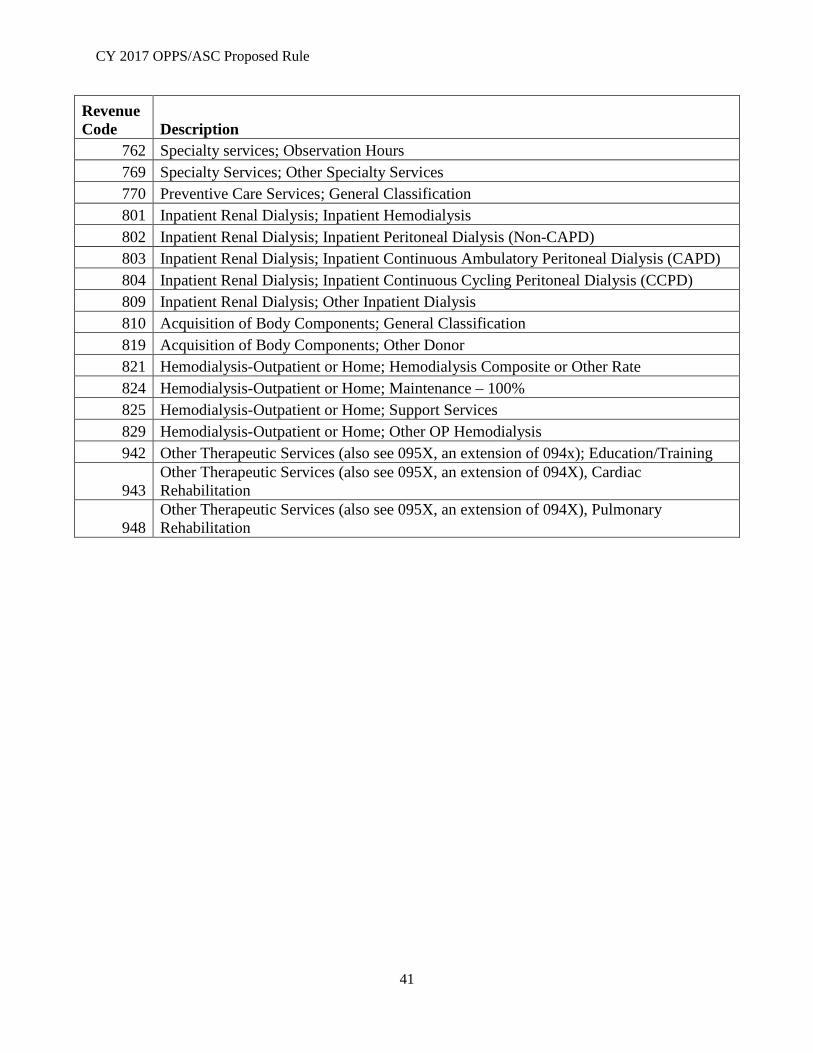
CY 2017 OPPS/ASC Proposed Rule
Revenue Code Description
762 Specialty services; Observation Hours 769 Specialty Services; Other Specialty Services 770 Preventive Care Services; General Classification 801 Inpatient Renal Dialysis; Inpatient Hemodialysis 802 Inpatient Renal Dialysis; Inpatient Peritoneal Dialysis (Non-CAPD) 803 Inpatient Renal Dialysis; Inpatient Continuous Ambulatory Peritoneal Dialysis (CAPD) 804 Inpatient Renal Dialysis; Inpatient Continuous Cycling Peritoneal Dialysis (CCPD) 809 Inpatient Renal Dialysis; Other Inpatient Dialysis 810 Acquisition of Body Components; General Classification 819 Acquisition of Body Components; Other Donor 821 Hemodialysis-Outpatient or Home; Hemodialysis Composite or Other Rate 824 Hemodialysis-Outpatient or Home; Maintenance – 100% 825 Hemodialysis-Outpatient or Home; Support Services 829 Hemodialysis-Outpatient or Home; Other OP Hemodialysis 942 Other Therapeutic Services (also see 095X, an extension of 094x); Education/Training
943 Other Therapeutic Services (also see 095X, an extension of 094X), Cardiac Rehabilitation
948 Other Therapeutic Services (also see 095X, an extension of 094X), Pulmonary Rehabilitation
41