Embed Size (px)
Citation preview

MEDICAL
OFFICESURVEYON PATIENT
SAFETYCULTURE
2016 USER COMPARATIVE DATABASE REPORT
Surveys on
Patient Safety
Culture™
PATIENTSAFETY


The authors of this report are responsible for its content. Statements in the report should not be construed as endorsement by the Agency for Healthcare Research and Quality or the U.S. Department of Health and Human Services.
Medical Office Survey on Patient Safety Culture: 2016 User Comparative Database Report
Prepared for: Agency for Healthcare Research and Quality U.S. Department of Health and Human Services 5600 Fishers Lane Rockville, MD 20857 www.ahrq.gov
Contract No. HHSA 290201300003C
Managed and prepared by: Westat, Rockville, MD
Theresa Famolaro, M.P.S., M.S. Naomi Dyer Yount, Ph.D. Ryan Hare Shakia Thornton Joann Sorra, Ph.D.
AHRQ Publication No. 16-0028-EFMay 2016
ii
This document is in the public domain and may be used and reprinted without permission except those copyrighted materials noted for which further reproduction is prohibited without specific permission of copyright holders.
Suggested Citation:
Famolaro T, Yount N, Hare R., et al. Medical Office Survey on Patient Safety Culture 2016 User Comparative Database Report. (Prepared by Westat, Rockville, MD, under Contract No. HHSA 290201300003C). Rockville, MD: Agency for Healthcare Research and Quality; May 2016. AHRQ Publication No. 16-0028-EF.
The authors of this report are responsible for its content. Statements in the report should not be construed as endorsement by the Agency for Healthcare Research and Quality or the U.S. Department of Health and Human Services.
No investigators have any affiliations or financial involvement (e.g., employment, consultancies, honoraria, stock options, expert testimony, grants or patents received or pending, or royalties) that conflict with material presented in this report.

iii
Table of Contents Executive Summary .......................................................................................................................1
Survey Content...........................................................................................................................1Survey Administration Statistics................................................................................................1Characteristics of Participating Medical Offices .......................................................................2Characteristics of Respondents ..................................................................................................2Areas of Strength for Most Medical Offices..............................................................................2Area With Potential for Improvement for Most Medical Offices..............................................2Results by Medical Office Characteristics .................................................................................3Results by Respondent Characteristics ......................................................................................4
Purpose and Use of This Report ...................................................................................................5Chapter 1. Introduction ................................................................................................................6
Survey Content...........................................................................................................................6Data Limitations.........................................................................................................................8
Chapter 2. Survey Administration Statistics .............................................................................10Chapter 3. Medical Office Characteristics ................................................................................12
Number of Providers ................................................................................................................12Single vs. Multi-Specialty ........................................................................................................13Specialty ...................................................................................................................................13Ownership ................................................................................................................................14Geographic Region ..................................................................................................................14
Chapter 4. Characteristics of Respondents ...............................................................................15Staff Position ............................................................................................................................15Additional Characteristics of Respondents ..............................................................................16
Chapter 5. Overall Results ..........................................................................................................17Composite and Item-Level Charts ...........................................................................................17Composite-Level Results .........................................................................................................17Item-Level Results ...................................................................................................................18Overall Ratings ........................................................................................................................31
Chapter 6. Comparing Your Results .........................................................................................35Description of Comparative Statistics .....................................................................................35Composite and Item-Level Comparative Tables .....................................................................38Appendices A and B: Overall Results by Medical Office and Respondent Characteristics ....47
Chapter 7. What’s Next? Action Planning for Improvement ..................................................50Seven Steps of Action Planning ...............................................................................................50
References .....................................................................................................................................54Notes: Description of Data Cleaning and Calculations ............................................................54
Data Cleaning...........................................................................................................................54Response Rates ........................................................................................................................55Calculation of Percent Positive Scores ....................................................................................55Item-Level Percent Positive Response.....................................................................................55Composite-Level Percent Positive Response...........................................................................56Item and Composite Percent Positive Scores Example ...........................................................56Percentiles ................................................................................................................................57

iv
List of Tables Table 1-1. Patient Safety Culture Composites and Definitions ...................................................... 6Table 1-2. Distribution of AHRQ Database Medical Offices (2016) Compared With U.S.
Economic Census, Offices of Physicians (2012) Data by Region .......................................... 9Table 2-1. Overall Response Rate Statistics – 2016 Database Medical Offices .......................... 10Table 2-2. Survey Administration Mode Statistics – 2016 Database Medical Offices ................ 11Table 2-3. Average Response Rate by Survey Administration Mode – 2016 Database
Medical Offices ..................................................................................................................... 11Table 3-1. Number of Providers: Distribution of 2016 Database Medical Offices ...................... 12Table 3-2. Single vs. Multi-Specialty: Distribution of 2016 Database Medical Offices .............. 13Table 3-3. Specific Specialties of Single Specialty Medical Offices: Distribution of 2016
Database Medical Offices ..................................................................................................... 13Table 3-4. Ownership: Distribution of 2016 Database Medical Offices ...................................... 14Table 3-5. Geographic Region: Distribution of 2016 Database Medical Offices
and Respondents ................................................................................................................... 14Table 4-1. Staff Position: Distribution of 2016 Database Medical Office Respondents .............. 15Table 4-2. Tenure in Medical Office: Distribution of 2016 Database Medical
Office Respondents ............................................................................................................... 16Table 4-3. Hours Worked per Week: Distribution of 2016 Database Medical
Office Respondents ............................................................................................................... 16Table 6-1. Interpretation of Percentile Scores .............................................................................. 37Table 6-2. Sample Percentile Statistics ......................................................................................... 38Table 6-3. Composite-Level Comparative Results – 2016 Database Medical Offices ................ 39Table 6-4. Item-Level Comparative Results – 2016 Database Medical Offices .......................... 40Table 6-5. Item-Level Comparative Results on Patient Safety and Quality Issues – 2016
Database Medical Offices ..................................................................................................... 44Table 6-6. Item-Level Comparative Results on Information Exchange With Other Settings –
2016 Database Medical Offices ............................................................................................ 45Table 6-7. Comparative Results on Average Overall Ratings on Quality and Patient Safety –
2016 Database Medical Offices ............................................................................................ 46Table N1. Example of Computing Item and Composite Percent Positive Scores ........................ 57Table N2. Data Table for Example of How To Compute Percentiles .......................................... 58
List of Charts Chart 5-1. Composite-Level Average Percent Positive Response – 2016 Database
Medical Offices ..................................................................................................................... 19Chart 5-2. Item-Level Average Percent Positive Response – 2016 Database Medical
Offices ................................................................................................................................... 20Chart 5-3. Item-Level Average Ratings on List of Patient Safety and Quality Issues –
2016 Database Medical Offices ............................................................................................ 24Chart 5-4. Item-Level Average Ratings on Information Exchange With Other Settings –
2016 Database Medical Offices ............................................................................................ 29Chart 5-5. Item-Level Average Overall Ratings on Quality – 2016 Database Medical
Offices ................................................................................................................................... 32
List of Figures Figure 7-1. Plan-Do-Study-Act Cycle .......................................................................................... 53

1
Executive Summary The Medical Office Survey on Patient Safety Culture is an expansion of AHRQ’s Hospital Survey on Patient Safety Culture to the medical office setting. The medical office survey is designed to measure the culture of patient safety in medical offices from the perspective of providers and staff. The Medical Office Survey on Patient Safety Culture 2016 User Comparative Database consists of data from 1,528 medical offices and 25,127 medical office respondents who completed the survey between November 2013 and November 2015.
This comparative database report was developed as a tool for the following purposes:
o Comparison—To allow medical offices to compare their patient safety culture survey results with other medical offices.
o Assessment and Learning—To provide data to medical offices to facilitate internal assessment and learning in the patient safety improvement process.
o Supplemental Information—To provide supplemental information to help medical offices identify their strengths and areas with potential for improvement in patient safety culture.
Survey Content The medical office survey includes 38 items that measure 10 composites of organizational culture pertaining to patient safety:
1. Communication About Error 2. Communication Openness 3. Office Processes and Standardization 4. Organizational Learning 5. Overall Perceptions of Patient Safety and Quality 6. Owner/Managing Partner/Leadership Support for Patient Safety 7. Patient Care Tracking/Followup 8. Staff Training 9. Teamwork 10. Work Pressure and Pace
The survey also includes questions that ask respondents about problems exchanging information with other settings and about access to care. In addition, respondents are asked to rate their medical office in five areas of health care quality (patient centered, effective, timely, efficient, and equitable) and to provide an overall rating on patient safety.
Survey Administration Statistics o A total of 1,528 medical offices submitted data for the 2016 report. o The average medical office response rate was 68 percent, with an average of 16
completed surveys per medical office.

2
Characteristics of Participating Medical Offices o Database medical offices vary in number of providers and specialties.o Most (86 percent) medical offices were owned by a hospital or health system.o More than half (58 percent) of medical offices were from the South Atlantic region.
Characteristics of Respondents o There were 25,127 medical office respondents.o The top three staff positions of respondents were:
• Other clinical staff or clinical support staff (30 percent).• Administrative or clerical staff (25 percent).• Registered Nurse (RN), Licensed Vocational Nurse (LVN), or Licensed Practical Nurse
(LPN) (17 percent).
o Nearly one-fourth of staff (23 percent) had worked at their medical office for 1 year toless than 3 years.
o Most respondents (58 percent) worked between 33 and 40 hours per week.
Areas of Strength for Most Medical Offices The following two areas of strength or composites had the highest average percent positive responsesi:
1. Teamwork (average 87 percent positive)—the extent to which the office has a culture ofteamwork, mutual respect, and close working relationships among staff and providers.
2. Patient Care Tracking/Follow-up (average 86 percent positive)—the extent to which theoffice reminds patients about appointments, documents how well patients followtreatment plans, follows up with patients who need monitoring, and follows up whenreports from an outside provider are not received.
Area With Potential for Improvement for Most Medical Offices 1. Work Pressure and Pace (average 50 percent positive)—the extent to which there are
enough staff and providers to handle the office patient load and the office work pace isnot hectic. This composite had the lowest average percent positive response.
i Percent positive is the percentage of positive responses (e.g., Agree, Strongly agree) to positively worded items (e.g., “Staff in this office follow standardized processes to get tasks done”) or negative responses (e.g., Disagree, Strongly disagree) to negatively worded items (e.g., “This office is more disorganized than it should be”).

3
Results by Medical Office Characteristics Number of Providers
o Medical offices with one provider had the highest average percent positive across thecomposites (79 percent); medical offices with 20 or more providers had the lowest (66percent).
o Percent positive scores for all five Overall Ratings on Quality (those responding“Excellent” or “Very Good”) were the highest for medical offices with one provider andthe lowest for medical offices with 20 or more providers.
o Medical offices with one provider had the highest percentage of respondents who gavetheir medical office an Overall Rating on Patient Safety of “Excellent” or “Very Good”(79 percent); medical offices with 20 or more providers had the lowest (55 percent).
Single Specialty vs. Multi-Specialty o Single specialty medical offices were generally more positive than Multi-specialty
medical offices on all 10 patient safety culture composites.o Single specialty medical offices had higher percent positive scores for all five Overall
Ratings on Quality (those responding “Excellent” or “Very Good”).o Single specialty medical offices had a higher percentage of respondents who gave their
medical office an Overall Rating on Patient Safety of “Excellent” or “Very Good” (70percent) than Multi-specialty medical offices (65 percent).
Specific Specialty o Medical offices that only specialized in Surgery/General Surgery had the highest average
percent positive response across the composites (79 percent); Orthopedics had the lowest(68 percent).
o Medical offices that only specialized in Surgery/General Surgery had higher percentpositive scores for four of the five Overall Ratings on Quality (those responding“Excellent” or “Very Good”).
o Medical offices that only specialized in Surgery/General Surgery had the highest OverallRating on Patient Safety (those responding “Excellent” or “Very Good”) (78 percent);Pulmonary Medicine had the lowest (63 percent).
Primary Care Specialty o Family Practice/Family Medicine medical offices had the highest average percent
positive response across the composites (75 percent); General Practice had the lowest(69 percent).
o Pediatrics had the highest percentage positive scores (those responding “Excellent” or“Very Good”) on three of the five Overall Ratings on Quality.
o OB/GYN medical offices had the highest Overall Rating on Patient Safety (thoseresponding “Excellent” or “Very Good”) (71 percent); General Practice had the lowest(64 percent).

4
Ownership o Hospital or health system owned medical offices had the highest average percent positive
response across the composites (74 percent); Community health centers had the lowest(67 percent).
o Hospital or health system owned medical offices had the highest percent positive scores(those responding “Excellent” or “Very Good”) on three (one of the ratings was a tie) ofthe five Overall Ratings on Quality.
o Hospital or health system owned medical offices had the highest Overall Rating onPatient Safety (those responding “Excellent” or “Very Good”) (70 percent); Communityhealth center owned medical offices had the lowest (55 percent).
Geographic Region o South Atlantic medical offices had the highest average percent positive response across
the composites (76 percent); Pacific had the lowest (59 percent).o South Atlantic medical offices had the highest percent positive scores (those responding
“Excellent” or “Very Good”) on four of the five Overall Ratings on Quality.o South Atlantic medical offices had the highest percentage of respondents who gave their
medical office an Overall Rating on Patient Safety of “Excellent” or “Very Good” (72percent); Pacific had the lowest (42 percent).
Results by Respondent Characteristics Staff Position
o Management had the highest average percent positive response across the composites (84percent); Nurses (RN/LVN/LPN), Physician Assistant/NP/Midwife/etc., and OtherClinical/Clinical Support Staff tied for the lowest (72 percent).
o Management had the highest percent positive scores for four of the five Overall Ratingson Quality (those responding “Excellent” or “Very Good”) they are tied with Physicianson one of the ratings]
o Management had the highest percentage who gave their medical office an Overall Ratingon Patient Safety of “Excellent” or “Very Good” (83 percent); Nurses (RN/LVN/LPN)had the lowest (65 percent).
Tenure in Medical Office o Respondents with less than 1 year in their current medical office had the highest average
percent positive response across the composites (77 percent); respondents with 3 years toless than 6 years had the lowest (70 percent).
o Respondents with less than 1 year in their current medical office had the highest percentpositive scores for three of the five Overall Ratings on Quality (those responding“Excellent” or “Very Good”).
o Respondents with less than 1 year or more than 11 years in their current medical office hadthe highest percentage of respondents who gave their medical office an Overall Rating onPatient Safety of “Excellent” or “Very Good” (70 percent); respondents with 3 years to lessthan 6 years in their current medical office had the lowest (64 percent).
5
Purpose and Use of This Report In response to requests from medical offices interested in comparing results with those of other medical offices on the Medical Office Survey on Patient Safety Culture, the Agency for Healthcare Research and Quality established the Medical Office Survey on Patient Safety Culture Comparative Database. The first Medical Office Survey on Patient Safety Culture User Comparative Database Report was released in 2012 and consisted of results from 934 medical offices and 23,679 respondents.
The Medical Office Survey on Patient Safety Culture 2016 User Comparative Database Report consists of data from 1,528 medical offices and 25,127 respondents.
This comparative database report was developed as a tool for the following purposes:
o Comparison—To allow medical offices to compare their patient safety culture surveyresults with other medical offices.
o Assessment and Learning—To provide data to medical offices to facilitate internalassessment and learning in the patient safety improvement process.
o Supplemental Information—To provide supplemental information to help medicaloffices identify their strengths and areas of potential improvement in patient safetyculture.
The report presents statistics (averages, standard deviations, minimum and maximum scores, and percentiles) on the patient safety culture composites and items from the survey.
Appendixes A and B present overall results by medical office characteristics (number of providers, single specialty vs. multi-specialty, specialty, primary care specialty, ownership, and region) and respondent characteristics (staff position and tenure in medical office).

6
Chapter 1. Introduction Patient safety is a critical component of health care quality. As medical offices continually strive to improve, there is growing recognition of the importance of establishing a culture of patient safety. Achieving a culture of patient safety requires an understanding of the values, beliefs, and norms about what is important in a medical office and which attitudes and behaviors related to patient safety are supported, rewarded, and expected.
Survey Content Recognizing the need for a measurement tool to assess the culture of patient safety in medical offices, the Agency for Healthcare Research and Quality (AHRQ) funded the development of the Medical Office Survey on Patient Safety Culture.
Developers reviewed research pertaining to safety, patient safety, health care quality, ambulatory medicine, medical errors, error reporting, safety climate and culture, and organizational climate and culture. In addition, they reviewed existing medical office surveys. The researchers also consulted more than two dozen experts in the field of medical office practice and patient safety and many medical office providers and staff for help in identifying key topics and issues. Based on these activities, the researchers identified a potential list of composites to include in the survey.
The survey was pilot tested and revised, and AHRQ released it in 2009. It was designed to assess medical office provider and staff opinions about patient safety issues, medical error, and event reporting. The survey includes 38 items that measure 10 composites of patient safety culture. In addition to the composite items, 14 items measure how often medical offices have problems exchanging information with other settings and other patient safety and quality issues. Each of the 10 patient safety culture composites is listed and defined in Table 1-1.
Table 1-1. Patient Safety Culture Composites and Definitions
Patient Safety Culture Composite Definition: The extent to which…. 1. Communication About Error Staff are willing to report mistakes they observe and do
not feel like their mistakes are held against them, and providers and staff talk openly about office problems and how to prevent errors from happening.
2. Communication Openness Providers in the office are open to staff ideas about how to improve office processes, and staff are encouraged to express alternative viewpoints and do not find it difficult to voice disagreement.
3. Office Processes and Standardization The office is organized, has an effective workflow, has standardized processes for completing tasks, and has good procedures for checking the accuracy of work performed.

7
Table 1-1. Patient Safety Culture Composites and Definitions (continued)
Patient Safety Culture Composite Definition: The extent to which…. 4. Organizational Learning The office has a learning culture that facilitates making
changes in office processes to improve the quality of patient care and evaluates changes for effectiveness.
5. Overall Perceptions of Patient Safetyand Quality
The quality of patient care is more important than getting more work done, office processes are good at preventing mistakes, and mistakes do not happen more than they should.
6. Owner/Managing Partner/LeadershipSupport for Patient Safety
Office leadership actively supports quality and patient safety, places a high priority on improving patient care processes, does not overlook mistakes, and makes decisions based on what is best for patients.
7. Patient Care Tracking/Follow-up The office reminds patients about appointments, documents how well patients follow treatment plans, follows up with patients who need monitoring, and follows up when reports from an outside provider are not received.
8. Staff Training The office provides staff with effective on-the-job training, trains staff on new processes, and does not assign staff tasks they have not been trained to perform.
9. Teamwork The office has a culture of teamwork, mutual respect, and close working relationships among staff and providers.
10. Work Pressure and Pace There are enough staff and providers to handle the patient load, and the office work pace is not hectic.
In addition to the composite items, the survey includes questions that ask respondents to rate their medical office in five areas of health care quality (patient centered, effective, timely, efficient, and equitable) and to provide an overall patient safety rating. Respondents also are asked to provide limited background demographic information.
The survey’s toolkit materials are available at the AHRQ Web site (http://www.ahrq.gov/professionals/quality-patient-safety/patientsafetyculture/medical-office/index.html) and include the survey, survey items and dimensions, user’s guide, information about a Data Entry and Analysis Tool, and a Medical Office Patient Safety Improvement Resource List. The toolkit provides medical offices with the basic knowledge and tools needed to conduct a patient safety culture assessment and suggestions for using the data.
The Medical Office Survey on Patient Safety Culture is available in Spanish on the AHRQ Web site. The Spanish translation is designed for U.S. Spanish-speaking respondents from different countries. Information for translators and translation guidelines are available for download at the AHRQ Web site (http://www.ahrq.gov/professionals/quality-patient-safety/patientsafetyculture/transguide.html).

8
Data Limitations The survey results presented in this report represent the largest known compilation of survey data on patient safety culture in medical offices that is currently available and therefore provide a useful reference for comparison. However, several data limitations should be kept in mind.
First, the medical offices that submitted data to the database are not a statistically selected sample of all U.S. medical offices, since only medical offices that administered the survey on their own and were willing to submit their data for inclusion in the database are represented. To provide a basic comparison of the database medical offices with these medical office population estimates, Table 1-2 shows the geographic distribution of the medical offices in the AHRQ Medical Office Survey on Patient Safety Culture database. This distribution is compared with the distribution of physicians’ offices based on the 2012 U.S. Economic Census estimates of the number of office-based medical practices.ii The geographic distribution categories are based on the American Hospital’s Association definition of geographic region.iii
The table shows that the 1,528 AHRQ database medical offices represent less than 1 percent of the estimated population of medical offices. In addition, database medical offices over represent the South Atlantic and East North Central regions and underrepresent medical offices in other regions.
Second, medical offices that administered the survey were not required to undergo any training and administered the survey in different ways. Some medical offices used a paper-only survey, others used Web-only surveys, and others used a combination of these two methods to collect the data. It is possible that these different modes could lead to differences in survey responses; further research is needed to determine whether and how different modes affect the results.
Finally, the data medical offices submitted have been cleaned for blank records (where responses to all survey items were missing or “Don’t know” with the exception of demographic items) and straight-lining (where responses to all survey items in a section were the same even though at least one item was negatively worded). Otherwise, data are presented as submitted. No additional attempts were made to verify or audit the accuracy of the data submitted.
ii U.S. regions are based on the American Hospital Association definition of geographic regions and calculated with data from the 2012 U.S. Economic Census, Health Care and Social Assistance, Offices of physicians, regions (see http://factfinder.census.gov/faces/tableservices/jsf/pages/productview.xhtml?pid=ECN_2012_US_62A1&prodType=table. iii States are categorized into American Hospital Association (AHA)-defined regions as follows: New England: CT, MA, ME, NH, RI, VT; Mid-Atlantic: NJ, NY, PA; South Atlantic: DC, DE, FL, GA, MD, NC, SC, VA, WV; East North Central: IL, IN, MI, OH, WI; East South Central: AL, KY, MS, TN; West North Central: IA, KS, MN, MO, ND, NE, SD; West South Central: AR, LA, OK, TX; Mountain: AZ, CO, ID, MT, NM, NV, UT, WY; Pacific: AK, CA, HI, OR, WA.

9
Table 1-2. Distribution of AHRQ Database Medical Offices (2016) Compared With U.S. Economic Census, Offices of Physicians (2012) Data by Region
Region
AHRQ Medical Office Survey on Patient Safety Culture Database
Medical Offices (2016) U.S. Economic Census,
Offices of Physicians (2012) Number Percent Number Percent
New England/Mid-Atlantic 97 6% 43,821 20% South Atlantic 885 58% 46,654 21% East North Central 303 20% 27,823 13% West North Central 67 4% 9,232 4% South Central 139 9% 39,911 18% Mountain 25 2% 15,412 7% Pacific 12 1% 38,037 17%
Total 1,528 100% 220,890 100%
Note: Percentages may not add to exactly 100 percent due to rounding. States are categorized into regions as follows: New England/Mid-Atlantic: CT, MA, ME, NH, RI, VT/NJ, NY, PA; South Atlantic: DC, DE, FL, GA, MD, NC, SC, VA, WV; East North Central: IL, IN, MI, OH, WI; West North Central: IA, KS, MN, MO, ND, NE, SD; South Central: AL, AR, KY, LA, MS, OK, TN TX; Mountain: AZ, CO, ID, MT, NM, NV, UT, WY; Pacific: AK, CA, HI, OR, WA.

10
Chapter 2. Survey Administration Statistics This chapter presents descriptive information on how the 2016 database medical offices administered the survey.
The 2016 database consists of survey data from 1,528 medical offices with a total of 25,127 medical office providers and staff respondents. Participating medical offices administered the medical office survey to their providers and staff between November 2013 and November 2015 and voluntarily submitted their data for inclusion in the database.
Table 2-1 shows overall response rate statistics for medical offices included in the 2016 database. An average of 16 completed surveys were submitted per medical office (range: 3 to 392), with an average medical office response rate of 68 percent (range: 6 to 100 percent).
Table 2-1. Overall Response Rate Statistics: 2016 Database Medical Offices
Overall Response Information Statistic Number of respondents 25,127 Number of surveys administered 37,576
Average Response Rate Information Statistic Average number of respondents per medical office (range: 3 to 392) 16 Average number of surveys administered per medical office (range: 5 to 902) 30 Overall average medical office response rate (range: 6% to 100%) 68%
Note: 264 medical offices with a total of 4,829 respondents did not provide the number of surveys administered and therefore are excluded from the following statistics: Number of surveys administered, average number of surveys administered per medical office, and overall average medical office response rate.
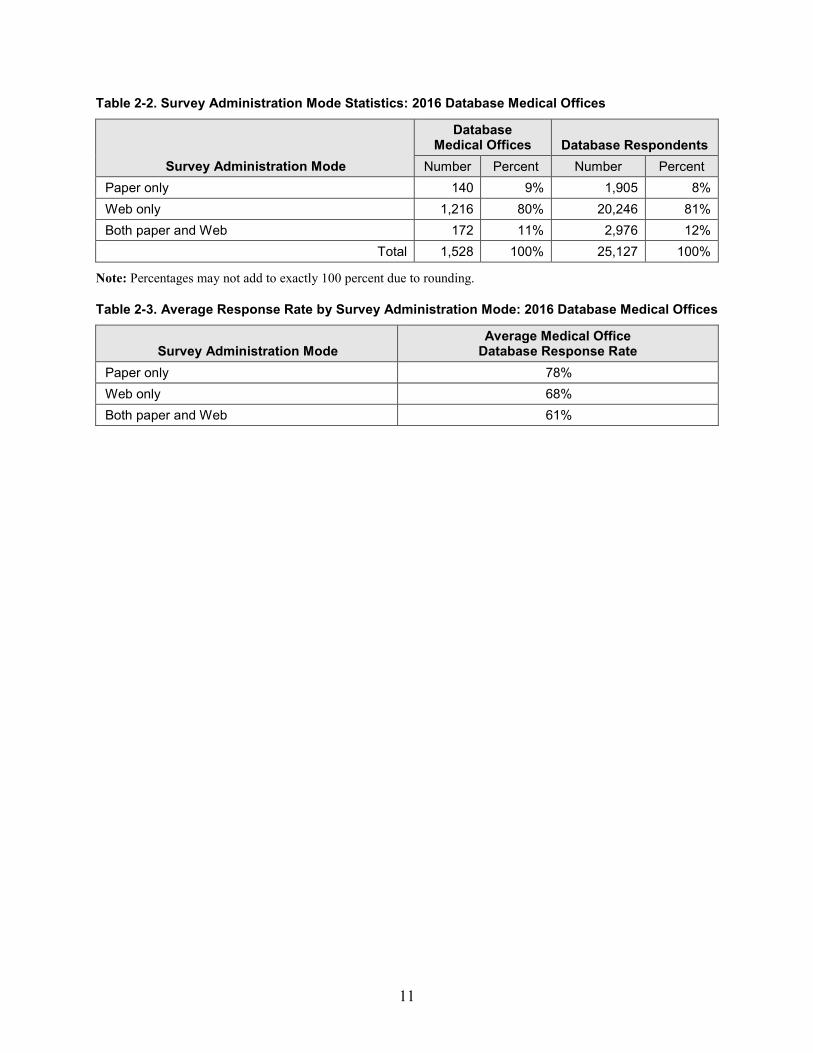
Most medical offices administered the survey by Web only (80 percent), as shown in Table 2-2; however, paper-only administration had the highest average response rate (78 percent), as shown in Table 2-3.
Highlights
o The 2016 database consists of data from 25,127 medical office staff respondentsfrom 1,528 medical offices.
o The average medical office response rate was 68 percent, with an average of 16completed surveys per medical office.
o Most medical offices (80 percent) administered Web surveys, which resulted inlower response rates (68 percent) compared with response rates from paper (78percent).
11
Table 2-2. Survey Administration Mode Statistics: 2016 Database Medical Offices
Survey Administration Mode
Database Medical Offices Database Respondents
Number Percent Number Percent Paper only 140 9% 1,905 8% Web only 1,216 80% 20,246 81% Both paper and Web 172 11% 2,976 12%
Total 1,528 100% 25,127 100%
Note: Percentages may not add to exactly 100 percent due to rounding.
Table 2-3. Average Response Rate by Survey Administration Mode: 2016 Database Medical Offices
Survey Administration Mode Average Medical Office
Database Response Rate Paper only 78% Web only 68% Both paper and Web 61%

12
Chapter 3. Medical Office Characteristics This chapter presents information about the distribution of database medical offices by number of providers, single vs. multi-specialty, specific specialties, ownership, and region. Some medical offices did not provide complete medical office information and therefore are shown as missing in the tables in this chapter.
Number of Providers
Table 3-1 shows the distribution of medical offices and respondents by number of providers. More than three-fourths (79 percent) of database medical offices had fewer than 10 providers.
Table 3-1. Number of Providers: Distribution of 2016 Database Medical Offices
Number of Providers
Database Medical Offices
Database Respondents
Number Percent Number Percent 1 153 10% 1,008 4% 2 203 13% 1,545 6% 3 253 17% 2,231 9% 4-9 594 39% 8,068 32% 10-13 114 7% 2,532 10% 14-19 77 5% 1,920 8% More than 19 134 9% 7,823 31%
Total 1,528 100% 25,127 100%
Highlights
o More than three-fourths (79 percent) of medical offices had fewer than 10 providers.
o Most medical offices (77 percent) were from single specialties.o The single specific specialty with the highest percentage was Family
Practice/Family Medicine (25 percent).o Most medical offices (86 percent) were owned by a hospital or health system.o More than half (58 percent) of medical offices were from the South Atlantic.
13
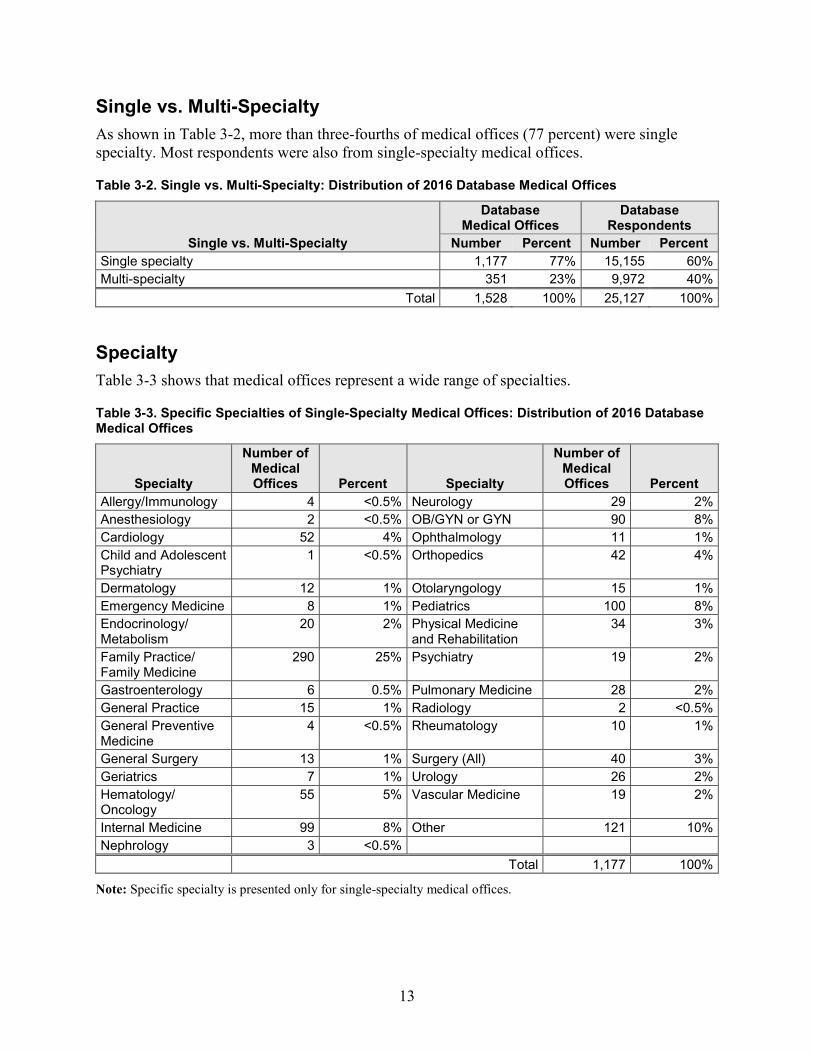
Single vs. Multi-Specialty As shown in Table 3-2, more than three-fourths of medical offices (77 percent) were single specialty. Most respondents were also from single-specialty medical offices.
Table 3-2. Single vs. Multi-Specialty: Distribution of 2016 Database Medical Offices
Single vs. Multi-Specialty
Database Medical Offices
Database Respondents
Number Percent Number Percent Single specialty 1,177 77% 15,155 60% Multi-specialty 351 23% 9,972 40%
Total 1,528 100% 25,127 100%
Specialty Table 3-3 shows that medical offices represent a wide range of specialties.
Table 3-3. Specific Specialties of Single-Specialty Medical Offices: Distribution of 2016 Database Medical Offices
Specialty
Number of Medical Offices Percent Specialty
Number of Medical Offices Percent
Allergy/Immunology 4 <0.5% Neurology 29 2% Anesthesiology 2 <0.5% OB/GYN or GYN 90 8% Cardiology 52 4% Ophthalmology 11 1% Child and Adolescent Psychiatry
1 <0.5% Orthopedics 42 4%
Dermatology 12 1% Otolaryngology 15 1% Emergency Medicine 8 1% Pediatrics 100 8% Endocrinology/ Metabolism
20 2% Physical Medicine and Rehabilitation
34 3%
Family Practice/ Family Medicine
290 25% Psychiatry 19 2%
Gastroenterology 6 0.5% Pulmonary Medicine 28 2% General Practice 15 1% Radiology 2 <0.5% General Preventive Medicine
4 <0.5% Rheumatology 10 1%
General Surgery 13 1% Surgery (All) 40 3% Geriatrics 7 1% Urology 26 2% Hematology/ Oncology
55 5% Vascular Medicine 19 2%
Internal Medicine 99 8% Other 121 10% Nephrology 3 <0.5%
Total 1,177 100%
Note: Specific specialty is presented only for single-specialty medical offices.

14
Ownership As shown in Table 3-4, more than three-fourths (86 percent) of medical offices were owned by a hospital or health system.
Table 3-4. Ownership: Distribution of 2016 Database Medical Offices
Ownership
Database Medical Offices
Database Respondents
Number Percent Number Percent Hospital or health system 1,312 86% 22,498 90% University or academic medical center 137 9% 1,837 7% Community health center 45 3% 488 2% Federal, State, or local government 22 1% 133 1% Providers and/or physicians 12 1% 171 1%
Total 1,528 100% 25,127 100%
Note: Percentages may not add to exactly 100 percent due to rounding.
Geographic Region Table 3-5 shows the distribution of database medical offices by geographic region. The largest percentages of database medical offices are from the South Atlantic (58 percent) and East North Central regions (20 percent).
Table 3-5. Geographic Region: Distribution of 2016 Database Medical Offices and Respondents
Region
Database Medical Offices
Database Respondents
Number Percent Number Percent New England/Mid-Atlantic 97 6% 2,229 9% South Atlantic 885 58% 11,561 46% East North Central 303 20% 6,825 27% West North Central 67 4% 514 2% South Central 139 9% 2,504 10% Mountain 25 2% 318 1% Pacific 12 1% 1,176 5%
Total 1,528 100% 25,127 100%
Note: Percentages may not add to exactly 100 percent due to rounding. States are categorized into regions as follows: New England/Mid-Atlantic: CT, MA, ME, NH, RI, VT/NJ, NY, PA; South Atlantic: DC, DE, FL, GA, MD, NC, SC, VA, WV; East North Central: IL, IN, MI, OH, WI; West North Central: IA, KS, MN, MO, ND, NE, SD; South Central: AL, AR, KY, LA, MS, OK, TN, TX; Mountain: AZ, CO, ID, MT, NM, NV, UT, WY; Pacific: AK, CA, HI, OR, WA.

15
Chapter 4. Characteristics of Respondents This chapter describes the respondents within the participating medical offices. Respondents from medical offices that omitted one of these questions, or those who did not respond, are shown as missing in the tables and are excluded from total percentages in this chapter.
Staff Position About one-third (30 percent) of respondents selected “Other clinical staff or clinical support staff” as their staff position, followed by “Administrative or clerical staff” (25 percent) and “Registered Nurse (RN), Licensed Vocational Nurse (LVN), Licensed Practical Nurse (LPN)” (17 percent) (Table 4-1).
Table 4-1. Staff Position: Distribution of 2016 Database Medical Office Respondents
Medical OfficeStaff Position Database Respondents Number Percent
Other clinical staff or clinical support staff 7,133 30% Administrative or clerical staff 5,890 25% Registered Nurse (RN), Licensed Vocational Nurse (LVN), Licensed Practical Nurse (LPN)
4,067 17%
Physician (MD or DO) 2,584 11% Management 1,775 7% Physician assistant, nurse practitioner, clinical nurse specialist, nurse midwife, advanced practice nurse, etc.
1,016 4%
Other position 1,326 6% Total 23,791 100%
Missing 1,336 Overall 25,127
Note: Percentages may not add to exactly 100 percent due to rounding.
Highlights
• The top three staff positions of respondents were:
o Other clinical staff or clinical support staff (30 percent)o Administrative or clerical staff (25 percent)o Registered Nurse (RN), Licensed Vocational Nurse (LVN), or Licensed
Practical Nurse (LPN) (17 percent).
• Nearly one-fourth of respondents (22 percent) had worked at their medical office for11 years or more.
• Most respondents (58 percent) worked between 33 and 40 hours per week.

16
Additional Characteristics of Respondents Tables 4-2 and 4-3 show the distribution of respondents by tenure and hours worked per week.
Table 4-2. Tenure in Medical Office: Distribution of 2016 Database Medical Office Respondents
Tenure in Medical Office Database Respondents Number Percent
Less than 2 months 543 2% 2 months to less than 1 year 3,563 15% 1 year to less than 3 years 5,354 23% 3 years to less than 6 years 4,312 19% 6 years to less than 11 years 4,223 18% 11 years or more 5,018 22%
Total 23,013 100% Missing 2,114
Overall total 25,127
Note: Percentages may not add to exactly 100 percent due to rounding.
Table 4-3. Hours Worked per Week: Distribution of 2016 Database Medical Office Respondents
Hours Worked per Week in Medical Office Database Respondents Number Percent
1 to 4 hours 187 1% 5 to 16 hours 806 3% 17 to 24 hours 1,327 6% 25 to 32 hours 1,639 7% 33 to 40 hours 13,502 58% 41 hours or more 5,740 25%
Total 23,201 100% Missing 1,926
Overall total 25,127

17
Chapter 5. Overall Results This chapter presents the overall survey results for the database, showing the average percentage of positive responses across the database medical offices on each of the survey’s items and composites. Reporting the average across medical offices ensures that each medical office receives an equal weight that contributes to the overall average.
Reporting the data at the medical office level in this way is important because culture is considered to be a group characteristic and is not considered to be a solely individual characteristic. An alternative method would be to report a straight percentage of positive responses across all respondents, but this method would give greater weight to respondents from larger medical offices.
Composite and Item-Level Charts This section provides the overall item and composite-level results. The methods for calculating the percent positive scores at the item and composite levels are described in the Notes section of this report.
Composite-Level Results Chart 5-1 shows the average percent positive response for each of the 10 patient safety culture composites across medical offices in the database. The patient safety culture composites are shown in order from the highest average percent positive response to the lowest.
Highlights • The areas of strength or the composites with the highest average percent positive
responses were:
o Teamwork (average 87 percent positive).o Patient Care Tracking/Followup (average 86 percent positive).
• The area with potential for improvement or the composite with the lowest averagepercent positive responses was:
o Work Pressure and Pace (average 50 percent positive).
• On average across medical offices, most respondents (68 percent) gave their medicaloffice an Overall Patient Safety rating of “Excellent” (29 percent) or “Very Good” (39percent).

18
Areas of Strength • Teamwork (average 87 percent positive)—the office has a culture of teamwork, mutual
respect, and close working relationships among staff and providers.• Patient Care Tracking/Follow-up(average 86 percent positive)—the office reminds patients
about appointments, documents how well patients follow treatment plans, follows up withpatients who need monitoring, and follows up when reports from an outside provider are notreceived.
Area With Potential for Improvement • Work Pressure and Pace (average 50 percent positive)—there are enough staff and
providers to handle the patient load, and the office work pace is not hectic.
Item-Level Results Chart 5-2 shows the average percent positive response for each of the 38 survey composite items. The items are grouped by the patient safety culture composite they are intended to measure. Within each composite, the items are presented in the order in which they appear in the survey. Chart 5-3 shows the item-level average ratings on a list of patient safety and quality issues, and Chart 5-4 shows the item-level average ratings on information exchange with other settings.
Area of Strength for the Patient Safety Culture Composite Items • The composite items with the highest average percent positive response (90 percent positive)
were from the patient safety culture composite Teamwork, (C2) “In this office there is a goodworking relationship between staff and providers” and the Patient Care Tracking/Follow-upcomposite: (D9) “This office follows up with patients who need monitoring.”
Area With Potential for Improvement for the Patient Safety Culture Composite Items • The composite item with the lowest average percent positive response (39 percent positive)
was from the patient safety culture composite Work Pressure and Pace: (C3) “In this office,we often feel rushed when taking care of patients.” (That is, an average of only 39 percent ofrespondents in each medical office Strongly disagreed or Disagreed with this negativelyworded item.)
Area of Strength for Patient Safety and Quality Items • The Patient Safety and Quality item with the highest average percent positive response (98
percent positive) was: (A2) “The wrong chart/medical record was used for a patient.” (Thatis, an average of 98 percent of respondents in each medical office indicated that thefrequency of this event occurring was monthly or less in the past 12 months.)
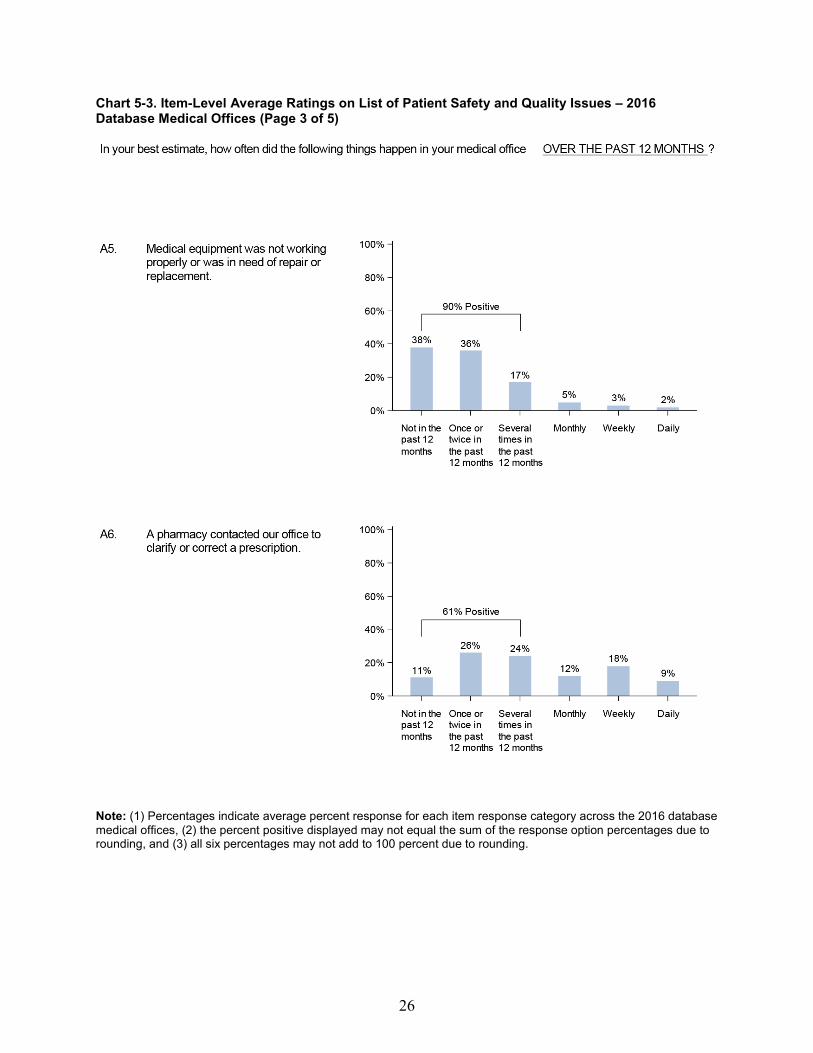
Area With Potential for Improvement for Patient Safety and Quality Items • The Patient Safety and Quality item with the lowest average percent positive response (61
percent positive) was (A6) “A pharmacy contacted our office to clarify or correct aprescription.”

Patient Safety Culture Composites % Positive Response
1. Teamwork87%
2. Patient Care Tracking/Follow-up86%
3. Overall Perceptions of Patient Safety and Quality
80%
4. Organizational Learning80%
5. Staff Training75%
6. Communication About Error 71%
7. Communication Openness69%
8. Office Processes and Standardization
69%
9. Owner/Managing Partner/Leadership Support for Patient Safety
69%
10. Work Pressure and Pace50%
Chart 5-1. Composite-Level Average Percent Positive Response – 2016 Database Medical Offices
19

Survey Items By Patient Safety Culture Composite
Survey Item % Positive Response
1. Teamwork
1. When someone in this office gets really busy, others helpout. (C1)
86%
2. In this office, there is a good working relationshipbetween staff and providers. (C2)
90%
3. In this office, we treat each other with respect. (CS) 86%
4. This office emphasizes teamwork in taking care ofpatients. (C 13)
86%
2. Patient Care Tracking/Follow-up
1. This office reminds patients when they need to schedulean appointment for preventive or routine care. (D3)
87%
2. This office documents how well our chronic-care patientsfollow their treatment plans. (D5)
80%
3. Our office follows up when we do not receive a report we are expecting from an outside provider. (D6)
86%
4. This office follows up with patients who need monitoring(D9)
. 90%
3. Overall Perceptions of Patient Safety and Quality
1. Our office processes are good at preventing mistakesthat could affect patients. (F2)
86%
2. Mistakes happen more than they should in this office.(F3R)
81%
3. It is just by chance that we don't make more mistakesthat affect our patients. (F4R)
79%
4. In this office, getting more work done is more importantthan quality of care. (F6R)
73%
Chart 5-2. Item-Level Average Percent Positive Response – 2016 Database Medical Offices (Page 1 of 4)
Note: The item’s survey location is shown after the item text. An “R” indicates a negatively worded item, where the percent positive response is based on those who responded “Strongly disagree” or “Disagree,” or “Never” or “Rarely” (depending on the response category used for the item).
20

Survey Items By Patient Safety Culture Composite
4. Organizational Learning
1. When there is a problem in our office, we see if we needto change the way we do things. (F1)
84%
2. This office is good at changing office processes to makesure the same problems don't happen again. (F5)
80%
3. After this office makes changes to improve the patientcare process, we check to see if the changes worked. (F7)
75%
5. Staff Training
1. This office trains staff when new processes are put intoplace. (C4)
77%
2. This office makes sure staff get the on-the-job trainingthey need. (C7)
76%
3. Staff in this office are asked to do tasks they haven'tbeen trained to do. (C10R)
70%
6. Communication About Error
1. Staff feel like their mistakes are held against them. (D7R) 62%
2. Providers and staff talk openly about office problems(D8)
. 62%
3. In this office, we discuss ways to prevent errors fromhappening again. (D11)
83%
4. Staff are willing to report mistakes they observe in thisoffice. (D12)
Survey Item % Positive Response
78%
Chart 5-2. Item-Level Average Percent Positive Response – 2016 Database Medical Offices (Page 2 of 4)
Note: The item’s survey location is shown after the item text. An “R” indicates a negatively worded item, where the percent positive response is based on those who responded “Strongly disagree” or “Disagree,” or “Never” or “Rarely” (depending on the response category used for the item).
21

Survey Items By Patient Safety Culture Composite
7. Communication Openness
1. Providers in this office are open to staff ideas about howto improve office processes. (D1)
72%
2. Staff are encouraged to express alternative viewpoints inthis office. (D2)
71%
3. Staff are afraid to ask questions when something doesnot seem right. (D4R)
74%
4. It is difficult to voice disagreement in this office. (D10R) 59%
8. Office Processes and Standardization
1. This office is more disorganized than it should be. (C8R) 66%
2. We have good procedures for checking that work in thisoffice was done correctly. (C9)
72%
3. We have problems with workflow in this office. (C12R) 55%
4. Staff in this office follow standardized processes to get tasks done. (C15)
83%
9. Owner/Managing Partner/Leadership Support for PatientSafety1. They aren't investing enough resources to improve thequality of care in this office. (E1 R)
50%
2. They overlook patient care mistakes that happen overand over. (E2R)
82%
3. They place a high priority on improving patient careprocesses. (E3)
81%
4. They make decisions too often based on what is best forthe office rather than what is best for patients. (E4R)
Survey Item % Positive Response
61%
Chart 5-2. Item-Level Average Percent Positive Response – 2016 Database Medical Offices (Page 3 of 4)
Note: The item’s survey location is shown after the item text. An “R” indicates a negatively worded item, where the percent positive response is based on those who responded “Strongly disagree” or “Disagree,” or “Never” or “Rarely” (depending on the response category used for the item).
22

Survey Items By Patient Safety Culture Composite
10. Work Pressure and Pace
1. In this office, we often feel rushed when taking care ofpatients. (C3R)
39%
2. We have too many patients for the number of providers inthis office. (C6R)
50%
3. We have enough staff to handle our patient load. (C 1 1) 50%
4. This office has too many patients to be able to handleeverything effectively. (C14R)
Survey Item % Positive Response
61%
Chart 5-2. Item-Level Average Percent Positive Response – 2016 Database Medical Offices (Page 4 of 4)
Note: The item’s survey location is shown after the item text. An “R” indicates a negatively worded item, where the percent positive response is based on those who responded “Strongly disagree” or “Disagree,” or “Never” or “Rarely” (depending on the response category used for the item).
23

24
Chart 5-3. Item-Level Average Ratings on List of Patient Safety and Quality Issues – 2016 Database Medical Offices (Page 1 of 5)
Note: (1) Percentages indicate average percent response for each item response category across the 2016 database medical offices, (2) the percent positive displayed may not equal the sum of the response option percentages due to rounding, and (3) all six percentages may not add to 100 percent due to rounding.

25
Chart 5-3. Item-Level Average Ratings on List of Patient Safety and Quality Issues – 2016 Database Medical Offices (Page 2 of 5)
Note: (1) Percentages indicate average percent response for each item response category across the 2016 database medical offices, (2) the percent positive displayed may not equal the sum of the response option percentages due to rounding, and (3) all six percentages may not add to 100 percent due to rounding.
26
Chart 5-3. Item-Level Average Ratings on List of Patient Safety and Quality Issues – 2016 Database Medical Offices (Page 3 of 5)
Note: (1) Percentages indicate average percent response for each item response category across the 2016 database medical offices, (2) the percent positive displayed may not equal the sum of the response option percentages due to rounding, and (3) all six percentages may not add to 100 percent due to rounding.

27
Chart 5-3. Item-Level Average Ratings on List of Patient Safety and Quality Issues – 2016 Database Medical Offices (Page 4 of 5)
Note: (1) Percentages indicate average percent response for each item response category across the 2016 database medical offices, (2) the percent positive displayed may not equal the sum of the response option percentages due to rounding, and (3) all six percentages may not add to 100 percent due to rounding.

28
Chart 5-3. Item-Level Average Ratings on List of Patient Safety and Quality Issues – 2016 Database Medical Offices (Page 5 of 5)
Note: (1) Percentages indicate average percent response for each item response category across the 2016 database medical offices, (2) the percent positive displayed may not equal the sum of the response option percentages due to rounding, and (3) all six percentages may not add to 100 percent due to rounding.
29
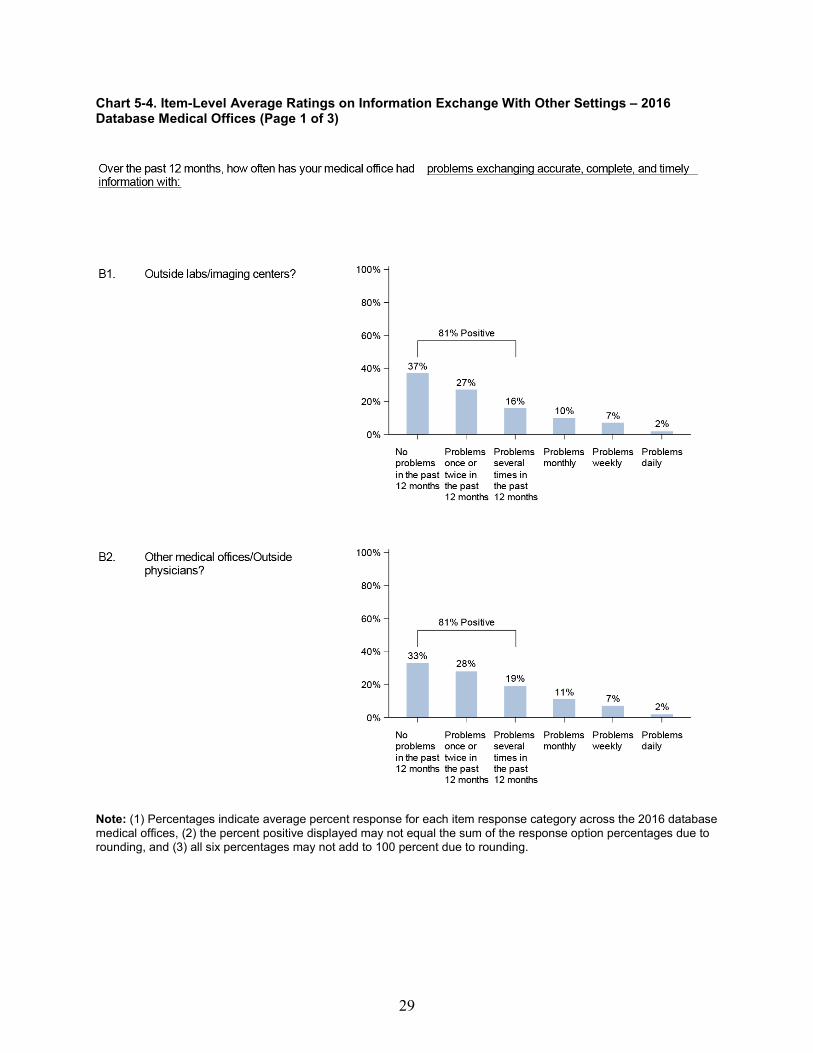
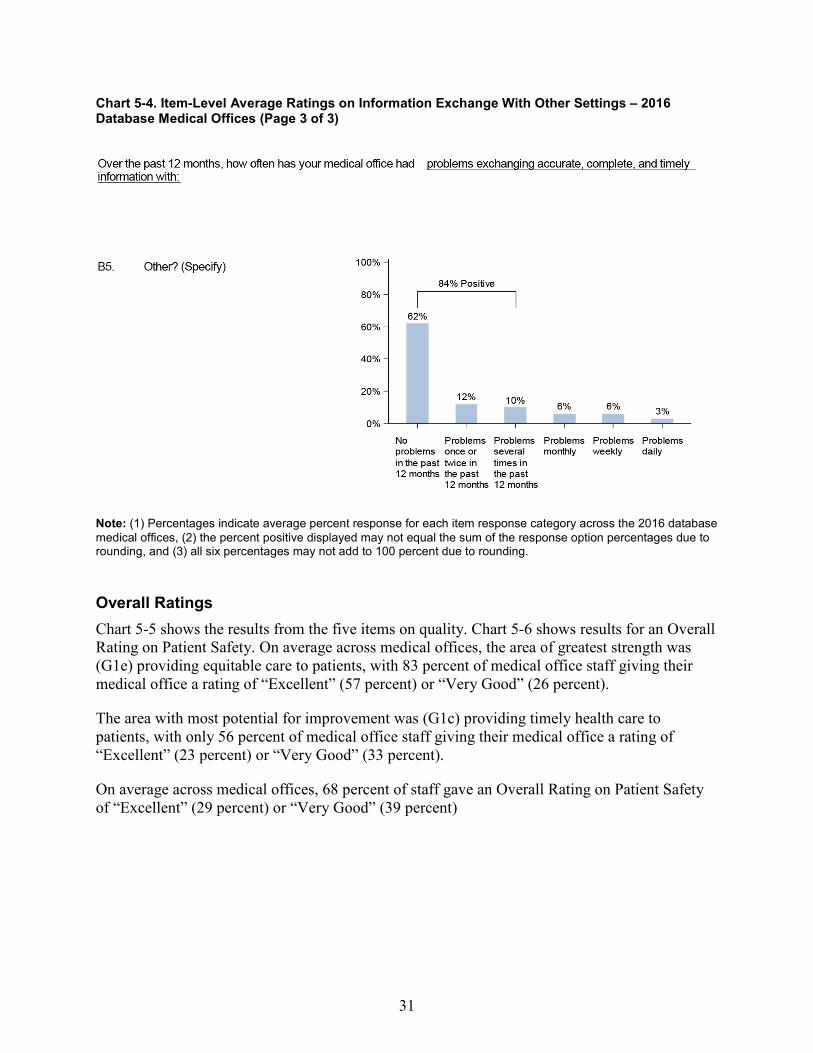
Chart 5-4. Item-Level Average Ratings on Information Exchange With Other Settings – 2016 Database Medical Offices (Page 1 of 3)
Note: (1) Percentages indicate average percent response for each item response category across the 2016 database medical offices, (2) the percent positive displayed may not equal the sum of the response option percentages due to rounding, and (3) all six percentages may not add to 100 percent due to rounding.

30
Chart 5-4. Item-Level Average Ratings on Information Exchange With Other Settings – 2016 Database Medical Offices (Page 2 of 3)
Note: (1) Percentages indicate average percent response for each item response category across the 2016 database medical offices, (2) the percent positive displayed may not equal the sum of the response option percentages due to rounding, and (3) all six percentages may not add to 100 percent due to rounding.
31
Chart 5-4. Item-Level Average Ratings on Information Exchange With Other Settings – 2016 Database Medical Offices (Page 3 of 3)
Note: (1) Percentages indicate average percent response for each item response category across the 2016 database medical offices, (2) the percent positive displayed may not equal the sum of the response option percentages due to rounding, and (3) all six percentages may not add to 100 percent due to rounding.
Overall Ratings Chart 5-5 shows the results from the five items on quality. Chart 5-6 shows results for an Overall Rating on Patient Safety. On average across medical offices, the area of greatest strength was (G1e) providing equitable care to patients, with 83 percent of medical office staff giving their medical office a rating of “Excellent” (57 percent) or “Very Good” (26 percent).
The area with most potential for improvement was (G1c) providing timely health care to patients, with only 56 percent of medical office staff giving their medical office a rating of “Excellent” (23 percent) or “Very Good” (33 percent).
On average across medical offices, 68 percent of staff gave an Overall Rating on Patient Safety of “Excellent” (29 percent) or “Very Good” (39 percent)
32
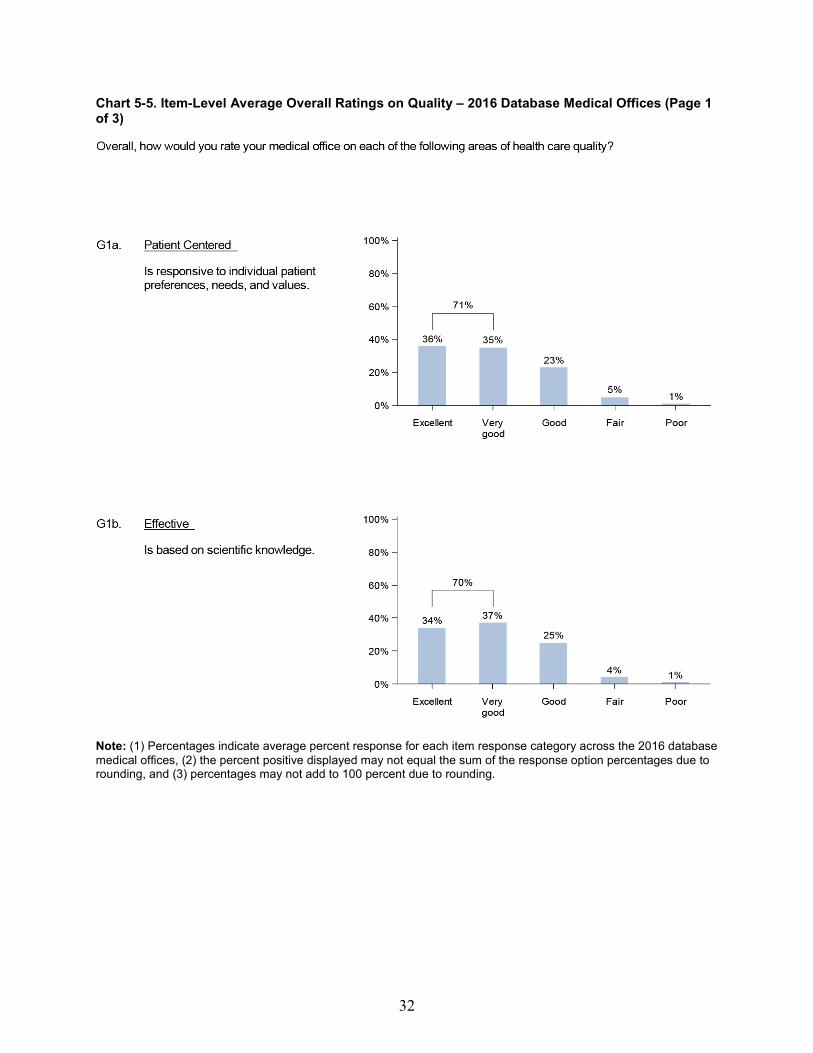
Chart 5-5. Item-Level Average Overall Ratings on Quality – 2016 Database Medical Offices (Page 1 of 3)
Note: (1) Percentages indicate average percent response for each item response category across the 2016 database medical offices, (2) the percent positive displayed may not equal the sum of the response option percentages due to rounding, and (3) percentages may not add to 100 percent due to rounding.

33
Chart 5-5. Item-Level Average Overall Ratings on Quality – 2016 Database Medical Offices (Page 2 of 3)
Note: (1) Percentages indicate average percent response for each item response category across the 2016 database medical offices and (2) percentages may not add to 100 percent due to rounding.

34
Chart 5-5. Item-Level Average Overall Ratings on Quality – 2016 Database Medical Offices (Page 3 of 3)
Chart 5-6. Item-Level Average Overall Rating on Patient Safety — 2016 Database Medical Offices
Note: (1) Percentages indicate average percent response for each item response category across the 2016 database medical offices and (2) percentages may not add to 100 percent due to rounding.

35
Chapter 6. Comparing Your Results To compare your medical office’s survey results with the results from the database, you need to calculate your medical office’s percent positive response on the survey’s 10 composites and other survey items, including patient safety and quality issues, information exchange with other settings, and ratings on quality and patient safety. The Notes section at the end of this report describes how to calculate these percent positive scores. You can then compare your medical office’s results with the database averages and examine the percentile scores to place your medical office’s results relative to the distribution of database medical offices.
When comparing your medical office’s results with results from the database, keep in mind that the database only provides relative comparisons. Even though your medical office’s survey results may be better than the database statistics, you may still believe there is room for improvement in a particular area within your medical office in an absolute sense.
The comparative data provided in this report should be used to supplement your medical office’s own efforts toward identifying areas of strength and areas on which to focus patient safety culture improvement efforts.
Description of Comparative Statistics
In addition to the average percent positive scores presented in Chapter 5, a number of other statistics are provided to facilitate comparisons with the database medical offices. A description of each statistic shown in this chapter is provided next.
Average Percent Positive The comparative results tables in this chapter present the average percent positive scores for each of the 10 patient safety culture composites and for the 51 survey items. These average percent positive scores were calculated by averaging composite-level percent positive scores across all medical offices in the database, as well as averaging item-level percent positive scores across
Highlights
• There was considerable variability in the range of medical office scores (lowest tohighest) across the 10 patient safety culture composites and items.
• Many of the items and composites showed a range of positive response from 0 or near 0to 100 percent.

36
medical offices. Since the percent positive is displayed as an overall average, scores from each medical office are weighted equally in their contribution to the calculation of the average.iv
Standard Deviation The standard deviation (s.d.), a measure of the spread or variability of medical office scores around the average, is also displayed. The standard deviation tells you the extent to which medical offices’ scores differ from the average:
• If scores from all medical offices were exactly the same, then the average wouldrepresent all their scores perfectly and the standard deviation would be zero.
• If scores from all medical offices were very close to the average, then the standarddeviation would be small and close to zero.
• If scores from many medical offices were very different from the average, then thestandard deviation would be a large number.
When the distribution of medical office scores follows a normal bell-shaped curve (where most of the scores fall in the middle of the distribution, with fewer scores at the lower and higher ends of the distribution), the average, plus or minus the standard deviation, will include about 68 percent of all medical office scores. For example, if an average percent positive score across the database medical office was 70 percent with a standard deviation of 10 percent (and scores were normally distributed), then about 68 percent of all the database medical offices would have scores between 60 and 80 percent.
Statistically “Significant” Differences Between Scores
You may be interested in determining the statistical significance of differences between your scores and the averages in the database, or between scores in various breakout categories (e.g., numbers of providers and staff). Statistical significance is greatly influenced by sample size; as the number of observations in comparison groups increases, small differences in scores become statistically significant. While a 1 percentage point difference between percent positive scores might be “statistically” significant (that is, not due to chance), the difference is not likely to be meaningful or “practically” significant.
Keep in mind that statistically significant differences are not always important, and nonsignificant differences are not always trivial. We provide the average, standard deviation, range, and percentile information so that you can compare your data with the database in different ways.
iv An alternative method would be to report a straight percentage of positive response across all respondents, but this method would give greater weight to respondents from larger medical offices.

37
Minimum and Maximum Scores The minimum (lowest) and maximum (highest) percent positive scores are presented for each composite and item. These scores provide information about the range of percent positive scores obtained by medical offices in the database and are actual scores from the lowest and highest scoring medical offices.
Percentiles The 10th, 25th, 50th (or median), 75th, and 90th percentile scores are displayed for the survey composites and items. Percentiles provide information about the distribution of medical office scores. To calculate percentile scores, we ranked all medical office percent positive scores in order from low to high. A specific percentile score shows the percentage of medical offices that scored at or below a particular score. For example, the 50th percentile, or median, is the percent positive score where 50 percent of the medical offices scored the same or lower and 50 percent of the medical offices scored higher.
When the distribution of medical office scores follows a normal bell-shaped curve (where most of the scores fall in the middle of the distribution with fewer scores at the lower and higher ends of the distribution), the 50th percentile, or median, will be very similar to the average score. Interpret the percentile scores as shown in Table 6-1.
Table 6-1. Interpretation of Percentile Scores
Percentile Score Interpretation 10th percentile Represents the lowest scoring medical offices.
10% of medical offices scored the same or lower. 90% of medical offices scored higher.
25th percentile Represents lower scoring medical offices.
25% of medical offices scored the same or lower. 75% of medical offices scored higher.
50th percentile (or median) Represents the middle of the distribution of medical offices.
50% of medical offices scored the same or lower. 50% of medical offices scored higher.
75th percentile Represents higher scoring medical offices.
75% of medical offices scored the same or lower. 25% of medical offices scored higher.
90th percentile Represents the highest scoring medical offices.
90% of medical offices scored the same or lower. 10% of medical offices scored higher.
To compare with the database percentiles, compare your medical office’s percent positive scores with the percentile scores for each composite and item. Look for the highest percentile where your medical office’s score is higher than that percentile.
38
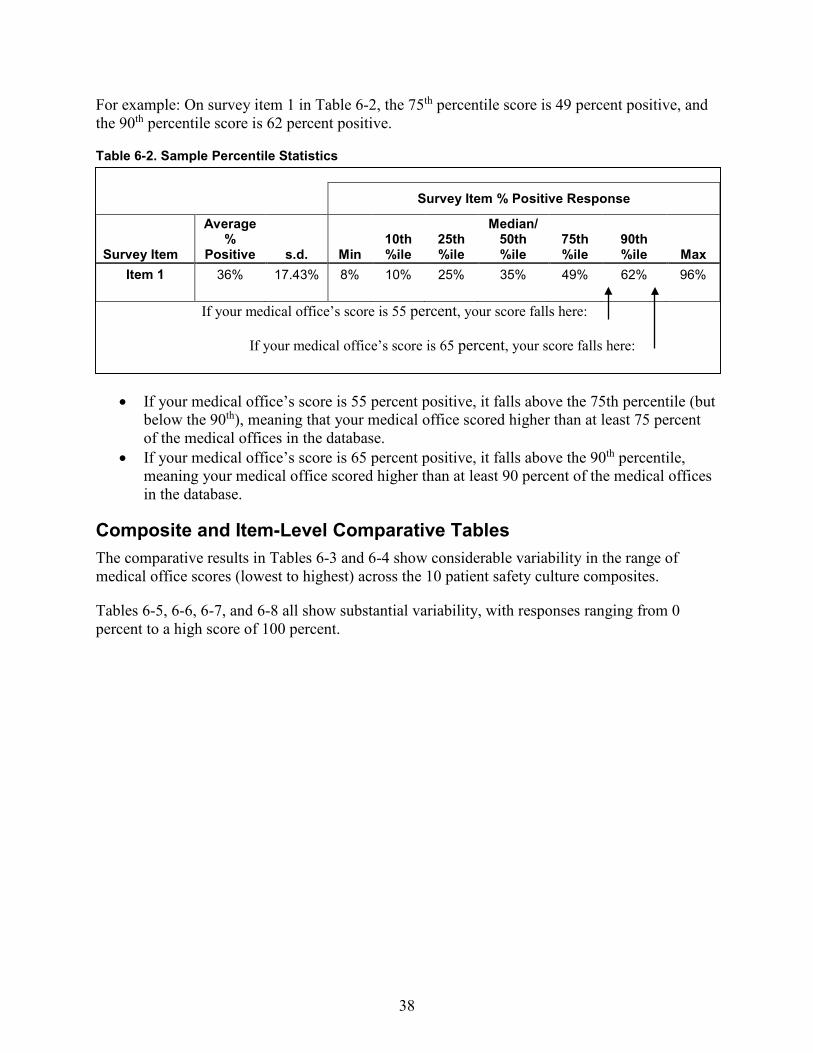
For example: On survey item 1 in Table 6-2, the 75th percentile score is 49 percent positive, and the 90th percentile score is 62 percent positive.
Table 6-2. Sample Percentile Statistics
• If your medical office’s score is 55 percent positive, it falls above the 75th percentile (butbelow the 90th), meaning that your medical office scored higher than at least 75 percentof the medical offices in the database.
• If your medical office’s score is 65 percent positive, it falls above the 90th percentile,meaning your medical office scored higher than at least 90 percent of the medical officesin the database.
Composite and Item-Level Comparative Tables The comparative results in Tables 6-3 and 6-4 show considerable variability in the range of medical office scores (lowest to highest) across the 10 patient safety culture composites.
Tables 6-5, 6-6, 6-7, and 6-8 all show substantial variability, with responses ranging from 0 percent to a high score of 100 percent.
Survey Item % Positive Response
Survey Item
Average %
Positive s.d. Min 10th %ile
25th %ile
Median/ 50th %ile
75th %ile
90th %ile Max
Item 1 36% 17.43% 8% 10% 25% 35% 49% 62% 96%
If your medical office’s score is 55 percent, your score falls here:
If your medical office’s score is 65 percent, your score falls here:

39
Table 6-3. Composite-Level Comparative Results – 2016 Database Medical Offices
Composite % Positive Response
Patient Safety Culture Composites
Average %
Positive s.d. Min 10th %ile
25th %ile
Median/ 50th %ile
75th %ile
90th %ile Max
1. Teamwork 87% 13.12% 25% 69% 81% 90% 97% 100% 100%
2. Patient Care Tracking/Follow-up 86% 12.86% 13% 69% 79% 89% 95% 100% 100%
3. Overall Perceptions of Patient Safety andQuality
80% 15.66% 0% 60% 71% 82% 92% 100% 100%
4. Organizational Learning 80% 16.91% 0% 57% 70% 83% 93% 100% 100%
5. Staff Training 75% 17.90% 0% 51% 64% 77% 88% 97% 100%
6. Communication About Error 71% 16.77% 13% 49% 60% 72% 83% 93% 100%
7. Communication Openness 69% 18.39% 12% 44% 56% 70% 83% 93% 100%
8. Office Processes and Standardization 69% 19.03% 0% 44% 56% 70% 83% 94% 100%
9. Owner/Managing Partner/LeadershipSupport for Safety
69% 18.06% 0% 44% 57% 69% 82% 92% 100%
10. Work Pressure and Pace 50% 22.04% 0% 22% 34% 49% 65% 81% 100%

40
Table 6-4. Item-Level Comparative Results – 2016 Database Medical Offices (Page 1 of 4)
Survey Item % Positive Response
Survey Items By Composite
Average %
Positive s.d. Min 10th %ile
25th %ile
Median/ 50th %ile
75th %ile
90th %ile Max
1. Teamwork1. When someone in this office gets really busy, others
help out. (C1)86% 15.55% 0% 67% 80% 89% 100% 100% 100%
2. In this office, there is a good working relationshipbetween staff and providers. (C2)
90% 14.02% 20% 71% 83% 97% 100% 100% 100%
3. In this office, we treat each other with respect. (C5) 86% 17.29% 0% 62% 78% 91% 100% 100% 100% 4. This office emphasizes teamwork in taking care of
patients. (C13)86% 16.18% 0% 65% 79% 89% 100% 100% 100%
2. Patient Care Tracking/Follow-up1. This office reminds patients when they need to
schedule an appointment for preventive or routine care.(D3)
87% 15.90% 0% 67% 80% 92% 100% 100% 100%
2. This office documents how well our chronic-carepatients follow their treatment plans. (D5)
80% 22.14% 0% 50% 67% 83% 100% 100% 100%
3. Our office follows up when we do not receive a reportwe are expecting from an outside provider. (D6)
86% 17.97% 0% 64% 79% 92% 100% 100% 100%
4. This office follows up with patients who needmonitoring. (D9)
90% 15.06% 0% 71% 83% 100% 100% 100% 100%
3. Overall Perceptions of Patient Safety andQuality
1. Our office processes are good at preventing mistakesthat could affect patients. (F2)
86% 16.27% 0% 67% 80% 90% 100% 100% 100%
2. Mistakes happen more than they should in this office.(F3R)
81% 19.66% 0% 52% 70% 83% 100% 100% 100%
3. It is just by chance that we don’t make more mistakesthat affect our patients. (F4R)
79% 19.34% 0% 52% 68% 82% 100% 100% 100%
4. In this office, getting more work done is more importantthan quality of care. (F6R)
73% 21.04% 0% 45% 60% 75% 90% 100% 100%
Note: The item’s survey location is shown after the item text. An “R” indicates a negatively worded item, where the percent positive response is based on those who responded “Strongly disagree” or “Disagree,” or “Never” or “Rarely” (depending on the response category used for the item).

41
Table 6-4. Item-Level Comparative Results – 2016 Database Medical Offices (Page 2 of 4) Survey Item % Positive Response
Survey Items By Composite
Average %
Positive s.d. Min 10th %ile
25th %ile
Median/ 50th %ile
75th%ile
90th %ile Max
4. Organizational Learning1. When there is a problem in our office, we see if we
need to change the way we do things. (F1)84% 17.58% 0% 60% 75% 88% 100% 100% 100%
2. This office is good at changing office processes tomake sure the same problems don’t happen again.(F5)
80% 19.09% 0% 56% 69% 83% 100% 100% 100%
3. After this office makes changes to improve the patientcare process, we check to see if the changes worked.(F7)
75% 21.29% 0% 50% 63% 78% 92% 100% 100%
5. Staff Training1. This office trains staff when new processes are put into
place. (C4)77% 19.71% 0% 50% 67% 80% 94% 100% 100%
2. This office makes sure staff get the on-the-job trainingthey need. (C7)
76% 20.36% 0% 50% 65% 80% 92% 100% 100%
3. Staff in this office are asked to do tasks they haven’tbeen trained to do. (C10R)
70% 21.44% 0% 40% 57% 71% 86% 100% 100%
6. Communication About Error1. Staff feel like their mistakes are held against them.
(D7R)62% 25.33% 0% 29% 43% 62% 81% 100% 100%
2. Providers and staff talk openly about office problems.(D8)
62% 22.98% 0% 33% 47% 62% 80% 100% 100%
3. In this office, we discuss ways to prevent errors fromhappening again. (D11)
83% 17.09% 0% 60% 73% 86% 100% 100% 100%
4. Staff are willing to report mistakes they observe in thisoffice. (D12)
78% 18.69% 0% 54% 67% 80% 93% 100% 100%
Note: The item’s survey location is shown after the item text. An “R” indicates a negatively worded item, where the percent positive response is based on those who responded “Strongly disagree” or “Disagree,” or “Never” or “Rarely” (depending on the response category used for the item).
42
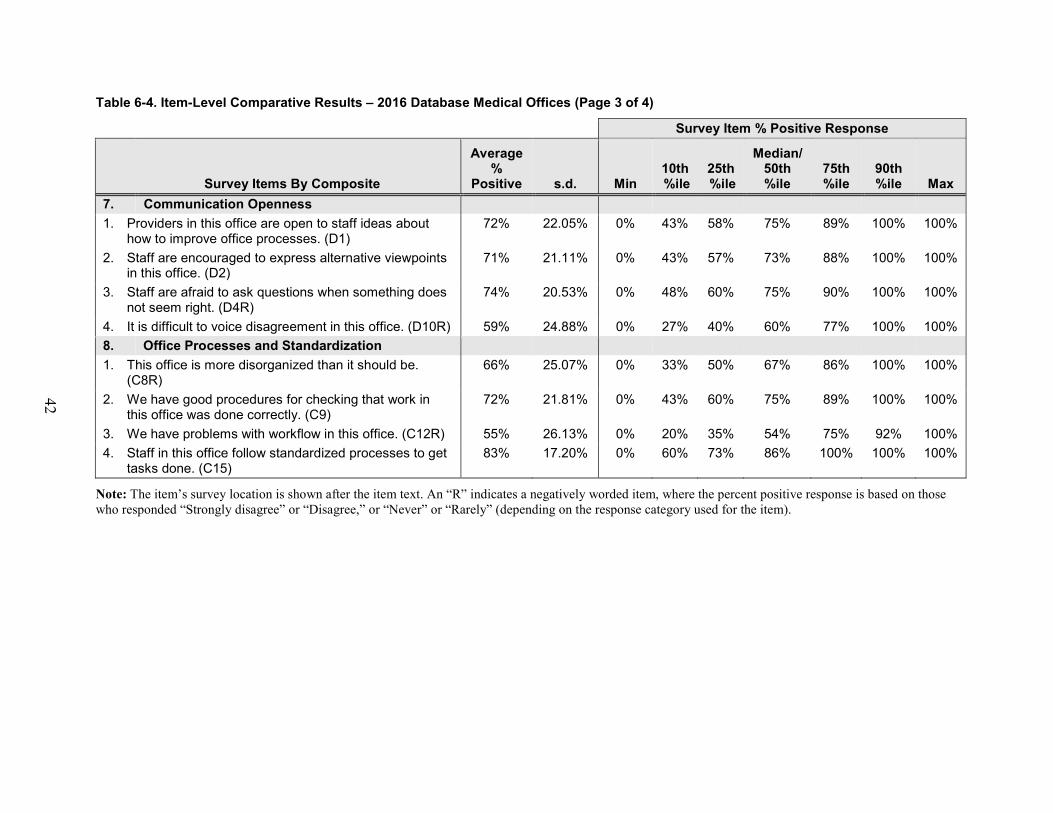
Table 6-4. Item-Level Comparative Results – 2016 Database Medical Offices (Page 3 of 4)
Survey Item % Positive Response
Survey Items By Composite
Average %
Positive s.d. Min 10th %ile
25th %ile
Median/ 50th %ile
75th%ile
90th %ile Max
7. Communication Openness1. Providers in this office are open to staff ideas about
how to improve office processes. (D1)72% 22.05% 0% 43% 58% 75% 89% 100% 100%
2. Staff are encouraged to express alternative viewpointsin this office. (D2)
71% 21.11% 0% 43% 57% 73% 88% 100% 100%
3. Staff are afraid to ask questions when something doesnot seem right. (D4R)
74% 20.53% 0% 48% 60% 75% 90% 100% 100%
4. It is difficult to voice disagreement in this office. (D10R) 59% 24.88% 0% 27% 40% 60% 77% 100% 100% 8. Office Processes and Standardization1. This office is more disorganized than it should be.
(C8R)66% 25.07% 0% 33% 50% 67% 86% 100% 100%
2. We have good procedures for checking that work inthis office was done correctly. (C9)
72% 21.81% 0% 43% 60% 75% 89% 100% 100%
3. We have problems with workflow in this office. (C12R) 55% 26.13% 0% 20% 35% 54% 75% 92% 100% 4. Staff in this office follow standardized processes to get
tasks done. (C15)83% 17.20% 0% 60% 73% 86% 100% 100% 100%
Note: The item’s survey location is shown after the item text. An “R” indicates a negatively worded item, where the percent positive response is based on those who responded “Strongly disagree” or “Disagree,” or “Never” or “Rarely” (depending on the response category used for the item).

43
Table 6-4. Item-Level Comparative Results – 2016 Database Medical Offices (Page 4 of 4)
Average %
Positive
Median/ 10th
ile
Survey Item % Positive Response
25th 50th 75th 90th Survey Items By Composite s.d. Min % %ile %ile %ile %ile Max
9. Owner/Managing Partner/Leadership Support forPatient Safety
1. They aren’t investing enough resources to improve thequality of care in this office. (E1R)
50% 26.73% 0% 17% 33% 50% 67% 89% 100%
2. They overlook patient care mistakes that happen overand over. (E2R)
82% 19.31% 0% 57% 71% 86% 100% 100% 100%
3. They place a high priority on improving patient careprocesses. (E3)
81% 19.74% 0% 55% 70% 84% 100% 100% 100%
4. They make decisions too often based on what is bestfor the office rather than what is best for patients.(E4R)
61% 25.85% 0% 28% 44% 63% 80% 100% 100%
10. Work Pressure and Pace1. In this office, we often feel rushed when taking care of
patients. (C3R)39% 24.82% 0% 10% 20% 33% 50% 75% 100%
2. We have too many patients for the number of providersin this office. (C6R)
50% 27.47% 0% 14% 31% 50% 69% 89% 100%
3. We have enough staff to handle our patient load. (C11) 50% 27.77% 0% 14% 29% 50% 70% 89% 100% 4. This office has too many patients to be able to handle
everything effectively. (C14R)61% 25.49% 0% 27% 43% 60% 80% 100% 100%
Note: The item’s survey location is shown after the item text. An “R” indicates a negatively worded item, where the percent positive response is based on those who responded “Strongly disagree” or “Disagree,” or “Never” or “Rarely” (depending on the response category used for the item).

44
Table 6-5. Item-Level Comparative Results on Patient Safety and Quality Issues – 2016 Database Medical Offices
Survey Item % Positive Response
A. List of Patient Safety and Quality Issues
Average %
Positive s.d. Min 10th%ile
25th%ile
Median/ 50th %ile
75th%ile
90th %ile Max
Access to Care 1. A patient was unable to get an appointment within 48
hours for an acute/serious problem. (A1)78% 23.70% 0% 47% 67% 83% 100% 100% 100%
Patient Identification 2. The wrong chart/medical record was used for a
patient. (A2)98% 6.99% 0% 91% 100
% 100% 100% 100% 100%
Charts/Medical Records 3. A patient's chart/medical record was not available
when needed. (A3)94% 12.11% 0% 80% 91% 100% 100% 100% 100%
4. Medical information was filed, scanned, or entered intothe wrong patient's chart/medical record. (A4)
96% 9.46% 0% 86% 99% 100% 100% 100% 100%
Medical Equipment 5. Medical equipment was not working properly or was in
need of repair or replacement. (A5)90% 14.80% 0% 72% 85% 100% 100% 100% 100%
Medication 6. A pharmacy contacted our office to clarify or correct a
prescription. (A6)61% 26.45% 0% 25% 43% 60% 80% 100% 100%
7. A patient's medication list was not updated during hisor her visit. (A7)
82% 20.36% 0% 52% 71% 87% 100% 100% 100%
Diagnostics and Tests 8. The results from a lab or imaging test were not
available when needed. (A8)81% 20.66% 0% 50% 71% 85% 100% 100% 100%
9. A critical abnormal result from a lab or imaging testwas not followed up within 1 business day. (A9)
94% 11.81% 0% 80% 92% 100% 100% 100% 100%
Note: The item's survey location is shown after the item text. For items A1-A9, the percent positive response is based on those who responded “Not in the past 12 months,” “Once or twice in the past 12 months,” and “Several times in the past 12 months.”

45
Table 6-6. Item-Level Comparative Results on Information Exchange With Other Settings – 2016 Database Medical Offices
Survey Item % Positive Response
Information Exchange With Other Settings
Average %
Positive s.d. Min 10th%ile
25th%ile
Median/ 50th %ile
75th%ile
90th %ile Max
B. Over the past 12 months, how often has yourmedical office had problems exchanging accurate,complete, and timely information with:
1. Outside labs/imaging centers? (B1) 81% 21.22% 0% 50% 69% 83% 100% 100% 100%
2. Other medical offices/Outside physicians? (B2) 81% 20.09% 0% 50% 69% 83% 100% 100% 100%
3. Pharmacies? (B3) 81% 21.22% 0% 50% 69% 83% 100% 100% 100%
4. Hospitals? (B4) 85% 18.55% 0% 60% 77% 91% 100% 100% 100%
Note: The item's survey location is shown after the item text. For items B1-B4, the percent positive response is based on those who responded “No problems in the past 12 months,” “One or two problems in the past 12 months,” and “Several problems in the past 12 months.”
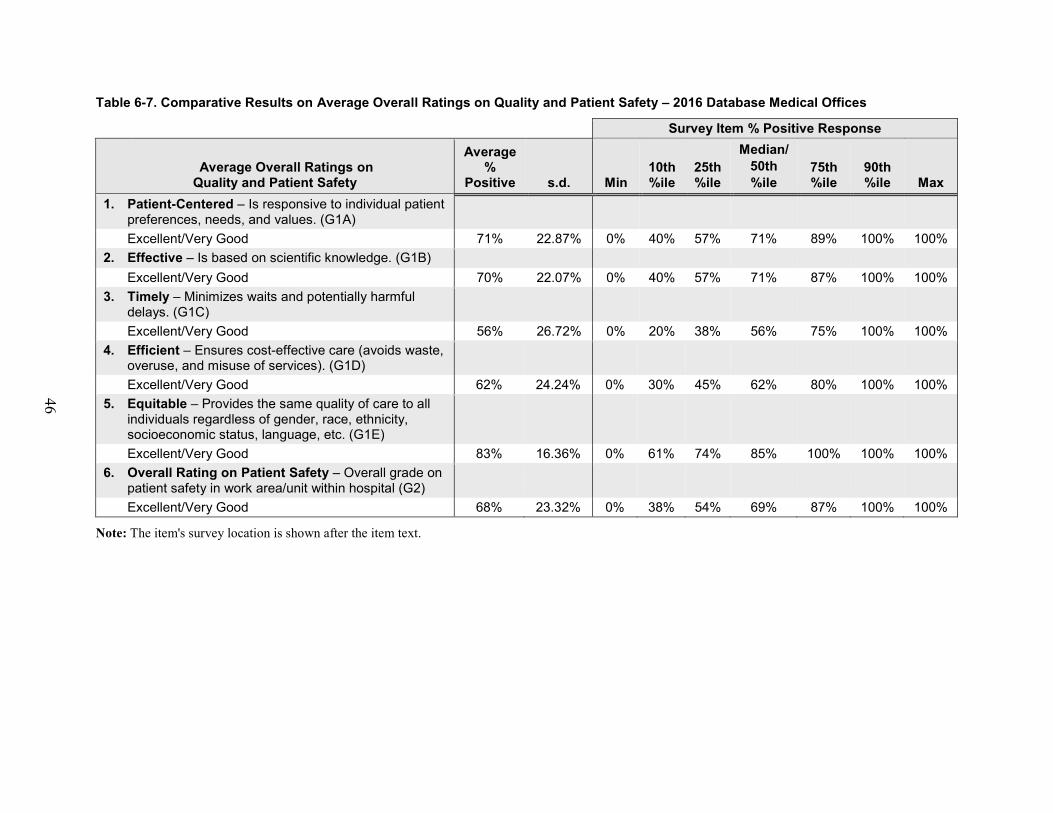
46
Table 6-7. Comparative Results on Average Overall Ratings on Quality and Patient Safety – 2016 Database Medical Offices
Survey Item % Positive Response
Average Overall Ratings on Quality and Patient Safety
Average %
Positive s.d. Min 10th%ile
25th%ile
Median/ 50th %ile
75th%ile
90th %ile Max
1. Patient-Centered – Is responsive to individual patientpreferences, needs, and values. (G1A)Excellent/Very Good 71% 22.87% 0% 40% 57% 71% 89% 100% 100%
2. Effective – Is based on scientific knowledge. (G1B)Excellent/Very Good 70% 22.07% 0% 40% 57% 71% 87% 100% 100%
3. Timely – Minimizes waits and potentially harmfuldelays. (G1C)Excellent/Very Good 56% 26.72% 0% 20% 38% 56% 75% 100% 100%
4. Efficient – Ensures cost-effective care (avoids waste,overuse, and misuse of services). (G1D)Excellent/Very Good 62% 24.24% 0% 30% 45% 62% 80% 100% 100%
5. Equitable – Provides the same quality of care to allindividuals regardless of gender, race, ethnicity,socioeconomic status, language, etc. (G1E)Excellent/Very Good 83% 16.36% 0% 61% 74% 85% 100% 100% 100%
6. Overall Rating on Patient Safety – Overall grade onpatient safety in work area/unit within hospital (G2)Excellent/Very Good 68% 23.32% 0% 38% 54% 69% 87% 100% 100%
Note: The item's survey location is shown after the item text.

47
Appendixes A and B: Overall Results by Medical Office and Respondent Characteristics In addition to the overall results on the database medical offices presented, Part II of the report presents data tables showing average percent positive scores on the survey composites and items across database medical offices, broken down by the following medical office and respondent characteristics:
Appendix A: Results by Medical Office Characteristics
• Number of Providers• Single vs. Multi-specialty• Specific Specialties• Primary Care Specialties• Ownership• Geographic Region
Appendix B: Results by Respondent Characteristics
• Staff Position• Tenure in Medical Office
The breakout tables are included as appendixes because there is a large number of them. Highlights of the findings from the breakout tables in these appendixes are provided on the following pages. The appendixes are available on the following Web site: http://www.ahrq.gov/professionals/quality-patient-safety/patientsafetyculture/medical-office/mo-reports.html.
Highlights From Appendix A: Overall Results by Medical Office Characteristics Number of Providers (Tables A-1, A-3, A-4) • Medical offices with one provider had the highest average percent positive across the
composites (79 percent); medical offices with 20 or more providers had the lowest (66percent).
• Percent positive scores for all five Overall Ratings on Quality (those responding “Excellent”or “Very Good”) were the highest for medical offices with one provider and the lowest formedical offices with 20 or more providers.
• Medical offices with one provider had the highest percentage of respondents who gave theirmedical office an Overall Rating on Patient Safety of “Excellent” or “Very Good” (79percent); medical offices with 20 or more providers had the lowest (55 percent).
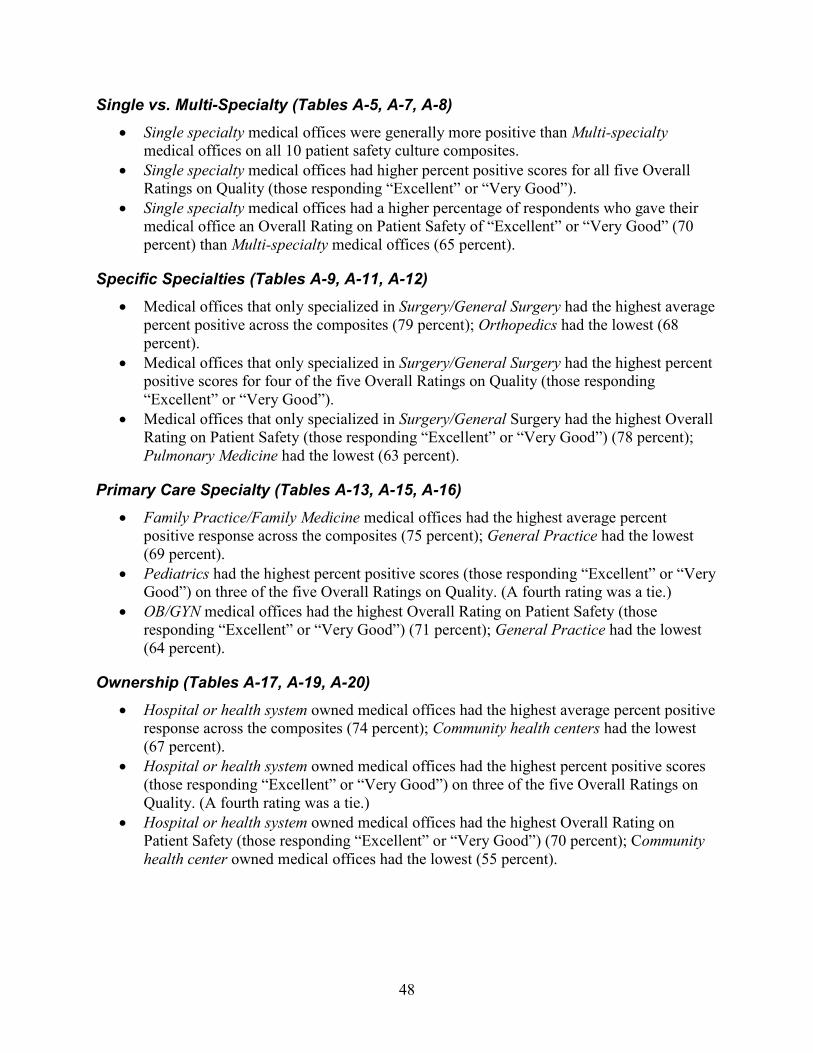
48
Single vs. Multi-Specialty (Tables A-5, A-7, A-8) • Single specialty medical offices were generally more positive than Multi-specialty
medical offices on all 10 patient safety culture composites.• Single specialty medical offices had higher percent positive scores for all five Overall
Ratings on Quality (those responding “Excellent” or “Very Good”).• Single specialty medical offices had a higher percentage of respondents who gave their
medical office an Overall Rating on Patient Safety of “Excellent” or “Very Good” (70percent) than Multi-specialty medical offices (65 percent).
Specific Specialties (Tables A-9, A-11, A-12) • Medical offices that only specialized in Surgery/General Surgery had the highest average
percent positive across the composites (79 percent); Orthopedics had the lowest (68percent).
• Medical offices that only specialized in Surgery/General Surgery had the highest percentpositive scores for four of the five Overall Ratings on Quality (those responding“Excellent” or “Very Good”).
• Medical offices that only specialized in Surgery/General Surgery had the highest OverallRating on Patient Safety (those responding “Excellent” or “Very Good”) (78 percent);Pulmonary Medicine had the lowest (63 percent).
Primary Care Specialty (Tables A-13, A-15, A-16) • Family Practice/Family Medicine medical offices had the highest average percent
positive response across the composites (75 percent); General Practice had the lowest(69 percent).
• Pediatrics had the highest percent positive scores (those responding “Excellent” or “VeryGood”) on three of the five Overall Ratings on Quality. (A fourth rating was a tie.)
• OB/GYN medical offices had the highest Overall Rating on Patient Safety (thoseresponding “Excellent” or “Very Good”) (71 percent); General Practice had the lowest(64 percent).
Ownership (Tables A-17, A-19, A-20) • Hospital or health system owned medical offices had the highest average percent positive
response across the composites (74 percent); Community health centers had the lowest(67 percent).
• Hospital or health system owned medical offices had the highest percent positive scores(those responding “Excellent” or “Very Good”) on three of the five Overall Ratings onQuality. (A fourth rating was a tie.)
• Hospital or health system owned medical offices had the highest Overall Rating onPatient Safety (those responding “Excellent” or “Very Good”) (70 percent); Communityhealth center owned medical offices had the lowest (55 percent).

49
Geographic Region (Tables A-21, A-23, A-24) • South Atlantic medical offices had the highest average percent positive response across
the composites (76 percent); Pacific had the lowest (59 percent).• South Atlantic medical offices had the highest percent positive scores (those responding
“Excellent” or “Very Good”) on four of the five Overall Ratings on Quality.• South Atlantic medical offices had the highest percentage of respondents who gave their
medical office an Overall Rating on Patient Safety of “Excellent” or “Very Good” (72percent); Pacific medical offices had the lowest (42 percent).
Highlights From Appendix B: Overall Results by Respondent Characteristics Staff Position (Tables B-1, B-3, B-4)
• Management had the highest average percent positive response across the composites (84percent); Nurses (RN/LVN/LPN), Physician Assistant/NP/Midwife/etc., and OtherClinical or Clinical Support Staff tied for the lowest (72 percent).
• Management had the highest percent positive scores for four of the five Overall Ratingson Quality (those responding “Excellent” or “Very good”). (They are tied with physicianson the fifth rating.)
• Management had the highest percentage who gave their medical office an Overall Ratingon Patient Safety of “Excellent” or “Very Good” (83 percent); Nurses (RN/LVN/LPN)had the lowest (65 percent).
Tenure in Medical Office (Tables B-5, B-7, B-8) • Respondents with less than 1 year in their current medical office had the highest average
percent positive response across the composites (77 percent); respondents with 3 years toless than 6 years had the lowest (70 percent).
• Respondents with less than 1 year in their current medical office had the highest percentpositive scores for three of the five Overall Ratings on Quality (those responding“Excellent” or “Very good”).
• Respondents with less than 1 year or 11 years or more in their current medical office hadthe highest percentage of respondents who gave their medical office an Overall Rating onPatient Safety of “Excellent” or “Very Good” (70 percent); respondents with 3 years toless than 6 years had the lowest (64 percent).

50
Chapter 7. What’s Next? Action Planning for Improvement The seven steps of action planning outlined in this chapter are primarily based on the book Designing and Using Organizational Surveys: A Seven-Step Process (Church & Waclawski, 1998).
Seven Steps of Action Planning Administering the medical office survey can be considered an “intervention,” a way to educate staff and build awareness about issues of concern related to patient safety. But it should not be the only goal of conducting the survey. Administering the survey is not enough. The delivery of survey results is not the end point in the survey process; it is actually just the beginning. Often, the perceived failure of surveys as a way to create lasting change is actually due to faulty or nonexistent action planning or survey followup.
Seven steps of action planning are provided to help your medical office go beyond simply conducting a survey to realizing changes in patient safety culture. The seven steps of action planning are:
1. Understand your survey results.2. Communicate and discuss survey results.3. Develop focused action plans.4. Communicate action plans and deliverables.5. Implement action plans.6. Track progress and evaluate impact.7. Share what works.
Step 1: Understand Your Survey Results It is important to review the survey results and interpret them before you develop action plans. Develop an understanding of your medical office’s key strengths and areas for improvement. Examine your medical office’s overall percent positive scores on the patient safety culture composites and items:
• Which areas were most and least positive?• How do your medical office’s results compare with the results from the database medical
offices?
Next, consider examining your survey data broken down by staff position:
• Are there different areas for improvement for different medical office staff?• Do any patterns emerge?• How do your medical office’s results for these breakouts compare with the results from
the database medical offices?

51
After reviewing the survey results carefully, identify two or three areas for improvement to avoid focusing on too many issues at one time. Once you have identified areas for improvement, you may find the Medical Office Resource List beneficial (http://www.ahrq.gov/sites/default/files/wysiwyg/professionals/quality-patient-safety/patientsafetyculture/medical-office/resource_list/moimpptsaf.pdf).
Step 2: Communicate and Discuss the Survey Results Common complaints among survey respondents are that they never get any feedback about survey results and have no idea whether anything ever happens as a result of a survey. It is therefore important to thank your staff for taking the time to complete the survey and let them know that you value their input. Sharing results from the survey throughout the medical office shows your commitment to the survey and improvement process.
Use survey feedback as an impetus for change. However, to ensure respondent anonymity/confidentiality, it is important to report data only if there are enough respondents in a particular category or group. Reporting data is not recommended if a category has fewer than three respondents. For example, if only two people in a staff position respond, that staff position’s data should not be reported separately because there are too few respondents to provide complete assurance of anonymity/confidentiality.
Summaries of the survey results should be distributed throughout the medical office in a top-down manner, beginning with senior management, administrators, and medical and senior leaders, followed by department managers and then staff. Managers at all levels should be expected to carefully review the findings. Summarize key findings, but also encourage discussion about the results throughout the medical office. What do others see in the data and how do they interpret the results?
In some cases, it may not be completely clear why an area of patient safety culture was particularly low. Keep in mind that surveys are only one way of examining culture, so strive for a deeper understanding when needed. Conduct followup activities, such as focus groups or interviews with staff to find out more about an issue, why it is problematic, and how it can be improved.
Step 3: Develop Focused Action Plans Once areas for patient safety culture improvement have been identified, formal written action plans need to be developed to ensure progress toward change. Encourage and empower staff to develop action plans that are “SMART”:
• Specific• Measurable• Achievable• Relevant• Time bound

52
When deciding whether a particular action plan or initiative would be a good fit in your facility, you may find Will It Work Here? A Decisionmaker’s Guide to Adopting Innovations” (Brach, et al., 2008) to be a useful resource (http://www.innovations.ahrq.gov/guide/InnovationAdoptionGuide.pdf). The guide helps users answer four overarching questions:
• Does this innovation fit?• Should we do it here?• Can we do it here?• How can we do it here?
Identify funding, staffing, or other resources needed to implement action plans and take steps to obtain these resources, which are often fundamental obstacles that hinder implementation of action plans. It is also important to identify other obstacles you may encounter when trying to implement change and to anticipate and understand the rationale behind any potential resistance toward proposed action plans.
In the planning stage, it is also important to identify quantitative and qualitative measures that can be used to evaluate progress and the impact of changes implemented. Evaluative measures will need to be used before, during, and after implementation of your action plan initiatives to assess the effectiveness of the initiatives.
Step 4: Communicate Action Plans and Deliverables Once action plans have been developed, the plans, deliverables, and expected outcomes of the plans need to be communicated. Those directly involved or affected will need to know their roles and responsibilities, as well as the timeframe for implementation. Action plans and goals should also be shared widely so that their transparency encourages further accountability and demonstrates the medical office-wide commitments being made in response to the survey results.
At this step it is important for senior medical office managers and leaders to understand that they are the primary owners of the change process and that success depends on their full commitment and support. Senior-level commitment to taking action must be strong; without buy-in from the top, including medical leadership, improvement efforts are likely to fail.
Step 5: Implement Action Plans Implementing action plans is one of the hardest steps. Taking action requires the provision of resources and support. It requires tracking quantitative and qualitative measures of progress and success that have already been identified. It requires publicly recognizing those individuals and units that take action to drive improvement. And it requires adjustments along the way.
This step is critical to realizing patient safety culture improvement. While communicating the survey results is important, taking action makes the real difference. However, as the Institute for Healthcare Improvement (IHI, 2016) suggests, actions do not have to be major, permanent changes. In fact, it is worthwhile to strive to implement easier, smaller changes that are likely to have a positive impact rather than big changes with unknown probability of success.

53
The “Plan-Do-Study-Act” cycle (Langley, et al., 1996) (Figure 7-1) is a pilot-study approach to change that involves first developing a small-scale plan to test a proposed change (Plan), carrying out the plan (Do), observing and learning from the consequences (Study), and determining what modifications should be made to the plan (Act). Implementation of action plans can occur on a small scale, within a single area, to examine impact and refine plans before rolling out the changes on a larger scale to other areas or medical offices.
Figure 7-1. Plan-Do-Study-Act Cycle
Step 6: Track Progress and Evaluate Impact Use quantitative and qualitative measures to review progress and evaluate whether a specific change actually leads to improvement. Ensure that there is timely communication of progress toward action plans on a regular basis. If you determine that a change has worked, communicate that success to staff by telling them what was changed and that it was done in response to the safety culture survey results. Be sure to make the connection to the survey so that the next time the survey is administered, staff will know that it will be worthwhile to participate again because actions were taken based on the prior survey’s results.
Alternatively, your evaluation may reveal that a change is not working as expected or has failed to reach its goals and will need to be modified or replaced by another approach. Before dropping the effort completely, try to determine why it failed and whether it might be worthwhile to make adjustments.
It is important not to reassess culture too frequently because lasting culture change will be slow and may take years. Frequent assessments of culture are likely to find temporary shifts or improvements that may come back down to baseline levels in the longer term if changes are not sustained. When planning to reassess culture, it is also very important to obtain high survey response rates. Otherwise, it will not be clear whether changes in survey results over time are due to true changes in attitudes or are the result of surveying different staff each time.
Step 7: Share What Works In Step 6, you track measures to identify which changes result in improvement. Once your medical office has found effective ways to address a particular area, the changes can be implemented on a broader scale to other medical offices. Be sure to share your successes with outside medical offices and health care systems as well.

54
References American Hospital Association (AHA) Annual Survey of Hospitals database. Chicago: Health Forum; multiple years (data used from 2013)
Brach C, Lenfestey N, Roussel A, et al. Will it work here? A decisionmaker’s guide to adopting innovations. Prepared by RTI International under Contract No. 233-02-0090. Rockville, MD: AHRQ; September 2008. AHRQ Publication No. 08-0051. https://innovations.ahrq.gov/guide/guideTOC. Accessed April 20, 2016.
Church AH, Waclawski J. Designing and using organizational surveys: a seven-step process. San Francisco: Jossey-Bass; 1998.
Hospital Survey on Patient Safety Culture. Rockville, MD: AHRQ; 2004. Available at: http://www.ahrq.gov/professionals/quality-patient-safety/patientsafetyculture/hospital/index.html.
Improvement methods: the plan-do-study-act (PDSA) cycle. Washington, DC: Institute for Healthcare Improvement; 2006. Available at: www.ihi.org/IHI/Topics/Improvement/ImprovementMethods/HowToImprove.
Langley C, Nolan K, Nolan T, et al. The improvement guide: a practical approach to improving organizational performance. San Francisco: Jossey-Bass; 1996.
U.S. Census Bureau 2012. Economic census (2012 NAICS code 6211 “Offices of physicians”). http://factfinder.census.gov/faces/nav/jsf/pages/index.xhtml. Accessed April 20, 2016.
Notes: Description of Data Cleaning and Calculations This section provides additional detail about how the data were cleaned and how the various statistics presented in this report were calculated.
Data Cleaning Each participating medical office submitted individual-level survey data. Once the data were submitted, response frequencies were run on each medical office’s data to look for out-of-range values, missing values, or other data anomalies. When data problems were found, medical offices were contacted and asked to make corrections and resubmit their data. In addition, each participating medical office was sent a copy of its data frequencies to verify that the dataset received was correct.
The data were also cleaned for straight-lined answers, which is when respondents give the same answer for both a positively worded item (e.g., D2. Staff are encouraged to express alternative viewpoints in this office.) and a negatively worded item (e.g., D4R. Staff are afraid to ask questions when something does not seem right.) in the same section of the survey. Positively worded and negatively worded items are in sections C, D, E, and F. When respondents supplied the same answers for all items in sections C, D, E, or F, the items in those sections were set to missing because negatively worded items were in those sections.
After this initial cleaning, respondents with missing values across sections C, D, E, and F were deleted before analysis. Respondents who supplied either “Don’t know” answers or had missing answers to all items across sections A, B, C, D, E, and F were also deleted before analysis.

55
Response Rates As part of the data submission process, medical offices were asked to provide their response rate numerator and denominator. Response rates were calculated using the formula below.
Response Rate = Number of complete, returned surveys
Number of surveys -Ineligibles
Numerator = Number of complete, returned surveys. The numerator equals the number of individual survey records submitted to the database. It excludes surveys that were returned blank on all nondemographic survey items, or deleted during data cleaning, but includes surveys where at least one nondemographic survey item was answered.
Denominator = The total number of surveys distributed minus ineligibles. Ineligibles include deceased individuals or those who were no longer employed at the medical office during data collection.
Medical offices were included in the database only if they had at least 3 completed surveys (numerator of at least 3) after this data cleaning step.
Calculation of Percent Positive Scores Most of the survey’s items ask respondents to answer using 5-point response categories in terms of agreement (Strongly agree, Agree, Neither, Disagree, Strongly disagree) or frequency (Always, Most of the time, Sometimes, Rarely, Never).
The 13 noncomposite items use 6-point frequency response categories. The 9 Patient Safety and Quality Issues items use a frequency scale ranging from “Not in the past 12 months” to “Daily” (Not in the past 12 months, Once or twice in the past 12 months, Several times in the past 12 months, Monthly, Weekly, Daily). The four Information Exchange With Other Settings items use similar response options ranging from “No problems in the past 12 months” to “Problems daily” (No problems in the past 12 months, Problems Once or twice in the past 12 months, Problems several times in the past 12 months, Problems monthly, Problems weekly, Problems daily).
Item-Level Percent Positive Response Both positively worded items (e.g., “Staff support one another in this medical office”) and negatively worded items (e.g., “Staff use shortcuts to get their work done faster”) are included in the survey. Calculating the percent positive response on an item is different for positively and negatively worded items:
• For positively worded items with 5-point response scales, percent positive response isthe combined percentage of respondents within a medical office who answered “Stronglyagree” or “Agree,” or “Always” or “Most of the time,” depending on the responsecategories used for the item.
For example, for the item “We have enough staff to handle our patient load,” if 50percent of respondents within a medical office responded Strongly agree and 25 percent

56
responded Agree, the item-level percent positive response for that medical office would be 50% + 25%= 75% positive.
• For negatively worded items, percent positive response is the combined percentage ofrespondents within a medical office who answered “Strongly disagree” or “Disagree,” or“Never” or “Rarely,” because a negative answer on a negatively worded item indicates apositive response.
For example, for the item “Mistakes happen more than they should in this office,” if 60percent of respondents within a medical office responded Strongly disagree and 20percent responded Disagree, the item-level percent positive response would be 80 percent(i.e., 80 percent of respondents do not believe mistakes happen more than they should inthis office).
Percent positive scores for the Patient Safety and Quality Issues items, as well as the Information Exchange With Other Settings items, were calculated differently than the other survey items. The percent positive score for these 13 items is the sum of the three response options that represent the smallest frequency of occurrence. For Patient Safety Quality Issues items, these are: Not in the past 12 months, Once or twice in the past 12 months, and Several times in the past 12 months. For Information Exchange With Other Settings items, the three responses are: No problems in the past 12 months, Problems once or twice in the past 12 months, and Problems several times in the past 12 months.
Composite-Level Percent Positive Response The survey measures 10 areas or composites of patient safety culture, each composed of three or four survey items. Composite scores were calculated for each medical office by averaging the percent positive response on the items within a composite. For example, for a three-item composite, if the item-level percent positive responses were 50 percent, 55 percent, and 60 percent, the medical office’s composite-level percent positive response would be the average of these three percentages, or 55 percent positive.
Item and Composite Percent Positive Scores Example To calculate your medical office’s composite score, average the percentage of positive response to each item in the composite. Table N1 shows an example of computing a composite score for Staff Training:
1. This composite has three items. Two are positively worded (items C4 and C7) and one isnegatively worded (item C10). Keep in mind that DISAGREEING with a negativelyworded item indicates a POSITIVE response.
2. Calculate the percentage of positive responses at the item level (see example in Table N1).

57
Table N1. Example of Computing Item and Composite Percent Positive Scores
Three items measuring "Staff Training"
For positively worded items, count the # of
“Strongly agree” or “Agree”
responses
For negatively worded items, count the # of
“Strongly disagree” or “Disagree” responses
Total # of responses to
the item
Percent positive
response on item
Item C4 - positively worded “This office trains staff when new processes are put into place”
110 NA* 240 110/240=46%
Item C7 - positively worded “This office makes sure staff get the on-the-job training they need”
140 NA* 250 140/250= 56%
Item C10R - negatively worded “Staff in this office are asked to do tasks they haven’t been trained to do”
NA* 125 260 125/260=48%
*NA = Not applicable Composite Score % Positive = (46% + 56% + 48%)/3 = 50%
This example includes three items, with percent positive response scores of 46 percent, 56 percent, and 48 percent. Averaging these item-level percent positive scores results in a composite score of .50 or 50 percent on Staff Training. In this example, an average of about 50 percent of the respondents responded positively to the survey items in this composite.
Once you calculate your medical office’s percent positive response for each of the 10 patient safety culture composites, you can compare your results with the composite-level results from the 1,528 database medical offices.
Percentiles Percentiles were computed using the SAS® software default method. The first step in this procedure is to rank order the percent positive scores from all the participating medical offices, from lowest to highest. The next step is to multiply the number of medical offices (n) by the percentile of interest (p), which in our case would be the 10th, 25th, 50th, 75th, or 90th percentile.
For example, to calculate the 10th percentile, one would multiply 1,528 (the total number of medical offices) by .10 (10th percentile). The product of n x p is equal to “j+g” where “j” is the integer and “g” is the number after the decimal. If “g” equals 0, the percentile score is equal to the percent positive value of the medical office in the jth position plus the percent positive value of the medical office in the jth +1 position, divided by 2 [(X(j) + X(j+1))/2]. If “g” is not equal to 0, the percentile score is equal to the percent positive value of the medical office in the jth +1 position.

58
The following examples show how the 10th and 50th percentiles would be computed using a sample of percent positive scores from 12 medical offices (using fake data shown in Table N2). First, the percent positive scores are sorted from low to high on Composite “A.”
Table N2. Data Table for Example of How To Compute Percentiles
Medical Office Composite “A” % Positive Score 1 33% 2 48% 10th percentile score = 48%3 52% 4 60% 5 63% 6 64%
50th percentile score = 65% 7 66% 8 70% 9 72% 10 75% 11 75% 12 78%
10th percentile
1. For the 10th percentile, we would first multiply the number of medical offices by .10:(n x p = 12 x .10 = 1.2).
2. The product of n x p = 1.2, where “j” = 1 and “g” = 2. Since “g” is not equal to 0, the 10th
percentile score is equal to the percent positive value of the medical office in the jth +1position:
a. “j” equals 1.b. The 10th percentile equals the value for the medical office in the 2nd position = 48%.
50th percentile
1. For the 50th percentile, we would first multiply the number of medical offices by .50:(n x p = 12 x .50 = 6.0).
2. The product of n x p = 6.0, where “j” = 6 and “g” = 0. Since “g” = 0, the 50th percentile scoreis equal to the percent positive value of the medical office in the jth position plus the percentpositive value of the medical office in the jth +1 position, divided by 2:
a. “j” equals 6.b. The 50th percentile equals the average of the medical offices in the 6th and 7th positions
(64%+66%)/2 = 65%.

AHRQ Publication No. 16-0028-EFMay 2016
www.ahrq.gov