Embed Size (px)
Citation preview

1 1
Success Stories from the AHRQ Medical Office Survey on Patient
Safety Culture
Webinar
September 16, 2014
1:00 – 2:00 pm ET
2 2
Need Help?
• No sound from computer speakers? Join us by phone: (855) 442-5743
Conference ID #: 87046239
• Trouble with your connection or slides not moving? Select F5 to refresh your screen.
Log out and log back in.
• Other problems? Use Q&A feature to ask for help.
3 3
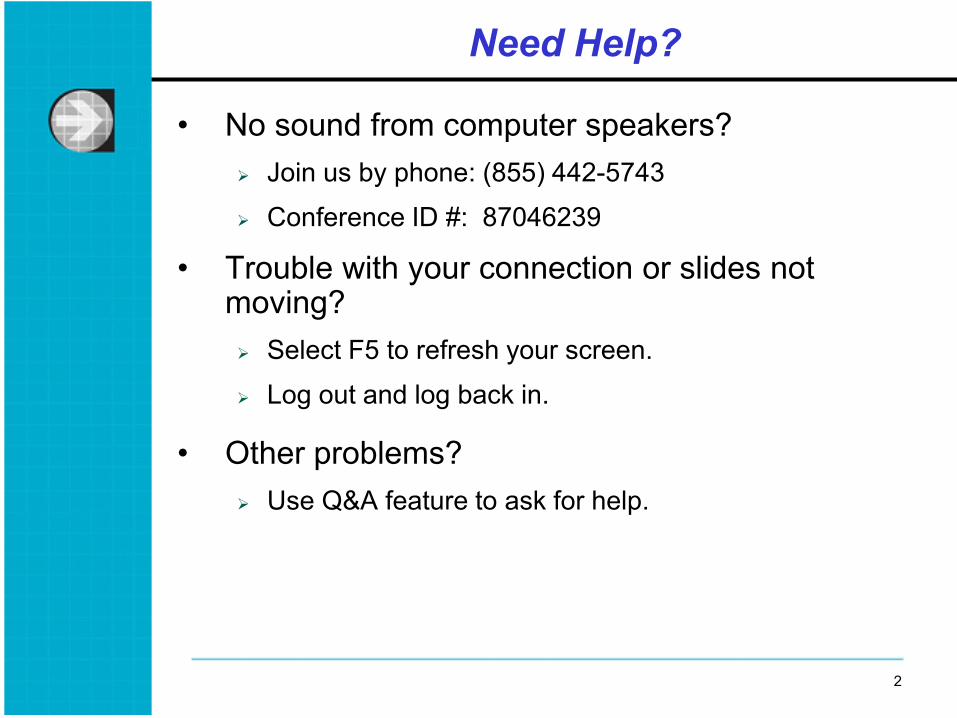
Using the Webinar Console and Submitting Questions
Closed Captioning To submit a question, type question here and
hit submit.
Click the Q&A icon to get the Q&A box to appear.
4 4
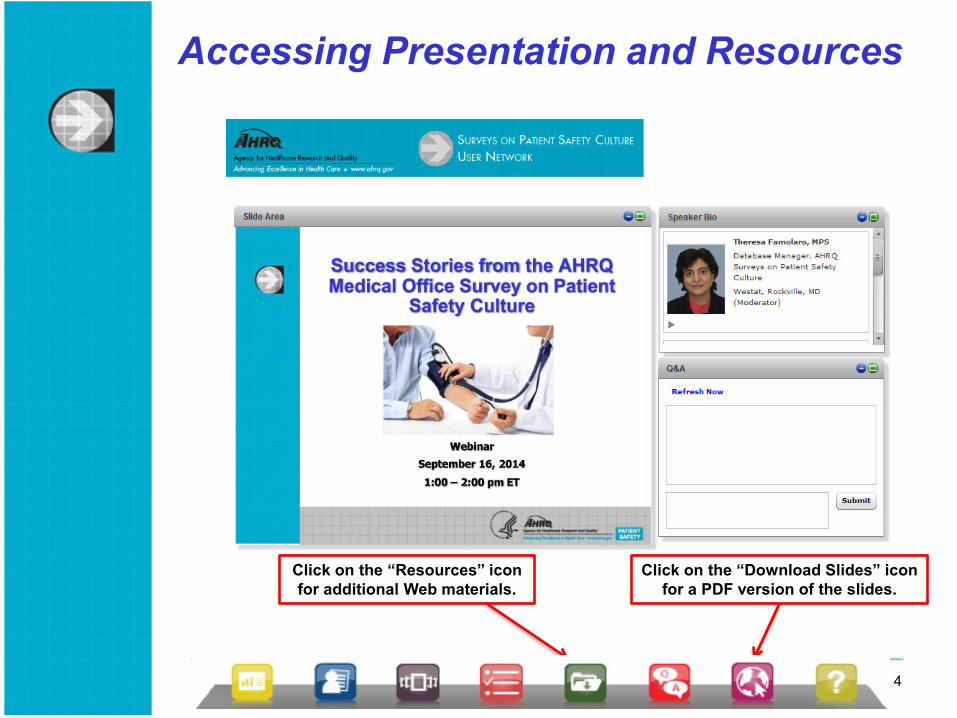
Accessing Presentation and Resources
Click on the “Resources” icon for additional Web materials.
Click on the “Download Slides” icon for a PDF version of the slides.
5 5
Objectives
• Share background on the AHRQ Medical Office Survey on Patient Safety Culture
• Present an overview of results from the AHRQ 2014 Medical Office User Comparative Database
• Introduce speakers who will share how they improved their results

6 6
Today’s Speakers
• Theresa Famolaro, MPS, Database Manager, AHRQ Surveys on Patient Safety Culture, Westat, Rockville, MD
• Juanita Stroud, Patient Safety Director, Carolinas HealthCare System, Charlotte, NC
• Bev Funaro, RN, Director of Quality and Regulatory Affairs, Yuma District Hospital and Clinics, Yuma, CO
7 7
Background on the Medical Office Survey Third addition to Surveys on Patient Safety Culture
family of surveys: Hospital Survey on Patient Safety Culture
Nursing Home Survey on Patient Safety Culture
Medical Office Survey on Patient Safety Culture
Community Pharmacy Survey on Patient Safety Culture
Surveys and related material available at:
http://www.ahrq.gov/professionals/quality-patient-safety/patientsafetyculture/medical-office/index.html

8 8
Background on the Medical Office Survey
• Specifically designed to measure the culture of patient safety in outpatient medical offices Assesses staff and provider attitudes and beliefs
about patient safety
Assesses some areas that are different than the hospital survey; survey items are also different
• Pilot tested in 2007; final survey released on AHRQ Web site in 2009
9 9
10 Areas or Composites of Patient Safety Survey areas: 1. Teamwork 2. Patient Care Tracking/Follow-up 3. Overall Perceptions of Patient Safety and Quality 4. Organizational Learning 5. Staff Training 6. Communication About Error 7. Owner/Managing Partner/Leadership Support for Patient
Safety 8. Office Processes and Standardization 9. Communication Openness 10. Work Pressure and Pace
Rating questions: • Nine ratings on Patient Safety and Quality Issues • Five ratings on Information Exchange With Other Settings • Five Overall Ratings on Quality of Care (patient-centered,
effective, timely, efficient, equitable) • One Overall Rating on Patient safety

10 10
2014 User Comparative Database Report
• Second edition (first was in 2012)
• Presents data from 27,103 staff within 935 U.S. medical offices
• Contains comparative data for various medical office characteristics (number of providers, specialty, ownership, and region) and staff position
11 11
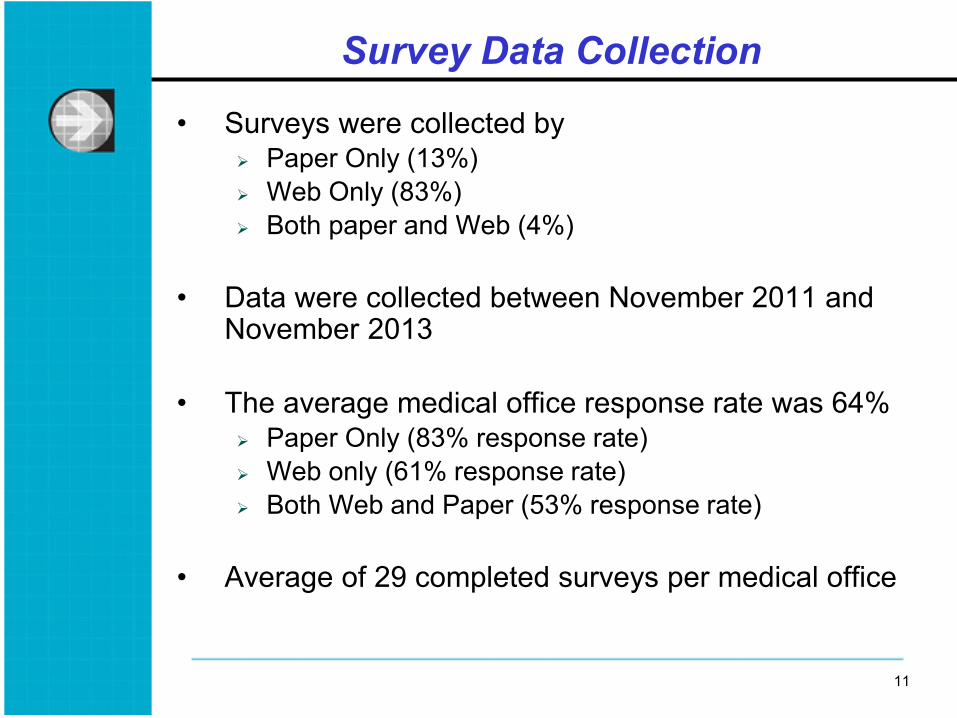
Survey Data Collection
• Surveys were collected by Paper Only (13%) Web Only (83%) Both paper and Web (4%)
• Data were collected between November 2011 and November 2013
• The average medical office response rate was 64% Paper Only (83% response rate) Web only (61% response rate) Both Web and Paper (53% response rate)
• Average of 29 completed surveys per medical office
12 12
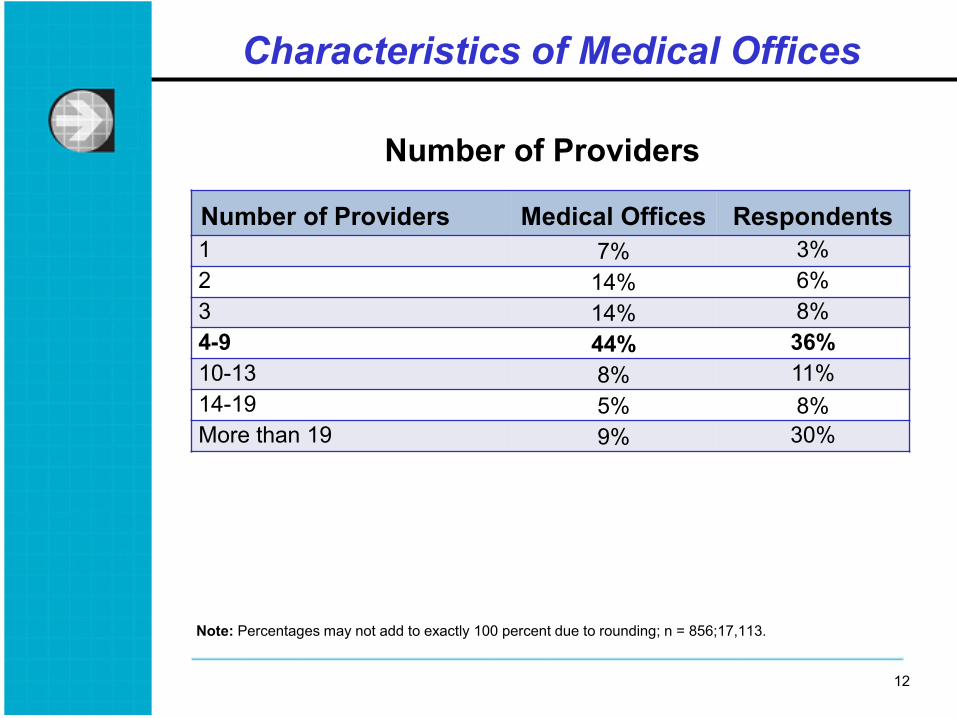
Characteristics of Medical Offices
Number of Providers
Number of Providers Medical Offices Respondents 1 7% 3% 2 14% 6% 3 14% 8% 4-9 44% 36% 10-13 8% 11% 14-19 5% 8% More than 19 9% 30%
Note: Percentages may not add to exactly 100 percent due to rounding; n = 856;17,113.

13 13
Characteristics of Medical Offices
61%
39%
Single vs. Multi-Specialty
Single specialtyMulti-specialty

14 14
Characteristics of Medical Offices
Ownership
Majority Ownership Medical Offices Respondents
Provider(s) and/or physician(s) 7% 5% Hospital or health system 69% 44% University or academic medical center 16% 14% Federal, State, or local government 6% 35% Other 3% 1%
Note: Percentages may not add to exactly 100 percent due to rounding; n = 935; 27,103.
15 15
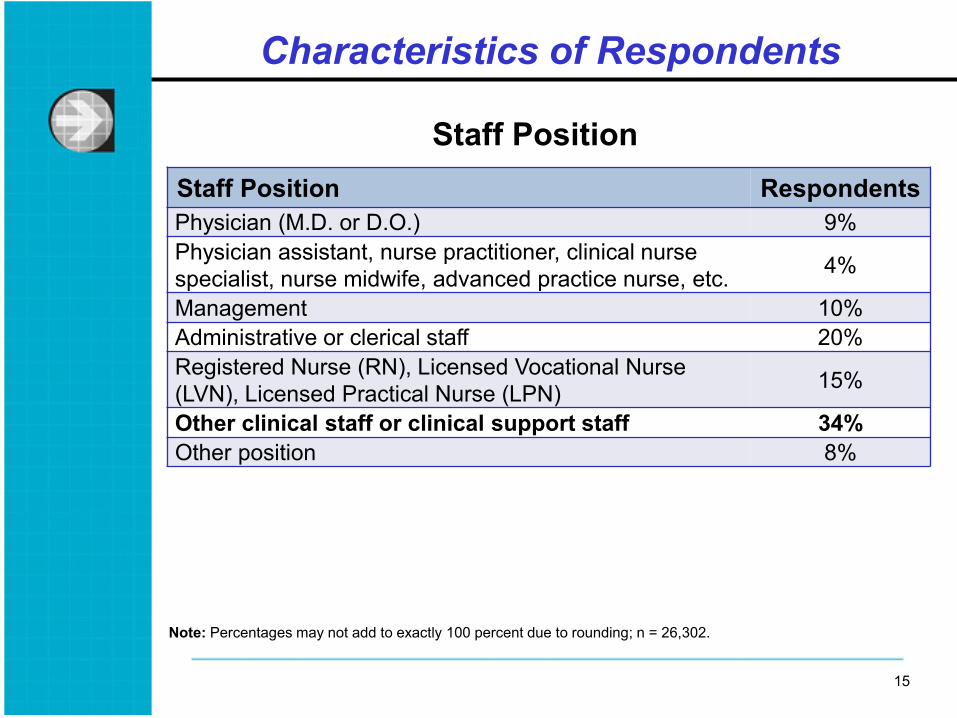
Characteristics of Respondents
Staff Position Staff Position Respondents Physician (M.D. or D.O.) 9% Physician assistant, nurse practitioner, clinical nurse specialist, nurse midwife, advanced practice nurse, etc. 4%
Management 10% Administrative or clerical staff 20% Registered Nurse (RN), Licensed Vocational Nurse (LVN), Licensed Practical Nurse (LPN) 15%
Other clinical staff or clinical support staff 34% Other position 8%
Note: Percentages may not add to exactly 100 percent due to rounding; n = 26,302.

16 16
Characteristics of Respondents
Tenure in Medical Office
Tenure in Medical Office Respondents Less than 2 months 2% 2 months to less than 1 year 13% 1 year to less than 3 years 21% 3 years to less than 6 years 20% 6 years to less than 11 years 19% 11 years or more 24%
Note: Percentages may not add to exactly 100 percent due to rounding; n = 16,887.

17 17
Characteristics of Respondents
Hours Worked Per Week
Hours Worked per Week in Medical Office Respondents 1 to 4 hours 1% 5 to 16 hours 4% 17 to 24 hours 6% 25 to 32 hours 7% 33 to 40 hours 61% 41 hours or more 21%
Note: Percentages may not add to exactly 100 percent due to rounding; n = 16,928
18 18
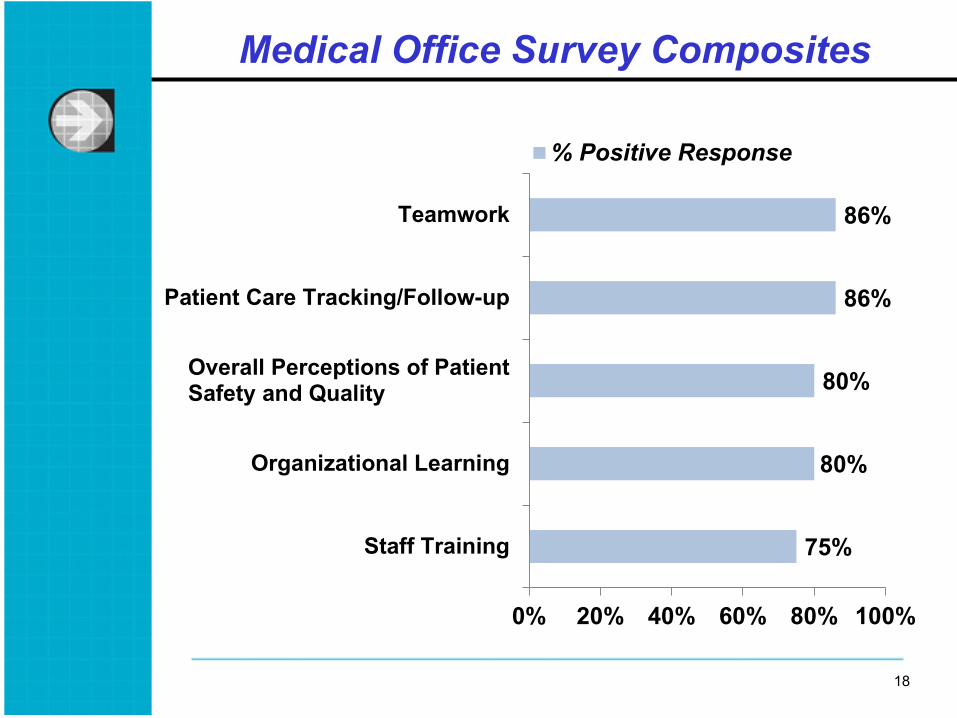
Medical Office Survey Composites
75%
80%
80%
86%
86%
0% 20% 40% 60% 80% 100%
Staff Training
Organizational Learning
Overall Perceptions of PatientSafety and Quality
Patient Care Tracking/Follow-up
Teamwork
% Positive Response

19 19
Medical Office Survey Composites
50%
68%
69%
70%
70%
0% 20% 40% 60% 80% 100%
Work Pressure and Pace
Communication Openness
Office Processes andStandardization
Owner/ Managing Partner/Leadership Support for PatientSafety
Communication About Error
% Positive Response
20 20
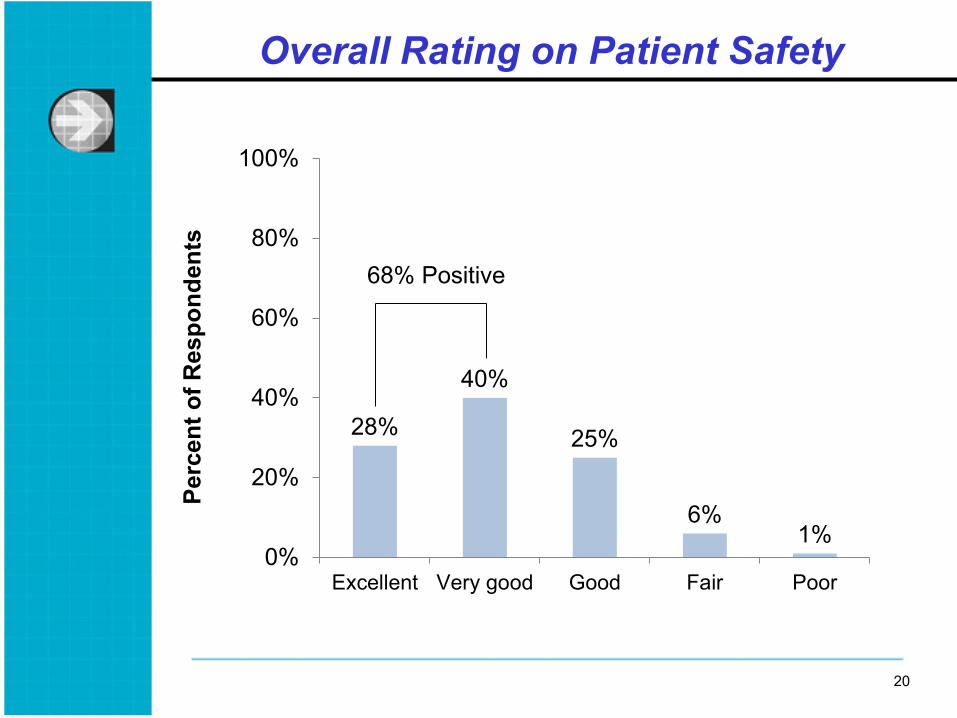
Overall Rating on Patient Safety
28%
40%
25%
6% 1%
0%
20%
40%
60%
80%
100%
Excellent Very good Good Fair Poor
68% Positive
Perc
ent o
f Res
pond
ents
21 21
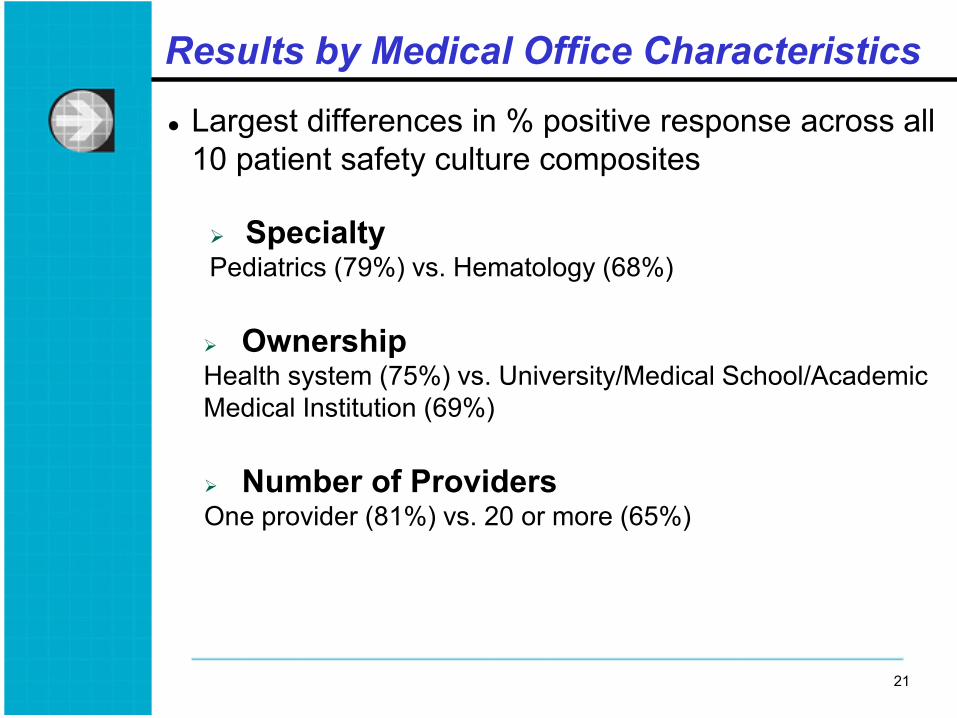
Results by Medical Office Characteristics
Largest differences in % positive response across all 10 patient safety culture composites
Specialty Pediatrics (79%) vs. Hematology (68%)
Ownership Health system (75%) vs. University/Medical School/Academic Medical Institution (69%)
Number of Providers One provider (81%) vs. 20 or more (65%)

22 22
Results by Staff Position
Management had the most positive results
Largest differences:
Communication about error Management 84% vs. Admin/Clerical Staff 66%
Communication openness Management 84% vs. Admin/Clerical staff 63%
23 23
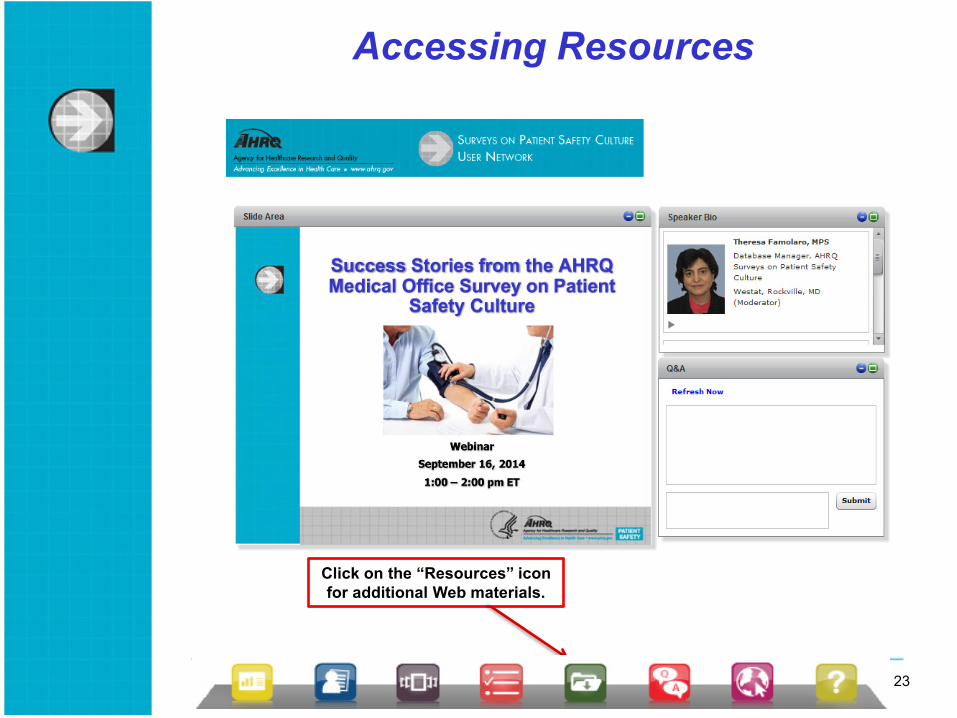
Accessing Resources
Click on the “Resources” icon for additional Web materials.

24 24
Conclusion
Next Open Data Submission: October 2015
For more information on submitting data: https://www.sopsdatabase.ahrq.gov
Database questions Email
Phone o 1-888-324-9790