Embed Size (px)
Citation preview

Medical labour force1999

The Australian Institute of Health and Welfare is Australia’s national health and welfarestatistics and information agency. The Institute’s mission is to improve the health and well-being of Australians by informing community discussion and decision making throughnational leadership in developing and providing health and welfare statistics and information.
NATIONAL HEALTH LABOUR FORCE SERIESNumber 24
Medical labour force1999
Australian Institute of Health and WelfareCanberra
AIHW Cat. no. HWL 24
������������������ ����� ��������� ��� �����
�������������������������������������� ����� ���� ����� ���� ����������� ��� ������������! �� ������ ������������������ ��� �������������� ����������������� ���� ��������� ��� ��" #� �������� �#�� ������ ������ ��������������������������! �� �� ������� �� �� �$ �������%�!���� ����������������� ����� ��������� ��� �&%'(�)�*+� �,��! �����,���-�.�
������!������������������ ����������������� ����� ��������� ��� /��0������� ���1�!����2��� �3 � ��������� � ��������� �������� /����!����������4��! �������� %�!�������5�� ����������������� ����� ��������� ��� �&%'�(�)�*+� �,��! �����,��-�. ����4���� �������� /��� !��� �6����788����������4���9�
�330�.��+:;��<
�3(0�.�+;��;���-�=
��������������
���������������� ����� ��������� ��� �������$ �����!�������� �.<<<�������,���������1��;��,��! ���7������60������� ����1�!����2��� �3 � ��0����;9�
�������� �� ������������������ ���������
(�����,���>��3���������� �
>� ����>��"������$��� �
���� �#�� ���!����������� �������������!������������! ��� �� ����7
1�!����2��� �����"����� ����5������������������ ����� ��������� ��� &%'�(�)�*+�,��! �����,���-�.%��� 7�6��9�-�;;�..*�?��7��!������� @������4���
%�!�� ��!������������������ ����� ��������� ���
%��� ��!��,%%
v
Contents
List of tables.........................................................................................................................................vii
List of figures........................................................................................................................................ ix
Abbreviations ........................................................................................................................................ x
Symbols and other usages ................................................................................................................... x
Acknowledgments............................................................................................................................... xi
Preface................................................................................................................................................ xiii
Explanatory notes .............................................................................................................................xiv
1 Main features ................................................................................................................................ 1
2 Overview of the medical labour force in 1999........................................................................ 4
2.1 Introduction ........................................................................................................................... 4
2.2 Employed medical practitioners in 1999............................................................................ 4
2.2.1 Clinicians ...................................................................................................................... 4
2.2.2 Non-clinicians .............................................................................................................. 6
2.3 State/Territory and geographic distribution .................................................................... 6
2.3.1 State and Territory distribution................................................................................. 6
2.3.2 Geographic distribution ........................................................................................... 10
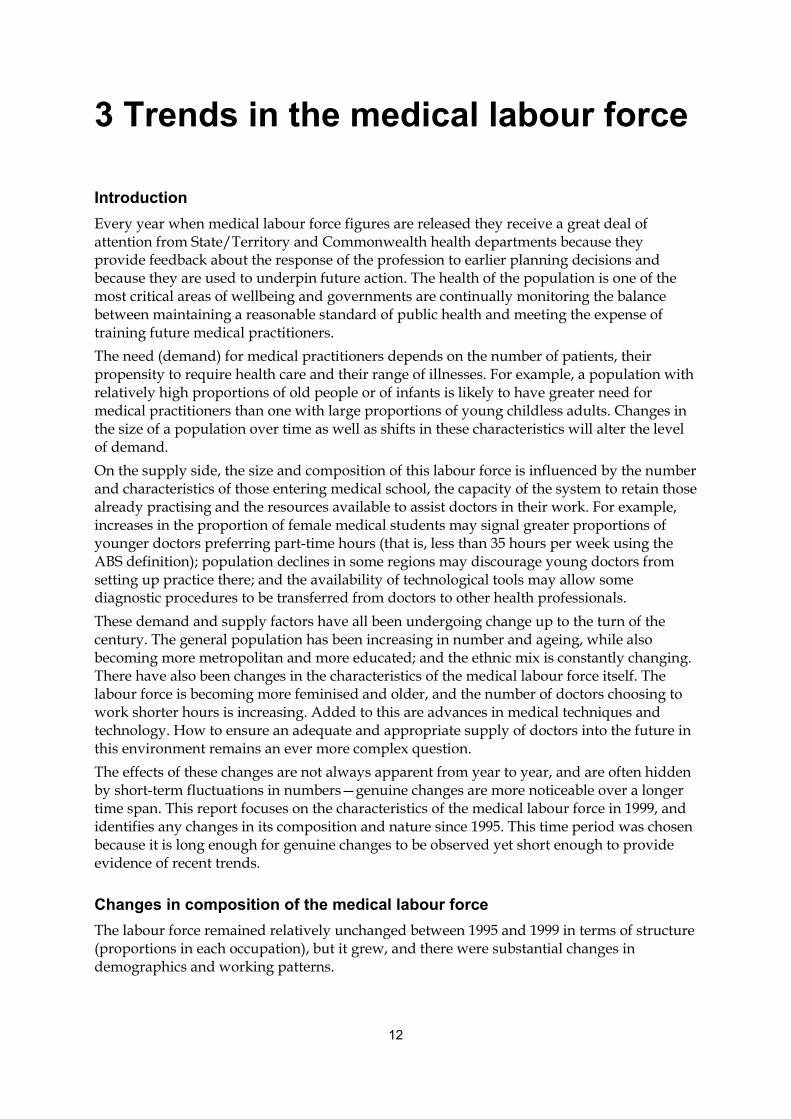
3 Trends in the medical labour force......................................................................................... 12
3.1 Employed medical practitioners ....................................................................................... 13
3.1.1 Demographic changes .............................................................................................. 14
3.1.2 Changing work patterns........................................................................................... 15
3.2 Clinicians .............................................................................................................................. 17
3.2.1 Primary care practitioners........................................................................................ 18
3.2.2 Hospital non-specialists ........................................................................................... 22
3.2.3 Specialists and specialists-in-training..................................................................... 23
3.3 State and Territory comparisons ....................................................................................... 27
3.3.1 Supply of medical practitioners .............................................................................. 27
3.3.2 Age and sex ................................................................................................................ 28

vi
4 Future growth in the medical labour force ........................................................................... 29
4.1 Education.............................................................................................................................. 29
4.1.1 Medical students in university ................................................................................ 30
4.1.2 Postgraduate specialist training .............................................................................. 31
4.2 Migration .............................................................................................................................. 32
Appendix A: Detailed tables ........................................................................................................... 35
Glossary............................................................................................................................................... 57
References ........................................................................................................................................... 63
Related publications ......................................................................................................................... 64

vii
List of tablesTable 1: Medical Labour Force Survey: estimated survey response rate, States and
Territories, 1995 and 1999 ...........................................................................................xv
Table 2: Employed medical practitioners: selected characteristics by occupation,Australia, 1999 ................................................................................................................ 5
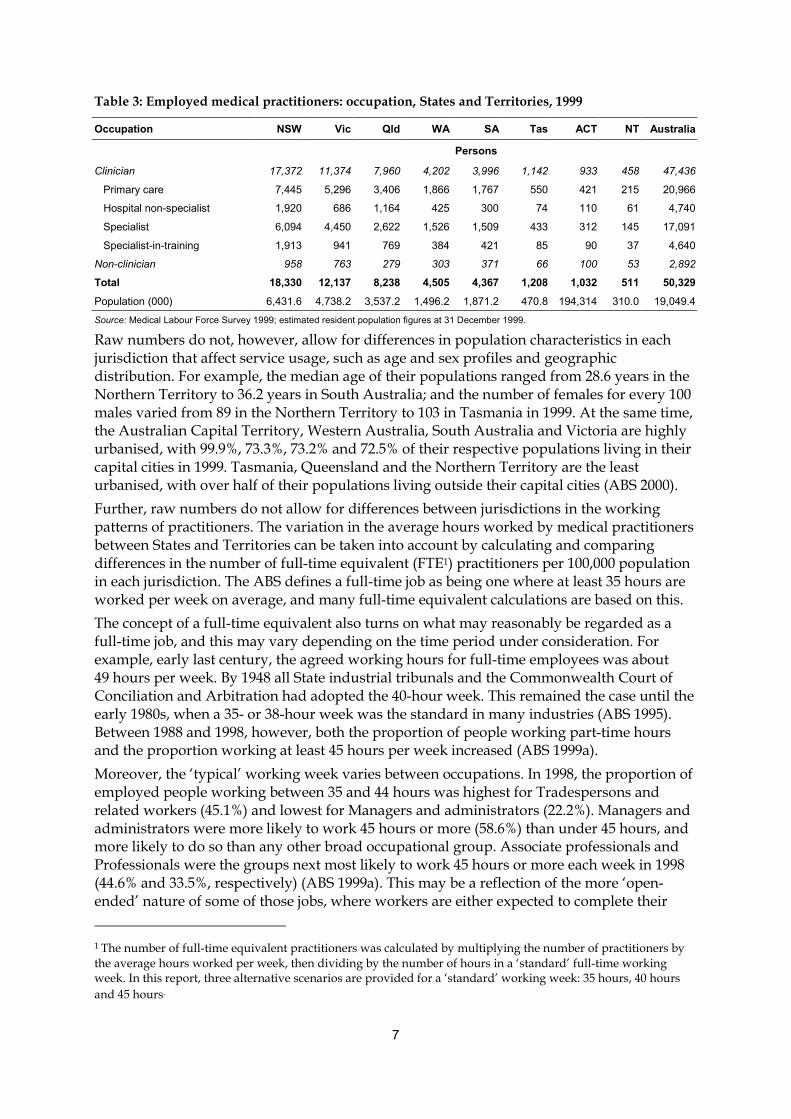
Table 3: Employed medical practitioners: occupation, States and Territories, 1999 ........... 7
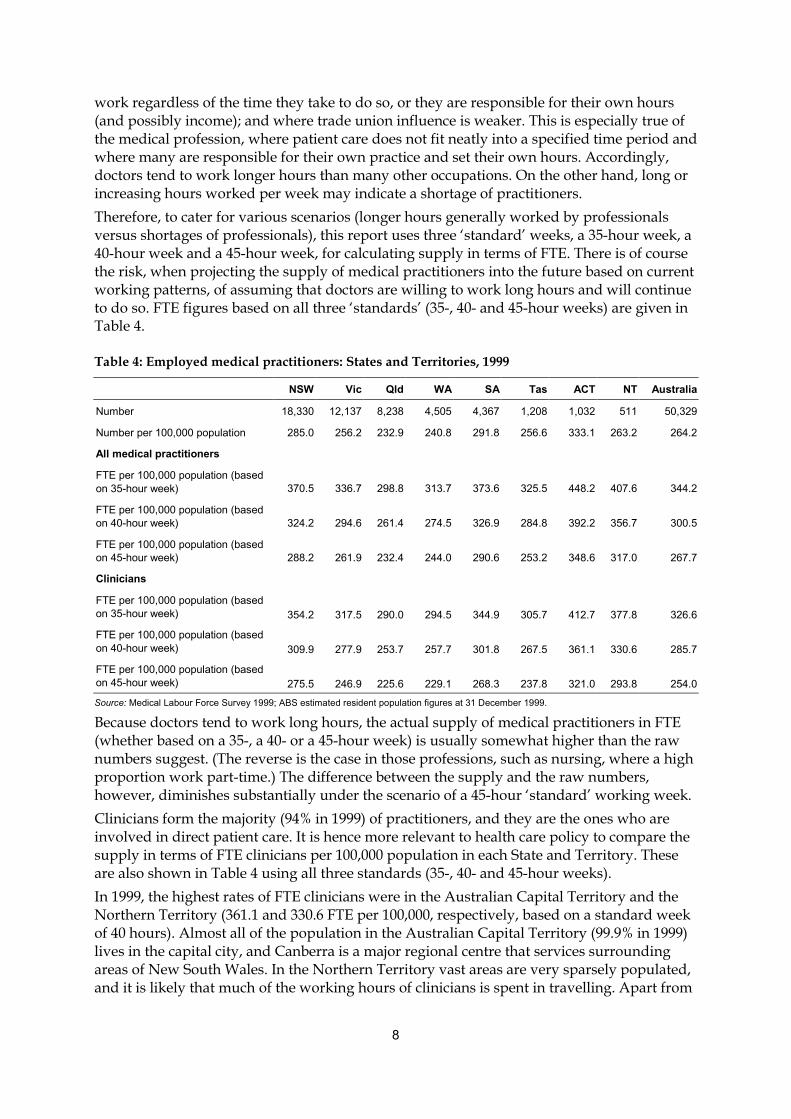
Table 4: Employed medical practitioners: States and Territories, 1999................................. 8
Table 5: Medicare services 1998–99, and patient consultations 1995 and 2001, Statesand Territories ................................................................................................................ 9
Table 6: Employed medical practitioners: occupation, geographical region,Australia, 1999 .............................................................................................................. 10
Table 7: Employed primary care practitioners: geographic region, Australia, 1999......... 11
Table 8: Changes in employed medical practitioners: selected characteristics byoccupation, Australia, 1995–99................................................................................... 13
Table 9: Average weekly hours worked, and proportion working 50 hours or moreper week: medical practitioners and selected other occupations, Australia, 1995and 1999......................................................................................................................... 15
Table 10: Primary care practitioners: selected characteristics by geographic area,1995 and 1999................................................................................................................ 20
Table 11: Specialists: selected characteristics by geographic area of main job, 1995and 1999......................................................................................................................... 26
Table 12: Employed medical practitioners: States and Territories, 1995 and 1999.............. 28
Table 13: Employed medical practitioners: percent female and average age, Statesand Territories, 1995 and 1999.................................................................................... 28
Table 14: Australian citizens and permanent residents commencing undergraduatemedicine courses: university and average age, and proportion female,1991–2000....................................................................................................................... 30
Table 15: Vocational training positions 1998 and 1999, and available first-year places 1999and 2000, Australian specialist colleges.................................................................... 32
Table 16: Australian Medical Council examination and specialist assessment results,1992–93 to 1999–00 ....................................................................................................... 34
Table A.1: All registered medical practitioners: employment status and sex, Statesand Territories, 1999 .................................................................................................... 35
Table A.2: Employed medical practitioners: occupation, sex and rate, States andTerritories, 1999 ............................................................................................................ 36
Table A.3: Employed medical practitioners: occupation, sex and rate, States andTerritories, 1995 ............................................................................................................ 37
Table A.4: Employed medical practitioners: age and sex, Australia, 1995 and 1999............. 38
Table A.5: Employed medical practitioners: hours worked per week and sex,Australia, 1995 and 1999 ............................................................................................. 38

viii
Table A.6: Clinicians: geographic area of main job and sex, Australia, 1995 and 1999......... 39
Table A.7: Primary care practitioners: age and sex, Australia, 1995 and 1999 ....................... 40
Table A.8: Primary care practitioners: sex, geographic area of main job, average ageand average hours worked per week, Australia, 1995 and 1999........................... 41
Table A.9: Primary care practitioners: sex, geographic area of main job and age,Australia, 1999 .............................................................................................................. 42
Table A.10: Primary care locums and deputising service practitioners: geographicarea of main job, Australia, 1995 and 1999 ............................................................... 42
Table A.11: Hospital non-specialists: age and sex, Australia, 1995 and 1999........................... 43
Table A.12: Hospital non-specialists: position and total hours worked per week,Australia, 1995 and 1999 ............................................................................................. 44
Table A.13: Specialists: main specialty of practice, sex and rate (per 100,000 population),Australia, 1995 and 1999 ............................................................................................. 45
Table A.14: Specialists and specialists-in-training: age and proportion female, Australia,1995 and 1999................................................................................................................ 47
Table A.15: Specialists and specialists-in-training: total hours worked per week,Australia, 1995 and 1999 ............................................................................................. 48
Table A.16: Selected specialists: geographic area of main job, Australia, 1995 and 1999 ....... 49
Table A.17: Medicine student course completions: residency(a) and level of course,Australia, 1990–99 ........................................................................................................ 50
Table A.18: Temporary migration of Australian and non-Australian medical practitionersto and from Australia for employment: type of migration and country ofprevious/future residence, 1992–93 to 1999–00....................................................... 51
Table A.19: Permanent migration of Australian and non-Australian medical practitionersto and from Australia for employment: type of migration and country ofprevious/future residence, 1992–93 to 1999–00....................................................... 53
Table A.20: Medicare: Number of services and services per capita by sex and age, andby patient State and Territory, 1998–99..................................................................... 54
Table A.21: Estimated yearly losses of medical practitioners from retirement or death,Australia, 1995 and 1999 ............................................................................................. 56

ix
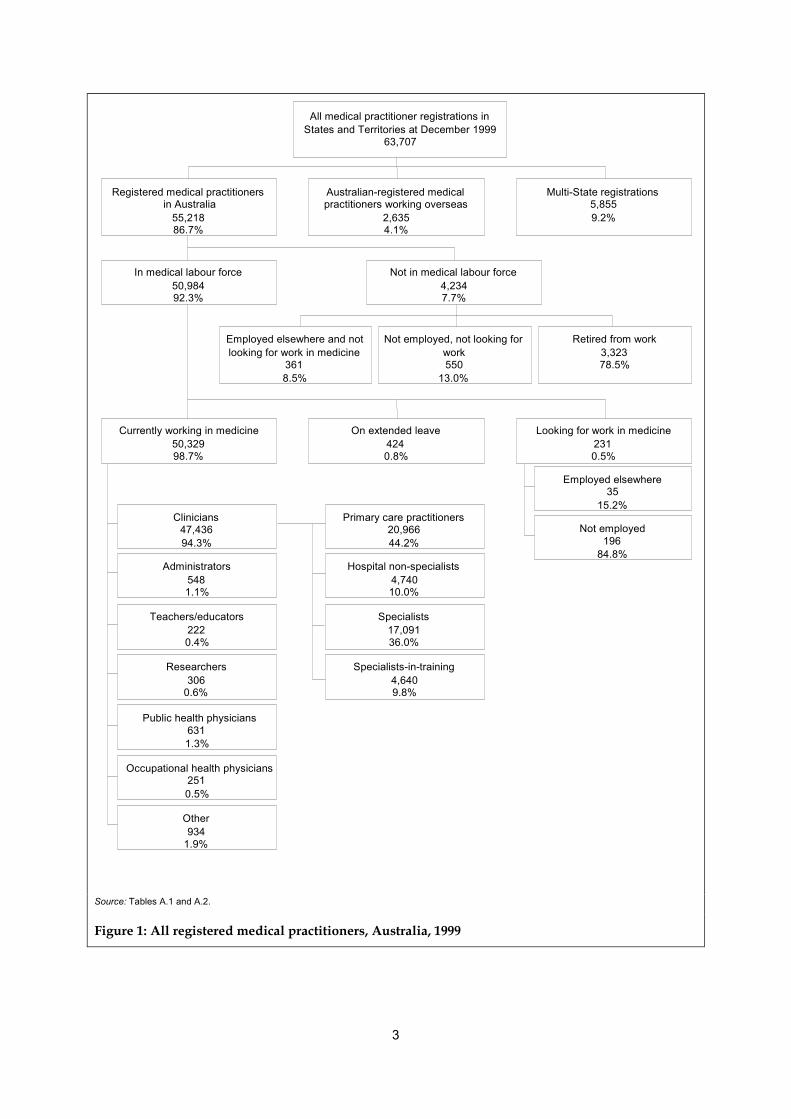
List of figuresFigure 1: All registered medical practitioners, Australia, 1999................................................ 3
Figure 2: Employed medical practioners: age and sex, Australia, 1995 and 1999............... 14
Figure 3: Employed medical practitioners: hours worked per week, Australia, 1995and 1999......................................................................................................................... 16
Figure 4: Clinicians: geographic area of main job, rate (per 100,000 population),Australia, 1995 and 1999 ............................................................................................. 18
Figure 5: Primary care practitioners: rate (per 100,000 population), States andTerritories, 1995 and 1999 .......................................................................................... 19
Figure 6: Primary care locums and deputising service practitioners: geographic areaof main job and rate (per 100 primary care practitioners), Australia, 1995and 1999......................................................................................................................... 20
Figure 7: Primary care practitioners: sex, age and average hours worked per week,Australia, 1995 and 1999 ............................................................................................. 21
Figure 8: Primary care practitioners: geographic area of main job and averageweekly hours, Australia, 1995 and 1999.................................................................... 22
Figure 9: Resident medical officers/interns and other hospital non-specialists:hours worked per week, Australia, 1995 and 1999 ................................................. 23
Figure 10: Specialists: age group, Australia, 1995 and 1999 ..................................................... 24
Figure 11: Specialists and specialists-in-training: specialty of practice and percentageworking 65 or more hours a week, Australia, 1995 and 1999 ................................ 25
Figure 12: Specialists: number per 100,000 population and geographic area, Australia,1995 and 1999................................................................................................................ 26
Figure 13: Medicine student course completions: residency and level of course,Australia, 1990–99 ........................................................................................................ 31
Figure 14: Temporary migration of non-Australian medical practitioners to Australiafor employment: length of migration, 1992–93 to 1999–00..................................... 33
Figure 15: Permanent migration of Australian medical practitioners from Australiaand non-Australian medical practitioners to Australia for the purpose ofemployment, 1992–93 to 1999–00............................................................................... 34
x
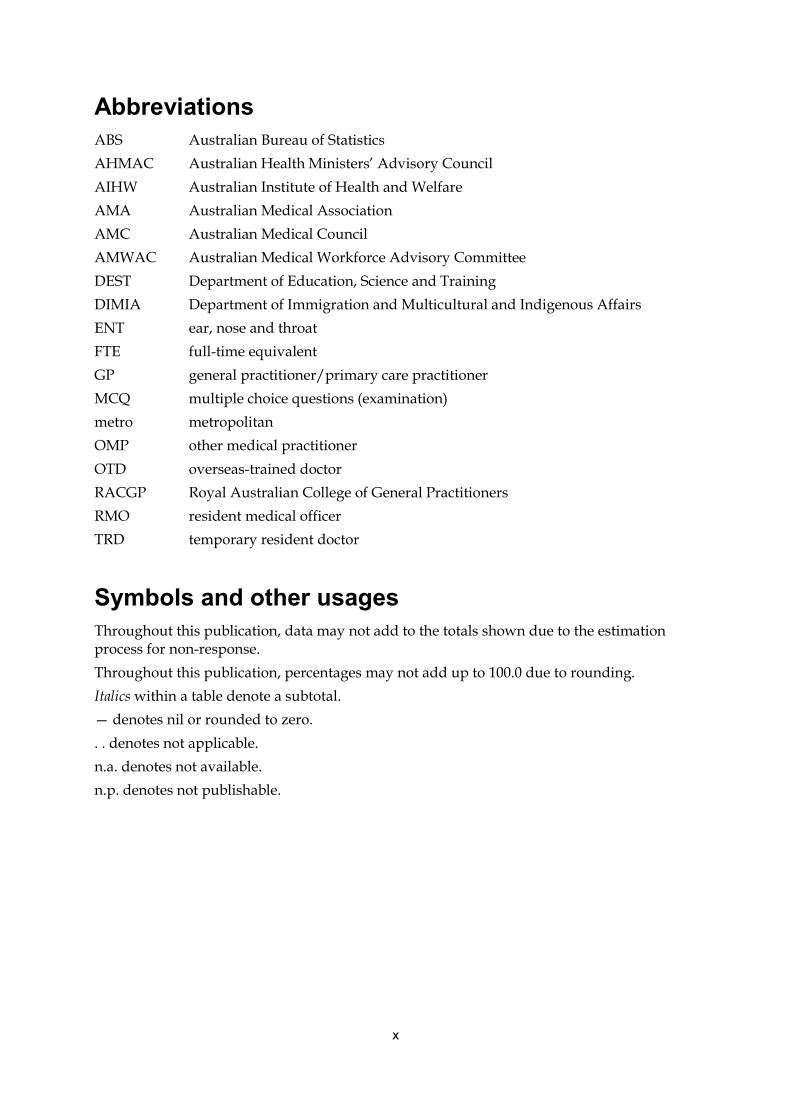
AbbreviationsABS Australian Bureau of StatisticsAHMAC Australian Health Ministers’ Advisory CouncilAIHW Australian Institute of Health and WelfareAMA Australian Medical AssociationAMC Australian Medical CouncilAMWAC Australian Medical Workforce Advisory CommitteeDEST Department of Education, Science and TrainingDIMIA Department of Immigration and Multicultural and Indigenous AffairsENT ear, nose and throatFTE full-time equivalentGP general practitioner/primary care practitionerMCQ multiple choice questions (examination)metro metropolitanOMP other medical practitionerOTD overseas-trained doctorRACGP Royal Australian College of General PractitionersRMO resident medical officerTRD temporary resident doctor
Symbols and other usagesThroughout this publication, data may not add to the totals shown due to the estimationprocess for non-response.Throughout this publication, percentages may not add up to 100.0 due to rounding.Italics within a table denote a subtotal.— denotes nil or rounded to zero.. . denotes not applicable.n.a. denotes not available.n.p. denotes not publishable.

xi
AcknowledgmentsThis publication was compiled by Odette Vogt, with guidance from Graham Angus, GleniceTaylor and Warwick Conn of the Labour Force and Rural Health Unit, and assistance fromKathy Southgate of the Data and Information Technology Unit of the Australian Institute ofHealth and Welfare.We thank each State and Territory medical board and health authority that provided dataused in this publication; the Department of Education, Science and Training and theDepartment of Immigration and Multicultural and Indigenous Affairs for education andimmigration data; the Australian Bureau of Statistics for population data; the AustralianMedical Association for information about their ‘Safe Hours Strategy’; and the AustralianMedical Council for information about registration pathways for overseas-trained doctors.Most importantly, we also thank the medical practitioners who took the time to complete thesurvey. Without their cooperation, it would not be possible to maintain this collection, whichis used to underpin planning and policy decisions.

xiii
PrefaceIn common with most other countries in the world, Australia is facing the challengespresented by an ageing population and a corresponding ageing of the general workforce. Inthe area of health, these challenges are twofold: providing for the particular health problemsof an increasing elderly population; and replacing older health workers as they exit theworkforce through retirement. In the worst case, these trends could result in heavierworkloads for a depleted health workforce.To avoid such a scenario, there has been an increased focus by policymakers and workforceplanning bodies on maintaining an adequate health workforce for all Australians over thecoming decades. For the medical profession, the long lead time between commencing andcompleting training, within a climate of rapidly advancing technologies and techniques,introduces a further level of complexity into the planning process. It is therefore critical tohave detailed and reliable sources of data to describe the size and characteristics of thecurrent medical workforce; of new entrants to the workforce (newly qualified graduates andimmigration of doctors); and of those who are leaving for various reasons, includingretirement. It is also important to monitor the supply of medical practitioners across thevarious regions of Australia.The most reliable source of detailed data about medical practitioners in Australia is theMedical Labour Force Survey, which has been conducted each year since 1993 in each Stateand Territory, in conjunction with their registration processes. This publication presentsfindings from the 1999 survey, supplemented by data from various other sources, to portraya picture of the medical labour force in 1999. Comparisons are made with 1995 to showmedium term trends over the previous four years, while student enrolment figures are usedas a basis for projecting future trends.The Institute places on record its appreciation to the large proportion of doctors in Australiawho responded to the survey. In doing so, they are assisting planning and resourceallocation nationally, both within the profession and across the whole health system.This publication differs from those of previous years in several respects. It provides deeperanalysis and insights through a focus on particular issues and more extensive use of otherdata sources. The findings are presented in a more easily digested format, enhanced withcarefully chosen tables and figures. The Appendix in the publication contains a smallernumber of tables providing only the main statistics, while a comprehensive set of tablescontaining 1999 data has been placed on the Institute’s web site (http://www.aihw.gov.au).This package provides both broad background figures for the general reader as well as muchmore detailed and readily accessible information than has previously been the case, inspreadsheets suitable for planning purposes.The Institute welcomes readers’ suggestions for further improvements to the publication.These can be emailed to [email protected].
Richard MaddenDirectorJanuary 2003
xiv
Explanatory notes
BackgroundIn 1990, the Australian Health Ministers’ Advisory Council (AHMAC) commissioned theAustralian Institute of Health and Welfare (AIHW) to develop national health labour forcestatistics about the major registrable health professions. Data collections based on a nationalminimum data set were developed addressing the workforce planning needs of the healthprofessions, government, service providers and educational institutions.This report is the seventh in a series of publications based primarily on the annual MedicalLabour Force Survey. The information contained within this report is drawn from the 1995and 1999 Medical Labour Force Surveys, as well as information supplied by the Departmentof Education, Science and Training and the Department of Immigration and Multiculturaland Indigenous Affairs. To view the full range of information available from the 1995 and1999 surveys, as well as more detailed information from the additional data sources, pleasevisit the web site at: http://www.aihw.gov.au/publications/health.html.
Scope and coverageThe scope of the Medical Labour Force Survey is all practitioners registered with the medicalboard in each State and Territory and eligible to practise.Coverage in some States may exclude medical practitioners who registered for the first timeduring the current year and practitioners with a conditional registration. These conditionalregistrants include interns and temporary resident doctors, who are not required to renewtheir registration at the standard renewal date. In some jurisdictions, practitioners known tothe boards to be not practising because they were retired, overseas or had moved interstatewere not included in the survey.
MethodEach State and Territory medical board conducts an annual renewal of practitionerregistration and the survey questionnaire was sent to all medical practitioners as part of theregistration renewal process.
TimingThe statistics in this publication relate to registration renewals during the period October–December 1995 and October–December 1999. The renewal notices and the survey weredispatched in all States and Territories in September 1995 and September 1999. The dispatchdate is generally three months before the expiry of registration. Survey data on practiceactivity refer to the four-week period before completion of the questionnaire by each medicalpractitioner.
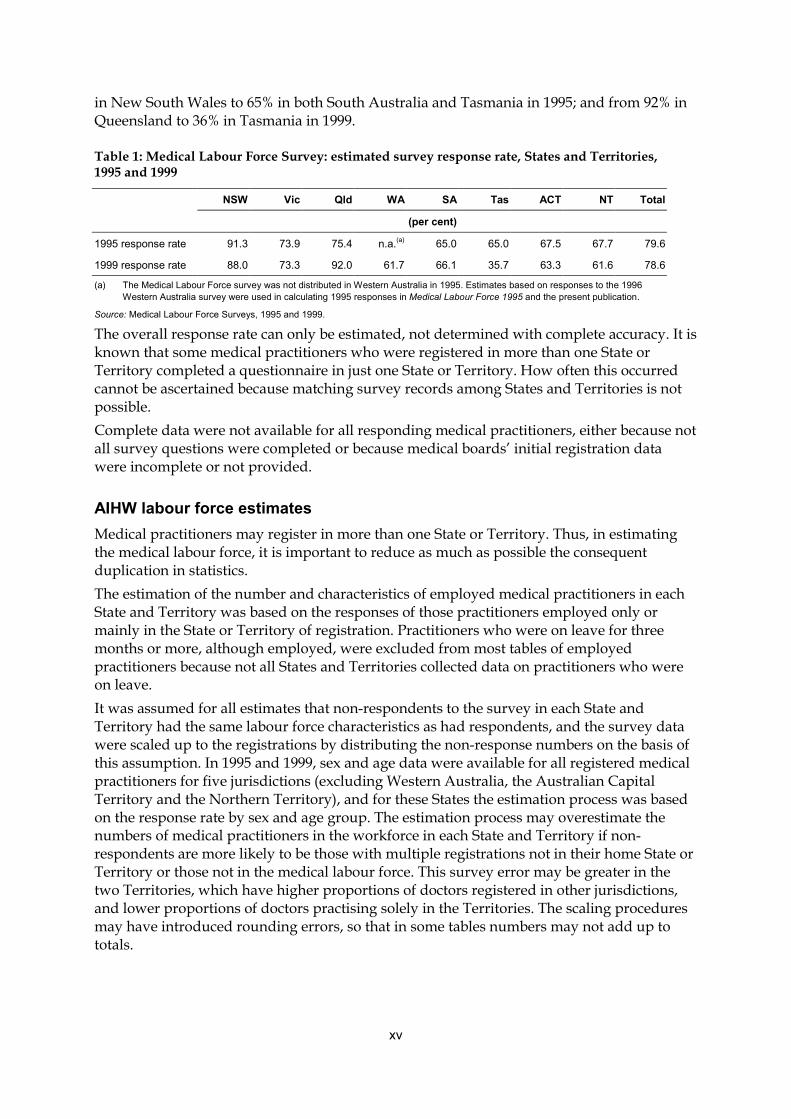
Response rateThe responses to the AIHW Medical Labour Force Surveys represented 79.6% and 78.6% ofthe total medical registrations in all States and Territories in 1995 and 1999, respectively(Table 1). The estimated response rates for individual States and Territories ranged from 91%
xv
in New South Wales to 65% in both South Australia and Tasmania in 1995; and from 92% inQueensland to 36% in Tasmania in 1999.
Table 1: Medical Labour Force Survey: estimated survey response rate, States and Territories,1995 and 1999
NSW Vic Qld WA SA Tas ACT NT Total
(per cent)
1995 response rate 91.3 73.9 75.4 n.a.(a) 65.0 65.0 67.5 67.7 79.6
1999 response rate 88.0 73.3 92.0 61.7 66.1 35.7 63.3 61.6 78.6
(a) The Medical Labour Force survey was not distributed in Western Australia in 1995. Estimates based on responses to the 1996Western Australia survey were used in calculating 1995 responses in Medical Labour Force 1995 and the present publication.
Source: Medical Labour Force Surveys, 1995 and 1999.
The overall response rate can only be estimated, not determined with complete accuracy. It isknown that some medical practitioners who were registered in more than one State orTerritory completed a questionnaire in just one State or Territory. How often this occurredcannot be ascertained because matching survey records among States and Territories is notpossible.Complete data were not available for all responding medical practitioners, either because notall survey questions were completed or because medical boards’ initial registration datawere incomplete or not provided.
AIHW labour force estimatesMedical practitioners may register in more than one State or Territory. Thus, in estimatingthe medical labour force, it is important to reduce as much as possible the consequentduplication in statistics.The estimation of the number and characteristics of employed medical practitioners in eachState and Territory was based on the responses of those practitioners employed only ormainly in the State or Territory of registration. Practitioners who were on leave for threemonths or more, although employed, were excluded from most tables of employedpractitioners because not all States and Territories collected data on practitioners who wereon leave.It was assumed for all estimates that non-respondents to the survey in each State andTerritory had the same labour force characteristics as had respondents, and the survey datawere scaled up to the registrations by distributing the non-response numbers on the basis ofthis assumption. In 1995 and 1999, sex and age data were available for all registered medicalpractitioners for five jurisdictions (excluding Western Australia, the Australian CapitalTerritory and the Northern Territory), and for these States the estimation process was basedon the response rate by sex and age group. The estimation process may overestimate thenumbers of medical practitioners in the workforce in each State and Territory if non-respondents are more likely to be those with multiple registrations not in their home State orTerritory or those not in the medical labour force. This survey error may be greater in thetwo Territories, which have higher proportions of doctors registered in other jurisdictions,and lower proportions of doctors practising solely in the Territories. The scaling proceduresmay have introduced rounding errors, so that in some tables numbers may not add up tototals.

xvi
Comparability with data in previous reportsThere are some differences between data published in this report and data published inMedical Labour Force 1995 (AIHW 1997). The 1993, 1994 and 1995 figures were revised by abenchmarking process against increases in Medicare providers to 1996. These increasesclosely matched increases in medical practitioners between 1993 (projected from the 1991Census) and the 1996 Census. This current report incorporates all revisions and amendmentsmade to 1995 data.
Additional data sourcesAdditional data in this report came from a variety of sources:• the Australian Bureau of Statistics• the Department of Education, Science and Training• the Department of Immigration and Multicultural and Indigenous Affairs.
The Australian Bureau of StatisticsThe Australian Bureau of Statistics (ABS) conducts the National Health Survey every sixyears. A random sample of households is surveyed regarding a broad range of health andwellbeing issues. Information from the 1995 survey was used to determine the number ofpeople who consulted a medical practitioner in the two weeks preceding the survey in thatyear.
The Department of Education, Science and TrainingThe Department of Education, Science and Training (DEST) requires all universities toprovide data on students commencing, enrolling in and completing all university courses.This information provides the number and characteristics of new entrants to medicalcourses, as well as those currently enrolled in medicine and those who graduate withmedical degrees.
The Department of Immigration and Multicultural and Indigenous AffairsThe Department of Immigration and Multicultural and Indigenous Affairs (DIMIA) obtainsdata on the number of medical practitioners arriving both temporarily and permanently intoAustralia to work. Information is also gathered on the number of Australian medicalpractitioners leaving Australia temporarily to find employment overseas, as well as thosewho plan to permanently settle in another country. This information is retrieved fromincoming and outgoing passenger cards distributed to all air and sea passengers.
1
1 Main features
The medical labour force in 1999In 1999 there were 55,218 registered medical practitioners in Australia, after allowing formultiple registrations and those who were overseas.
Most of these (92.3%) were in the medical labour force.
Of those currently working in medicine in 1999, nearly all (47,436 or 94.3%) were clinicians,comprising 20,966 primary care practitioners (44.2%), 17,091 specialists (36.0%), 4,740hospital non-specialists (10.0%) and 4,640 specialists-in-training (9.8%).
The average age of medical practitioners was 47.7 years, and those in capital cities and othermetropolitan areas were older on average (48.0 and 48.4 years, respectively), while those inremote areas were younger (42.3 years).
Employed practitioners worked 45.6 hours per week on average, and just under half (47%)worked 50 or more hours per week in 1999. Clinicians worked 42.0 hours per week, onaverage, in direct patient care.
Primary care practitioners worked 42.3 hours per week on average (47.7 hours per week formales and 32.3 for females). Their average hours increased steadily with increasingremoteness, from 41.2 hours per week in capital cities to 51.0 hours in remote areas.
Resident medical officers (RMOs) and interns worked longer hours than employed medicalpractitioners in general, with 62% working 50 hours or more per week in 1999.
There were 264.2 employed medical practitioners per 100,000 people in Australia in 1999,ranging from 333.1 per 100,000 in the ACT to 232.9 per 100,000 in Queensland.
Changes since 1995There was a 6.3% growth in the number of employed medical practitioners and a 6.4%increase in the number of clinicians since 1995. By comparison, the Australian populationrose by 4.7%.
This resulted in a slight rise in the supply of medical practitioners from 260 per 100,000people in 1995 to 264 per 100,000 in 1999.
The supply of medical practitioners rose in New South Wales, Western Australia, SouthAustralia, Tasmania, the Australian Capital Territory and the Northern Territory, and fell inthe other States.
The supply of clinicians increased in all geographical regions—most of the growth occurredin large rural centres, where there was an increase from 240 to 265 per 100,000.

2
The proportion of employed medical practitioners who were female rose from 27.2% to29.4%; the average age increased from 44.9 years to 46.0 years; and the average number ofhours worked per week decreased from 48.2 to 45.6.
It is likely that these trends will continue because of increasing proportions of studentscommencing undergraduate medicine courses who are older and who are female.
3
All medical practitioner registrations inStates and Territories at December 1999
63,707
Registered medical practitioners in Australia
55,21886.7%
Australian-registered medicalpractitioners working overseas
2,6354.1%
Multi-State registrations5,8559.2%
In medical labour force50,98492.3%
Currently working in medicine50,32998.7%
Occupational health physicians2510.5%
Researchers306
0.6%
Teachers/educators2220.4%
Other934
1.9%
Public health physicians6311.3%
Administrators5481.1%
Clinicians47,43694.3%
Primary care practitioners20,96644.2%
Hospital non-specialists4,74010.0%
Specialists17,09136.0%
Specialists-in-training4,6409.8%
On extended leave4240.8%
Employed elsewhere and notlooking for work in medicine
3618.5%
Not employed, not looking forwork550
13.0%
Retired from work3,32378.5%
Not in medical labour force4,2347.7%
Looking for work in medicine2310.5%
Employed elsewhere35
15.2%
Not employed196
84.8%
Source: Tables A.1 and A.2.
Figure 1: All registered medical practitioners, Australia, 1999
4
2 Overview of the medical labourforce in 1999
2.1 IntroductionIn December 1999, the Australian medical labour force comprised 50,984 medicalpractitioners, of whom 50,329 (98.7%) were employed and practising in medicine (Figure 1).This compares with the much larger nurse labour force (233,982 in 1999 of whom 224,595, or96.0%, were working in nursing) and the smaller pharmacy labour force (15,176 in 1999, ofwhom 14,747, or 97.2%, were working as pharmacists).This overview outlines the main characteristics and the geographic distribution of the threegroups of clinicians and the small group of non-clinicians in 1999.
2.2 Employed medical practitioners in 1999Of the 50,329 employed practitioners in 1999, the vast majority (94%) were clinicians.Specialists also made up a large group (36%), and hospital non-specialists and specialists-in-training (each 10%) made up the remainder. Non-clinicians (administrators, educators,researchers, etc.) accounted for the remaining 6% of employed practitioners.The majority of employed practitioners were male (70.6%), their average age was 46.0 yearsand as a group they worked an average of 45.6 hours per week (Table 2).
2.2.1 CliniciansClinicians are the broad body of practitioners responsible for diagnosing and/or treatingpatients. The 47,436 clinicians in 1999 supplied the Australian population at a rate of 249 per100,000 people, and most (70.8%) were male. Clinicians comprise primary care practitioners(the largest group at 44.2%); hospital non-specialists (10.0%); specialists (36.0%) andspecialists-in-training (9.8%).
Primary care practitionersPrimary care practitioners (mostly general practitioners) form the largest body of clinicalpractitioners because they are usually the first point of contact for patients, for primary care.Not only do they deal with common illnesses, provide advice and administer ongoing care,but they also have the skills and knowledge to recognise more serious conditions thatrequire specialist services.There were 20,966 employed primary care practitioners in Australia in 1999, and most werevocationally registered general practitioners (VRGPs) (18,180, or 86.7%). Another 894 (4.3%)were GP trainees, and those termed ‘other medical practitioners’ (OMPs), whose mainpractice is unreferred patient attendances, made up the remaining 1,892 (9.0%).

5
Table 2: Employed medical practitioners: selected characteristics by occupation, Australia, 1999
Occupation No. Rate(a) % female Average ageAverage
weekly hours
Clinician: 47,436 249.0 29.2 45.7 45.9
Primary care 20,966 110.1 34.6 47.7 42.3
Hospital non-specialist 4,740 24.9 41.0 32.4 48.2
Specialist 17,091 89.7 17.2 49.9 48.1
Specialist-in-training 4,640 24.4 37.4 32.3 51.7
Non-clinician: 2,892 15.2 32.9 49.7 41.3
Administrator 548 2.9 32.9 49.6 44.8
Teacher/ educator 222 1.2 26.1 51.8 41.6
Researcher 306 1.6 38.2 47.0 44.5
Public health physician 631 3.3 40.4 42.5 44.7
Occupational health physician 251 1.3 14.5 51.9 37.5
Other 934 4.9 32.5 53.9 37.0
Total 50,329 264.2 29.4 46.0 45.6
(a) Per 100,000 population, based on ABS estimated resident population figures at 31 December 1999.
Source: Medical Labour Force Survey 1999.
Over a third (34.6%) of the 20,966 primary care practitioners in 1999 were females, comparedwith 29.2% for all clinicians. With an average age of 47.7 years, primary care practitioners areyounger than specialists (49.9 years) and work shorter hours than other clinicians (42.3 hoursper week on average, compared with 48.1 hours per week for specialists, 51.7 for specialists-in-training and 48.2 for hospital non-specialists) (Table 2).
Hospital non-specialistsHospital non-specialists are medical practitioners mainly employed in a salaried position ina hospital who do not have a recognised specialist qualification and are not undertaking atraining program to gain a recognised specialist qualification. They include resident medicalofficers (RMOs) (including some GP trainees), interns and other salaried hospital careerpractitioners, and exclude specialists-in-training. In 1999, there were 4,740 medicalpractitioners in this group, comprising 3,368 RMOs and interns and 1,372 other medicalpractitioners (Tables 2 and A.12).The average age of hospital non-specialists was 32.4 years, and females made up a relativelylarge proportion (41.0%) of this group in 1999 (Table 2).Hospital non-specialists tended to work longer hours (48.2 hours per week on average) thanother clinicians, but this was mainly for RMOs and interns, who worked much longer hoursthan OMPs (50.0 and 44.0 hours per week, respectively) (Table A.12).
Specialists and specialists-in-trainingSpecialists are medical practitioners who have been awarded a qualification by a specialistprofessional college to treat certain conditions. Specialists-in-training are practitioners whohave been accepted by a specialist professional college into a training position supervised bya member of the college and who are working towards a specialist qualification. There were17,091 specialists in 1999, of whom 17.2% were female—a much lower proportion than otherclinical areas. The proportion of females was much higher, however, among the 4,640

6
specialists-in-training (37.4%), suggesting that the proportion of females in the specialistworkforce will rise in future years (Table 2).The average age of specialists was 49.9 years—older than other clinicians. Reflecting the factthat most medical practitioners who undertake specialty training do so early in their careers,the average age of specialists-in-training was 32.3 years in 1999. While specialists tend towork longer hours (48.1 per week) than primary care practitioners (42.3), specialists-in-training work longer hours still (51.7 per week, on average) (Table 2).In 1999, psychiatry (2,088, 12.2%), anaesthesia (2,052, 12.0%), diagnostic radiology (1,107,6.5%), obstetrics and gynaecology (1,100, 6.4%) and general surgery (1,058, 6.2%), each withover 1,000 practitioners, were the largest areas of specialty. The specialties with the largestproportions of female practitioners were cytopathology (45.0%), haematology (44.0%) andclinical genetics (a new specialty) (41.6%). These specialties were all very small, with no morethan 65 practitioners. Among larger specialties, females represented over a quarter ofpractitioners in geriatrics, infectious diseases, paediatric medicine, anatomical pathology,dermatology and psychiatry (Table A13).
2.2.2 Non-cliniciansThere were 2,892 non-clinicians employed in 1999. This small group comprised 548administrators, 222 teachers and educators, 306 researchers, 631 public health physicians, 251occupational health physicians and another 934 whose particular occupation was not known(Table 2).Non-clinicians tended to be slightly older than clinicians (49.7 years on average, comparedwith 45.7 years), and all of the above groups worked relatively short average hours, rangingfrom just under 45 hours per week for administrators, researchers and public healthphysicians to 41.6 hours per week for teachers and educators and 37.5 hours per week foroccupational health physicians. Just under a third of non-clinicians (32.9%) were female(Table 2).
2.3 State/Territory and geographic distribution
2.3.1 State and Territory distributionIn 1999, over a third of all medical practitioners (36.4% or 18,330) were in New South Wales,and almost a quarter (24.1%, or 12,137) were in Victoria. These two States accounted forsimilar proportions of the Australian population (33.8% and 24.8%, respectively in 1999). Thesmallest number worked in the Northern Territory (1.0% or 511), although these aresupplemented by practitioners who mainly work in another jurisdiction but who sometimestravel to work in the Northern Territory (Table 3).The highest numbers of both clinicians and non-clinicians were in New South Wales and thesecond highest of each were in Victoria, although there were more hospital non-specialistsemployed in Queensland (1,164) than in Victoria (686).
7
Table 3: Employed medical practitioners: occupation, States and Territories, 1999
Occupation NSW Vic Qld WA SA Tas ACT NT Australia
Persons
Clinician 17,372 11,374 7,960 4,202 3,996 1,142 933 458 47,436
Primary care 7,445 5,296 3,406 1,866 1,767 550 421 215 20,966
Hospital non-specialist 1,920 686 1,164 425 300 74 110 61 4,740
Specialist 6,094 4,450 2,622 1,526 1,509 433 312 145 17,091
Specialist-in-training 1,913 941 769 384 421 85 90 37 4,640
Non-clinician 958 763 279 303 371 66 100 53 2,892
Total 18,330 12,137 8,238 4,505 4,367 1,208 1,032 511 50,329Population (000) 6,431.6 4,738.2 3,537.2 1,496.2 1,871.2 470.8 194,314 310.0 19,049.4Source: Medical Labour Force Survey 1999; estimated resident population figures at 31 December 1999.
Raw numbers do not, however, allow for differences in population characteristics in eachjurisdiction that affect service usage, such as age and sex profiles and geographicdistribution. For example, the median age of their populations ranged from 28.6 years in theNorthern Territory to 36.2 years in South Australia; and the number of females for every 100males varied from 89 in the Northern Territory to 103 in Tasmania in 1999. At the same time,the Australian Capital Territory, Western Australia, South Australia and Victoria are highlyurbanised, with 99.9%, 73.3%, 73.2% and 72.5% of their respective populations living in theircapital cities in 1999. Tasmania, Queensland and the Northern Territory are the leasturbanised, with over half of their populations living outside their capital cities (ABS 2000).Further, raw numbers do not allow for differences between jurisdictions in the workingpatterns of practitioners. The variation in the average hours worked by medical practitionersbetween States and Territories can be taken into account by calculating and comparingdifferences in the number of full-time equivalent (FTE1) practitioners per 100,000 populationin each jurisdiction. The ABS defines a full-time job as being one where at least 35 hours areworked per week on average, and many full-time equivalent calculations are based on this.The concept of a full-time equivalent also turns on what may reasonably be regarded as afull-time job, and this may vary depending on the time period under consideration. Forexample, early last century, the agreed working hours for full-time employees was about49 hours per week. By 1948 all State industrial tribunals and the Commonwealth Court ofConciliation and Arbitration had adopted the 40-hour week. This remained the case until theearly 1980s, when a 35- or 38-hour week was the standard in many industries (ABS 1995).Between 1988 and 1998, however, both the proportion of people working part-time hoursand the proportion working at least 45 hours per week increased (ABS 1999a).Moreover, the ‘typical’ working week varies between occupations. In 1998, the proportion ofemployed people working between 35 and 44 hours was highest for Tradespersons andrelated workers (45.1%) and lowest for Managers and administrators (22.2%). Managers andadministrators were more likely to work 45 hours or more (58.6%) than under 45 hours, andmore likely to do so than any other broad occupational group. Associate professionals andProfessionals were the groups next most likely to work 45 hours or more each week in 1998(44.6% and 33.5%, respectively) (ABS 1999a). This may be a reflection of the more ‘open-ended’ nature of some of those jobs, where workers are either expected to complete their 1 The number of full-time equivalent practitioners was calculated by multiplying the number of practitioners bythe average hours worked per week, then dividing by the number of hours in a ‘standard’ full-time workingweek. In this report, three alternative scenarios are provided for a ‘standard’ working week: 35 hours, 40 hoursand 45 hours.
8
work regardless of the time they take to do so, or they are responsible for their own hours(and possibly income); and where trade union influence is weaker. This is especially true ofthe medical profession, where patient care does not fit neatly into a specified time period andwhere many are responsible for their own practice and set their own hours. Accordingly,doctors tend to work longer hours than many other occupations. On the other hand, long orincreasing hours worked per week may indicate a shortage of practitioners.Therefore, to cater for various scenarios (longer hours generally worked by professionalsversus shortages of professionals), this report uses three ‘standard’ weeks, a 35-hour week, a40-hour week and a 45-hour week, for calculating supply in terms of FTE. There is of coursethe risk, when projecting the supply of medical practitioners into the future based on currentworking patterns, of assuming that doctors are willing to work long hours and will continueto do so. FTE figures based on all three ‘standards’ (35-, 40- and 45-hour weeks) are given inTable 4.
Table 4: Employed medical practitioners: States and Territories, 1999
NSW Vic Qld WA SA Tas ACT NT Australia
Number 18,330 12,137 8,238 4,505 4,367 1,208 1,032 511 50,329
Number per 100,000 population 285.0 256.2 232.9 240.8 291.8 256.6 333.1 263.2 264.2
All medical practitioners
FTE per 100,000 population (basedon 35-hour week) 370.5 336.7 298.8 313.7 373.6 325.5 448.2 407.6 344.2
FTE per 100,000 population (basedon 40-hour week) 324.2 294.6 261.4 274.5 326.9 284.8 392.2 356.7 300.5
FTE per 100,000 population (basedon 45-hour week) 288.2 261.9 232.4 244.0 290.6 253.2 348.6 317.0 267.7
Clinicians
FTE per 100,000 population (basedon 35-hour week) 354.2 317.5 290.0 294.5 344.9 305.7 412.7 377.8 326.6
FTE per 100,000 population (basedon 40-hour week) 309.9 277.9 253.7 257.7 301.8 267.5 361.1 330.6 285.7
FTE per 100,000 population (basedon 45-hour week) 275.5 246.9 225.6 229.1 268.3 237.8 321.0 293.8 254.0
Source: Medical Labour Force Survey 1999; ABS estimated resident population figures at 31 December 1999.
Because doctors tend to work long hours, the actual supply of medical practitioners in FTE(whether based on a 35-, a 40- or a 45-hour week) is usually somewhat higher than the rawnumbers suggest. (The reverse is the case in those professions, such as nursing, where a highproportion work part-time.) The difference between the supply and the raw numbers,however, diminishes substantially under the scenario of a 45-hour ‘standard’ working week.Clinicians form the majority (94% in 1999) of practitioners, and they are the ones who areinvolved in direct patient care. It is hence more relevant to health care policy to compare thesupply in terms of FTE clinicians per 100,000 population in each State and Territory. Theseare also shown in Table 4 using all three standards (35-, 40- and 45-hour weeks).In 1999, the highest rates of FTE clinicians were in the Australian Capital Territory and theNorthern Territory (361.1 and 330.6 FTE per 100,000, respectively, based on a standard weekof 40 hours). Almost all of the population in the Australian Capital Territory (99.9% in 1999)lives in the capital city, and Canberra is a major regional centre that services surroundingareas of New South Wales. In the Northern Territory vast areas are very sparsely populated,and it is likely that much of the working hours of clinicians is spent in travelling. Apart from

9
those two jurisdictions, supply of clinicians was highest in New South Wales and SouthAustralia (309.9 and 301.8 FTE per 100,000, respectively, based on a standard week of 40hours) (Table 4).Supply would be expected to differ between jurisdictions, however, given their distinctivepopulation characteristics (such as their age and sex profiles), which act to influence usage(demand) in various ways. For example, States and Territories with the oldest age profilessuch as Tasmania (median age 36.1 years) and South Australia (36.2 years) might be expectedto have greater need for medical services than those with the youngest age profiles such asthe Northern Territory (median age of 28.6 years) (Table 5).
Medicare servicesState/Territory usage can be compared broadly by using Medicare statistics regarding thenumber of services per capita in 1998–99 delivered by registered Medicare providers (whoare clinicians, and include primary care practitioners and specialists). These show thatservices provided were highest in New South Wales (11.7 per capita) and Victoria (11.0). Thelowest were in the Northern Territory (5.8 services per capita) (Table 5). These rates have notbeen standardised for age or sex, and therefore might be expected to reflect differences in theage/sex profiles between the States and Territories.
Table 5: Medicare services 1998–99, and patient consultations 1995 and 2001, States and Territories
NSW Vic Qld WA SA Tas ACT NT(a) Australia
Medicare services(per capita) 11.72 11.04 10.77 9.53 10.32 9.85 9.01 5.75 10.90
Patient consultations(per 100,000 population,1995) 248.1 230.1 222.3 215.9 234.8 221.1 219.7 191.1 232.9
Patient consultations(per 100,000 population,2001) 257.5 244.1 239.2 229.9 237.1 235.5 222.4 n.a. 244.7
Median age of population(years) 35.3 35.1 34.3 33.9 36.2 36.1 32.4 28.6 34.9
(a) Estimates of consultations relate to predominantly urban areas only.
Source: Medicare statistics, 1984–85 to March quarter 2002, Department of Health and Aged Care; ABS Cat. no. 4368.0, 1997; and ABSestimated resident population figures at 31 December 1995.
Medicare services account for only a portion (albeit a very large portion) of all servicesdelivered to patients by clinicians. They do not include services provided for workers’compensation, services provided for hospital outpatients or services provided in hospitalsfor public patients.
Patient consultationsAn alternative way of looking at service provision is through doctor consultation rates. It isknown that people in some age groups consult doctors more frequently than those in otherage groups, and in most age groups consultations are more frequent for females than formales.The ABS National Health Survey provides an estimate of the number and rates per 1,000population of people who consult a doctor (clinician) over a two-week period. These rateshave been standardised by age and sex to the Australian population to take account of thedifferent age and sex profiles of the populations in each State and Territory, and thereforeshould not reflect these differences. Nevertheless, there were differences in usage.

10
In 2001, the rate of doctor consultations was highest in New South Wales (257.5 per 100,000)and lowest in the Australian Capital Territory (222.4 per 100,000). The pattern of usageacross the States and Territories for consultation rates was the same as the pattern forMedicare services, (although no data from the survey was available for the NorthernTerritory). There was an increase in consultation rates in every State and Territory between1995 and 2001. This was possibly a consequence of increased community awareness of, orattitudes to, certain health conditions (ABS 2001).
2.3.2 Geographic distributionWhile it is important to examine the supply of practitioners in each State and Territorybecause jurisdictional responsibilities occur within those boundaries, from an equityperspective, it is also important to examine the supply of practitioners in each geographicregion. In 1999, over three-quarters (38,619 or 76.7%) of all medical practitioners wereemployed in capital cities (Table 6). This is more than their population share: in 1999, 63.8%of the population lived in capital cities (ABS 2000). It would be expected that medicalpractitioners would be concentrated in capital cities, however, because many of the largehospitals are located there, together with facilities for research, teaching and training andadvanced ‘high-tech’ equipment for treatment.
Table 6: Employed medical practitioners: occupation, geographical region, Australia, 1999
Occupation Capital cityOther metro
centreLarge rural
centreSmall rural
centreOther rural
areaRemote
area Total
Clinician: 36,169 3,480 3,006 1,925 2,256 602 47,436
Primary care 14,697 1,526 1,188 1,167 1,967 421 20,966
Hospital non-specialist 3,637 413 390 141 77 82 4,740
Specialists 13,708 1,207 1,300 589 201 86 17,091
Specialists-in-training 4,127 334 128 27 11 13 4,640
Non-clinician: 2,450 139 117 80 64 42 2,892
All employed practitioners 38,619 3,618 3,123 2,005 2,320 644 50,329
Population (000) 12,170.3 1,456.6 1,133.6 1,230.7 2,491.2 561.4 19,043.9
Source: Medical Labour Force Survey 1999; ABS estimated resident population figures at 31 December 1999.
When considering primary care practitioners only, who are less likely to be hospital-based,then the distribution is somewhat more even, with 70.1% being employed in capital cities in1999. Generally, the number of practitioners decreased with increasing remoteness, exceptthat in ‘Other rural areas’ there were more clinicians (including primary care practitionersand hospital non-specialists) than in small rural centres. This is because about twice as manypeople live in ‘Other rural areas’, collectively, as in small rural centres. In fact, the greatestimbalance is in ‘Other rural areas’, because although 13.1% of the population lived there in1999, only 4.6% of all medical practitioners had their main practice in those areas.The distribution of primary care practitioners is more equitable than for clinicians andmedical practitioners generally. As noted before, this is not surprising since a sizeableproportion of other clinicians (particularly specialists and specialists-in-training) work inlarge hospitals, which are generally located in population centres. In terms of access togeneral health care, it is more reasonable to compare the supply of primary care practitionersthan other types of practitioners, across regions.

11
Again, numbers alone do not give the complete picture, because for primary carepractitioners, the progressive decrease in the numbers with increasing remoteness is partlycompensated for by corresponding increases in hours they worked, which in 1999 rangedfrom 41.2 hours per week on average in capital cities to 51.0 hours per week in remote areas,(Table A.8). Hours worked can be taken into account through calculating FTE per 100,000population in each area. Again, these are shown based on standard weeks of 35, 40 and 45hours.Even when translating the numbers of doctors into FTE, there is a gradual decrease in FTEprimary care practitioners per 100,000 with increasing remoteness. There is, however, asimilar rate of supply in ‘Other metropolitan centres’ as in ‘Large rural centres’ (111.6 and112.4 per 100,000, respectively, based on a standard 40-hour week) and a similar rate ofsupply in ‘Other rural areas’ as in ‘Remote areas’ (93.5 and 95.63 per 100,000, respectively,based on a standard 40-hour week) (Table 7). This does indicate a degree of inequity inaccess to primary health care across the geographic regions.
Table 7: Employed primary care practitioners: geographic region, Australia, 1999
Capitalcity
Othermetropolitan
centreLarge rural
centreSmall rural
centreOther rural
areaRemote
area Total
FTE per 100,000 population(based on 35-hour week) 142.1 127.5 128.4 124.4 106.9 109.3 133.1
FTE per 100,000 population(based on 40-hour week) 124.3 111.6 112.4 108.9 93.5 95.6 116.5
FTE per 100,000 population(based on 45-hour week) 110.5 99.2 99.9 96.8 83.1 85.0 103.5
Source: Medical Labour Force Survey 1999; ABS estimated resident population figures at 31 December 1999.
Ideally, these comparisons of supply should be seen against usage patterns across thegeographical regions, as it is very likely that the different age profiles and different healthstatus would lead to differences in usage rates. However, at the time of printing it was notpossible to obtain either Medicare services rates or doctor consultation rates by remotenesscategories.
12
3 Trends in the medical labour force
IntroductionEvery year when medical labour force figures are released they receive a great deal ofattention from State/Territory and Commonwealth health departments because theyprovide feedback about the response of the profession to earlier planning decisions andbecause they are used to underpin future action. The health of the population is one of themost critical areas of wellbeing and governments are continually monitoring the balancebetween maintaining a reasonable standard of public health and meeting the expense oftraining future medical practitioners.The need (demand) for medical practitioners depends on the number of patients, theirpropensity to require health care and their range of illnesses. For example, a population withrelatively high proportions of old people or of infants is likely to have greater need formedical practitioners than one with large proportions of young childless adults. Changes inthe size of a population over time as well as shifts in these characteristics will alter the levelof demand.On the supply side, the size and composition of this labour force is influenced by the numberand characteristics of those entering medical school, the capacity of the system to retain thosealready practising and the resources available to assist doctors in their work. For example,increases in the proportion of female medical students may signal greater proportions ofyounger doctors preferring part-time hours (that is, less than 35 hours per week using theABS definition); population declines in some regions may discourage young doctors fromsetting up practice there; and the availability of technological tools may allow somediagnostic procedures to be transferred from doctors to other health professionals.These demand and supply factors have all been undergoing change up to the turn of thecentury. The general population has been increasing in number and ageing, while alsobecoming more metropolitan and more educated; and the ethnic mix is constantly changing.There have also been changes in the characteristics of the medical labour force itself. Thelabour force is becoming more feminised and older, and the number of doctors choosing towork shorter hours is increasing. Added to this are advances in medical techniques andtechnology. How to ensure an adequate and appropriate supply of doctors into the future inthis environment remains an ever more complex question.The effects of these changes are not always apparent from year to year, and are often hiddenby short-term fluctuations in numbers—genuine changes are more noticeable over a longertime span. This report focuses on the characteristics of the medical labour force in 1999, andidentifies any changes in its composition and nature since 1995. This time period was chosenbecause it is long enough for genuine changes to be observed yet short enough to provideevidence of recent trends.
Changes in composition of the medical labour forceThe labour force remained relatively unchanged between 1995 and 1999 in terms of structure(proportions in each occupation), but it grew, and there were substantial changes indemographics and working patterns.

13
In December 1995, the medical labour force comprised 48,032 practitioners, of whom 47,331(98.5%) were employed and practising in medicine. By December 1999, there had been a6.1% growth in the medical labour force (to 50,984 practitioners) and a 6.3% growth inemployed medical practitioners (to 50,329).
3.1 Employed medical practitionersThe medical workforce has been becoming more specialised over recent years. Over half ofthe 6.3% growth in the number of employed medical practitioners between 1995 and 1999occurred among specialists (which grew by 9.5% from 15,604 to 17,091) and specialists-in-training (which grew by 8.6% from 4,273 to 4,640). Smaller growth occurred for primary carepractitioners (from 19,937 to 20,966, or 5.2%), while the number of hospital non-specialistsdecreased slightly (0.6%) in the four years from 4,769 in 1995 to 4,740 in 1999 (Tables A.2, A.3and 8).
Table 8: Changes in employed medical practitioners: selected characteristics byoccupation, Australia, 1995–99
OccupationGrowth in
numbers (%)Change in % female(percentage points)
Change in averageage (years)
Clinician: 6.4 2.3 1.4
Primary care 5.2 2.7 1.9
Hospital non-specialist -0.6 –1.6 1.3
Specialist 9.5 2.7 0.9
Specialist-in-training 8.6 5.8 0.6
Non-clinician: 5.2 1.7 1.1
Administrator –25.6 1.7 2.5
Teacher/ educator 28.3 –3.0 0.1
Researcher 7.7 4.7 1.0
Public health physician 36.9 0.9 –1.1
Occupational health physician 5.9 –1.5 1.2
Other 9.2 1.8 1.8
Total 6.3 2.2 1.1
Source: Medical Labour Force Survey 1995.
Indeed, general practice itself is also being regarded as a specialty area, with its ownequivalent to the specialists’ colleges (the Royal Australian College of General Practitioners,or RACGP, established in 1969), affording equal status with other disciplines. Generalpractitioners, who made up 86.7% of primary care practitioners in 1999, are required to fulfila stringent set of criteria before becoming eligible for vocational registration with theRACGP. These criteria include: completion of a formal general practice training program;attainment of fellowship of the RACGP by examination; demonstration of ongoinginvolvement in continuing education and quality assurance; and agreement to participate inpeer review through an independent peer review organisation (DHAC 2000). There was alsoa moderate increase of 5.2% in the small number of non-clinicians since 1995, with most ofthis confined to public health physicians, where there was a 36.9% rise from 461 in 1995 to631 in 1999. Public health physicians were the youngest of all those medical occupations inwhich there were no trainees, and they were also the only field in which the average age of
14
practitioners decreased between the two survey years (by 1.1 years from 43.6 to 42.5 years).This would suggest that public health medicine is a burgeoning field within the medicalprofession.The only field of employed non-clinicians that showed a large percentage decrease wasadministrators, which fell by 25.6% between the two survey years (from 737 to 548).However, an increase of 9.2% in the number of practitioners indicating an ‘other’ occupationmay account for some of this apparent decrease.
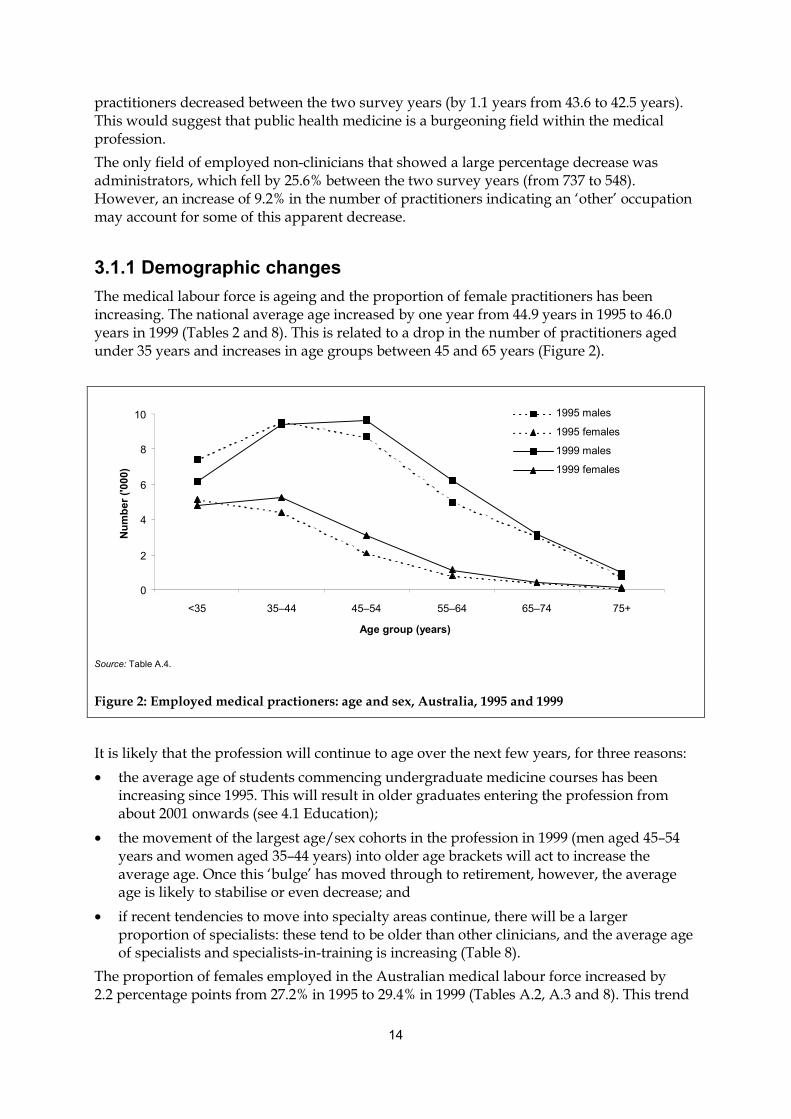
3.1.1 Demographic changesThe medical labour force is ageing and the proportion of female practitioners has beenincreasing. The national average age increased by one year from 44.9 years in 1995 to 46.0years in 1999 (Tables 2 and 8). This is related to a drop in the number of practitioners agedunder 35 years and increases in age groups between 45 and 65 years (Figure 2).
0
2
4
6
8
10
<35 35–44 45–54 55–64 65–74 75+
Age group (years)
Num
ber (
'000
)
1995 males
1995 females
1999 males
1999 females
Source: Table A.4.
Figure 2: Employed medical practioners: age and sex, Australia, 1995 and 1999
It is likely that the profession will continue to age over the next few years, for three reasons:• the average age of students commencing undergraduate medicine courses has been
increasing since 1995. This will result in older graduates entering the profession fromabout 2001 onwards (see 4.1 Education);
• the movement of the largest age/sex cohorts in the profession in 1999 (men aged 45–54years and women aged 35–44 years) into older age brackets will act to increase theaverage age. Once this ‘bulge’ has moved through to retirement, however, the averageage is likely to stabilise or even decrease; and
• if recent tendencies to move into specialty areas continue, there will be a largerproportion of specialists: these tend to be older than other clinicians, and the average ageof specialists and specialists-in-training is increasing (Table 8).
The proportion of females employed in the Australian medical labour force increased by2.2 percentage points from 27.2% in 1995 to 29.4% in 1999 (Tables A.2, A.3 and 8). This trend
15
is also likely to continue over the next few years: the proportion of students completingundergraduate and postgraduate medical courses who are female has been increasingsteadily throughout the 1990s and the proportion of females commencing undergraduatecourses (and who will complete from 2000 onwards) has also risen (see 4.1 Education). Thegreatest increase in the proportion of females occurred in specialists-in-training, rising by5.8 percentage points from 31.6% in 1995 to 37.4% in 1999. Conversely, the proportion offemales working as a teacher/educator fell by 3.0 percentage points from 29.1% in 1995 to26.1% in 1999 (Tables A.2, A.3 and 8).
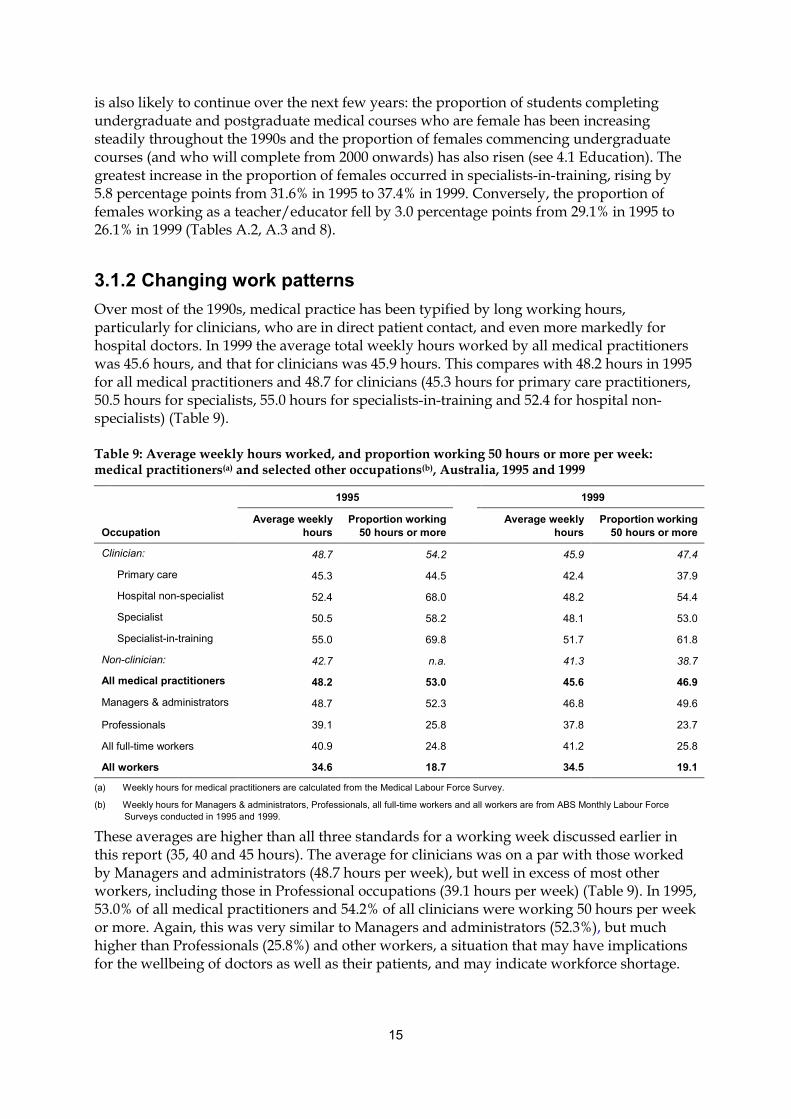
3.1.2 Changing work patternsOver most of the 1990s, medical practice has been typified by long working hours,particularly for clinicians, who are in direct patient contact, and even more markedly forhospital doctors. In 1999 the average total weekly hours worked by all medical practitionerswas 45.6 hours, and that for clinicians was 45.9 hours. This compares with 48.2 hours in 1995for all medical practitioners and 48.7 for clinicians (45.3 hours for primary care practitioners,50.5 hours for specialists, 55.0 hours for specialists-in-training and 52.4 for hospital non-specialists) (Table 9).
Table 9: Average weekly hours worked, and proportion working 50 hours or more per week:medical practitioners(a) and selected other occupations(b), Australia, 1995 and 1999
1995 1999
OccupationAverage weekly
hoursProportion working
50 hours or moreAverage weekly
hoursProportion working
50 hours or more
Clinician: 48.7 54.2 45.9 47.4
Primary care 45.3 44.5 42.4 37.9
Hospital non-specialist 52.4 68.0 48.2 54.4
Specialist 50.5 58.2 48.1 53.0
Specialist-in-training 55.0 69.8 51.7 61.8
Non-clinician: 42.7 n.a. 41.3 38.7
All medical practitioners 48.2 53.0 45.6 46.9
Managers & administrators 48.7 52.3 46.8 49.6
Professionals 39.1 25.8 37.8 23.7
All full-time workers 40.9 24.8 41.2 25.8
All workers 34.6 18.7 34.5 19.1
(a) Weekly hours for medical practitioners are calculated from the Medical Labour Force Survey.
(b) Weekly hours for Managers & administrators, Professionals, all full-time workers and all workers are from ABS Monthly Labour ForceSurveys conducted in 1995 and 1999.
These averages are higher than all three standards for a working week discussed earlier inthis report (35, 40 and 45 hours). The average for clinicians was on a par with those workedby Managers and administrators (48.7 hours per week), but well in excess of most otherworkers, including those in Professional occupations (39.1 hours per week) (Table 9). In 1995,53.0% of all medical practitioners and 54.2% of all clinicians were working 50 hours per weekor more. Again, this was very similar to Managers and administrators (52.3%), but muchhigher than Professionals (25.8%) and other workers, a situation that may have implicationsfor the wellbeing of doctors as well as their patients, and may indicate workforce shortage.

16
Several studies, both in Australia and in other countries, have demonstrated a link betweenburnout and a number of other factors, including hours worked for medical practitioners.Burnout is a syndrome defined as a triad of emotional exhaustion, depersonalisation and areduced sense of personal accomplishment (Maslach, Schaufeli & Leiter 2001). For example,a longitudinal study of UK doctors demonstrated a two-way link between stress andemotional exhaustion (the central component of burnout), and suggested that one of thecontributing factors may have been workload (McManus, Winder & Gordon 2002). A studyof emergency physicians and trainees in Australia showed a correlation between burnoutand male sex, trainee status, longer working hours, weekend shifts, shift work, workdissatisfaction, self-reporting of feeling stressed and a desire to stop working in theemergency department (Goh, Cameron & Mark 1999). However, a recent study of Australiangeneral practitioners aged 35–45 years (the age group deemed to be most vulnerable tostress) failed to establish a link between work stress and severity of mistakes (Winefield &Veale 2002). While it is clear that some doctors may be experiencing work-related stress,there is limited evidence to indicate that patient care is being compromised.In recent years, efforts have been made to encourage the reduction in the number of hoursworked by medical practitioners, especially hospital doctors. In particular, the AustralianMedical Association (AMA) has been conducting a ‘Safe Hours Campaign’ from 1996 in anendeavour to increase awareness of the risks associated with the long hours worked bymedical practitioners, especially junior hospital doctors (AMA 2002). The ultimate aim of thecampaign was the development of a national industry standard for hours worked andworkloads for hospital doctors in Australia, to be achieved by 1999.
Males
05
1015202530354045
<20 20–34 35–49 50–64 65+
Hours worked per week
Per c
ent
1995
1999
Females
05
1015202530354045
<20 20–34 35–49 50–64 65+
Hours worked per week
Per c
ent
1995
1999
Source: Table A.5.
Figure 3: Employed medical practitioners: hours worked per week, Australia, 1995 and 1999
Possibly as a result of this campaign, the average hours worked and the proportions working50 hours or more per week dropped between 1995 and 1999 for both male and femalepractitioners. This resulted in substantially lower hours for clinicians (to 45.9 hours per weekon average) and the drop was apparent in all clinical fields, with average hours falling from45.3 to 42.3 for primary care practitioners, from 50.5 to 48.1 for specialists, from 55.0 to 51.7for specialists-in-training and from 52.4 to 48.2 for hospital non-specialists. The proportion ofmedical practitioners working 50 hours per week or more fell from 53.0%to 46.9% (and from54.2% to 47.4% for clinicians).

17
This was against the national trend for all employed persons, but in line with those forManagers and administrators; and Professionals. By 1999 the average weekly hours workedby full-time employed Australians had risen from 40.9 to 41.2 hours, while there was a dropfrom 48.7 to 46.8 hours per week for Managers and administrators, and from 39.1 to 37.8hours per week for Professionals (ABS 1995 and 1999b). This still leaves a large discrepancyin hours worked between medical practitioners and many other Australian workers.Drops in average hours worked occurred in most non-clinical areas too, althoughpractitioners in these fields were already working much shorter hours than clinicians. Theexceptions were teachers/educators (where average hours increased from 35.5 to 41.6 hours)and researchers (from 41.7 to 44.5 hours). The largest decrease occurred for occupationalhealth physicians for whom average hours worked fell from 40.5 per week in 1995 to 37.5 in1999 (Tables 2 and 8).At the same time, the proportion of all employed medical practitioners working part-timehours increased between 1995 and 1999. In 1995, 18.4% of practitioners worked fewer than35 hours a week; the proportion increased to 20.5% in 1999 (Table A.5). This was consistentwith national trends during the period: the percentage of all employed Australians whoworked part-time rose from 24.5% in 1995 to 26.1% in 1999 (ABS 1995, 1999b).Despite the decrease in hours worked by practitioners, the number of full-time equivalentsactually increased (from 65,182 in 1995 to 65,571 in 1999, based on a standard working weekof 35 hours) (Table 12). This appears counter-intuitive, but is related to the swing from bothextremes (very short hours and very long hours) to moderate hours (35–49 per week) forboth sexes, and to the effect of an increasing number of female practitioners in the medicallabour force. Almost 40% of female medical practitioners worked part-time in 1999,compared to 37% in 1995, but in 1999 part-time females were more likely to work between 20and 34 hours, and slightly less likely to work under 20 hours than in 1995 (Figure 3).
3.2 CliniciansIn 1999 there were 47,436 employed medical practitioners who were clinicians. Thisrepresented a rise of 6.4% since 1995. During this time, the Australian population rose by4.7% (see Tables A.2 and A.3). While most clinicians are male (70.8% in 1999), the proportionof females has been increasing: in 1995 73.0% were male.A number of other factors also changed over the period. The two most important of thesewere shorter working hours of clinicians (acting to lessen supply); and a general ageing ofthe population (acting to increase demand, although the proportion of infants in thepopulation is also a relevant factor). Issues of supply and demand are addressed in moredetail at 2.3 State/Territory and geographical distribution.
Geographic distributionThe geographic location of clinicians in Australia is partly a product of the distribution, sizesand types of hospitals, needs of individual communities, practitioner preferences,government incentives and training facilities. Equitable access to health care for allAustralians, no matter where they live, has been a planning priority for all levels ofgovernment for many years, and a number of schemes have been introduced to attract andretain doctors in areas outside the major cities.

��
�
��
���
���
���
���
���
���
&DSLWDO�FLW\ 2WKHU�PHWUR�FHQWUH
/DUJH�UXUDO 6PDOO�UXUDOFHQWUH
2WKHU�UXUDODUHD
5HPRWH�DUHD 7RWDO
*HRJUDSKLF�DUHD
5DWH��SHU���������SRSXODWLRQ�
����
����
FHQWUH
6RXUFH��7DEOH�$���
������������� �������������� ������������������������������������������������������������������� �����
������������ �������������������������������������������� ��� ���� ������������������������������������������� ����������������� ������ ������������������������������� !�� ����� ����������������������"������������������##!###����������$���"%#�%����������"&�����������'�$�������%'��( ����)�������������� �������������*���������� �$���##�%����#+�"'���,� ��������������������� ������������������� ����������������������������##!###����������$���"-+�������������"-.����������'�
/��������������������������������������������$%%�"0����������������������������'! ���������1������������$�#�#0'!�������������$-&�#0'����������������1��1���������$��.0'��( ������������� ���� ������������������������������������������������� ��������������!����������� ����������������������������
�������������� ���������� ��
2������!�� ���������"#!�&&������������������������������������( ����������������������������!#"��$��"0'��������������������������( �������������������������������������� �����������������!�����#��&������##!###����������������������#��������##!###���������$��������'�( ���������������������� ������������������������������ �������������������������� �������������� �������������(�����������( ��3����������/�������(�������!��������������� ������������(������������� �� �� �� ��������!���������� ����������������������"�&������������������##!###��������������"-�-������##!###������������-��.������##!###�������!�� �������4����������� ���������������������#��������##!###���������!�����#&�%�����##!###����&�-������##!###�$(������3�"�����3�-'�
19
0
20
40
60
80
100
120
140
160
NSW Vic Qld WA SA Tas ACT NT Australia
State
Rat
e (p
er 1
00,0
00 p
opul
atio
n)1995
1999
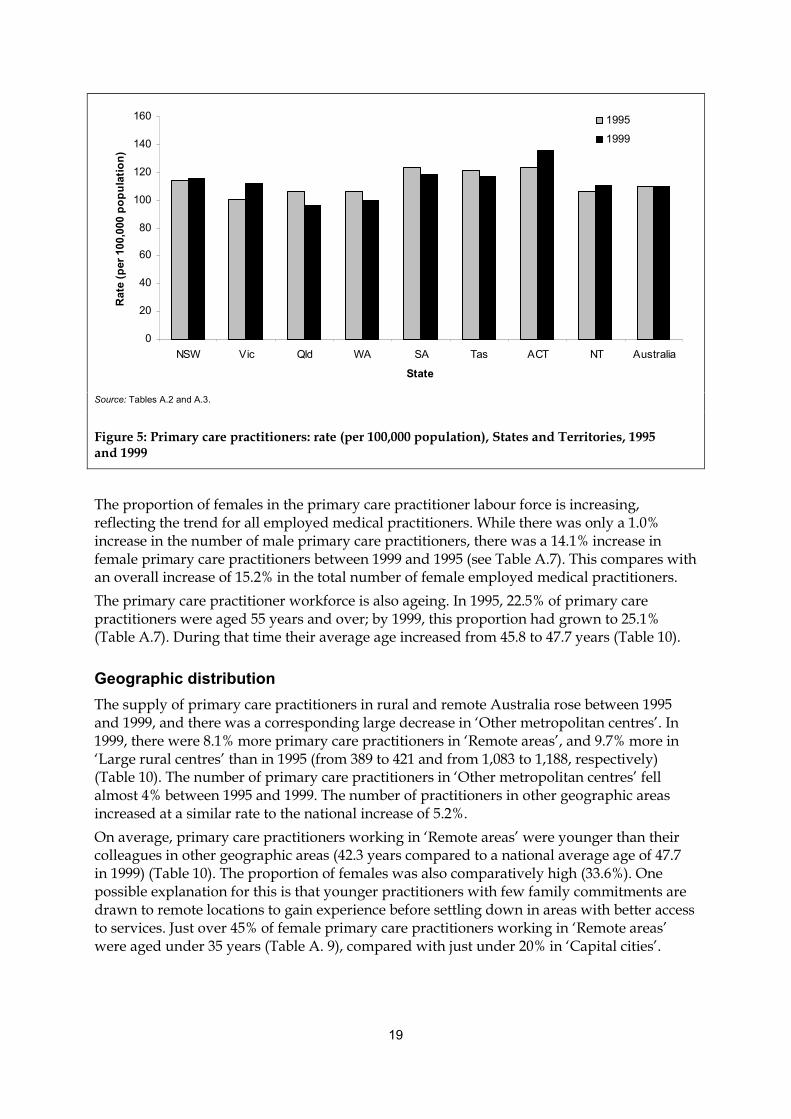
Source: Tables A.2 and A.3.
Figure 5: Primary care practitioners: rate (per 100,000 population), States and Territories, 1995and 1999
The proportion of females in the primary care practitioner labour force is increasing,reflecting the trend for all employed medical practitioners. While there was only a 1.0%increase in the number of male primary care practitioners, there was a 14.1% increase infemale primary care practitioners between 1999 and 1995 (see Table A.7). This compares withan overall increase of 15.2% in the total number of female employed medical practitioners.The primary care practitioner workforce is also ageing. In 1995, 22.5% of primary carepractitioners were aged 55 years and over; by 1999, this proportion had grown to 25.1%(Table A.7). During that time their average age increased from 45.8 to 47.7 years (Table 10).
Geographic distributionThe supply of primary care practitioners in rural and remote Australia rose between 1995and 1999, and there was a corresponding large decrease in ‘Other metropolitan centres’. In1999, there were 8.1% more primary care practitioners in ‘Remote areas’, and 9.7% more in‘Large rural centres’ than in 1995 (from 389 to 421 and from 1,083 to 1,188, respectively)(Table 10). The number of primary care practitioners in ‘Other metropolitan centres’ fellalmost 4% between 1995 and 1999. The number of practitioners in other geographic areasincreased at a similar rate to the national increase of 5.2%.On average, primary care practitioners working in ‘Remote areas’ were younger than theircolleagues in other geographic areas (42.3 years compared to a national average age of 47.7in 1999) (Table 10). The proportion of females was also comparatively high (33.6%). Onepossible explanation for this is that younger practitioners with few family commitments aredrawn to remote locations to gain experience before settling down in areas with better accessto services. Just over 45% of female primary care practitioners working in ‘Remote areas’were aged under 35 years (Table A. 9), compared with just under 20% in ‘Capital cities’.
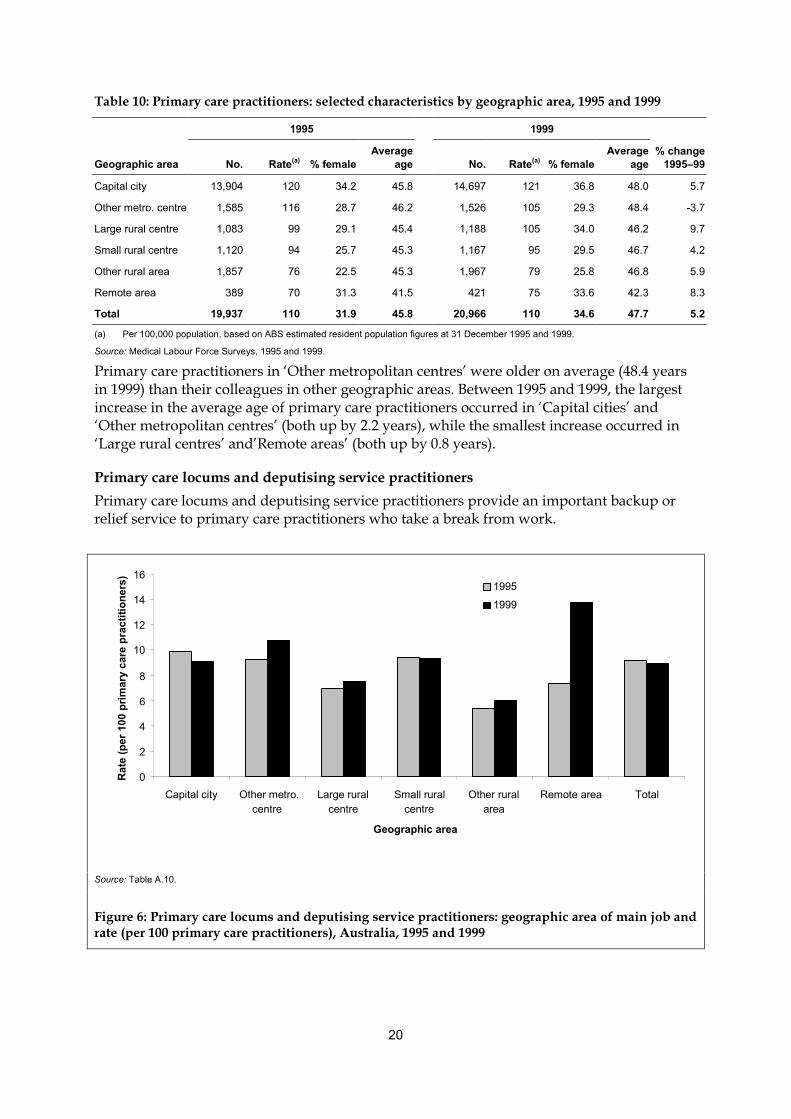
20
Table 10: Primary care practitioners: selected characteristics by geographic area, 1995 and 1999
1995 1999
Geographic area No. Rate(a) % femaleAverage
age No. Rate(a) % femaleAverage
age% change
1995–99
Capital city 13,904 120 34.2 45.8 14,697 121 36.8 48.0 5.7
Other metro. centre 1,585 116 28.7 46.2 1,526 105 29.3 48.4 -3.7
Large rural centre 1,083 99 29.1 45.4 1,188 105 34.0 46.2 9.7
Small rural centre 1,120 94 25.7 45.3 1,167 95 29.5 46.7 4.2
Other rural area 1,857 76 22.5 45.3 1,967 79 25.8 46.8 5.9
Remote area 389 70 31.3 41.5 421 75 33.6 42.3 8.3
Total 19,937 110 31.9 45.8 20,966 110 34.6 47.7 5.2
(a) Per 100,000 population, based on ABS estimated resident population figures at 31 December 1995 and 1999.
Source: Medical Labour Force Surveys, 1995 and 1999.
Primary care practitioners in ‘Other metropolitan centres’ were older on average (48.4 yearsin 1999) than their colleagues in other geographic areas. Between 1995 and 1999, the largestincrease in the average age of primary care practitioners occurred in ‘Capital cities’ and‘Other metropolitan centres’ (both up by 2.2 years), while the smallest increase occurred in‘Large rural centres’ and’Remote areas’ (both up by 0.8 years).
Primary care locums and deputising service practitionersPrimary care locums and deputising service practitioners provide an important backup orrelief service to primary care practitioners who take a break from work.
0
2
4
6
8
10
12
14
16
Capital city Other metro.centre
Large ruralcentre
Small ruralcentre
Other ruralarea
Remote area Total
Geographic area
Rat
e (p
er 1
00 p
rimar
y ca
re p
ract
ition
ers) 1995
1999
Source: Table A.10.
Figure 6: Primary care locums and deputising service practitioners: geographic area of main job andrate (per 100 primary care practitioners), Australia, 1995 and 1999
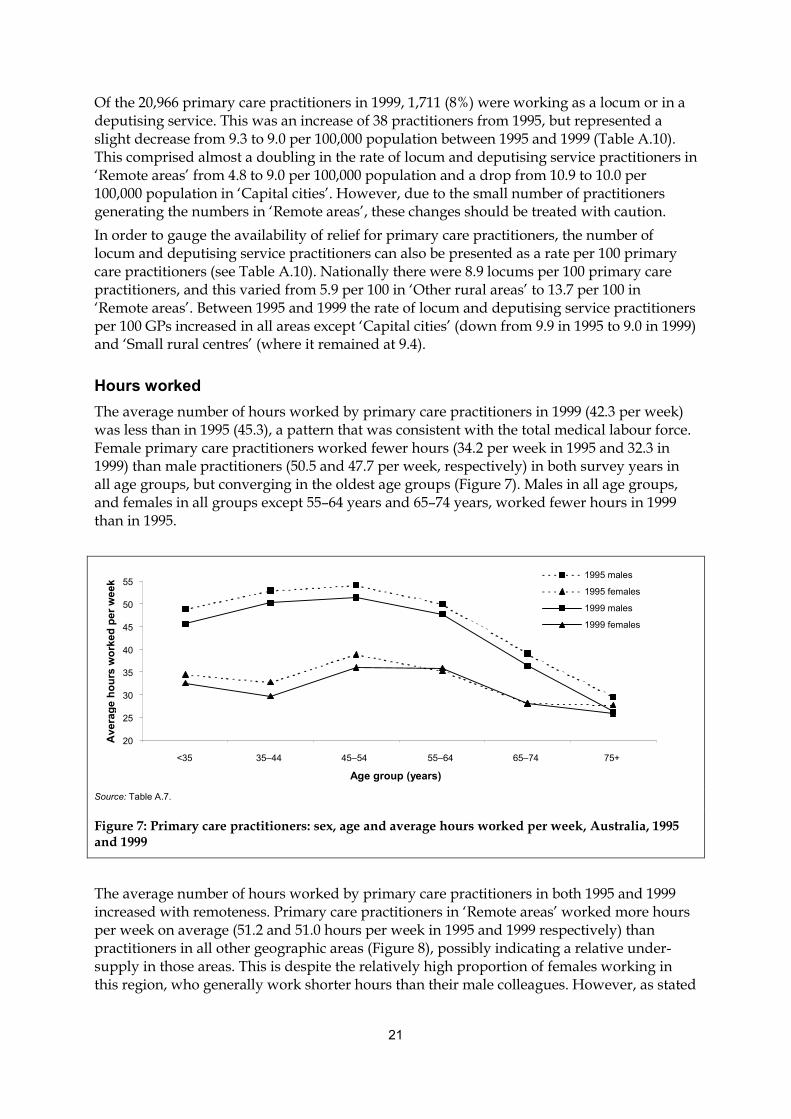
21
Of the 20,966 primary care practitioners in 1999, 1,711 (8%) were working as a locum or in adeputising service. This was an increase of 38 practitioners from 1995, but represented aslight decrease from 9.3 to 9.0 per 100,000 population between 1995 and 1999 (Table A.10).This comprised almost a doubling in the rate of locum and deputising service practitioners in‘Remote areas’ from 4.8 to 9.0 per 100,000 population and a drop from 10.9 to 10.0 per100,000 population in ‘Capital cities’. However, due to the small number of practitionersgenerating the numbers in ‘Remote areas’, these changes should be treated with caution.In order to gauge the availability of relief for primary care practitioners, the number oflocum and deputising service practitioners can also be presented as a rate per 100 primarycare practitioners (see Table A.10). Nationally there were 8.9 locums per 100 primary carepractitioners, and this varied from 5.9 per 100 in ‘Other rural areas’ to 13.7 per 100 in‘Remote areas’. Between 1995 and 1999 the rate of locum and deputising service practitionersper 100 GPs increased in all areas except ‘Capital cities’ (down from 9.9 in 1995 to 9.0 in 1999)and ‘Small rural centres’ (where it remained at 9.4).
Hours workedThe average number of hours worked by primary care practitioners in 1999 (42.3 per week)was less than in 1995 (45.3), a pattern that was consistent with the total medical labour force.Female primary care practitioners worked fewer hours (34.2 per week in 1995 and 32.3 in1999) than male practitioners (50.5 and 47.7 per week, respectively) in both survey years inall age groups, but converging in the oldest age groups (Figure 7). Males in all age groups,and females in all groups except 55–64 years and 65–74 years, worked fewer hours in 1999than in 1995.
20
25
30
35
40
45
50
55
<35 35–44 45–54 55–64 65–74 75+
Age group (years)
Ave
rage
hou
rs w
orke
d pe
r wee
k
1995 males
1995 females
1999 males
1999 females
Source: Table A.7.
Figure 7: Primary care practitioners: sex, age and average hours worked per week, Australia, 1995and 1999
The average number of hours worked by primary care practitioners in both 1995 and 1999increased with remoteness. Primary care practitioners in ‘Remote areas’ worked more hoursper week on average (51.2 and 51.0 hours per week in 1995 and 1999 respectively) thanpractitioners in all other geographic areas (Figure 8), possibly indicating a relative under-supply in those areas. This is despite the relatively high proportion of females working inthis region, who generally work shorter hours than their male colleagues. However, as stated

22
earlier, there is a large proportion of females working in ‘Remote areas’ who are aged lessthan 35 years (45%) (Table A.9). Females in this age group tend to work full-time.The geographic region with the next highest hours was ‘Other rural areas’ (50.2 and 47.4hours per week in 1995 and 1999 respectively). This compared with primary carepractitioners in ‘Capital cities’ who worked an average of 44.3 hours per week in 1995 and41.2 hours per week in 1999. The only geographic area that did not show a substantial dropin average hours worked between 1995 and 1999 was ‘Remote areas’.
0
10
20
30
40
50
60
Capital city Other metro.centre
Large ruralcentre
Small ruralcentre
Other ruralarea
Remote area Total
Geographic area
Ave
rage
hou
rs w
orke
d pe
r wee
k 1995
1999
Source: Table A.8.
Figure 8: Primary care practitioners: geographic area of main job and average weekly hours,Australia, 1995 and 1999
3.2.2 Hospital non-specialistsIn contrast to the other clinical occupations, the number of hospital non-specialists employedin Australia fell marginally between 1995 and 1999 (from 4,769 to 4,740) (Table A.12). Thedecrease occurred only in female hospital non-specialists (falling from 2,034 to 1,945), whilethe number of males increased (from 2,736 to 2,796). This is the only clinical occupation inwhich this pattern of change in demographics occurred, suggesting that female practitionersare broadening their choice of occupation within the medical profession. Even so, it remainsthe occupation with the highest proportion of females in the employed medical labour force.
Hours workedHospital non-specialists worked 48.2 hours per week on average in 1999, long hours incomparison with their other clinical colleagues. This is particularly the case with RMOs andinterns, with 62.1% working 50 or more hours a week in 1999 (and 7.1% working 65 or morehours per week) (Figure 9). In comparison, just under half (46.7%) of all employedpractitioners worked 50 or more hours per week. The number of hours worked by otherhospital non-specialists was not as high as those worked by RMOs and interns. Just over athird (35.5%) of other hospital non-specialists in 1999 worked 50 or more hours per week(with 7.9% working 65 or more hours) (Figure 9).Notwithstanding the declining number of females in this occupation, the number of hoursworked by hospital non-specialists has decreased greatly. The proportion of hospital non-

23
specialists who worked 50 or more hours per week decreased between 1995 and 1999 (from67.8% down to 54.4%), while the proportion who worked less than 35 hours per weekincreased (from 7.2% to 10.0% respectively).
RMOs and Interns
0
10
20
30
40
50
60
<35 35–49 50–64 65–79 80+
Hours worked per week
Per c
ent
1995
1999
Other hospital non-specialists
0
10
20
30
40
50
60
<35 35–49 50–64 65–79 80+
Hours worked per weekPe
r cen
t
1995
1999
Source: Table A.12.
Figure 9: Resident medical officers/interns and other hospital non-specialists: hours worked perweek, Australia, 1995 and 1999
3.2.3 Specialists and specialists-in-trainingThe number of employed specialists in Australia increased from 15,604 in 1995 to 17,091 in1999, a 9.5% increase (Table A.13). In this time, the group of surgery specialties grew themost at more than 18% (from 2,580 to 3,050), while the group of pathology specialties grewthe least at 4.5% (from 751 to 785).In 1999, psychiatry (2,088, 12.2%), anaesthesia (2,052, 12.0%) and diagnostic radiology (1,107,6.5%) were the three largest areas of specialty. In 1995, psychiatry (1,892, 12.1%) andanaesthesia (1,810, 11.6%) were also the largest two specialties, followed by general surgery(1,041, 6.7%). Obstetrics and gynaecology was also a large specialty in both 1995 and 1999(981, 6.3% and 1,100, 6.4% respectively) (Table A.13).The number of specialists-in-training grew by almost 9% between 1995 and 1999, from 4,273to 4,640. There were gains in the three specialties, internal medicine (61 trainees, or 4.9%),pathology (31 trainees, or 23.1%) and surgery, (55 trainees, or 8.7%) as well as a generalincrease of 9.7% across the other specialties (Table A.15).The average age of both specialists and specialists-in-training has been increasing. Theaverage age of specialists was 49.0 years in 1995, increasing slightly to 49.9 years in 1999(see Table A.14), and the proportion aged 55 years or over increased from 28.4% to 31.8%(Figure 10). For specialists-in-training, the average age was 31.7 years in 1995 and 32.3 yearsin 1999, which would be explained in part by the increasing average age of studentscompleting undergraduate medicine courses (see 4.1 Education).In what has traditionally been a male-dominated field, the proportion of females in thespecialist medical labour force has been increasing. There were 29.9% more female specialists
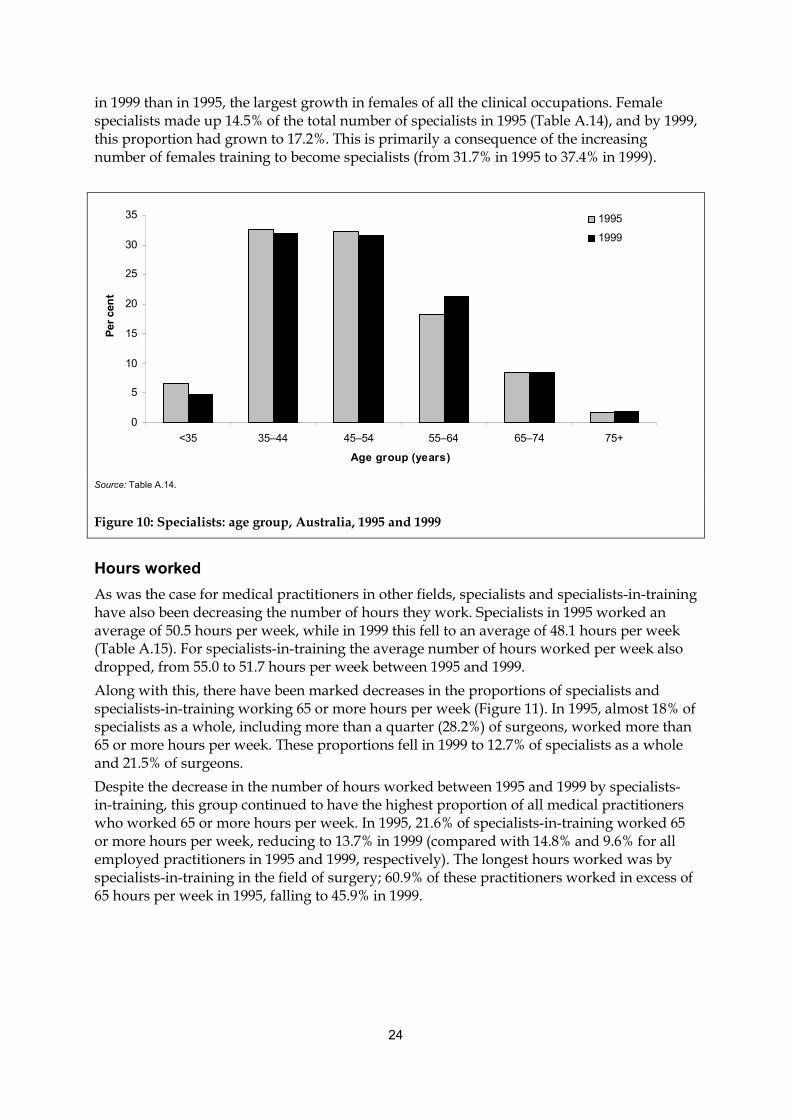
24
in 1999 than in 1995, the largest growth in females of all the clinical occupations. Femalespecialists made up 14.5% of the total number of specialists in 1995 (Table A.14), and by 1999,this proportion had grown to 17.2%. This is primarily a consequence of the increasingnumber of females training to become specialists (from 31.7% in 1995 to 37.4% in 1999).
0
5
10
15
20
25
30
35
<35 35–44 45–54 55–64 65–74 75+
Age group (years)
Per c
ent
1995
1999
Source: Table A.14.
Figure 10: Specialists: age group, Australia, 1995 and 1999
Hours workedAs was the case for medical practitioners in other fields, specialists and specialists-in-traininghave also been decreasing the number of hours they work. Specialists in 1995 worked anaverage of 50.5 hours per week, while in 1999 this fell to an average of 48.1 hours per week(Table A.15). For specialists-in-training the average number of hours worked per week alsodropped, from 55.0 to 51.7 hours per week between 1995 and 1999.Along with this, there have been marked decreases in the proportions of specialists andspecialists-in-training working 65 or more hours per week (Figure 11). In 1995, almost 18% ofspecialists as a whole, including more than a quarter (28.2%) of surgeons, worked more than65 or more hours per week. These proportions fell in 1999 to 12.7% of specialists as a wholeand 21.5% of surgeons.Despite the decrease in the number of hours worked between 1995 and 1999 by specialists-in-training, this group continued to have the highest proportion of all medical practitionerswho worked 65 or more hours per week. In 1995, 21.6% of specialists-in-training worked 65or more hours per week, reducing to 13.7% in 1999 (compared with 14.8% and 9.6% for allemployed practitioners in 1995 and 1999, respectively). The longest hours worked was byspecialists-in-training in the field of surgery; 60.9% of these practitioners worked in excess of65 hours per week in 1995, falling to 45.9% in 1999.
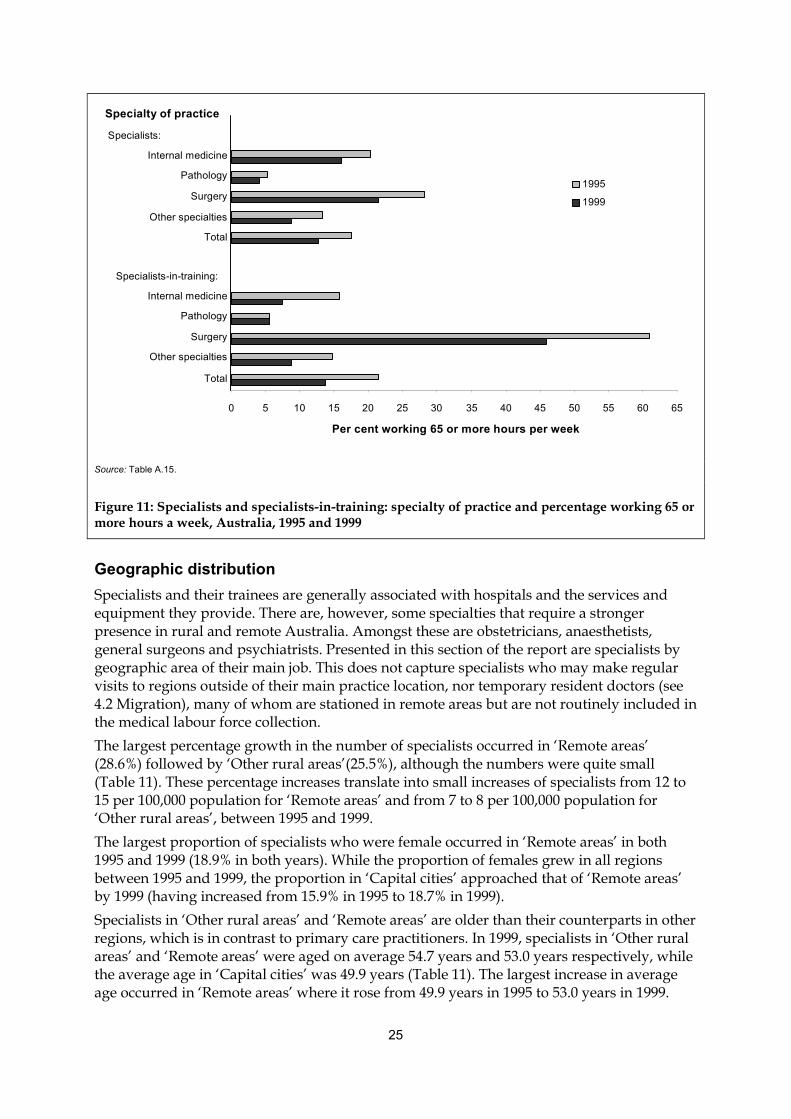
25
0 5 10 15 20 25 30 35 40 45 50 55 60 65
Specialists:
Internal medicine
Pathology
Surgery
Other specialties
Total
Specialists-in-training:
Internal medicine
Pathology
Surgery
Other specialties
Total
Specialty of practice
Per cent working 65 or more hours per week
1995
1999
Source: Table A.15.
Figure 11: Specialists and specialists-in-training: specialty of practice and percentage working 65 ormore hours a week, Australia, 1995 and 1999
Geographic distributionSpecialists and their trainees are generally associated with hospitals and the services andequipment they provide. There are, however, some specialties that require a strongerpresence in rural and remote Australia. Amongst these are obstetricians, anaesthetists,general surgeons and psychiatrists. Presented in this section of the report are specialists bygeographic area of their main job. This does not capture specialists who may make regularvisits to regions outside of their main practice location, nor temporary resident doctors (see4.2 Migration), many of whom are stationed in remote areas but are not routinely included inthe medical labour force collection.The largest percentage growth in the number of specialists occurred in ‘Remote areas’(28.6%) followed by ‘Other rural areas’(25.5%), although the numbers were quite small(Table 11). These percentage increases translate into small increases of specialists from 12 to15 per 100,000 population for ‘Remote areas’ and from 7 to 8 per 100,000 population for‘Other rural areas’, between 1995 and 1999.The largest proportion of specialists who were female occurred in ‘Remote areas’ in both1995 and 1999 (18.9% in both years). While the proportion of females grew in all regionsbetween 1995 and 1999, the proportion in ‘Capital cities’ approached that of ‘Remote areas’by 1999 (having increased from 15.9% in 1995 to 18.7% in 1999).Specialists in ‘Other rural areas’ and ‘Remote areas’ are older than their counterparts in otherregions, which is in contrast to primary care practitioners. In 1999, specialists in ‘Other ruralareas’ and ‘Remote areas’ were aged on average 54.7 years and 53.0 years respectively, whilethe average age in ‘Capital cities’ was 49.9 years (Table 11). The largest increase in averageage occurred in ‘Remote areas’ where it rose from 49.9 years in 1995 to 53.0 years in 1999.

26
Table 11: Specialists: selected characteristics by geographic area of main job, 1995 and 1999
1995 1999
Geographic area No. Rate(a) % femaleAverage
age No. Rate(a) % femaleAverage
age% change
1995–99
Capital city 12,563 109 15.9 49.0 13,708 113 18.7 49.9 9.1
Other metro. centre 1,144 84 8.7 48.3 1,207 83 11.7 49.2 5.5
Large rural centre 1,123 103 8.2 48.0 1,300 115 9.5 49.0 15.8
Small rural centre 546 46 8.4 49.8 589 48 11.9 50.8 7.7
Other rural area 160 7 7.1 54.0 201 8 10.3 54.7 25.5
Remote area 67 12 18.9 49.9 86 15 18.9 53.0 28.6
Total 15,604 86 14.5 49.0 17,091 90 17.1 49.9 9.5
(a) Per 100,000 population, based on ABS estimated resident population figures at 31 December 1995 and 1999.
Source: Medical Labour Force Surveys, 1995 and 1999.
Because of the large number of specialties, it is not feasible to present a geographic analysisof all of them in this publication. For the four specialties with greatest presence in rural andremote Australia, however, their rates are depicted in Figure 12. In both 1995 and 1999, thenumber per 100,000 population of specialists practising in general surgery, anaesthesia, andobstetrics and gynaecology in ‘Large rural centres’ was greater than in all other geographicareas. This is largely on account of patients from more remote areas travelling to thesecentres for treatment.
General surgery
0
3
6
912
15
18
21
CC OM LR SR OR RA Total
Rat
e (p
er 1
00,0
00 p
op.) 1995
1999
Anaesthesia
0
3
6
9
12
15
18
21
CC OM LR SR OR RA Total
Rat
e (p
er 1
00,0
00 p
op.)
1995
1999
Obstetrics & Gynaecology
0
3
6
912
15
18
21
CC OM LR SR OR RA Total
Rat
e (p
er 1
00,0
00 p
op.) 1995
1999
Psychiatry
0
3
6
9
12
15
18
21
CC OM LR SR OR RA Total
Rat
e (p
er 1
00,0
00 p
op.)
1995
1999
Note: CC – capital city; OM – other metropolitan centre; LR – large rural centre; SR – small rural centre; OR – other rural area; RA – remote area.
Source: Table A.16.
Figure 12: Specialists: number per 100,000 population and geographic area, Australia, 1995 and 1999

27
The geographic distribution was much different for psychiatry than for other occupations.The rate of psychiatrists practising in ‘Capital cities’ per 100,000 population in 1999 was fargreater than all other regions (14.8), while the rate for ‘Large rural centres’ was the same asfor ‘Other metropolitan centres’ (8.1) (Figure 12). In contrast, there were 3.9, 0.8 and 1.8psychiatrists per 100,000 population in ‘Small rural centres’, ‘Other rural centres’ and Remoteareas’, respectively, in 1999.This regional distribution of psychiatrists corresponds with information in a more recentreport into mental health services in Australia (AIHW 2002). This report revealed that therewere more mental health-related hospital separations per 1,000 population with specialisedpsychiatric care for patients from metropolitan areas than in other areas, but the pattern formental health-related separations without specialised psychiatric care was reversed. Therewere 10.4 separations with specialised care per 1,000 in metropolitan areas, falling to 5.3 and2.9 per 1,000 population for patients from rural and remote areas respectively. There were 4.3separations without specialised care per 1,000 population for patients from metropolitanareas, rising to 6.3 and 8.7 per 1,000 for patients from rural and remote areas, respectively.
3.3 State and Territory comparisons
3.3.1 Supply of medical practitionersThe largest absolute growth between 1995 and 1999 in the number of employed medicalpractitioners occurred in New South Wales, where they increased by 9.9% or 1,646 (from16,684 to 18,330), accounting for over half (54.9%) of the total increase in Australia of 2,998employed medical practitioners (from 47,331 to 50,329). The largest proportional increaseswere in the Australian Capital Territory (17.7%) and the Northern Territory (16.4%), and thesmallest were in Victoria (0.2%) and South Australia (3.8%) (Tables 12, A.2 and A.3).State/Territory comparisons of changes in the number of medical practitioners may bemisleading, however, unless seen in conjunction with the population growth in eachjurisdiction over the period and changes in the working hours of medical practitioners. Interms of FTE per 100,000 population, the largest increases were in the Northern Territory, inwhich the number of practitioners grew by 67.3 per 100,000, and in the Australian CapitalTerritory, where there was a growth of 58.2 per 100,000. In four States, New South Wales,Victoria, Queensland and South Australia, there were decreases in the FTE of medicalpractitioners per 100,000; New South Wales by 8.1, Victoria by 29.1, Queensland by 19.9, andSouth Australia by 26.7 per 100,000 population.This compares with a negligible movement in the supply nationally (from 358.3 to 344.2 per100,000 population), which suggests that the actual supply of practitioners did not changegreatly during this period. The reverse was true for clinicians, though: between 1995 and1999 FTE clinicians decreased slightly from 329.8 per 100,000 population to 326.6. Again, thisdoes not indicate any large movement over the period. There was variation between theStates and Territories, however. Decreases were recorded only in Victoria, Queensland andSouth Australia; there were increases in all other jurisdictions, the largest in the NorthernTerritory (from 313.3 to 377.8 FTE per 100,000) and the Australian Capital Territory (from352.2 to 412.7).
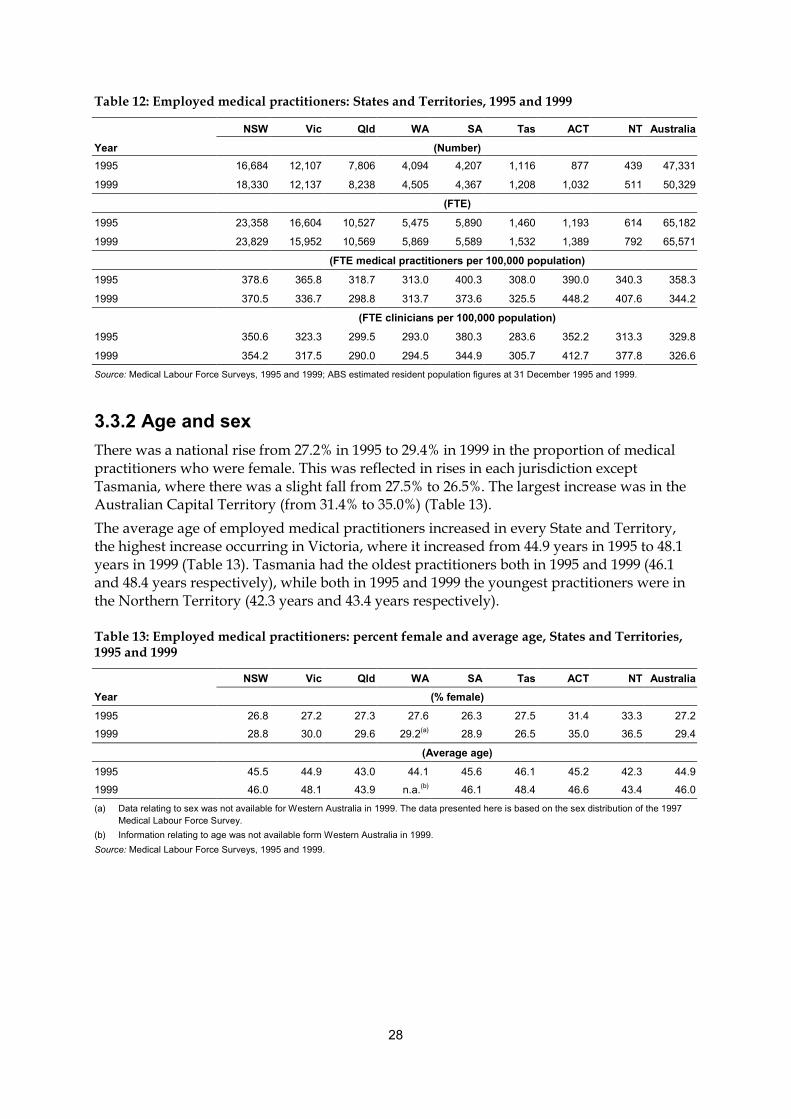
28
Table 12: Employed medical practitioners: States and Territories, 1995 and 1999
NSW Vic Qld WA SA Tas ACT NT AustraliaYear (Number)1995 16,684 12,107 7,806 4,094 4,207 1,116 877 439 47,331
1999 18,330 12,137 8,238 4,505 4,367 1,208 1,032 511 50,329
(FTE)
1995 23,358 16,604 10,527 5,475 5,890 1,460 1,193 614 65,182
1999 23,829 15,952 10,569 5,869 5,589 1,532 1,389 792 65,571
(FTE medical practitioners per 100,000 population)
1995 378.6 365.8 318.7 313.0 400.3 308.0 390.0 340.3 358.3
1999 370.5 336.7 298.8 313.7 373.6 325.5 448.2 407.6 344.2
(FTE clinicians per 100,000 population)1995 350.6 323.3 299.5 293.0 380.3 283.6 352.2 313.3 329.8
1999 354.2 317.5 290.0 294.5 344.9 305.7 412.7 377.8 326.6Source: Medical Labour Force Surveys, 1995 and 1999; ABS estimated resident population figures at 31 December 1995 and 1999.
3.3.2 Age and sexThere was a national rise from 27.2% in 1995 to 29.4% in 1999 in the proportion of medicalpractitioners who were female. This was reflected in rises in each jurisdiction exceptTasmania, where there was a slight fall from 27.5% to 26.5%. The largest increase was in theAustralian Capital Territory (from 31.4% to 35.0%) (Table 13).The average age of employed medical practitioners increased in every State and Territory,the highest increase occurring in Victoria, where it increased from 44.9 years in 1995 to 48.1years in 1999 (Table 13). Tasmania had the oldest practitioners both in 1995 and 1999 (46.1and 48.4 years respectively), while both in 1995 and 1999 the youngest practitioners were inthe Northern Territory (42.3 years and 43.4 years respectively).
Table 13: Employed medical practitioners: percent female and average age, States and Territories,1995 and 1999
NSW Vic Qld WA SA Tas ACT NT AustraliaYear (% female)1995 26.8 27.2 27.3 27.6 26.3 27.5 31.4 33.3 27.21999 28.8 30.0 29.6 29.2(a) 28.9 26.5 35.0 36.5 29.4
(Average age)1995 45.5 44.9 43.0 44.1 45.6 46.1 45.2 42.3 44.91999 46.0 48.1 43.9 n.a.(b) 46.1 48.4 46.6 43.4 46.0(a) Data relating to sex was not available for Western Australia in 1999. The data presented here is based on the sex distribution of the 1997
Medical Labour Force Survey. (b) Information relating to age was not available form Western Australia in 1999.Source: Medical Labour Force Surveys, 1995 and 1999.
29
4 Future growth in the medicallabour force
Estimated net growth, 1995–99Additions to the Australian medical labour force occur through two channels—the trainingof new practitioners permanently residing in Australia and the immigration of qualifiedoverseas practitioners. Some churning occurs among those who leave the workforcetemporarily (for example, to raise their family or for a temporary break). Losses occur mainlythrough retirement, death, permanent emigration and increases in temporary migration.Between 1996 and 1999 a total of 4,970 Australian citizens or permanent residents completedmedical undergraduate degrees (Table A.17), and between 1996–97 and 1999–00, inclusively,another 1,928 overseas-trained medical practitioners entered the labour force through theAustralian Medical Council (AMC) examination and specialist assessment results (Table 16)and there was a net increase of 965 in temporary immigration of medical practitioners for ashort-term stay (Table A.18). While it is not known how many medical practitioners retiredor died in any one year, an estimate can be calculated from the progressive decreases overthe time period in the cohorts moving into and through the age brackets of 55 years andover. It is assumed that practitioners in these age groups who cease practice do not return,and that all those aged 75 and over are retired (even though some do indicate on their surveyform that they work for at least one hour each week).Using this method, an estimated 2,013 medical practitioners ceased practice from retirementor death between 1996 and 1999 (Table A.21). Between 1995–96 and 1999–2001, a further2,567 emigrated permanently or for a long-term stay to other countries (Tables A.18 andA.19). Ignoring the effects of churning, this amounts, roughly, to a net gain of 3,283 medicalpractitioners to the medical workforce between 1995 and 1999. Given the differences inscope, methodology and time periods, and the uncertainty surrounding the assumptionsconcerning retirement, this is a figure which is in broad agreement with the growth of 2,998in the number of employed medical practitioners, as obtained from the 1995 and 1999 labourforce surveys.The following sections discuss some of the above components of the flow into and from themedical workforce (education, training and migration) in more detail.
4.1 EducationMedical practitioners undertake many years of training after a highly competitive selectionprocess at the end of their Year 12 schooling. Medical undergraduate degree courses usuallytake about six years to complete, after which new graduates may spend up to two moreyears as hospital interns gaining intensive experience in a wide range of medical conditions.This may be followed by postgraduate training to become specialists or vocationallyregistered general practitioners (VRGPs). Once qualified as a practitioner, doctors arerequired to uphold high professional standards to maintain their registration.After such an investment, it is not surprising that nearly all (98.7%) of registered medicalpractitioners in the medical labour force are employed and practising in medicine.
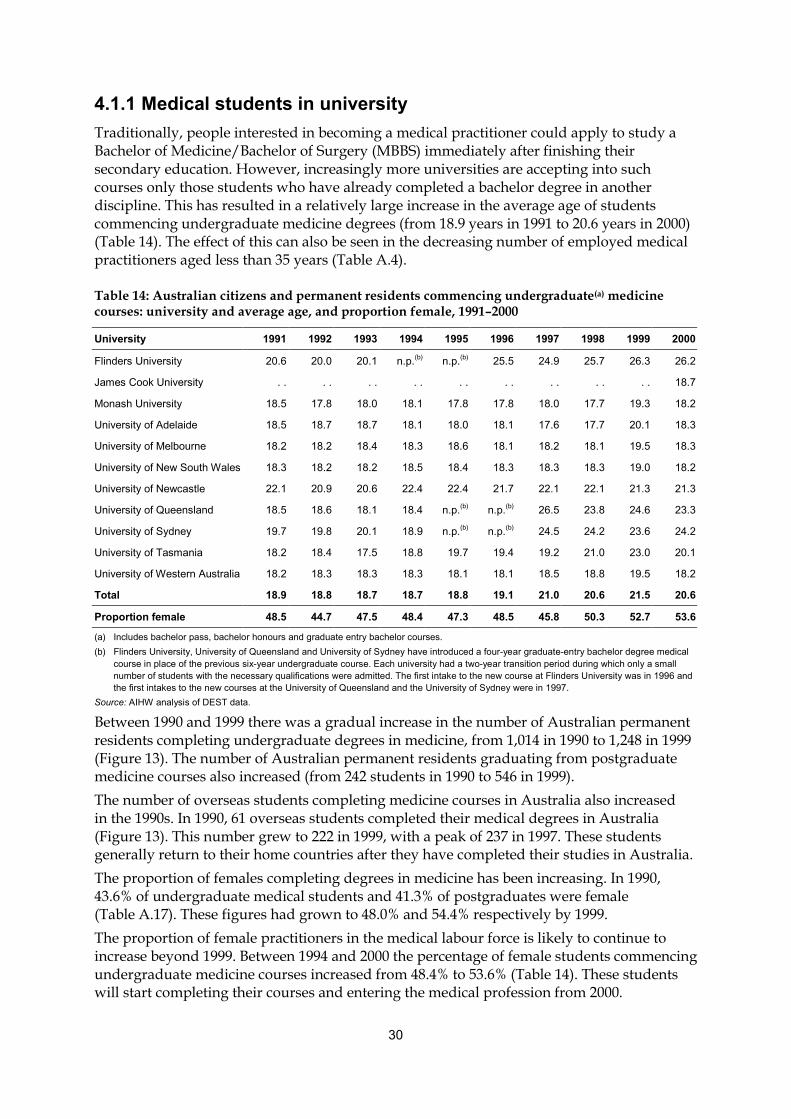
30
4.1.1 Medical students in universityTraditionally, people interested in becoming a medical practitioner could apply to study aBachelor of Medicine/Bachelor of Surgery (MBBS) immediately after finishing theirsecondary education. However, increasingly more universities are accepting into suchcourses only those students who have already completed a bachelor degree in anotherdiscipline. This has resulted in a relatively large increase in the average age of studentscommencing undergraduate medicine degrees (from 18.9 years in 1991 to 20.6 years in 2000)(Table 14). The effect of this can also be seen in the decreasing number of employed medicalpractitioners aged less than 35 years (Table A.4).
Table 14: Australian citizens and permanent residents commencing undergraduate(a) medicinecourses: university and average age, and proportion female, 1991–2000
University 1991 1992 1993 1994 1995 1996 1997 1998 1999 2000
Flinders University 20.6 20.0 20.1 n.p.(b) n.p.(b) 25.5 24.9 25.7 26.3 26.2
James Cook University . . . . . . . . . . . . . . . . . . 18.7
Monash University 18.5 17.8 18.0 18.1 17.8 17.8 18.0 17.7 19.3 18.2
University of Adelaide 18.5 18.7 18.7 18.1 18.0 18.1 17.6 17.7 20.1 18.3
University of Melbourne 18.2 18.2 18.4 18.3 18.6 18.1 18.2 18.1 19.5 18.3
University of New South Wales 18.3 18.2 18.2 18.5 18.4 18.3 18.3 18.3 19.0 18.2
University of Newcastle 22.1 20.9 20.6 22.4 22.4 21.7 22.1 22.1 21.3 21.3
University of Queensland 18.5 18.6 18.1 18.4 n.p.(b) n.p.(b) 26.5 23.8 24.6 23.3
University of Sydney 19.7 19.8 20.1 18.9 n.p.(b) n.p.(b) 24.5 24.2 23.6 24.2
University of Tasmania 18.2 18.4 17.5 18.8 19.7 19.4 19.2 21.0 23.0 20.1
University of Western Australia 18.2 18.3 18.3 18.3 18.1 18.1 18.5 18.8 19.5 18.2
Total 18.9 18.8 18.7 18.7 18.8 19.1 21.0 20.6 21.5 20.6
Proportion female 48.5 44.7 47.5 48.4 47.3 48.5 45.8 50.3 52.7 53.6
(a) Includes bachelor pass, bachelor honours and graduate entry bachelor courses.(b) Flinders University, University of Queensland and University of Sydney have introduced a four-year graduate-entry bachelor degree medical
course in place of the previous six-year undergraduate course. Each university had a two-year transition period during which only a smallnumber of students with the necessary qualifications were admitted. The first intake to the new course at Flinders University was in 1996 andthe first intakes to the new courses at the University of Queensland and the University of Sydney were in 1997.
Source: AIHW analysis of DEST data.
Between 1990 and 1999 there was a gradual increase in the number of Australian permanentresidents completing undergraduate degrees in medicine, from 1,014 in 1990 to 1,248 in 1999(Figure 13). The number of Australian permanent residents graduating from postgraduatemedicine courses also increased (from 242 students in 1990 to 546 in 1999).The number of overseas students completing medicine courses in Australia also increasedin the 1990s. In 1990, 61 overseas students completed their medical degrees in Australia(Figure 13). This number grew to 222 in 1999, with a peak of 237 in 1997. These studentsgenerally return to their home countries after they have completed their studies in Australia.The proportion of females completing degrees in medicine has been increasing. In 1990,43.6% of undergraduate medical students and 41.3% of postgraduates were female(Table A.17). These figures had grown to 48.0% and 54.4% respectively by 1999.The proportion of female practitioners in the medical labour force is likely to continue toincrease beyond 1999. Between 1994 and 2000 the percentage of female students commencingundergraduate medicine courses increased from 48.4% to 53.6% (Table 14). These studentswill start completing their courses and entering the medical profession from 2000.

31
0
200
400
600
800
1,000
1,200
1,400
1990 1991 1992 1993 1994 1995 1996 1997 1998 1999
Year
Num
ber
Aust. bachelor
Aust. postgrad.
O'seas bachelor
O'seas postgrad.
Source: Table A.17.
Figure 13: Medicine student course completions: residency and level of course, Australia, 1990–99
4.1.2 Postgraduate specialist trainingFollowing the completion of undergraduate or postgraduate university degree andinternship, the cream of recently-qualified young doctors are invited to take up a specialist(or general practice) training position. The number of training places available in eachspecialty is determined by the specialty colleges, and are based on estimates of the futuredemand for practitioners (‘fellows’) in each specialty area. The Australian MedicalWorkforce Advisory Committee (AMWAC) periodically reviews the needs of each specialtyand makes recommendations to the colleges. AMWAC reviews typically use AIHW medicallabour force and national hospital morbidity data, Department of Health and AgeingMedicare statistics, ABS population projections and other information, applied to the currentsupply in the specialty field (acquired from college data holdings) to project futurerequirements.Practitioners who are not offered, or who do not accept, a training position may register topractise as hospital non-specialists, under supervision, or as ‘Other medical practitioners’(OMPs). OMPs are primary care practitioners who may treat patients, but not as anunsupervised general practitioner.In 1999, there were 5,645 trainees in the specialist colleges, representing a growth of 91, or1.6% since 1998. In both years, just over a quarter were registered with the Royal AustralianCollege of General Practitioners. Another 13% in each of those years were registered with theRoyal Australasian College of Physicians. Other large specialties were emergency medicine(12%), psychiatry (11%) and anaesthetics (10%) (Table 15).Each year, the Medical Training Review Panel obtains information from the specialtycolleges, through AMWAC, about current and likely training opportunities for medicalpractitioners. According to the Panel, there are likely to be 1,483 first-year places available in2000 for new trainees (MTRP 2000). This is an increase of 9.9% on the 1,350 first-year placesestimated for the previous year. Trainees typically undertake a program lasting betweenthree and five years before being elected to fellowship of their college.
��
������������ ������ ������������ �������������������������������������� ������������������������������ ���������������� ���������
$OO�WUDLQLQJ�SODFHV
([SHFWHG�ILUVW�\HDU
WUDLQLQJ�SODFHV
6SHFLDOLVW�FROOHJH ���� ���� ���� ����
$XVWUDOLDQ�DQG�1HZ�=HDODQG�&ROOHJH�RI�$QDHVWKHWLVWV ��� ��� ��� ���
$XVWUDODVLDQ�&ROOHJH�RI�'HUPDWRORJLVWV �� �� � �
$XVWUDODVLDQ�&ROOHJH�IRU�(PHUJHQF\�0HGLFLQH ��� ��� ��� ���
5R\DO�$XVWUDOLDQ�&ROOHJH�RI�*HQHUDO�3UDFWLWLRQHUV ����� ����� ��� ���
5R\DO�$XVWUDOLDQ�&ROOHJH�RI�0HGLFDO�$GPLQLVWUDWRUV �� �� �� ��
5R\DO�$XVWUDOLDQ�&ROOHJH�RI�2EVWHWULFLDQV�DQG�*\QDHFRORJLVWV ��� ��� �� ��
5R\DO�$XVWUDODVLDQ�&ROOHJH�RI�2SKWKDOPRORJLVWV �� �� �� ��
5R\DO�&ROOHJH�RI�3DWKRORJLVWV�RI�$XVWUDODVLD ��� ��� �� ��
5R\DO�$XVWUDODVLDQ�&ROOHJH�RI�3K\VLFLDQV ��� ��� ��� ���
5R\DO�$XVWUDOLDQ�DQG�1HZ�=HDODQG�&ROOHJH�RI�3V\FKLDWULVWV ��� ��� ��� ���
5R\DO�$XVWUDOLDQ�DQG�1HZ�=HDODQG�&ROOHJH�RI�5DGLRORJLVWV ��� ��� �� ��
5R\DO�$XVWUDODVLDQ�&ROOHJH�RI�6XUJHRQV ��� ��� ��� ���
7RWDO ����� ����� ����� �����
6RXUFH��0HGLFDO�FROOHJHV�
���������������� �������� ������������������������ �������� !��!�����������������!� ������"������������������������������� �������"��������������������������!���� �#�$��!��%&�� ��"���������%�&�'�(#)*+������������!��� ������������ ������������������������� �������" �� ���'� �����!����������������� ����� �������" �� ��+�����!���� �#�$���!������!�,���������������" ��� ������� ����� ���" �������'��#�*+��������!�����'��#(*+���������������'��#�*+��������� ���� �� ��'��#�*+#����!��!��!� �������!��!���������� �����������"����� !� ���!� ��� �����������""� ����������!�� ��� ������������ �#�-� ��.��"����&#)*������������ �������������!�� �" ��� ����"��������� ����,��������#(*������������ �������"������ � ������ ���������������#(*�����������"���!��� ������)#)*������������ �������"������ � ����"���!��� ��'���������+#
�����������/��������"�������������� ��� ����!��������!������ ������ ���������!�������!���� ������0������������" ����������������������� �����"���������� ��!���� !����� ����������������"��������� ������#�1!� ��� ������������������������������������!� �2�� ��"������� �0� ������������ ������������������������ ��!��� �������!������"� � �� ������������� ��"��������"� ����� ��������!����� ����������������,� ��� �������!��� ��"���#�3�"�������"��� �����������4������1� ��� ������-��� ������� �������!���������� ��������������������� ��������� ��� ��������� �������� � �������� ��������"� � �������������"�������"�����������!��"����������� ���" ��������������"������������������ �������"� ����� �����������������������������5� �����������6#�1!����" ��������� ��� ���� ����5���"� � �� ������������� �6'173�+�'���������+#

33
0
500
1,000
1,500
2,000
2,500
1992–93 1993–94 1994–95 1995–96 1996–97 1997–98 1998–99 1999–00
Financial year
Num
ber
Long term
Short term
Source: Table A.18.
Figure 14: Temporary migration of non-Australian medical practitioners to Australia foremployment: length of migration, 1992–93 to 1999–00
As indicated in Figure 14, it seems that incentives have had an effect on the number ofdoctors entering Australia temporarily for the purpose of employment. In most years since1992 there was an increase in the number of doctors entering Australia on a temporary visa,and there was a total increase over the period from 667 in 1992–93 to 2,372 doctors in1999–00. Approximately two in three of these medical practitioners stay for less than 12months.Overseas-trained medical practitioners who wish to practise in Australia long term arerequired to pass a series of exams and assessments conducted by the Australian MedicalCouncil. In order to become a fully registered primary care practitioner or hospital non-specialist, the overseas-trained practitioner must enter through the general registrationpathway and pass both a multiple choice questions (MCQ) examination and a clinicalexamination. Overseas-trained specialists must enter through the AMC/specialist medicalcollege pathway for assessment of their overseas training and experience by the relevantspecialist college for the purpose of conditional registration as a specialist. In the financialyear 1999–00, 219 candidates passed the general examination process and were eligible forfull registration in Australia (Table 16). In the same year, 54 candidates qualified forconditional registration through the specialist pathway.While many foreign doctors come to Australia permanently for the purpose of employment,it is also true that some Australian doctors migrate permanently to other countries for thesame purpose. Between 1992–93 and 1996–97, the number of Australian medicalpractitioners leaving Australia permanently remained relatively constant at around 150doctors per year (Figure 15). From 1997–98 onwards, this number steadily increased to 296doctors per year in 1999–00. During this time, the number of overseas doctors permanentlymigrating to Australia fluctuated from a peak of 626 in 1995–96, to a low of 358 in 1997–98.

34
Table 16: Australian Medical Council examination and specialist assessment results,1992–93 to 1999–00
1992–93 1993–94 1994–95 1995–96 1996–97 1997–98 1998–99 1999–00
Overseas-trained doctors entering through the general registration pathway
MCQ examination:
Number of candidates presenting 812 619 688 . .(a) 1,382 779 669 769
Number passing/eligible toproceed to clinical examination 297 343 391 . .(a) 612 234 372 304
Clinical examination:
Number exams conducted 434 418 404 518 556 427 459 434
Number passing AMC exam andeligible for registration 193 211 222 266 266 151 220 219
Overseas-trained specialists entering through the AMC/specialist medical college pathway
Number of applications received 86(b) 191 162 178 151 123 132 220
Total qualified for registration (c) 18 69 67 66 63 52 47 54
Total overseas-trained doctorsentering the workforce 211 280 289 332 329 203 267 273
(a) No MCQ examination was held in 1995–96.(b) Part-year figure only. AMC/specialist medical college procedures commenced in January 1993.(c) Applicants qualifying in a particular year may have submitted their applications in a previous year.Note: This table contains information that has been revised since the previous Medical Labour Force 1998 publication.Source: Australian Medical Council.
It can be seen from Figure 15 that in every year since 1992–93, there was a net gain ofdoctors, although the size of this gain has been smaller since 1997–98 than in the precedingyears. It may be that with a general ageing of populations in other developed countries, therehave been competing demands for health professionals, including medical practitioners,willing to emigrate from any country, either short term or permanently.
0
100
200
300
400
500
600
700
1992–93 1993–94 1994–95 1995–96 1996–97 1997–98 1998–99 1999–00
Financial year
Num
ber
To AustraliaFrom Australia
Source: Table A.19.
Figure 15: Permanent migration of Australian medical practitioners from Australia and non-Australian medical practitioners to Australia for the purpose of employment, 1992–93 to 1999–00

35
Appendix A: Detailed tables
Table A.1: All registered medical practitioners: employment status and sex, States and Territories,1999
Employment status NSW Vic Qld WA SA Tas ACT NT Australia
Males
Only in this State 12,568 8,277 5,630 3,124 2,879 865 534 306 34,182
Mainly in this State 481 217 167 66 225 21 137 19 1,333
Mainly in another State 671 405 96 81 79 124 151 185 1,792
Only in other States 940 377 646 322 223 70 149 200 2,927
On extended leave 52 34 18 24 8 3 3 6 147
Practising overseas 851 422 228 73 132 30 45 18 1,798
Employed, not in medicine 130 52 15 19 20 2 6 3 248
Currently not employed 190 46 36 20 32 13 8 10 354
Retired from work 996 527 358 261 318 94 59 11 2,623
Total 16,878 10,357 7,194 3,989 3,916 1,222 1,092 758 45,405
Females
Only in this State 5,180 3,612 2,410 1,309 1,222 319 322 180 14,555
Mainly in this State 101 31 31 6 40 3 39 6 258
Mainly in another State 104 72 12 13 15 12 18 33 279
Only in other States 281 175 126 101 56 40 42 35 856
On extended leave 104 84 53 8 13 3 10 2 276
Practising overseas 307 201 77 183 46 5 12 7 837
Employed, not in medicine 66 37 13 11 11 7 3 1 149
Currently not employed 212 64 45 14 30 7 13 6 392
Retired from work 283 184 69 49 63 23 24 4 700
Total 6,638 4,460 2,836 1,694 1,496 419 484 274 18,302
Persons
Only in this State 17,748 11,889 8,040 4,434 4,101 1,184 856 486 48,738
Mainly in this State 582 248 199 71 266 24 176 25 1,591
Mainly in another State 775 478 108 94 94 136 169 218 2,072
Only in other States 1,221 552 772 422 279 110 191 235 3,783
On extended leave 156 118 71 32 21 6 13 7 424
Practising overseas 1,157 622 305 256 178 35 57 25 2,635
Employed, not in medicine 197 88 28 29 31 9 10 4 396
Currently not employed 401 110 81 34 62 20 21 16 746
Retired from work 1,279 712 428 310 381 116 82 15 3,323
Total 23,516 14,817 10,030 5,683 5,412 1,641 1,576 1,032 63,707
Source: Medical Labour Force Survey 1999.

36
Table A.2: Employed medical practitioners: occupation, sex and rate, States and Territories, 1999
Occupation NSW Vic Qld WA SA Tas ACT NT AustraliaPersons (no.)
Clinician 17,372 11,374 7,960 4,202 3,996 1,142 933 458 47,436
Primary care 7,445 5,296 3,406 1,866 1,767 550 421 215 20,966
Hospital non-specialist 1,920 686 1,164 425 300 74 110 61 4,740
Specialist 6,094 4,450 2,622 1,526 1,509 433 312 145 17,091
Specialist-in-training 1,913 941 769 384 421 85 90 37 4,640
Non-clinician 958 763 279 303 371 66 100 53 2,892
Administrator 235 93 91 44 46 10 12 18 548
Teacher/educator 67 66 30 23 26 3 4 3 222
Researcher 118 85 25 38 20 3 7 11 306
Public health physician 125 185 75 91 84 25 27 20 631
Occupational health physician 102 41 26 26 35 7 0 13 251
Other 311 293 32 149 92 18 4 35 934
Total 18,330 12,137 8,238 4,505 4,367 1,208 1,032 511 50,329
Proportion female (per cent)
Clinician 28.5 29.8 29.4 29.1 28.5 27.0 36.1 37.2 29.2
Primary care 32.9 35.5 35.2 35.2 32.5 34.0 46.8 45.9 34.6
Hospital non-specialist 41.7 32.7 39.5 47.4 49.1 23.8 51.8 59.5 41.0
Specialist 16.6 20.1 15.3 15.2 17.2 14.5 14.1 18.1 17.2
Specialist-in-training 36.0 40.9 36.9 34.6 37.3 47.8 42.5 24.7 37.4
Non-clinician 34.1 33.4 35.1 29.9 33.8 21.6 25.3 30.1 32.9
Administrator 33.9 28.0 38.5 22.2 37.1 49.6 25.5 28.6 32.9
Teacher/educator 22.6 32.4 23.8 24.4 27.0 0.0 0.0 51.1 26.1
Researcher 43.8 32.9 51.5 49.3 28.4 0.0 0.0 0.0 38.2
Public health physician 42.1 43.7 41.0 36.8 38.0 9.1 48.6 51.7 40.4
Occupational health physician 15.4 24.1 13.1 28.0 0.0 0.0 0.0 0.0 14.5
Other 36.1 30.2 27.0 33.8 31.1 38.6 0.0 23.9 32.5
Total 28.8 30.0 29.6 29.2 28.9 26.5 35.0 36.5 29.4
Rate (per 100,000 population)
Clinician 270.1 240.0 225.0 224.6 267.1 242.6 300.9 235.7 249.0
Primary care 115.8 111.8 96.3 99.7 118.1 116.9 135.8 110.5 110.1
Hospital non-specialist 29.9 14.5 32.9 22.7 20.0 15.7 35.5 31.6 24.9
Specialist 94.7 93.9 74.1 81.6 100.8 92.0 100.6 74.5 89.7
Specialist-in-training 29.7 19.9 21.7 20.5 28.1 18.0 29.0 19.0 24.4
Non-clinician 14.9 16.1 7.9 16.2 24.8 14.0 32.2 27.5 15.2
Administrator 3.7 2.0 2.6 2.9 2.5 2.1 6.0 5.7 2.9
Teacher/educator 1.0 1.4 0.9 1.5 1.4 0.6 2.0 1.1 1.2
Researcher 1.8 1.8 0.7 2.5 1.1 0.6 3.4 3.5 1.6
Public health physician 1.9 3.9 2.1 6.1 4.5 5.2 13.9 6.3 3.3
Occupational health physician 1.6 0.9 0.7 1.7 1.9 1.6 0.0 4.3 1.3
Other 4.8 6.2 0.9 9.9 4.9 3.9 2.2 11.3 4.9
Total 285.0 256.2 232.9 240.8 291.8 256.6 333.1 263.2 264.2
(’000)Population at 31 December 1999 6,431.6 4,738.2 3,537.2 1,871.2 1,496.2 470.8 310.0 194.3 19,049.4Source: Medical Labour Force Survey 1999; ABS estimated resident population figures at 31 December 1999.

37
Table A.3: Employed medical practitioners: occupation, sex and rate, States and Territories, 1995
Occupation NSW Vic Qld WA SA Tas ACT NT Australia
Persons (no.)Clinician 15,739 11,142 7,430 3,960 4,037 1,067 802 406 44,583
Primary care 7,031 4,570 3,516 1,862 1,816 575 377 191 19,937
Hospital non-specialist 1,924 1,030 896 317 347 98 94 63 4,769
Specialist 5,376 4,231 2,348 1,440 1,490 323 280 117 15,604
Specialist-in-training 1,409 1,310 670 341 385 72 51 36 4,273
Non-clinician 945 965 377 135 170 49 75 32 2,748
Administrator 223 270 100 42 55 9 28 11 737 Teacher/educator 70 48 30 9 12 4 0 1 173 Researcher 104 79 28 18 27 4 18 5 284 Public health physician 143 148 77 22 40 9 18 4 461 Occupational health physician 95 73 22 10 23 11 0 3 237 Other 310 347 120 34 13 12 11 8 855Total 16,684 12,107 7,806 4,094 4,207 1,116 877 439 47,331
Proportion female (per cent)
Clinician 26.6 26.9 27.1 27.3 26.4 27.6 31.8 29.6 27.0 Primary care 29.9 32.0 32.3 33.1 31.0 33.3 41.7 39.7 31.6 Hospital non-specialist 41.5 41.5 41.0 49.5 42.9 42.7 43.0 35.8 42.0 Specialist 14.1 15.4 12.6 12.9 14.0 11.4 12.8 10.8 14.0 Specialist-in-training 32.1 29.8 31.0 35.7 31.8 32.4 41.2 28.3 31.6Non-clinician 32.4 29.4 33.2 35.3 28.0 27.0 26.8 38.1 31.2 Administrator 33.5 30.4 33.8 40.9 18.9 14.3 26.3 25.0 31.2 Teacher/educator 30.6 38.2 28.6 20.0 0.0 0.0 0.0 0.0 29.1 Researcher 34.8 32.1 40.0 45.5 18.8 33.3 33.3 20.0 33.5 Public health physician 39.2 37.5 40.7 37.5 42.1 42.9 42.9 60.0 39.5 Occupational health physician 19.3 11.8 6.7 11.1 33.3 25.0 0.0 0.0 16.0 Other 32.1 26.8 32.1 40.0 41.4 33.3 28.6 66.7 30.7Total 26.8 27.2 27.3 27.6 26.3 27.5 31.4 33.3 27.2
Rate (per 100,000 population)
Clinician 255.1 245.4 224.9 226.4 274.4 225.1 262.3 225.2 245.1
Primary care 114.0 100.7 106.4 106.4 123.4 121.2 123.3 106.0 109.6
Hospital non-specialist 31.2 22.7 27.1 18.1 23.6 20.6 30.9 34.7 26.2
Specialist 87.1 93.2 71.1 82.3 101.3 68.1 91.5 64.6 85.8
Specialist-in-training 22.8 28.9 20.3 19.5 26.1 15.1 16.7 19.8 23.5
Non-clinician 15.3 21.3 11.4 7.7 11.5 10.2 24.5 17.9 15.1
Administrator 3.6 5.9 3.0 2.4 3.7 1.9 9.3 5.9 4.1 Teacher/educator 1.1 1.1 0.9 0.5 0.8 0.8 0.0 0.3 1.0 Researcher 1.7 1.7 0.9 1.0 1.9 0.8 5.8 2.8 1.6 Public health physician 2.3 3.3 2.3 1.2 2.7 1.9 5.8 2.2 2.5 Occupational health physician 1.5 1.6 0.7 0.6 1.5 2.2 0.0 1.9 1.3 Other 5.0 7.6 3.6 2.0 0.9 2.6 3.6 4.6 4.7Total 270.5 266.7 236.3 234.1 286.0 235.3 286.8 243.1 260.2
(’000)Population at 31 December 1995 6,168.8 4,539.8 3,303.4 1,749.3 1,471.2 474.1 305.8 180.5 18,193.0Source: Medical Labour Force Survey 1995; ABS estimated resident population figures at 31 December 1995.
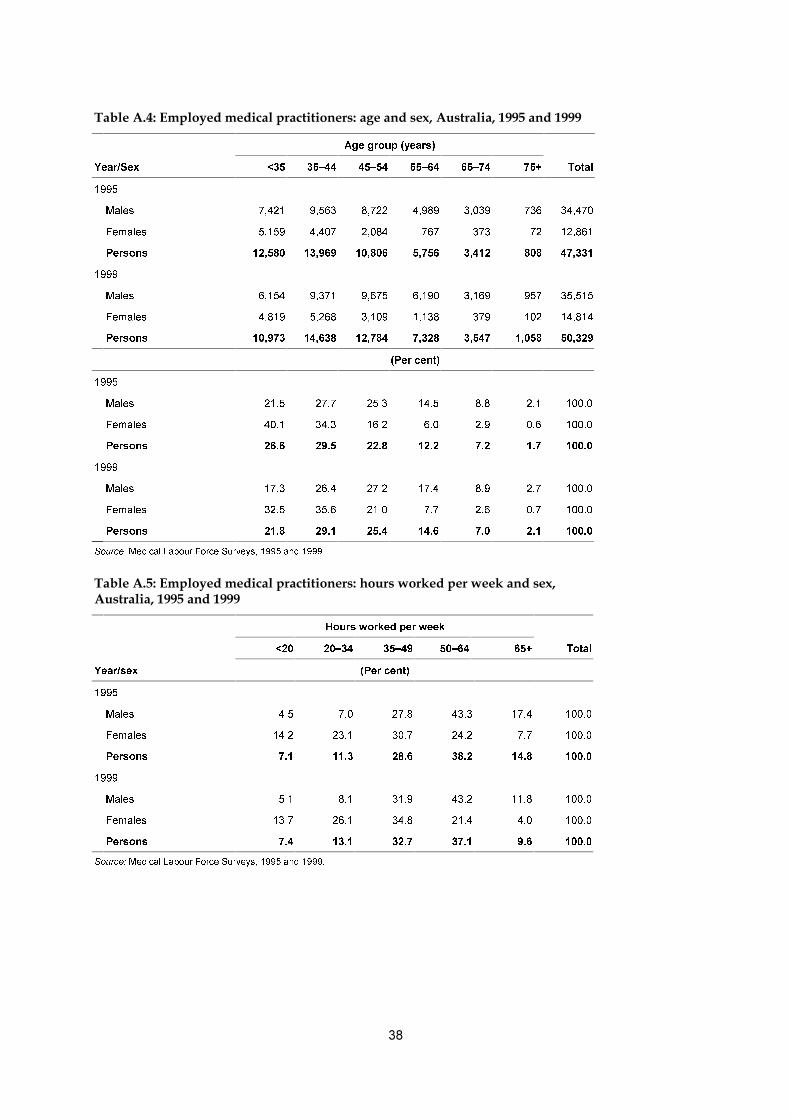
��
����������� �������������� ��������������������������������������������������
$JH�JURXS��\HDUV�
<HDU�6H[ ��� ��±�� ��±�� ��±�� ��±�� ��� 7RWDO
����
0DOHV ����� ����� ����� ����� ����� ��� ������
)HPDOHV ����� ����� ����� ��� ��� �� ������
3HUVRQV ������ ������ ������ ����� ����� ��� ������
����
0DOHV ����� ����� ����� ����� ����� ��� ������
)HPDOHV ����� ����� ����� ����� ��� ��� ������
3HUVRQV ������ ������ ������ ����� ����� ����� ������
�3HU�FHQW�
����
0DOHV ���� ���� ���� ���� ��� ��� �����
)HPDOHV ���� ���� ���� ��� ��� ��� �����
3HUVRQV ���� ���� ���� ���� ��� ��� �����
����
0DOHV ���� ���� ���� ���� ��� ��� �����
)HPDOHV ���� ���� ���� ��� ��� ��� �����
3HUVRQV ���� ���� ���� ���� ��� ��� �����
6RXUFH��0HGLFDO�/DERXU�)RUFH�6XUYH\V�������DQG������
������������ �������������� ���������������������� ��� ������ ���������������������������������
+RXUV�ZRUNHG�SHU�ZHHN
��� ���±�� ��±�� ���±�� ���� 7RWDO
<HDU�VH[ �3HU�FHQW�
����
0DOHV ��� ��� ���� ���� ���� �����
)HPDOHV ���� ���� ���� ���� ��� �����
3HUVRQV ��� ���� ���� ���� ���� �����
����
0DOHV ��� ��� ���� ���� ���� �����
)HPDOHV ���� ���� ���� ���� ��� �����
3HUVRQV ��� ���� ���� ���� ��� �����
6RXUFH��0HGLFDO�/DERXU�)RUFH�6XUYH\V�������DQG������
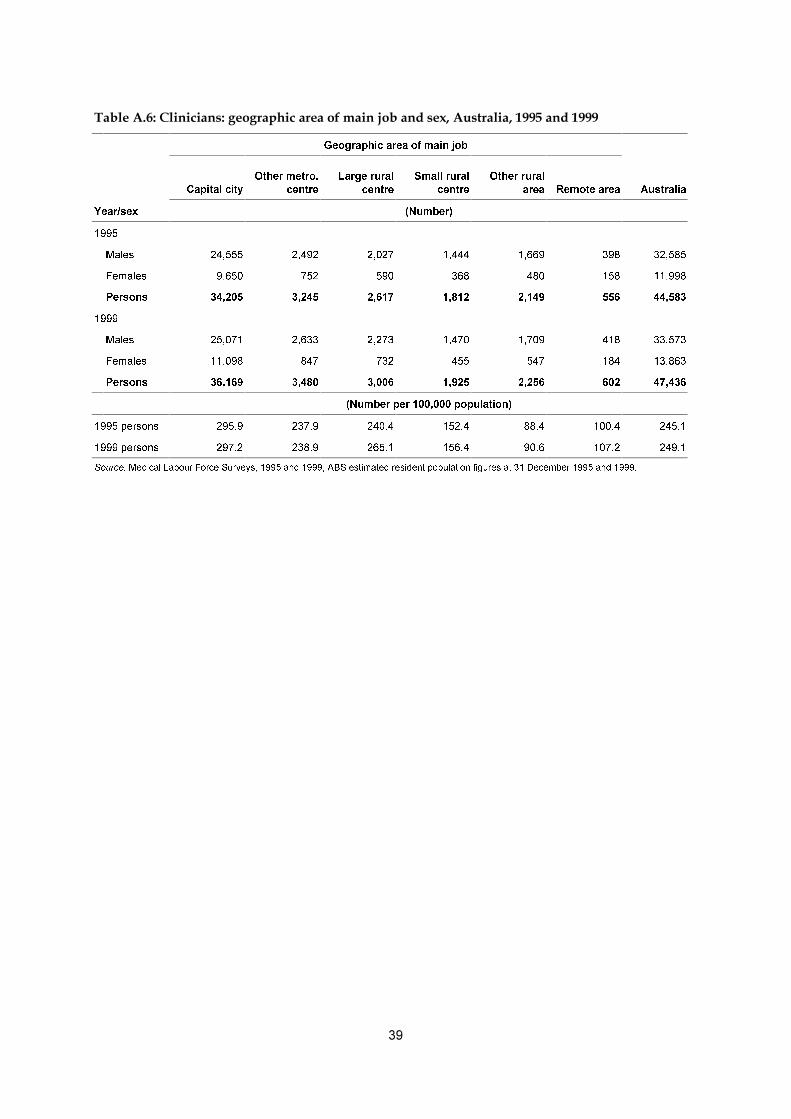
��
��������!�"���������������� ����������#������$������������������������������������
*HRJUDSKLF�DUHD�RI�PDLQ�MRE
&DSLWDO�FLW\
2WKHU�PHWUR�
FHQWUH
/DUJH�UXUDO
FHQWUH
6PDOO�UXUDO
FHQWUH
2WKHU�UXUDO
DUHD 5HPRWH�DUHD $XVWUDOLD
<HDU�VH[ �1XPEHU�
����
0DOHV ������ ����� ����� ����� ����� ��� ������
)HPDOHV ����� ��� ��� ��� ��� ��� ������
3HUVRQV ������ ����� ����� ����� ����� ��� ������
����
0DOHV ������ ����� ����� ����� ����� ��� ������
)HPDOHV ������ ��� ��� ��� ��� ��� ������
3HUVRQV ������ ����� ����� ����� ����� ��� ������
�1XPEHU�SHU���������SRSXODWLRQ�
�����SHUVRQV ����� ����� ����� ����� ���� ����� �����
�����SHUVRQV ����� ����� ����� ����� ���� ����� �����
6RXUFH��0HGLFDO�/DERXU�)RUFH�6XUYH\V�������DQG�������$%6�HVWLPDWHG�UHVLGHQW�SRSXODWLRQ�ILJXUHV�DW����'HFHPEHU������DQG������
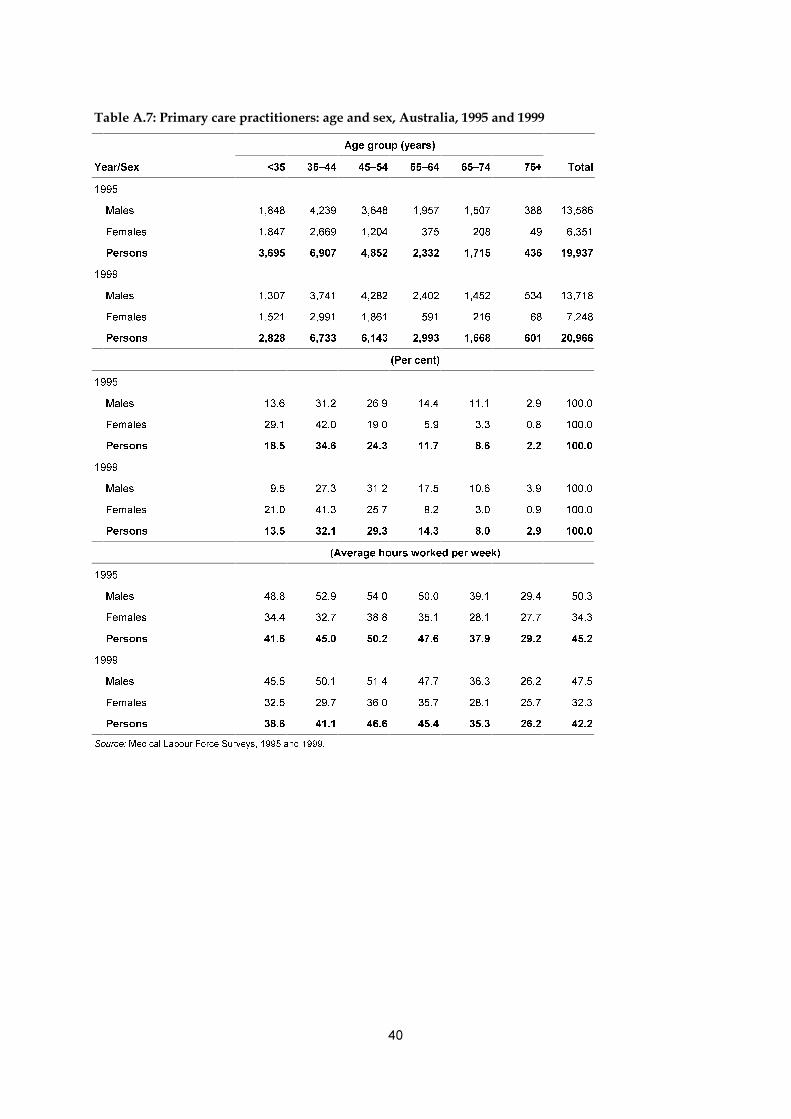
��
��������%�&������������ ��������������������������������������������������
$JH�JURXS��\HDUV�
<HDU�6H[ ��� ��±�� ��±�� ��±�� ��±�� ��� 7RWDO
����
0DOHV ����� ����� ����� ����� ����� ��� ������
)HPDOHV ����� ����� ����� ��� ��� �� �����
3HUVRQV ����� ����� ����� ����� ����� ��� ������
����
0DOHV ����� ����� ����� ����� ����� ��� ������
)HPDOHV ����� ����� ����� ��� ��� �� �����
3HUVRQV ����� ����� ����� ����� ����� ��� ������
�3HU�FHQW�
����
0DOHV ���� ���� ���� ���� ���� ��� �����
)HPDOHV ���� ���� ���� ��� ��� ��� �����
3HUVRQV ���� ���� ���� ���� ��� ��� �����
����
0DOHV ��� ���� ���� ���� ���� ��� �����
)HPDOHV ���� ���� ���� ��� ��� ��� �����
3HUVRQV ���� ���� ���� ���� ��� ��� �����
�$YHUDJH�KRXUV�ZRUNHG�SHU�ZHHN�
����
0DOHV ���� ���� ���� ���� ���� ���� ����
)HPDOHV ���� ���� ���� ���� ���� ���� ����
3HUVRQV ���� ���� ���� ���� ���� ���� ����
����
0DOHV ���� ���� ���� ���� ���� ���� ����
)HPDOHV ���� ���� ���� ���� ���� ���� ����
3HUVRQV ���� ���� ���� ���� ���� ���� ����
6RXUFH��0HGLFDO�/DERXU�)RUFH�6XUYH\V�������DQG������

��
����������� ��������������� � ������������������� ������������ ��������������������������������������� ���������� ��������� ���!""#�����!"""
&DSLWDO
FLW\
2WKHU�PHWUR�
FHQWUH
/DUJH�UXUDO
FHQWUH
6PDOO�UXUDO
FHQWUH
2WKHU�UXUDO
DUHD
5HPRWH
DUHD 7RWDO
<HDU�VH[ �1XPEHU�
����
0DOHV ����� ����� ��� ��� ����� ��� ������
)HPDOHV ����� ��� ��� ��� ��� ��� �����
3HUVRQV ������ ����� ����� ����� ����� ��� ������
����
0DOHV ����� ����� ��� ��� ����� ��� ������
)HPDOHV ����� ��� ��� ��� ��� ��� �����
3HUVRQV ������ ����� ����� ����� ����� ��� ������
�$YHUDJH�DJH�
����
0DOHV ���� ���� ���� ���� ���� ���� ����
)HPDOHV ���� ���� ���� ���� ���� ���� ����
3HUVRQV ���� ���� ���� ���� ���� ���� ����
����
0DOHV ���� ���� ���� ���� ���� ���� ����
)HPDOHV ���� ���� ���� ���� ���� ���� ����
3HUVRQV ���� ���� ���� ���� ���� ���� ����
�$YHUDJH�KRXUV�ZRUNHG�SHU�ZHHN�
����
0DOHV ���� ���� ���� ���� ���� ���� ����
)HPDOHV ���� ���� ���� ���� ���� ���� ����
3HUVRQV ���� ���� ���� ���� ���� ���� ����
����
0DOHV ���� ���� ���� ���� ���� ���� ����
)HPDOHV ���� ���� ���� ���� ���� ���� ����
3HUVRQV ���� ���� ���� ���� ���� ���� ����
6RXUFH��0HGLFDO�/DERXU�)RUFH�6XUYH\V�������DQG������

42
Table A.9: Primary care practitioners: sex, geographic area of main job and age, Australia, 1999
Capitalcity
Other metro.centre
Large ruralcentre
Small ruralcentre
Other ruralarea
Remotearea Total
Sex/age (Per cent)
Males
<35 9.6 7.0 8.2 11.0 8.8 20.8 9.5
35–44 25.3 25.9 31.7 31.2 34.7 36.6 27.3
45–54 31.3 30.1 34.1 32.2 30.3 27.4 31.2
55–64 18.4 20.8 15.0 13.4 14.5 10.3 17.5
65+ 15.5 16.2 10.9 12.2 11.7 5.0 14.5
Total 100.0 100.0 100.0 100.0 100.0 100.0 100.0
Females
<35 19.8 23.2 21.1 22.3 23.9 45.3 21.0
35–44 40.9 42.8 45.9 39.2 40.4 45.5 41.3
45–54 26.2 23.9 24.6 30.2 23.9 8.4 25.7
55–64 8.7 7.2 6.9 6.4 7.4 0.8 8.2
65+ 4.4 2.9 1.5 1.9 4.5 0.0 3.9
Total 100.0 100.0 100.0 100.0 100.0 100.0 100.0
Source: Medical Labour Force Surveys, 1995 and 1999.
Table A.10: Primary care locums and deputising service practitioners: geographic area of main job,Australia, 1995 and 1999
1995 1999
Geographic area NumberNumber per
100,000 pop.Number per
100 GPs NumberNumber per
100,000 pop.Number per
100 GPs
Capital city 1,250 10.9 9.9 1,219 10.0 9.0
Other metro. centre 134 9.9 9.3 148 10.1 10.7
Large rural centre 71 6.5 7.0 83 7.3 7.5
Small rural centre 97 8.2 9.4 100 8.1 9.4
Other rural area 94 3.9 5.4 110 4.4 5.9
Remote area 27 4.8 7.4 51 9.0 13.7
Total 1,673 9.3 9.2 1,711 9.0 8.9
Source: Medical Labour Force Surveys, 1995 and 1999.
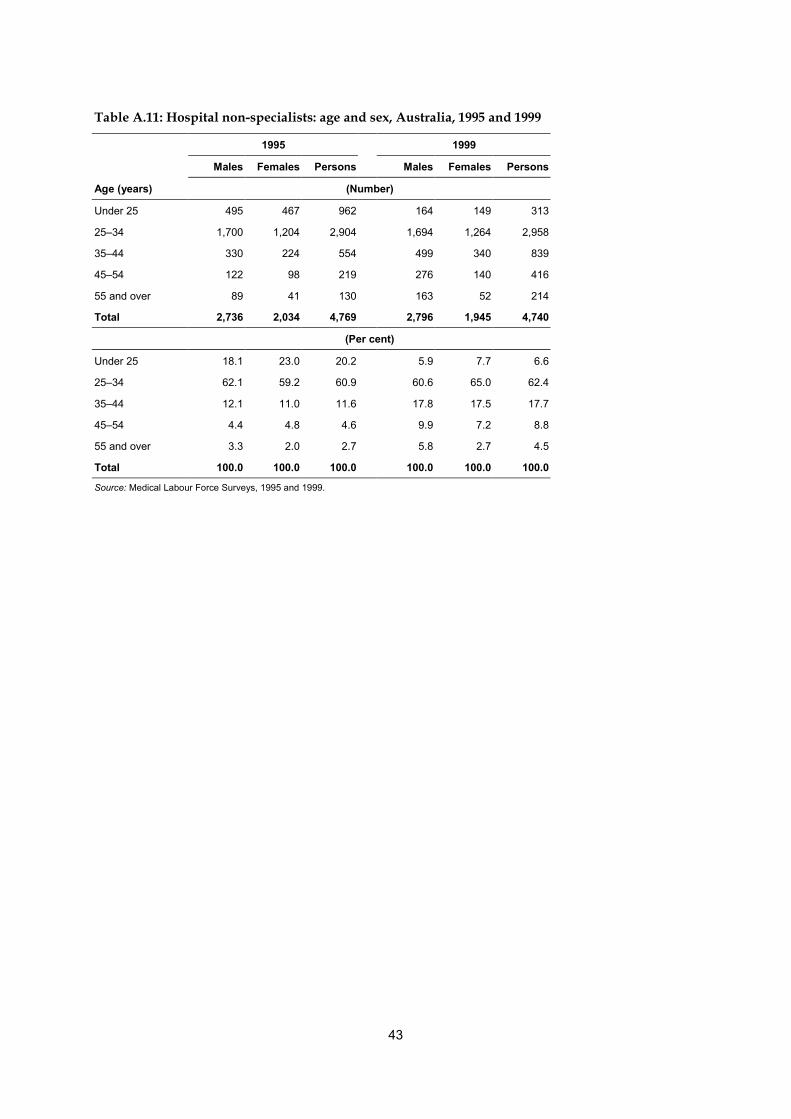
43
Table A.11: Hospital non-specialists: age and sex, Australia, 1995 and 1999
1995 1999
Males Females Persons Males Females Persons
Age (years) (Number)
Under 25 495 467 962 164 149 313
25–34 1,700 1,204 2,904 1,694 1,264 2,958
35–44 330 224 554 499 340 839
45–54 122 98 219 276 140 416
55 and over 89 41 130 163 52 214
Total 2,736 2,034 4,769 2,796 1,945 4,740
(Per cent)
Under 25 18.1 23.0 20.2 5.9 7.7 6.6
25–34 62.1 59.2 60.9 60.6 65.0 62.4
35–44 12.1 11.0 11.6 17.8 17.5 17.7
45–54 4.4 4.8 4.6 9.9 7.2 8.8
55 and over 3.3 2.0 2.7 5.8 2.7 4.5
Total 100.0 100.0 100.0 100.0 100.0 100.0
Source: Medical Labour Force Surveys, 1995 and 1999.

44
Table A.12: Hospital non-specialists: position and total hours worked per week,Australia, 1995 and 1999
1995 1999
RMO/intern OMP Total RMO/Intern OMP Total
Hours worked (Number)
Less than 20 48 64 112 58 111 169
20–34 101 129 230 123 184 307
35–49 820 373 1,193 1,097 589 1,686
50–64 2,161 325 2,486 1,851 378 2,229
65–79 428 70 498 155 72 227
80 and over 216 35 250 84 37 122
Total 3,774 995 4,769 3,368 1,372 4,740
Average hours 54.5 46.5 52.4 50.0 44.0 48.2
(Per cent)
Less than 20 1.3 6.4 2.3 1.7 8.1 3.6
20–34 2.7 13.0 4.8 3.6 13.4 6.5
35–49 21.7 37.5 25.0 32.6 42.9 35.6
50–64 57.3 32.7 52.1 55.0 27.6 47.0
65–79 11.3 7.0 10.4 4.6 5.3 4.8
80 and over 5.7 3.5 5.3 2.5 2.7 2.6
Total 100.0 100.0 100.0 100.0 100.0 100.0
Note: RMO — resident medical officer; OMP — other medical practitioner.
Source: Medical Labour Force Surveys, 1995 and 1999.
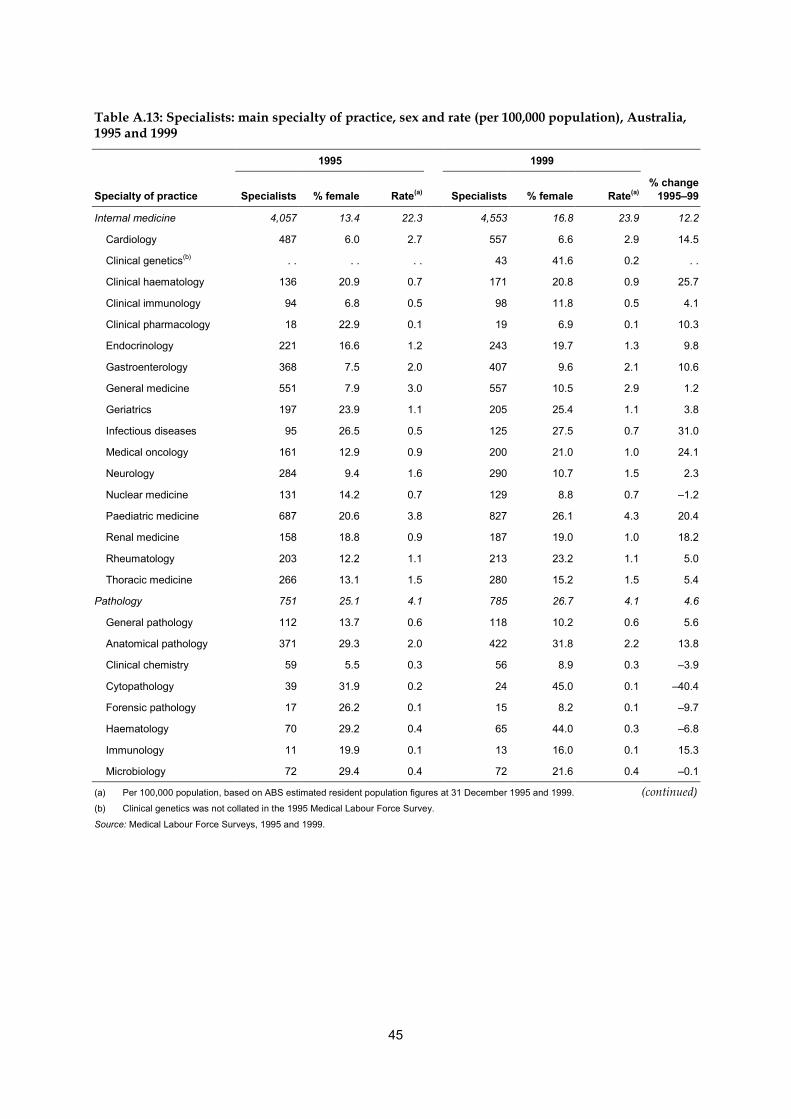
45
Table A.13: Specialists: main specialty of practice, sex and rate (per 100,000 population), Australia,1995 and 1999
1995 1999
Specialty of practice Specialists % female Rate(a) Specialists % female Rate(a)% change
1995–99
Internal medicine 4,057 13.4 22.3 4,553 16.8 23.9 12.2
Cardiology 487 6.0 2.7 557 6.6 2.9 14.5
Clinical genetics(b) . . . . . . 43 41.6 0.2 . .
Clinical haematology 136 20.9 0.7 171 20.8 0.9 25.7
Clinical immunology 94 6.8 0.5 98 11.8 0.5 4.1
Clinical pharmacology 18 22.9 0.1 19 6.9 0.1 10.3
Endocrinology 221 16.6 1.2 243 19.7 1.3 9.8
Gastroenterology 368 7.5 2.0 407 9.6 2.1 10.6
General medicine 551 7.9 3.0 557 10.5 2.9 1.2
Geriatrics 197 23.9 1.1 205 25.4 1.1 3.8
Infectious diseases 95 26.5 0.5 125 27.5 0.7 31.0
Medical oncology 161 12.9 0.9 200 21.0 1.0 24.1
Neurology 284 9.4 1.6 290 10.7 1.5 2.3
Nuclear medicine 131 14.2 0.7 129 8.8 0.7 –1.2
Paediatric medicine 687 20.6 3.8 827 26.1 4.3 20.4
Renal medicine 158 18.8 0.9 187 19.0 1.0 18.2
Rheumatology 203 12.2 1.1 213 23.2 1.1 5.0
Thoracic medicine 266 13.1 1.5 280 15.2 1.5 5.4
Pathology 751 25.1 4.1 785 26.7 4.1 4.6
General pathology 112 13.7 0.6 118 10.2 0.6 5.6
Anatomical pathology 371 29.3 2.0 422 31.8 2.2 13.8
Clinical chemistry 59 5.5 0.3 56 8.9 0.3 –3.9
Cytopathology 39 31.9 0.2 24 45.0 0.1 –40.4
Forensic pathology 17 26.2 0.1 15 8.2 0.1 –9.7
Haematology 70 29.2 0.4 65 44.0 0.3 –6.8
Immunology 11 19.9 0.1 13 16.0 0.1 15.3
Microbiology 72 29.4 0.4 72 21.6 0.4 –0.1
(a) Per 100,000 population, based on ABS estimated resident population figures at 31 December 1995 and 1999. (continued)(b) Clinical genetics was not collated in the 1995 Medical Labour Force Survey.
Source: Medical Labour Force Surveys, 1995 and 1999.

46
Table A.13 (continued): Specialists: main specialty of practice, sex and rate (per 100,000 population),Australia, 1995 and 1999
1995 1999
Specialty of practice Specialists % female Rate(a) Specialists % female Rate(a)% change
1995–99
Surgery 2,580 3.8 14.2 3,050 4.2 16.0 18.2
General surgery 1,041 3.4 5.7 1,058 3.8 5.6 1.6
Cardiothoracic surgery 94 5.7 0.5 111 6.1 0.6 18.6
Neurosurgery 106 4.1 0.6 113 6.4 0.6 6.1
Orthopaedic surgery 700 1.6 3.8 736 2.5 3.9 5.2
Otolaryngology (ENT) 316 3.6 1.7 298 3.4 1.6 -5.7
Paediatric surgery 70 7.6 0.4 79 17.9 0.4 13.8
Plastic surgery 232 10.2 1.3 267 8.3 1.4 15.0
Urology 206 3.1 1.1 240 1.3 1.3 16.2
Vascular surgery 132 3.7 0.7 149 4.8 0.8 12.8
Other specialties 8,216 17.4 45.2 8,703 21.1 45.7 5.9
Anaesthesia 1,810 18.9 9.9 2,052 18.7 10.8 13.4
Dermatology 287 28.4 1.6 312 32.5 1.6 8.7
Diagnostic radiology 1,020 14.2 5.6 1,107 17.7 5.8 8.6
Emergency medicine 232 16.9 1.3 342 21.9 1.8 47.1
Intensive care 198 8.7 1.1 262 12.2 1.4 32.4
Medical administration 83 9.2 0.5 62 16.6 0.3 -25.1
Obstetrics & gynaecology 981 12.3 5.4 1,100 16.5 5.8 12.1
Occupational medicine 107 14.0 0.6 39 12.7 0.2 -63.9
Ophthalmology 698 10.1 3.8 677 11.3 3.6 -3.0
Psychiatry 1,892 24.8 10.4 2,088 29.6 11.0 10.3
Public health medicine 34 20.0 0.2 52 28.2 0.3 53.4
Radiation oncology 125 24.0 0.7 164 23.1 0.9 31.3
Rehabilitation medicine 170 12.6 0.9 177 20.7 0.9 4.4
Other 263 19.3 1.4 270 24.8 1.4 2.5
Total 15,604 14.5 85.8 17,091 17.2 89.7 9.5
(a) Per 100,000 population, based on ABS estimated resident population figures at 31 December 1995 and 1999.(b) Clinical genetics was not available in the 1995 Medical Labour Force Survey.
Source: Medical Labour Force Surveys, 1995 and 1999.

47
Table A.14: Specialists and specialists-in-training: age and proportion female, Australia, 1995 and1999
Age (years)
Year/Occupation <35 35–44 45–54 55–64 65–74 75+ Total Average age
1995
Specialists 1,021 5,101 5,052 2,857 1,314 258 15,604 49.0
% female 30.3 19.6 11.5 9.1 7.7 4.3 14.5 . .
Specialists-in-training 3,512 673 88 — — — 4,273 31.7
% female 31.3 32.9 37.0 . . . . . . 31.7 . .
1999
Specialists 793 5,459 5,411 3,654 1,444 330 17,091 49.9
% female 36.3 24.2 15.4 10.0 7.1 8.5 17.2 . .
Specialists-in-training 3,647 854 134 4 — — 4,640 32.3
% female 37.9 33.9 47.8 — . . . . 37.4 . .
Source: Medical Labour Force Surveys, 1995 and 1999.
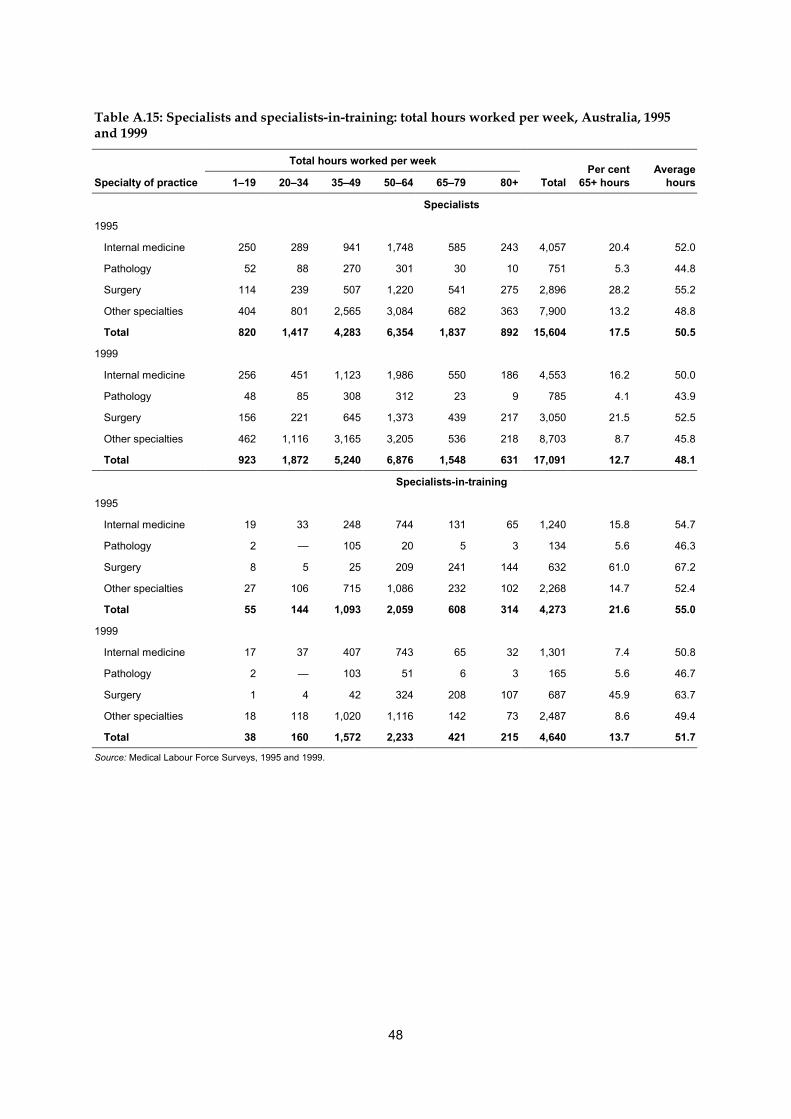
48
Table A.15: Specialists and specialists-in-training: total hours worked per week, Australia, 1995and 1999
Total hours worked per week
Specialty of practice 1–19 20–34 35–49 50–64 65–79 80+ TotalPer cent
65+ hoursAverage
hours
Specialists
1995
Internal medicine 250 289 941 1,748 585 243 4,057 20.4 52.0
Pathology 52 88 270 301 30 10 751 5.3 44.8
Surgery 114 239 507 1,220 541 275 2,896 28.2 55.2
Other specialties 404 801 2,565 3,084 682 363 7,900 13.2 48.8
Total 820 1,417 4,283 6,354 1,837 892 15,604 17.5 50.5
1999
Internal medicine 256 451 1,123 1,986 550 186 4,553 16.2 50.0
Pathology 48 85 308 312 23 9 785 4.1 43.9
Surgery 156 221 645 1,373 439 217 3,050 21.5 52.5
Other specialties 462 1,116 3,165 3,205 536 218 8,703 8.7 45.8
Total 923 1,872 5,240 6,876 1,548 631 17,091 12.7 48.1
Specialists-in-training
1995
Internal medicine 19 33 248 744 131 65 1,240 15.8 54.7
Pathology 2 — 105 20 5 3 134 5.6 46.3
Surgery 8 5 25 209 241 144 632 61.0 67.2
Other specialties 27 106 715 1,086 232 102 2,268 14.7 52.4
Total 55 144 1,093 2,059 608 314 4,273 21.6 55.0
1999
Internal medicine 17 37 407 743 65 32 1,301 7.4 50.8
Pathology 2 — 103 51 6 3 165 5.6 46.7
Surgery 1 4 42 324 208 107 687 45.9 63.7
Other specialties 18 118 1,020 1,116 142 73 2,487 8.6 49.4
Total 38 160 1,572 2,233 421 215 4,640 13.7 51.7
Source: Medical Labour Force Surveys, 1995 and 1999.
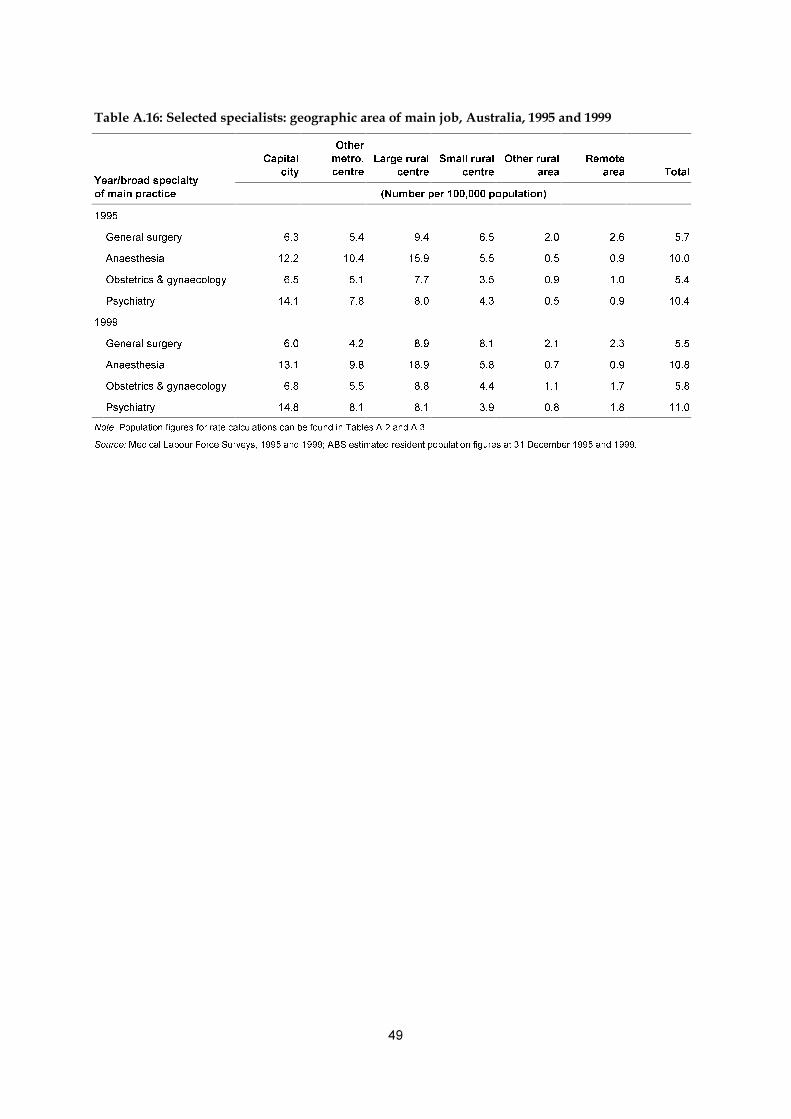
��
�������������� ������� ������������������ �����������������������������������������
&DSLWDO
FLW\
2WKHU
PHWUR�
FHQWUH
/DUJH�UXUDO
FHQWUH
6PDOO�UXUDO
FHQWUH
2WKHU�UXUDO
DUHD
5HPRWH
DUHD 7RWDO<HDU�EURDG�VSHFLDOW\
RI�PDLQ�SUDFWLFH �1XPEHU�SHU���������SRSXODWLRQ�
����
*HQHUDO�VXUJHU\ ��� ��� ��� ��� ��� ��� ���
$QDHVWKHVLD ���� ���� ���� ��� ��� ��� ����
2EVWHWULFV��J\QDHFRORJ\ ��� ��� ��� ��� ��� ��� ���
3V\FKLDWU\ ���� ��� ��� ��� ��� ��� ����
����
*HQHUDO�VXUJHU\ ��� ��� ��� ��� ��� ��� ���
$QDHVWKHVLD ���� ��� ���� ��� ��� ��� ����
2EVWHWULFV��J\QDHFRORJ\ ��� ��� ��� ��� ��� ��� ���
3V\FKLDWU\ ���� ��� ��� ��� ��� ��� ����
1RWH��3RSXODWLRQ�ILJXUHV�IRU�UDWH�FDOFXODWLRQV�FDQ�EH�IRXQG�LQ�7DEOHV�$���DQG�$���
6RXUFH��0HGLFDO�/DERXU�)RUFH�6XUYH\V�������DQG�������$%6�HVWLPDWHG�UHVLGHQW�SRSXODWLRQ�ILJXUHV�DW����'HFHPEHU������DQG������
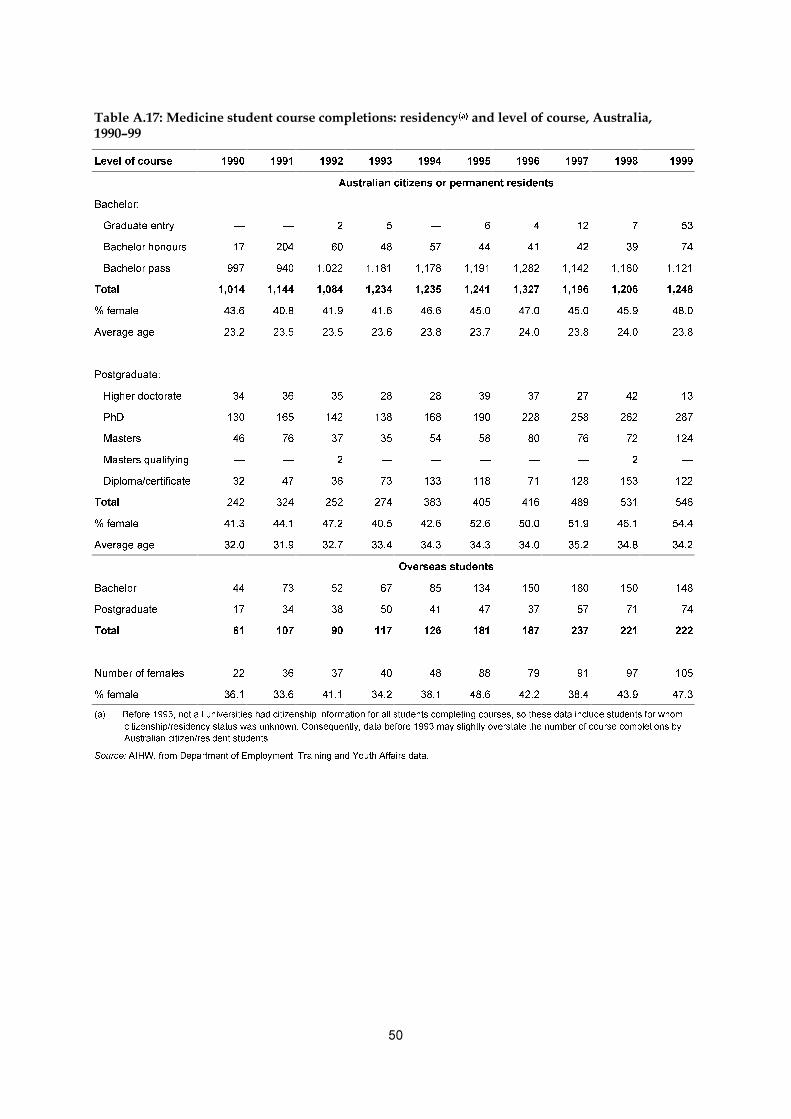
��
������������ ��������� ���������������������������� �����D���� ����������������������������������
/HYHO�RI�FRXUVH ���� ���� ���� ���� ���� ���� ���� ���� ���� ����
$XVWUDOLDQ�FLWL]HQV�RU�SHUPDQHQW�UHVLGHQWV
%DFKHORU�
���*UDGXDWH�HQWU\ ² ² � � ² � � �� � ��
���%DFKHORU�KRQRXUV �� ��� �� �� �� �� �� �� �� ��
���%DFKHORU�SDVV ��� ��� ����� ����� ����� ����� ����� ����� ����� �����
7RWDO ����� ����� ����� ����� ����� ����� ����� ����� ����� �����
��IHPDOH ���� ���� ���� ���� ���� ���� ���� ���� ���� ����
$YHUDJH�DJH ���� ���� ���� ���� ���� ���� ���� ���� ���� ����
3RVWJUDGXDWH�
���+LJKHU�GRFWRUDWH �� �� �� �� �� �� �� �� �� ��
���3K' ��� ��� ��� ��� ��� ��� ��� ��� ��� ���
���0DVWHUV �� �� �� �� �� �� �� �� �� ���
���0DVWHUV�TXDOLI\LQJ ² ² � ² ² ² ² ² � ²
���'LSORPD�FHUWLILFDWH �� �� �� �� ��� ��� �� ��� ��� ���
7RWDO ��� ��� ��� ��� ��� ��� ��� ��� ��� ���
��IHPDOH ���� ���� ���� ���� ���� ���� ���� ���� ���� ����
$YHUDJH�DJH ���� ���� ���� ���� ���� ���� ���� ���� ���� ����
2YHUVHDV�VWXGHQWV
%DFKHORU �� �� �� �� �� ��� ��� ��� ��� ���
3RVWJUDGXDWH �� �� �� �� �� �� �� �� �� ��
7RWDO �� ��� �� ��� ��� ��� ��� ��� ��� ���
1XPEHU�RI�IHPDOHV �� �� �� �� �� �� �� �� �� ���
��IHPDOH ���� ���� ���� ���� ���� ���� ���� ���� ���� ����
�D� %HIRUH�������QRW�DOO�XQLYHUVLWLHV�KDG�FLWL]HQVKLS�LQIRUPDWLRQ�IRU�DOO�VWXGHQWV�FRPSOHWLQJ�FRXUVHV��VR�WKHVH�GDWD�LQFOXGH�VWXGHQWV�IRU�ZKRP
FLWL]HQVKLS�UHVLGHQF\�VWDWXV�ZDV�XQNQRZQ��&RQVHTXHQWO\��GDWD�EHIRUH������PD\�VOLJKWO\�RYHUVWDWH�WKH�QXPEHU�RI�FRXUVH�FRPSOHWLRQV�E\
$XVWUDOLDQ�FLWL]HQ�UHVLGHQW�VWXGHQWV�
6RXUFH��$,+:��IURP�'HSDUWPHQW�RI�(PSOR\PHQW��7UDLQLQJ�DQG�<RXWK�$IIDLUV�GDWD�
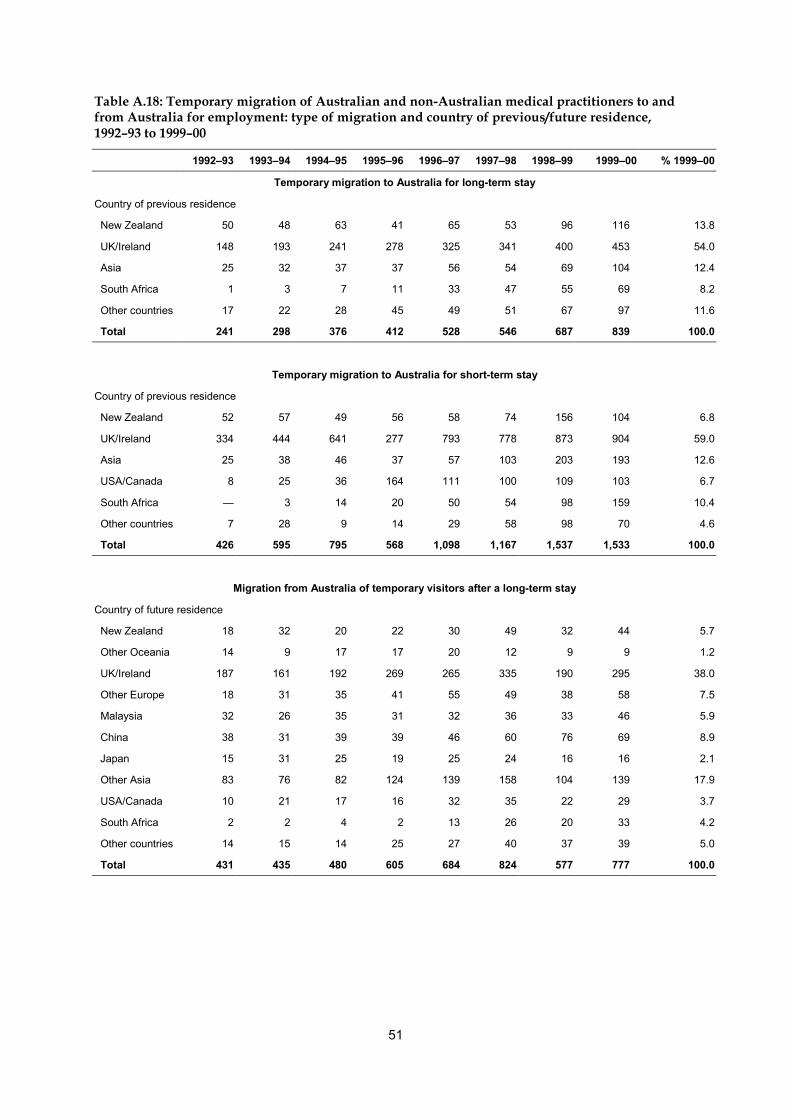
51
Table A.18: Temporary migration of Australian and non-Australian medical practitioners to andfrom Australia for employment: type of migration and country of previous/future residence,1992–93 to 1999–00
1992–93 1993–94 1994–95 1995–96 1996–97 1997–98 1998–99 1999–00 % 1999–00
Temporary migration to Australia for long-term stay
Country of previous residence
New Zealand 50 48 63 41 65 53 96 116 13.8
UK/Ireland 148 193 241 278 325 341 400 453 54.0
Asia 25 32 37 37 56 54 69 104 12.4
South Africa 1 3 7 11 33 47 55 69 8.2
Other countries 17 22 28 45 49 51 67 97 11.6
Total 241 298 376 412 528 546 687 839 100.0
Temporary migration to Australia for short-term stay
Country of previous residence
New Zealand 52 57 49 56 58 74 156 104 6.8
UK/Ireland 334 444 641 277 793 778 873 904 59.0
Asia 25 38 46 37 57 103 203 193 12.6
USA/Canada 8 25 36 164 111 100 109 103 6.7
South Africa — 3 14 20 50 54 98 159 10.4
Other countries 7 28 9 14 29 58 98 70 4.6
Total 426 595 795 568 1,098 1,167 1,537 1,533 100.0
Migration from Australia of temporary visitors after a long-term stay
Country of future residence
New Zealand 18 32 20 22 30 49 32 44 5.7
Other Oceania 14 9 17 17 20 12 9 9 1.2
UK/Ireland 187 161 192 269 265 335 190 295 38.0
Other Europe 18 31 35 41 55 49 38 58 7.5
Malaysia 32 26 35 31 32 36 33 46 5.9
China 38 31 39 39 46 60 76 69 8.9
Japan 15 31 25 19 25 24 16 16 2.1
Other Asia 83 76 82 124 139 158 104 139 17.9
USA/Canada 10 21 17 16 32 35 22 29 3.7
South Africa 2 2 4 2 13 26 20 33 4.2
Other countries 14 15 14 25 27 40 37 39 5.0
Total 431 435 480 605 684 824 577 777 100.0

52
Table A.18 (continued): Temporary migration of Australian and non-Australian medicalpractitioners to and from Australia for employment: type of migration and country ofprevious/future residence, 1992–93 to 1999–2000
1992–93 1993–94 1994–95 1995–96 1996–97 1997–98 1998–99 1999–00 % 1999–00
Migration from Australia of Australian residents for a long-term overseas stay
Country of future residence
New Zealand 9 13 12 17 23 16 13 14 3.4
Other Oceania 26 21 18 24 17 12 10 15 3.6
UK/Ireland 163 140 161 147 147 163 155 150 36.5
Other Europe 11 13 12 17 11 9 12 11 2.7
Middle East 23 21 23 22 14 22 21 22 5.4
Hong Kong 54 56 67 50 72 55 58 53 12.9
Other Asia 39 31 36 45 59 47 40 45 10.9
USA/Canada 101 69 93 87 90 88 93 75 18.2
South Africa 2 5 2 6 — 3 1 5 1.2
Other countries 11 10 10 9 9 15 18 21 5.1
Total 439 379 434 424 442 430 421 411 100.0
Source: AIHW from Department of Immigration and Multiculktural and Indigenous Affairs data.

53
Table A.19: Permanent migration of Australian and non-Australian medical practitioners to andfrom Australia for employment: type of migration and country of previous/future residence,1992–93 to 1999–00
1992–93 1993–94 1994–95 1995–96 1996–97 1997–98 1998–99 1999–00 % 1999–00
Permanent migration to Australia of overseas residents
Country of previous residence
New Zealand 39 49 74 71 63 69 110 260 47.8
Other Oceania 7 5 6 6 5 3 2 3 0.6
UK/Ireland 105 85 119 87 71 44 40 24 4.4
Other Europe 103 55 81 63 59 37 33 35 6.4
Middle East 11 15 22 24 17 16 14 18 3.3
Hong Kong 46 28 31 30 33 7 7 7 1.3
China 25 42 58 186 119 45 65 39 7.2
Other Asia 96 100 110 93 72 71 68 93 17.1
USA/Canada 13 19 13 25 13 19 15 13 2.4
South Africa 12 17 26 16 32 29 25 32 5.9
Other Africa 21 21 14 19 16 13 13 7 1.3
Other countries 2 9 4 6 — 5 16 13 2.4
Total 480 445 558 626 500 358 408 544 100.0
Permanent migration from Australia of Australian residents
Country of future residence
New Zealand 29 34 52 49 51 38 41 60 20.3
Other Oceania 1 1 — 2 2 — 1 3 1.0
UK/Ireland 37 31 41 32 37 46 60 85 28.7
Other Europe 6 9 7 6 4 8 13 12 4.1
Middle East 6 10 4 3 8 6 8 9 3.0
Asia 29 37 36 29 41 52 77 79 26.7
USA/Canada 22 25 13 27 15 21 26 43 14.5
Other countries 3 4 1 5 4 2 6 5 1.7
Total 133 151 154 153 162 173 232 296 100.0
Net permanent immigration
Country of residence
New Zealand 10 15 22 22 12 31 69 200 . .
Other Oceania 6 4 6 4 3 3 1 — . .
UK/Ireland 68 54 78 55 34 –2 –20 –61 . .
Other Europe 97 46 74 57 55 29 20 23 . .
Middle East 5 5 18 21 9 10 6 9 . .
Asia 138 133 163 280 183 71 63 60 . .
USA/Canada –9 –6 — –2 –2 –2 –11 –30 . .
Other countries 32 43 43 36 44 45 48 47 . .
Total 347 294 404 473 338 185 176 248 . .Source: AIHW from Department of Immigration and Multiculktural and Indigenous Affairs data.
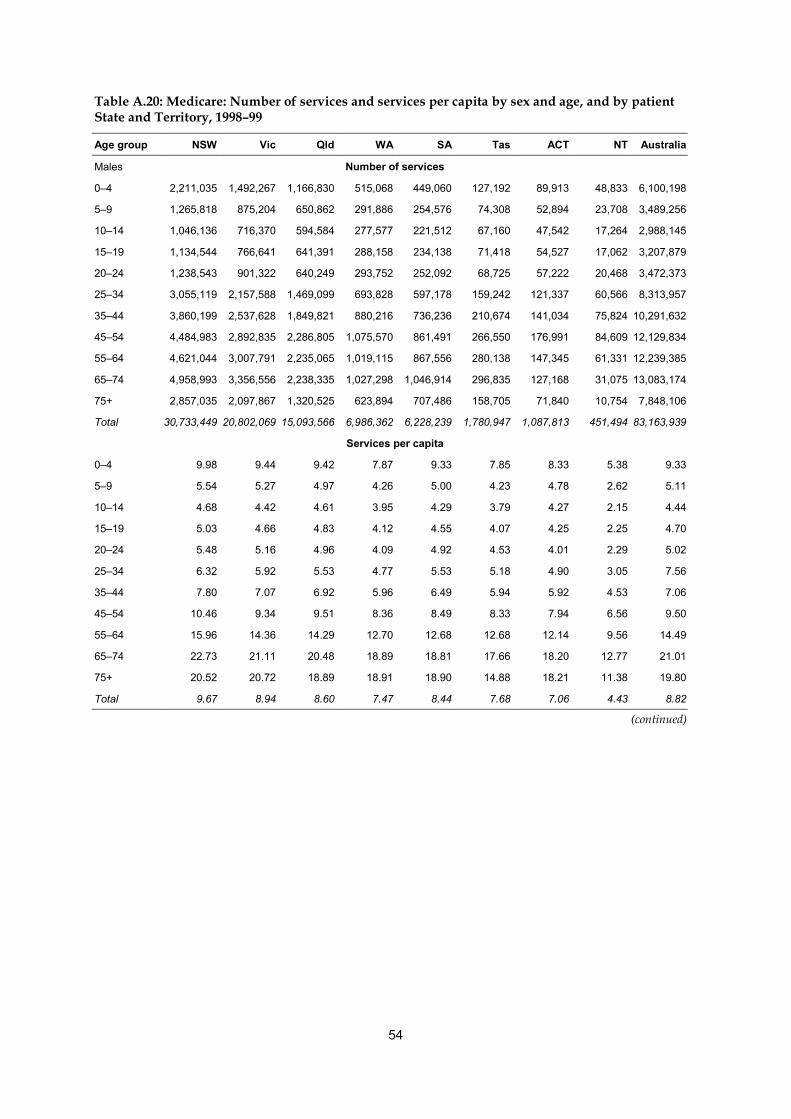
54
Table A.20: Medicare: Number of services and services per capita by sex and age, and by patientState and Territory, 1998–99
Age group NSW Vic Qld WA SA Tas ACT NT Australia
Males Number of services
0–4 2,211,035 1,492,267 1,166,830 515,068 449,060 127,192 89,913 48,833 6,100,198
5–9 1,265,818 875,204 650,862 291,886 254,576 74,308 52,894 23,708 3,489,256
10–14 1,046,136 716,370 594,584 277,577 221,512 67,160 47,542 17,264 2,988,145
15–19 1,134,544 766,641 641,391 288,158 234,138 71,418 54,527 17,062 3,207,879
20–24 1,238,543 901,322 640,249 293,752 252,092 68,725 57,222 20,468 3,472,373
25–34 3,055,119 2,157,588 1,469,099 693,828 597,178 159,242 121,337 60,566 8,313,957
35–44 3,860,199 2,537,628 1,849,821 880,216 736,236 210,674 141,034 75,824 10,291,632
45–54 4,484,983 2,892,835 2,286,805 1,075,570 861,491 266,550 176,991 84,609 12,129,834
55–64 4,621,044 3,007,791 2,235,065 1,019,115 867,556 280,138 147,345 61,331 12,239,385
65–74 4,958,993 3,356,556 2,238,335 1,027,298 1,046,914 296,835 127,168 31,075 13,083,174
75+ 2,857,035 2,097,867 1,320,525 623,894 707,486 158,705 71,840 10,754 7,848,106
Total 30,733,449 20,802,069 15,093,566 6,986,362 6,228,239 1,780,947 1,087,813 451,494 83,163,939
Services per capita
0–4 9.98 9.44 9.42 7.87 9.33 7.85 8.33 5.38 9.33
5–9 5.54 5.27 4.97 4.26 5.00 4.23 4.78 2.62 5.11
10–14 4.68 4.42 4.61 3.95 4.29 3.79 4.27 2.15 4.44
15–19 5.03 4.66 4.83 4.12 4.55 4.07 4.25 2.25 4.70
20–24 5.48 5.16 4.96 4.09 4.92 4.53 4.01 2.29 5.02
25–34 6.32 5.92 5.53 4.77 5.53 5.18 4.90 3.05 7.56
35–44 7.80 7.07 6.92 5.96 6.49 5.94 5.92 4.53 7.06
45–54 10.46 9.34 9.51 8.36 8.49 8.33 7.94 6.56 9.50
55–64 15.96 14.36 14.29 12.70 12.68 12.68 12.14 9.56 14.49
65–74 22.73 21.11 20.48 18.89 18.81 17.66 18.20 12.77 21.01
75+ 20.52 20.72 18.89 18.91 18.90 14.88 18.21 11.38 19.80
Total 9.67 8.94 8.60 7.47 8.44 7.68 7.06 4.43 8.82
(continued)
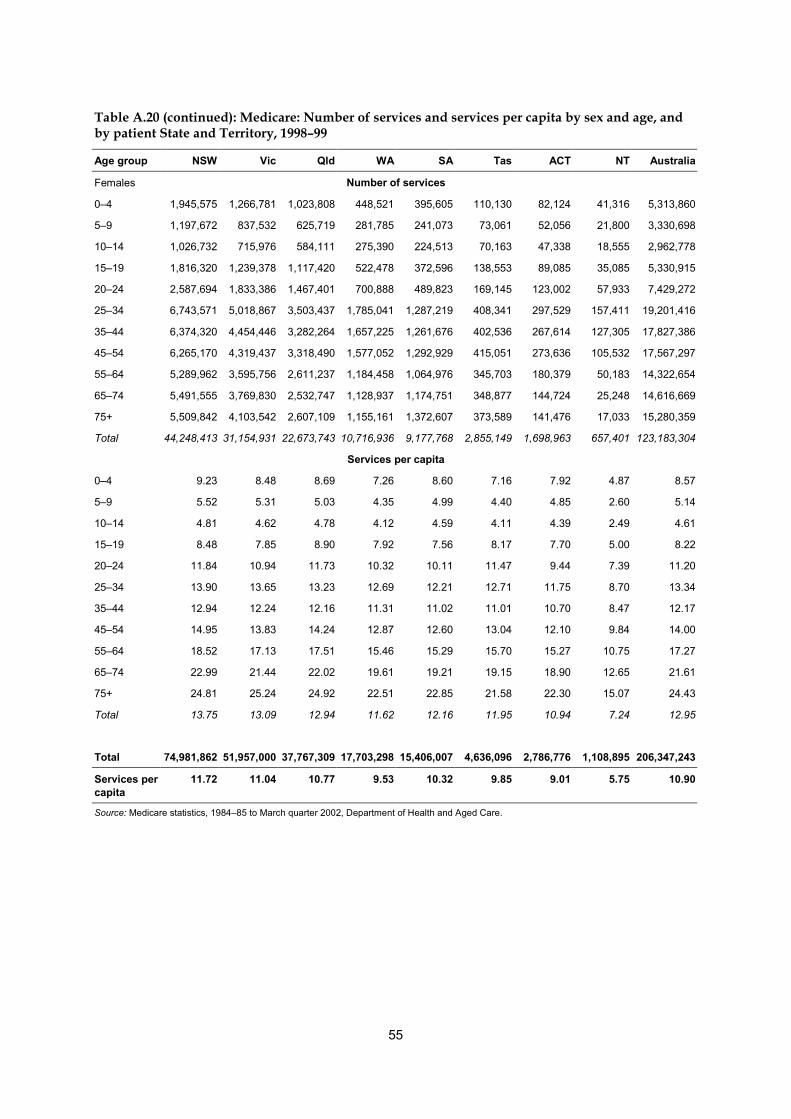
55
Table A.20 (continued): Medicare: Number of services and services per capita by sex and age, andby patient State and Territory, 1998–99
Age group NSW Vic Qld WA SA Tas ACT NT Australia
Females Number of services
0–4 1,945,575 1,266,781 1,023,808 448,521 395,605 110,130 82,124 41,316 5,313,860
5–9 1,197,672 837,532 625,719 281,785 241,073 73,061 52,056 21,800 3,330,698
10–14 1,026,732 715,976 584,111 275,390 224,513 70,163 47,338 18,555 2,962,778
15–19 1,816,320 1,239,378 1,117,420 522,478 372,596 138,553 89,085 35,085 5,330,915
20–24 2,587,694 1,833,386 1,467,401 700,888 489,823 169,145 123,002 57,933 7,429,272
25–34 6,743,571 5,018,867 3,503,437 1,785,041 1,287,219 408,341 297,529 157,411 19,201,416
35–44 6,374,320 4,454,446 3,282,264 1,657,225 1,261,676 402,536 267,614 127,305 17,827,386
45–54 6,265,170 4,319,437 3,318,490 1,577,052 1,292,929 415,051 273,636 105,532 17,567,297
55–64 5,289,962 3,595,756 2,611,237 1,184,458 1,064,976 345,703 180,379 50,183 14,322,654
65–74 5,491,555 3,769,830 2,532,747 1,128,937 1,174,751 348,877 144,724 25,248 14,616,669
75+ 5,509,842 4,103,542 2,607,109 1,155,161 1,372,607 373,589 141,476 17,033 15,280,359
Total 44,248,413 31,154,931 22,673,743 10,716,936 9,177,768 2,855,149 1,698,963 657,401 123,183,304
Services per capita
0–4 9.23 8.48 8.69 7.26 8.60 7.16 7.92 4.87 8.57
5–9 5.52 5.31 5.03 4.35 4.99 4.40 4.85 2.60 5.14
10–14 4.81 4.62 4.78 4.12 4.59 4.11 4.39 2.49 4.61
15–19 8.48 7.85 8.90 7.92 7.56 8.17 7.70 5.00 8.22
20–24 11.84 10.94 11.73 10.32 10.11 11.47 9.44 7.39 11.20
25–34 13.90 13.65 13.23 12.69 12.21 12.71 11.75 8.70 13.34
35–44 12.94 12.24 12.16 11.31 11.02 11.01 10.70 8.47 12.17
45–54 14.95 13.83 14.24 12.87 12.60 13.04 12.10 9.84 14.00
55–64 18.52 17.13 17.51 15.46 15.29 15.70 15.27 10.75 17.27
65–74 22.99 21.44 22.02 19.61 19.21 19.15 18.90 12.65 21.61
75+ 24.81 25.24 24.92 22.51 22.85 21.58 22.30 15.07 24.43
Total 13.75 13.09 12.94 11.62 12.16 11.95 10.94 7.24 12.95
Total 74,981,862 51,957,000 37,767,309 17,703,298 15,406,007 4,636,096 2,786,776 1,108,895 206,347,243
Services percapita
11.72 11.04 10.77 9.53 10.32 9.85 9.01 5.75 10.90
Source: Medicare statistics, 1984–85 to March quarter 2002, Department of Health and Aged Care.

56
Table A.21: Estimated yearly losses of medicalpractitioners from retirement or death, Australia,1995 and 1999
Age (years) 1995 1999
55–58 2,750 3,721
59–62 2,102 2,636
63–66 1,868 1,864
67–70 1,568 1,480
71–74 881 1,175
75+(a) 0 0
Total losses 2,013
(a) Assumes all practitioners aged 75+ are effectively retired.
57
Glossary
AgeThe number of completed years from year of birth to the year of the survey.
ClinicianA medical practitioner who is involved in the diagnosis and/or treatment of patients,including recommending preventative action. In this publication, a medical practitioner whoengages in clinical practice in any job is classified as a clinician.
CountryThe Australian Standard Classification of Countries for Social Statistics (ABS 1990) has been usedto classify country of initial qualification into the following categories:1. Australia2. New Zealand3. United Kingdom and Ireland: England, Scotland, Wales, Northern Ireland, Ireland4. Asia: Brunei, Cambodia, Indonesia, Laos, Malaysia, Myanmar, the Philippines,
Singapore, Thailand, Viet Nam, People’s Republic of China, Hong Kong, Japan,Democratic People’s Republic of Korea (North Korea), Republic of Korea (SouthKorea), Macau, Mongolia, Taiwan, Afghanistan, Bangladesh, Bhutan, India, Maldives,Nepal, Pakistan, Sri Lanka
5. Other countries: all countries not specified above.
Deputising serviceA medical practitioner, or group of practitioners, who provides after-hours primary care, butnot continuing care, to the patients of the subscribing primary care medical practitioners.
General practitioner (RACGP) traineesA medical practitioner under the supervision of an RACGP fellow in a job recognised asleading to the RACGP Fellowship. The Health Insurance Commission classifies thesetrainees as vocationally registered general practitioners in the Medicare data in this report.See also Vocationally registered general practitioner.
Geographic region classificationThe Rural, Remote and Metropolitan Areas Classification (Department of Primary Industries andEnergy & Department of Health and Family Services 1994) has been used to classify thegeographic location of medical practitioners responding to the annual survey. Thegeographic boundaries of these categories are based on the 1991 population census. Theclasses of geographic location are listed below.
58
Metropolitan areas1. Capital cities consist of the State and Territory capital cities: Sydney, Melbourne,
Brisbane, Perth, Adelaide, Hobart, Darwin and Canberra.2. Other metropolitan centres consist of one or more statistical subdivisions that have an
urban centre of population of 100,000 or more: Newcastle, Wollongong, Queanbeyan(part of Canberra–Queanbeyan), Geelong, Gold Coast–Tweed Heads, Townsville–Thuringowa.
Rural zone3. Large rural centres are statistical local areas where most of the population reside in urban
centres of population of 25,000 to 99,999. These centres are: Albury–Wodonga, Dubbo,Lismore, Orange, Port Macquarie, Tamworth, Wagga Wagga (NSW); Ballarat, Bendigo,Shepparton–Mooroopna (Vic); Bundaberg, Cairns, Mackay, Maroochydore–Mooloolaba,Rockhampton, Toowoomba (Qld); Whyalla (SA); and Launceston (Tas).
4. Small rural centres are statistical local areas in rural zones containing urban centres ofpopulation between 10,000 and 24,999. These centres are Armidale, Ballina, Bathurst,Broken Hill, Casino, Coffs Harbour, Echuca–Moama, Forster–Tuncurry, Goulburn,Grafton, Griffith, Lithgow, Moree Plains, Muswellbrook, Nowra–Bombaderry,Singleton, Taree (NSW); Bairnsdale, Colac, Echuca–Moama, Horsham, Mildura, Moe–Yallourn, Morwell, Ocean Grove–Barwon Heads, Portland, Sale, Traralgon, Wangaratta,Warrnambool (Vic); Caloundra, Gladstone, Gympie, Hervey Bay, Maryborough,Tewantin–Noosa, Warwick (Qld); Mount Gambier, Murray Bridge, Port Augusta, PortLincoln, Port Pirie (SA); Albany, Bunbury, Geraldton, Mandurah (WA); and Burnie–Somerset, Devonport (Tas).
5. Other rural areas are the remaining statistical areas within the rural zone. Examples areCowra Shire, Temora Shire, Guyra Shire (NSW); Ararat Shire, Cobram Shire (Vic);Cardwell Shire, Whitsunday Shire (Qld); Barossa, Pinnaroo (SA); Moora Shire, YorkShire (WA); George Town, Ross (Tas); and Coomalie, Litchfield (NT).
Remote zoneThese are generally less densely populated than rural statistical local areas and are hundredsof kilometres from a major urban centre. Data in this publication are reported for the zonewhich comprises the two areas shown below.6. Remote centres are statistical local areas in the remote zone containing urban centres of
population of 5,000 or more: Blackwater, Bowen, Emerald, Mareeba, Moranbah, MountIsa, Roma (Qld); Broome, Carnarvon, East Pilbara, Esperance, Kalgoorlie/Boulder, PortHedland, Karratha (WA); and Alice Springs, Katherine (NT).
7. Other remote areas are the remaining areas within the remote zone. Examples are:Balranald, Bourke, Cobar, Lord Howe Island (NSW); French Island, Orbost, Walpeup(Vic); Aurukun, Longreach, Quilpie (Qld); Coober Pedy, Murat Bay, Roxby Downs (SA);Coolgardie, Exmouth, Laverton, Shark Bay (WA); King Island, Strahan (Tas); Daly,Jabiru, Nhulunbuy (NT).
Hospital non-specialistMedical practitioners mainly employed in a salaried position in a hospital who do not have arecognised specialist qualification and who are not undertaking a training program to gain arecognised specialist qualification. They include resident medical officers and interns andother salaried hospital career practitioners and exclude specialists-in-training.

59
Hours workedThe hours per week that were self-reported by responding medical practitioners as theaverage hours worked in each medical-related job over the four weeks before the survey.Hours worked exclude time spent on travel between work locations (except travel to call-outs) and voluntary professional activities. In the editing of survey responses, maximumhours worked in all jobs have been limited to 126 hours per week.
InternA resident medical practitioner working in a hospital, usually in the first year of service aftergraduating from medical school.
Locum tenensA medical practitioner who acts as a substitute for another medical practitioner while thatpractitioner is temporarily absent from their practice.
Main jobThe job and location in which a practitioner spends the most time. The medical labour forcesurvey has provision for a practitioner to report up to three jobs. These jobs may be similarwork in separate locations, for example, a city specialist practice and an outreach practice inrural areas, or different medical-related jobs, for example, a clinical practice and teachingmedicine at a university.
Medical labour forceDefined for each State and Territory as:• registered medical practitioners employed in medicine; plus• registered medical practitioners not employed in medicine but looking for work in
medicine.
Medical practitioners employed in medicineA registered medical practitioner in an occupation that uses the skills and knowledge of theperson’s medical qualification. This category includes those on maternity or other extendedleave of three months or more.
Mental health-related separationsMental health-related separations from hospital include all separations with a mental health-related principal diagnosis. Separations with specialised psychiatric care occur if the patientis reported as having one or more days in a psychiatric hospital or in a specialisedpsychiatric unit of an acute care hospital.

60
OccupationA description of the job function within the field of medicine of a person with medicalqualifications. The occupations are:• clinician: a medical practitioner mainly involved in the care and treatment of individuals,
including diagnosis and preventative action;• administrator: a person mainly employed in medical administration;• teacher/educator: a person teaching or training persons in medicine for their initial
qualification or in advanced skills after initial qualification;• researcher: a person primarily engaged in medical research;• public health physician: a medical practitioner primarily engaged in identifying disease
and illness and the conditions for disease and illness, and in implementing preventativemeasures which affect the health of the general public;
• occupational health physician: a medical practitioner primarily engaged in identifyingdisease and illness, and the conditions for disease and illness, and implementingpreventative measures which arise from employment in particular occupations orindustries; and
• other: a job function in medicine which is not one of the above—for example, industrialrelations.
Other salaried hospital career practitionerGenerally, a medical practitioner who mainly works in a hospital after completing allprofessional training and who is referred to as a career medical officer (CMO) or hospitalmedical officer (HMO) in most States. This category includes some practitioners who havecompleted an internship and have been registered to practise under supervision.
Overseas-trained doctor (OTD)A person who obtained an initial medical qualification in a country other than Australia. Thequalification must be recognised as equivalent to an Australian medical qualification for theperson to obtain registration as a medical practitioner in Australia.
Primary care practitionerA practitioner engaged in general practice or in the primary care of patients. This categoryincludes practitioners recognised by Medicare as VRGPs, RACGP Fellows, RACGP traineesand other medical practitioners whose main practice is unreferred patient attendances.
Resident medical officer (RMO)A medical practitioner undergoing further training in a hospital after completing aninternship but who has not commenced a recognised general practice or specialist practicetraining program.

61
Separations (hospital)‘Separation’ refers to the process by which an admitted patient completes an episode of careby being discharged, dying, transferring to another hospital or changing type of care. Detailsof the episode of care are not recorded when a patient is admitted for two main reasons:• Patients are not always in a position to provide their personal details when they are
admitted• All information about the treatment received by a patient and their outcomes is known at
the time of separation.Separation can occur on several occasions for any one person.
SpecialistA medical practitioner with a qualification awarded by, or which equates to that awardedby, the relevant specialist professional college in Australia. Specialist recognition is normallybased on the completion of a program of appropriate supervised training covering aminimum of six years after initial medical graduation and an examination leading to theaward of a higher qualification.The Health Insurance Commission recognises as a specialist a medical practitioner who hasmade formal application for recognition as a specialist and who:• is registered as a specialist under State or Territory law; or• holds a fellowship of a specified specialist college; or• is considered eligible for recognition as a specialist or consultant physician by a
specialist recognition advisory committee.Where a medical practitioner has been recognised as a specialist or consultant physician forthe purposes of the Health Insurance Act, Medicare benefits are payable at the appropriatehigher rate for certain services rendered in the practice of the specialty, provided the patienthas been referred by:• another medical practitioner; or• a registered dental practitioner, where the referral arises out of a dental service; or• a registered optometrist, where the specialist is an ophthalmologist.
Specialist-in-trainingA medical practitioner who has been accepted by a specialist medical college into a trainingposition supervised by a member of the college.
Temporary resident doctor (TRD)A citizen of another country who has an immigration visa enabling them to be employed as amedical practitioner in Australia. The person’s qualifications must be recognised forconditional registration by the relevant State medical board.
Vocationally registered general practitioner (VRGP)A primary care practitioner who has been registered by the Health Insurance Commission asa recognised general practitioner. The criteria for registration as a vocationally registeredgeneral practitioner are certification from either the Royal Australian College of General
62
Practitioners, a Vocational Registration Eligibility Committee, or the Vocational RegistrationAppeal Committee, that the practitioner’s medical practice is predominantly generalpractice, and that the practitioner has appropriate training and experience in generalpractice.In assessing whether a practitioner’s medical practice is predominantly general practice, onlyservices eligible for Medicare benefits are considered. To qualify, 50% of the clinical time andservices claimed against Medicare must be in general practice as defined. The RACGP andVocational Registration Eligibility Committee or Vocational Registration Appeal Committeewill have regard to whether the practitioner provides a comprehensive primary medicalservice, including: treating a wide range of patients and conditions using a variety ofaccepted skills and techniques; providing services away from the practitioner’s surgery onrequest (for example, home visits); and making appropriate provision for the practitioner’spatients to have access to after-hours medical care.The training and experience which the RACGP regards as appropriate for eligibility is theattainment of Fellowship of the RACGP or other postgraduate qualifications and training ofa standard equivalent to that accepted for the award of the Fellowship.Continued vocational registration depends on the practitioner’s involvement in appropriatecontinuing medical education and quality assurance programs approved by the RACGP, andon the practitioner continuing to work predominantly in general practice.
Work settingThe functional use of the premises where a medical job is located.

63
ReferencesAustralian Bureau of Statistics (ABS) 1990. Australian Classification of Countries for SocialStatistics. ABS Cat. no. 1269.0. Canberra: ABS.Australian Bureau of Statistics (ABS) 1997. National Health Survey: summary of results,Australia. ABS Cat. no. 4368.0. Canberra: ABS.Australian Bureau of Statistics (ABS) 1995. Labour force, Australia, January 1995–December1995. ABS Cat. No. 6203.0. Canberra: ABS.Australian Bureau of Statistics (ABS) 1997. National Health Survey: summary of results,States and Territories, 1995. ABS Cat. no. 4368.0. Canberra: ABS.Australian Bureau of Statistics (ABS) 1999. Australian social trends 1999. ABS Cat. no. 4102.0.Canberra: ABS.Australian Bureau of Statistics (ABS) 1999b. Labour force, Australia, January 1999–December1999. ABS Cat. No. 6203.0. Canberra: ABS.Australian Bureau of Statistics (ABS) 2000. Australian social trends 2000. ABS Cat. no. 4102.0.Canberra: ABS.Australian Bureau of Statistics (ABS) 2001. National Health Survey: summary of results 2001.ABS Cat. No. 4364.0. Canberra: ABS.Australian Institute of Health and Welfare (AIHW) 1997. Medical labour force 1995. AIHWCat. no. HWL 5. Canberra: AIHW (National Health Labour Force Series No. 10).Australian Institute of Health and Welfare (AIHW) 2002. Mental health services in Australia1999–2000. Canberra: AIHW (Mental Health Series No. 3).Australian Medical Association (AMA) [online]. 2002 [cited 23 April 2002]. Available fromInternet: URL: http://domino.ama.com.au/AMAWeb/IRRemun.nsf/Safe+HoursAustralian Medical Workforce Advisory Committee (AMWAC) 1999. Temporary residentdoctors in Australia. AMWAC Report 1999.3. Sydney: J.B. Waldegrave.Australian Medical Workforce Advisory Committee (AMWAC) 2000. Annual report1999–2000. AMWAC Report 2000.5. Sydney: Copybook.Department of Health and Aged Care (DHAC) 2000. General Practice in Australia: 2000.Canberra: Pirie Printers.Department of Primary Industries and Energy & Department of Health and Family Services1994. The Rural, Remote and Metropolitan Areas Classification. Canberra: AGPS.Goh L, Cameron PA & Mark P 1999. Burnout in emergency physicians and trainees inAustralia. Emergency Medicine 11:250–257.Maslach C, Schaufeli WB & Leiter MP 2001. Job burnout. Annual Reviews in Psychology52:397–422.McManus IC, Winder BC & Gordon D 2002. The causal links between stress and burnout in alongitudinal study of UK doctors. The Lancet 359:2089–2090.Medical Training Review Panel (MTRP) 2000. Medical Training Review Panel fourth report.Canberra: Paragon Printers.Winefield HR & Veale BM 2002. Work stress and quality of work performance in Australiangeneral practitioners. Australian Journal of Primary Health 8:59–65.
64
Related publications
National health labour force seriesNo. 1: Pharmacy labour force 1992No. 2: Podiatry labour force 1992No. 3: Medical labour force 1992–93No. 4: Physiotherapy labour force 1993No. 5: Pharmacy labour force 1993No. 6: Medical labour force 1994No. 7: Podiatry labour force 1994No. 8: Pharmacy labour force 1994No. 9: Nursing labour force 1993 and 1994No. 10: Medical labour force 1995No. 11: Nursing labour force 1995No. 12: Pharmacy labour force 1995No. 13: Medical labour force 1996No. 14: Nursing labour force 1998No. 15: Medical labour force 1997No. 16: Medical labour force 1998No. 17: Pharmacy labour force 1998No. 18: Optometrist labour force 1999No. 19: Health and community services labour force 1996No. 20: Nursing labour force 1999No. 21: Occupational therapy labour force 1998No. 22: Physiotherapy labour force 1998No. 23: Podiatry labour force 1999
Australia’s health seriesAustralia’s health 1994Australia’s health 1996Australia’s health 1998Australia’s health 2000
Internet accessA selection of material produced by the AIHW is published on the Internet(http://www.aihw.gov.au).