Embed Size (px)
Citation preview
Medical Device Industry Salary Report –National Trends and a Regional Case Study
MassMEDIC
Ed Speidel, Senior Vice President
Rob Surdel, Assistant Vice President
October 16, 2009
1
Today’s Agenda> Who we are
> Macroeconomic conditions
> State of the workforce
> 2010 Salary planning
> Pay evolution- Cash compensation
- Equity compensation
> Case study
2
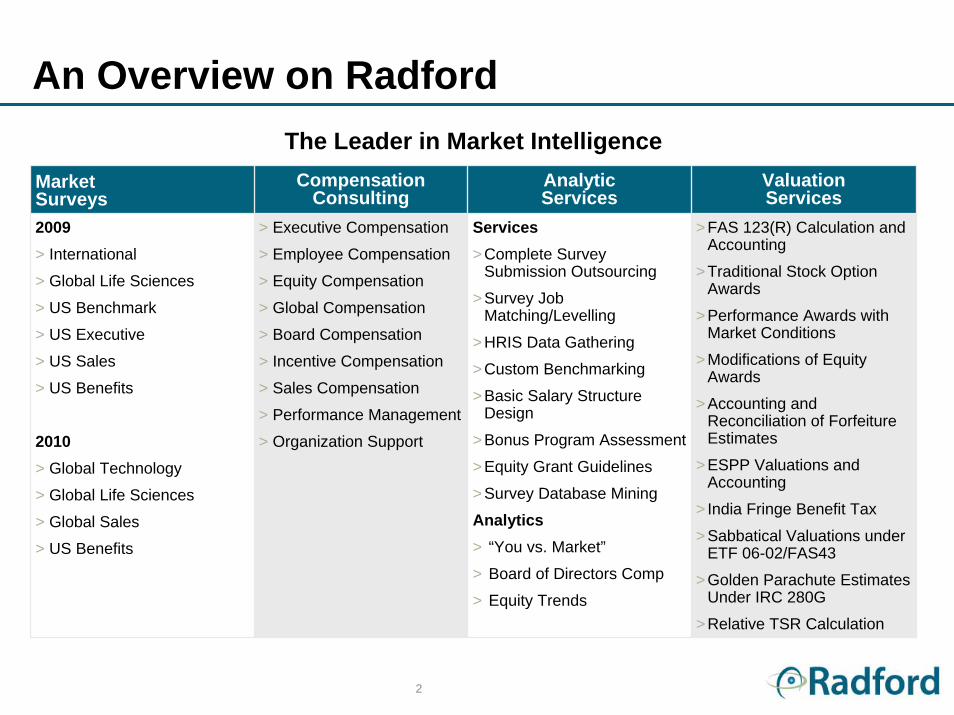
The Leader in Market IntelligenceMarket Surveys
Compensation Consulting
Analytic Services
Valuation Services
2009> International
> Global Life Sciences
> US Benchmark
> US Executive
> US Sales
> US Benefits
2010> Global Technology
> Global Life Sciences
> Global Sales
> US Benefits
> Executive Compensation
> Employee Compensation
> Equity Compensation
> Global Compensation
> Board Compensation
> Incentive Compensation
> Sales Compensation
> Performance Management
> Organization Support
Services>Complete Survey
Submission Outsourcing
>Survey Job Matching/Levelling
>HRIS Data Gathering
>Custom Benchmarking
>Basic Salary Structure Design
>Bonus Program Assessment
>Equity Grant Guidelines
>Survey Database Mining
Analytics> “You vs. Market”
> Board of Directors Comp
> Equity Trends
>FAS 123(R) Calculation and Accounting
>Traditional Stock Option Awards
>Performance Awards with Market Conditions
>Modifications of Equity Awards
>Accounting and Reconciliation of Forfeiture Estimates
>ESPP Valuations and Accounting
> India Fringe Benefit Tax
>Sabbatical Valuations under ETF 06-02/FAS43
>Golden Parachute Estimates Under IRC 280G
>Relative TSR Calculation
An Overview on Radford
3
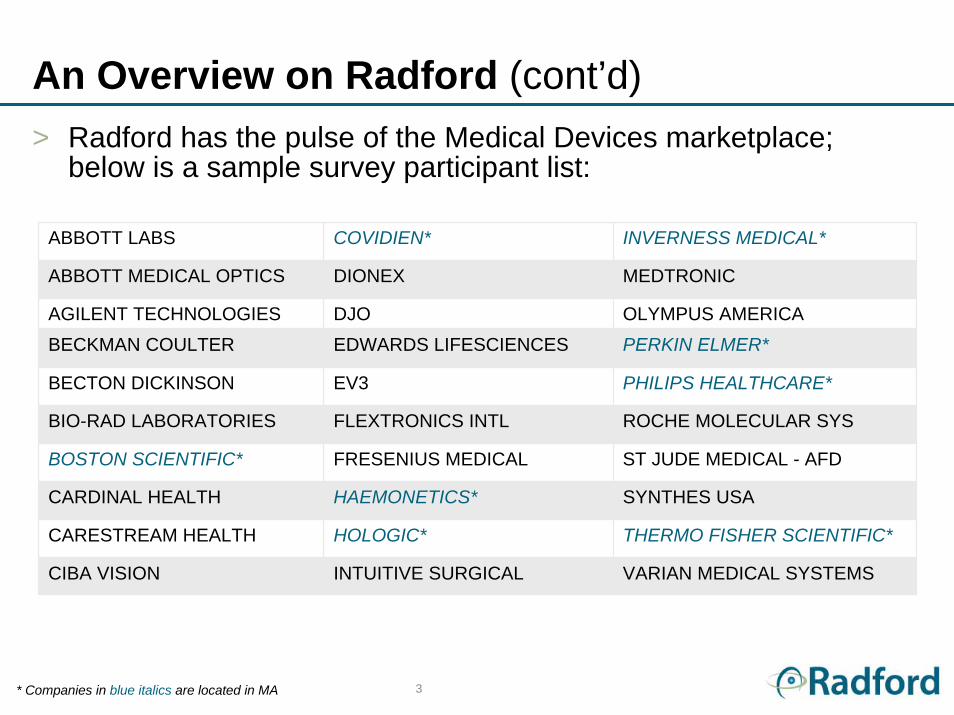
An Overview on Radford (cont’d)> Radford has the pulse of the Medical Devices marketplace;
below is a sample survey participant list:
ABBOTT LABS COVIDIEN* INVERNESS MEDICAL*
ABBOTT MEDICAL OPTICS DIONEX MEDTRONIC
AGILENT TECHNOLOGIES DJO OLYMPUS AMERICABECKMAN COULTER EDWARDS LIFESCIENCES PERKIN ELMER*
BIO-RAD LABORATORIES FLEXTRONICS INTL ROCHE MOLECULAR SYS
BOSTON SCIENTIFIC* FRESENIUS MEDICAL ST JUDE MEDICAL - AFD
CARDINAL HEALTH HAEMONETICS* SYNTHES USA
CARESTREAM HEALTH HOLOGIC* THERMO FISHER SCIENTIFIC*
CIBA VISION INTUITIVE SURGICAL VARIAN MEDICAL SYSTEMS
BECTON DICKINSON EV3 PHILIPS HEALTHCARE*
* Companies in blue italics are located in MA

Macroeconomic Conditions
5
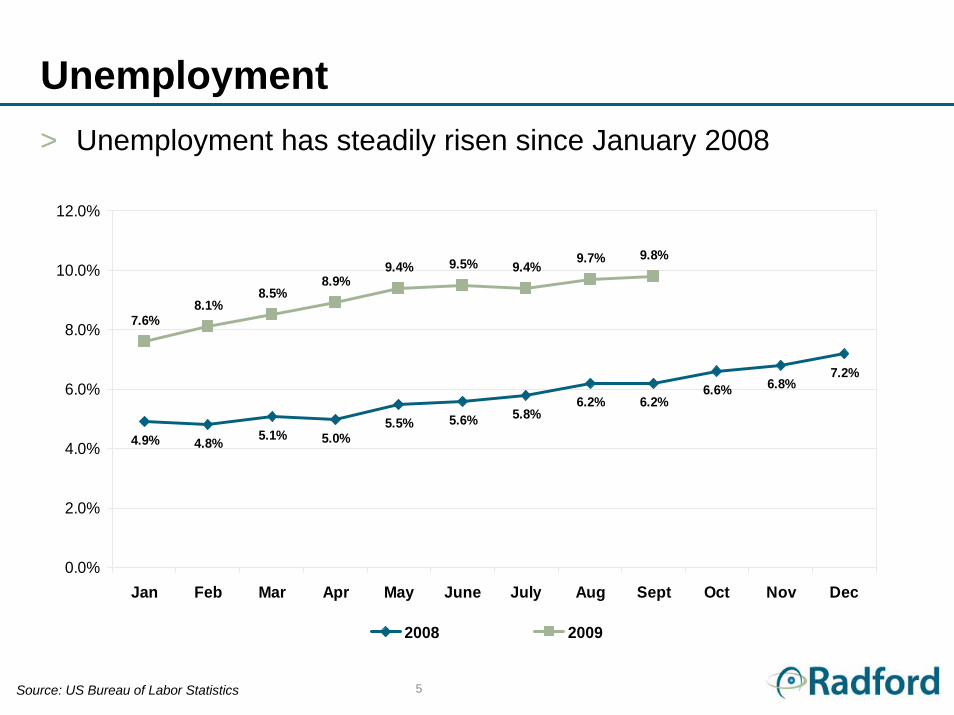
Unemployment
4.9% 4.8% 5.1% 5.0%5.5% 5.6% 5.8%
6.2% 6.2%6.6% 6.8%
7.2%
7.6%8.1%
8.5%8.9%
9.4% 9.5% 9.4%9.7% 9.8%
0.0%
2.0%
4.0%
6.0%
8.0%
10.0%
12.0%
Jan Feb Mar Apr May June July Aug Sept Oct Nov Dec
2008 2009
> Unemployment has steadily risen since January 2008
Source: US Bureau of Labor Statistics

State of the Workforce
7
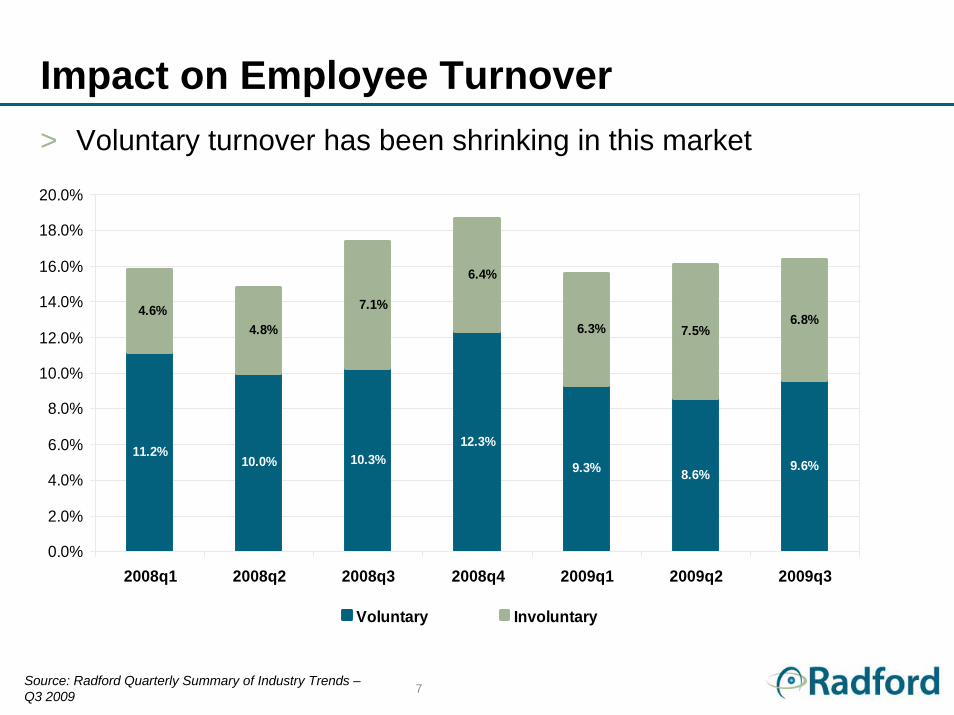
Impact on Employee Turnover> Voluntary turnover has been shrinking in this market
11.2%10.0% 10.3%
12.3%
9.3% 8.6% 9.6%
7.5%6.8%
6.3%
6.4%
7.1%
4.8%4.6%
0.0%
2.0%
4.0%
6.0%
8.0%
10.0%
12.0%
14.0%
16.0%
18.0%
20.0%
2008q1 2008q2 2008q3 2008q4 2009q1 2009q2 2009q3
Voluntary Involuntary
Source: Radford Quarterly Summary of Industry Trends –Q3 2009
8
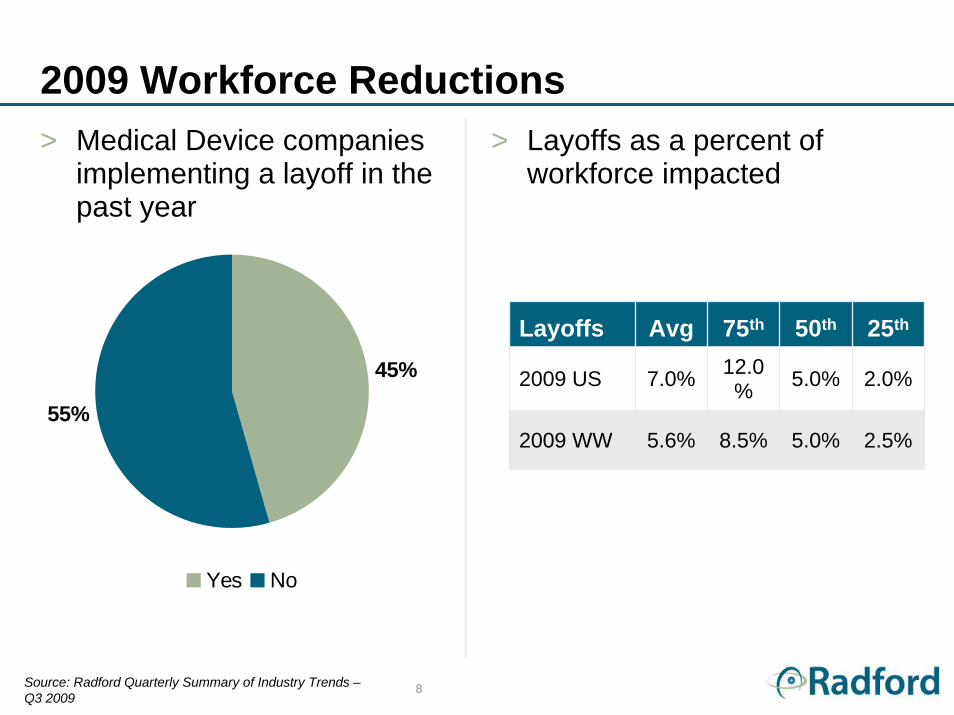
2009 Workforce Reductions> Medical Device companies
implementing a layoff in the past year
> Layoffs as a percent of workforce impacted
45%
55%
Yes No
Layoffs Avg 75th 50th
7.0% 5.0%
5.0%2009 WW 5.6% 8.5% 2.5%
25th
2009 US 12.0% 2.0%
Source: Radford Quarterly Summary of Industry Trends –Q3 2009

Salary Planning
10
Controlling Cash1) Salary
> Most companies provided increases, but some excluded executives and others only funded a nominal adjustment pool
2) Cash incentives> Very few companies report structural changes to their program> More than half of companies expect payouts to be comparable to
prior years> Some are considering paying bonuses using a combination of
cash and stock> 14% of companies report suspending their bonus plans for next
year
Sources: 2009 Custom Survey – Managing Compensation in a Downturn Economy; and Radford Quarterly Summary of Industry Trends – Q3 2009
11
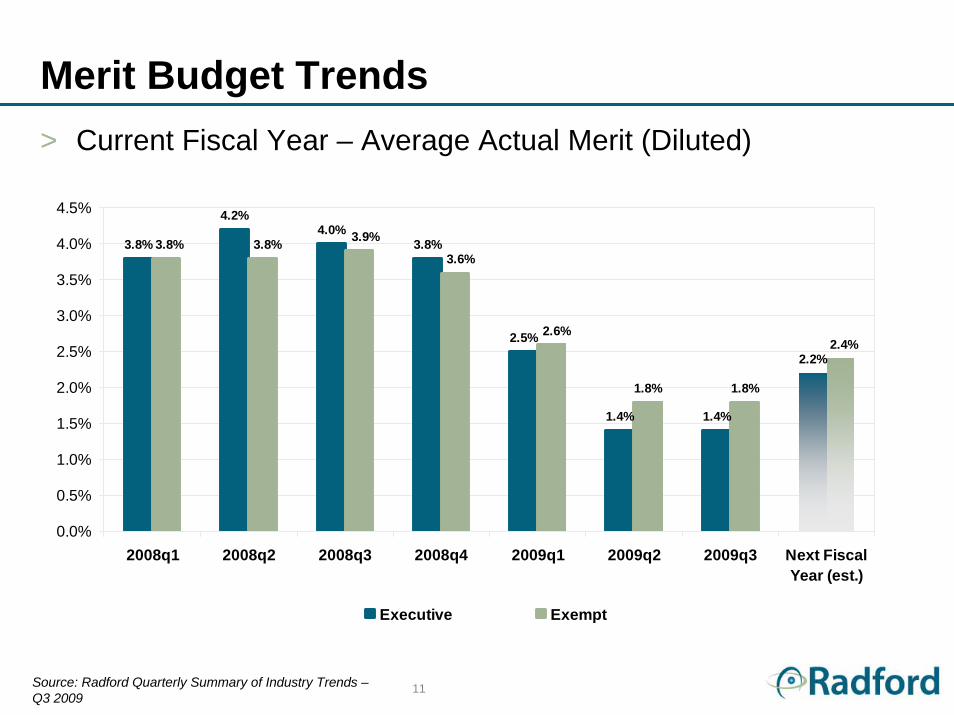
Merit Budget Trends
3.8%
4.2%4.0%
3.8%
2.5%
1.4% 1.4%
2.2%
1.8% 1.8%
3.8% 3.8% 3.9%
3.6%
2.6%2.4%
0.0%
0.5%
1.0%
1.5%
2.0%
2.5%
3.0%
3.5%
4.0%
4.5%
2008q1 2008q2 2008q3 2008q4 2009q1 2009q2 2009q3 Next FiscalYear (est.)
Executive Exempt
> Current Fiscal Year – Average Actual Merit (Diluted)
Source: Radford Quarterly Summary of Industry Trends –Q3 2009
12
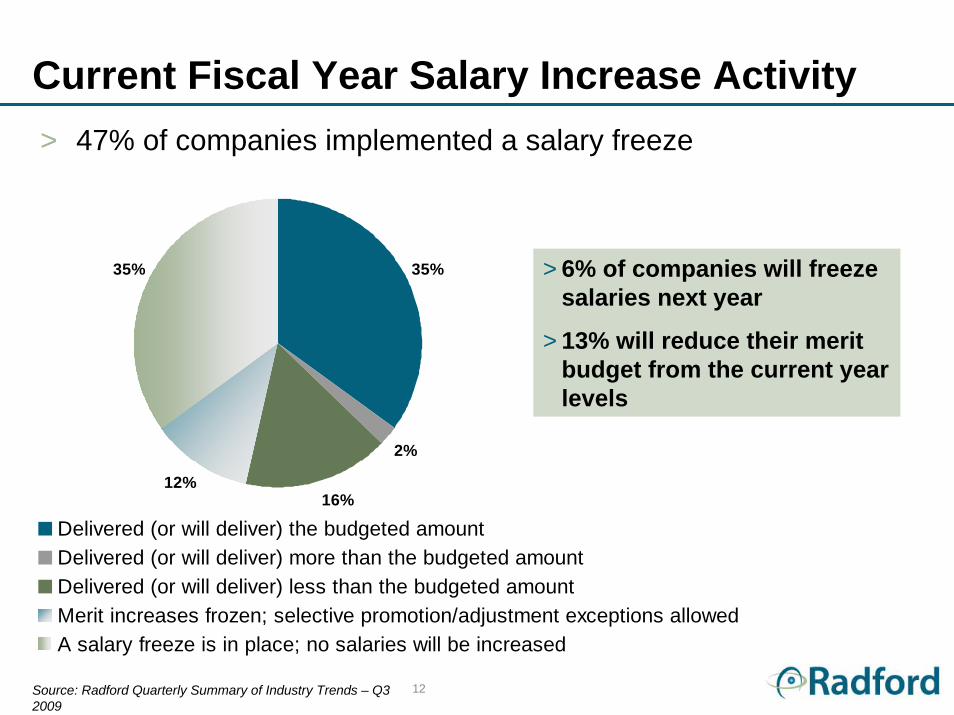
Current Fiscal Year Salary Increase Activity> 47% of companies implemented a salary freeze
35%
2%
16%12%
35%
Delivered (or will deliver) the budgeted amountDelivered (or will deliver) more than the budgeted amountDelivered (or will deliver) less than the budgeted amountMerit increases frozen; selective promotion/adjustment exceptions allowedA salary freeze is in place; no salaries will be increased
> 6% of companies will freeze salaries next year
> 13% will reduce their merit budget from the current year levels
Source: Radford Quarterly Summary of Industry Trends – Q3 2009

Pay Evolution
14
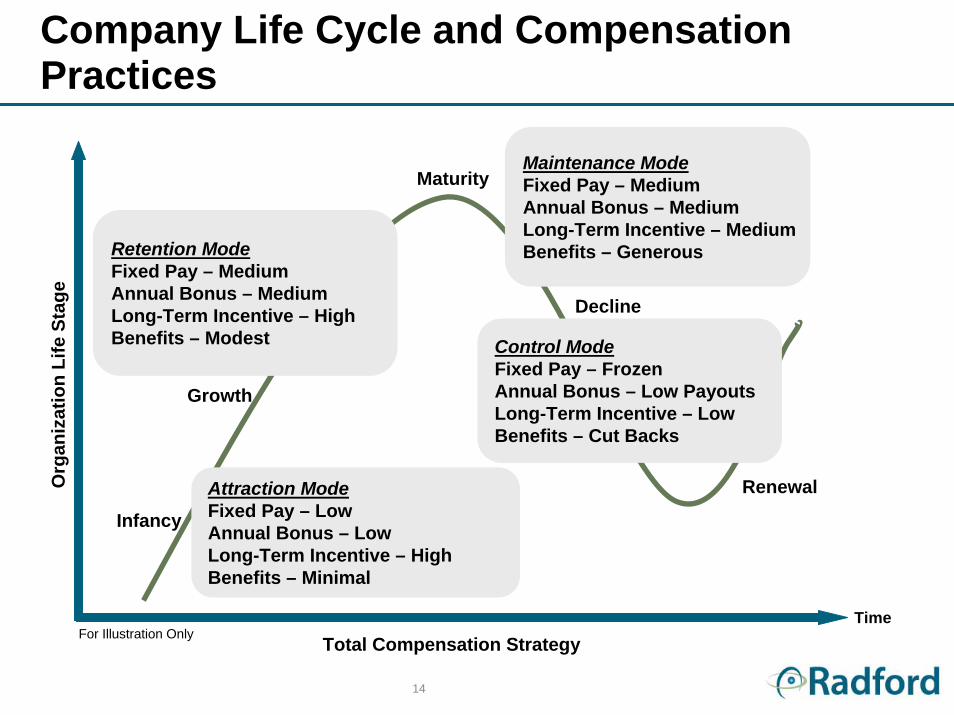
Infancy
Maturity
Decline
Attraction ModeFixed Pay – Low Annual Bonus – LowLong-Term Incentive – HighBenefits – Minimal
Retention ModeFixed Pay – Medium Annual Bonus – Medium Long-Term Incentive – HighBenefits – Modest
Maintenance ModeFixed Pay – MediumAnnual Bonus – MediumLong-Term Incentive – Medium Benefits – Generous
Control ModeFixed Pay – FrozenAnnual Bonus – Low Payouts Long-Term Incentive – LowBenefits – Cut Backs
Growth
Renewal
Time
Org
aniz
atio
n Li
fe S
tage
For Illustration Only Total Compensation Strategy
Company Life Cycle and Compensation Practices
15
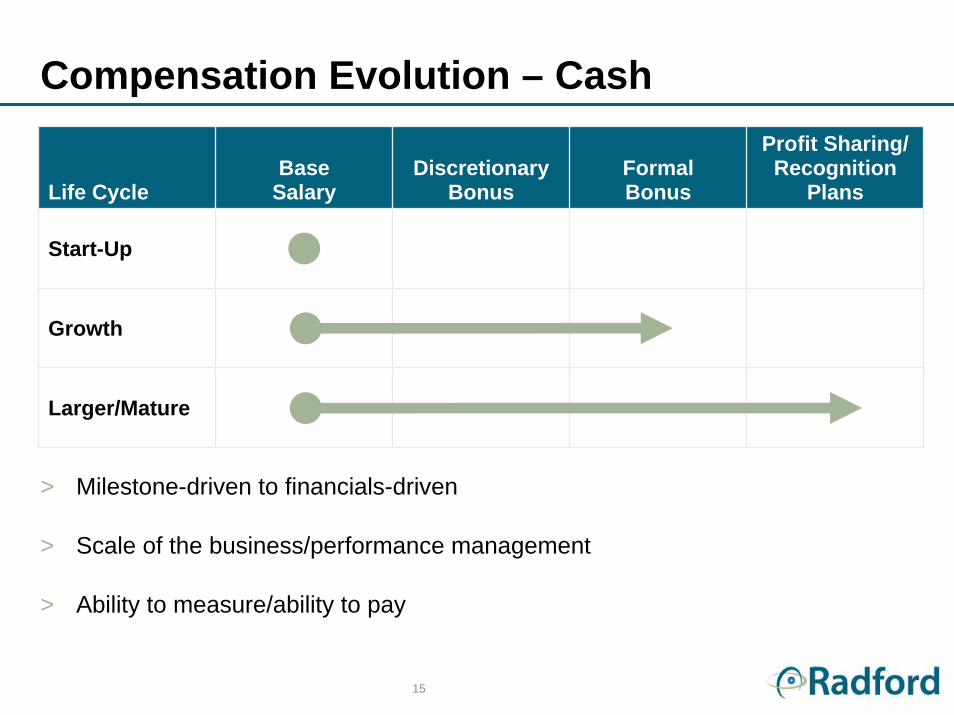
Compensation Evolution – Cash
> Milestone-driven to financials-driven
> Scale of the business/performance management
> Ability to measure/ability to pay
Life CycleBase
SalaryDiscretionary
BonusFormal Bonus
Profit Sharing/ Recognition
Plans
Start-Up
Growth
Larger/Mature
16
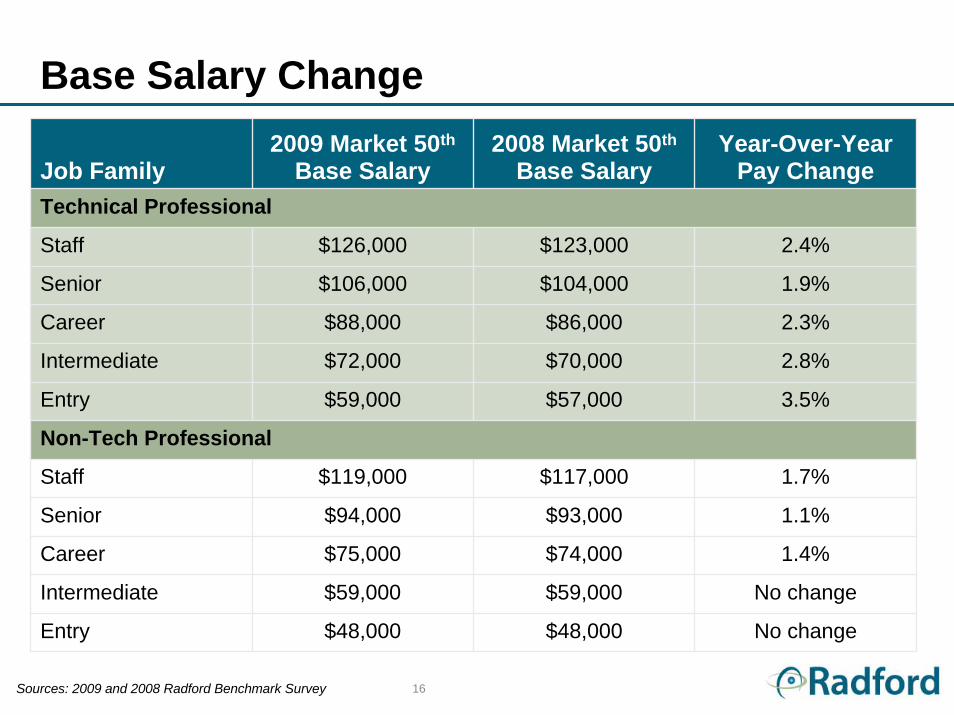
Base Salary Change
Job Family2009 Market 50th
Base Salary2008 Market 50th
Base SalaryYear-Over-Year
Pay ChangeTechnical Professional
$123,000
$104,000
$86,000
$70,000
$57,000
Non-Tech Professional
Staff $119,000 $117,000 1.7%
Senior $94,000 $93,000 1.1%
Career $75,000 $74,000 1.4%
Intermediate $59,000 $59,000 No change
Entry $48,000 $48,000 No change
Staff $126,000 2.4%
Senior $106,000 1.9%
Career $88,000 2.3%
Intermediate $72,000 2.8%
Entry $59,000 3.5%
Sources: 2009 and 2008 Radford Benchmark Survey
17
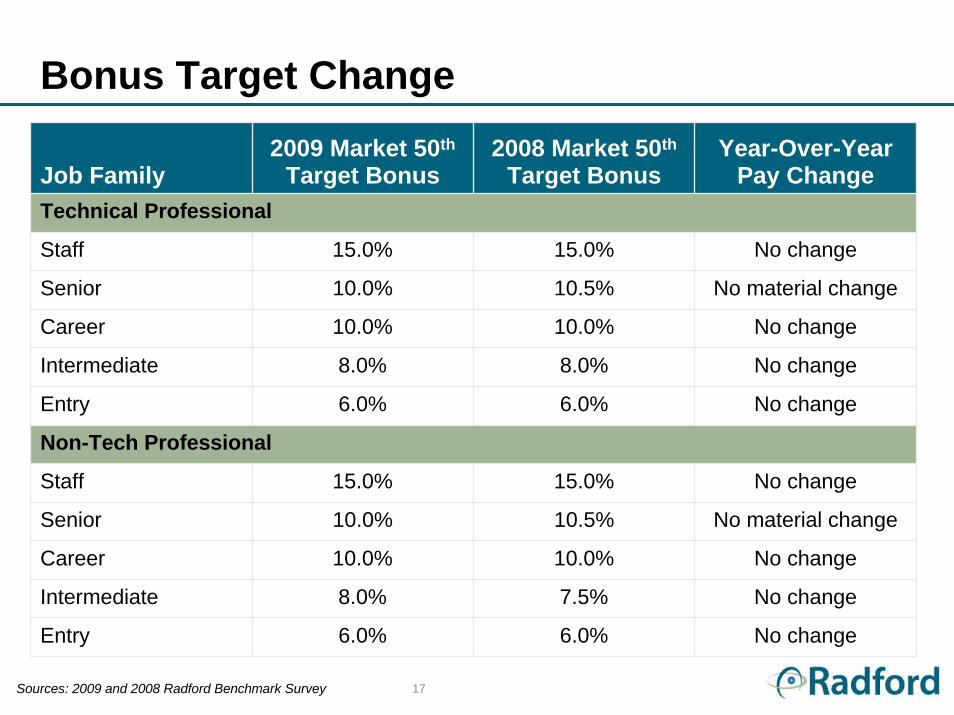
Bonus Target Change
Job Family2009 Market 50th
Target Bonus2008 Market 50th
Target BonusYear-Over-Year
Pay ChangeTechnical Professional
15.0%
10.5%
10.0%
8.0%
6.0%
Non-Tech Professional
Staff 15.0% 15.0% No change
Senior 10.0% 10.5% No material change
Career 10.0% 10.0% No change
Intermediate 8.0% 7.5% No change
Entry 6.0% 6.0% No change
Staff 15.0% No change
Senior 10.0% No material change
Career 10.0% No change
Intermediate 8.0% No change
Entry 6.0% No change
Sources: 2009 and 2008 Radford Benchmark Survey
18
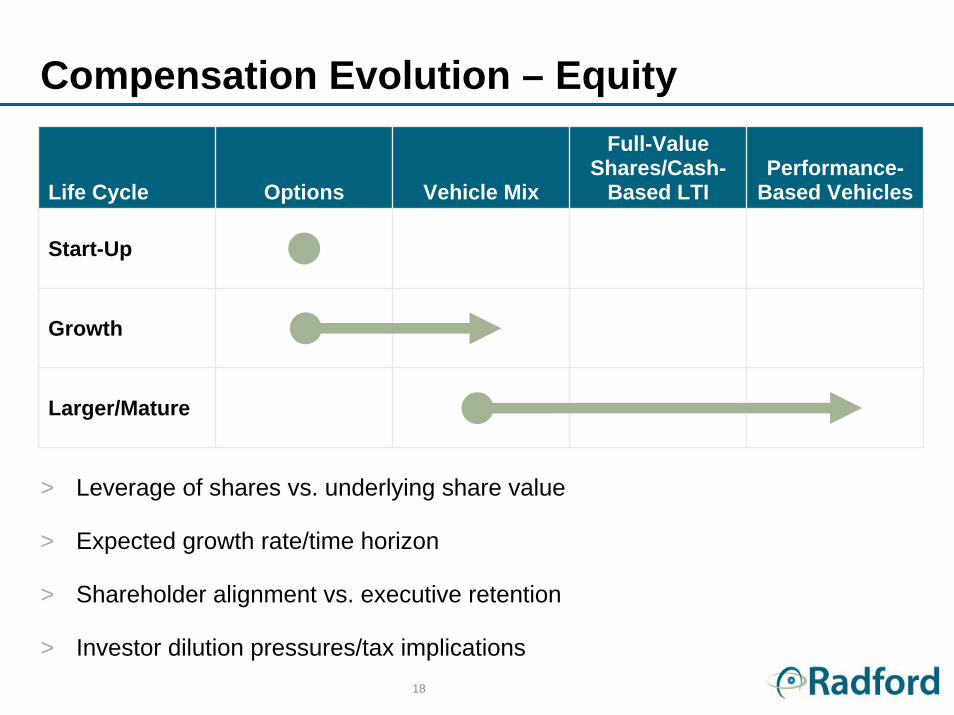
> Leverage of shares vs. underlying share value
> Expected growth rate/time horizon
> Shareholder alignment vs. executive retention
> Investor dilution pressures/tax implications
Life Cycle Options Vehicle Mix
Full-Value Shares/Cash-
Based LTIPerformance-
Based Vehicles
Start-Up
Growth
Larger/Mature
Compensation Evolution – Equity
19
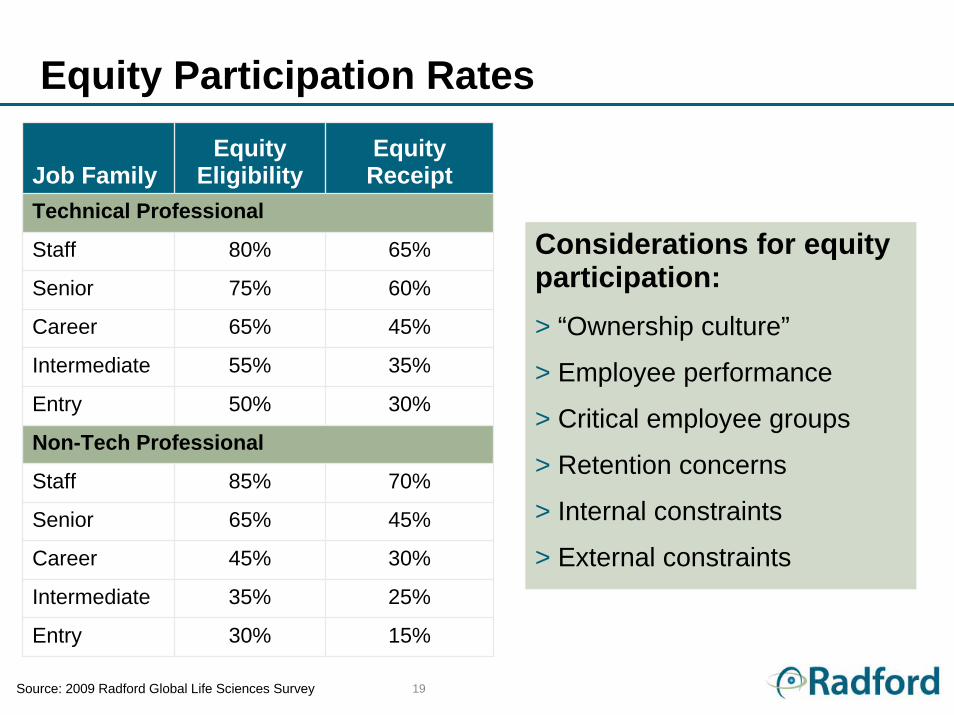
Considerations for equity participation:> “Ownership culture”
> Employee performance
> Critical employee groups
> Retention concerns
> Internal constraints
> External constraints
Job FamilyEquity
EligibilityEquity
ReceiptTechnical Professional
65%
60%
45%
35%
30%
Non-Tech Professional
Staff 85% 70%
Senior 65% 45%
Career 45% 30%
Intermediate 35% 25%
Entry 30% 15%
Staff 80%
Senior 75%
Career 65%
Intermediate 55%
Entry 50%
Source: 2009 Radford Global Life Sciences Survey
Equity Participation Rates
20
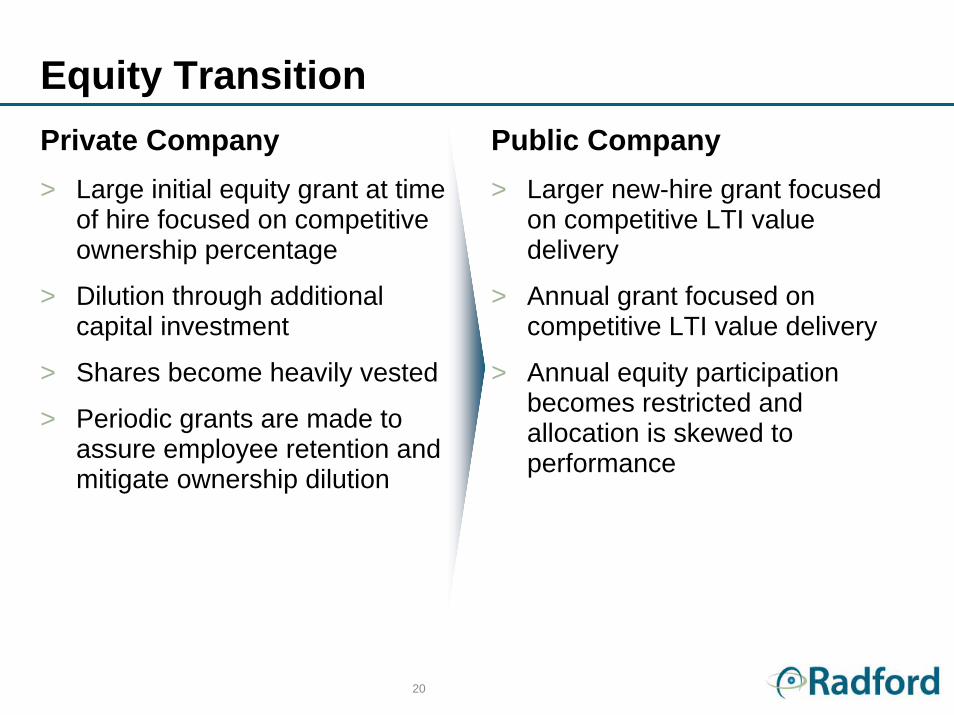
Private Company> Large initial equity grant at time
of hire focused on competitive ownership percentage
> Dilution through additional capital investment
> Shares become heavily vested
> Periodic grants are made to assure employee retention and mitigate ownership dilution
Public Company> Larger new-hire grant focused
on competitive LTI value delivery
> Annual grant focused on competitive LTI value delivery
> Annual equity participation becomes restricted and allocation is skewed to performance
Equity Transition
21
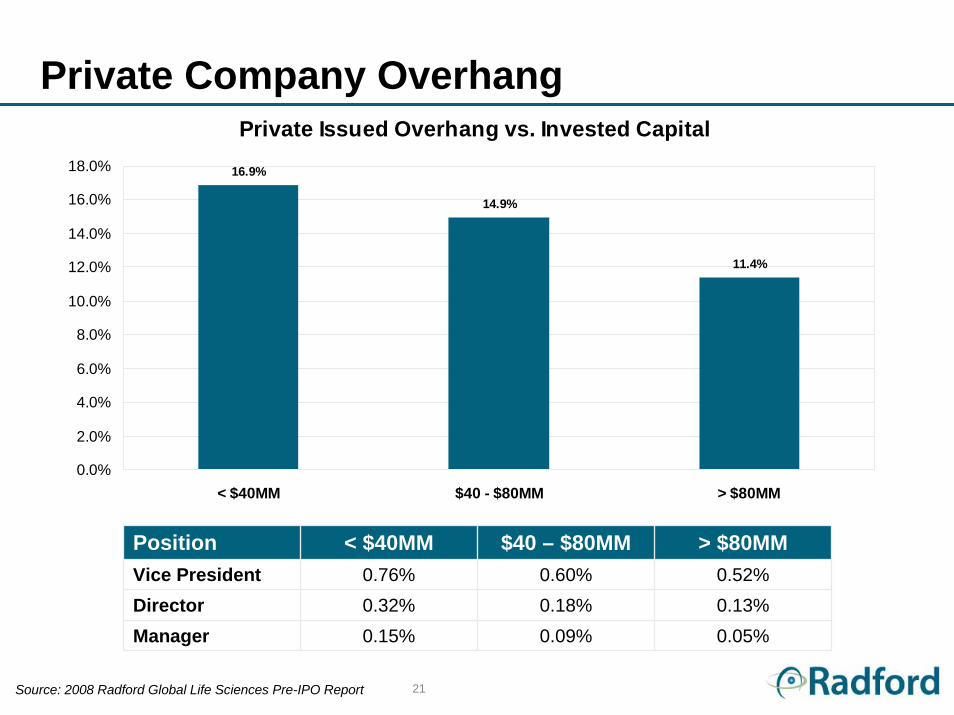
Private Company OverhangPrivate Issued Overhang vs. Invested Capital
16.9%
14.9%
11.4%
0.0%
2.0%
4.0%
6.0%
8.0%
10.0%
12.0%
14.0%
16.0%
18.0%
< $40MM $40 - $80MM > $80MM
Position < $40MM $40 – $80MM > $80MMVice President 0.76%
0.32%0.15%
0.60% 0.52%Director 0.18% 0.13%Manager 0.09% 0.05%
Source: 2008 Radford Global Life Sciences Pre-IPO Report
22
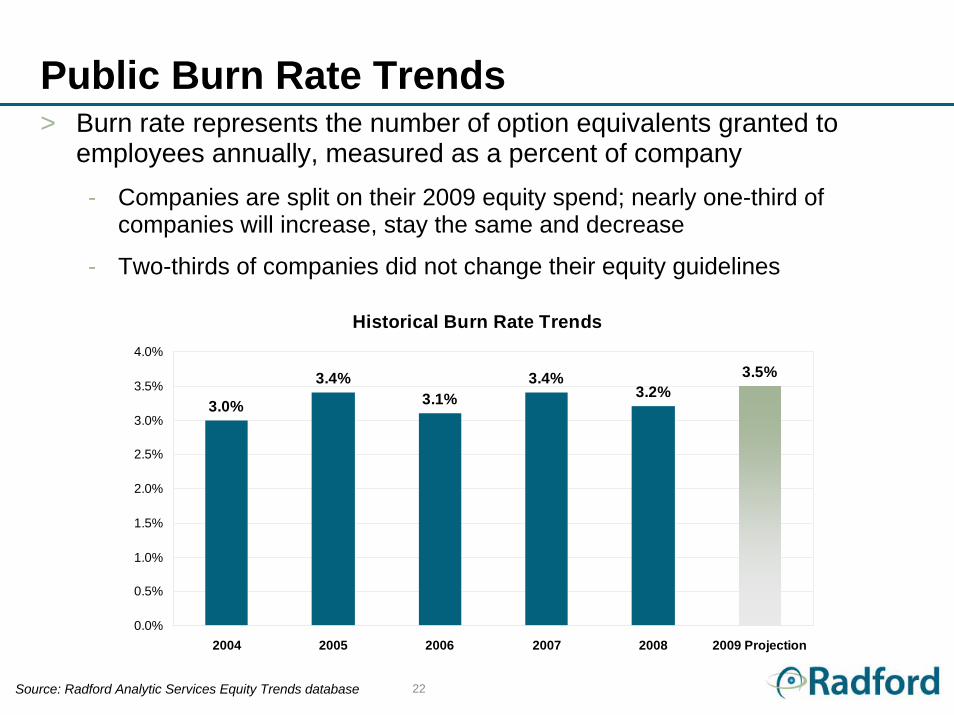
Public Burn Rate Trends> Burn rate represents the number of option equivalents granted to
employees annually, measured as a percent of company- Companies are split on their 2009 equity spend; nearly one-third of
companies will increase, stay the same and decrease
- Two-thirds of companies did not change their equity guidelines
Historical Burn Rate Trends
3.0%
3.4%3.1%
3.4%3.2%
3.5%
0.0%
0.5%
1.0%
1.5%
2.0%
2.5%
3.0%
3.5%
4.0%
2004 2005 2006 2007 2008 2009 Projection
Source: Radford Analytic Services Equity Trends database
23
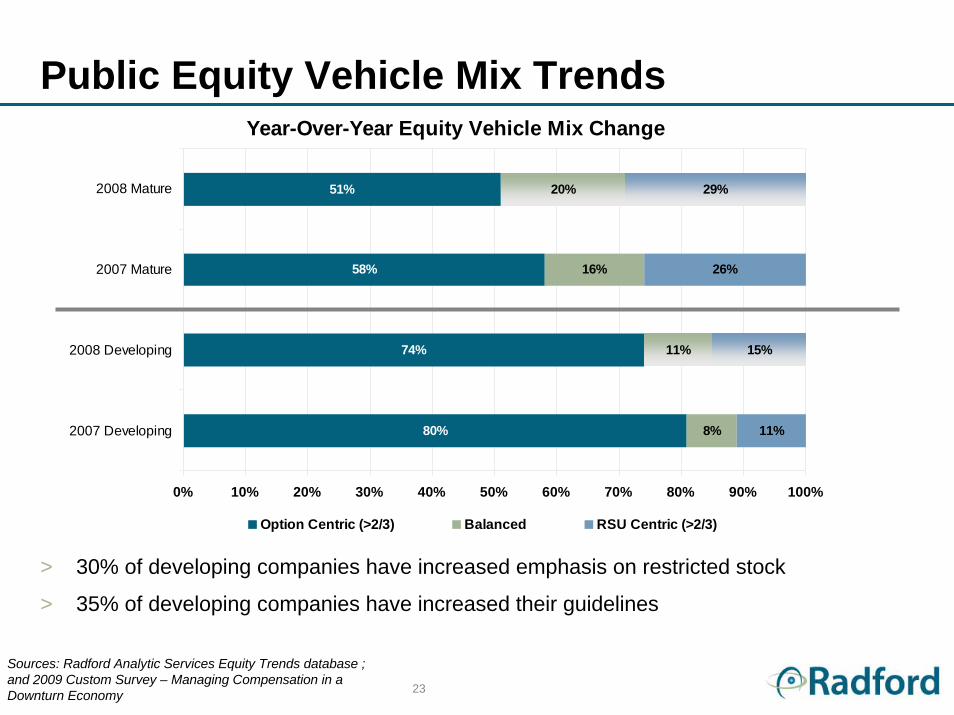
Year-Over-Year Equity Vehicle Mix Change
80%
74%
58%
51%
8%
11%
16%
20%
11%
15%
26%
29%
0% 10% 20% 30% 40% 50% 60% 70% 80% 90% 100%
2007 Developing
2008 Developing
2007 Mature
2008 Mature
Option Centric (>2/3) Balanced RSU Centric (>2/3)
Public Equity Vehicle Mix Trends
> 30% of developing companies have increased emphasis on restricted stock
> 35% of developing companies have increased their guidelines
Sources: Radford Analytic Services Equity Trends database ; and 2009 Custom Survey – Managing Compensation in a Downturn Economy
24
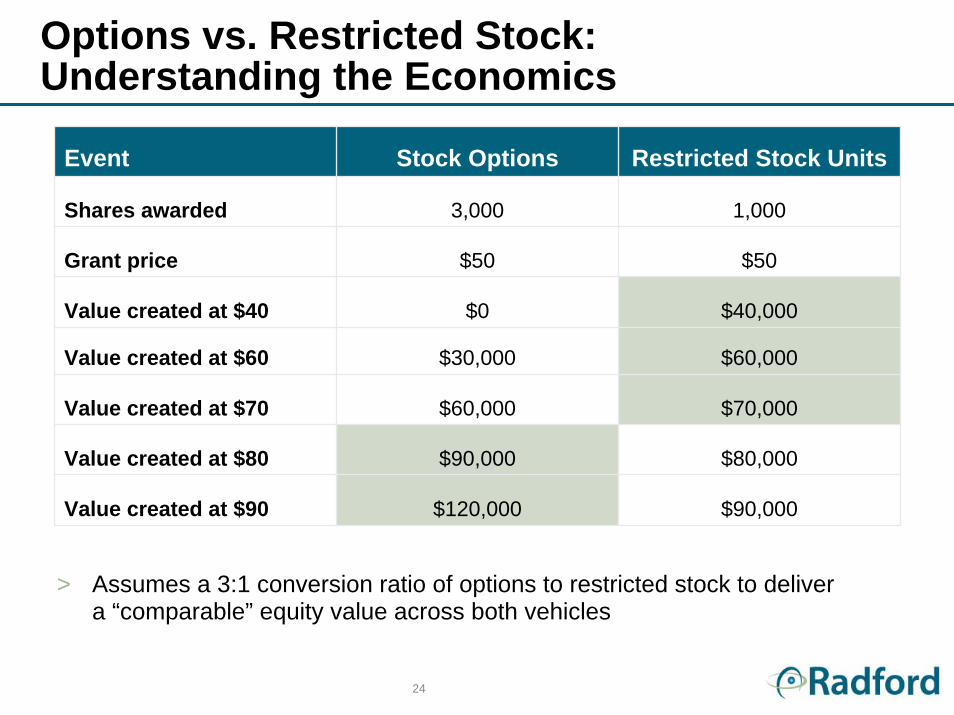
Event Stock Options
Shares awarded 3,000
$50
Value created at $40 $0 $40,000
$30,000
$60,000
Value created at $80 $90,000 $80,000
Value created at $90 $120,000 $90,000
Grant price
Value created at $60 $60,000
Value created at $70 $70,000
Restricted Stock Units
1,000
$50
> Assumes a 3:1 conversion ratio of options to restricted stock to deliver a “comparable” equity value across both vehicles
Options vs. Restricted Stock:Understanding the Economics
25
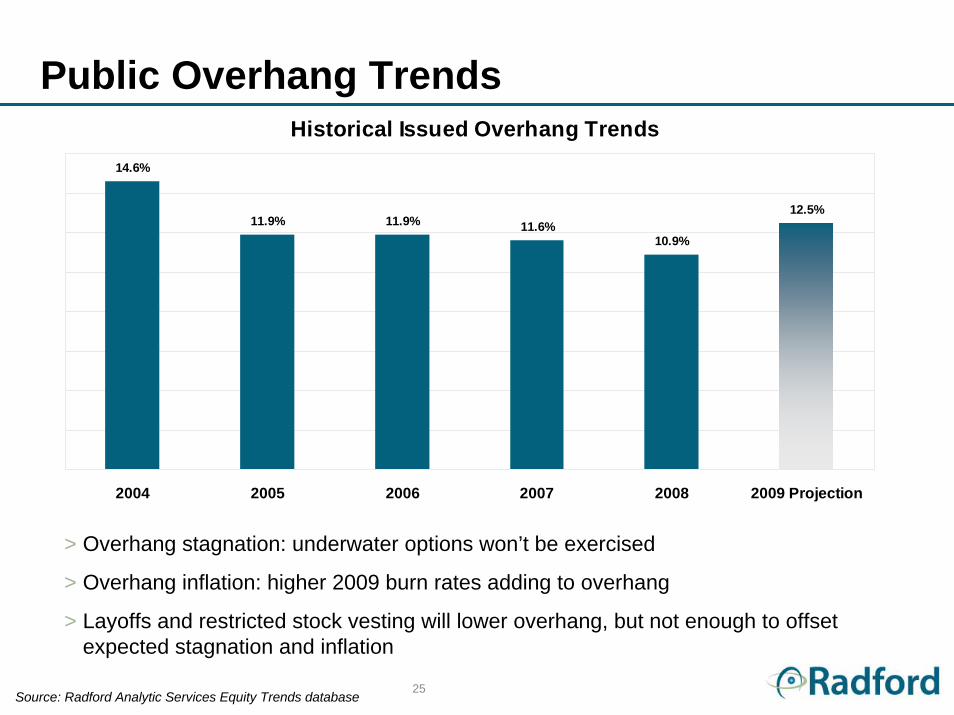
Public Overhang Trends
> Overhang stagnation: underwater options won’t be exercised
> Overhang inflation: higher 2009 burn rates adding to overhang
> Layoffs and restricted stock vesting will lower overhang, but not enough to offset expected stagnation and inflation
Source: Radford Analytic Services Equity Trends database
Historical Issued Overhang Trends14.6%
11.9% 11.9% 11.6%10.9%
12.5%
2004 2005 2006 2007 2008 2009 Projection

Case Study
27
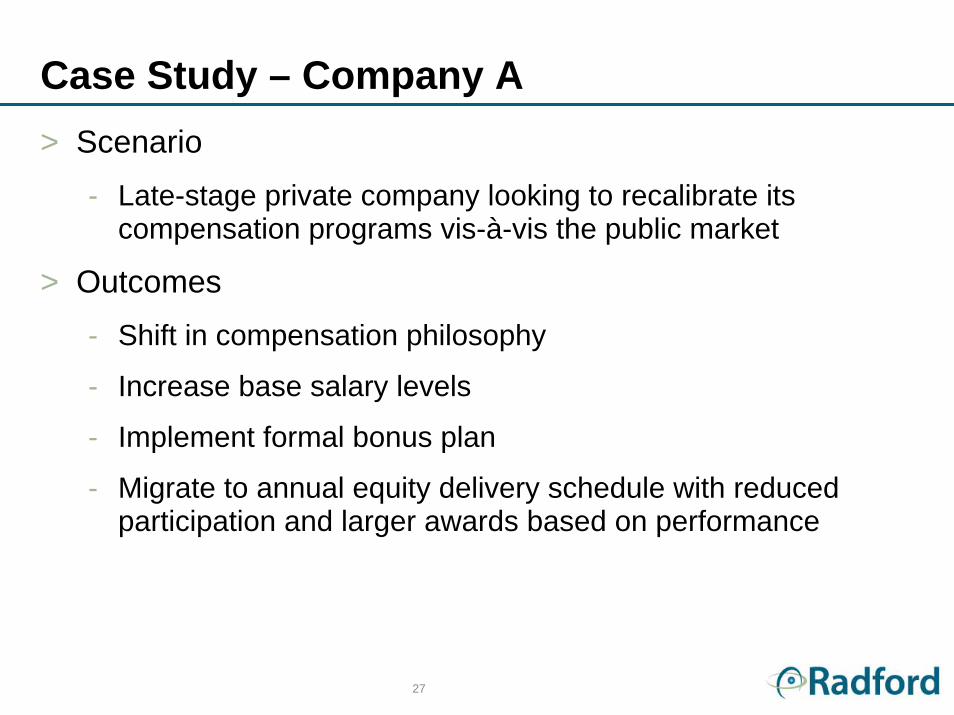
Case Study – Company A> Scenario
- Late-stage private company looking to recalibrate its compensation programs vis-à-vis the public market
> Outcomes- Shift in compensation philosophy
- Increase base salary levels
- Implement formal bonus plan
- Migrate to annual equity delivery schedule with reduced participation and larger awards based on performance
28
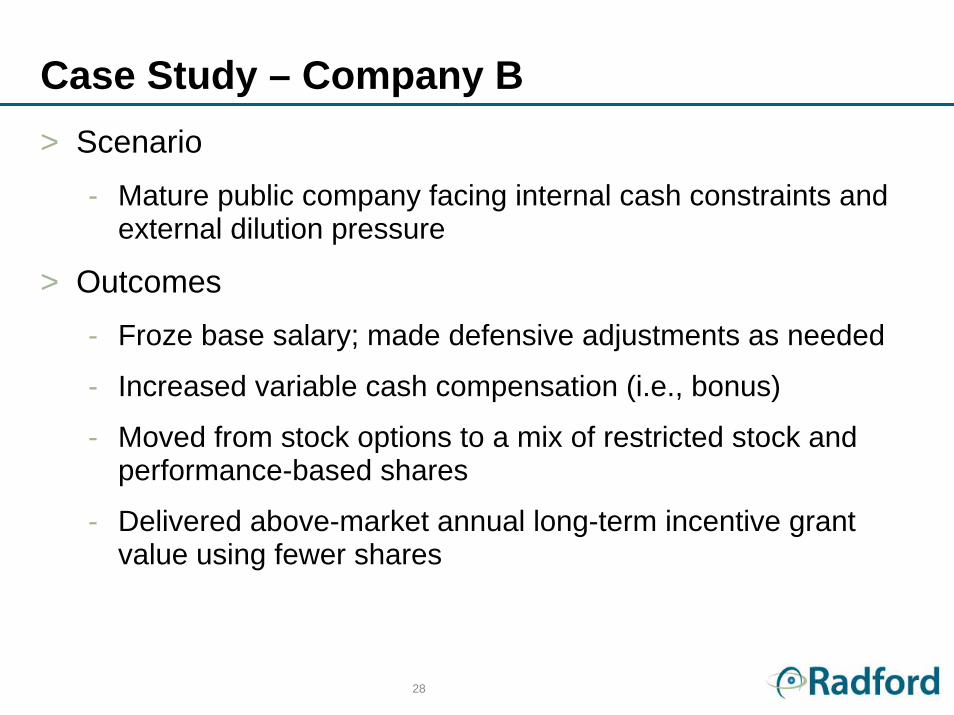
Case Study – Company B> Scenario
- Mature public company facing internal cash constraints and external dilution pressure
> Outcomes- Froze base salary; made defensive adjustments as needed
- Increased variable cash compensation (i.e., bonus)
- Moved from stock options to a mix of restricted stock and performance-based shares
- Delivered above-market annual long-term incentive grant value using fewer shares

Thank You!Questions?
Ed Speidel, [email protected], +1 (508) 628-1552
Rob Surdel, [email protected], +1 (508) 628-1551