Embed Size (px)
Citation preview
One Firm. Complete Solutions.
Compensation Trends in the Medical Device Industry
September 2014

1 | Compensation Trends in the Medical Device Industry – MassMEDIC
Our Value
Global Knowledge. Local Perspectives.
For more than 35 years, Radford, an Aon Hewitt company, has served as the leading provider of compensation intelligence to the global technology and life sciences sectors.
Our ability to combine deep industry expertise with global survey knowledge and local consulting perspectives makes Radford an unmatched partner for innovation-based companies seeking truly comprehensive compensation and governance solutions.
Today, more than 2,500 companies choose to partner with Radford’s survey, compensation consulting and equity valuation businesses for these reasons.
Industry Expertise + Global
Knowledge + Local Perspectives
2 | Compensation Trends in the Medical Device Industry – MassMEDIC
Today’s Presentation
US Market and Employment Outlook
Labor Trends
Pay Frameworks
Pay Mix
Public vs. Private Cash
Public vs. Private Equity

3 | Compensation Trends in the Medical Device Industry – MassMEDIC
US Market and Employment Outlook
US Unemployment in a Recovering Economy
The unemployment rate in Massachusetts has tracked primarily below the national average, and currently stands at 5.5%
Source: Economic Data, Federal Reserve Bank of St. Louis.
5.5%6.1%
0.0
2.0
4.0
6.0
8.0
10.0
12.0
Northeast Massachusetts US
4 | Compensation Trends in the Medical Device Industry – MassMEDIC
US Market and Employment Outlook
US Markets
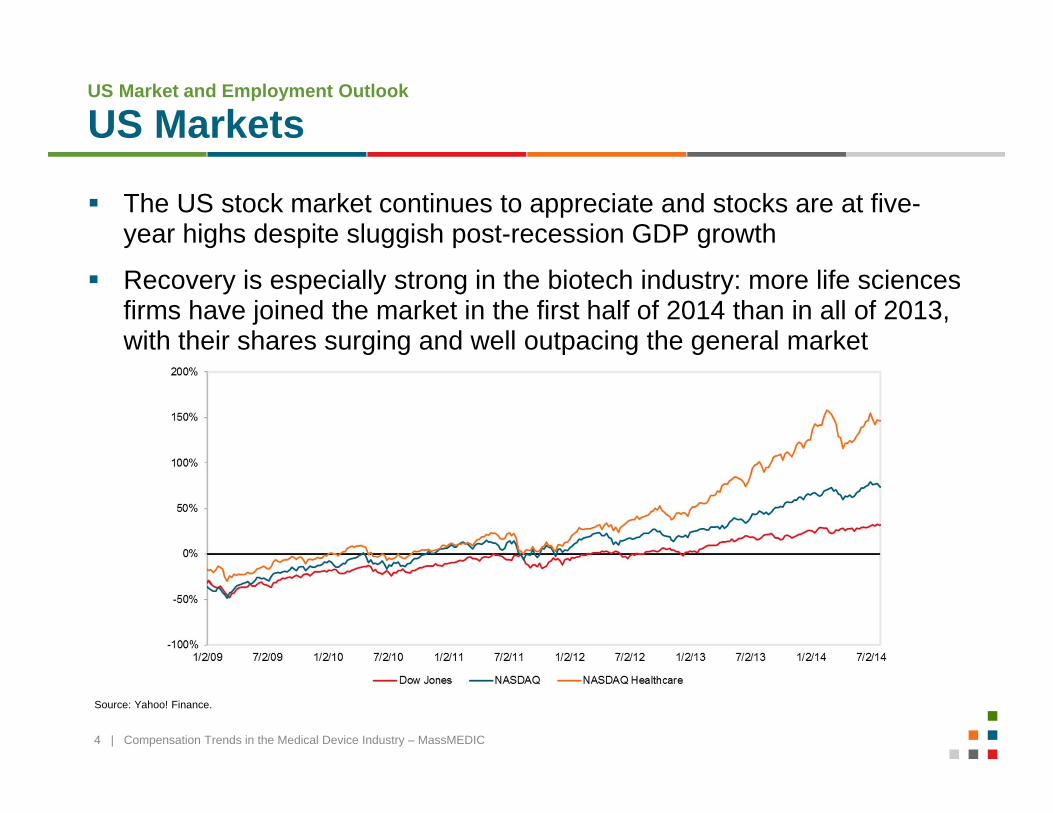
The US stock market continues to appreciate and stocks are at five-year highs despite sluggish post-recession GDP growth
Recovery is especially strong in the biotech industry: more life sciences firms have joined the market in the first half of 2014 than in all of 2013, with their shares surging and well outpacing the general market
Source: Yahoo! Finance.
5 | Compensation Trends in the Medical Device Industry – MassMEDIC
Behind Today’s Data
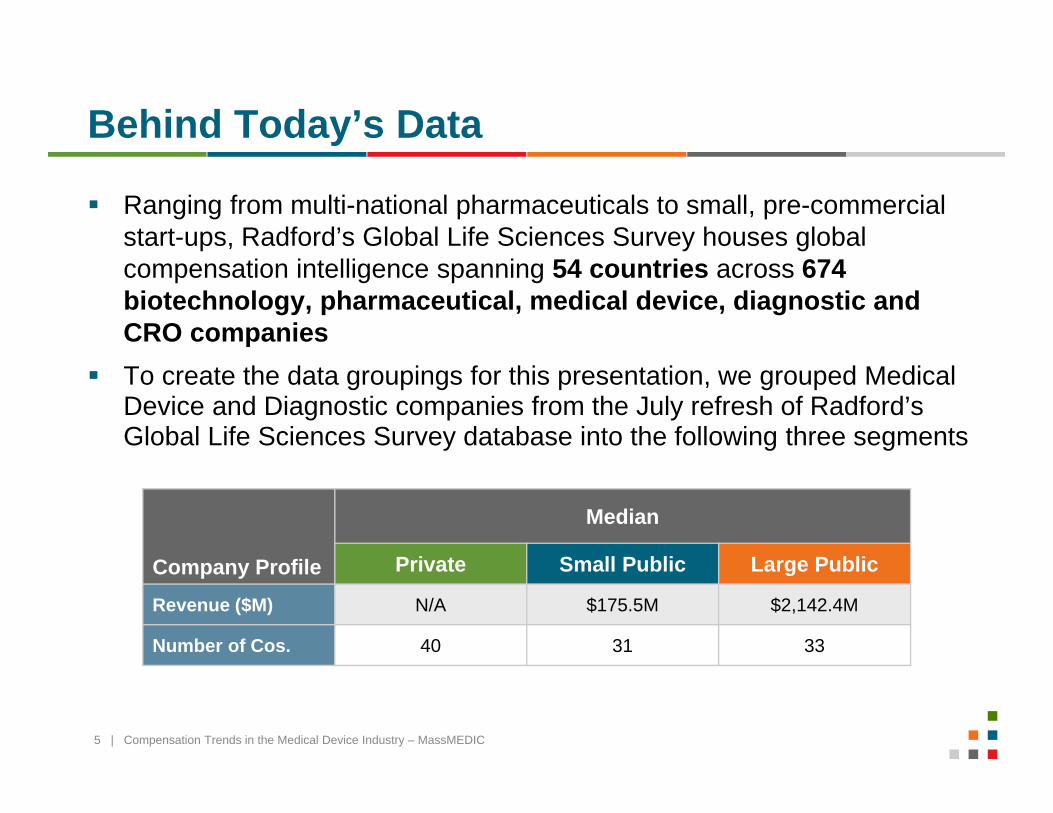
Ranging from multi-national pharmaceuticals to small, pre-commercial start-ups, Radford’s Global Life Sciences Survey houses global compensation intelligence spanning 54 countries across 674 biotechnology, pharmaceutical, medical device, diagnostic and CRO companies
To create the data groupings for this presentation, we grouped Medical Device and Diagnostic companies from the July refresh of Radford’s Global Life Sciences Survey database into the following three segments
Company Profile
Median
Private Small Public Large Public
Revenue ($M) N/A $175.5M $2,142.4M
Number of Cos. 40 31 33
6 | Compensation Trends in the Medical Device Industry – MassMEDIC
Labor Trends
Current Hiring Environment
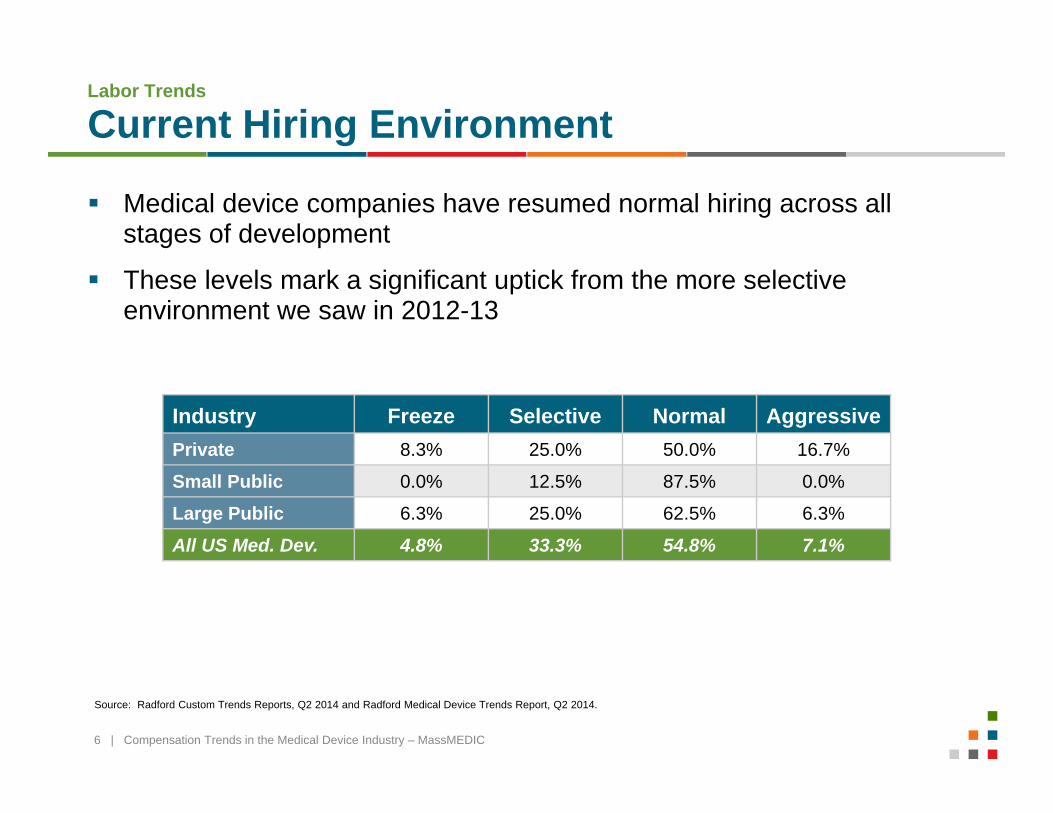
Medical device companies have resumed normal hiring across all stages of development
These levels mark a significant uptick from the more selective environment we saw in 2012-13
Source: Radford Custom Trends Reports, Q2 2014 and Radford Medical Device Trends Report, Q2 2014.
Industry Freeze Selective Normal AggressivePrivate 8.3% 25.0% 50.0% 16.7%
Small Public 0.0% 12.5% 87.5% 0.0%
Large Public 6.3% 25.0% 62.5% 6.3%
All US Med. Dev. 4.8% 33.3% 54.8% 7.1%
7 | Compensation Trends in the Medical Device Industry – MassMEDIC
Labor Trends
Turnover
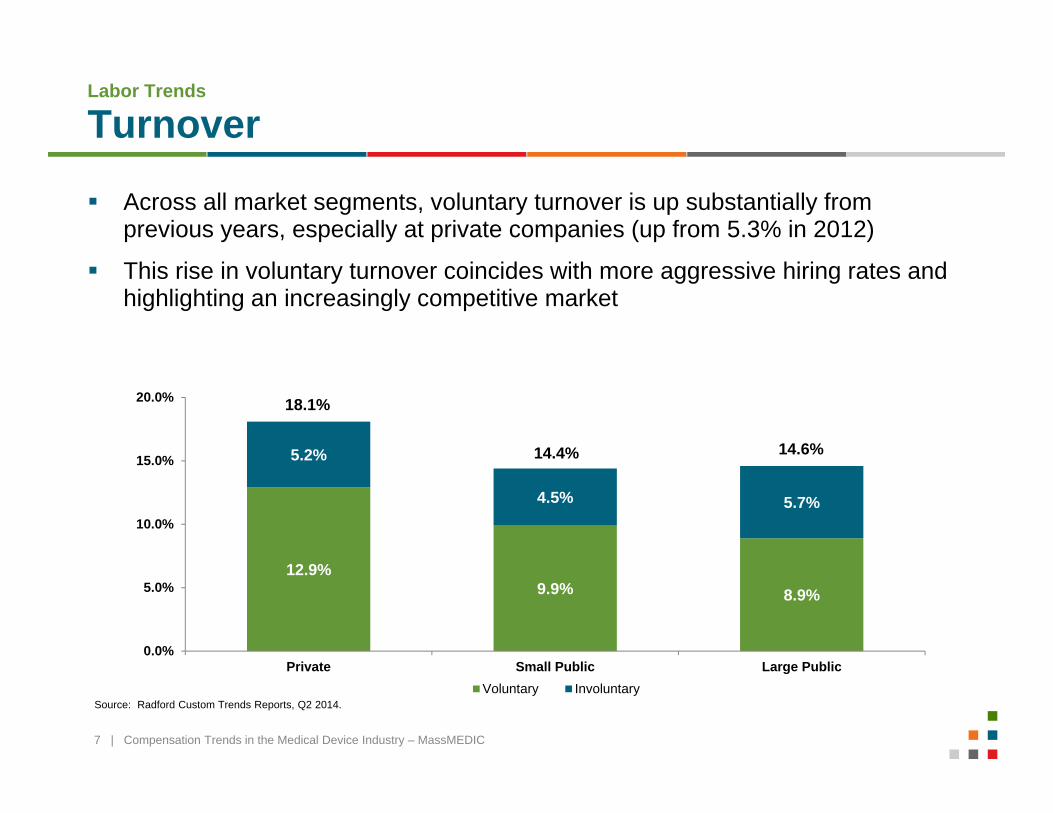
Across all market segments, voluntary turnover is up substantially from previous years, especially at private companies (up from 5.3% in 2012)
This rise in voluntary turnover coincides with more aggressive hiring rates and highlighting an increasingly competitive market
12.9%9.9% 8.9%
5.2%
4.5% 5.7%
0.0%
5.0%
10.0%
15.0%
20.0%
Private Small Public Large PublicVoluntary Involuntary
18.1%
Source: Radford Custom Trends Reports, Q2 2014.
14.4% 14.6%
8 | Compensation Trends in the Medical Device Industry – MassMEDIC
Labor Trends
US Salary Increases
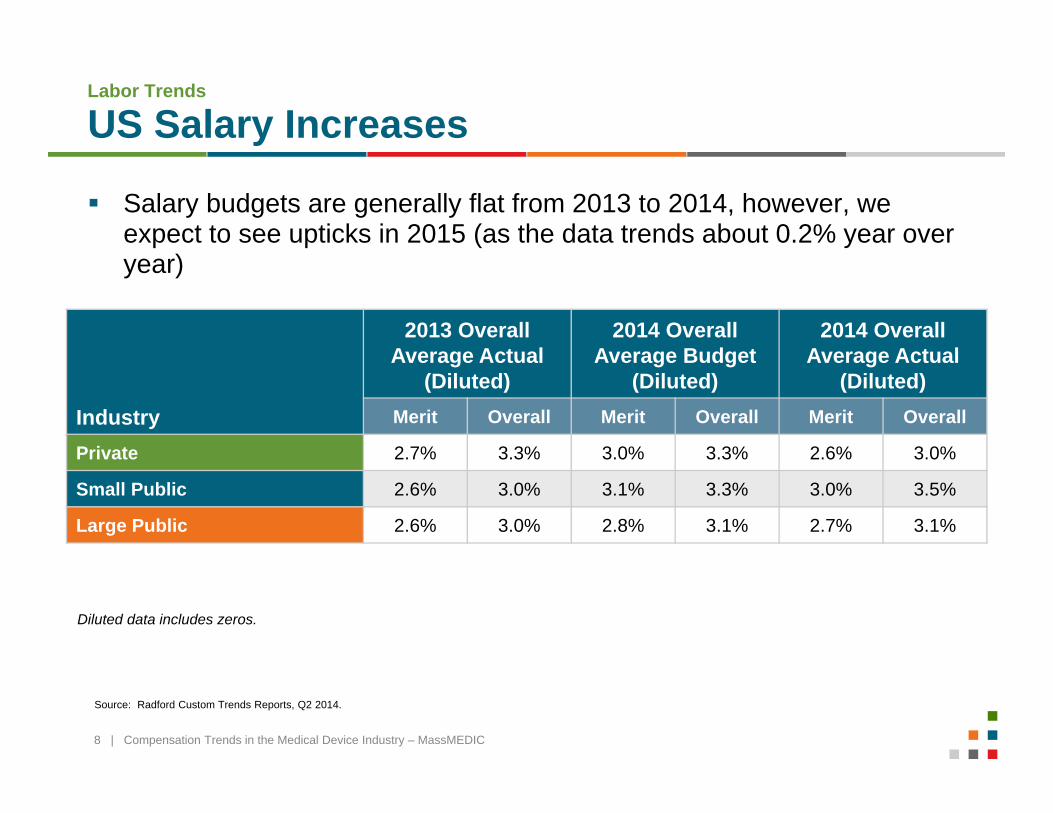
Salary budgets are generally flat from 2013 to 2014, however, we expect to see upticks in 2015 (as the data trends about 0.2% year over year)
Industry
2013 Overall Average Actual
(Diluted)
2014 Overall Average Budget
(Diluted)
2014 Overall Average Actual
(Diluted)Merit Overall Merit Overall Merit Overall
Private 2.7% 3.3% 3.0% 3.3% 2.6% 3.0%
Small Public 2.6% 3.0% 3.1% 3.3% 3.0% 3.5%
Large Public 2.6% 3.0% 2.8% 3.1% 2.7% 3.1%
Source: Radford Custom Trends Reports, Q2 2014.
Diluted data includes zeros.
9 | Compensation Trends in the Medical Device Industry – MassMEDIC
Pay Frameworks
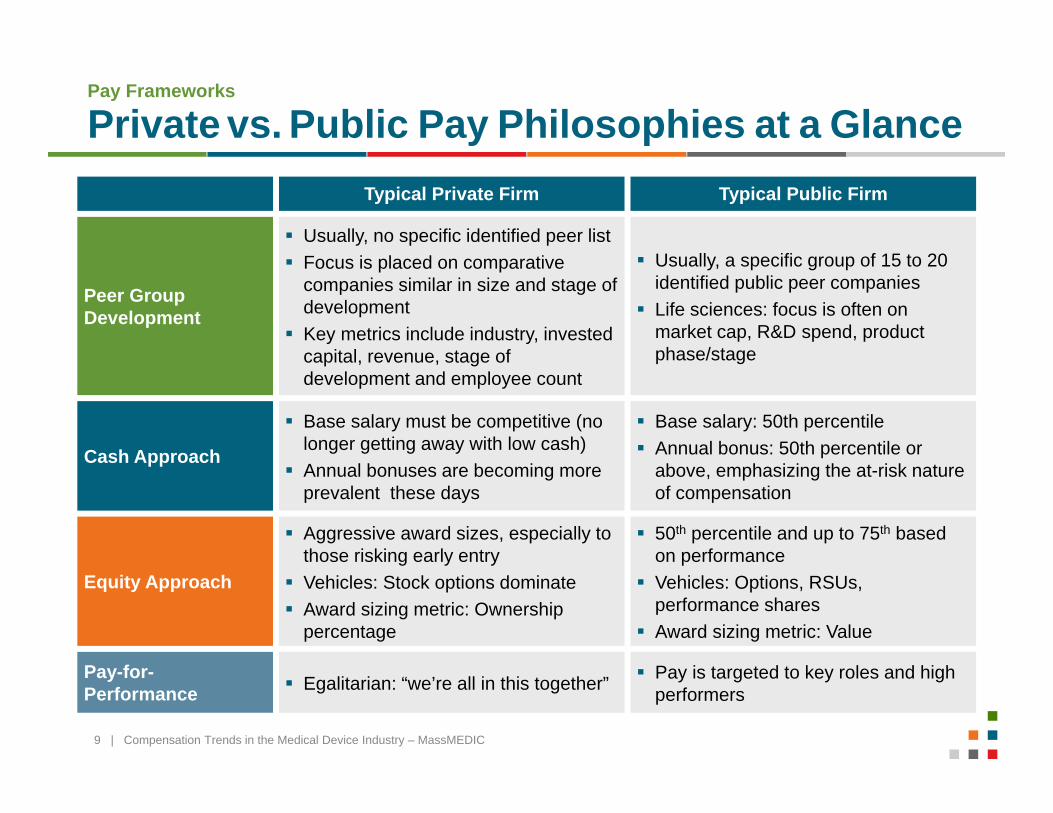
Private vs. Public Pay Philosophies at a GlanceTypical Private Firm Typical Public Firm
Peer Group Development
Usually, no specific identified peer list Focus is placed on comparative
companies similar in size and stage of development
Key metrics include industry, invested capital, revenue, stage of development and employee count
Usually, a specific group of 15 to 20 identified public peer companies
Life sciences: focus is often on market cap, R&D spend, product phase/stage
Cash Approach
Base salary must be competitive (no longer getting away with low cash)
Annual bonuses are becoming more prevalent these days
Base salary: 50th percentile Annual bonus: 50th percentile or
above, emphasizing the at-risk nature of compensation
Equity Approach
Aggressive award sizes, especially to those risking early entry
Vehicles: Stock options dominate Award sizing metric: Ownership
percentage
50th percentile and up to 75th based on performance
Vehicles: Options, RSUs, performance shares
Award sizing metric: Value
Pay-for-Performance Egalitarian: “we’re all in this together” Pay is targeted to key roles and high
performers
10 | Compensation Trends in the Medical Device Industry – MassMEDIC
Pay Mix
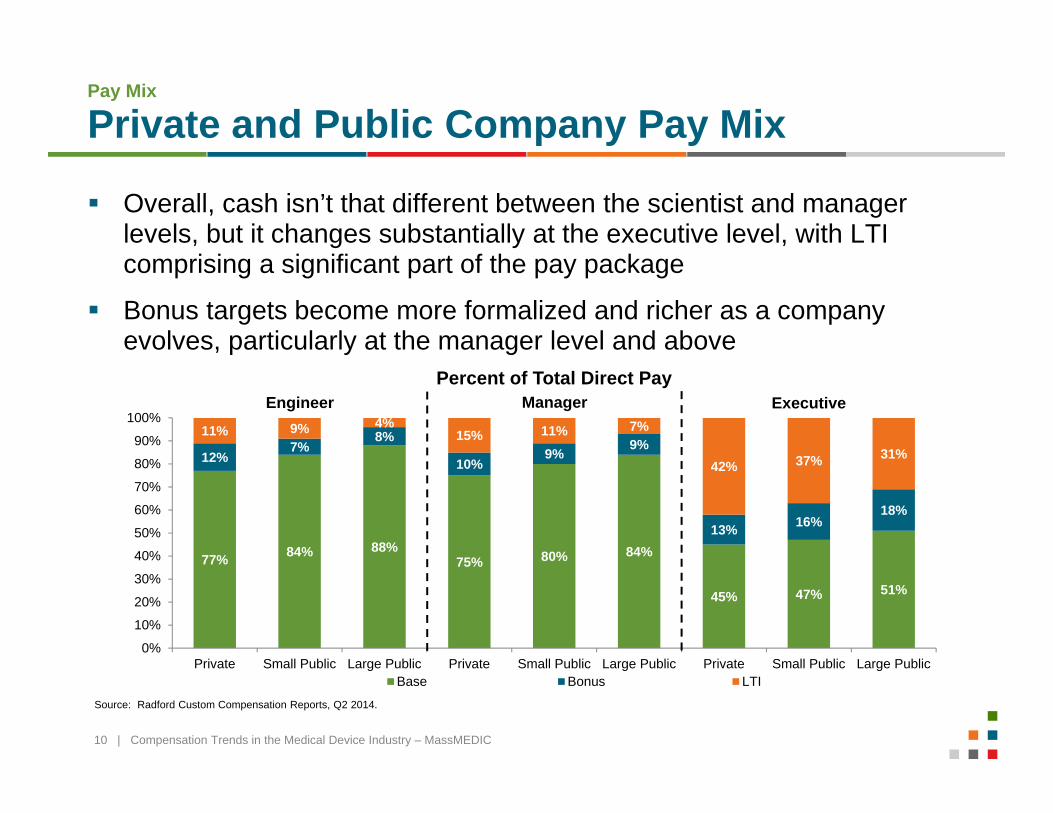
Private and Public Company Pay Mix
Overall, cash isn’t that different between the scientist and manager levels, but it changes substantially at the executive level, with LTI comprising a significant part of the pay package
Bonus targets become more formalized and richer as a company evolves, particularly at the manager level and above
77% 84% 88%75% 80% 84%
45% 47% 51%
12%7%
8%
10%9% 9%
13% 16%18%
11% 9% 4%15% 11% 7%
42% 37% 31%
0%
10%
20%
30%
40%
50%
60%
70%
80%
90%
100%
Private Small Public Large Public Private Small Public Large Public Private Small Public Large Public
Percent of Total Direct Pay
Base Bonus LTI
ExecutiveManagerEngineer
Source: Radford Custom Compensation Reports, Q2 2014.
11 | Compensation Trends in the Medical Device Industry – MassMEDIC
Private vs. Public Cash
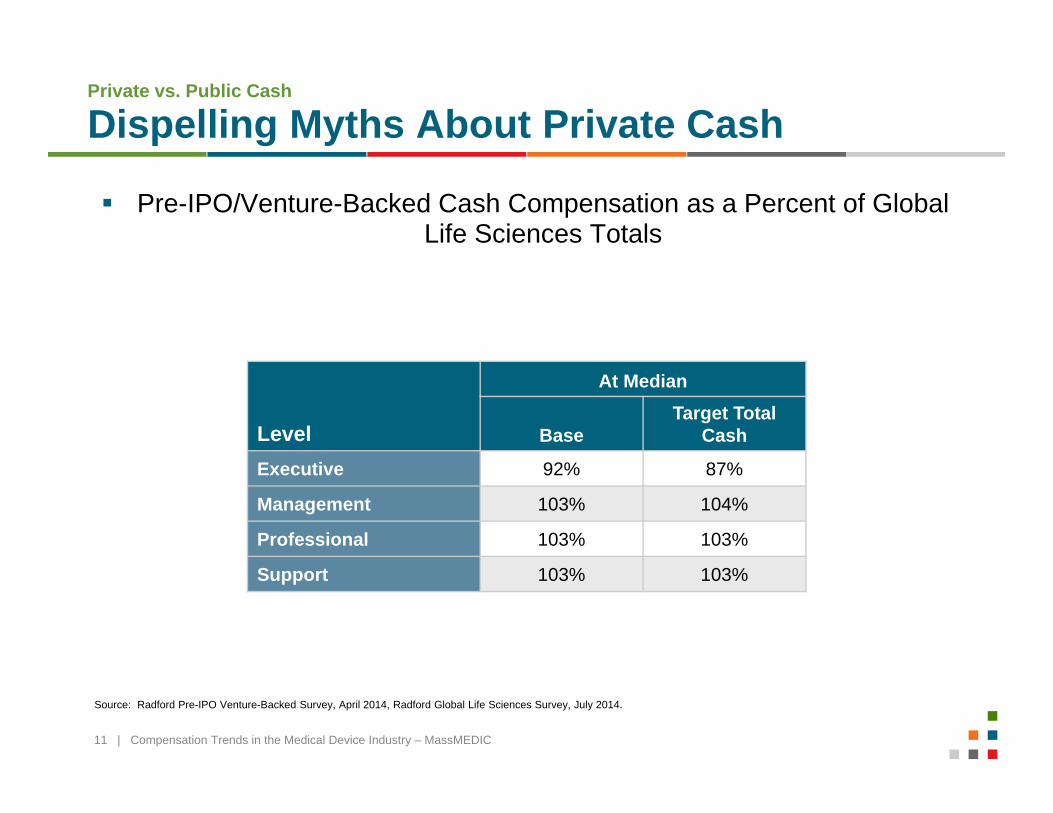
Dispelling Myths About Private Cash
Pre-IPO/Venture-Backed Cash Compensation as a Percent of Global Life Sciences Totals
Level
At Median
BaseTarget Total
Cash
Executive 92% 87%
Management 103% 104%
Professional 103% 103%
Support 103% 103%
Source: Radford Pre-IPO Venture-Backed Survey, April 2014, Radford Global Life Sciences Survey, July 2014.

12 | Compensation Trends in the Medical Device Industry – MassMEDIC
Public vs. Private Cash
Types of Incentive Plans
Most medical device companies, both public and private, provide annual incentives
The medical device industry historically has stood out against other life sciences industries with higher rates of discretionary and cash profit sharing bonus plans
Bonus MetricMetric Prevalence
Private Small Public Large Public
Companies with bonus/incentive compensation plan 82% 96% 100%
Bonus Plan CombinationsFormal Bonus Only 58% 56% 57%
Discretionary Bonus Only 24% 0% 6%
Formal + Discretionary 18% 37% 28%
Formal + Cash Profit Sharing 0% 7% 9%
Source: Radford Custom Practices Reports, Q2 2014.

13 | Compensation Trends in the Medical Device Industry – MassMEDIC
Private vs. Public Cash
Evolution of Pay Practices: Cash Incentives
Incentive pay changes to focus more on financial performance (sales and profit) as companies move private to public
Generally speaking, bonus metrics shift as a company grows in size
Bonus Metric*(more than one may apply) Private Small Public Large PublicNew Product Introduction 56% 33% 7%
Other Non-Financial 80% 74% 47%
Sales 76% 100% 83%
Profit 48% 81% 100%
Quality 28% 11% 17%
Customer Satisfaction 20% 4% 10%
Source: Radford Custom Practices Reports, Q2 2014.
14 | Compensation Trends in the Medical Device Industry – MassMEDIC
Public vs. Private Cash
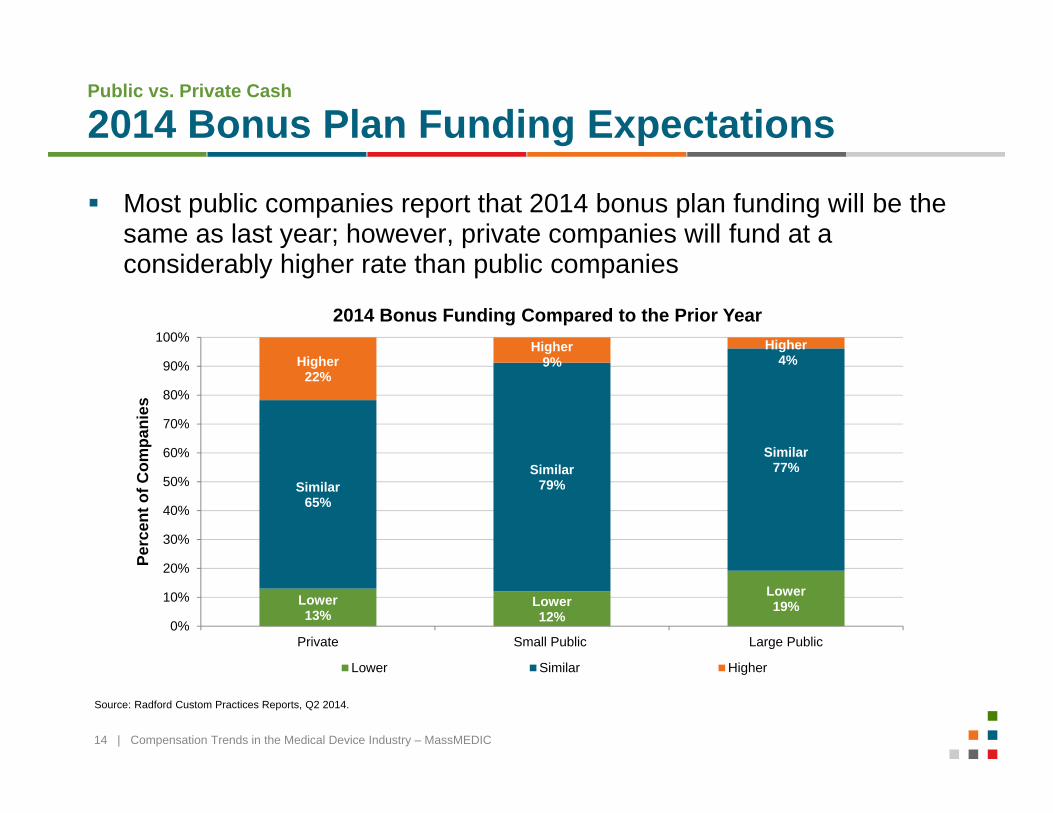
2014 Bonus Plan Funding Expectations
Most public companies report that 2014 bonus plan funding will be the same as last year; however, private companies will fund at a considerably higher rate than public companies
Lower13%
Lower 12%
Lower 19%
Similar65%
Similar79%
Similar77%
Higher22%
Higher9%
Higher4%
0%
10%
20%
30%
40%
50%
60%
70%
80%
90%
100%
Private Small Public Large Public
Perc
ent o
f Com
pani
es
2014 Bonus Funding Compared to the Prior Year
Lower Similar Higher
Source: Radford Custom Practices Reports, Q2 2014.
15 | Compensation Trends in the Medical Device Industry – MassMEDIC
Public vs. Private Cash
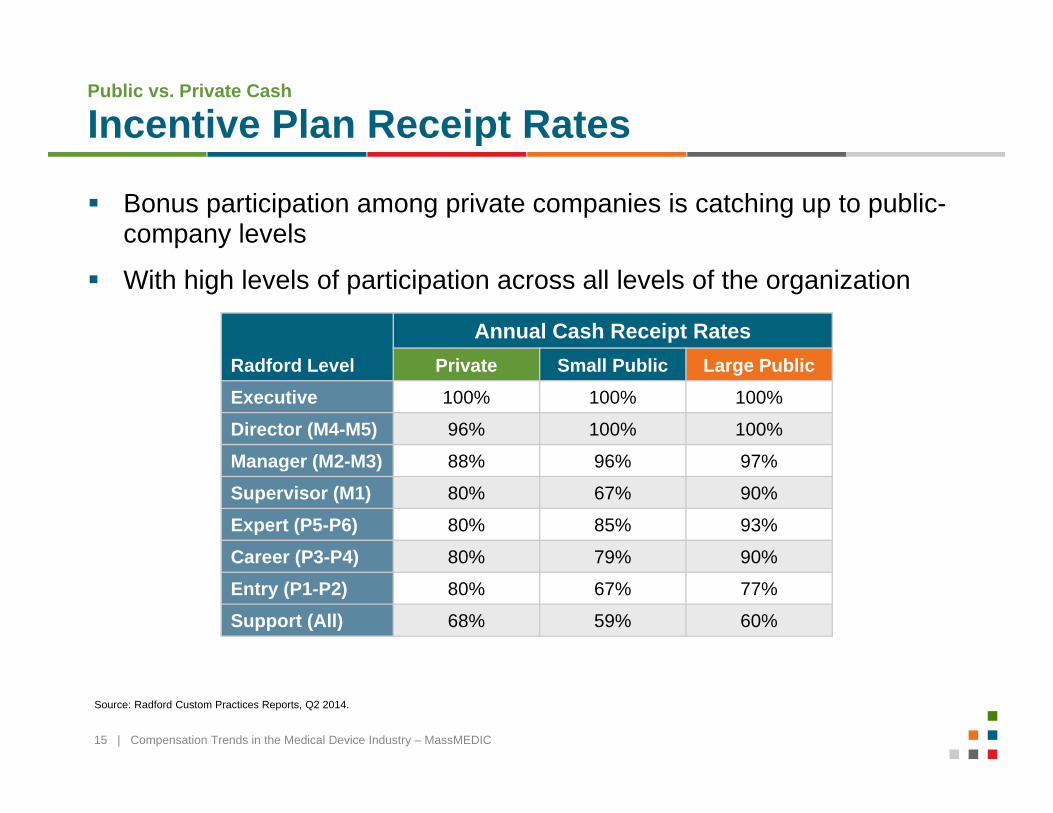
Incentive Plan Receipt Rates
Bonus participation among private companies is catching up to public-company levels
With high levels of participation across all levels of the organization
Source: Radford Custom Practices Reports, Q2 2014.
Radford Level
Annual Cash Receipt RatesPrivate Small Public Large Public
Executive 100% 100% 100%
Director (M4-M5) 96% 100% 100%
Manager (M2-M3) 88% 96% 97%
Supervisor (M1) 80% 67% 90%
Expert (P5-P6) 80% 85% 93%
Career (P3-P4) 80% 79% 90%
Entry (P1-P2) 80% 67% 77%
Support (All) 68% 59% 60%
16 | Compensation Trends in the Medical Device Industry – MassMEDIC
Private vs. Public Cash
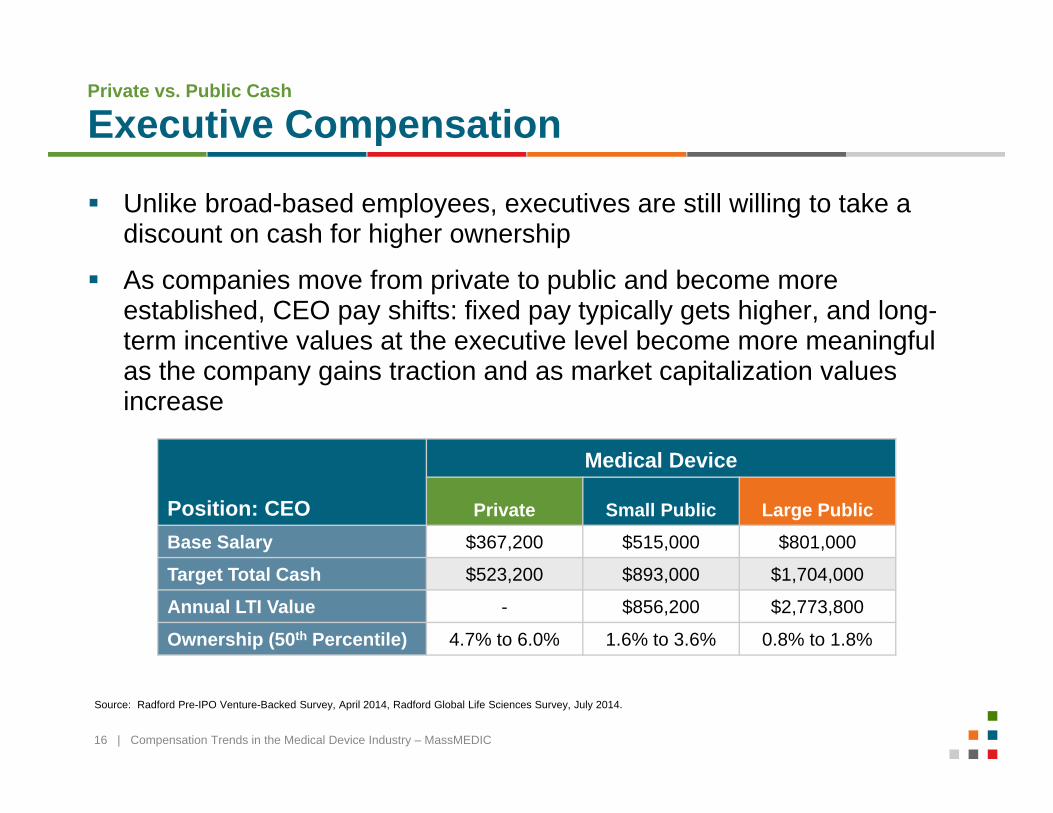
Executive Compensation
Unlike broad-based employees, executives are still willing to take a discount on cash for higher ownership
As companies move from private to public and become more established, CEO pay shifts: fixed pay typically gets higher, and long-term incentive values at the executive level become more meaningful as the company gains traction and as market capitalization values increase
Position: CEO
Medical Device
Private Small Public Large PublicBase Salary $367,200 $515,000 $801,000
Target Total Cash $523,200 $893,000 $1,704,000
Annual LTI Value - $856,200 $2,773,800
Ownership (50th Percentile) 4.7% to 6.0% 1.6% to 3.6% 0.8% to 1.8%
Source: Radford Pre-IPO Venture-Backed Survey, April 2014, Radford Global Life Sciences Survey, July 2014.
17 | Compensation Trends in the Medical Device Industry – MassMEDIC
Private vs. Public Cash
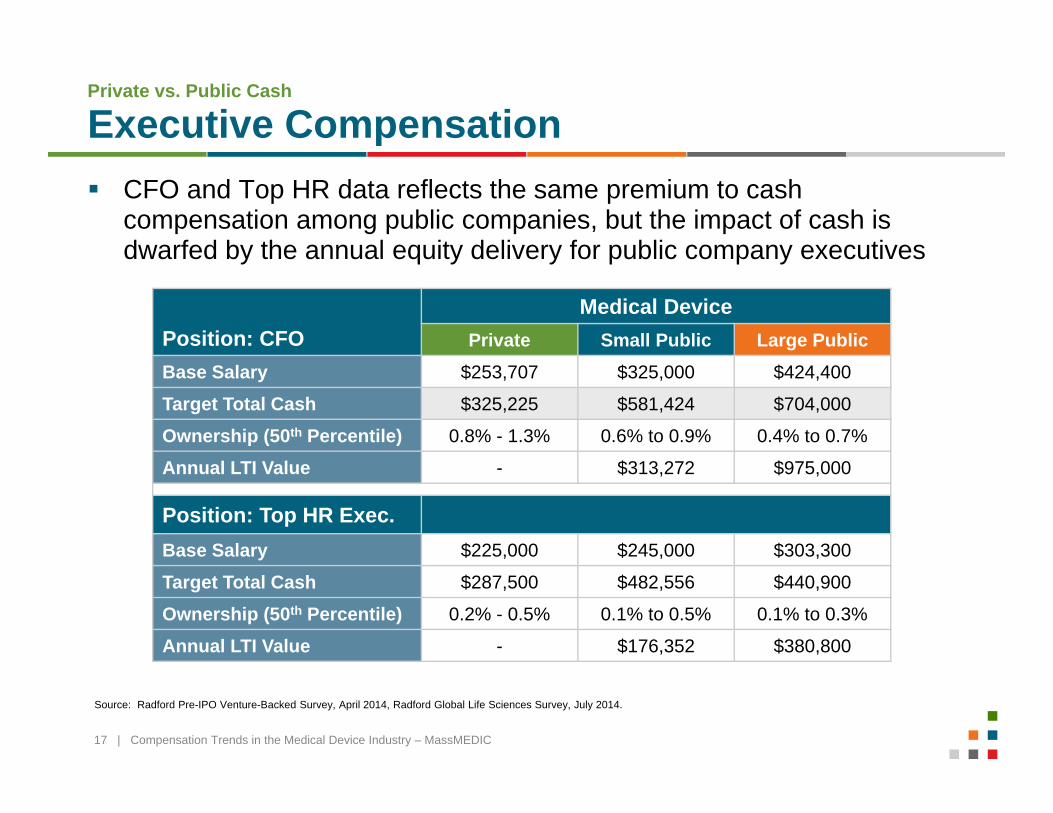
Executive Compensation CFO and Top HR data reflects the same premium to cash
compensation among public companies, but the impact of cash is dwarfed by the annual equity delivery for public company executives
Source: Radford Pre-IPO Venture-Backed Survey, April 2014, Radford Global Life Sciences Survey, July 2014.
Position: CFOMedical Device
Private Small Public Large PublicBase Salary $253,707 $325,000 $424,400
Target Total Cash $325,225 $581,424 $704,000
Ownership (50th Percentile) 0.8% - 1.3% 0.6% to 0.9% 0.4% to 0.7%
Annual LTI Value - $313,272 $975,000
Position: Top HR Exec.Base Salary $225,000 $245,000 $303,300
Target Total Cash $287,500 $482,556 $440,900
Ownership (50th Percentile) 0.2% - 0.5% 0.1% to 0.5% 0.1% to 0.3%
Annual LTI Value - $176,352 $380,800
18 | Compensation Trends in the Medical Device Industry – MassMEDIC
Pay Frameworks
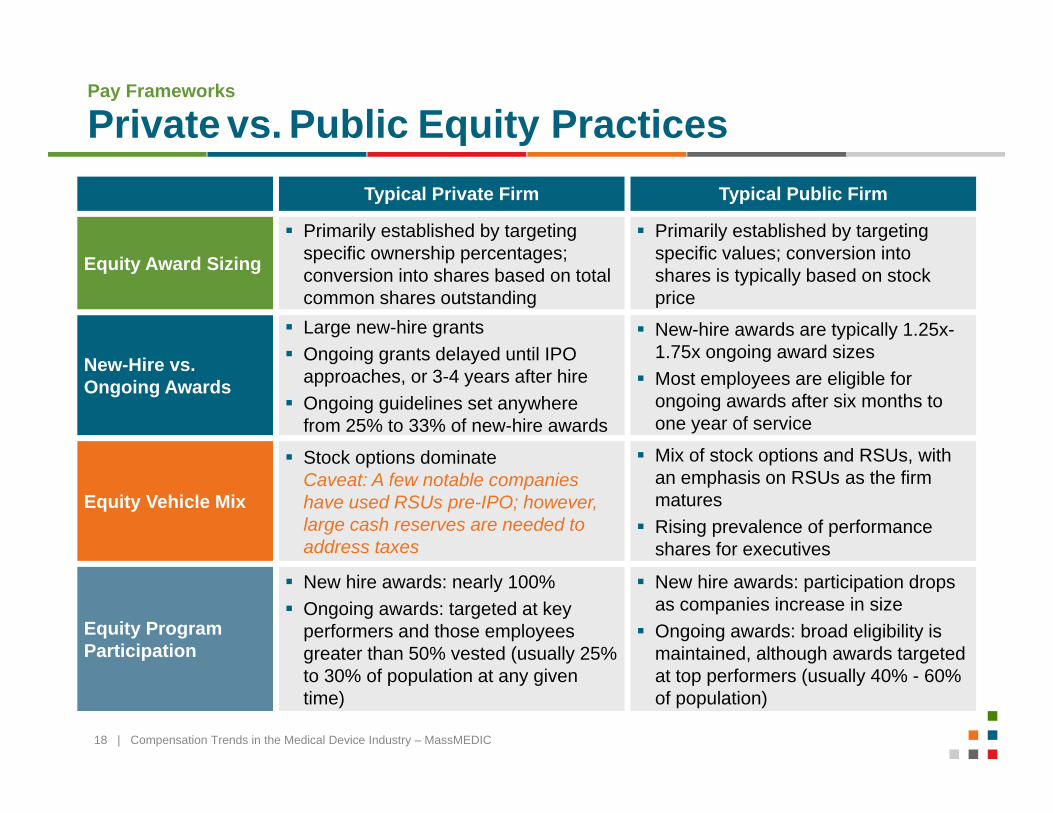
Private vs. Public Equity PracticesTypical Private Firm Typical Public Firm
Equity Award Sizing
Primarily established by targeting specific ownership percentages; conversion into shares based on total common shares outstanding
Primarily established by targeting specific values; conversion into shares is typically based on stock price
New-Hire vs. Ongoing Awards
Large new-hire grants Ongoing grants delayed until IPO
approaches, or 3-4 years after hire Ongoing guidelines set anywhere
from 25% to 33% of new-hire awards
New-hire awards are typically 1.25x-1.75x ongoing award sizes
Most employees are eligible for ongoing awards after six months to one year of service
Equity Vehicle Mix
Stock options dominateCaveat: A few notable companies have used RSUs pre-IPO; however, large cash reserves are needed to address taxes
Mix of stock options and RSUs, with an emphasis on RSUs as the firm matures
Rising prevalence of performance shares for executives
Equity Program Participation
New hire awards: nearly 100% Ongoing awards: targeted at key
performers and those employees greater than 50% vested (usually 25% to 30% of population at any given time)
New hire awards: participation drops as companies increase in size
Ongoing awards: broad eligibility is maintained, although awards targeted at top performers (usually 40% - 60% of population)
19 | Compensation Trends in the Medical Device Industry – MassMEDIC
Private vs. Public Equity
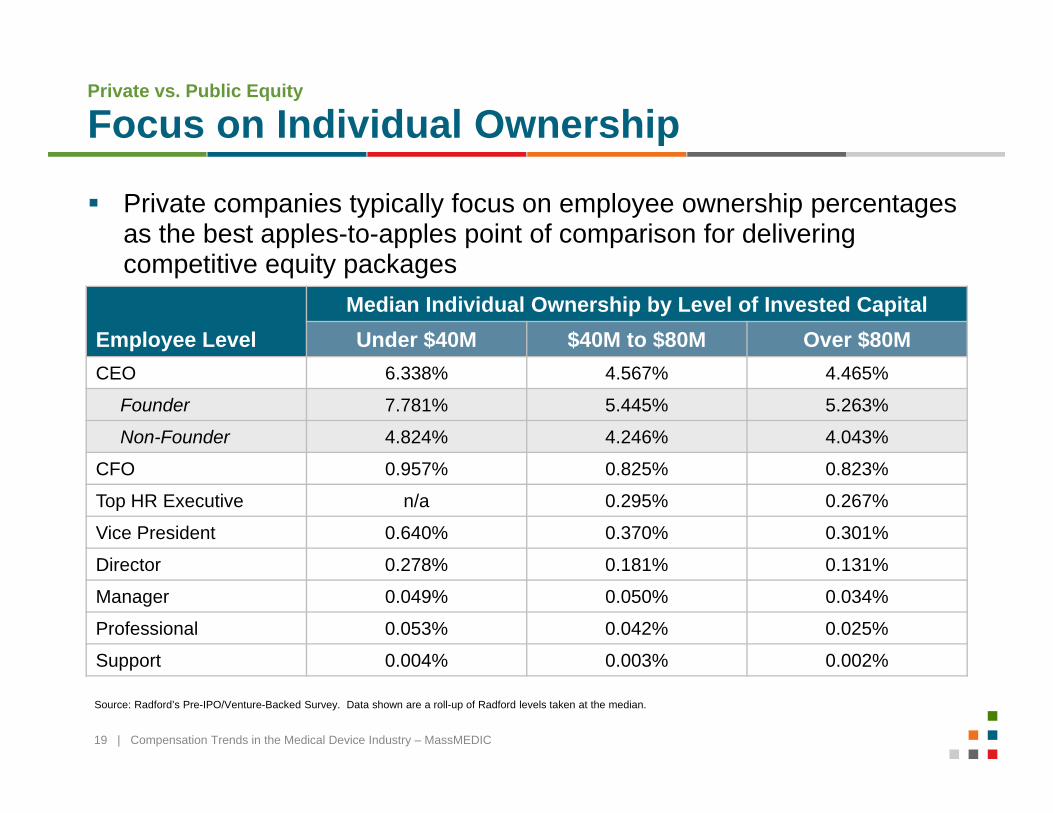
Focus on Individual Ownership
Employee LevelMedian Individual Ownership by Level of Invested CapitalUnder $40M $40M to $80M Over $80M
CEO 6.338% 4.567% 4.465%
Founder 7.781% 5.445% 5.263%
Non-Founder 4.824% 4.246% 4.043%
CFO 0.957% 0.825% 0.823%
Top HR Executive n/a 0.295% 0.267%
Vice President 0.640% 0.370% 0.301%
Director 0.278% 0.181% 0.131%
Manager 0.049% 0.050% 0.034%
Professional 0.053% 0.042% 0.025%
Support 0.004% 0.003% 0.002%
Source: Radford’s Pre-IPO/Venture-Backed Survey. Data shown are a roll-up of Radford levels taken at the median.
Private companies typically focus on employee ownership percentages as the best apples-to-apples point of comparison for delivering competitive equity packages
20 | Compensation Trends in the Medical Device Industry – MassMEDIC
Private vs. Public Equity
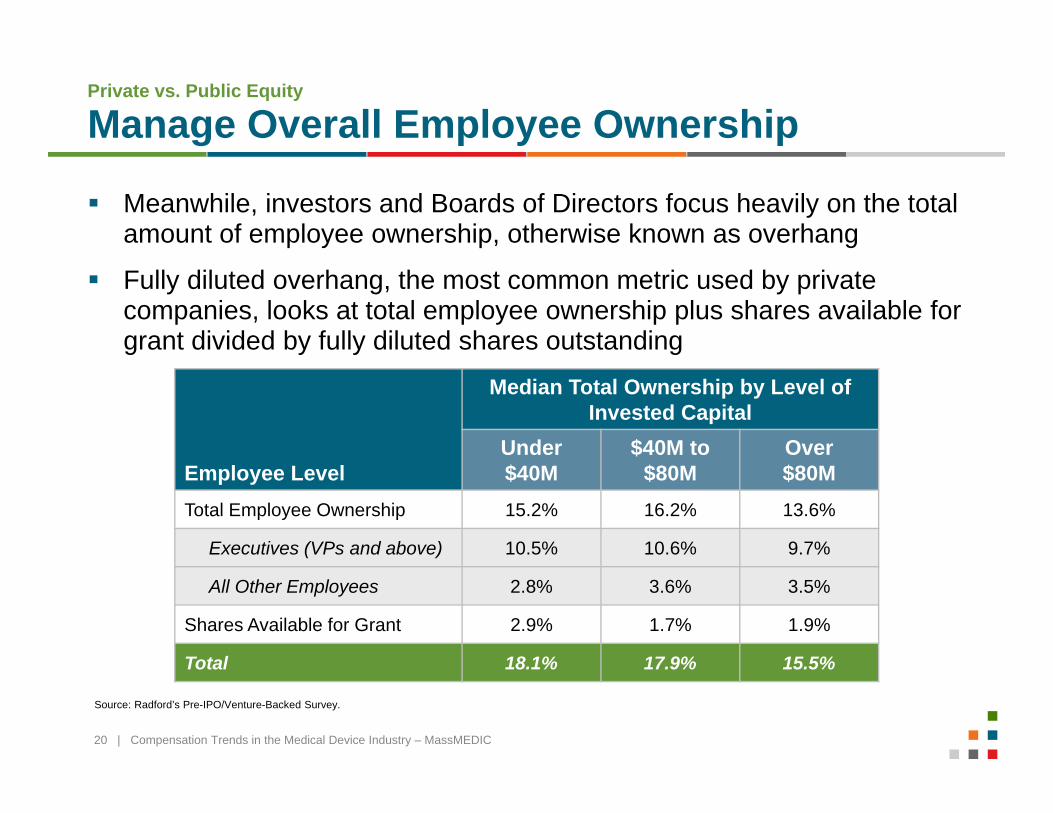
Manage Overall Employee Ownership
Employee Level
Median Total Ownership by Level of Invested Capital
Under $40M
$40M to $80M
Over$80M
Total Employee Ownership 15.2% 16.2% 13.6%
Executives (VPs and above) 10.5% 10.6% 9.7%
All Other Employees 2.8% 3.6% 3.5%
Shares Available for Grant 2.9% 1.7% 1.9%
Total 18.1% 17.9% 15.5%
Meanwhile, investors and Boards of Directors focus heavily on the total amount of employee ownership, otherwise known as overhang
Fully diluted overhang, the most common metric used by private companies, looks at total employee ownership plus shares available for grant divided by fully diluted shares outstanding
Source: Radford’s Pre-IPO/Venture-Backed Survey.
21 | Compensation Trends in the Medical Device Industry – MassMEDIC
Private vs. Public Equity
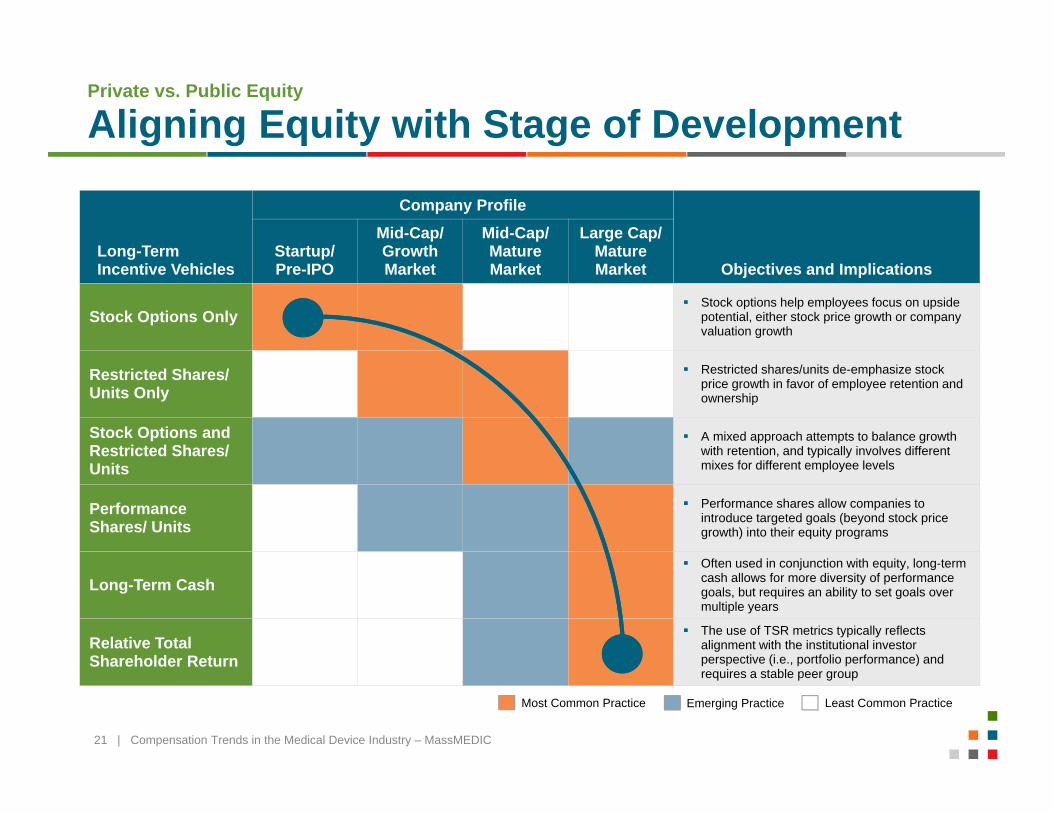
Aligning Equity with Stage of Development
Long-Term Incentive Vehicles
Company Profile
Objectives and ImplicationsStartup/ Pre-IPO
Mid-Cap/ Growth Market
Mid-Cap/ Mature Market
Large Cap/Mature Market
Stock Options Only Stock options help employees focus on upside
potential, either stock price growth or company valuation growth
Restricted Shares/ Units Only
Restricted shares/units de-emphasize stock price growth in favor of employee retention and ownership
Stock Options and Restricted Shares/ Units
A mixed approach attempts to balance growth with retention, and typically involves different mixes for different employee levels
PerformanceShares/ Units
Performance shares allow companies to introduce targeted goals (beyond stock price growth) into their equity programs
Long-Term Cash Often used in conjunction with equity, long-term
cash allows for more diversity of performance goals, but requires an ability to set goals over multiple years
Relative Total Shareholder Return
The use of TSR metrics typically reflects alignment with the institutional investor perspective (i.e., portfolio performance) and requires a stable peer group
Emerging Practice Least Common PracticeMost Common Practice
22 | Compensation Trends in the Medical Device Industry – MassMEDIC
Public Equity
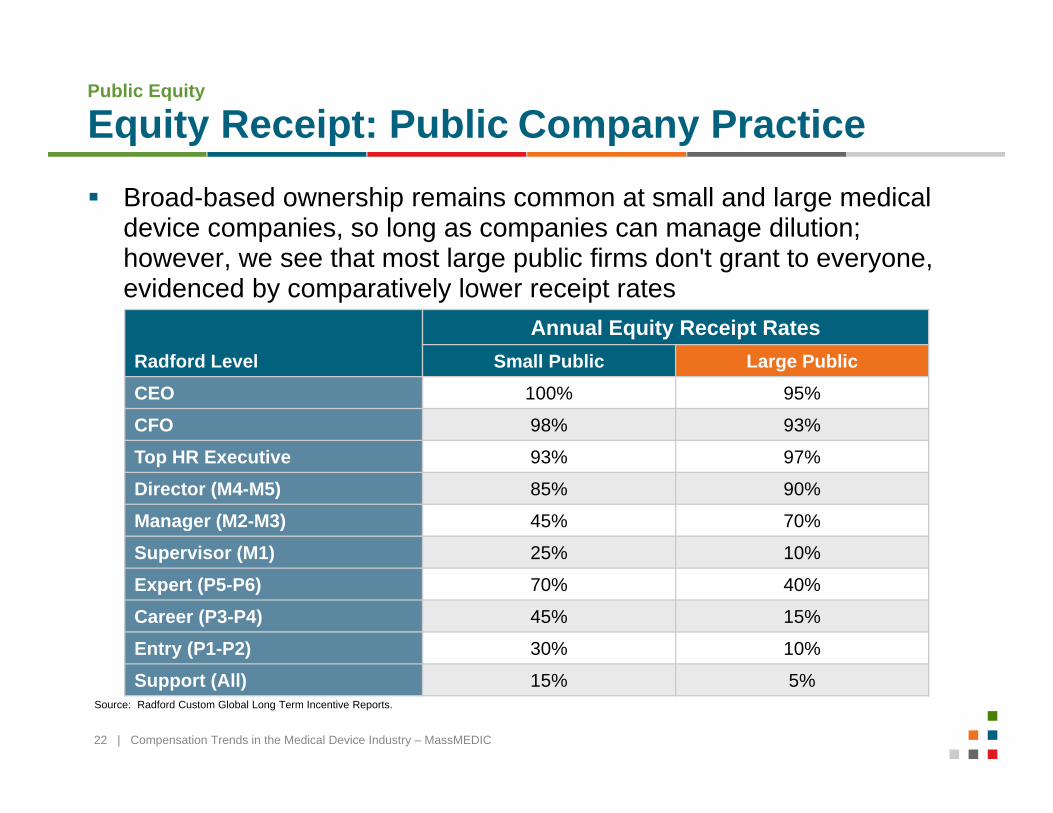
Equity Receipt: Public Company Practice Broad-based ownership remains common at small and large medical
device companies, so long as companies can manage dilution; however, we see that most large public firms don't grant to everyone, evidenced by comparatively lower receipt rates
Source: Radford Custom Global Long Term Incentive Reports.
Radford Level
Annual Equity Receipt RatesSmall Public Large Public
CEO 100% 95%
CFO 98% 93%
Top HR Executive 93% 97%
Director (M4-M5) 85% 90%
Manager (M2-M3) 45% 70%
Supervisor (M1) 25% 10%
Expert (P5-P6) 70% 40%
Career (P3-P4) 45% 15%
Entry (P1-P2) 30% 10%
Support (All) 15% 5%
23 | Compensation Trends in the Medical Device Industry – MassMEDIC
Public Equity
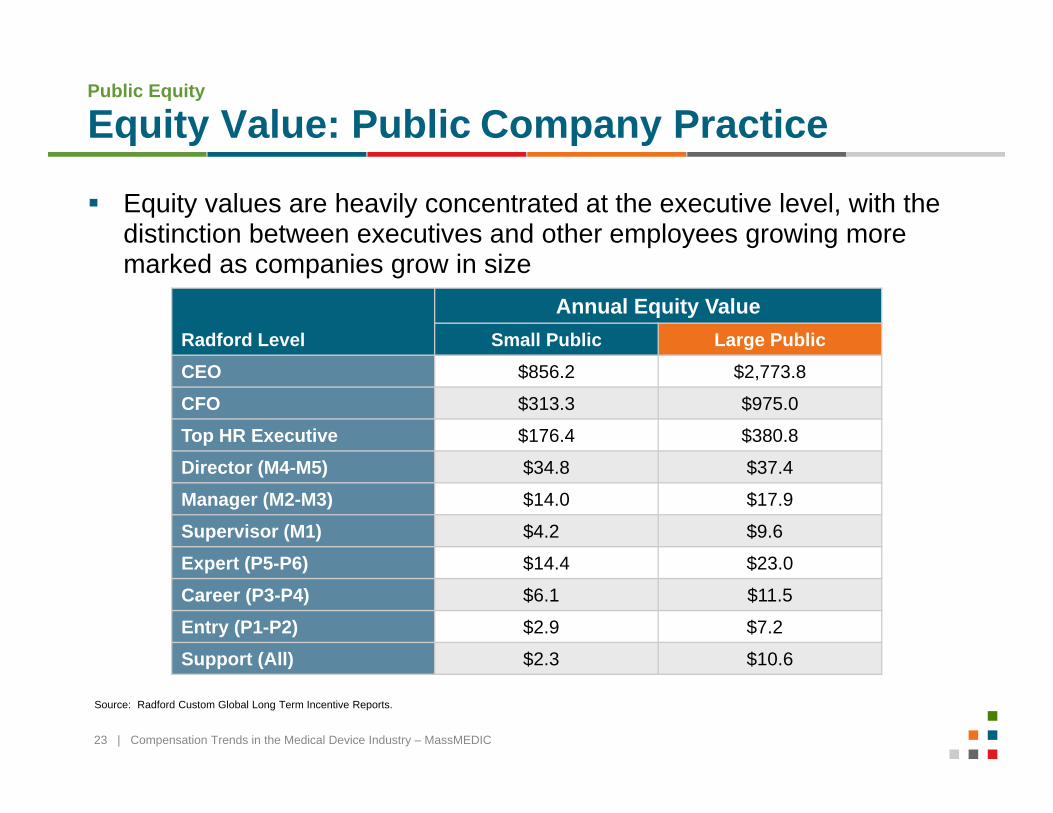
Equity Value: Public Company Practice
Equity values are heavily concentrated at the executive level, with the distinction between executives and other employees growing more marked as companies grow in size
Source: Radford Custom Global Long Term Incentive Reports.
Radford Level
Annual Equity ValueSmall Public Large Public
CEO $856.2 $2,773.8
CFO $313.3 $975.0
Top HR Executive $176.4 $380.8
Director (M4-M5) $34.8 $37.4
Manager (M2-M3) $14.0 $17.9
Supervisor (M1) $4.20 $9.60
Expert (P5-P6) $14.4 $23.0
Career (P3-P4) $6.10 $11.5
Entry (P1-P2) $2.90 $7.20
Support (All) $2.30 $10.6
24 | Compensation Trends in the Medical Device Industry – MassMEDIC
Public Equity
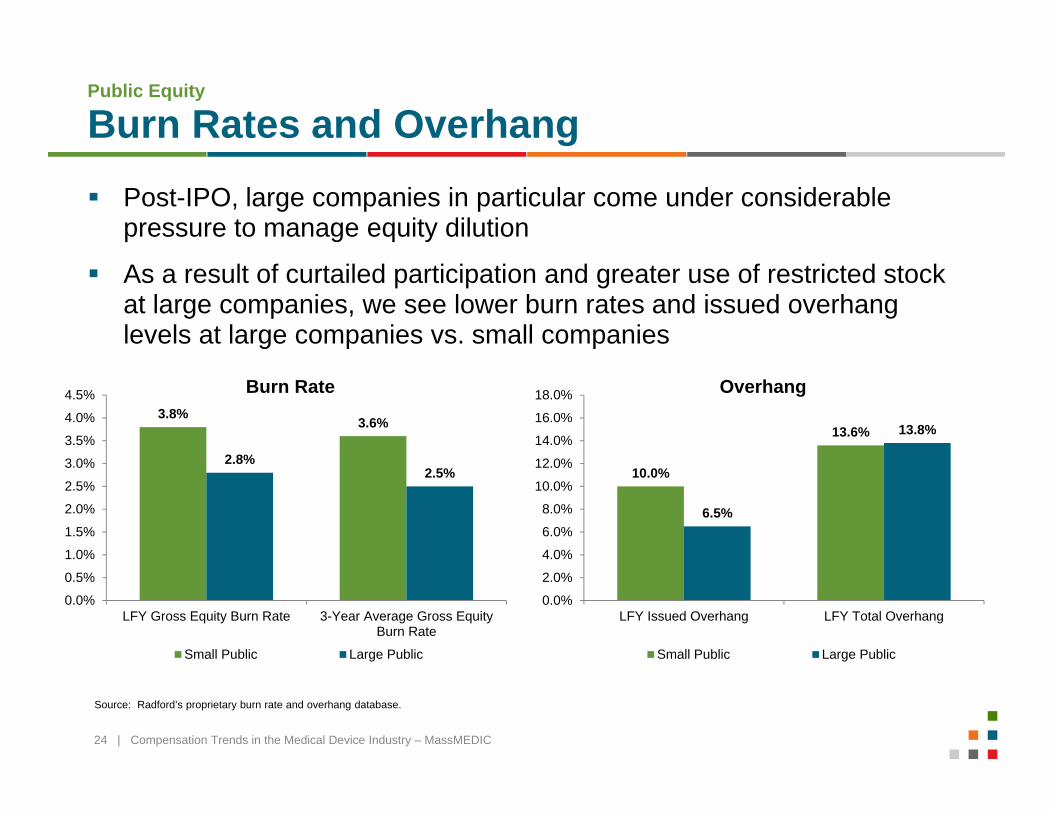
Burn Rates and Overhang Post-IPO, large companies in particular come under considerable
pressure to manage equity dilution
As a result of curtailed participation and greater use of restricted stock at large companies, we see lower burn rates and issued overhang levels at large companies vs. small companies
3.8% 3.6%
2.8%2.5%
0.0%
0.5%
1.0%
1.5%
2.0%
2.5%
3.0%
3.5%
4.0%
4.5%
LFY Gross Equity Burn Rate 3-Year Average Gross EquityBurn Rate
Burn Rate
Small Public Large Public
10.0%
13.6%
6.5%
13.8%
0.0%
2.0%
4.0%
6.0%
8.0%
10.0%
12.0%
14.0%
16.0%
18.0%
LFY Issued Overhang LFY Total Overhang
Overhang
Small Public Large Public
Source: Radford’s proprietary burn rate and overhang database.
25 | Compensation Trends in the Medical Device Industry – MassMEDIC
Key Takeaways Labor markets are tightening and voluntary turnover has increased
Companies increasingly need to act proactively and defensively to lock-in key talent which means more aggressive cash positioning and cash/equity retention programs
Merit pools for 2015 will be ~3% and probably trending higher with adjustment pools ranging .5 to 1%
The hot IPO marketplace has reinvigorated employees interest in equity compensation (even stock options)
However larger public companies continue to be constrained in delivering the same broad-based equity grants that are common among Private and smaller Public Companies

26 | Compensation Trends in the Medical Device Industry – MassMEDIC
Questions?