Embed Size (px)
Citation preview
Summary of Community and Brokered Transportation – 2005
MedicaidTransportationBrokers
Medicaidisafederalentitlementprogramthatpaysforbasichealthcareservicesforlow-incomeindividualsandlong-termcareforeldersandpeoplewithdisabilities.CongressestablishedMedicaidin1965byenactingtheMedicalAssistanceProgramunderTitleXIXoftheSocialSecurityAct(PublicLaw89-97).StatesadministertheirownMedicaidprograms and establish their own eligibility standards, benefits pack-ages,paymentrates,andrulesconsistentwithfederalrequirements.Thefederalgovernmentrequiresstatestoprovidenon-emergencymedicaltransportation(NEMT)forthoseMedicaidclientsthatcouldnototherwiseaccessmedicalfacilitiesandservices.
TheHealthandRecoveryServicesAdministration1(HRSA)oftheDepartmentofSocialandHealthServices(DSHS)administersWashingtonState’sMedicaidprogram.Since1989,WashingtonhasusedaregionalbrokeragesystemtocoordinateitsMedicaidtranspor-tation.HRSAdividesthestateinto13transportationserviceregionsandcontractswithanetworkofbrokers.ThebrokersverifyMedicaidclients’eligibilityforthetransportationprogramandarrangetheleastcostlymethodoftransportationwhichisavailableandappropriateforeachclient.Transportationmethodsusedbythebrokersincludepublicbus,gasvouchers,clientandvolunteermileagereimbursement,non-profit providers, taxi, cabulance, ferry, and commercial bus and air.HRSAdoesnotpermitbrokerstoprovideridesdirectlyexceptincertainregionswheretherearenotenoughtransportationoptionstomeettheNEMTneed.Brokersreceiveanadministrativefeetocoordinatethetransportationprogramplusreimbursementforthedirecttripcosts.
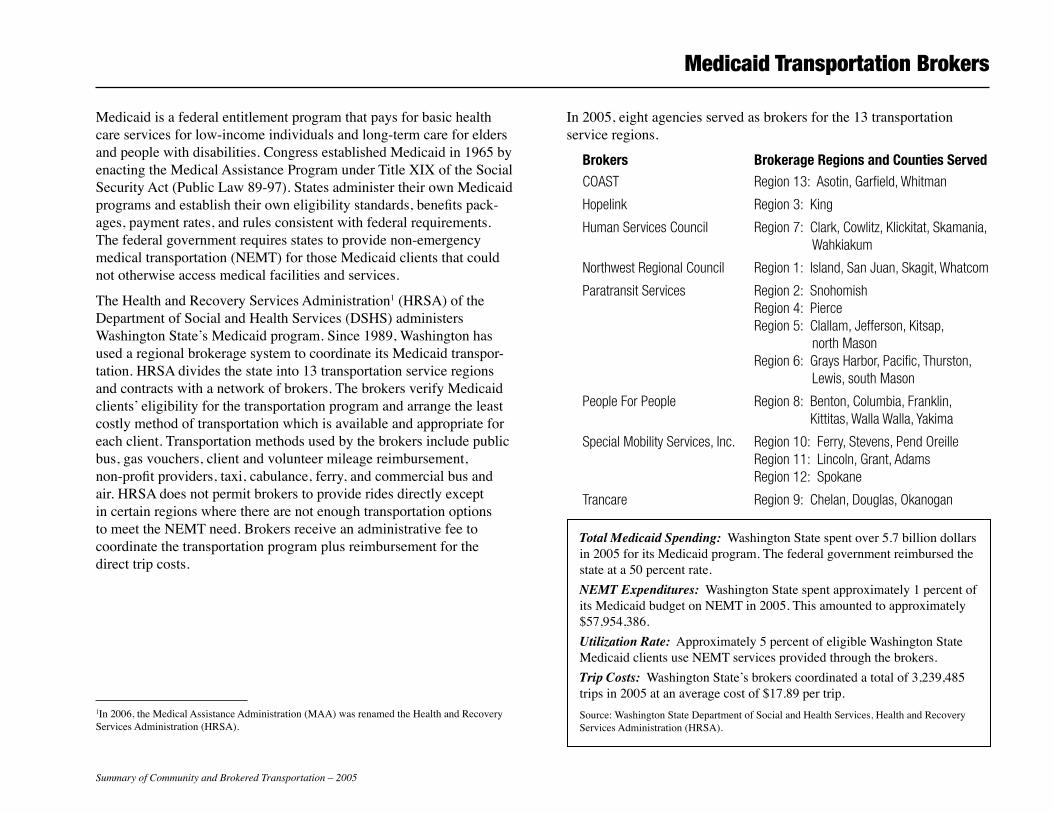
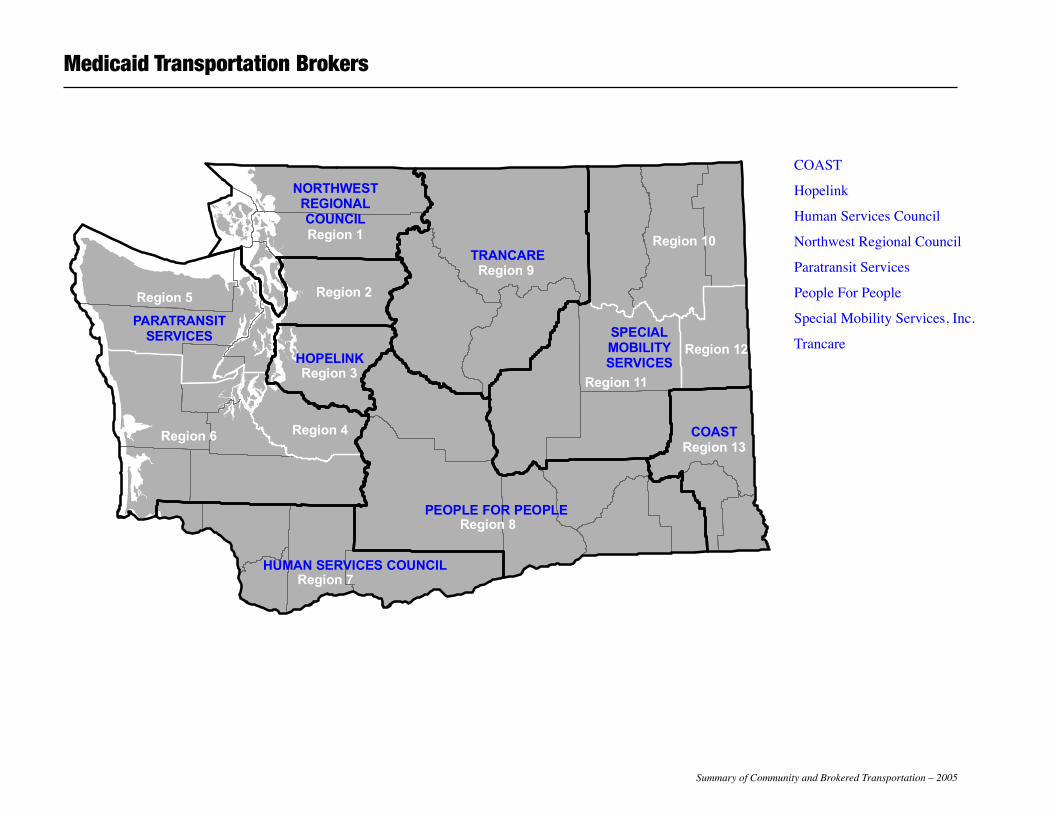
In2005,eightagenciesservedasbrokersforthe13transportationserviceregions.
Brokers BrokerageRegionsandCountiesServed COAST Region13:Asotin,Garfield,Whitman
Hopelink Region3:King
HumanServicesCouncil Region7:Clark,Cowlitz,Klickitat,Skamania, Wahkiakum
NorthwestRegionalCouncil Region1:Island,SanJuan,Skagit,Whatcom
ParatransitServices Region2:Snohomish Region4:Pierce Region5:Clallam,Jefferson,Kitsap, northMason Region6:GraysHarbor,Pacific,Thurston, Lewis,southMason
PeopleForPeople Region8:Benton,Columbia,Franklin, Kittitas,WallaWalla,Yakima
SpecialMobilityServices,Inc. Region10:Ferry,Stevens,PendOreille Region11:Lincoln,Grant,Adams Region12:Spokane
Trancare Region9:Chelan,Douglas,Okanogan
Total Medicaid Spending:WashingtonStatespentover5.7billiondollarsin2005foritsMedicaidprogram.Thefederalgovernmentreimbursedthestateata50percentrate.NEMT Expenditures:WashingtonStatespentapproximately1percentofitsMedicaidbudgetonNEMTin2005.Thisamountedtoapproximately$57,954,386.Utilization Rate:Approximately5percentofeligibleWashingtonStateMedicaidclientsuseNEMTservicesprovidedthroughthebrokers.Trip Costs: Washington State’s brokers coordinated a total of 3,239,485 tripsin2005atanaveragecostof$17.89pertrip.Source:WashingtonStateDepartmentofSocialandHealthServices,HealthandRecoveryServicesAdministration(HRSA).
1In2006,theMedicalAssistanceAdministration(MAA)wasrenamedtheHealthandRecoveryServicesAdministration(HRSA).
SummaryofCommunityandBrokeredTransportation–2005
PEOPLE FOR PEOPLE
HUMAN SERVICES COUNCIL
PARATRANSITSERVICES
NORTHWESTREGIONALCOUNCIL
TRANCARE
SPECIALMOBILITYSERVICES
COAST
HOPELINK
Region 6
Region 5
Region 8
Region 11
Region 10
Region 12
Region 9
Region 1
Region 3
Region 4
Region 7
Region 13
Region 2
COAST
Hopelink
Human Services Council
Northwest Regional Council
Paratransit Services
People For People
Special Mobility Services, Inc.
Trancare
Medicaid Transportation Brokers
Summary of Community and Brokered Transportation – 2005 Page 167
COAST
System Snapshot• OperatingName:CouncilonAgingandHumanServices
dbaCOAST
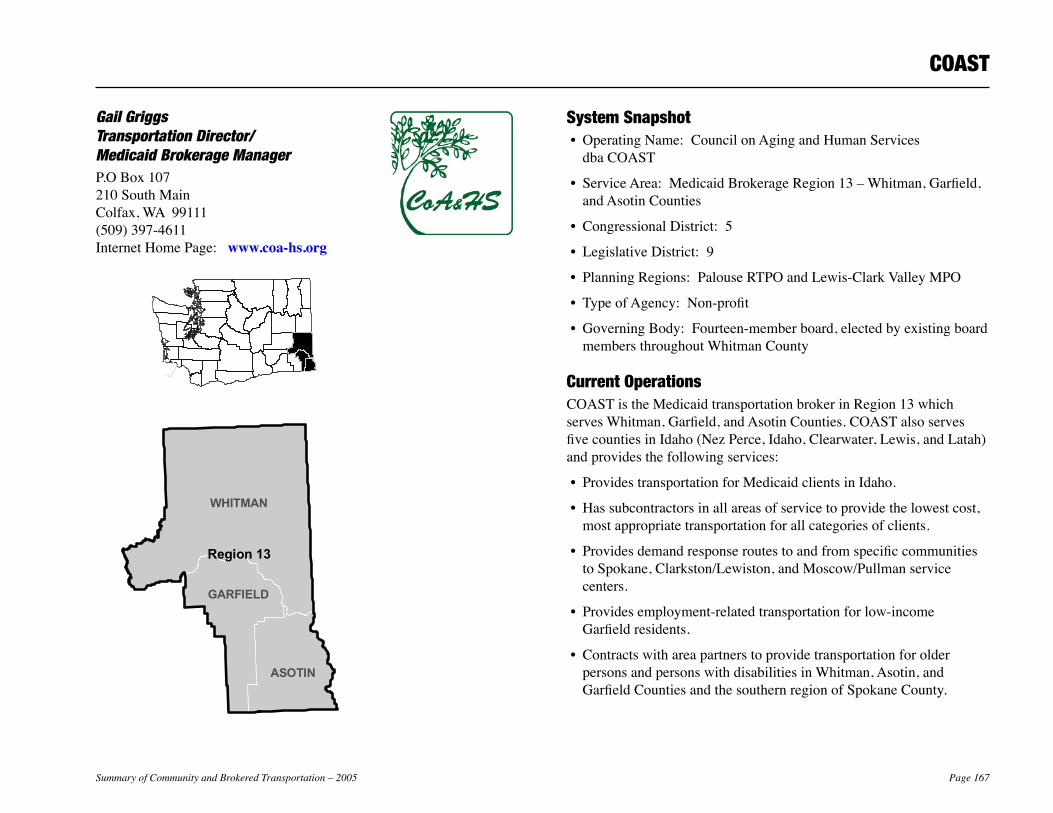
• ServiceArea:MedicaidBrokerageRegion13–Whitman,Garfield,andAsotinCounties
• CongressionalDistrict:5
• LegislativeDistrict:9
• PlanningRegions:PalouseRTPOandLewis-ClarkValleyMPO
• TypeofAgency:Non-profit
• GoverningBody:Fourteen-memberboard,electedbyexistingboardmembersthroughoutWhitmanCounty
Current OperationsCOASTistheMedicaidtransportationbrokerinRegion13whichservesWhitman,Garfield,andAsotinCounties.COASTalsoservesfivecountiesinIdaho(NezPerce,Idaho,Clearwater,Lewis,andLatah)andprovidesthefollowingservices:
• ProvidestransportationforMedicaidclientsinIdaho.
• Hassubcontractorsinallareasofservicetoprovidethelowestcost,mostappropriatetransportationforallcategoriesofclients.
• ProvidesdemandresponseroutestoandfromspecificcommunitiestoSpokane,Clarkston/Lewiston,andMoscow/Pullmanservicecenters.
• Providesemployment-relatedtransportationforlow-incomeGarfieldresidents.
• ContractswithareapartnerstoprovidetransportationforolderpersonsandpersonswithdisabilitiesinWhitman,Asotin,andGarfieldCountiesandthesouthernregionofSpokaneCounty.
Gail Griggs Transportation Director/ Medicaid Brokerage ManagerP.OBox107210SouthMainColfax,WA99111(509)397-4611InternetHomePage:www.coa-hs.org
Region 13
ASOTIN
WHITMAN
GARFIELD
Page 168 Summary of Community and Brokered Transportation – 2005
• Providesbi-monthly,demandresponsetripsfromisolatedruralcommunitiestourbanservicecentersaswellasdailyrouteslinkingColfaxandPullmanandflexibleroutedservicesincommunitiesofClarkston,Pullman,andColfax.
• CoordinatesvolunteerdriversincludingtheCommunityVanprogramwhichprovidesexpandedaccessforallcitizensoftheCityofPalouseandnearbyTownofGarfield.
• Operatesaregionaldispatch/informationcenterservingthecountiesofWhitman,Asotin,GarfieldandthesouthernpartofSpokaneCountyinWashingtonaswellasfivenorthcentralIdahocounties.
Intermodal ConnectionsCOASTmakesactiveconnectionswithalloftheexistingpublictransitsystemsandprovidersinthearea.
Contracted Transportation ProvidersProvidestransportationforMedicaidclientsdirectlyaswellascontractswiththefollowing12providers:
All-WaysTransportation–Lewiston,IdahoBlack&WhiteCab–Lewiston,IdahoClassicTransportation–Genesee,IdahoEvergreenTowncar–Seattle,KingCountyGarfieldCountyHospitalDistrict–Pomeroy,GarfieldCountyGarfieldCountyTransportation–Pomeroy,GarfieldCountyInterlink–Clarkston,AsotinCountyTransTech–Lewiston,IdahoPullmanTransit–Pullman,WhitmanCountyRSVP–Lewiston,IdahoSpecialMobilityServices–Spokane,SpokaneCountyWheelchairTransport–Spokane,SpokaneCounty
Formal PlansWashingtonTransportationPlan
ACCTCoordinationPlansforAsotinandWhitmanCounties(2001-2003)
AsotinCountyResidentialDevelopmentalServicesInteragencyPlan(2001-2003)
AgingandLong-TermCareofEasternWashingtonPlan(2000-2003)
SoutheasternWashingtonAgingandLong-TermCarePlan(2000-2003)
PalouseEconomicDevelopmentCouncil,EconomicPlan(1995)
WhitmanCountyAllianceProviderSurveyandServicePlan(1999)
2005 Achievements• SuccessfulcompetitivebiddertocontinueastheMedicaidbroker
forRegion13.
• SuccessfulapplicantforstatewidecompetitivefundingviatheWSDOTConsolidatedGrantsProgramforbothoperatingandcapitalfunding.
• IdentifiedinTransportationResearchBoard(TRB)nationalstudyasthemostcoordinatedrural/non-urbantransportationsystemintheUnitedStates.
• IdentifiedinGovernmentAccountabilityOffice(GAO)studyasmodelprogramforcoordinationofservicesandfundingforolderpersons.
• IncludedasacasestudyinaU.S.AdministrationonAging(AoA)nationalstudyontransportationforseniorservices.
• VisitedbyrepresentativesoftheGAOintheprocessofstudyingHeadStarttransportationandutilizationofmulti-functionschoolactivitybuses(MFSABs).
COAST
Summary of Community and Brokered Transportation – 2005 Page 169
COAST
2006 Objectives• Operatethesystemandpurchasethreevehiclesincludingatleast
oneMFSAB.
Long-range Plans• FormationofaWhitmanCountySpecialNeedsTransportationBenefitArea.
Page 170 Summary of Community and Brokered Transportation – 2005
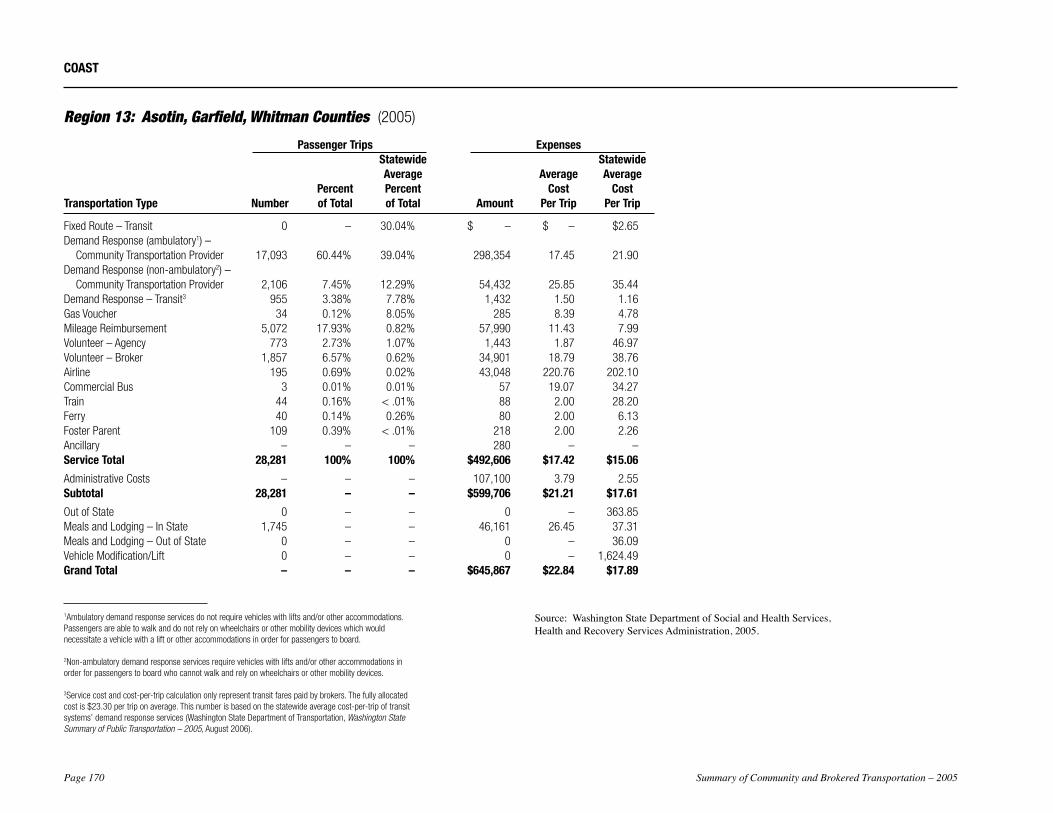
Region 13: Asotin, Garfield, Whitman Counties (2005)
Passenger Trips Expenses Statewide Statewide Average Average Average Percent Percent Cost Cost Transportation Type Number of Total of Total Amount Per Trip Per Trip
Fixed Route – Transit 0 – 30.04% $ – $ – $2.65 Demand Response (ambulatory1) – Community Transportation Provider 17,093 60.44% 39.04% 298,354 17.45 21.90Demand Response (non-ambulatory2) – Community Transportation Provider 2,106 7.45% 12.29% 54,432 25.85 35.44Demand Response – Transit3 955 3.38% 7.78% 1,432 1.50 1.16Gas Voucher 34 0.12% 8.05% 285 8.39 4.78Mileage Reimbursement 5,072 17.93% 0.82% 57,990 11.43 7.99Volunteer – Agency 773 2.73% 1.07% 1,443 1.87 46.97Volunteer – Broker 1,857 6.57% 0.62% 34,901 18.79 38.76Airline 195 0.69% 0.02% 43,048 220.76 202.10Commercial Bus 3 0.01% 0.01% 57 19.07 34.27Train 44 0.16% < .01% 88 2.00 28.20Ferry 40 0.14% 0.26% 80 2.00 6.13Foster Parent 109 0.39% < .01% 218 2.00 2.26Ancillary – – – 280 – –Service Total 28,281 100% 100% $492,606 $17.42 $15.06
Administrative Costs – – – 107,100 3.79 2.55Subtotal 28,281 – – $599,706 $21.21 $17.61
Out of State 0 – – 0 – 363.85Meals and Lodging – In State 1,745 – – 46,161 26.45 37.31Meals and Lodging – Out of State 0 – – 0 – 36.09Vehicle Modification/Lift 0 – – 0 – 1,624.49Grand Total – – – $645,867 $22.84 $17.89
COAST
1Ambulatory demand response services do not require vehicles with lifts and/or other accommodations. Passengers are able to walk and do not rely on wheelchairs or other mobility devices which would necessitate a vehicle with a lift or other accommodations in order for passengers to board.
2Non-ambulatory demand response services require vehicles with lifts and/or other accommodations in order for passengers to board who cannot walk and rely on wheelchairs or other mobility devices.
3Service cost and cost-per-trip calculation only represent transit fares paid by brokers. The fully allocated cost is $23.30 per trip on average. This number is based on the statewide average cost-per-trip of transit systems’ demand response services (Washington State Department of Transportation, Washington State Summary of Public Transportation – 2005, August 2006).
Source:WashingtonStateDepartmentofSocialandHealthServices,HealthandRecoveryServicesAdministration,2005.
Summary of Community and Brokered Transportation – 2005 Page 171
Hopelink
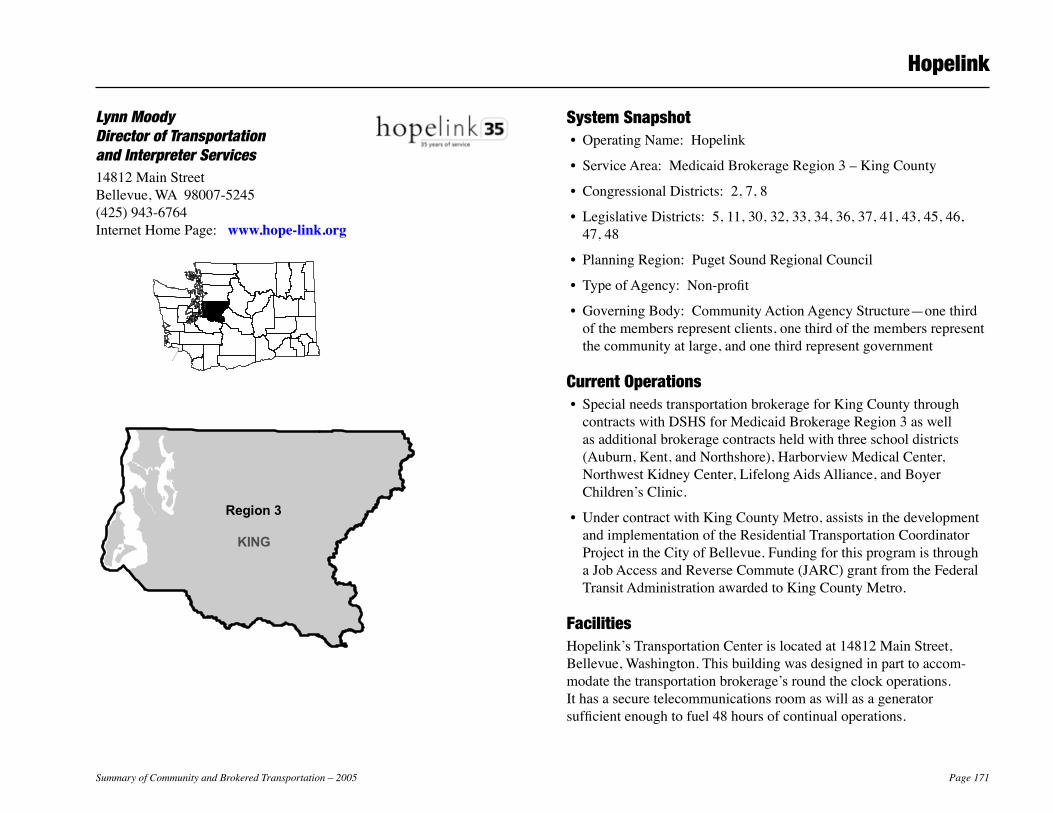
System Snapshot• OperatingName:Hopelink
• ServiceArea:MedicaidBrokerageRegion3–KingCounty
• CongressionalDistricts:2,7,8
• LegislativeDistricts:5,11,30,32,33,34,36,37,41,43,45,46,47,48
• PlanningRegion:PugetSoundRegionalCouncil
• TypeofAgency:Non-profit
• GoverningBody:CommunityActionAgencyStructure—onethirdofthemembersrepresentclients,onethirdofthemembersrepresentthecommunityatlarge,andonethirdrepresentgovernment
Current Operations• SpecialneedstransportationbrokerageforKingCountythrough
contractswithDSHSforMedicaidBrokerageRegion3aswellasadditionalbrokeragecontractsheldwiththreeschooldistricts(Auburn,Kent,andNorthshore),HarborviewMedicalCenter,NorthwestKidneyCenter,LifelongAidsAlliance,andBoyerChildren’sClinic.
• UndercontractwithKingCountyMetro,assistsinthedevelopmentandimplementationoftheResidentialTransportationCoordinatorProjectintheCityofBellevue.FundingforthisprogramisthroughaJobAccessandReverseCommute(JARC)grantfromtheFederalTransitAdministrationawardedtoKingCountyMetro.
FacilitiesHopelink’sTransportationCenterislocatedat14812MainStreet,Bellevue,Washington.Thisbuildingwasdesignedinparttoaccom-modatethetransportationbrokerage’sroundtheclockoperations.Ithasasecuretelecommunicationsroomaswillasageneratorsufficientenoughtofuel48hoursofcontinualoperations.
Lynn Moody Director of Transportation and Interpreter Services14812MainStreetBellevue,WA98007-5245(425)943-6764InternetHomePage:www.hope-link.org
KING
Region 3
KING
Region 3
Page 172 Summary of Community and Brokered Transportation – 2005
Intermodal ConnectionsWashingtonStateFerrySystemCommercialair,bus,andtrainservices
PartnershipsAuburnSchoolDistrictBoyerChildren’sClinicCityofSeattleHumanServicesDepartmentHarborviewMedicalCenterKentSchoolDistrictKingCountyKeyPartnersInTransportationKingCountyMetroMountSiSeniorCenterNon-profitInsurancePool(NPIP)NorthshoreSchoolDistrictNorthwestKidneyCenterPugetSoundEducationalServiceDistrictSoundTransitSeattle/KingCountyTaxiAdvisoryGroupUnitedWayVariousmedicalprovidersandfacilitiesinKingCountyWashingtonStateDepartmentofSocialandHealthServicesWashingtonStateDepartmentofTransportation
Contracted Transportation ProvidersPugetSoundDispatchOrangeCabFarwestTaxiNorthEndTaxiTrans-MedicTransportationNorthwestTransport,Inc.BlueRisinTransportationTacomaYellowCabSeattleExpressStarlineTransportationAmericanCabulanceTransproInc.NeighborhoodHouseTransiaNorthshoreSeniorCenterParatransitServices
Formal PlansPugetSoundRegionalCouncilSoundTransit
Hopelink
Summary of Community and Brokered Transportation – 2005 Page 173
2005 Achievements• Servedover32,746unduplicatedclientsbetweentheTransportation
andInterpreterServicesBrokerages.
• Served166childrenandprovided9,468tripswithMcKinney-Vento/homelessstudentandspecialeducationstudenttransportationcontractswithKent,Auburn,andNorthshoreSchoolDistricts.
• Servedastheleadagencyforfederalcapitalassistancegrants(5310),providedtwonewminibusesforourpartnersNeighborhoodHouseandNorthshoreSeniorCenter,andwroteasuccessfulgrantfor$295,000thatwillprovidesevenmorereplacementvehiclesoverthenexttwoyears.
• AssistedMountSiSeniorCenterindevelopingasuccessfulWSDOTgrantfor$211,000thatwillhelpfundtheMountSiCommunityShuttleintheUpperSnoqualmieValleyforanothertwoyears.
• Procuredanewphonesystemforthebrokerageoperations.
• AwardedtheMetro/BellevueCrossroadsResidentialTransportationCoordinator(RTC)ProgramContract.SixbilingualRTC’sprovidedinformationontransportationoptionstotheirlocalcommunities.
2006 Objectives• Provideover1,200,000brokeredtrips.
• ProcureBrokerageReservationsandSchedulingSoftware.
• ParticipateinthePugetSoundEducationsServiceDistrict’sMcKinney-VentoDemonstrationProjectbrokeringtransportationforhomelessstudents.
• Expandthenumberofschooldistrictsreceivingbrokerageservices.
• ExpandthenumberofResidentialTransportationCoordinatorContracts.
• Overseetheprocurementof5310vehiclesforNorthshoreSeniorCenterandNeighborhoodHouse.
• SuccessfulinstallationofnewphonestructurefortheTransportationContactCenter.
Long-range Plans• DevelopsystemsandproceduresthatbetterprepareHopelinkto
respondtocommunityemergencies.
• Expandaccesstohealthcare,education,employment,socialservices,andcommunityactivities.
• Expandtheutilizationoftechnologytooptimizeagencysystemsandprocessesandtoimprovecustomerservice.
• Expandcoordinationeffortsandpartnerships.
Hopelink
Page 174 Summary of Community and Brokered Transportation – 2005
Hopelink
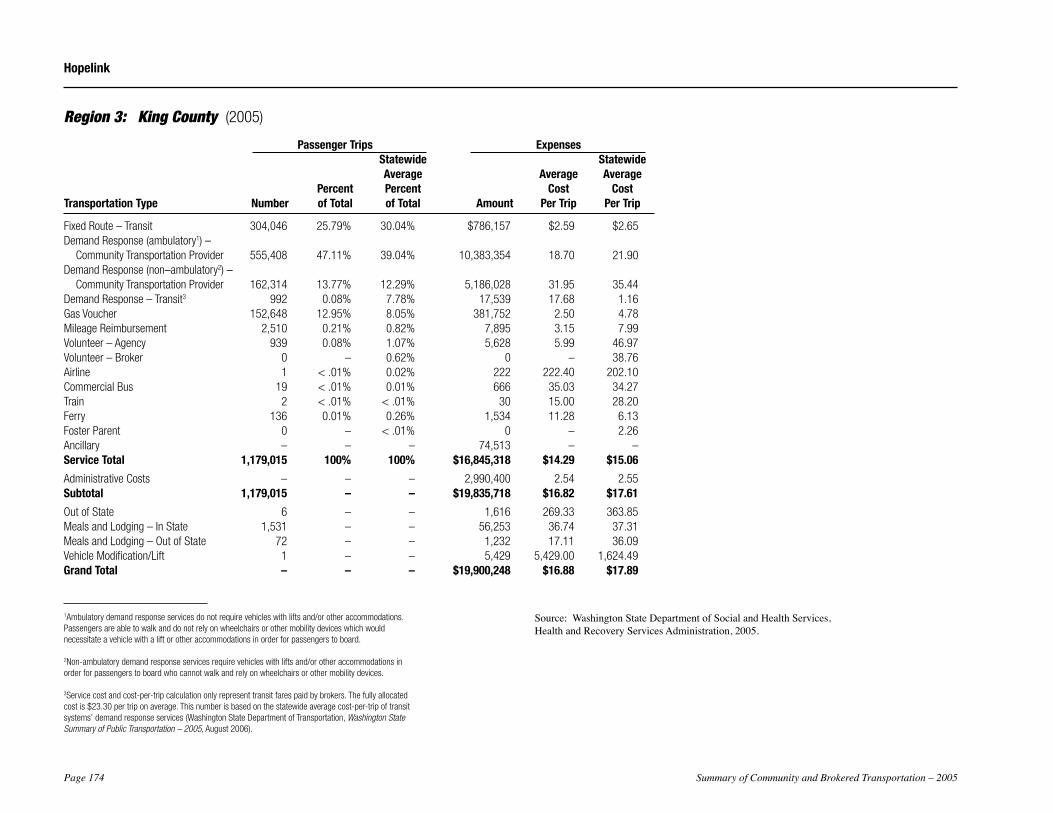
Region 3: King County (2005)
Passenger Trips Expenses Statewide Statewide Average Average Average Percent Percent Cost Cost Transportation Type Number of Total of Total Amount Per Trip Per Trip
Fixed Route – Transit 304,046 25.79% 30.04% $786,157 $2.59 $2.65 Demand Response (ambulatory1) – Community Transportation Provider 555,408 47.11% 39.04% 10,383,354 18.70 21.90Demand Response (non–ambulatory2) – Community Transportation Provider 162,314 13.77% 12.29% 5,186,028 31.95 35.44Demand Response – Transit3 992 0.08% 7.78% 17,539 17.68 1.16Gas Voucher 152,648 12.95% 8.05% 381,752 2.50 4.78Mileage Reimbursement 2,510 0.21% 0.82% 7,895 3.15 7.99Volunteer – Agency 939 0.08% 1.07% 5,628 5.99 46.97Volunteer – Broker 0 – 0.62% 0 – 38.76Airline 1 < .01% 0.02% 222 222.40 202.10Commercial Bus 19 < .01% 0.01% 666 35.03 34.27Train 2 < .01% < .01% 30 15.00 28.20Ferry 136 0.01% 0.26% 1,534 11.28 6.13Foster Parent 0 – < .01% 0 – 2.26Ancillary – – – 74,513 – – Service Total 1,179,015 100% 100% $16,845,318 $14.29 $15.06
Administrative Costs – – – 2,990,400 2.54 2.55Subtotal 1,179,015 – – $19,835,718 $16.82 $17.61
Out of State 6 – – 1,616 269.33 363.85Meals and Lodging – In State 1,531 – – 56,253 36.74 37.31Meals and Lodging – Out of State 72 – – 1,232 17.11 36.09Vehicle Modification/Lift 1 – – 5,429 5,429.00 1,624.49Grand Total – – – $19,900,248 $16.88 $17.89
1Ambulatory demand response services do not require vehicles with lifts and/or other accommodations. Passengers are able to walk and do not rely on wheelchairs or other mobility devices which would necessitate a vehicle with a lift or other accommodations in order for passengers to board.
2Non-ambulatory demand response services require vehicles with lifts and/or other accommodations in order for passengers to board who cannot walk and rely on wheelchairs or other mobility devices.
3Service cost and cost-per-trip calculation only represent transit fares paid by brokers. The fully allocated cost is $23.30 per trip on average. This number is based on the statewide average cost-per-trip of transit systems’ demand response services (Washington State Department of Transportation, Washington State Summary of Public Transportation – 2005, August 2006).
Source:WashingtonStateDepartmentofSocialandHealthServices,HealthandRecoveryServicesAdministration,2005.
Summary of Community and Brokered Transportation – 2005 Page 175
Human Services Council
System Snapshot• OperatingName:HumanServicesCouncil(HSC)
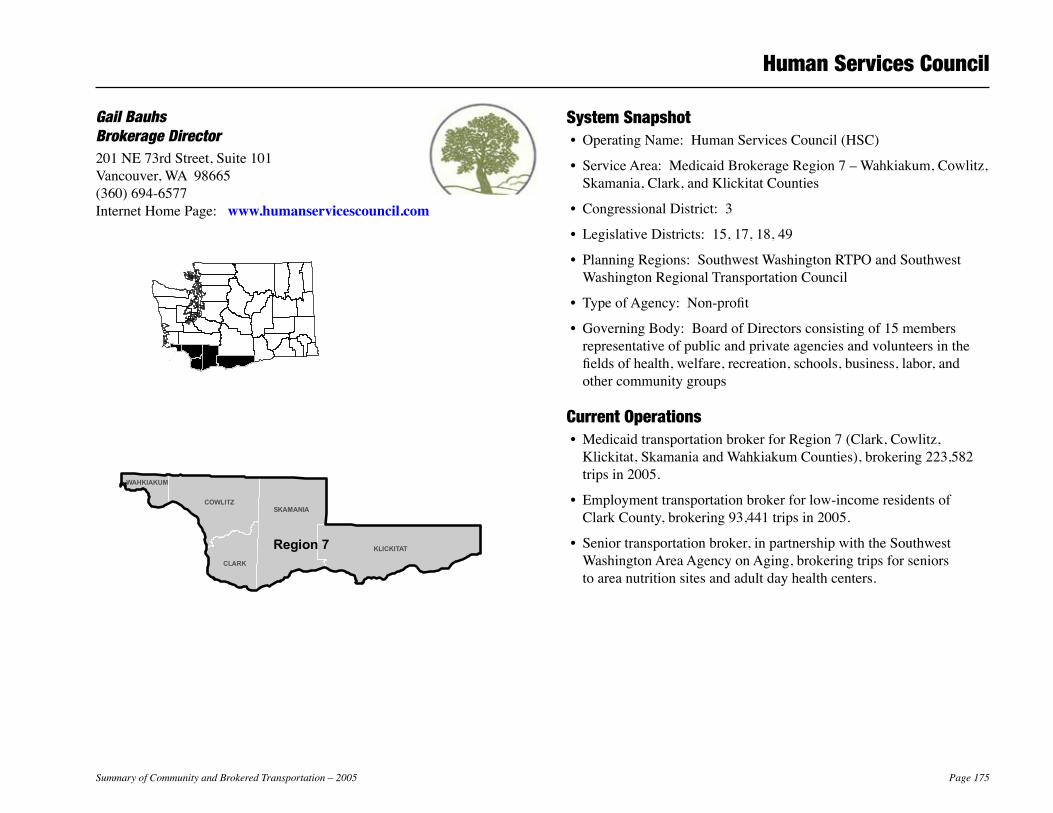
• ServiceArea:MedicaidBrokerageRegion7–Wahkiakum,Cowlitz,Skamania,Clark,andKlickitatCounties
• CongressionalDistrict:3
• LegislativeDistricts:15,17,18,49
• PlanningRegions:SouthwestWashingtonRTPOandSouthwestWashingtonRegionalTransportationCouncil
• TypeofAgency:Non-profit
• GoverningBody:BoardofDirectorsconsistingof15membersrepresentativeofpublicandprivateagenciesandvolunteersinthefieldsofhealth,welfare,recreation,schools,business,labor,andothercommunitygroups
Current Operations• MedicaidtransportationbrokerforRegion7(Clark,Cowlitz,
Klickitat,SkamaniaandWahkiakumCounties),brokering223,582tripsin2005.
• Employmenttransportationbrokerforlow-incomeresidentsofClarkCounty,brokering93,441tripsin2005.
• Seniortransportationbroker,inpartnershipwiththeSouthwestWashingtonAreaAgencyonAging,brokeringtripsforseniorstoareanutritionsitesandadultdayhealthcenters.
Gail Bauhs Brokerage Director201NE73rdStreet,Suite101Vancouver,WA98665(360)694-6577InternetHomePage:www.humanservicescouncil.com
Region 7
WAHKIAKUM
COWLITZSKAMANIA
CLARK
KLICKITATRegion 7
WAHKIAKUM
COWLITZSKAMANIA
CLARK
KLICKITAT
Page 176 Summary of Community and Brokered Transportation – 2005
Contracted Transportation ProvidersAmericanMedicalResponse–ClarkandCowlitzCountiesCatholicCommunityServices–Clark,Cowlitz,Skamania,and
WahkiakumCountiesCityTaxi–ClarkCountyC-Tran–ClarkCountyCUBS(CommunityUrbanBusSystem)–CowlitzCountyEvergreenServices–ClarkCountyGoldenChariotSpecialtyTransport–ClarkCountyHoodRiverCountyTransportationDistrict–HoodRiverCounty,
OregonKlickitatCountySeniorServices–KlickitatCountyLowerColumbiaCommunityActionCouncil–Cowlitzand
WahkiakumCountiesMercy1Transportation–Clark,Cowlitz,andWahkiakumCountiesMetroWestAmbulance–ClarkCountyMick’sWheelchairandMedicalTransport–ClarkCountyQuadCityCab–ClarkandCowlitzCountiesSkamaniaCountySeniorServices–SkamaniaCountySouthwestWashingtonAreaAgencyonAging–Clark,Cowlitz,
Klickitat,Skamania,andWahkiakumCountiesTLCWheelchairServices–ClarkandCowlitzCountiesTrans-Care–CowlitzandWahkiakumCountiesWoodlandWheelchairService–ClarkandCowlitzCounties
Formal PlansSouthwestWashingtonAgencyonAging2006-2007AreaPlanUpdate
2005 Achievements• ProvidedrecordvolumeofMedicaidtripsandservedrecordnumber
ofclientsinMedicaidBrokerageRegion7.
• Facilitateduninterrupteddialysisservicesforclientsshutofffromhighwayroutesduetorockslides,throughproviderpartnershipsandferrytransports.
• CoordinatedMedicaidtrackingsystemstominimizeduplicationofservices.
• Upgradedbrokeragecallcentercomputerhardwaretoreduceschedulingtime.
• Implementednewbillingmodulesoftwaretoincreasetimelinessofvendorinvoiceprocessing.
2006 Objectives• CoordinatewithRideConnectionvolunteertransportationprogram
tobrokertripsforlife-sustainingandothermedicallyurgentservices.
• IncreasevolumeofsharedMedicaid/Senior/JARCtrips.
• Upgradebrokerageservertoenhancetripschedulingandinvoicingspeedandcapacity.
• MovetoanewHSCofficelocation.
Human Services Council
Summary of Community and Brokered Transportation – 2005 Page 177
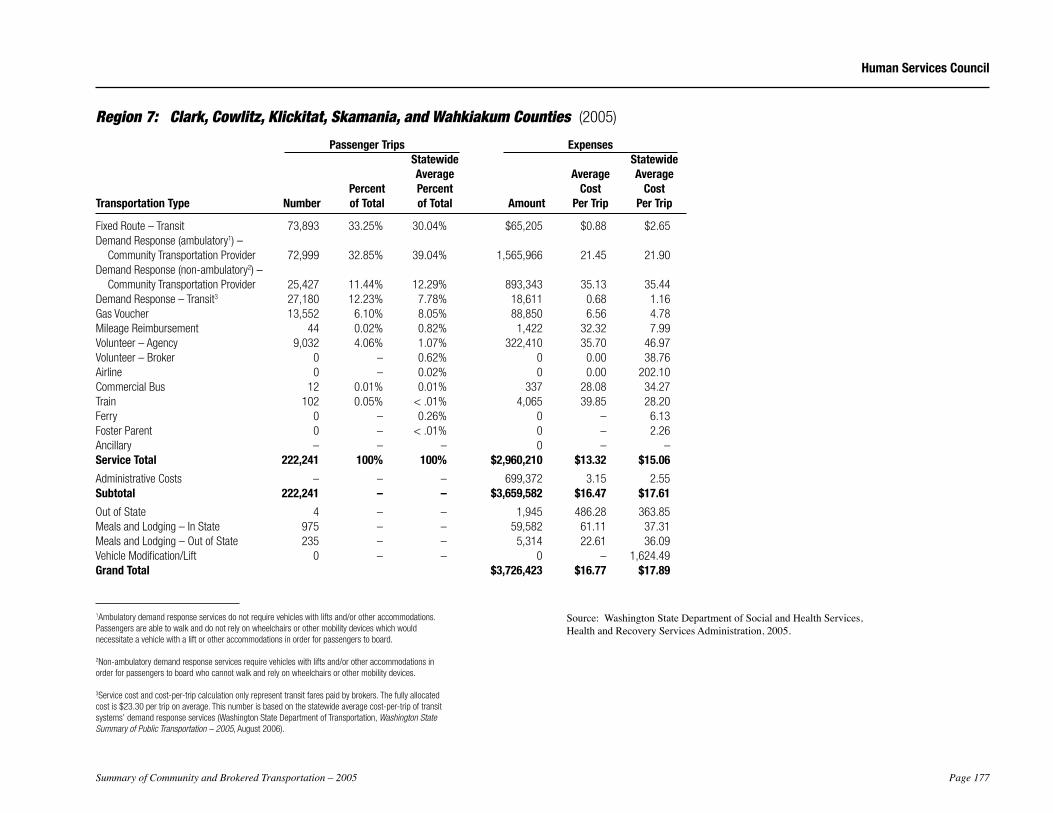
Region 7: Clark, Cowlitz, Klickitat, Skamania, and Wahkiakum Counties (2005)
Passenger Trips Expenses Statewide Statewide Average Average Average Percent Percent Cost Cost Transportation Type Number of Total of Total Amount Per Trip Per Trip
Fixed Route – Transit 73,893 33.25% 30.04% $65,205 $0.88 $2.65 Demand Response (ambulatory1) – Community Transportation Provider 72,999 32.85% 39.04% 1,565,966 21.45 21.90Demand Response (non-ambulatory2) – Community Transportation Provider 25,427 11.44% 12.29% 893,343 35.13 35.44Demand Response – Transit3 27,180 12.23% 7.78% 18,611 0.68 1.16Gas Voucher 13,552 6.10% 8.05% 88,850 6.56 4.78Mileage Reimbursement 44 0.02% 0.82% 1,422 32.32 7.99Volunteer – Agency 9,032 4.06% 1.07% 322,410 35.70 46.97Volunteer – Broker 0 – 0.62% 0 0.00 38.76Airline 0 – 0.02% 0 0.00 202.10Commercial Bus 12 0.01% 0.01% 337 28.08 34.27Train 102 0.05% < .01% 4,065 39.85 28.20Ferry 0 – 0.26% 0 – 6.13Foster Parent 0 – < .01% 0 – 2.26Ancillary – – – 0 – – Service Total 222,241 100% 100% $2,960,210 $13.32 $15.06
Administrative Costs – – – 699,372 3.15 2.55Subtotal 222,241 – – $3,659,582 $16.47 $17.61
Out of State 4 – – 1,945 486.28 363.85Meals and Lodging – In State 975 – – 59,582 61.11 37.31Meals and Lodging – Out of State 235 – – 5,314 22.61 36.09Vehicle Modification/Lift 0 – – 0 – 1,624.49Grand Total $3,726,423 $16.77 $17.89
Human Services Council
1Ambulatory demand response services do not require vehicles with lifts and/or other accommodations. Passengers are able to walk and do not rely on wheelchairs or other mobility devices which would necessitate a vehicle with a lift or other accommodations in order for passengers to board.
2Non-ambulatory demand response services require vehicles with lifts and/or other accommodations in order for passengers to board who cannot walk and rely on wheelchairs or other mobility devices.
3Service cost and cost-per-trip calculation only represent transit fares paid by brokers. The fully allocated cost is $23.30 per trip on average. This number is based on the statewide average cost-per-trip of transit systems’ demand response services (Washington State Department of Transportation, Washington State Summary of Public Transportation – 2005, August 2006).
Source:WashingtonStateDepartmentofSocialandHealthServices,HealthandRecoveryServicesAdministration,2005.

Page 178 Summary of Community and Brokered Transportation – 2005
Summary of Community and Brokered Transportation – 2005 Page 179
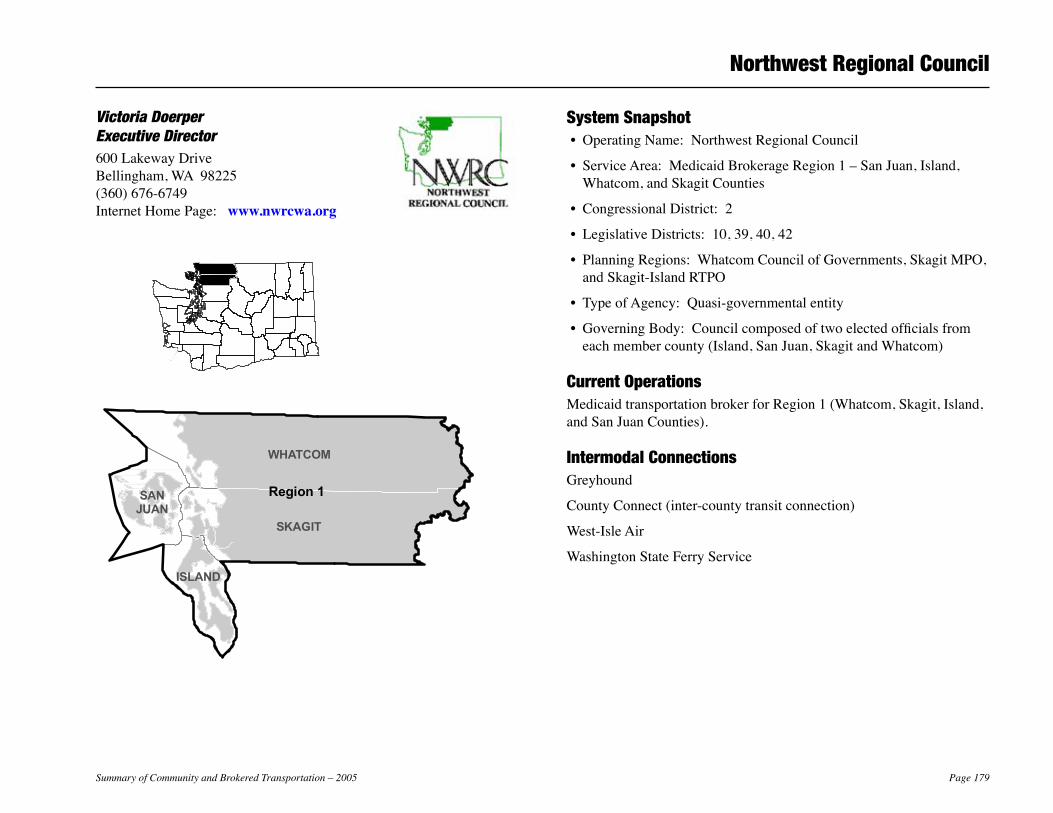
Northwest Regional Council
System Snapshot• OperatingName:NorthwestRegionalCouncil
• ServiceArea:MedicaidBrokerageRegion1–SanJuan,Island,Whatcom,andSkagitCounties
• CongressionalDistrict:2
• LegislativeDistricts:10,39,40,42
• PlanningRegions:WhatcomCouncilofGovernments,SkagitMPO,andSkagit-IslandRTPO
• TypeofAgency:Quasi-governmentalentity
• GoverningBody:Councilcomposedoftwoelectedofficialsfromeachmembercounty(Island,SanJuan,SkagitandWhatcom)
Current OperationsMedicaidtransportationbrokerforRegion1(Whatcom,Skagit,Island,andSanJuanCounties).
Intermodal ConnectionsGreyhound
CountyConnect(inter-countytransitconnection)
West-IsleAir
WashingtonStateFerryService
Victoria Doerper Executive Director600LakewayDriveBellingham,WA98225(360)676-6749InternetHomePage:www.nwrcwa.org
WHATCOM
SKAGIT
Region 1SANJUAN
ISLAND
WHATCOM
SKAGIT
Region 1SANJUAN
ISLAND
Page 180 Summary of Community and Brokered Transportation – 2005
Contracted Transportation ProvidersCity/YellowCabCascadeSpecializedTransportationTriangle/RGIVanServiceValleyTaxi+WesternVanServiceCatholicCommunityServicesSeniorServicesofIslandCountyMercyTransportation
PartnershipsTransitDistricts:
WhatcomTransportationAuthoritySkagitTransitIslandTransit
LocalTribes:NooksackSwinomishUpperSkagitLummiSaukSuiattleSamish
WhatcomAllianceforHealthcareAccess:St.JosephHospitalLocalPhysicians,dentists,andotherhealthcareprovidersLegislativeofficialsLocalelectedofficial
WSDOT(JARCGranttoprovidetransportationtoDSHSWorkFirstclients)
Formal PlansTheNorthwestRegionalCouncildoesanAreaPlaneveryfouryears.Thelastonecoveredtheperiodof2003-2007.
2005 Achievements• Continuedtoprovidelow-costtransportationtoMedicaidclients
withexceptionaluseoftransitservicesintheprogram.
2006 Objectives• Createbillingagreementswiththelastthreeofsixtargetedlocal
TribeswhocurrentlyprovidetransportationtoMedicaideligibletribalmembers.
• Continuetoprovidecost-effectivetransportation.
• Improveinternalprocessesthroughsystemsdevelopmentandrefinement.
• ParticipateinthevolunteerdentistprogramtoprovidetransportationtoMedicaideligibleparticipants.
Long-range Plans• IncorporateMedicaidtransportationintodiscussionsabouttotal
costperpatientforHRSAclients.
• ParticipateinChronicDiseaseManagementdemonstrationproject.
• Increaseoutreachtolocalphysicians’offices.
• ProvideassistancetolocalTribestoconsiderUSDAtribalgrantsforvehicles.
Northwest Regional Council
Summary of Community and Brokered Transportation – 2005 Page 181
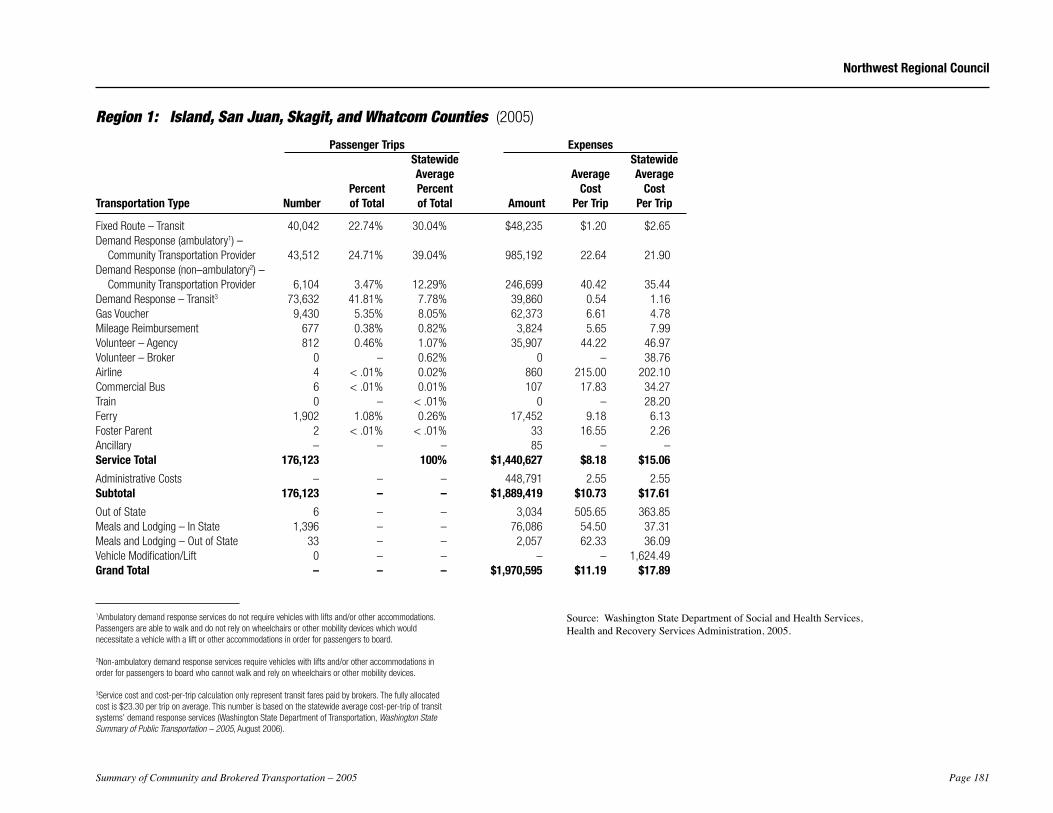
Region 1: Island, San Juan, Skagit, and Whatcom Counties (2005)
Passenger Trips Expenses Statewide Statewide Average Average Average Percent Percent Cost Cost Transportation Type Number of Total of Total Amount Per Trip Per Trip
Fixed Route – Transit 40,042 22.74% 30.04% $48,235 $1.20 $2.65 Demand Response (ambulatory1) – Community Transportation Provider 43,512 24.71% 39.04% 985,192 22.64 21.90Demand Response (non–ambulatory2) – Community Transportation Provider 6,104 3.47% 12.29% 246,699 40.42 35.44Demand Response – Transit3 73,632 41.81% 7.78% 39,860 0.54 1.16Gas Voucher 9,430 5.35% 8.05% 62,373 6.61 4.78Mileage Reimbursement 677 0.38% 0.82% 3,824 5.65 7.99Volunteer – Agency 812 0.46% 1.07% 35,907 44.22 46.97Volunteer – Broker 0 – 0.62% 0 – 38.76Airline 4 < .01% 0.02% 860 215.00 202.10Commercial Bus 6 < .01% 0.01% 107 17.83 34.27Train 0 – < .01% 0 – 28.20Ferry 1,902 1.08% 0.26% 17,452 9.18 6.13Foster Parent 2 < .01% < .01% 33 16.55 2.26Ancillary – – – 85 – – Service Total 176,123 100% $1,440,627 $8.18 $15.06
Administrative Costs – – – 448,791 2.55 2.55Subtotal 176,123 – – $1,889,419 $10.73 $17.61
Out of State 6 – – 3,034 505.65 363.85Meals and Lodging – In State 1,396 – – 76,086 54.50 37.31Meals and Lodging – Out of State 33 – – 2,057 62.33 36.09Vehicle Modification/Lift 0 – – – – 1,624.49Grand Total – – – $1,970,595 $11.19 $17.89
Northwest Regional Council
1Ambulatory demand response services do not require vehicles with lifts and/or other accommodations. Passengers are able to walk and do not rely on wheelchairs or other mobility devices which would necessitate a vehicle with a lift or other accommodations in order for passengers to board.
2Non-ambulatory demand response services require vehicles with lifts and/or other accommodations in order for passengers to board who cannot walk and rely on wheelchairs or other mobility devices.
3Service cost and cost-per-trip calculation only represent transit fares paid by brokers. The fully allocated cost is $23.30 per trip on average. This number is based on the statewide average cost-per-trip of transit systems’ demand response services (Washington State Department of Transportation, Washington State Summary of Public Transportation – 2005, August 2006).
Source:WashingtonStateDepartmentofSocialandHealthServices,HealthandRecoveryServicesAdministration,2005.

Page 182 Summary of Community and Brokered Transportation – 2005
Summary of Community and Brokered Transportation – 2005 Page 183
Paratransit Services
System Snapshot• OperatingName:ParatransitServices
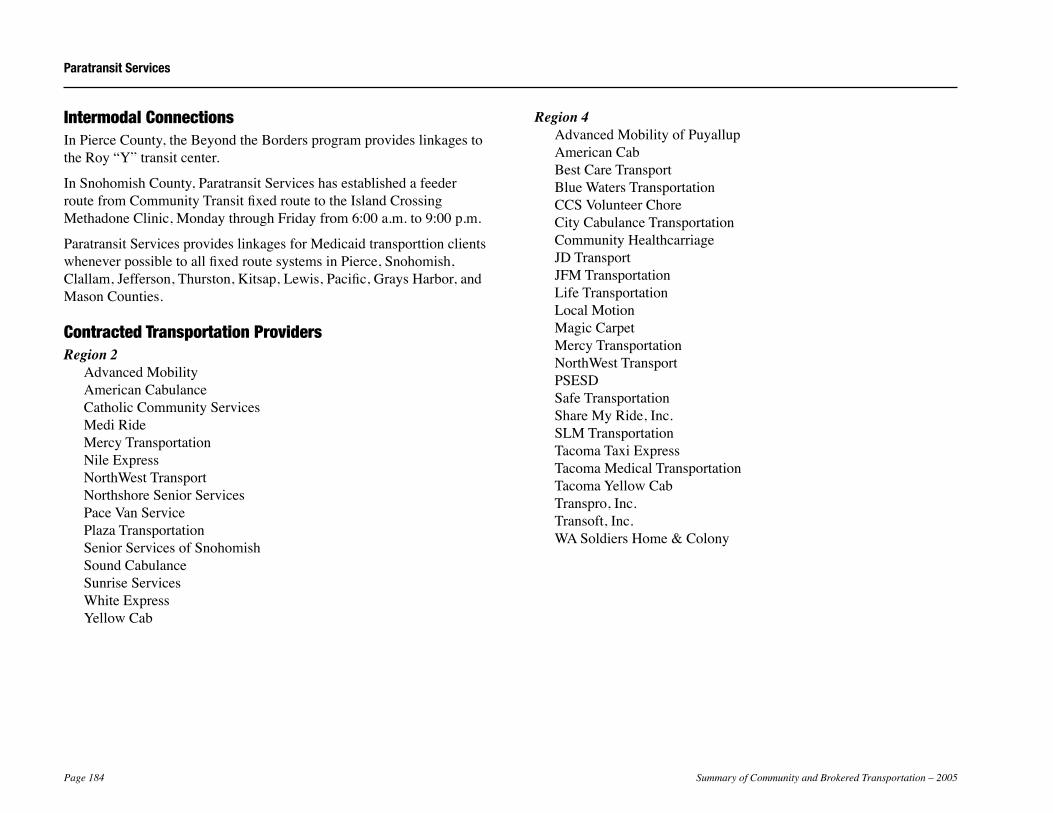
• ServiceRange: MedicaidBrokerageRegion2–SnohomishCounty Region4–PierceCounty Region5–Clallam,Jefferson,Kitsap,and NorthMasonCounties Region6–GraysHarbor,Pacific,SouthMason, Thurston,andLewisCounties
• CongressionalDistricts:1,2,3,6,7,8,9
• LegislativeDistricts:1,2,10,19,20,21,22,23,24,25,26,27,28,29,31,32,35,38,39,44
• PlanningRegions:PugetSoundRegionalCouncil,PeninsulaRTPO,ThurstonRegionalPlanningCouncil,andSouthwestWashingtonRTPO
• TypeofAgency:Non-profit
• GoverningBody:Nine-memberBoardofDirectorscomprisedofadiversegroupofcommunityandbusinessleaders
Current Operations• BrokerofMedicaidtransportationandinterpreterservicesforten
countiesinnorthwesternWashingtonwithatotalserviceareaof14,707squaremilesandapopulationofover2millionpeople.
• OperatesaccessiblepublictransitsystemsinAlaska,WashingtonState,Oregon,andnorthernCalifornia.
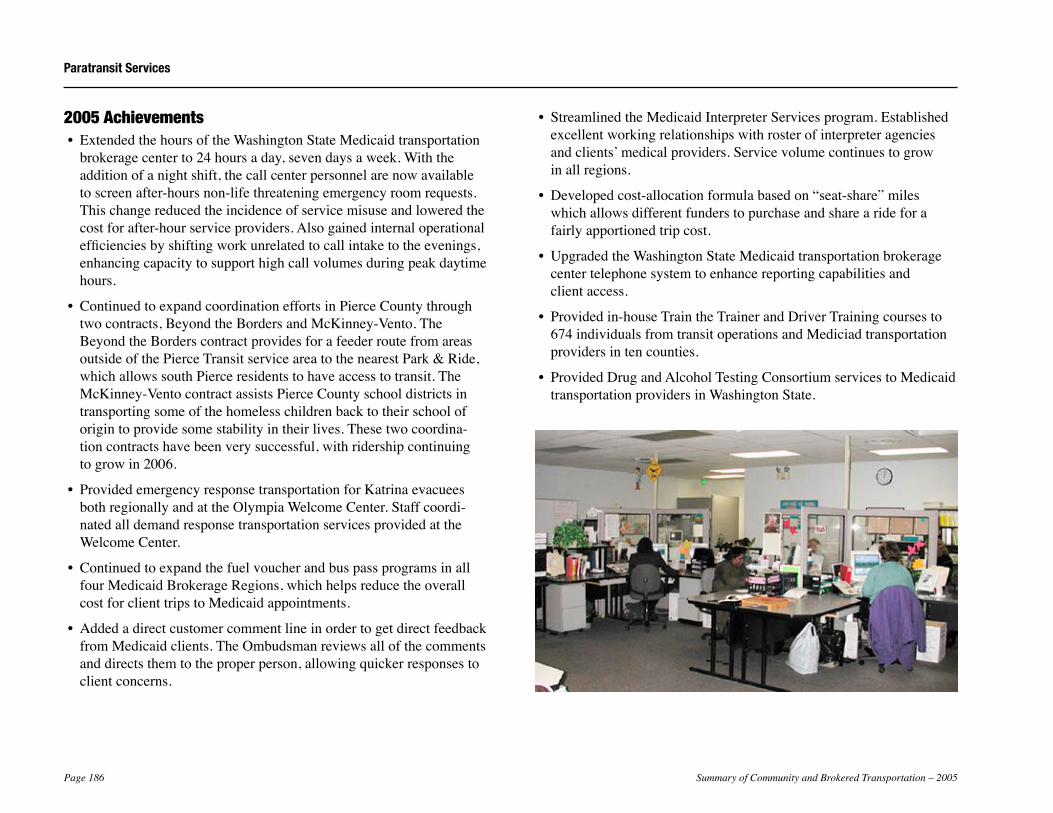
FacilitiesParatransitServices’WashingtonStateNon-emergencyMedicaidTransportationbrokeragecenterislocatedinBremerton,Washington.Thisfacilityisequippedwithstate-of-the-arttelecommunicationsandmanagementinformationsystemsandisstaffedwithcall-taking,brokerage,customerservice,technicalsupport,training,andadministrativepersonnel.
David Baker President/Chief Executive Office4810AutoCenterWay,SuiteZBremerton,WA98312-4309(800)933-3468InternetHomePage:www.paratransit.net
KITSAP
JEFFERSON
LEWIS
SNOHOMISHCLALLAM
PIERCE
Region 2
Region 5
Region 4Region 6THURSTON
GRAYSHARBOR
PACIFIC
MASONSOUTH
MASONNORTH
KITSAP
JEFFERSON
LEWIS
SNOHOMISHCLALLAM
PIERCE
Region 2
Region 5
Region 4Region 6THURSTON
GRAYSHARBOR
PACIFIC
MASONSOUTH
MASONNORTH
Page 184 Summary of Community and Brokered Transportation – 2005
Intermodal ConnectionsInPierceCounty,theBeyondtheBordersprogramprovideslinkagestotheRoy“Y”transitcenter.
InSnohomishCounty,ParatransitServiceshasestablishedafeederroutefromCommunityTransitfixedroutetotheIslandCrossingMethadoneClinic,MondaythroughFridayfrom6:00a.m.to9:00p.m.
ParatransitServicesprovideslinkagesforMedicaidtransporttionclientswheneverpossibletoallfixedroutesystemsinPierce,Snohomish,Clallam,Jefferson,Thurston,Kitsap,Lewis,Pacific,GraysHarbor,andMasonCounties.
Contracted Transportation ProvidersRegion 2
AdvancedMobilityAmericanCabulanceCatholicCommunityServicesMediRideMercyTransportationNileExpressNorthWestTransportNorthshoreSeniorServicesPaceVanServicePlazaTransportationSeniorServicesofSnohomishSoundCabulanceSunriseServicesWhiteExpressYellowCab
Region 4AdvancedMobilityofPuyallupAmericanCabBestCareTransportBlueWatersTransportationCCSVolunteerChoreCityCabulanceTransportationCommunityHealthcarriageJDTransportJFMTransportationLifeTransportationLocalMotionMagicCarpetMercyTransportationNorthWestTransportPSESDSafeTransportationShareMyRide,Inc.SLMTransportationTacomaTaxiExpressTacomaMedicalTransportationTacomaYellowCabTranspro,Inc.Transoft,Inc.WASoldiersHome&Colony
Paratransit Services
Summary of Community and Brokered Transportation – 2005 Page 185
Region 5ArrowTransportationBainbridgeIslandTaxiCCSVolunteerChoreClallamTransitSystemConcernedCitizensJamestownS’KlallamTribeJeffersonTransitAuthorityJFMTransportationLowerElwhaTribeMakahTribeNorthWestTransportPeninsulaTransportServicePortGambleS’KlallamTribePTRocketTransportationTranspro,Inc.Troll’sTaxiWAVeteransHomeWestSoundTransportation
Region 6Allen’sCabBlueWatersTransportationCCSSWVolunteerChoreCCSVolunteerChoreCoastalCommunityActionProgramCoastalTransportFarWestTransportationGlenomaMedicalTransportGoTaxiofLewisCountyHorizonMedicalTransportationLewisCountySeniorServicesL.E.W.I.S.MountainHighwayTransitMEDIXAmbulanceServiceNorthWestTransportShoalwaterBayTribeTheVolunteerCenterToursPlusTranspro,Inc.
Paratransit Services
Page 186 Summary of Community and Brokered Transportation – 2005
2005 Achievements• ExtendedthehoursoftheWashingtonStateMedicaidtransportation
brokeragecenterto24hoursaday,sevendaysaweek.Withtheadditionofanightshift,thecallcenterpersonnelarenowavailabletoscreenafter-hoursnon-lifethreateningemergencyroomrequests.Thischangereducedtheincidenceofservicemisuseandloweredthecostforafter-hourserviceproviders.Alsogainedinternaloperationalefficienciesbyshiftingworkunrelatedtocallintaketotheevenings,enhancingcapacitytosupporthighcallvolumesduringpeakdaytimehours.
• ContinuedtoexpandcoordinationeffortsinPierceCountythroughtwocontracts,BeyondtheBordersandMcKinney-Vento.TheBeyondtheBorderscontractprovidesforafeederroutefromareasoutsideofthePierceTransitserviceareatothenearestPark&Ride,whichallowssouthPierceresidentstohaveaccesstotransit.TheMcKinney-VentocontractassistsPierceCountyschooldistrictsintransportingsomeofthehomelesschildrenbacktotheirschooloforigintoprovidesomestabilityintheirlives.Thesetwocoordina-tioncontractshavebeenverysuccessful,withridershipcontinuingtogrowin2006.
• ProvidedemergencyresponsetransportationforKatrinaevacueesbothregionallyandattheOlympiaWelcomeCenter.Staffcoordi-natedalldemandresponsetransportationservicesprovidedattheWelcomeCenter.
• ContinuedtoexpandthefuelvoucherandbuspassprogramsinallfourMedicaidBrokerageRegions,whichhelpsreducetheoverallcostforclienttripstoMedicaidappointments.
• AddedadirectcustomercommentlineinordertogetdirectfeedbackfromMedicaidclients.TheOmbudsmanreviewsallofthecommentsanddirectsthemtotheproperperson,allowingquickerresponsestoclientconcerns.
• StreamlinedtheMedicaidInterpreterServicesprogram.Establishedexcellentworkingrelationshipswithrosterofinterpreteragenciesandclients’medicalproviders.Servicevolumecontinuestogrowinallregions.
• Developedcost-allocationformulabasedon“seat-share”mileswhichallowsdifferentfunderstopurchaseandsharearideforafairlyapportionedtripcost.
• UpgradedtheWashingtonStateMedicaidtransportationbrokeragecentertelephonesystemtoenhancereportingcapabilitiesandclientaccess.
• Providedin-houseTraintheTrainerandDriverTrainingcoursesto674individualsfromtransitoperationsandMediciadtransportationprovidersintencounties.
• ProvidedDrugandAlcoholTestingConsortiumservicestoMedicaidtransportationprovidersinWashingtonState.
Paratransit Services
Summary of Community and Brokered Transportation – 2005 Page 187
2006 Objectives• CompletetheupgradeprocessfortheMedicaidtransportation
schedulingsoftwareTrapeze™byAugust2006.Upgradein-housesoftwareusedtobrokertheMedicaidInterpreterServicesprogram.
• InstituteAutomatedCallBackprogramfor10counties,whichautomaticallycontactsclientsthedaypriortoserviceinformingthemofthetimeofpickupandnameofthetransportationprovider.
• Instituteweb-accessTripCheckthatallowsClientstocheckthetimeoftheirtripandnameoftransportationprovideron-line.
• StudySmartCardapplicationtoMedicaidtransportationbrokerageprogram.
• Enhanceeducationaloutreachtofacilitiesandagenciesinthetencountiesserved.
• Improveclientaccessthroughtechnologicalimprovementsleadingtoshortercallcenterholdtimesandimprovedwebservices.
• Utilizetechnologytoautomate“seat-share”permilecostcalculationstosupportmultifundertripsharing.
• ConnecttheBeyondtheBordersprogramtoYelmandL.E.W.I.S.MountainshuttlesinPierceandThurstonCounties.
Long-range Plans• Reviewfundingandgrantopportunitiestosupportincreased
coordinationandtechnologicaldevelopmentdesignedtoincreaseefficiencyandqualityofservices.
• Continuetoenhanceandimprovecoordinationwithemergencyresponseandevacuationplansforalltencountiesintheeventofamajorcatastrophiceventorintheeventofamassiverepatriation.
• CoordinatewithotherMedicaidtransportationbrokeragesindevelopingtheI-5CorridorShuttleandstatewideridesharing.
• Increaselocalandregionalcoordinationwithcommunity,transit,agency,school,andprivatepartners.
• ContinuetoworkwithschooldistrictsandtransportationproviderstorefineMcKinney-Ventohomelessschoolchildrentransportationservices.
• Continueasanon-profitorganizationtoactinthepublicinterestandensurethatpersonswithspecialneedshaveaccesstoqualitytransportationservices.
Paratransit Services
Page 188 Summary of Community and Brokered Transportation – 2005
Paratransit Services
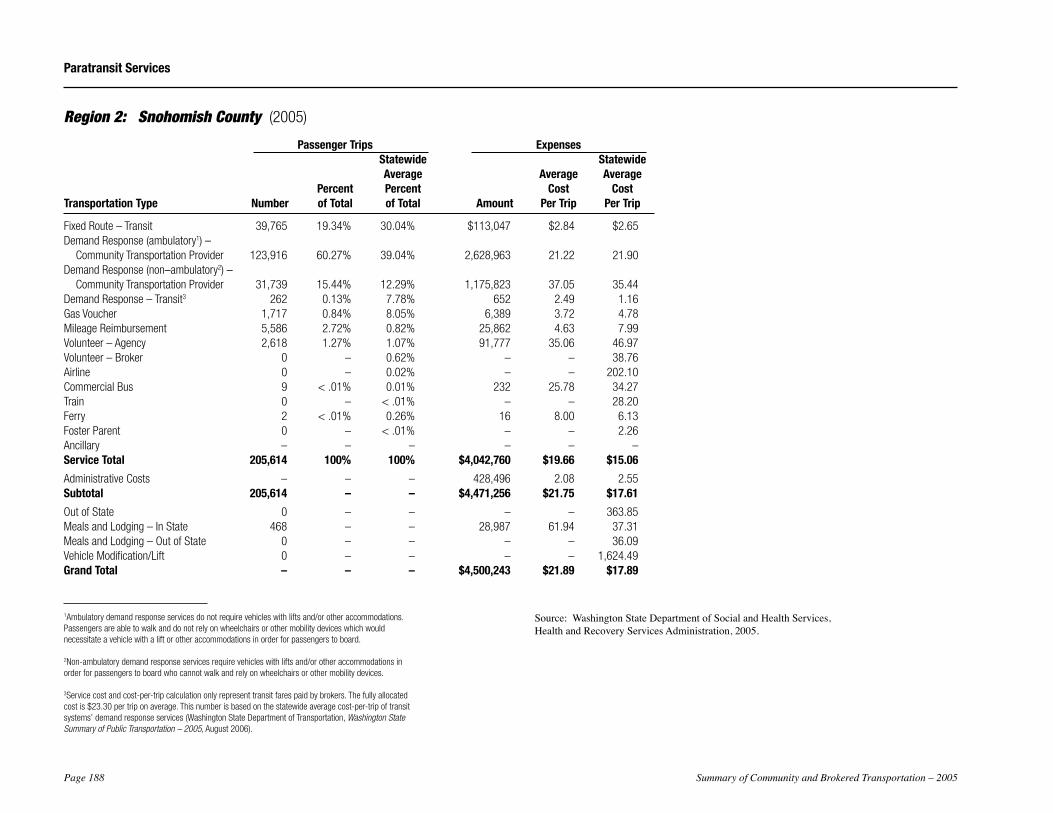
Region 2: Snohomish County (2005)
Passenger Trips Expenses Statewide Statewide Average Average Average Percent Percent Cost Cost Transportation Type Number of Total of Total Amount Per Trip Per Trip
Fixed Route – Transit 39,765 19.34% 30.04% $113,047 $2.84 $2.65 Demand Response (ambulatory1) – Community Transportation Provider 123,916 60.27% 39.04% 2,628,963 21.22 21.90Demand Response (non–ambulatory2) – Community Transportation Provider 31,739 15.44% 12.29% 1,175,823 37.05 35.44Demand Response – Transit3 262 0.13% 7.78% 652 2.49 1.16Gas Voucher 1,717 0.84% 8.05% 6,389 3.72 4.78Mileage Reimbursement 5,586 2.72% 0.82% 25,862 4.63 7.99Volunteer – Agency 2,618 1.27% 1.07% 91,777 35.06 46.97Volunteer – Broker 0 – 0.62% – – 38.76Airline 0 – 0.02% – – 202.10Commercial Bus 9 < .01% 0.01% 232 25.78 34.27Train 0 – < .01% – – 28.20Ferry 2 < .01% 0.26% 16 8.00 6.13Foster Parent 0 – < .01% – – 2.26Ancillary – – – – – – Service Total 205,614 100% 100% $4,042,760 $19.66 $15.06
Administrative Costs – – – 428,496 2.08 2.55Subtotal 205,614 – – $4,471,256 $21.75 $17.61
Out of State 0 – – – – 363.85Meals and Lodging – In State 468 – – 28,987 61.94 37.31Meals and Lodging – Out of State 0 – – – – 36.09Vehicle Modification/Lift 0 – – – – 1,624.49Grand Total – – – $4,500,243 $21.89 $17.89
1Ambulatory demand response services do not require vehicles with lifts and/or other accommodations. Passengers are able to walk and do not rely on wheelchairs or other mobility devices which would necessitate a vehicle with a lift or other accommodations in order for passengers to board.
2Non-ambulatory demand response services require vehicles with lifts and/or other accommodations in order for passengers to board who cannot walk and rely on wheelchairs or other mobility devices.
3Service cost and cost-per-trip calculation only represent transit fares paid by brokers. The fully allocated cost is $23.30 per trip on average. This number is based on the statewide average cost-per-trip of transit systems’ demand response services (Washington State Department of Transportation, Washington State Summary of Public Transportation – 2005, August 2006).
Source:WashingtonStateDepartmentofSocialandHealthServices,HealthandRecoveryServicesAdministration,2005.
Summary of Community and Brokered Transportation – 2005 Page 189
Paratransit Services
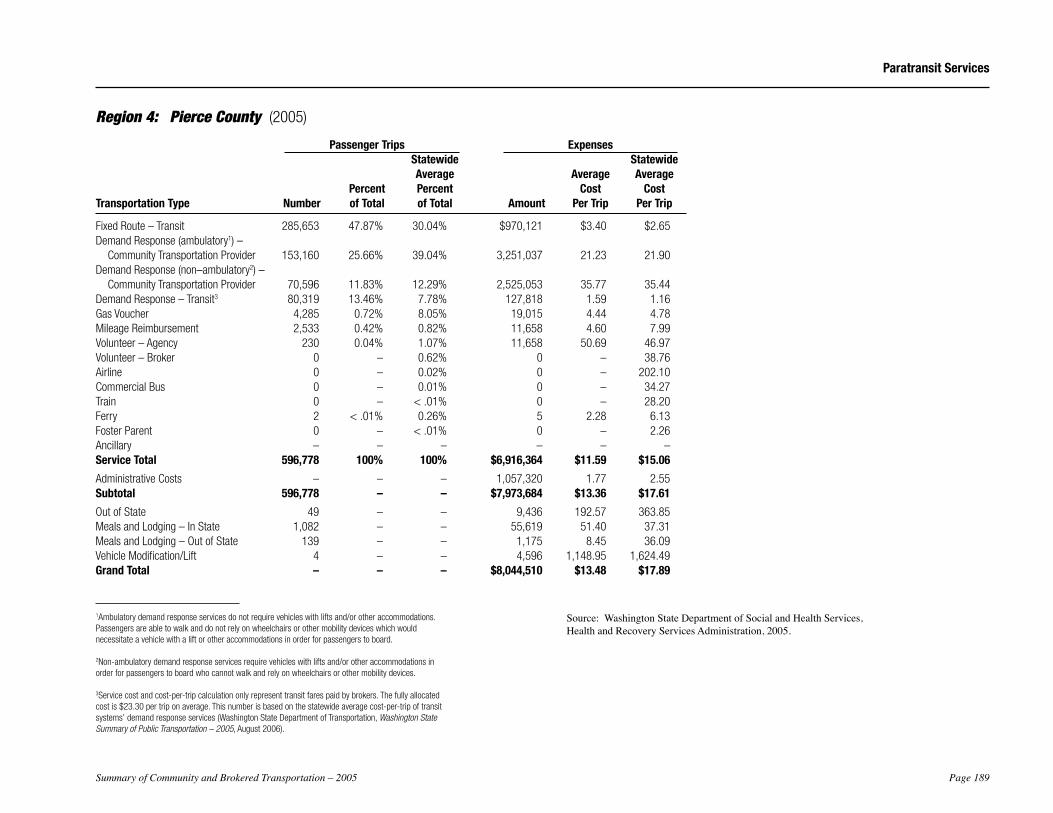
Region 4: Pierce County (2005)
Passenger Trips Expenses Statewide Statewide Average Average Average Percent Percent Cost Cost Transportation Type Number of Total of Total Amount Per Trip Per Trip
Fixed Route – Transit 285,653 47.87% 30.04% $970,121 $3.40 $2.65 Demand Response (ambulatory1) – Community Transportation Provider 153,160 25.66% 39.04% 3,251,037 21.23 21.90Demand Response (non–ambulatory2) – Community Transportation Provider 70,596 11.83% 12.29% 2,525,053 35.77 35.44Demand Response – Transit3 80,319 13.46% 7.78% 127,818 1.59 1.16Gas Voucher 4,285 0.72% 8.05% 19,015 4.44 4.78Mileage Reimbursement 2,533 0.42% 0.82% 11,658 4.60 7.99Volunteer – Agency 230 0.04% 1.07% 11,658 50.69 46.97Volunteer – Broker 0 – 0.62% 0 – 38.76Airline 0 – 0.02% 0 – 202.10Commercial Bus 0 – 0.01% 0 – 34.27Train 0 – < .01% 0 – 28.20Ferry 2 < .01% 0.26% 5 2.28 6.13Foster Parent 0 – < .01% 0 – 2.26Ancillary – – – – – – Service Total 596,778 100% 100% $6,916,364 $11.59 $15.06
Administrative Costs – – – 1,057,320 1.77 2.55Subtotal 596,778 – – $7,973,684 $13.36 $17.61
Out of State 49 – – 9,436 192.57 363.85Meals and Lodging – In State 1,082 – – 55,619 51.40 37.31Meals and Lodging – Out of State 139 – – 1,175 8.45 36.09Vehicle Modification/Lift 4 – – 4,596 1,148.95 1,624.49Grand Total – – – $8,044,510 $13.48 $17.89
1Ambulatory demand response services do not require vehicles with lifts and/or other accommodations. Passengers are able to walk and do not rely on wheelchairs or other mobility devices which would necessitate a vehicle with a lift or other accommodations in order for passengers to board.
2Non-ambulatory demand response services require vehicles with lifts and/or other accommodations in order for passengers to board who cannot walk and rely on wheelchairs or other mobility devices.
3Service cost and cost-per-trip calculation only represent transit fares paid by brokers. The fully allocated cost is $23.30 per trip on average. This number is based on the statewide average cost-per-trip of transit systems’ demand response services (Washington State Department of Transportation, Washington State Summary of Public Transportation – 2005, August 2006).
Source:WashingtonStateDepartmentofSocialandHealthServices,HealthandRecoveryServicesAdministration,2005.
Page 190 Summary of Community and Brokered Transportation – 2005
Paratransit Services
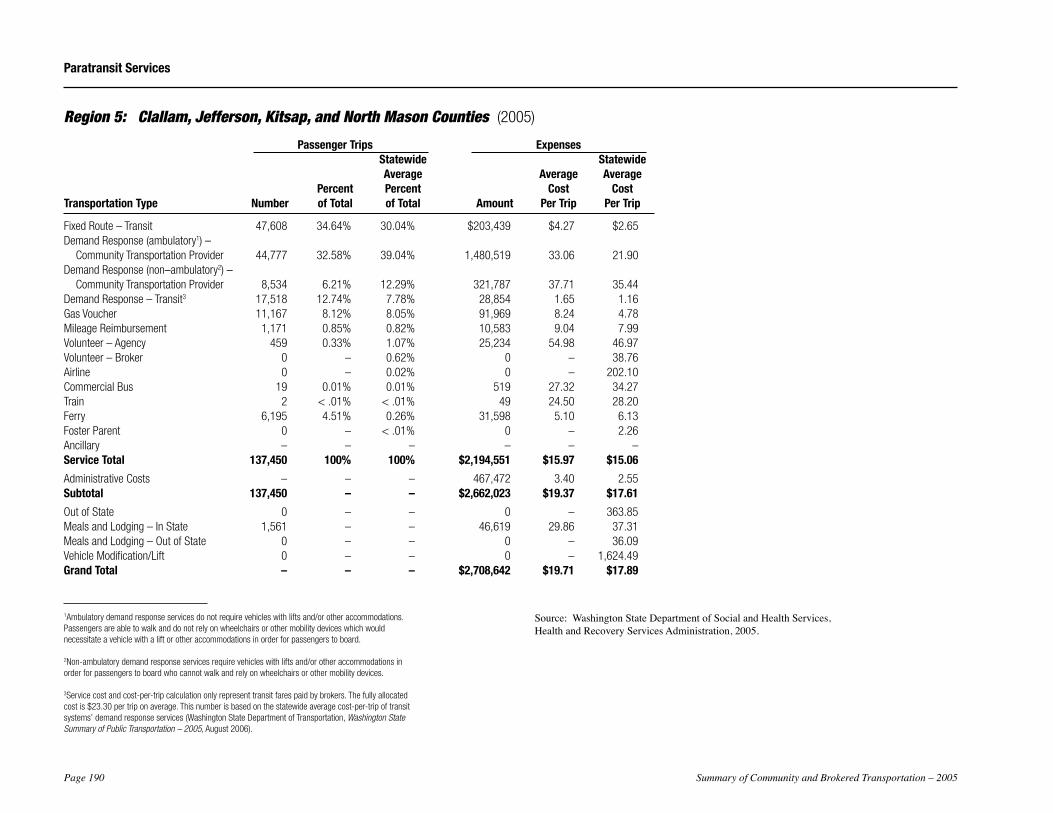
Region 5: Clallam, Jefferson, Kitsap, and North Mason Counties (2005)
Passenger Trips Expenses Statewide Statewide Average Average Average Percent Percent Cost Cost Transportation Type Number of Total of Total Amount Per Trip Per Trip
Fixed Route – Transit 47,608 34.64% 30.04% $203,439 $4.27 $2.65 Demand Response (ambulatory1) – Community Transportation Provider 44,777 32.58% 39.04% 1,480,519 33.06 21.90Demand Response (non–ambulatory2) – Community Transportation Provider 8,534 6.21% 12.29% 321,787 37.71 35.44Demand Response – Transit3 17,518 12.74% 7.78% 28,854 1.65 1.16Gas Voucher 11,167 8.12% 8.05% 91,969 8.24 4.78Mileage Reimbursement 1,171 0.85% 0.82% 10,583 9.04 7.99Volunteer – Agency 459 0.33% 1.07% 25,234 54.98 46.97Volunteer – Broker 0 – 0.62% 0 – 38.76Airline 0 – 0.02% 0 – 202.10Commercial Bus 19 0.01% 0.01% 519 27.32 34.27Train 2 < .01% < .01% 49 24.50 28.20Ferry 6,195 4.51% 0.26% 31,598 5.10 6.13Foster Parent 0 – < .01% 0 – 2.26Ancillary – – – – – – Service Total 137,450 100% 100% $2,194,551 $15.97 $15.06
Administrative Costs – – – 467,472 3.40 2.55Subtotal 137,450 – – $2,662,023 $19.37 $17.61
Out of State 0 – – 0 – 363.85Meals and Lodging – In State 1,561 – – 46,619 29.86 37.31Meals and Lodging – Out of State 0 – – 0 – 36.09Vehicle Modification/Lift 0 – – 0 – 1,624.49Grand Total – – – $2,708,642 $19.71 $17.89
1Ambulatory demand response services do not require vehicles with lifts and/or other accommodations. Passengers are able to walk and do not rely on wheelchairs or other mobility devices which would necessitate a vehicle with a lift or other accommodations in order for passengers to board.
2Non-ambulatory demand response services require vehicles with lifts and/or other accommodations in order for passengers to board who cannot walk and rely on wheelchairs or other mobility devices.
3Service cost and cost-per-trip calculation only represent transit fares paid by brokers. The fully allocated cost is $23.30 per trip on average. This number is based on the statewide average cost-per-trip of transit systems’ demand response services (Washington State Department of Transportation, Washington State Summary of Public Transportation – 2005, August 2006).
Source:WashingtonStateDepartmentofSocialandHealthServices,HealthandRecoveryServicesAdministration,2005.

Summary of Community and Brokered Transportation – 2005 Page 191
Paratransit Services
Region 6: Grays Harbor, Lewis, Mason–south, Pacific, and Thurston Counties (2005)
Passenger Trips Expenses Statewide Statewide Average Average Average Percent Percent Cost Cost Transportation Type Number of Total of Total Amount Per Trip Per Trip
Fixed Route – Transit 76,158 39.23% 30.04% $104,173 $1.37 $2.65 Demand Response (ambulatory1) – Community Transportation Provider 62,913 32.41% 39.04% 2,236,858 35.55 21.90Demand Response (non–ambulatory2) – Community Transportation Provider 18,564 9.56% 12.29% 1,004,083 54.09 35.44Demand Response – Transit3 710 0.37% 7.78% 710 1.00 1.16Gas Voucher 22,030 11.35% 8.05% 172,857 7.85 4.78Mileage Reimbursement 4,978 2.56% 0.82% 43,118 8.66 7.99Volunteer – Agency 8,676 4.47% 1.07% 658,218 75.87 46.97Volunteer – Broker 0 – 0.62% 0 – 38.76Airline 0 – 0.02% 0 – 202.10Commercial Bus 0 – 0.01% 0 – 34.27Train 0 – < .01% 0 – 28.20Ferry 106 0.05% 0.26% 733 6.92 6.13Foster Parent 0 – < .01% 0 – 2.26Ancillary – – – – – – Service Total 194,135 100% 100% $4,220,750 $21.74 $15.06
Administrative Costs – – – 504,000 2.60 2.55Subtotal 194,135 – – $4,724,750 $24.34 $17.61
Out of State 3 – – 1,349 449.73 363.85Meals and Lodging – In State 1,131 – – 37,020 32.73 37.31Meals and Lodging – Out of State 142 – – 10,771 75.85 36.09Vehicle Modification/Lift 3 – – 2,971 990.47 1,624.49Grand Total – – – $4,776,861 $24.61 $17.89
1Ambulatory demand response services do not require vehicles with lifts and/or other accommodations. Passengers are able to walk and do not rely on wheelchairs or other mobility devices which would necessitate a vehicle with a lift or other accommodations in order for passengers to board.
2Non-ambulatory demand response services require vehicles with lifts and/or other accommodations in order for passengers to board who cannot walk and rely on wheelchairs or other mobility devices.
3Service cost and cost-per-trip calculation only represent transit fares paid by brokers. The fully allocated cost is $23.30 per trip on average. This number is based on the statewide average cost-per-trip of transit systems’ demand response services (Washington State Department of Transportation, Washington State Summary of Public Transportation – 2005, August 2006).
Source:WashingtonStateDepartmentofSocialandHealthServices,HealthandRecoveryServicesAdministration,2005.

Page 192 Summary of Community and Brokered Transportation – 2005
Summary of Community and Brokered Transportation – 2005 Page 193
People For People
System Snapshot• OperatingName:PeopleForPeople(PFP)
• ServiceArea:MedicaidBrokerageRegion8–Kittitas,Yakima,Benton,Franklin,WallaWalla,andColumbiaCounties
• CongressionalDistrict:4
• LegislativeDistricts:13,14,15
• PlanningRegions:QuadCountyRTPO,YakimaValleyConferenceofGovernments,andBenton-Franklin-WallaWallaRTPO
• TypeofAgency:Non-profit
• GoverningBody:Twelve-membervolunteerBoardofDirectorsconsistingofbroadrepresentationofthecountiesserved
Current OperationsBrokerageservescommunitiesinsixcountiesbyarrangingtrans-portationforpeopleofallagesthathavecurrentWashingtonStateDepartmentofSocialandHealthServicesMedicaidcouponsandneedtransportationtonon-emergencymedicalservices.Verificationforpropereligibilityisconfirmedandthenthemostcost-effective,appropriatetransportationiscoordinated.
Aprimarygoaloftheseservicesistoassistclientswithvouchersforgasolineormileagereimbursementiftheyhavetheirowntransporta-tionresources.Ifthatisnotpossible,transportationisarrangedusingcontractedproviderssuchaslocaltransitandparatransitproviders,volunteerdrivers,non-profitproviders,cabulance,andtaxicompanies.
PeopleForPeopleensuresthatthelowestcost,mostappropriaterideisarrangedfortheclient.Tripsmaybesharedwithotherriders.
Marcy Durbin302WestLincolnYakima,WA98902-2656(509)457-8709InternetHomePage:www.pfp.org
YAKIMARegion 8
BENTON
KITTITAS
FRANKLIN
WALLA WALLA
COLUMBIAYAKIMA
Region 8
BENTON
KITTITAS
FRANKLIN
WALLA WALLA
COLUMBIA
Page 194 Summary of Community and Brokered Transportation – 2005
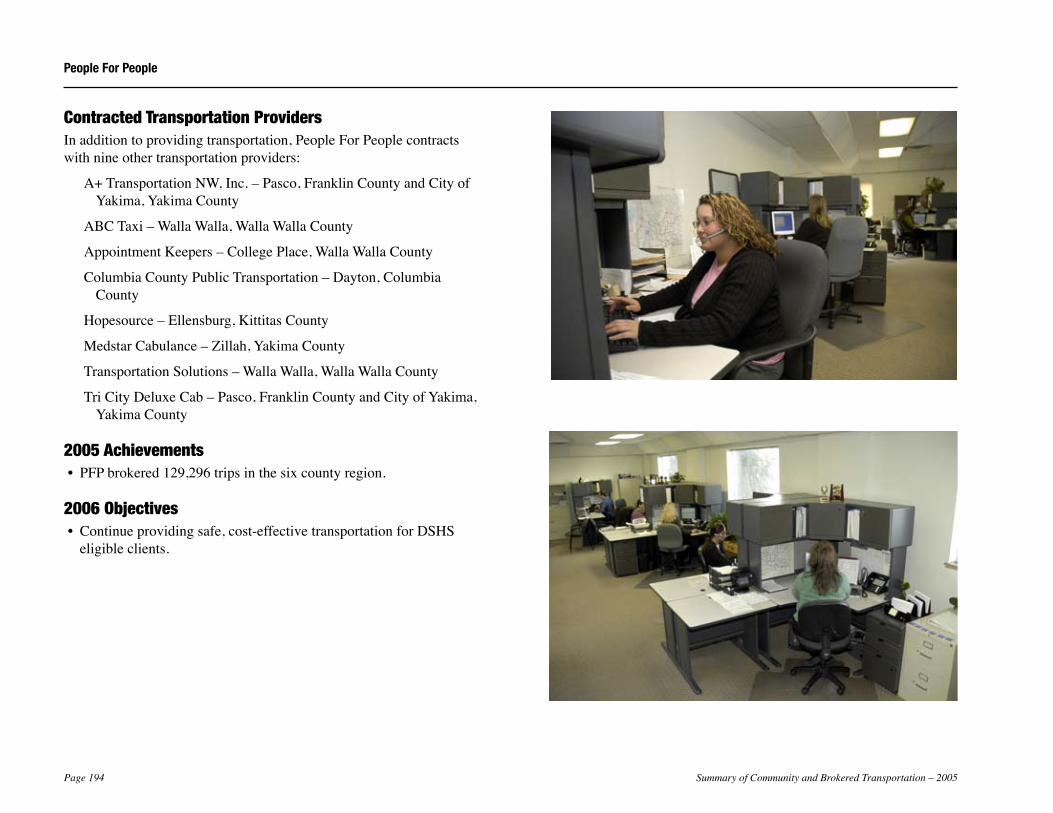
Contracted Transportation ProvidersInadditiontoprovidingtransportation,PeopleForPeoplecontractswithnineothertransportationproviders:
A+TransportationNW,Inc.–Pasco,FranklinCountyandCityofYakima,YakimaCounty
ABCTaxi–WallaWalla,WallaWallaCounty
AppointmentKeepers–CollegePlace,WallaWallaCounty
ColumbiaCountyPublicTransportation–Dayton,ColumbiaCounty
Hopesource–Ellensburg,KittitasCounty
MedstarCabulance–Zillah,YakimaCounty
TransportationSolutions–WallaWalla,WallaWallaCounty
TriCityDeluxeCab–Pasco,FranklinCountyandCityofYakima,YakimaCounty
2005 Achievements• PFPbrokered129,296tripsinthesixcountyregion.
2006 Objectives• Continueprovidingsafe,cost-effectivetransportationforDSHS
eligibleclients.
People For People
Summary of Community and Brokered Transportation – 2005 Page 195
People For People
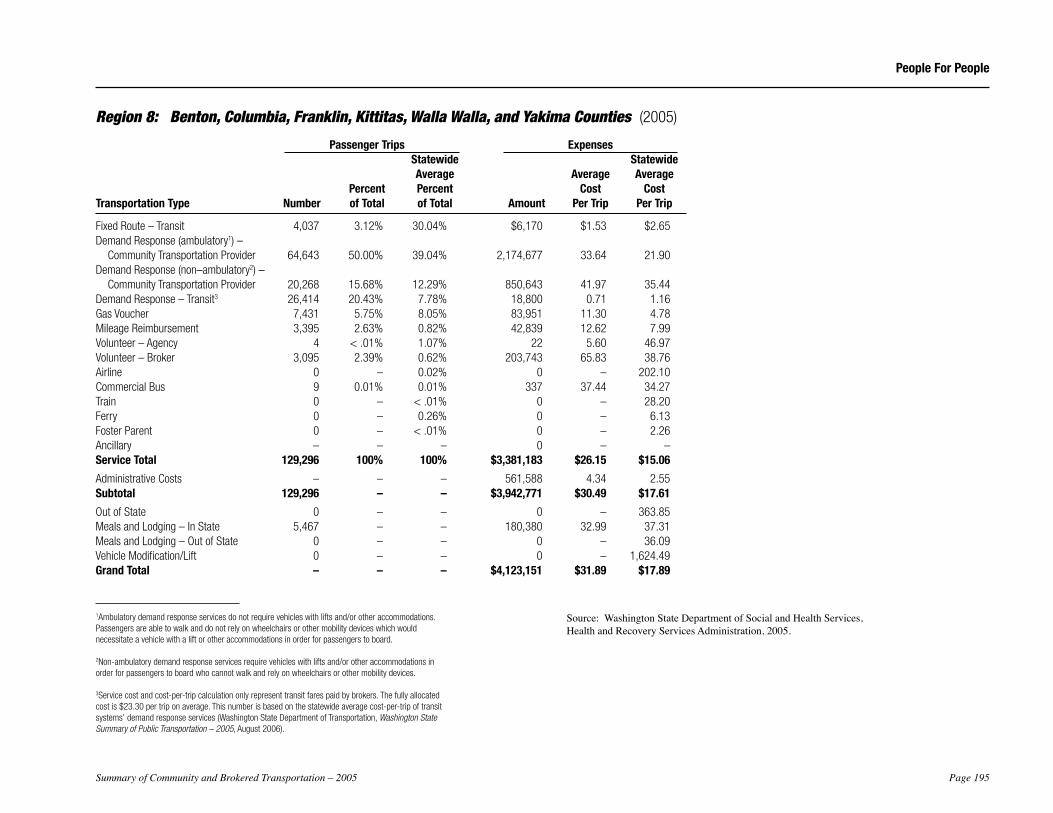
Region 8: Benton, Columbia, Franklin, Kittitas, Walla Walla, and Yakima Counties (2005)
Passenger Trips Expenses Statewide Statewide Average Average Average Percent Percent Cost Cost Transportation Type Number of Total of Total Amount Per Trip Per Trip
Fixed Route – Transit 4,037 3.12% 30.04% $6,170 $1.53 $2.65 Demand Response (ambulatory1) – Community Transportation Provider 64,643 50.00% 39.04% 2,174,677 33.64 21.90Demand Response (non–ambulatory2) – Community Transportation Provider 20,268 15.68% 12.29% 850,643 41.97 35.44Demand Response – Transit3 26,414 20.43% 7.78% 18,800 0.71 1.16Gas Voucher 7,431 5.75% 8.05% 83,951 11.30 4.78Mileage Reimbursement 3,395 2.63% 0.82% 42,839 12.62 7.99Volunteer – Agency 4 < .01% 1.07% 22 5.60 46.97Volunteer – Broker 3,095 2.39% 0.62% 203,743 65.83 38.76Airline 0 – 0.02% 0 – 202.10Commercial Bus 9 0.01% 0.01% 337 37.44 34.27Train 0 – < .01% 0 – 28.20Ferry 0 – 0.26% 0 – 6.13Foster Parent 0 – < .01% 0 – 2.26Ancillary – – – 0 – – Service Total 129,296 100% 100% $3,381,183 $26.15 $15.06
Administrative Costs – – – 561,588 4.34 2.55Subtotal 129,296 – – $3,942,771 $30.49 $17.61
Out of State 0 – – 0 – 363.85Meals and Lodging – In State 5,467 – – 180,380 32.99 37.31Meals and Lodging – Out of State 0 – – 0 – 36.09Vehicle Modification/Lift 0 – – 0 – 1,624.49Grand Total – – – $4,123,151 $31.89 $17.89
1Ambulatory demand response services do not require vehicles with lifts and/or other accommodations. Passengers are able to walk and do not rely on wheelchairs or other mobility devices which would necessitate a vehicle with a lift or other accommodations in order for passengers to board.
2Non-ambulatory demand response services require vehicles with lifts and/or other accommodations in order for passengers to board who cannot walk and rely on wheelchairs or other mobility devices.
3Service cost and cost-per-trip calculation only represent transit fares paid by brokers. The fully allocated cost is $23.30 per trip on average. This number is based on the statewide average cost-per-trip of transit systems’ demand response services (Washington State Department of Transportation, Washington State Summary of Public Transportation – 2005, August 2006).
Source:WashingtonStateDepartmentofSocialandHealthServices,HealthandRecoveryServicesAdministration,2005.

Page 196 Summary of Community and Brokered Transportation – 2005
Summary of Community and Brokered Transportation – 2005 Page 197
Special Mobility Services, Inc.
System Snapshot• OperatingName:SpecialMobilityServices,Inc.
• ServiceArea: MedicaidBrokerageRegion10–Ferry,Stevens, andPendOreilleCounties Region11–Grant,Lincoln,andAdamsCounties Region12–SpokaneCounty
• CongressionalDistricts:4,5
• LegislativeDistricts:4,6,7,9,12,13
• PlanningRegions:NorthEastWashingtonRTPO,SpokaneRegionalTransportationCouncil,andQuadCountyRTPO
• TypeofAgency:Non-profit
• GoverningBody:Five-memberboardofdirectors
Current OperationsBrokerstransportationforMedicaidclientsinRegions10(Ferry,Stevens,andPendOreilleCounties),11(Grant,Lincoln,andAdamsCounties),and12(SpokaneCounty).
Intermodal ConnectionsClientsmayuselocaltransportationtoconnecttointercitybus,rail,orairforout-of-areaappointments.
Rusty Koontz Regional ManagerMedicalTransportationAssistanceUnit3102EastTrent,Suite210Spokane,WA99202-3800(509)532-9505
Region 10
STEVENS
LINCOLN
SPOKANE
GRANT
ADAMS
PENDOREILLE
FERRY
Region 11
Region12
Page 198 Summary of Community and Brokered Transportation – 2005
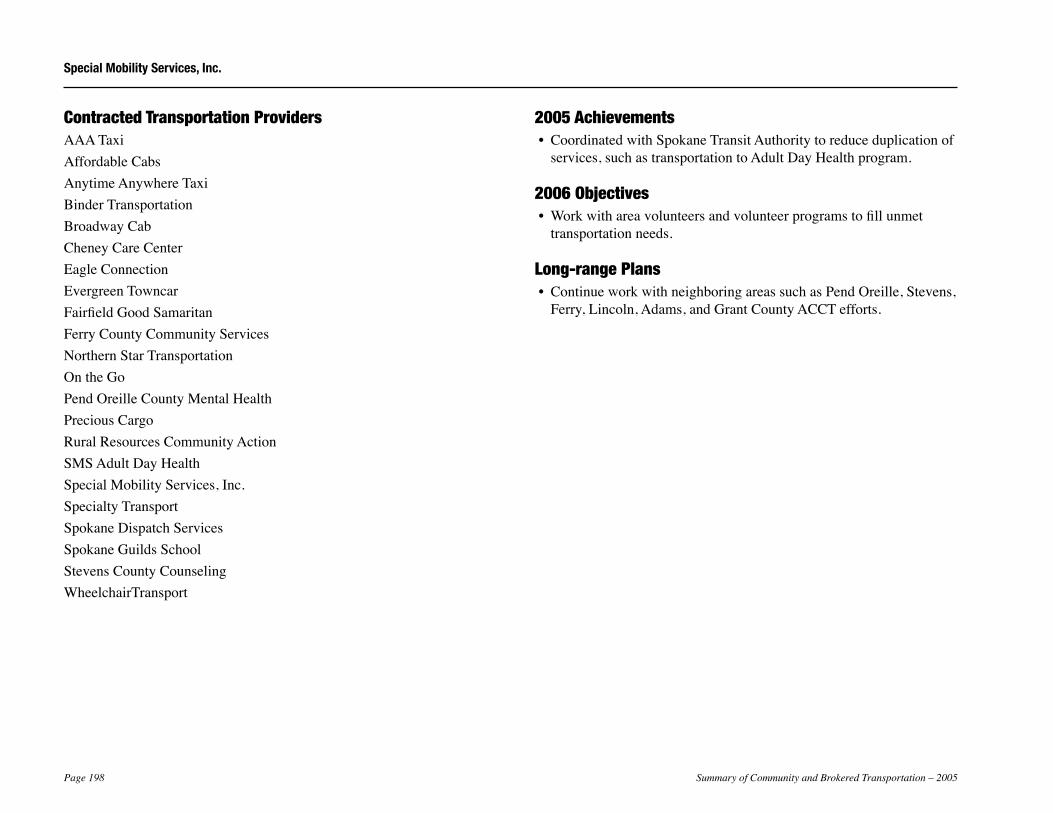
Contracted Transportation ProvidersAAATaxiAffordableCabsAnytimeAnywhereTaxiBinderTransportationBroadwayCabCheneyCareCenterEagleConnectionEvergreenTowncarFairfieldGoodSamaritanFerryCountyCommunityServicesNorthernStarTransportationOntheGoPendOreilleCountyMentalHealthPreciousCargoRuralResourcesCommunityActionSMSAdultDayHealthSpecialMobilityServices,Inc.SpecialtyTransportSpokaneDispatchServicesSpokaneGuildsSchoolStevensCountyCounselingWheelchairTransport
2005 Achievements• CoordinatedwithSpokaneTransitAuthoritytoreduceduplicationof
services,suchastransportationtoAdultDayHealthprogram.
2006 Objectives• Workwithareavolunteersandvolunteerprogramstofillunmet
transportationneeds.
Long-range Plans• ContinueworkwithneighboringareassuchasPendOreille,Stevens,
Ferry,Lincoln,Adams,andGrantCountyACCTefforts.
Special Mobility Services, Inc.
Summary of Community and Brokered Transportation – 2005 Page 199
Special Mobility Services, Inc.
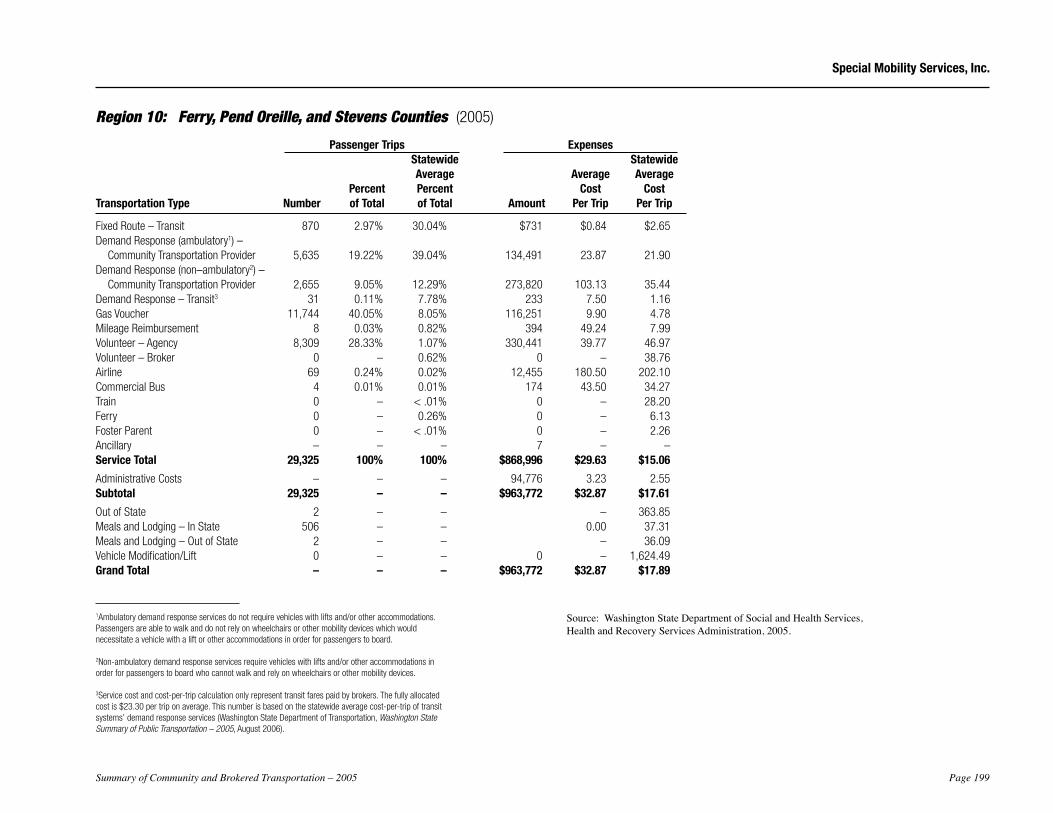
Region 10: Ferry, Pend Oreille, and Stevens Counties (2005)
Passenger Trips Expenses Statewide Statewide Average Average Average Percent Percent Cost Cost Transportation Type Number of Total of Total Amount Per Trip Per Trip
Fixed Route – Transit 870 2.97% 30.04% $731 $0.84 $2.65 Demand Response (ambulatory1) – Community Transportation Provider 5,635 19.22% 39.04% 134,491 23.87 21.90Demand Response (non–ambulatory2) – Community Transportation Provider 2,655 9.05% 12.29% 273,820 103.13 35.44Demand Response – Transit3 31 0.11% 7.78% 233 7.50 1.16Gas Voucher 11,744 40.05% 8.05% 116,251 9.90 4.78Mileage Reimbursement 8 0.03% 0.82% 394 49.24 7.99Volunteer – Agency 8,309 28.33% 1.07% 330,441 39.77 46.97Volunteer – Broker 0 – 0.62% 0 – 38.76Airline 69 0.24% 0.02% 12,455 180.50 202.10Commercial Bus 4 0.01% 0.01% 174 43.50 34.27Train 0 – < .01% 0 – 28.20Ferry 0 – 0.26% 0 – 6.13Foster Parent 0 – < .01% 0 – 2.26Ancillary – – – 7 – – Service Total 29,325 100% 100% $868,996 $29.63 $15.06
Administrative Costs – – – 94,776 3.23 2.55Subtotal 29,325 – – $963,772 $32.87 $17.61
Out of State 2 – – – 363.85Meals and Lodging – In State 506 – – 0.00 37.31Meals and Lodging – Out of State 2 – – – 36.09Vehicle Modification/Lift 0 – – 0 – 1,624.49Grand Total – – – $963,772 $32.87 $17.89
1Ambulatory demand response services do not require vehicles with lifts and/or other accommodations. Passengers are able to walk and do not rely on wheelchairs or other mobility devices which would necessitate a vehicle with a lift or other accommodations in order for passengers to board.
2Non-ambulatory demand response services require vehicles with lifts and/or other accommodations in order for passengers to board who cannot walk and rely on wheelchairs or other mobility devices.
3Service cost and cost-per-trip calculation only represent transit fares paid by brokers. The fully allocated cost is $23.30 per trip on average. This number is based on the statewide average cost-per-trip of transit systems’ demand response services (Washington State Department of Transportation, Washington State Summary of Public Transportation – 2005, August 2006).
Source:WashingtonStateDepartmentofSocialandHealthServices,HealthandRecoveryServicesAdministration,2005.
Page 200 Summary of Community and Brokered Transportation – 2005
Special Mobility Services, Inc.
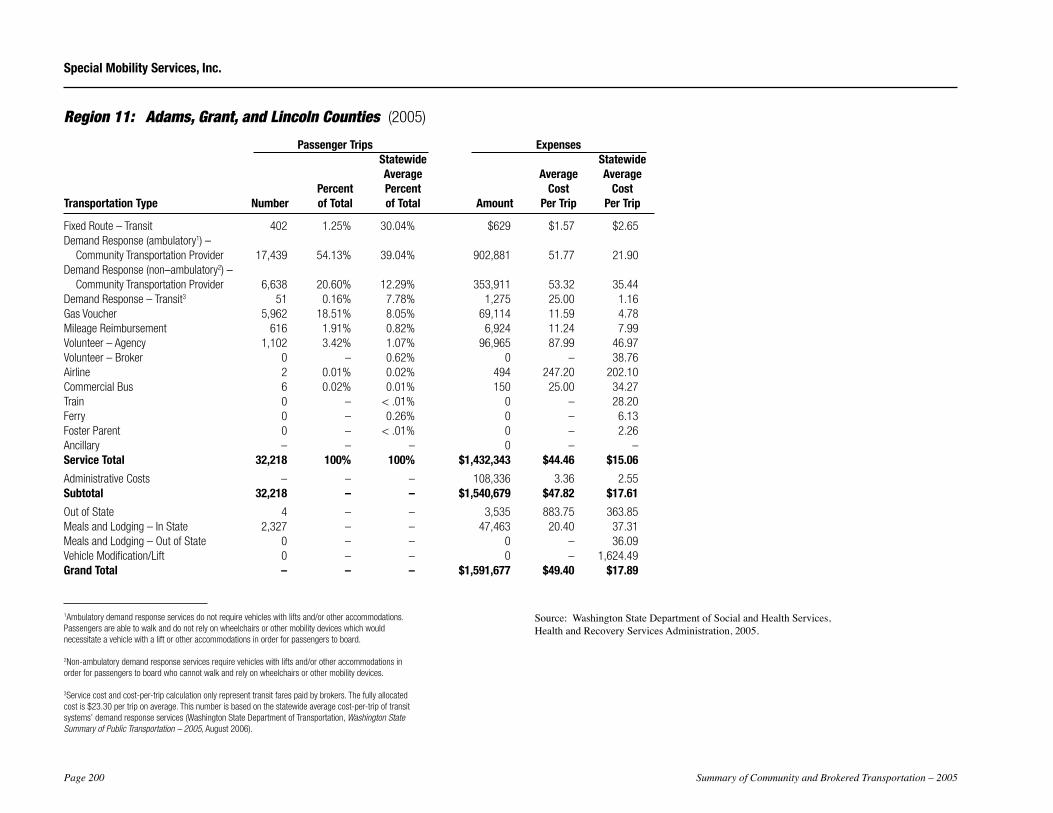
Region 11: Adams, Grant, and Lincoln Counties (2005)
Passenger Trips Expenses Statewide Statewide Average Average Average Percent Percent Cost Cost Transportation Type Number of Total of Total Amount Per Trip Per Trip
Fixed Route – Transit 402 1.25% 30.04% $629 $1.57 $2.65 Demand Response (ambulatory1) – Community Transportation Provider 17,439 54.13% 39.04% 902,881 51.77 21.90Demand Response (non–ambulatory2) – Community Transportation Provider 6,638 20.60% 12.29% 353,911 53.32 35.44Demand Response – Transit3 51 0.16% 7.78% 1,275 25.00 1.16Gas Voucher 5,962 18.51% 8.05% 69,114 11.59 4.78Mileage Reimbursement 616 1.91% 0.82% 6,924 11.24 7.99Volunteer – Agency 1,102 3.42% 1.07% 96,965 87.99 46.97Volunteer – Broker 0 – 0.62% 0 – 38.76Airline 2 0.01% 0.02% 494 247.20 202.10Commercial Bus 6 0.02% 0.01% 150 25.00 34.27Train 0 – < .01% 0 – 28.20Ferry 0 – 0.26% 0 – 6.13Foster Parent 0 – < .01% 0 – 2.26Ancillary – – – 0 – – Service Total 32,218 100% 100% $1,432,343 $44.46 $15.06
Administrative Costs – – – 108,336 3.36 2.55Subtotal 32,218 – – $1,540,679 $47.82 $17.61
Out of State 4 – – 3,535 883.75 363.85Meals and Lodging – In State 2,327 – – 47,463 20.40 37.31Meals and Lodging – Out of State 0 – – 0 – 36.09Vehicle Modification/Lift 0 – – 0 – 1,624.49Grand Total – – – $1,591,677 $49.40 $17.89
1Ambulatory demand response services do not require vehicles with lifts and/or other accommodations. Passengers are able to walk and do not rely on wheelchairs or other mobility devices which would necessitate a vehicle with a lift or other accommodations in order for passengers to board.
2Non-ambulatory demand response services require vehicles with lifts and/or other accommodations in order for passengers to board who cannot walk and rely on wheelchairs or other mobility devices.
3Service cost and cost-per-trip calculation only represent transit fares paid by brokers. The fully allocated cost is $23.30 per trip on average. This number is based on the statewide average cost-per-trip of transit systems’ demand response services (Washington State Department of Transportation, Washington State Summary of Public Transportation – 2005, August 2006).
Source:WashingtonStateDepartmentofSocialandHealthServices,HealthandRecoveryServicesAdministration,2005.
Summary of Community and Brokered Transportation – 2005 Page 201
Special Mobility Services, Inc.
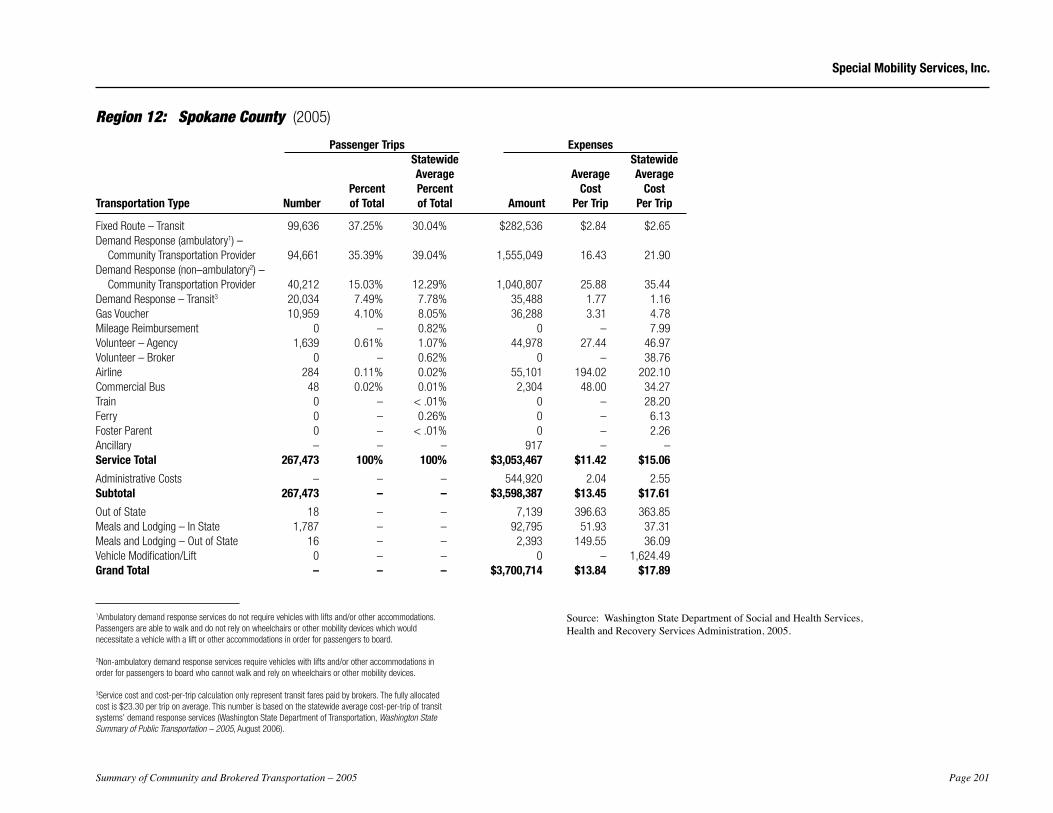
Region 12: Spokane County (2005)
Passenger Trips Expenses Statewide Statewide Average Average Average Percent Percent Cost Cost Transportation Type Number of Total of Total Amount Per Trip Per Trip
Fixed Route – Transit 99,636 37.25% 30.04% $282,536 $2.84 $2.65 Demand Response (ambulatory1) – Community Transportation Provider 94,661 35.39% 39.04% 1,555,049 16.43 21.90Demand Response (non–ambulatory2) – Community Transportation Provider 40,212 15.03% 12.29% 1,040,807 25.88 35.44Demand Response – Transit3 20,034 7.49% 7.78% 35,488 1.77 1.16Gas Voucher 10,959 4.10% 8.05% 36,288 3.31 4.78Mileage Reimbursement 0 – 0.82% 0 – 7.99Volunteer – Agency 1,639 0.61% 1.07% 44,978 27.44 46.97Volunteer – Broker 0 – 0.62% 0 – 38.76Airline 284 0.11% 0.02% 55,101 194.02 202.10Commercial Bus 48 0.02% 0.01% 2,304 48.00 34.27Train 0 – < .01% 0 – 28.20Ferry 0 – 0.26% 0 – 6.13Foster Parent 0 – < .01% 0 – 2.26Ancillary – – – 917 – – Service Total 267,473 100% 100% $3,053,467 $11.42 $15.06
Administrative Costs – – – 544,920 2.04 2.55Subtotal 267,473 – – $3,598,387 $13.45 $17.61
Out of State 18 – – 7,139 396.63 363.85Meals and Lodging – In State 1,787 – – 92,795 51.93 37.31Meals and Lodging – Out of State 16 – – 2,393 149.55 36.09Vehicle Modification/Lift 0 – – 0 – 1,624.49Grand Total – – – $3,700,714 $13.84 $17.89
1Ambulatory demand response services do not require vehicles with lifts and/or other accommodations. Passengers are able to walk and do not rely on wheelchairs or other mobility devices which would necessitate a vehicle with a lift or other accommodations in order for passengers to board.
2Non-ambulatory demand response services require vehicles with lifts and/or other accommodations in order for passengers to board who cannot walk and rely on wheelchairs or other mobility devices.
3Service cost and cost-per-trip calculation only represent transit fares paid by brokers. The fully allocated cost is $23.30 per trip on average. This number is based on the statewide average cost-per-trip of transit systems’ demand response services (Washington State Department of Transportation, Washington State Summary of Public Transportation – 2005, August 2006).
Source:WashingtonStateDepartmentofSocialandHealthServices,HealthandRecoveryServicesAdministration,2005.

Page 202 Summary of Community and Brokered Transportation – 2005
Summary of Community and Brokered Transportation – 2005 Page 203
Trancare
System Snapshot• OperatingName:Trancare
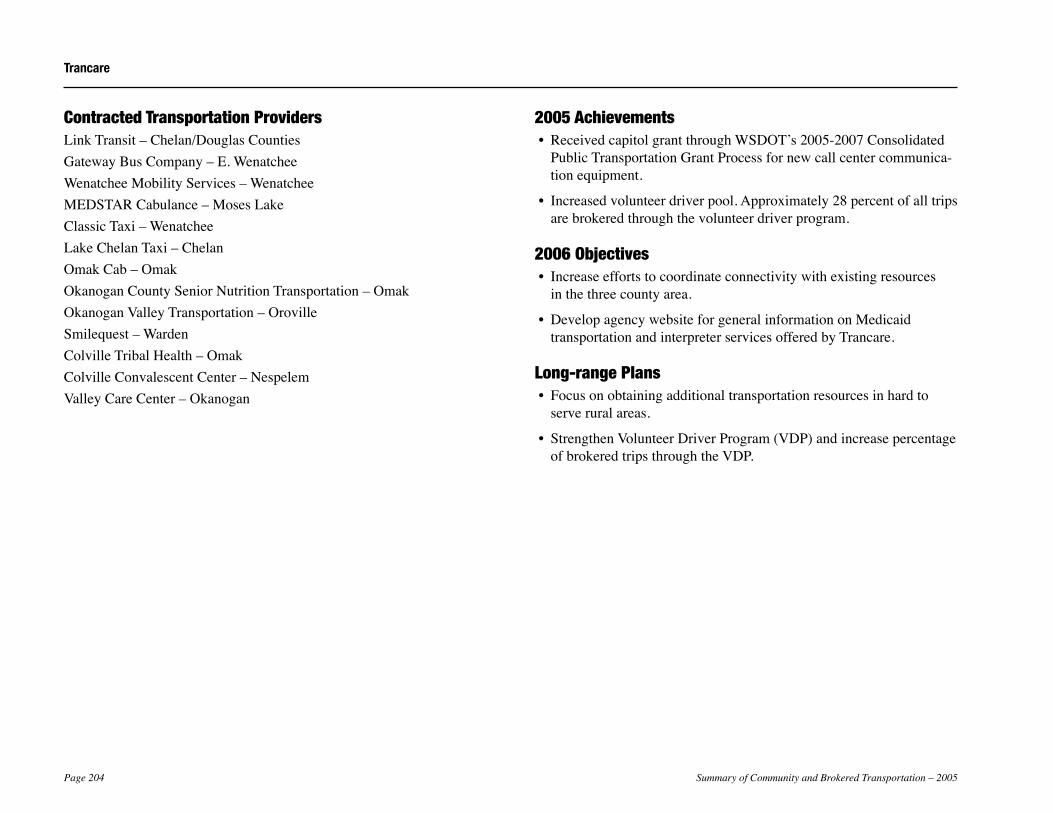
• ServiceArea:MedicaidBrokerageRegion9–Okanogan,Chelan,andDouglasCounties
• CongressionalDistrict:4
• LegislativeDistricts:7,12
• PlanningRegions:NorthCentralRTPOandWenatcheeValleyTransportationCouncil
• TypeofAgency:Non-profit
• GoverningBody:BoardofDirectors
Current OperationsTransportationbrokerageforMedicaidclientsinRegion9(Chelan,Douglas,andOkanoganCounties).
Intermodal ConnectionsLinkTransitattheColumbiaStationinWenatchee
Greg Wright Director225OhmeGardenRoadWenatchee,WA98801-9047(509)667-1431InternetHomePage:www.trancare.org
Region 9
OKANOGAN
CHELAN
DOUGLAS
Page 204 Summary of Community and Brokered Transportation – 2005
Contracted Transportation ProvidersLinkTransit–Chelan/DouglasCountiesGatewayBusCompany–E.WenatcheeWenatcheeMobilityServices–WenatcheeMEDSTARCabulance–MosesLakeClassicTaxi–WenatcheeLakeChelanTaxi–ChelanOmakCab–OmakOkanoganCountySeniorNutritionTransportation–OmakOkanoganValleyTransportation–OrovilleSmilequest–WardenColvilleTribalHealth–OmakColvilleConvalescentCenter–NespelemValleyCareCenter–Okanogan
2005 Achievements• ReceivedcapitolgrantthroughWSDOT’s2005-2007Consolidated
PublicTransportationGrantProcessfornewcallcentercommunica-tionequipment.
• Increasedvolunteerdriverpool.Approximately28percentofalltripsarebrokeredthroughthevolunteerdriverprogram.
2006 Objectives• Increaseeffortstocoordinateconnectivitywithexistingresources
inthethreecountyarea.
• DevelopagencywebsiteforgeneralinformationonMedicaidtransportationandinterpreterservicesofferedbyTrancare.
Long-range Plans• Focusonobtainingadditionaltransportationresourcesinhardto
serveruralareas.
• StrengthenVolunteerDriverProgram(VDP)andincreasepercentageofbrokeredtripsthroughtheVDP.
Trancare
Summary of Community and Brokered Transportation – 2005 Page 205
Trancare
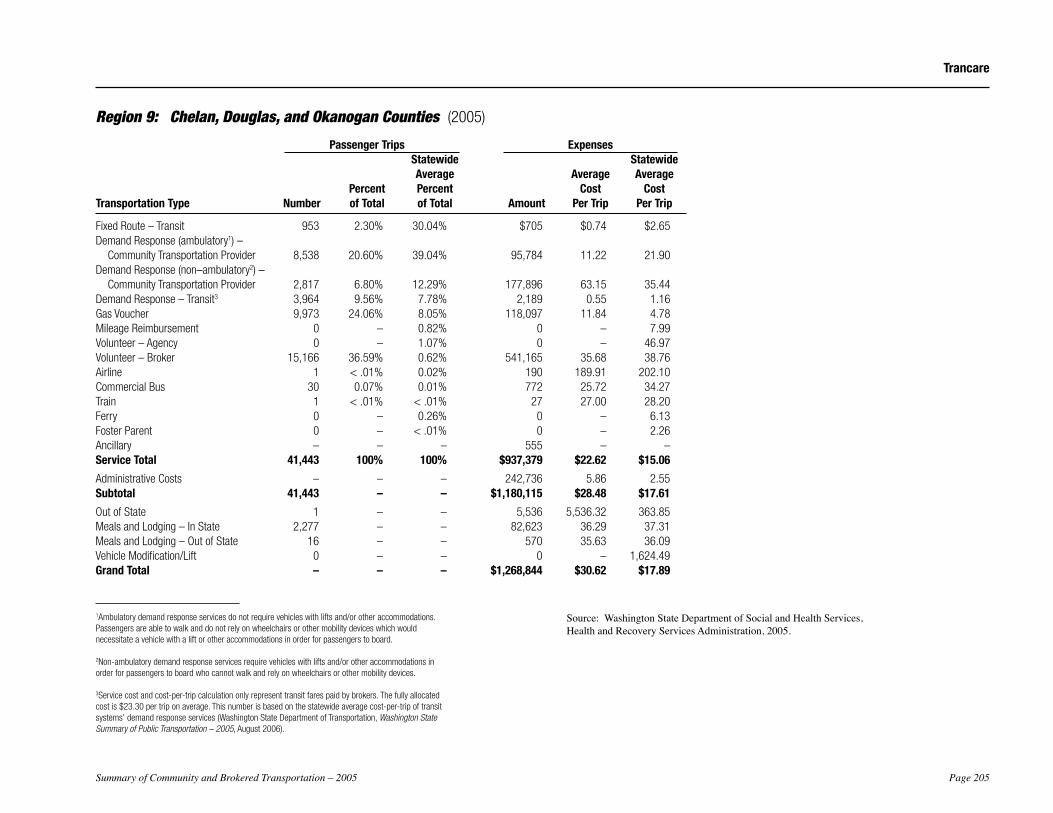
Region 9: Chelan, Douglas, and Okanogan Counties (2005)
Passenger Trips Expenses Statewide Statewide Average Average Average Percent Percent Cost Cost Transportation Type Number of Total of Total Amount Per Trip Per Trip
Fixed Route – Transit 953 2.30% 30.04% $705 $0.74 $2.65 Demand Response (ambulatory1) – Community Transportation Provider 8,538 20.60% 39.04% 95,784 11.22 21.90Demand Response (non–ambulatory2) – Community Transportation Provider 2,817 6.80% 12.29% 177,896 63.15 35.44Demand Response – Transit3 3,964 9.56% 7.78% 2,189 0.55 1.16Gas Voucher 9,973 24.06% 8.05% 118,097 11.84 4.78Mileage Reimbursement 0 – 0.82% 0 – 7.99Volunteer – Agency 0 – 1.07% 0 – 46.97Volunteer – Broker 15,166 36.59% 0.62% 541,165 35.68 38.76Airline 1 < .01% 0.02% 190 189.91 202.10Commercial Bus 30 0.07% 0.01% 772 25.72 34.27Train 1 < .01% < .01% 27 27.00 28.20Ferry 0 – 0.26% 0 – 6.13Foster Parent 0 – < .01% 0 – 2.26Ancillary – – – 555 – – Service Total 41,443 100% 100% $937,379 $22.62 $15.06
Administrative Costs – – – 242,736 5.86 2.55Subtotal 41,443 – – $1,180,115 $28.48 $17.61
Out of State 1 – – 5,536 5,536.32 363.85Meals and Lodging – In State 2,277 – – 82,623 36.29 37.31Meals and Lodging – Out of State 16 – – 570 35.63 36.09Vehicle Modification/Lift 0 – – 0 – 1,624.49Grand Total – – – $1,268,844 $30.62 $17.89
1Ambulatory demand response services do not require vehicles with lifts and/or other accommodations. Passengers are able to walk and do not rely on wheelchairs or other mobility devices which would necessitate a vehicle with a lift or other accommodations in order for passengers to board.
2Non-ambulatory demand response services require vehicles with lifts and/or other accommodations in order for passengers to board who cannot walk and rely on wheelchairs or other mobility devices.
3Service cost and cost-per-trip calculation only represent transit fares paid by brokers. The fully allocated cost is $23.30 per trip on average. This number is based on the statewide average cost-per-trip of transit systems’ demand response services (Washington State Department of Transportation, Washington State Summary of Public Transportation – 2005, August 2006).
Source:WashingtonStateDepartmentofSocialandHealthServices,HealthandRecoveryServicesAdministration,2005.

Page 206 Summary of Community and Brokered Transportation – 2005