Embed Size (px)
Citation preview
Acta of Bioengineering and Biomechanics Original paperVol. 17, No. 4, 2015 DOI: 10.5277/ABB-00296-2015-02
Medial longitudinal arch biomechanics evaluationduring gait in subjects with flexible flatfoot
TULAYA PRACHGOSIN1, DESMOND Y.R. CHONG2, WIPAWAN LEELASAMRAN3,PRUITTIKORN SMITHMAITRIE4, SURAPONG CHATPUN1*
1 Institute of Biomedical Engineering, Faculty of Medicine, Prince of Songkla University, Songkhla, Thailand.2 Department of Biomedical Engineering, Faculty of Engineering, National University of Singapore, Singapore.
3 Department of Orthopaedic Surgery and Physical Medicine, Faculty of Medicine, Prince of Songkla University, Songkhla, Thailand.4 Department of Mechanical Engineering, Faculty of Engineering, Prince of Songkla University, Songkhla, Thailand.
Purpose: Medial longitudinal arch (MLA) strengthening has been considered an important part of successful flatfoot treatment. But,to date, the biomechanical loading behavior of the medial arch in flatfoot has not been evaluated. This study aimed to evaluate the MLAmoment, MLA deformation angle, foot kinematics and ground reaction forces (GRF) in both normal foot and flatfoot groups. Methods:Each participant’s foot was classified according to arch type using foot prints and radiographs. Twenty-eight non-obese adults (13 flat-feet and 15 normal feet) were involved. The biomechanics data were collected in a 3D motion analysis laboratory. The MLA biome-chanics were calculated. Hindfoot and forefoot kinematics were also analyzed. Results: The flatfoot group had a significantly greaterpeak eversion MLA moment ( p = 0.005) and a smaller peak MLA deformation angle ( p < 0.05) during specific subphases. The peak ofhindfoot plantarflexion ( p < 0.05) and internal rotation ( p < 0.05) and the peak of forefoot abduction ( p < 0.05) in the specific subphaseswere greater in the flatfoot group. The flatfoot group also had significantly smaller peak vertical GRF ( p < 0.05) during late stance andlarger peak medial GRF ( p < 0.05) during mid stance. Conclusions: This study found a significantly greater eversion deforming forceacting at the MLA structure, greater hindfoot and forefoot motion, less MLA flexibility and abnormal GRF in a flatfoot group duringwalking, which reflected the deficit of foot function in a flatfoot group.
Key words: biomechanics, gait, medial longitudinal arch, flatfoot
1. Introduction
Flexible flatfoot is a reversible complex foot de-formity, which is comprised of the heel valgus, lowermedial longitudinal arch (MLA) and abductory foottwist. Subtalar joint (STJ) is the main joint to evaluateflatfoot pathomechanics. The medial deviation ofsubtalar joint axis location is used to determine thepronation pathological force in flatfoot [11]. But theprecision in the determination of the STJ axis needsclinical practice and experience. In addition to the STJaxis, the stability of the MLA is also an important footstructure in flatfoot motion. The talonavicular joint
(TNJ) is the keystone joint of the MLA structure lo-cated at the apex of the MLA and is a dual member ofthe subtalar complex joint and transverse tarsal joint[21]. Arangio and colleagues [1] found that 5 degreesof STJ pronation increased TNJ moment by 47%.The complexity of this articulation is called the ace-tabulum pedis [19], [21]. Ligamentous laxity is oneof the related conditions with the flatfoot [19]. Thehyper-flexibility of the acetabulum pedis allows anexcessive motion of talar head, calcaneus and na-vicular bones [8]. This can cause peritalar subluxa-tion, an unlocked midtarsal joint, and unstable foot inpronation posture. The lever arm of the MLA apex isincreased and a larger moment is applied on the
______________________________
* Corresponding author: Surapong Chatpun, Institute of Biomedical Engineering (IBME), Faculty of Medicine, Prince of SongklaUniversity, Songkhla, Thailand 90110. Tel: +66 (0)74-451743, fax: +66 (0)74-451744, e-mail: [email protected]
Received: January 24th, 2015Accepted for publication: March 10th, 2015
T. PRACHGOSIN et al.122
joint. This leads to ongoing injury of the weak springligament complex (SLC) and then posterior tibialistendon insufficiency develops with further foot de-stabilization [10]. As part of shock absorption andrigid lever assistance of the foot during locomotionthe function of TNJ and MLA should be evaluated inflatfoot gait [16], [18].
MLA structure evaluation has been used in clinicalpractice to evaluate foot function, such as navicularheight, navicular drop test, and navicular drift testduring static and dynamic conditions [12]. Addition-ally, motion analysis of the MLA, MLA movementand TNJ moment, was evaluated during walking todetermine the relationship to the tarsal joints in nor-mal foot [1], [15], [24].
In flatfoot, Tome and colleagues [25] suggestedthat in addition to the hindfoot angle, the MLA angleand forefoot kinematics were also important parame-ters to develop a treatment plan for posterior tibialtendon dysfunction (PTTD) in patients. They founda significantly greater hindfoot eversion, MLA andforefoot abduction angles across the specific phase ofstance in PTTD patients in comparison with the nor-mal group. Besides that, the load at the MLA of flat-foot is essential, too. Arangio and colleagues [2]evaluated the TNJ moment with a mathematicalmodel in a cadaveric flatfoot model. They founda larger significant TNJ moment in weakened MLAstabilizers during talar dome loading.
At present, a study of the dynamic MLA biome-chanics in flatfoot has not been reported. This studyexperimentally tested the hypothesis that there wouldbe differences of the MLA biomechanics (MLA mo-ment and MLA deformation [MLAD] angle), hindfootand forefoot kinematics, and ground reaction forcesbetween normal foot and flatfoot groups in each gaitsubphase including loading response, mid stance,terminal stance, and pre-swing.
2. Methods
2.1. Participants
Twenty-eight participants who were 18 to 50 yearsold with a Body Mass Index less than 25 were re-cruited from the local population in southern Thai-land. Potential participants who had any neuromus-cular-skeletal diseases were excluded. The foot archtypes of normal foot and flatfoot groups were classi-fied by footprint and foot radiographs [14]. The foot-
print was determined by the arch index which is thearea of the midfoot divided by the whole foot areaexcluding the digits. Two views of foot radiographswere taken: anterior-posterior and lateral views. Thecalcaneal pitch (CIA) and calcaneal-first metatarsal(C1MA) angles were measured in the lateral view.The talonavicular coverage (TNC) and talus to thesecond metatarsal (T2MA) angles were measured inthe anterior-posterior view. In this study, the normalfoot criteria reference range was defined following theLeslie et al. study [13] and within one standard devia-tion. Only one foot of each participant was evaluated.Informed consent was obtained from each participantbefore the study. Ethical approval for this study wasobtained from the Institutional Review Board (EthicsID: 55-299-25-6-3).
2.2. Instrumentation
This study used a three-dimensional motion analysissystem (Vicon Mx, Vicon Motion System Ltd., Oxford,England) with 10 cameras (MX T20) with a samplingfrequency of 100 Hz to capture the foot kinematics.Three force platforms (AMTI, OR6, USA) with sam-pling at 1,000 Hz were used to measure the groundreaction forces (GRF).
2.3. Procedures
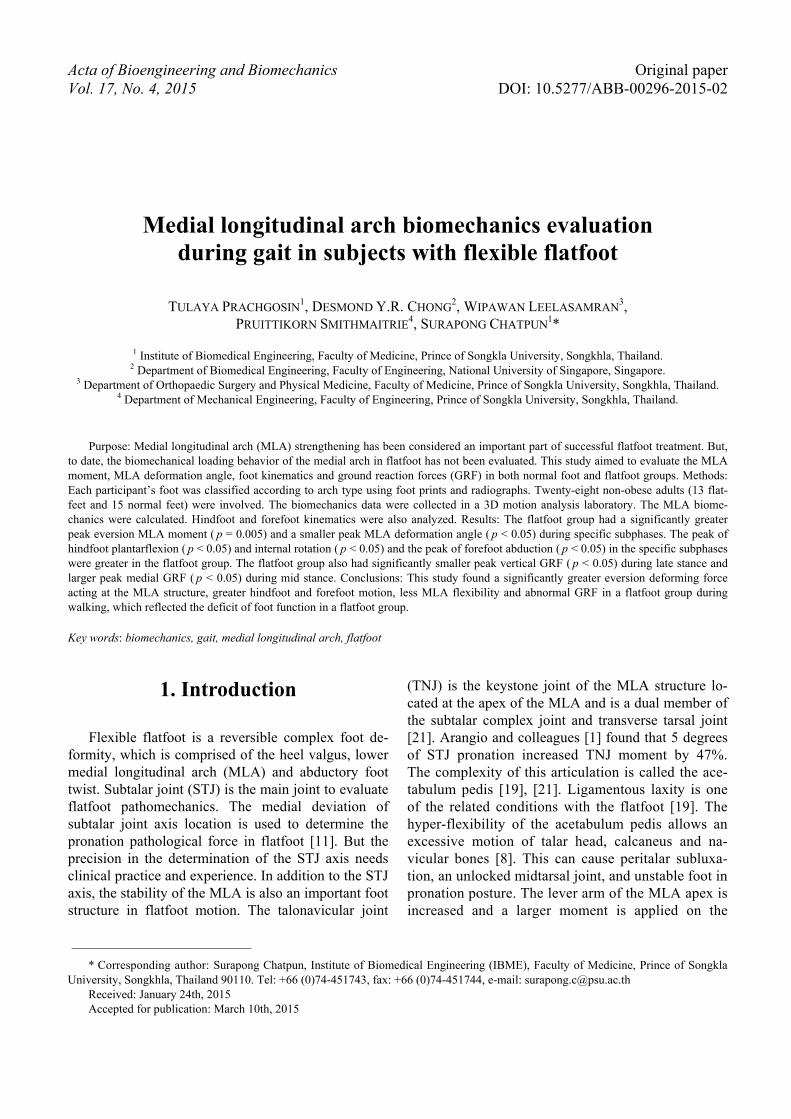
Reflective markers with a diameter of 9 mm weremounted onto the participants’ feet with double-sidedadhesive tape based on the positions defined by theOxford Foot Model [22], [25]. Additional markers toevaluate the MLA were also mounted (Fig. 1a). Allparticipants attended a single session test by walkingbarefoot at a self-selected comfortable speed alonga 10 meter walkway. During static capture, the par-ticipants were asked to stand in the relaxed position.Each participant had to become familiar with thewalkway before data capture began. Three successfultrials of only one foot on one force platform werecollected for data analysis.
2.4. Mechanical evaluation
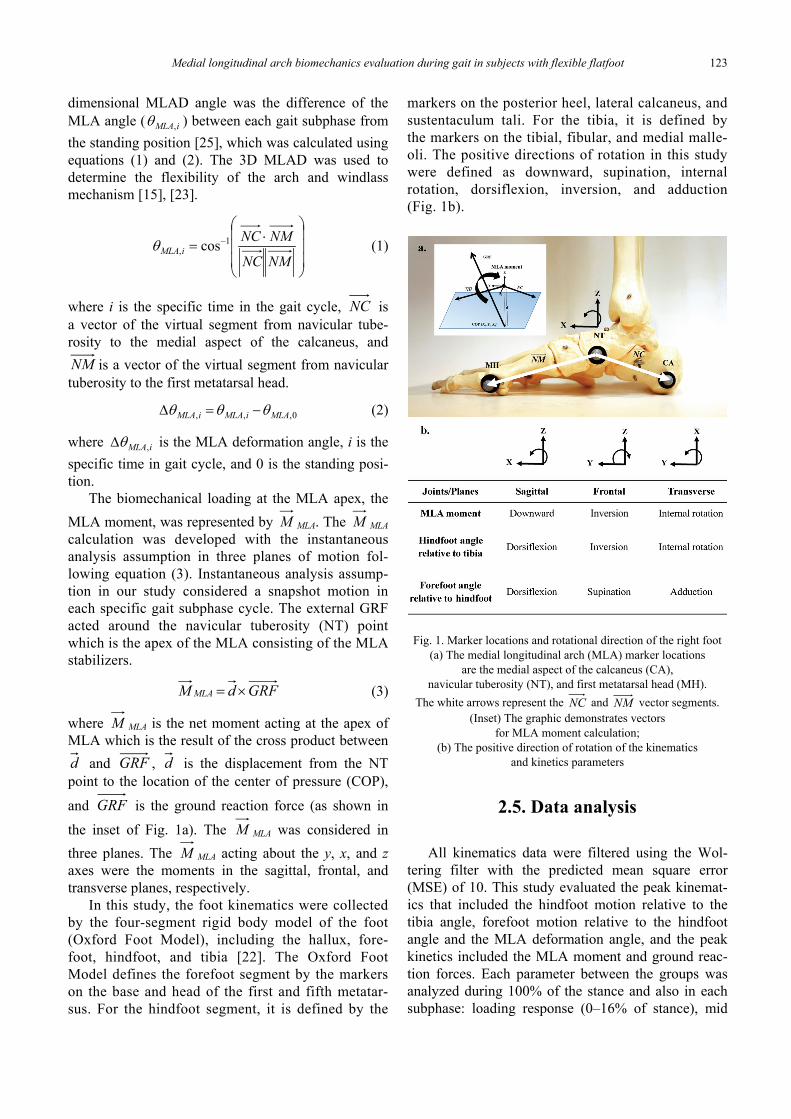
The MLA biomechanics in this study were basedon the motion of two virtual vector segments. Theproximal vector segment was NC and the distal vec-tor segment was NM as shown in Fig. 1a. The three-
Medial longitudinal arch biomechanics evaluation during gait in subjects with flexible flatfoot 123
dimensional MLAD angle was the difference of theMLA angle ( iMLA,θ ) between each gait subphase fromthe standing position [25], which was calculated usingequations (1) and (2). The 3D MLAD was used todetermine the flexibility of the arch and windlassmechanism [15], [23].
⎟⎟⎟
⎠
⎞
⎜⎜⎜
⎝
⎛⋅
= −
NMNC
NMNCiMLA
1, cosθ (1)
where i is the specific time in the gait cycle, NC isa vector of the virtual segment from navicular tube-rosity to the medial aspect of the calcaneus, andNM is a vector of the virtual segment from naviculartuberosity to the first metatarsal head.
0,,, MLAiMLAiMLA θθθ −=Δ (2)
where iMLA,θΔ is the MLA deformation angle, i is thespecific time in gait cycle, and 0 is the standing posi-tion.
The biomechanical loading at the MLA apex, theMLA moment, was represented by M MLA. The M MLA
calculation was developed with the instantaneousanalysis assumption in three planes of motion fol-lowing equation (3). Instantaneous analysis assump-tion in our study considered a snapshot motion ineach specific gait subphase cycle. The external GRFacted around the navicular tuberosity (NT) pointwhich is the apex of the MLA consisting of the MLAstabilizers.
GRFdM MLA ×= (3)
where M MLA is the net moment acting at the apex ofMLA which is the result of the cross product betweend and GRF , d is the displacement from the NTpoint to the location of the center of pressure (COP),
and GRF is the ground reaction force (as shown in
the inset of Fig. 1a). The M MLA was considered inthree planes. The M MLA acting about the y, x, and zaxes were the moments in the sagittal, frontal, andtransverse planes, respectively.
In this study, the foot kinematics were collectedby the four-segment rigid body model of the foot(Oxford Foot Model), including the hallux, fore-foot, hindfoot, and tibia [22]. The Oxford FootModel defines the forefoot segment by the markerson the base and head of the first and fifth metatar-sus. For the hindfoot segment, it is defined by the
markers on the posterior heel, lateral calcaneus, andsustentaculum tali. For the tibia, it is defined bythe markers on the tibial, fibular, and medial malle-oli. The positive directions of rotation in this studywere defined as downward, supination, internalrotation, dorsiflexion, inversion, and adduction(Fig. 1b).
Fig. 1. Marker locations and rotational direction of the right foot(a) The medial longitudinal arch (MLA) marker locations
are the medial aspect of the calcaneus (CA),navicular tuberosity (NT), and first metatarsal head (MH).
The white arrows represent the NC and NM vector segments.(Inset) The graphic demonstrates vectors
for MLA moment calculation;(b) The positive direction of rotation of the kinematics
and kinetics parameters
2.5. Data analysis
All kinematics data were filtered using the Wol-tering filter with the predicted mean square error(MSE) of 10. This study evaluated the peak kinemat-ics that included the hindfoot motion relative to thetibia angle, forefoot motion relative to the hindfootangle and the MLA deformation angle, and the peakkinetics included the MLA moment and ground reac-tion forces. Each parameter between the groups wasanalyzed during 100% of the stance and also in eachsubphase: loading response (0–16% of stance), mid
Inversion
T. PRACHGOSIN et al.124
stance (17–48% of stance), terminal stance (49–81%of stance), and pre-swing (82–100% of stance) [4],[7]. The data were then statistically compared betweengroups with unpaired t-test via Prism 5 (GraphPad,San Diego, CA) and the significance level was set atp value < 0.05.
3. Results
There were significant differences between flatfootand normal foot groups in both kinematics and kinet-ics during specific subphases of the gait cycle. Thedata were presented in the mean difference betweenthe groups and standard deviation among the data.The demographic data and the spatio-temporal pa-rameters of all participants have been concluded inTable 1.
Table. Participants’ characteristics data (mean ± SD)
CharacteristicNormal
foot group(N = 15)
Flatfootgroup
(N = 13)Age (years) 32.7 ± 8.9 24.9 ± 3.3Gender (Female/Male) 14/1 10/3Foot side (Right/Left) 11/4 10/3Height (m) 1.6 ± 0.1 1.6 ± 0.1Body mass (kg) 52.2 ± 4.8 59.1 ± 7.6Body Mass Index (kg/m2) 21.1 ± 1.6 22.7 ± 1.9Footprint arch index 0.25 ± 0.02 0.35 ± 0.03
Radiography (degrees)Calcaneal inclination angle 21.2 ± 1.7 13.9 ± 2.7Calcaneal-first metatarsal angle 133.4 ± 2.9 147.0 ± 4.9Talonavicular coverage angle 18.2 ± 3.6 23.7 ± 7.7Talus to second metatarsal angle 18.6 ± 4.5 27.4 ± 11.8
Spatio-temporal parametersGait velocity (m/s) 1.12 ± 0.1 1.09 ± 0.1Stride length (m) 1.19 ± 0.1 1.20 ± 0.1Cadence (step/min) 113.51 ± 7.8 109.19 ± 7.6
3.1. Medial longitudinal arch (MLA)biomechanics
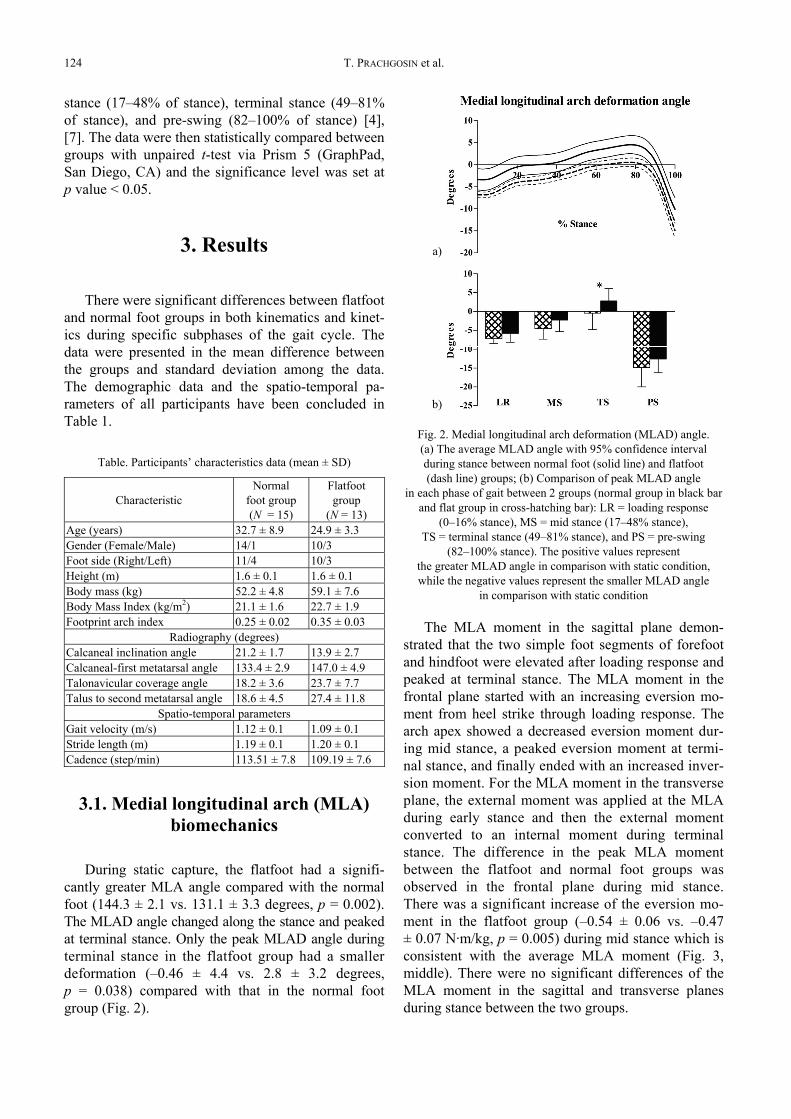
During static capture, the flatfoot had a signifi-cantly greater MLA angle compared with the normalfoot (144.3 ± 2.1 vs. 131.1 ± 3.3 degrees, p = 0.002).The MLAD angle changed along the stance and peakedat terminal stance. Only the peak MLAD angle duringterminal stance in the flatfoot group had a smallerdeformation (–0.46 ± 4.4 vs. 2.8 ± 3.2 degrees,p = 0.038) compared with that in the normal footgroup (Fig. 2).
Fig. 2. Medial longitudinal arch deformation (MLAD) angle.(a) The average MLAD angle with 95% confidence intervalduring stance between normal foot (solid line) and flatfoot(dash line) groups; (b) Comparison of peak MLAD angle
in each phase of gait between 2 groups (normal group in black barand flat group in cross-hatching bar): LR = loading response
(0–16% stance), MS = mid stance (17–48% stance),TS = terminal stance (49–81% stance), and PS = pre-swing
(82–100% stance). The positive values representthe greater MLAD angle in comparison with static condition,while the negative values represent the smaller MLAD angle
in comparison with static condition
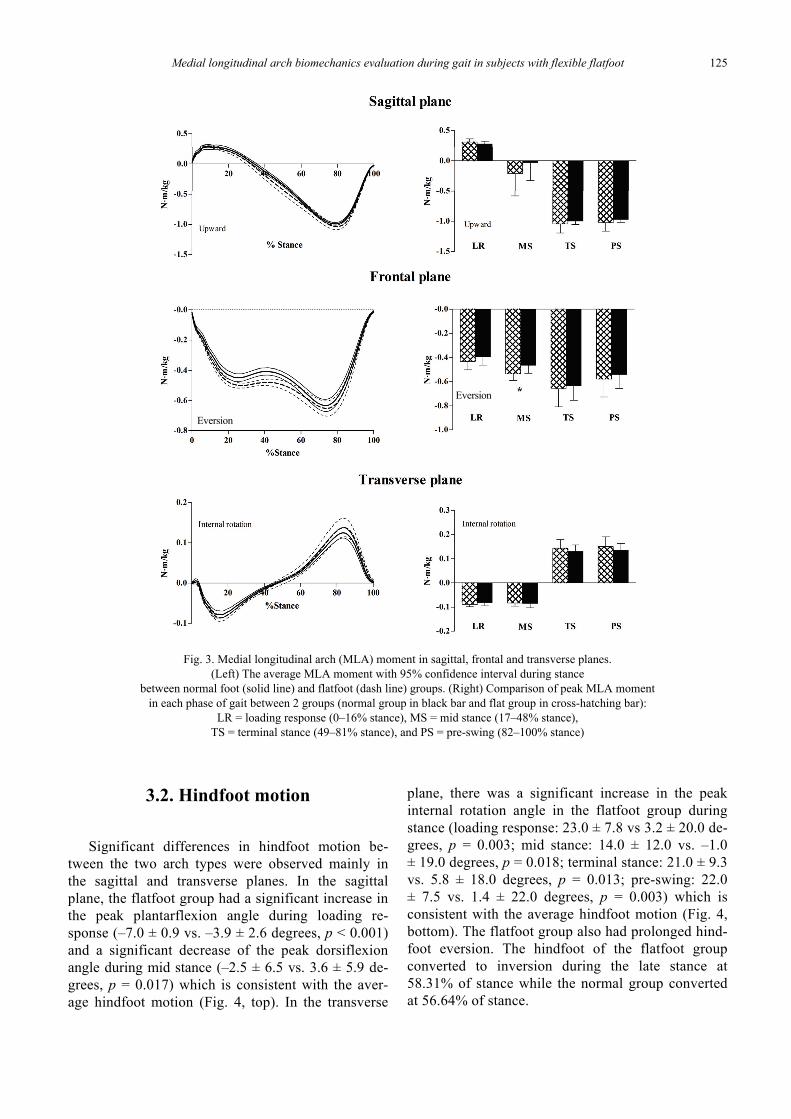
The MLA moment in the sagittal plane demon-strated that the two simple foot segments of forefootand hindfoot were elevated after loading response andpeaked at terminal stance. The MLA moment in thefrontal plane started with an increasing eversion mo-ment from heel strike through loading response. Thearch apex showed a decreased eversion moment dur-ing mid stance, a peaked eversion moment at termi-nal stance, and finally ended with an increased inver-sion moment. For the MLA moment in the transverseplane, the external moment was applied at the MLAduring early stance and then the external momentconverted to an internal moment during terminalstance. The difference in the peak MLA momentbetween the flatfoot and normal foot groups wasobserved in the frontal plane during mid stance.There was a significant increase of the eversion mo-ment in the flatfoot group (–0.54 ± 0.06 vs. –0.47± 0.07 N·m/kg, p = 0.005) during mid stance which isconsistent with the average MLA moment (Fig. 3,middle). There were no significant differences of theMLA moment in the sagittal and transverse planesduring stance between the two groups.
a)
b)
Medial longitudinal arch biomechanics evaluation during gait in subjects with flexible flatfoot 125
3.2. Hindfoot motion
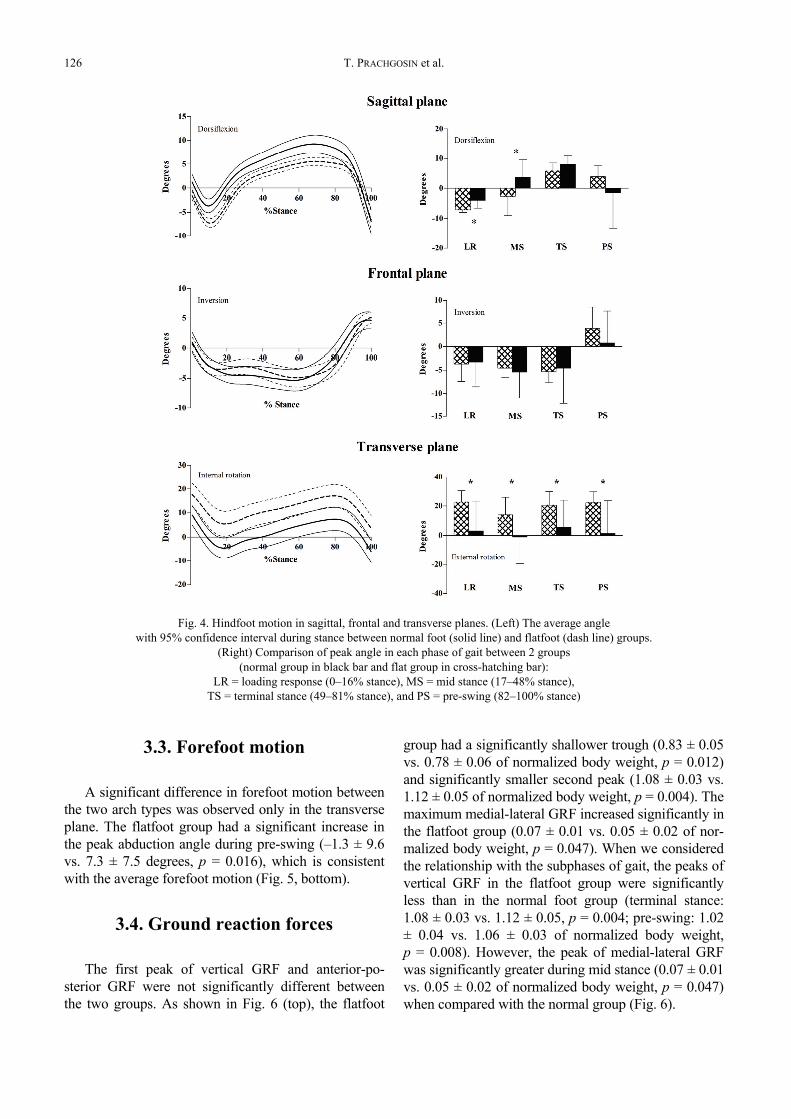
Significant differences in hindfoot motion be-tween the two arch types were observed mainly inthe sagittal and transverse planes. In the sagittalplane, the flatfoot group had a significant increase inthe peak plantarflexion angle during loading re-sponse (–7.0 ± 0.9 vs. –3.9 ± 2.6 degrees, p < 0.001)and a significant decrease of the peak dorsiflexionangle during mid stance (–2.5 ± 6.5 vs. 3.6 ± 5.9 de-grees, p = 0.017) which is consistent with the aver-age hindfoot motion (Fig. 4, top). In the transverse
plane, there was a significant increase in the peakinternal rotation angle in the flatfoot group duringstance (loading response: 23.0 ± 7.8 vs 3.2 ± 20.0 de-grees, p = 0.003; mid stance: 14.0 ± 12.0 vs. –1.0± 19.0 degrees, p = 0.018; terminal stance: 21.0 ± 9.3vs. 5.8 ± 18.0 degrees, p = 0.013; pre-swing: 22.0± 7.5 vs. 1.4 ± 22.0 degrees, p = 0.003) which isconsistent with the average hindfoot motion (Fig. 4,bottom). The flatfoot group also had prolonged hind-foot eversion. The hindfoot of the flatfoot groupconverted to inversion during the late stance at58.31% of stance while the normal group convertedat 56.64% of stance.
Fig. 3. Medial longitudinal arch (MLA) moment in sagittal, frontal and transverse planes.(Left) The average MLA moment with 95% confidence interval during stance
between normal foot (solid line) and flatfoot (dash line) groups. (Right) Comparison of peak MLA momentin each phase of gait between 2 groups (normal group in black bar and flat group in cross-hatching bar):
LR = loading response (0–16% stance), MS = mid stance (17–48% stance),TS = terminal stance (49–81% stance), and PS = pre-swing (82–100% stance)
Eversion
Eversion
T. PRACHGOSIN et al.126
3.3. Forefoot motion
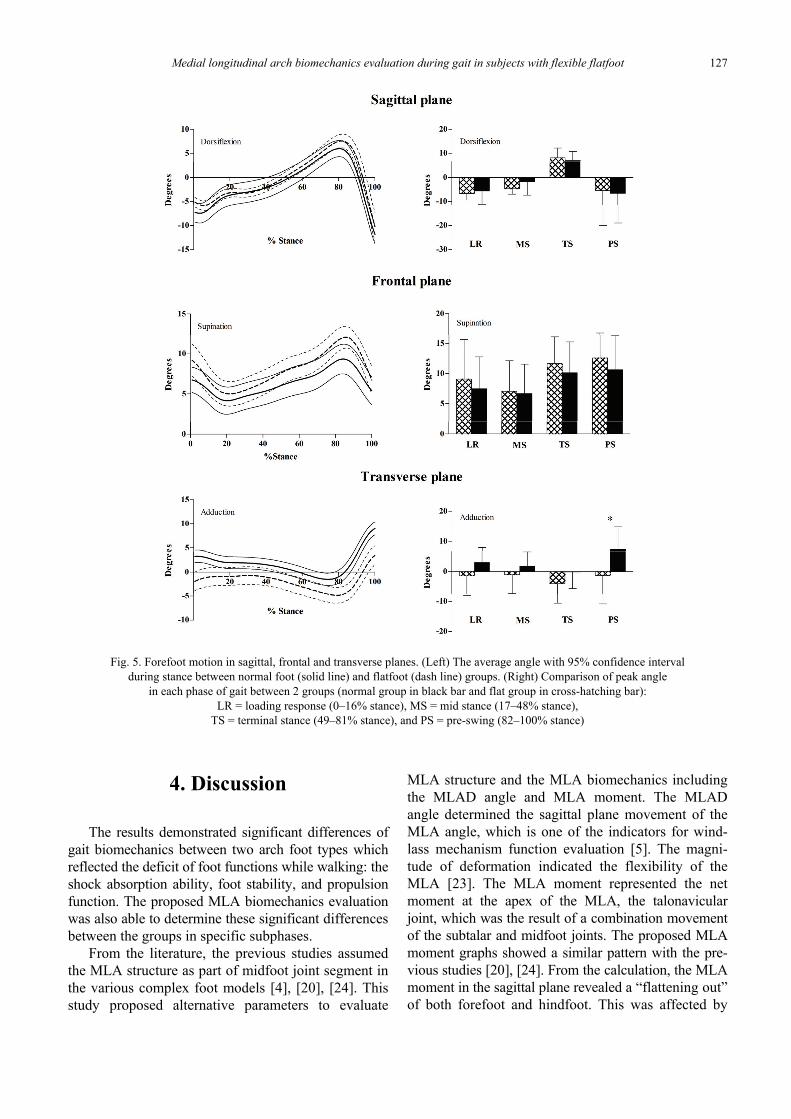
A significant difference in forefoot motion betweenthe two arch types was observed only in the transverseplane. The flatfoot group had a significant increase inthe peak abduction angle during pre-swing (–1.3 ± 9.6vs. 7.3 ± 7.5 degrees, p = 0.016), which is consistentwith the average forefoot motion (Fig. 5, bottom).
3.4. Ground reaction forces
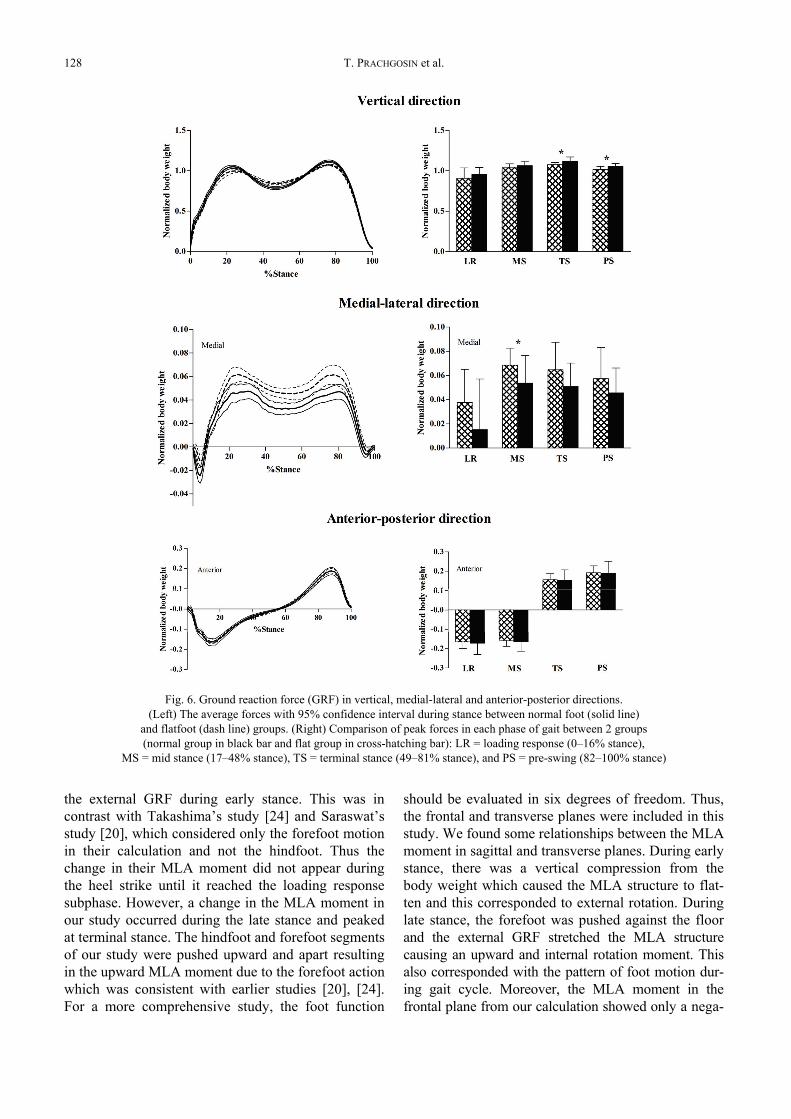
The first peak of vertical GRF and anterior-po-sterior GRF were not significantly different betweenthe two groups. As shown in Fig. 6 (top), the flatfoot
group had a significantly shallower trough (0.83 ± 0.05vs. 0.78 ± 0.06 of normalized body weight, p = 0.012)and significantly smaller second peak (1.08 ± 0.03 vs.1.12 ± 0.05 of normalized body weight, p = 0.004). Themaximum medial-lateral GRF increased significantly inthe flatfoot group (0.07 ± 0.01 vs. 0.05 ± 0.02 of nor-malized body weight, p = 0.047). When we consideredthe relationship with the subphases of gait, the peaks ofvertical GRF in the flatfoot group were significantlyless than in the normal foot group (terminal stance:1.08 ± 0.03 vs. 1.12 ± 0.05, p = 0.004; pre-swing: 1.02± 0.04 vs. 1.06 ± 0.03 of normalized body weight,p = 0.008). However, the peak of medial-lateral GRFwas significantly greater during mid stance (0.07 ± 0.01vs. 0.05 ± 0.02 of normalized body weight, p = 0.047)when compared with the normal group (Fig. 6).
Fig. 4. Hindfoot motion in sagittal, frontal and transverse planes. (Left) The average anglewith 95% confidence interval during stance between normal foot (solid line) and flatfoot (dash line) groups.
(Right) Comparison of peak angle in each phase of gait between 2 groups(normal group in black bar and flat group in cross-hatching bar):
LR = loading response (0–16% stance), MS = mid stance (17–48% stance),TS = terminal stance (49–81% stance), and PS = pre-swing (82–100% stance)
Medial longitudinal arch biomechanics evaluation during gait in subjects with flexible flatfoot 127
4. Discussion
The results demonstrated significant differences ofgait biomechanics between two arch foot types whichreflected the deficit of foot functions while walking: theshock absorption ability, foot stability, and propulsionfunction. The proposed MLA biomechanics evaluationwas also able to determine these significant differencesbetween the groups in specific subphases.
From the literature, the previous studies assumedthe MLA structure as part of midfoot joint segment inthe various complex foot models [4], [20], [24]. Thisstudy proposed alternative parameters to evaluate
MLA structure and the MLA biomechanics includingthe MLAD angle and MLA moment. The MLADangle determined the sagittal plane movement of theMLA angle, which is one of the indicators for wind-lass mechanism function evaluation [5]. The magni-tude of deformation indicated the flexibility of theMLA [23]. The MLA moment represented the netmoment at the apex of the MLA, the talonavicularjoint, which was the result of a combination movementof the subtalar and midfoot joints. The proposed MLAmoment graphs showed a similar pattern with the pre-vious studies [20], [24]. From the calculation, the MLAmoment in the sagittal plane revealed a “flattening out”of both forefoot and hindfoot. This was affected by
Fig. 5. Forefoot motion in sagittal, frontal and transverse planes. (Left) The average angle with 95% confidence intervalduring stance between normal foot (solid line) and flatfoot (dash line) groups. (Right) Comparison of peak angle
in each phase of gait between 2 groups (normal group in black bar and flat group in cross-hatching bar):LR = loading response (0–16% stance), MS = mid stance (17–48% stance),
TS = terminal stance (49–81% stance), and PS = pre-swing (82–100% stance)
T. PRACHGOSIN et al.128
the external GRF during early stance. This was incontrast with Takashima’s study [24] and Saraswat’sstudy [20], which considered only the forefoot motionin their calculation and not the hindfoot. Thus thechange in their MLA moment did not appear duringthe heel strike until it reached the loading responsesubphase. However, a change in the MLA moment inour study occurred during the late stance and peakedat terminal stance. The hindfoot and forefoot segmentsof our study were pushed upward and apart resultingin the upward MLA moment due to the forefoot actionwhich was consistent with earlier studies [20], [24].For a more comprehensive study, the foot function
should be evaluated in six degrees of freedom. Thus,the frontal and transverse planes were included in thisstudy. We found some relationships between the MLAmoment in sagittal and transverse planes. During earlystance, there was a vertical compression from thebody weight which caused the MLA structure to flat-ten and this corresponded to external rotation. Duringlate stance, the forefoot was pushed against the floorand the external GRF stretched the MLA structurecausing an upward and internal rotation moment. Thisalso corresponded with the pattern of foot motion dur-ing gait cycle. Moreover, the MLA moment in thefrontal plane from our calculation showed only a nega-
Fig. 6. Ground reaction force (GRF) in vertical, medial-lateral and anterior-posterior directions.(Left) The average forces with 95% confidence interval during stance between normal foot (solid line)
and flatfoot (dash line) groups. (Right) Comparison of peak forces in each phase of gait between 2 groups(normal group in black bar and flat group in cross-hatching bar): LR = loading response (0–16% stance),
MS = mid stance (17–48% stance), TS = terminal stance (49–81% stance), and PS = pre-swing (82–100% stance)
Medial longitudinal arch biomechanics evaluation during gait in subjects with flexible flatfoot 129
tive value for the eversion moment because the direc-tion of foot progression was displaced througha negative direction of global coordinate axis.
During the loading response, the normal foot hasnormal hindfoot eversion-inversion adjustment tounlock the midtarsal joint doing shock absorption.This function is aided by the flexibility of the MLAfrom the reverse windlass mechanism [3]. Our resultsshowed that flatfeet had significantly larger hindfooteversion and internal rotation relative to the tibiawhich was consistent with the results of previousstudies [4]. These reflected the defect of shock ab-sorption ability in the flatfeet gait. The larger magni-tude of the MLAD angle in the flatfoot group alsorepresented an increase of arch flexibility duringplantigrade walking on the floor [25].
Mid stance is the subphase of gait when the bodyforce vector moves across the stationary foot as singlelimb support [18]. The foot must be stable. A shallowtrough of the vertical GRF larger than 0.7 of normal-ized body weight in the flatfoot group showed thedifficulty of the body to move across the foot whichwas similar to the finding reported in a study by Pauk[17]. Under the tension from vertical compressionduring body progression, the deficient SLC is unableto hold the navicular bone against the talus bone ina close-packed position [19]. Furthermore, the tibialisposterior muscle, the dynamic MLA stabilizer, andarch forming muscle are not active during mid stance[18]. An increase of the eversion moment at the MLAand a larger maximum medial GRF caused the footfurther instability [10].
The most important part of the late stance phaseis the propulsion function. The highest leg muscleactivity occurs during this period of both arch form-ing and arch deforming muscles [18]. These causethe talus bone to move externally and upwardthereby locking the midtarsal joint that aids thewindlass mechanism to develop a rigid lever for pro-pulsion. Our study found greater hindfoot internalrotation accompanied by greater hindfoot eversionand forefoot abduction in the flatfoot group. Thesecause difficulty of the foot to resupinate and invertthe foot for propulsion as described in earlier re-searches [4]. The prolonged foot pronation also pro-moted insufficient propulsion [3]. The magnitude ofthe MLAD angle was smaller when compared withthe normal foot group which represented the power-lessness of the MLA stabilizers to raise the arch inpreparation for propulsion. During late stance, theGRF moves across the metatarsal joints transmittingenergy to promote body progression. The smallersecond peak of vertical GRF in the flatfoot group
that was found in this study also diminished the effi-ciency of the progression [3], [17].
There were several limitations and concerns in theresults of this study based on foot classification crite-ria that we modified for the purpose of our study. Wefocused on the foot alignment in the sagittal andtransverse planes. The normal feet were defined asone standard deviation of the sample of population.The true normal foot was possibly not recruited fromthis non-restrict criteria. Although this protocol wasperhaps not a good representation to classify foottype, this protocol quantitatively provided the footclassification in this study. The heterogeneity of gen-ders between groups might influence the results. Thehigher incidence of ligamentous laxity joints in fe-males [6], [17], compared with males, would obscurethe true biomechanical change between arches of foottypes. Some results also differed from previous stud-ies because our reference position was the relaxedstanding position [9] and our participants were notdiagnosed as posterior tibialis tendon dysfunction.The MLAD angle in the present study was measuredonly in a sagittal plane; therefore, the deformation ina frontal plane of MLA angle needs to be studied fur-ther. Also, this study did not include the electromyog-raphy to complete the gait mechanics evaluation.Therefore, an explanation related to muscle activitieswas not confirmed in our study.
5. Conclusion
There were significant abnormal gait mechanicsduring specific subphases that reflected the dysfunc-tion of flatfoot. The proposed MLA moment calcula-tion in this study showed a consistency in the resultswith previous literature and the calculation can beused in the biomechanical MLA apex loading evalua-tion in three-dimensional motion of flatfoot whilewalking. Applying this proposed MLA moment cal-culation can be used as an alternative parameter toevaluate the arch of foot function in addition to thegeneral flatfoot biomechanics evaluation.
Acknowledgements
This work was funded by the Faculty of Medicine, Prince ofSongkla University, Songkhla, Thailand (Grant No. 55-299-25-6-3).The authors would like to especially thank Dr. Nattapon Chanta-rapanich, Dr. Alan Geater and Dr. Chanon Kongkamol for theirassistance in the data analysis, Mr. Glenn Shingledecker for hisassistance in English grammar error corrections and lastly all ofour volunteers for their participation.
T. PRACHGOSIN et al.130
References
[1] ARANGIO G.A., PHILLIPPY D.C., XIAO D., GU W.K.,SALATHE E.P., Subtalar pronation – relationship to themedial longitudinal arch loading in the normal foot, Foot AnkleInt., 2000, Vol. 21(3), 216–220.
[2] ARANGIO G.A., SALATHE E.P., A biomechanical analysis ofposterior tibial tendon dysfunction, medial displacement cal-caneal osteotomy and flexor digitorum longus transfer inadult acquired flat foot, Clin. Biomech., 2009, Vol. 24(4),385–390.
[3] BERTANI A., CAPPELLO A., BENEDETTI M.G., SIMONCINI L.,CATANI F., Flat foot functional evaluation using pattern rec-ognition of ground reaction data, Clin. Biomech., 1999, Vol.14(7), 484–493.
[4] BULDT A.K., MURLEY G.S., BUTTERWORTH P., LEVINGER P.,MENZ H.B., LANDORF K.B., The relationship between footposture and lower limb kinematics during walking: A sys-tematic review, Gait Posture, 2013, vol. 38(3), 363–372.
[5] CARAVAGGI P., PATAKY T., GÜNTHER M., SAVAGE R.,CROMPTON R., Dynamics of longitudinal arch support in re-lation to walking speed: contribution of the plantar aponeu-rosis, J. Anat., 2010, Vol. 217(3), 254–261.
[6] CHIU M.-C., WU H.-C., CHANG L.-Y., Gait speed and gendereffects on center of pressure progression during normalwalking, Gait Posture, 2013, Vol. 37(1), 43–48.
[7] COBB S.C., TIS L.L., JOHNSON J.T., WANG Y.T., GEIL M.D.,MCCARTY F.A., The effect of low-mobile foot posture onmulti-segment medial foot model gait kinematics, Gait Pos-ture, 2009, Vol. 30(3), 334–339.
[8] FORTIN P.T., Posterior tibial tendon insufficiency: Isolated fu-sion of the talonavicular joint, Foot Ankle Clin., 2001, Vol. 6(1),137–151.
[9] HOUCK J.R., TOME J.M., NAWOCZEŃSKI D.A., Subtalar neu-tral position as an offset for a kinematic model of the footduring walking, Gait Posture, 2008, Vol. 28(1), 29–37.
[10] JENNINGS M.M., CHRISTENSEN J.C., The effects of sectioningthe spring ligament on rearfoot stability and posterior tibialtendon efficiency, J. Foot Ankle Surg., 2008, Vol. 47(3),219–224.
[11] KIRBY K.A., GREEN D.R., Evaluation and nonoperativemanagement of pes valgus, in Foot and ankle disorders inchildren, Churchill Livingstone, 1992, 295–327.
[12] KOTHARI A., DIXON P.C., STEBBINS J., ZAVATSKY A.B.,THEOLOGIS T., Motion analysis to track navicular dis-placements in the pediatric foot: relationship with foot
posture, body mass index, and flexibility, Foot ankle Int,2014, Vol. 35(9), 929–937.
[13] LESLIE W.D., GREENBERG I.D., Reference range determina-tion: the problem of small sample sizes, J. Nucl. Med., 1991,Vol. 32(12), 2306–2310.
[14] MURLEY G.S., MENZ H.B., LANDORF K.B., A protocol forclassifying normal- and flat-arched foot posture for researchstudies using clinical and radiographic measurements,J. Foot Ankle Res., 2009, Vol. 2, 22.
[15] NAKAMURA H., KAKURAI S., Relationship between the me-dial longitudinal arch movement and the pattern of rearfootmotion during the stance phase of walking, J. Phys. Ther.Sci., 2003, Vol. 15(1), 13–18.
[16] O’BRIEN D.L., TYNDYK M., Effect of arch type and BodyMass Index on plantar pressure distribution during stancephase of gait, Acta Bioeng. Biomech., 2014, Vol. 16(2),131–135.
[17] PAUK J., SZYMUL J., Differences in pediatric vertical groundreaction force between planovalgus and neutrally alignedfeet, Acta Bioeng. Biomech., 2014, Vol. 16(2), 95–101.
[18] PERRY J., Gait Analysis: Normal and Pathological Function,2rd ed. Slack Incorporated, 2010.
[19] RICHIE D.H., Biomechanics and clinical analysis of the adultacquired flatfoot, Clin. Podiatr. Med. Surg., 2007, Vol. 24(4),617–644.
[20] SARASWAT P., MACWILLIAMS B.A., DAVIS R.B., D’ASTOUS J.L.,Kinematics and kinetics of normal and planovalgus feetduring walking, Gait Posture, 2014, Vol. 39(1), 339–345.
[21] SERINGE R., WICART P., The talonavicular and subtalarjoints: the “calcaneopedal unit” concept, Orthop. Traumatol.Surg. Res., 2013, Vol. 99(6 Suppl), S345–S355.
[22] STEBBINS J., HARRINGTON M., THOMPSON N., ZAVATSKY A.,THEOLOGIS T., Repeatability of a model for measuringmulti-segment foot kinematics in children, Gait Posture,2006, Vol. 23(4), 401–410.
[23] STOLWIJK N.M., KOENRAADT K.L.M., LOUWERENS J.W.K.,GRIM D., DUYSENS J., KEIJSERS N.L.W., Foot lengtheningand shortening during gait: a parameter to investigate footfunction?, Gait Posture, 2014, Vol. 39(2), 773–777.
[24] TAKASHIMA T., FUJIMOTO H., TAKANISHI A., Determinationof the longitudinal arch moment of the human foot complexduring gait (Inverse dynamics model analysis), Trans. JapanSoc. Mech. Eng. Ser., 2002, Vol. 68(672), 2425–2430.
[25] TOME J., NAWOCZEŃSKI D.A, FLEMISTER A., HOUCK J., Com-parison of foot kinematics between subjects with posteriortibialis tendon dysfunction and healthy controls, J. Orthop.Sports Phys. Ther., 2006, Vol. 36(9), 635–644.