Embed Size (px)
Citation preview

03.05.2018
Prologis
Citi Global Property CEO Conference
Hollywood, FL
Prologis Park Redlands Distribution Center, Redlands, California

2
Forward-Looking Statements
This presentation includes certain terms and non-GAAP financial measures that are not specifically defined herein.
These terms and financial measures are defined and, in the case of the non-GAAP financial measures, reconciled to the
most directly comparable GAAP measure, in our fourth quarter Earnings Release and Supplemental Information that is
available on our investor relations website at www.ir.prologis.com and on the SEC’s website at www.sec.gov.
The statements in this document that are not historical facts are forward-looking statements within the meaning of Section 27A of theSecurities Act of 1933, as amended, and Section 21E of the Securities Exchange Act of 1934, as amended. These forward-lookingstatements are based on current expectations, estimates and projections about the industry and markets in which we operate as well asmanagement’s beliefs and assumptions. Such statements involve uncertainties that could significantly impact our financial results. Wordssuch as “expects,” “anticipates,” “intends,” “plans,” “believes,” “seeks,” “estimates” and variations of such words and similar expressionsare intended to identify such forward-looking statements, which generally are not historical in nature. All statements that addressoperating performance, events or developments that we expect or anticipate will occur in the future — including statements relating torent and occupancy growth, development activity and changes in sales or contribution volume of properties, disposition activity, generalconditions in the geographic areas where we operate, our debt, capital structure and financial position, our ability to form new co-investment ventures and the availability of capital in existing or new co-investment ventures — are forward-looking statements. Thesestatements are not guarantees of future performance and involve certain risks, uncertainties and assumptions that are difficult to predict.Although we believe the expectations reflected in any forward-looking statements are based on reasonable assumptions, we can give noassurance that our expectations will be attained and therefore, actual outcomes and results may differ materially from what is expressedor forecasted in such forward-looking statements. Some of the factors that may affect outcomes and results include, but are not limited to:(i) national, international, regional and local economic climates, (ii) changes in financial markets, interest rates and foreign currencyexchange rates, (iii) increased or unanticipated competition for our properties, (iv) risks associated with acquisitions, dispositions anddevelopment of properties, (v) maintenance of real estate investment trust status, tax structuring and income tax rates (vi) availability offinancing and capital, the levels of debt that we maintain and our credit ratings, (vii) risks related to our investments in our co-investmentventures, including our ability to establish new co-investment ventures and funds, (viii) risks of doing business internationally, includingcurrency risks, (ix) environmental uncertainties, including risks of natural disasters, and (x) those additional factors discussed in reportsfiled with the Securities and Exchange Commission by us under the heading “Risk Factors.” We undertake no duty to update any forward-looking statements appearing in this document.

Contents
04 Section 01Points of Focus
11 Section 02Why Logistics Real Estate
22 Section 03Why Prologis
Prologis Park Munich East, Munich, Germany

Points of Focus
Section 01
Amazon Intl Park of Commerce in Tracy, CA

5
Superior Earnings and Dividend Growth
*This is a non-GAAP financial measure
Source: Factset, data as of Feb. 23, 2018; growth through YE 2017
1. Includes DCT, DRE, EGP, FR, LPT and STAG. Weighted on market cap
2. Includes AVB, BXP, EQR, FRT, HST, PSA, and SPG. Weighted on market cap
3. Includes REITs in the RMZ as of 12/31/2017 with data for every year in each respective period; weighted on market cap
4. Source: SP500 per Factset
5. Leverage on a market capitalization basis. A securities rating is not a recommendation to buy, sell or hold securities and is subject to revision or
withdrawal at any time by the rating agency
Prologis has the best
Core FFO* CAGR’s for the three and
five-year time periods
Prologis has the
top DividendCAGR for the three-year
time period
Over the three-year time
period, Prologis reduced
leverage by 700 bps and achieved a A3/A-
rating(5)
Core FFO* per share
CAGR1-Year 3-Year 5-Year
PLD (excluding promotes) 10% 13% 9%
Other Logistics REITs(1) 7% 5% 5%
Blue Chips(2) 5% 7% 7%
REIT Average(3) 4% 6% 7%
S&P 500 Average(4) 11% 4% 5%
Dividend CAGR 1-Year 3-Year 5-Year
PLD 5% 10% 9%
Other Logistics REITs(1) 0% 3% 3%
Blue Chips(2) 8% 10% 11%
REIT Average(3) 4% 6% 7%
S&P 500 Average(4) 4% 9% 12%

6
Industry-Leading Same Store and Earnings Guidance
*This is a non-GAAP financial measure
1. Midpoint of Prologis 2018 guidance for Net Effective SS NOI* growth of 4.0%-5.0% and Cash SS NOI* growth of 5.0%-6.0%
2. Includes midpoint of 2018 guidance for DCT, DRE, EGP, FR and LPT and consensus for STAG. Weighted on market cap
3. Includes midpoint of 2018 guidance for AVB, BXP, EQR, FRT, HST, and SPG and consensus for PSA. Weighted on market cap
2018 SAME STORE NOI*
GROWTHGAAP Cash
PLD (1) 4.5% 5.5%
Other Logistics REITs(2) 3.2% 4.1%
CORE FFO* PER SHARE GROWTHPrior 3-Year
CAGR
2018 Guidance
Midpoint
PLD (excluding promotes) 13% 7%
Other Logistics REITs (2) 5% 3%
Blue Chips (3)7% 4%
Prologis established
sector-leading
guidance for 2018
SSNOI* growth among
the logistics REITs
▪ +100 bps higher than
the peer average
Established the highest
estimated Core FFO per
share growth for 2018
▪ +300 bps higher than
the peer average

7
Strong Three-Year Return PotentialIllustrative, as Presented at Prologis Investor Forum – November 2016
* This is a non-GAAP financial measure
1. Net Effective; expect Cash SSNOI to be higher
2. Based on a number of assumptions that Prologis believes to be reasonable; however, no assurance can be made that Prologis’
expectations will be attained and there actual outcomes and results may differ materially
Global platform enables us to allocate capital opportunistically and capture
a disproportionate share of profitable development opportunities
SSNOI*(1)
Midpoint of Low
& High Scenario
4.0-5.0%
1.5%Yield on Value
Creation
1.8%Platform Leverage
7.0-8.0%Core FFO* Growth(excluding promotes)
3.0%Dividend Yield
10.0-11.0%Annual Total Return(2)
0.3%Assumed Interest
Rate Expansion
Conservative expectation for interest rate expansion will be a slight drag
Scale will drive efficiency
• Ability to grow NOI and fees without increasing costs
• Balance sheet continues to strengthen
Expect to deliver sector-leading same store growth
• Superior rent growth from market selection and infill focus
• Significant embedded upside from rolling current rents in our portfolio to market
8
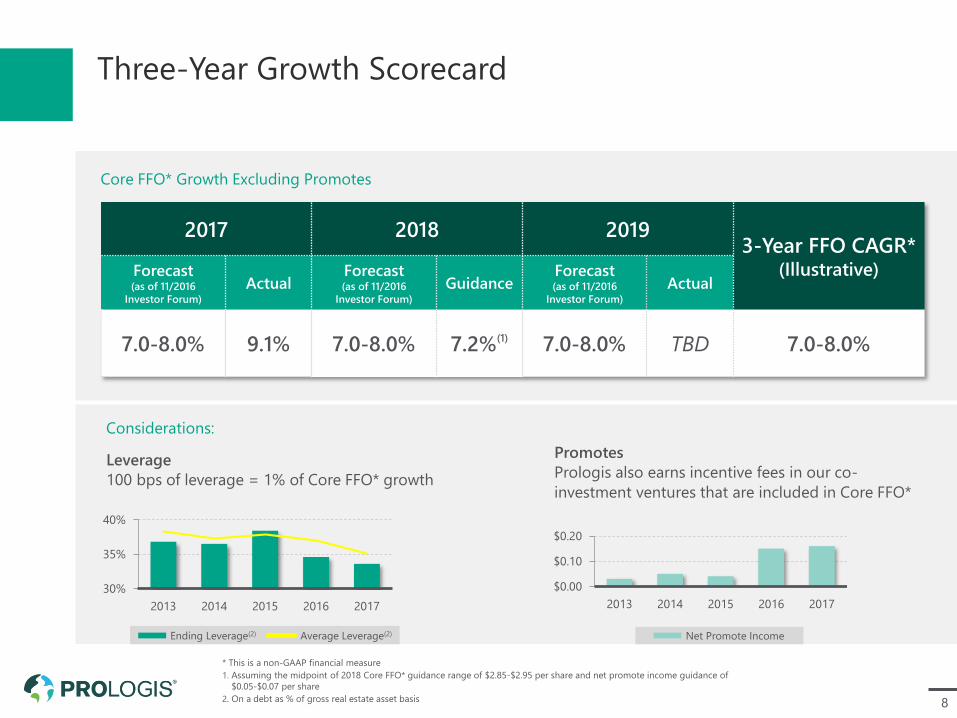
Three-Year Growth Scorecard
2017 2018 20193-Year FFO CAGR*
(Illustrative)Forecast(as of 11/2016
Investor Forum)
ActualForecast(as of 11/2016
Investor Forum)
GuidanceForecast(as of 11/2016
Investor Forum)
Actual
7.0-8.0% 9.1% 7.0-8.0% 7.2%(1) 7.0-8.0% TBD 7.0-8.0%
Core FFO* Growth Excluding Promotes
Leverage
100 bps of leverage = 1% of Core FFO* growth
Promotes
Prologis also earns incentive fees in our co-
investment ventures that are included in Core FFO*
30%
35%
40%
2013 2014 2015 2016 2017
* This is a non-GAAP financial measure
1. Assuming the midpoint of 2018 Core FFO* guidance range of $2.85-$2.95 per share and net promote income guidance of
$0.05-$0.07 per share
2. On a debt as % of gross real estate asset basis
Considerations:
$0.00
$0.10
$0.20
2013 2014 2015 2016 2017
Net Promote IncomeEnding Leverage(2) Average Leverage(2)

9
* This is a non-GAAP financial measure
1. In-place to market of 88% represents a 13.5% uplift from rolling in-place leases up to market
2. This illustration excludes other drivers of same store NOI growth, such as changes in occupancy
Robust Long-Term Same Store NOI* GrowthIllustrative 3-Year Growth: 2017 through 2019
3-YEAR GROWTHYE 2016 FUTURE GROWTH
Significant spread
of in-place to
market at end of
2019 will extend
the runway for
SSNOI* growth
New Uplift Potential
4-5%
Annual Market
Rent Growth
4-5%
Same Store
NOI* CAGR(2)
Cash SS NOI* growth
expected to be even higher
YE 2019
Uplift Potential
In-Place
Rents
~88% (1)
of market
In-Place
Rents
~87% - 89%
of market

10
1. Illustrative represented on a pro rata share basis for 2019 and beyond
2. Includes reduction in our ownership interest in our PELF, PELP (assuming 10% sell-down to 40%), and USLF ventures
$2.8B of Internal Capacity to Fund Growth(1)
Annual Capital Uses(in millions)
Development Spend $1,800
Acquisitions
(via co-investment ventures)$100
Total Annual Capital Uses $1,900
Total Annual Funding
Requirement$575M
Annual Capital Sources(in millions)
Contribution Proceeds $1,050
Retained Cash Flow (from Core Operations)
$125
Leverage Capacity (on Value Creation)
$150
Total Annual Capital
Sources$1,325
One-Time Capital Sources
Co-Investment Rebalancing(2) $2,600
Land Bank Rationalization
(U.S. and Europe) $225
Total Additional Capital
Sources$2,825
5 years OF ANTICPATED FUNDING
REQUIREMENTS FROM ONE-TIME
CAPITAL SOURCES
Significant
investment capacity
to self fund
We have not issued
equity or tapped our
ATM since Q1 2015

Section 02
Why Logistics
Real Estate

12
We are Essential to the Global Supply Chain
• World’s leading owner, operator and
developer of logistics real estate
• We build, lease and operate
distribution space to facilitate the flow
of goods around the world
• Our irreplaceable portfolio is
concentrated in population centers
where consumption and supply chain
reconfiguration drive logistics demand
• The world’s best brands choose to
partner with us
• Principally an owner/operator in the
U.S. and an asset manager/developer
outside the U.S.
Prologis Qingpu Logistics Center, Shanghai, China

13
Logistics Real Estate Delivers Consistent Returns
1997-2017%
10.010.7
9.4 9.2
6
7
8
9
10
11
12
Logistics Retail Office Apartment
Logistics is projected to be the
highest-performing property
type through 2021
Historically, logistics
consistently delivered one of
the highest returns and had
one of the lowest standard
deviations
Total Returns Forecast, 2017-2021E%, Unleveraged Pre-fee and Before Tax
7.1
5.4 4.9 4.6
-1
0
1
2
3
4
5
6
7
8
9
Logistics Apartment Retail Office
Income Appreciation
Source: PREA Consensus Forecast Survey as of Q4 2017; historical returns provided by NCREIF
14
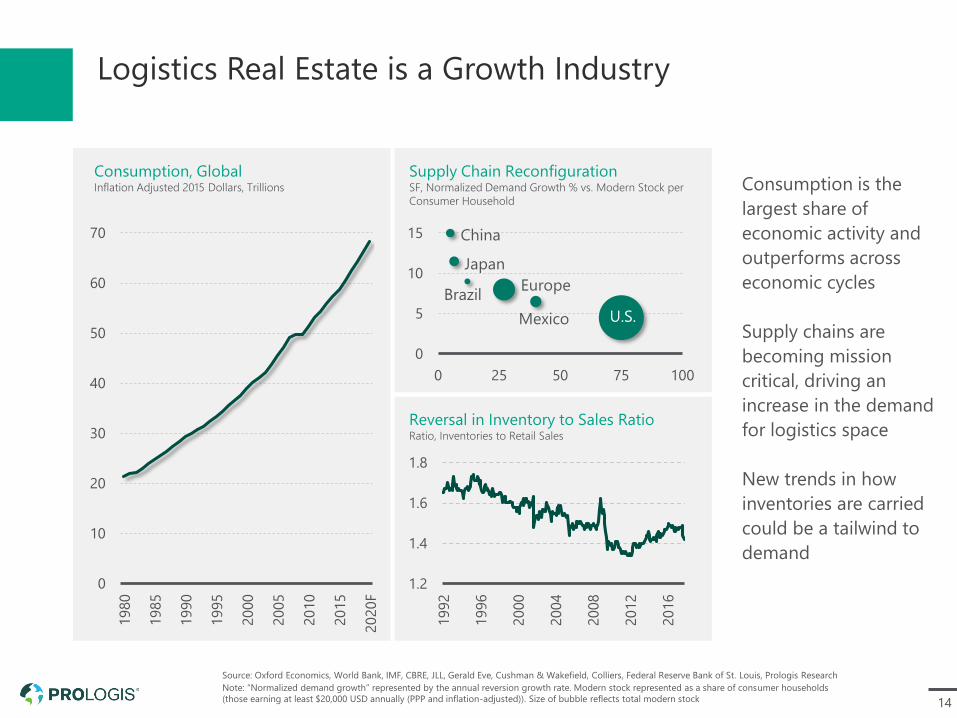
Logistics Real Estate is a Growth Industry
Consumption is the
largest share of
economic activity and
outperforms across
economic cycles
Supply chains are
becoming mission
critical, driving an
increase in the demand
for logistics space
New trends in how
inventories are carried
could be a tailwind to
demand
Source: Oxford Economics, World Bank, IMF, CBRE, JLL, Gerald Eve, Cushman & Wakefield, Colliers, Federal Reserve Bank of St. Louis, Prologis Research
Note: “Normalized demand growth” represented by the annual reversion growth rate. Modern stock represented as a share of consumer households
(those earning at least $20,000 USD annually (PPP and inflation-adjusted)). Size of bubble reflects total modern stock
Consumption, GlobalInflation Adjusted 2015 Dollars, Trillions
Supply Chain ReconfigurationSF, Normalized Demand Growth % vs. Modern Stock per
Consumer Household
Reversal in Inventory to Sales RatioRatio, Inventories to Retail Sales
1.2
1.4
1.6
1.8
1992
1996
2000
2004
2008
2012
2016
0
10
20
30
40
50
60
70
1980
1985
1990
1995
2000
2005
2010
2015
2020F
0
5
10
15
0 25 50 75 100
U.S.
Europe
Japan
Mexico
Brazil
China

15
Significant Shift As E-Commerce Adoption Rate Increases
162% projected growth of
e-commerce sales from
2015-2020
• 130% shift to
e-commerce
• 16% inflation
• 16% real growth
in sales
E-Commerce Sales, GlobalDollars, Trillions %
Source: e-Marketer, Goldman Sachs, Prologis Research
Note: Includes products and services ordered using the internet via any device, regardless of the method of payment or
fulfillment, excludes travel and event tickets
-1
1
3
5
7
9
11
13
15
17
0.0
0.5
1.0
1.5
2.0
2.5
3.0
3.5
4.0
4.5
5.0
2010
2011
2012
2013
2014
2015
2016
2017E
2018F
2019F
2020F
E-Commerce Sales (L) E-Commerce as a % of Total Retail Sales (R)

16
E-Commerce Requires 3x Floor Space+-/
SalesUS$, B
FacilitiesSF, M
ProductivityUS$ / SF
EfficiencySF / $1B
$214B 302 $710 1,409 KSFOnline
Brick &
Mortar $1,061B 493 $2,152 465 KSF
3x+-/
Source: Internet Retailer, company filings, Prologis Research
Note: 2017 data
E-fulfillment requires 3x
the logistics space used
by brick-and-mortar
retailers due to:
• Shipping parcels
versus pallets
• High inventory turn
levels
• Broader product
variety
• Reverse logistics

17
Not All E-Commerce Facilities Are New or Large
Source: Prologis Research
140,000 SFaverage unit size for
e-commerce customers
16 yearsaverage building age for
e-commerce customers
Distribution of Leases by Unit Size%, Share of Prologis Portfolio,
Global by Size Category in Thousands SF
Distribution of Leases by Building Age%, Share of Prologis Global Portfolio
Global by Age
E-Commerce Non E-Commerce
0
2
4
6
8
10
12
0 5 10 15 20 25 30 35
0
5
10
15
20
25
10
25
50
100
200
350
500
750
1,0
00
1,2
50
1,5
00

18
Other Segments of the Economy Outperforming
Source: U.S. Census, U.S. Bureau of Economic Analysis. Forecasts and estimate of normal come from Consensus Economics and
Oxford Economics, respectively
Consumption vs. GDP, U.S.%, y/y, Inflation Adjusted
Housing Starts, U.S.Square Feet, Thousands, New Privately Owned Housing Units Started,
Monthly, SAAR
Estimate of Normal
-4
-2
0
2
4
6
2000
2001
2002
2003
2004
2005
2006
2007
2008
2009
2010
2011
2012
2013
2014
2015
2016
2017E
2018F
2019F
Personal Consumption Expenditures GDP
0
500
1,000
1,500
2,000
2,500
2000
2001
2002
2003
2004
2005
2006
2007
2008
2009
2010
2011
2012
2013
2014
2015
2016
2017
2017E

19
Vacancies At or Near All-Time Lows
U.S.Square Feet, Millions %
EuropeSquare Feet, Millions %
AsiaSquare Feet, Millions %
Completions (L) Net Absorption (L) Vacancy Rate (R)
2018F
Source: CBRE, JLL, Gerald Eve, Cushman & Wakefield, Colliers, Prologis Research
Note: Prologis Research forecasts as of Dec. 31, 2017
Asia includes 5 markets in Japan, 19 main markets in China and Singapore
0
5
10
15
0
50
100
150
2007
2008
2009
2010
2011
2012
2013
2014
2015
2016
2017
2018F
0
2
4
6
8
10
(250)
(150)
(50)
50
150
250
350
1991
1993
1995
1997
1999
2001
2003
2005
2007
2009
2011
2013
2015
2017
0
5
10
15
0
50
100
150
2007
2008
2009
2010
2011
2012
2013
2014
2015
2016
2017
2018F
20
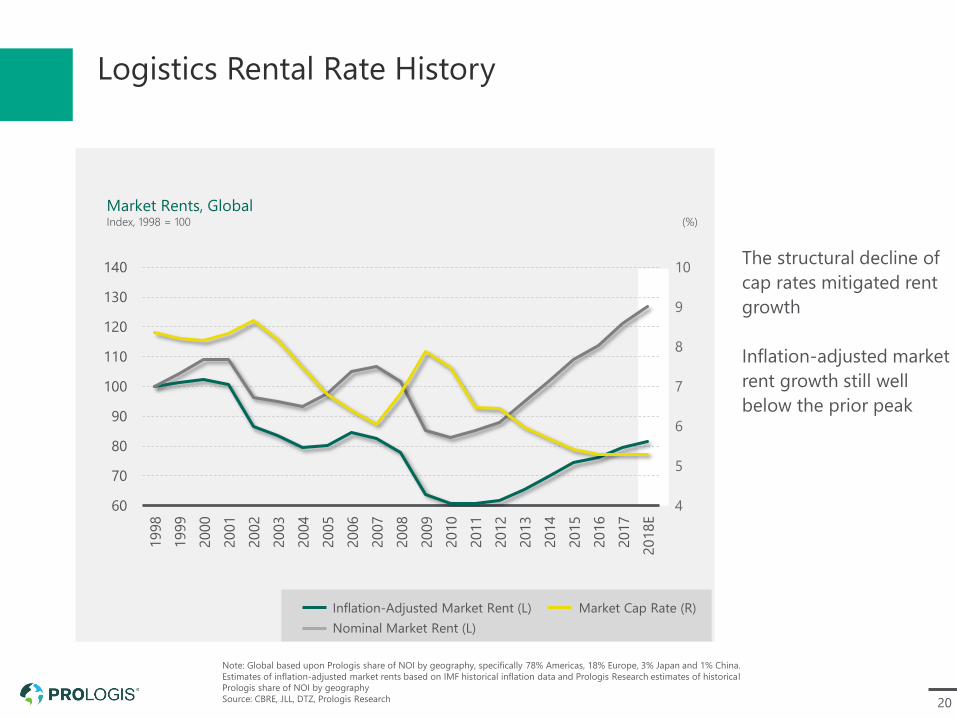
Logistics Rental Rate History
The structural decline of
cap rates mitigated rent
growth
Inflation-adjusted market
rent growth still well
below the prior peak
Inflation-Adjusted Market Rent (L)
Nominal Market Rent (L)
Market Cap Rate (R)
Market Rents, GlobalIndex, 1998 = 100 (%)
Note: Global based upon Prologis share of NOI by geography, specifically 78% Americas, 18% Europe, 3% Japan and 1% China.
Estimates of inflation-adjusted market rents based on IMF historical inflation data and Prologis Research estimates of historical
Prologis share of NOI by geography
Source: CBRE, JLL, DTZ, Prologis Research
4
5
6
7
8
9
10
60
70
80
90
100
110
120
130
140
1998
1999
2000
2001
2002
2003
2004
2005
2006
2007
2008
2009
2010
2011
2012
2013
2014
2015
2016
2017
2018E

21
Logistics Rents Have Room to GrowDistribution of Supply Chain Costs
Source: Estimates compiled from CSCMP report prepared by AT Kearney, IMS Worldwide, public company filings, and Prologis Research
e-commerce
Rent accounts for <5% of total
supply chain costs
Expect this composition to change
as supply chains become more
efficient
• Transportation costs will decrease
with advances in technology
• Rent will increase as customers
seek quality locations near major
population centers to meet
consumer delivery requirements
0
20
40
60
80
100
Inventory Costs
Labor
Transportation
Rent

Section 03
Why Prologis
Prologis Torrance Distribution Center, Torrance, California
23
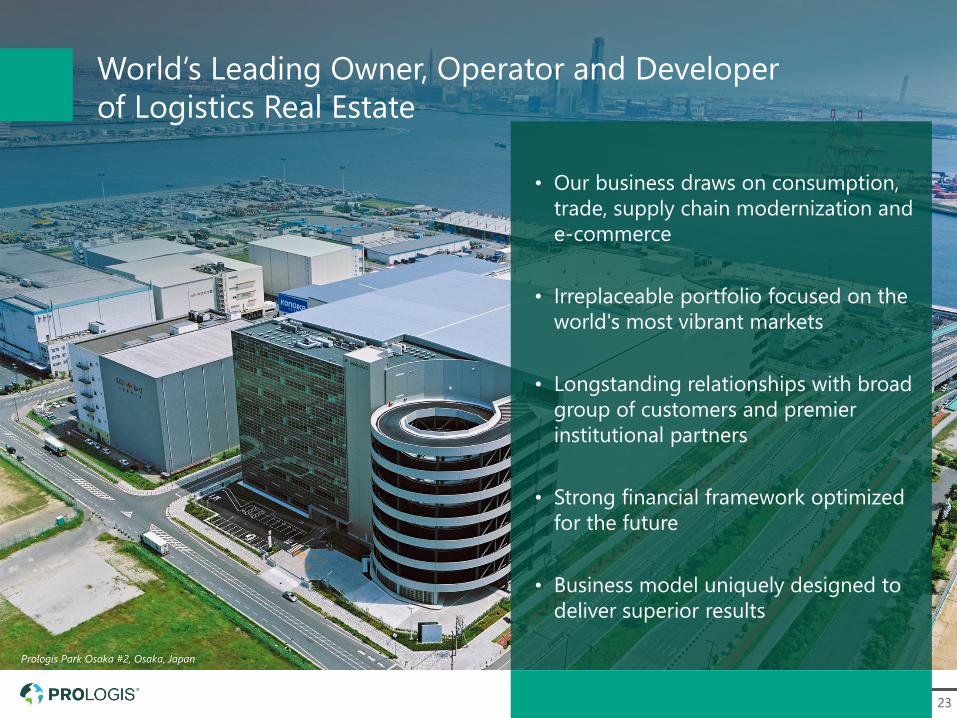
World’s Leading Owner, Operator and Developer
of Logistics Real Estate
Prologis Park Osaka #2, Osaka, Japan
• Our business draws on consumption,
trade, supply chain modernization and
e-commerce
• Irreplaceable portfolio focused on the
world's most vibrant markets
• Longstanding relationships with broad
group of customers and premier
institutional partners
• Strong financial framework optimized
for the future
• Business model uniquely designed to
deliver superior results

24
Prologis at a Glance
1983FOUNDED IN
$79B
ON FOUR CONTINENTS
MSF
NYSE: PLDS&P 500 MEMBER
100MOST SUSTAINABLE CORPORATIONS
GLOBAL
CREDIT RATING OF
A3/A-
684
ASSETS UNDER MANAGEMENT
Note: A securities rating is not a recommendation to buy, sell or hold securities and may be subject to revision or withdrawal at any time

25
Unique Business ModelStrong, Interconnected Enterprise Designed for Superior Results
Development
44%
56%
U.S. Outside the U.S.
Creates ~$450M in
value from starts
annually(3)
Operations
70%
30%
U.S. Outside the U.S.
~90% of Core FFO*
Generates $1.9B in
annual NOI(1)
Strategic Capital
34%
66%
U.S. Outside the U.S.
Produces $209M in
recurring fees and
promotes(2)
+
~10% of Core FFO*
+
*This is a non-GAAP measure
1. Pro rata share cash NOI, as described in our supplemental, annualized as of Dec. 31, 2017
2. Third-party asset management fees annualized plus trailing twelve month third-party transaction fees and normalized net
promotes of $25M as of Dec. 31, 2017
3. Estimated pro rata share of value creation from development starts on a trailing twelve month basis
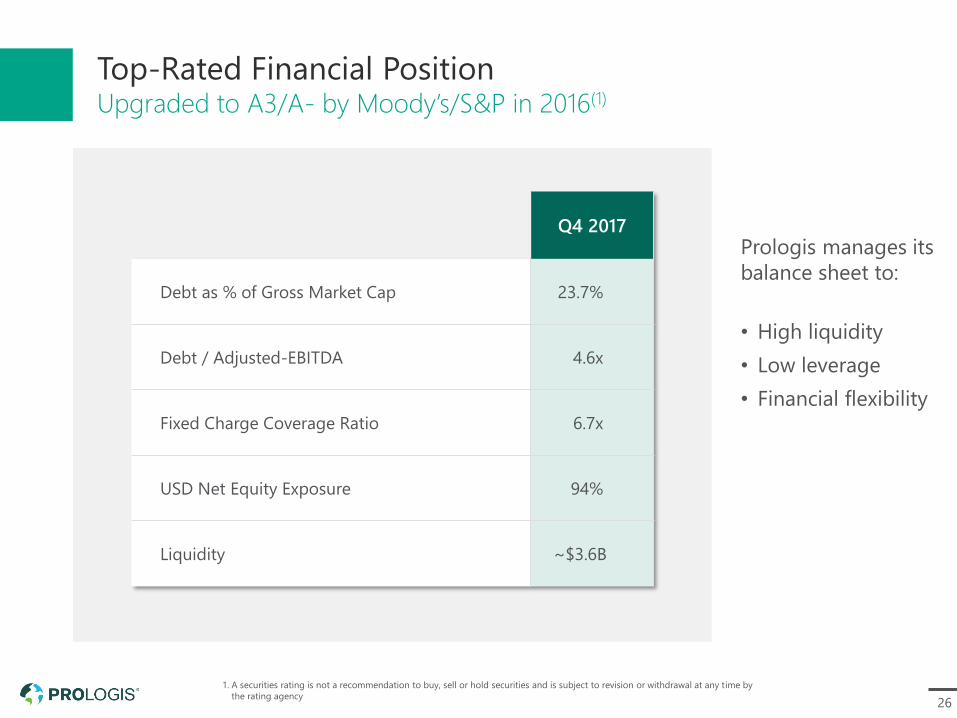
26
Top-Rated Financial PositionUpgraded to A3/A- by Moody’s/S&P in 2016(1)
Q4 2017
Debt as % of Gross Market Cap 23.7%
Debt / Adjusted-EBITDA 4.6x
Fixed Charge Coverage Ratio 6.7x
USD Net Equity Exposure 94%
Liquidity ~$3.6B
Prologis manages its
balance sheet to:
• High liquidity
• Low leverage
• Financial flexibility
1. A securities rating is not a recommendation to buy, sell or hold securities and is subject to revision or withdrawal at any time by
the rating agency

27
Serving the World’s Best Brands
95%Of our top 25
customers operate
globally
75%lease from us on
multiple continents

28
Consumer-Driven Business: Diverse by Customer & Industry
Our top 25
customers
represent just
19% of net effective rent
Source: Prologis Research
Note: Based upon internal Prologis data as of Dec 31, 2017. The Type of Goods in Building classifications do not sum to 100%.
The balance, 13%, is attributable to units where 3PL customers have more than one industry type present
1. Based on economic value of goods
Manufacturing Transport /
Freight
Distribution
0
10
20
30
40
50
60
70
80
90
Healthcare/Pharma
Industry/Machinery
Home Goods
Packaging/Plastics
Auto & Parts
Construction
Transport/Freight
Apparel
General Goods
Electronics/Appliances
Consumer Products
Food & Beverage
0 2 4 6 8 10
Type of Goods in Building%, NRA basis
Customer Activity in Building%, NRA basis
E-commerce

29
Prologis is a Critical Waypoint for the Global Economy
Source: Oxford Economics, Prologis Research
$1.3 Trillionis the economic value of goods flowing through
our distribution centers each year
REPRESENTING
2.4%of GDP for the
19 countries where
we do business
1.7%of the
World’s GDP
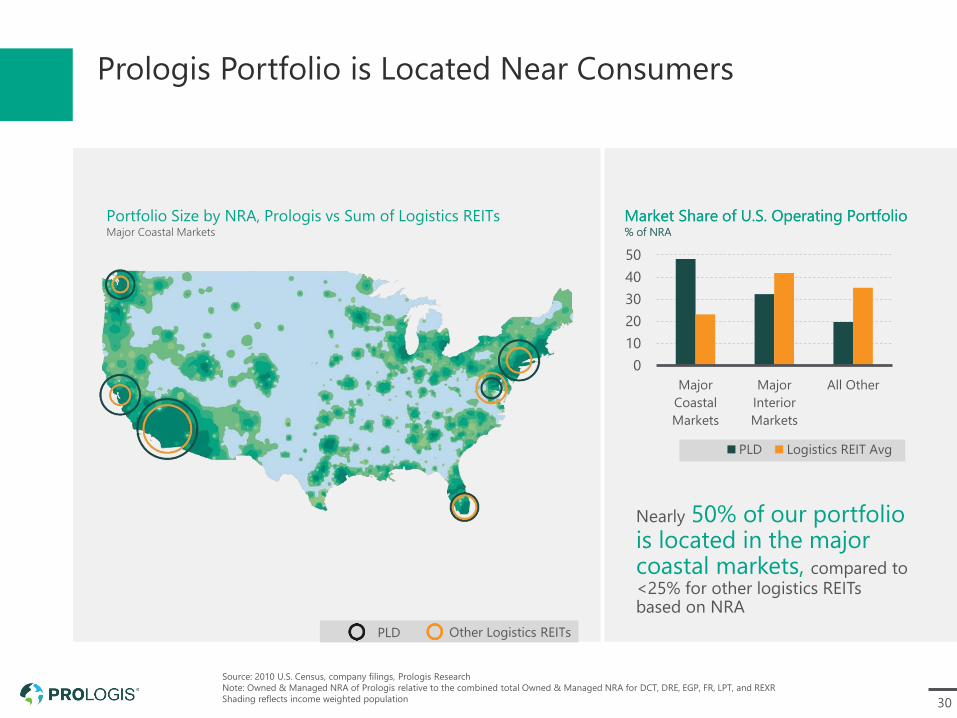
30
Source: 2010 U.S. Census, company filings, Prologis Research
Note: Owned & Managed NRA of Prologis relative to the combined total Owned & Managed NRA for DCT, DRE, EGP, FR, LPT, and REXR
Shading reflects income weighted population
Prologis Portfolio is Located Near Consumers
Portfolio Size by NRA, Prologis vs Sum of Logistics REITsMajor Coastal Markets
PLD Other Logistics REITs
Portfolio Size by NRA, Prologis vs Sum of Logistics REITsMajor Coastal Markets
PLD Other Logistics REITs
Market Share of U.S. Operating Portfolio% of NRA
Nearly 50% of our portfolio is located in the major coastal markets, compared to <25% for other logistics REITs based on NRA
Market Share of U.S. Operating Portfolio% of NRA
0
10
20
30
40
50
Major
Coastal
Markets
Major
Interior
Markets
All Other
PLD Logistics REIT Avg

31
Focused Submarket Strategy, Southern California
Source: Company filings as of Sept. 30, 2017, Prologis Research. Prologis reflects Owned & Managed portfolio. JV development
data unavailable for certain companies, therefore information with respect to those companies includes CBRE and CoStar data.
Note: For all companies, properties in San Diego not shown on map

32
Focused Submarket Strategy, New York / New Jersey
Source: Company filings as of Sept. 30, 2017, Prologis Research. Prologis reflects Owned & Managed portfolio. JV development
data unavailable for certain companies, therefore information with respect to those companies includes CBRE and CoStar data

33
Focused Submarket Strategy, Bay Area and Central Valley
Source: Company filings as of Sept. 30, 2017, Prologis Research. Prologis reflects Owned & Managed portfolio. JV development
data unavailable for certain companies, therefore information with respect to those companies includes CBRE and CoStar data
34
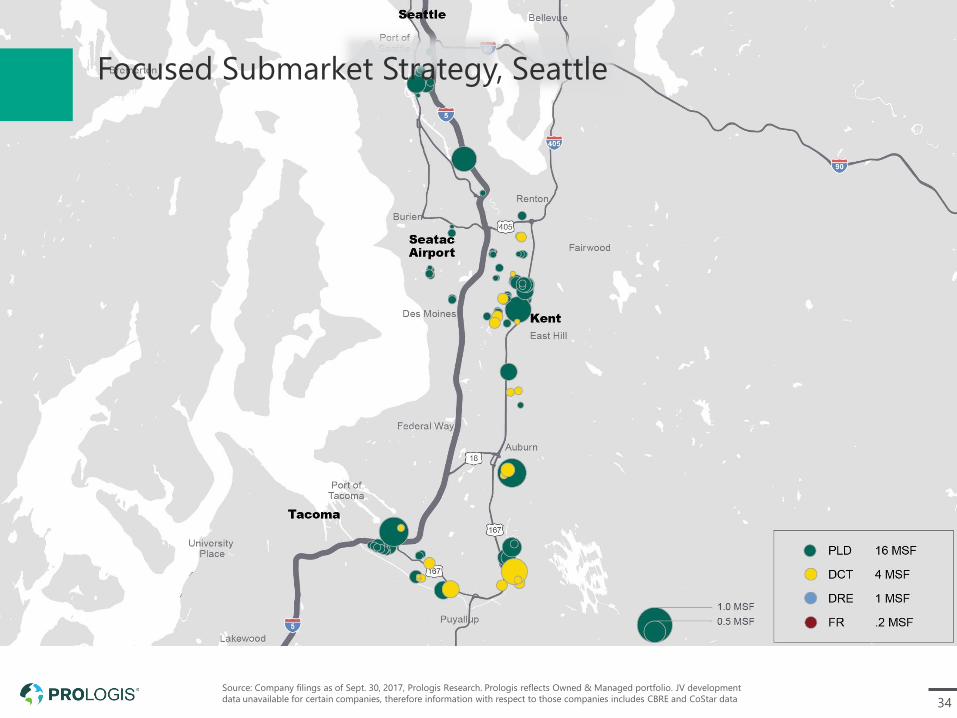
Source: Company filings as of Sept. 30, 2017, Prologis Research. Prologis reflects Owned & Managed portfolio. JV development
data unavailable for certain companies, therefore information with respect to those companies includes CBRE and CoStar data
Focused Submarket Strategy, Seattle

35
Seattle Multi-Story Case Study
Prologis assets

36
Benefits of a Focused StrategyAverage Prologis U.S. Markets v. Other Logistics REITs
Source: CoStar and Prologis Research
1. Other logistics REITs include DCT, DRE, EGP, FR, LPT and REXR
2012-2017. Average annual market rental
growth for Prologis U.S. markets vs. average
of other logistics REITs(1)
CAP RATE
-27 bps Difference
CoStar logistics market cap rate. Differential
between Prologis market exposure vs. average
of other logistics REITs at YE 2017(1)
Prologis LAX Cargo Center, Los Angeles, California
RENT GROWTH
+105 bps Annual Difference

37
Location and Quality Matters
Going forward it’s all about Same Store
NOI growth and value creation
Prologis has superior organic and
external growth potential

Title Goes Here