Embed Size (px)
Citation preview
UNITED STATES SECURITIES AND EXCHANGE COMMISSIONWashington, D.C. 20549
FORM 10-K(Mark One)☑ ANNUAL REPORT PURSUANT TO SECTION 13 OR 15(d) OF THE SECURITIES EXCHANGE ACT OF 1934
For the fiscal year ended December 31, 2017or
☐ TRANSITION REPORT PURSUANT TO SECTION 13 OR 15(d) OF THE SECURITIES EXCHANGE ACT OF 1934For the transition period from ______________ to ______________
Commission File Number: 001-13545 (Prologis, Inc.) 001-14245 (Prologis, L.P.)
Prologis, Inc.Prologis, L.P.
(Exact name of registrant as specified in its charter)
Maryland (Prologis, Inc.)Delaware (Prologis, L.P.)
94-3281941 (Prologis, Inc.)94-3285362 (Prologis, L.P.)
(State or other jurisdiction ofincorporation or organization)
(I.R.S. EmployerIdentification No.)
Pier 1, Bay 1, San Francisco, California 94111
(Address or principal executive offices) (Zip Code)
(415) 394-9000(Registrant’s telephone number, including area code)
Securities registered pursuant to Section 12(b) of the Act:
Title of Each Class Name of Each Exchange on Which RegisteredPrologis, Inc. Common Stock, $0.01 par value New York Stock ExchangePrologis, L.P. 1.375% Notes due 2020 New York Stock ExchangePrologis, L.P. 1.375% Notes due 2021 New York Stock ExchangePrologis, L.P. 3.000% Notes due 2022 New York Stock ExchangePrologis, L.P. 3.375% Notes due 2024 New York Stock ExchangePrologis, L.P. 3.000% Notes due 2026 New York Stock ExchangePrologis, L.P. 2.250% Notes due 2029 New York Stock ExchangePrologis, L.P. Floating Rate Notes due 2020 New York Stock Exchange
Securities registered pursuant to Section 12(g) of the Act:
Prologis, Inc. – NONEPrologis, L.P. – NONE
Indicate by check mark if the registrant is a well-known seasoned issuer, as defined in Rule 405 of the Securities Act.Prologis, Inc.: Yes ☑ No ☐ Prologis, L.P.: Yes ☑ No ☐ Indicate by check mark if the registrant is not required to file reports pursuant to Section 13 or Section 15(d) of the Act.Prologis, Inc.: Yes ☐ No ☑ Prologis, L.P.: Yes ☐ No ☑ Indicate by check mark whether the registrant: (1) has filed all reports required to be filed by Section 13 or 15(d) of the Securities Exchange Act of 1934 during the preceding 12 months (or forsuch shorter period that the registrant was required to file such reports), and (2) has been subject to such filing requirements for the past 90 days. Prologis, Inc.: Yes ☑ No ☐ Prologis,L.P.: Yes ☑ No ☐ Indicate by check mark whether the registrant has submitted electronically and posted on its corporate website; if any, every Interactive Data File required to be submitted and posted pursuantto Rule 405 of Regulation S-T during the preceding 12 months (or for such shorter periods that the registrant was required to submit and post such files). Prologis, Inc.: Yes ☑ No ☐ Prologis,L.P.: Yes ☑ No ☐ Indicate by check mark if disclosure of delinquent filers pursuant to Item 405 of Regulation S-K is not contained herein, and will not be contained, to the best of registrant’s knowledge, indefinitive proxy or information statements incorporated by reference in Part III of this Form 10-K or any amendment to this Form 10-K. ☐ Indicate by check mark whether the registrant is a large accelerated filer, an accelerated filer, a non-accelerated filer, a smaller reporting company, or an emerging growth company. See thedefinitions of “large accelerated filer,” “accelerated filer,” “smaller reporting company,” and “emerging growth company” in Rule 12b-2 of the Exchange Act (check one): Prologis, Inc.: ☑ Large accelerated filer ☐ Accelerated filer ☐ Smaller reporting company ☐ Non-accelerated filer (do not check if a smaller reporting company) ☐ Emerging growth company Prologis, L.P.: ☐ Large accelerated filer ☐ Accelerated filer ☐ Smaller reporting company ☑ Non-accelerated filer (do not check if a smaller reporting company) ☐ Emerging growth company Indicate by check mark whether the registrant is a shell company (as defined in Rule 12b-2 of the Securities Exchange Act of 1934).Prologis, Inc.: Yes ☐ No ☑ Prologis, L.P.: Yes ☐ No ☑ Based on the closing price of Prologis, Inc.’s common stock on June 30, 2017, the aggregate market value of the voting common equity held by nonaffiliates of Prologis, Inc. was$30,903,505,295. The number of shares of Prologis, Inc.’s common stock outstanding at February 12, 2018, was approximately 533,054,000.
DOCUMENTS INCORPORATED BY REFERENCE
Portions of Part III of this report are incorporated by reference to the registrant’s definitive proxy statement for the 2018 annual meeting of its stockholders or will be provided in an amendmentfiled on Form 10-K/A.
EXPLANATORY NOTE
This report combines the annual reports on Form 10-K for the year ended December 31, 2017, of Prologis, Inc. and Prologis, L.P. Unless stated otherwise or thecontext otherwise requires, references to “Prologis, Inc.” or the “Parent” mean Prologis, Inc. and its consolidated subsidiaries; and references to “Prologis, L.P.”or the “Operating Partnership” or the “OP” mean Prologis, L.P., and its consolidated subsidiaries. The terms “the Company,” “Prologis,” “we,” “our” or “us” meansthe Parent and the OP collectively. The Parent is a real estate investment trust (a “REIT”) and the general partner of the OP. At December 31, 2017, the Parent owned an approximate97.41% common general partnership interest in the OP and 100% of the preferred units in the OP. The remaining approximate 2.59% common limitedpartnership interests are owned by unaffiliated investors and certain current and former directors and officers of the Parent. We operate the Parent and the OP as one enterprise. The management of the Parent consists of the same members as the management of the OP. Thesemembers are officers of the Parent and employees of the OP or one of its subsidiaries. As sole general partner, the Parent has control of the OP throughcomplete responsibility and discretion in the day-to-day management and therefore, consolidates the OP for financial reporting purposes. Because the onlysignificant asset of the Parent is its investment in the OP, the assets and liabilities of the Parent and the OP are the same on their respective financialstatements. We believe combining the annual reports on Form 10-K of the Parent and the OP into this single report results in the following benefits: • enhances investors’ understanding of the Parent and the OP by enabling investors to view the business as a whole in the same manner as management
views and operates the business; • eliminates duplicative disclosure and provides a more streamlined and readable presentation as a substantial portion of the Company’s disclosure applies
to both the Parent and the OP; and • creates time and cost efficiencies through the preparation of one combined report instead of two separate reports. It is important to understand the few differences between the Parent and the OP in the context of how we operate the Company. The Parent does not conductbusiness itself, other than acting as the sole general partner of the OP and issuing public equity from time to time. The Parent itself does not incur anyindebtedness, but it guarantees the unsecured debt of the OP. The OP holds substantially all the assets of the business, directly or indirectly. The OP conductsthe operations of the business and is structured as a partnership with no publicly traded equity. Except for net proceeds from equity issuances by the Parent,which are contributed to the OP in exchange for partnership units, the OP generates capital required by the business through the OP’s operations, incurrence ofindebtedness and issuance of partnership units to third parties. The presentation of noncontrolling interests, stockholders’ equity and partners’ capital are the main areas of difference between the consolidated financialstatements of the Parent and those of the OP. The differences in the presentations between stockholders’ equity and partners’ capital result from the differencesin the equity and capital issuances in the Parent and in the OP. The preferred stock, common stock, additional paid-in capital, accumulated other comprehensive income (loss) and distributions in excess of net earnings of theParent are presented as stockholders’ equity in the Parent’s consolidated financial statements. These items represent the common and preferred generalpartnership interests held by the Parent in the OP and are presented as general partner’s capital within partners’ capital in the OP’s consolidated financialstatements. The common limited partnership interests held by the limited partners in the OP are presented as noncontrolling interest within equity in the Parent’sconsolidated financial statements and as limited partners’ capital within partners’ capital in the OP’s consolidated financial statements. To highlight the differences between the Parent and the OP, separate sections in this report, as applicable, individually discuss the Parent and the OP, includingseparate financial statements and separate Exhibit 31 and 32 certifications. In the sections that combine disclosure of the Parent and the OP, this report refers toactions or holdings as being actions or holdings of Prologis.

TABLE OF CONTENTS
Item Description Page
PART I 1. Business 3 The Company 3 Operating Segments 4 Future Growth 5 Code of Ethics and Business Conduct 7 Environmental Matters 8 Insurance Coverage 81A. Risk Factors 81B. Unresolved Staff Comments 152. Properties 16 Geographic Distribution 16 Lease Expirations 18 Co-Investment Ventures 193. Legal Proceedings 194. Mine Safety Disclosures 19 PART II 5. Market for Registrant’s Common Equity, Related Stockholder Matters and Issuer Purchases of Equity Securities 20 Market Information and Holders 20 Preferred Stock Dividends 21 Sale of Unregistered Securities 21 Securities Authorized for Issuance Under Equity Compensation Plans 21 Other Stockholder Matters 216. Selected Financial Data 217. Management’s Discussion and Analysis of Financial Condition and Results of Operations 22 Management’s Overview 22 Results of Operations 22 Environmental Matters 31 Liquidity and Capital Resources 31 Off-Balance Sheet Arrangements 35 Contractual Obligations 36 Critical Accounting Policies 36 New Accounting Pronouncements 38 Funds from Operations Attributable to Common Stockholders/Unitholders 387A. Quantitative and Qualitative Disclosures About Market Risk 408. Financial Statements and Supplementary Data 419. Changes in and Disagreements with Accountants on Accounting and Financial Disclosure 419A. Controls and Procedures 419B. Other Information 42 PART III 10. Directors, Executive Officers and Corporate Governance 4311. Executive Compensation 4312. Security Ownership of Certain Beneficial Owners and Management and Related Stockholder Matters 4313. Certain Relationships and Related Transactions, and Director Independence 4314. Principal Accounting Fees and Services 43 PART IV 15. Exhibits, Financial Statements and Schedules 4316. Form 10-K Summary 43
2

The statements in this report that are not historical facts are forward-looking statements within the meaning of Section 27A of the Securities Act of 1933, asamended, and Section 21E of the Securities Exchange Act of 1934, as amended. These forward-looking statements are based on current expectations,estimates and projections about the industry and markets in which we operate as well as management’s beliefs and assumptions. Such statements i nvolveuncertainties that could significantly impact our financial results. Words such as “expects,” “anticipates,” “intends,” “plans,” “believes,” “seeks,” and “estimates”including variations of such words and similar expressions are intended to identify such forward-looking statements, which generally are not historical in nature.All statements that address operating performance, events or developments that we expect or anticipate will occur in the future — including statements relatingto rent and occu pancy growth, development activity, contribution and disposition activity, general conditions in the geographic areas where we operate, ourdebt, capital structure and financial position, our ability to form new co-investment ventures and the availability of capital in existing or new co-investmentventures — are forward-looking statements. These statements are not guarantees of future performance and involve certain risks, uncertainties andassumptions that are difficult to predict. Although we believe the expectations reflected in any forward-looking statements are based on reasonable assumptions,we can give no assurance that our expectations will be attained, and therefore actual outcomes and results may differ materially from what is expressed orforeca sted in such forward-looking statements. Some of the factors that may affect outcomes and results include, but are not limited to: (i) national, international,regional and local economic and political climates; (ii) changes in global financial markets, in terest rates and foreign currency exchange rates; (iii) increased orunanticipated competition for our properties; (iv) risks associated with acquisitions, dispositions and development of pro perties; (v) maintenance of REIT status,tax structuring and chan ges in income tax laws and rates; (vi) availability of financing and capital, the levels of debt that we maintain and our credit ratings; (vii)risks related to our investments in our co-investment ventures, including our ability to establish new co-invest ment ventures; (viii) risks of doing businessinternationally, including currency risks; (ix) environmental uncertainties, including risks of natural disasters; and (x) those additional factors discussed under Item1A. Risk Factors in this report. We under take no duty to update any forward-looking statements appearing in this report except as may be required by law. PART I ITEM 1. Business Prologis, Inc. is a self-administered and self-managed REIT and is the sole general partner of Prologis, L.P. We operate Prologis, Inc. and Prologis, L.P. as oneenterprise and, therefore, our discussion and analysis refers to Prologis, Inc. and its consolidated subsidiaries, including Prologis, L.P., collectively. We invest inreal estate through wholly owned subsid iaries and other entities through which we co-invest with partners and investors. We maintain a significant level ofownership in these co-investment ventures, which may be consolidated or unconsolidated based on our level of control of the entity. Prologis, Inc. began operating as a fully integrated real estate company in 1997 and elected to be taxed as a REIT under the Internal Revenue Code of 1986, asamended (“Internal Revenue Code”). We believe the current organization and method of operation will enable Prologis, Inc. to maintain its status as a REIT.Prologis, L.P. was also formed in 1997. We operate our business on an owned and managed basis, including properties that we wholly own and properties that are owned by one of our co-investmentventures. We make decisions based on the property operations, regardless of our ownership interest, therefore we generally evaluate operating metrics on anowned and managed basis. Our corporate headquarters is located at Pier 1, Bay 1, San Francisco, California 94111, and our other principal office locations are in Amsterdam, Denver,Luxembourg, Mexico City, Shanghai, Singapore and Tokyo. Our Internet address is www.prologis.com . All reports required to be filed with the Securities and Exchange Commission (“SEC”) are available and can beaccessed free of charge through the Investor Relations section of our website, www.prologis.com . The common stock of Prologis, Inc. is listed on the New YorkStock Exchange (“NYSE”) under the ticker “PLD” and is a component of the Standard & Poor’s (“S&P”) 500. THE COMPANY Prologis is the global leader in logistics real estate with a focus on high-barrier, high-growth markets in 19 countries. We own, manage and develop well-located,high-quality logistics facilities in the world’s busiest consumption markets. Our local teams actively manage our portfolio, which encompasses leasing andproperty management, capital deployment and opportunistic dispositions allowing us to recycle capital to fund our development and acquisition activities. Themajority of our properties in the United States (“U.S.”) are wholly owned, while our properties outside the U.S. are generally held in co-investment ventures,reducing our exposure to foreign currency movements. Our portfolio benefits from key drivers of economic activity, including consumption, supply chain modernization, e-commerce and urbanization. In the developedmarkets of the U.S., Europe and Japan, key factors are the reconfiguration of supply chains (strongly influenced by e-commerce trends), and the operationalefficiencies that can be realized from our modern logistics facilities. In emerging markets, such as Brazil, China and Mexico, new affluence and the rise of a newconsumer class have increased the need for modern distribution networks. Our strategy is to own the highest-quality logistics property portfolio in each of ourtarget markets. These markets are characterized by large population densities and consumption and typically offer proximity to large labor pools and aresupported by extensive transportation infrastructure (major airports, seaports and rail and highway networks). Customers turn to us because they know anefficient supply chain will make their businesses run better, and that a strategic relationship with Prologis will create a competitive advantage.
3
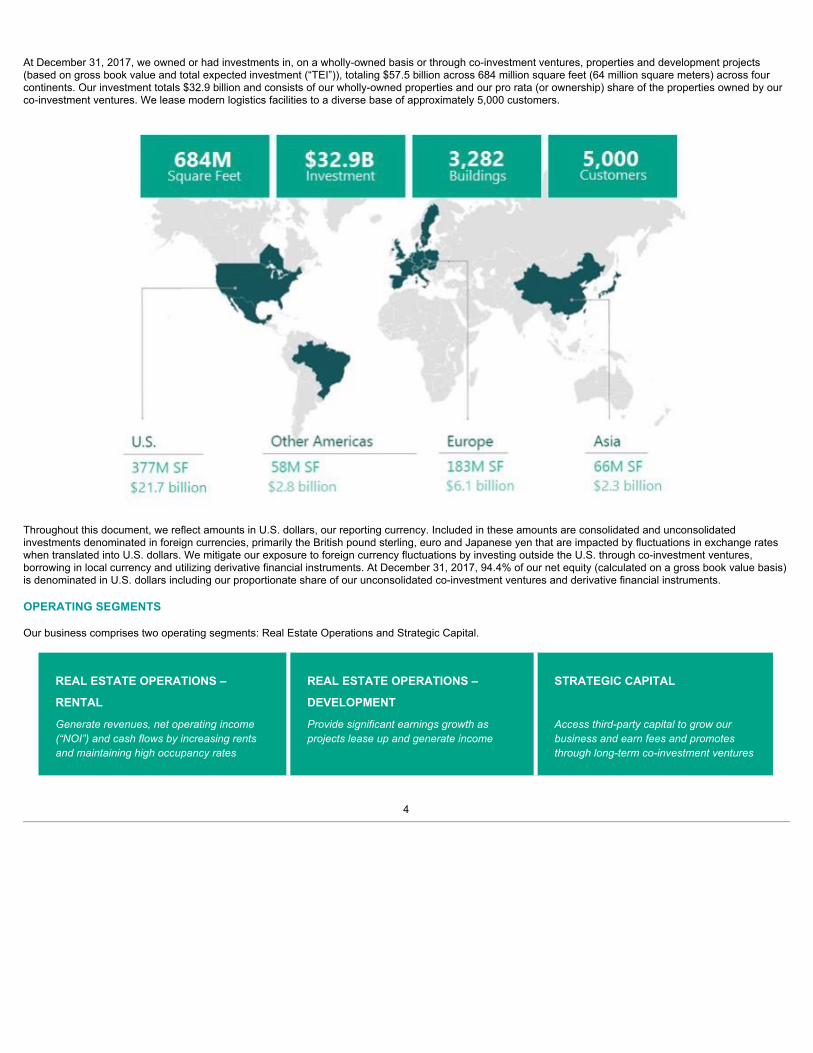
At December 31, 2017, we owned or had investments in, on a wholly-owned basis or through co-investment ventures, properties and development projects(based on gross book value and total expected investment (“TEI”)), totaling $57.5 billion across 684 million square feet (64 million square meters) across fourcontinents. Our investment totals $32.9 billion and consists of our wholly-owned properties and our pro rata (or ownership) share of the properties owned by ourco-investment ventures. We lease modern logistics facilities to a diverse base of approximately 5,000 customers.
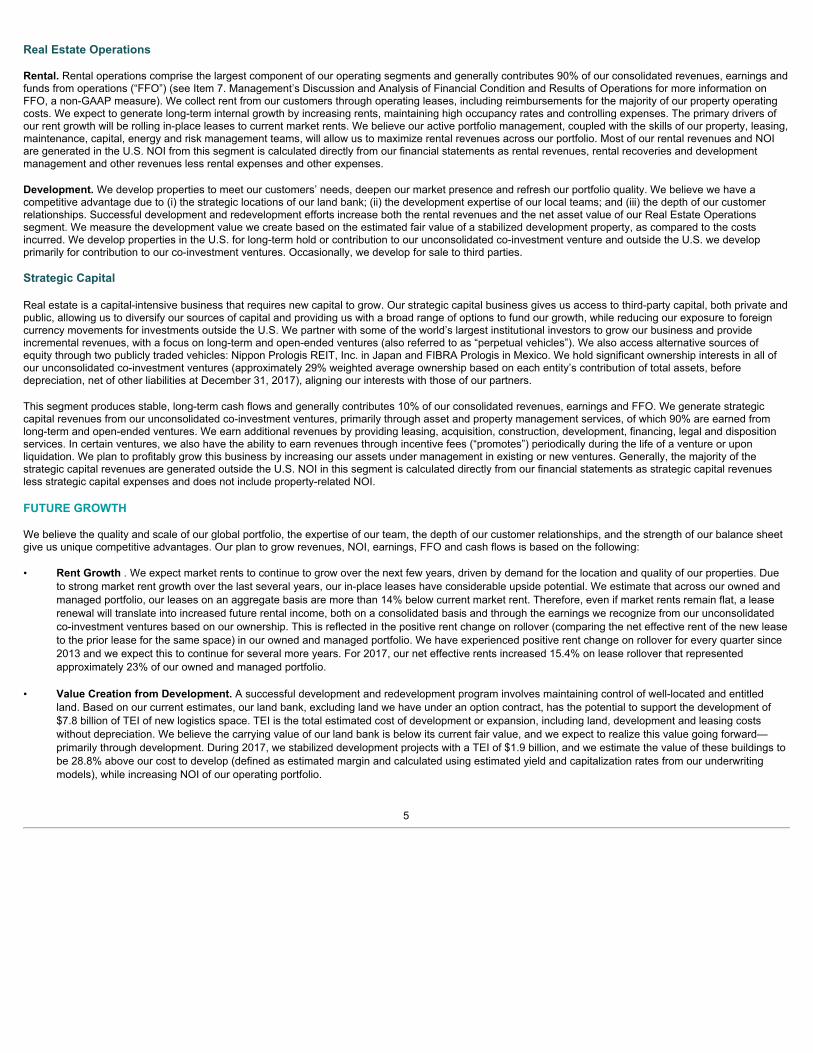
Throughout this document, we reflect amounts in U.S. dollars, our reporting currency. Included in these amounts are consolidated and unconsolidatedinvestments denominated in foreign currencies, primarily the British pound sterling, euro and Japanese yen that are impacted by fluctuations in exchange rateswhen translated into U.S. dollars. We mitigate our exposure to foreign currency fluctuations by investing outside the U.S. through co-investment ventures,borrowing in local currency and utilizing derivative financial instruments. At December 31, 2017, 94.4% of our net equity (calculated on a gross book value basis)is denominated in U.S. dollars including our proportionate share of our unconsolidated co-investment ventures and derivative financial instruments. OPERATING SEGMENTS Our business comprises two operating segments: Real Estate Operations and Strategic Capital.
REAL ESTATE OPERATIONS –
RENTAL
Generate revenues, net operating income(“NOI”) and cash flows by increasing rentsand maintaining high occupancy rates
REAL ESTATE OPERATIONS –
DEVELOPMENT
Provide significant earnings growth asprojects lease up and generate income
STRATEGIC CAPITAL
Access third-party capital to grow ourbusiness and earn fees and promotesthrough long-term co-investment ventures
4
Real Estate Operations Rental. Rental operations comprise the largest component of our operating segments and generally contributes 90% of our consolidated revenues, earnings andfunds from operations (“FFO”) (see Item 7. Management’s Discussion and Analysis of Financial Condition and Results of Operations for more information onFFO, a non-GAAP measure). We collect rent from our customers through operating leases, including reimbursements for the majority of our property operatingcosts. We expect to generate long-term internal growth by increasing rents, maintaining high occupancy rates and controlling expenses. The primary drivers ofour rent growth will be rolling in-place leases to current market rents. We believe our active portfolio management, coupled with the skills of our property, leasing,maintenance, capital, energy and risk management teams, will allow us to maximize rental revenues across our portfolio. Most of our rental revenues and NOIare generated in the U.S. NOI from this segment is calculated directly from our financial statements as rental revenues, rental recoveries and developmentmanagement and other revenues less rental expenses and other expenses. Development. We develop properties to meet our customers’ needs, deepen our market presence and refresh our portfolio quality. We believe we have acompetitive advantage due to (i) the strategic locations of our land bank; (ii) the development expertise of our local teams; and (iii) the depth of our customerrelationships. Successful development and redevelopment efforts increase both the rental revenues and the net asset value of our Real Estate Operationssegment. We measure the development value we create based on the estimated fair value of a stabilized development property, as compared to the costsincurred. We develop properties in the U.S. for long-term hold or contribution to our unconsolidated co-investment venture and outside the U.S. we developprimarily for contribution to our co-investment ventures. Occasionally, we develop for sale to third parties. Strategic Capital Real estate is a capital-intensive business that requires new capital to grow. Our strategic capital business gives us access to third-party capital, both private andpublic, allowing us to diversify our sources of capital and providing us with a broad range of options to fund our growth, while reducing our exposure to foreigncurrency movements for investments outside the U.S. We partner with some of the world’s largest institutional investors to grow our business and provideincremental revenues, with a focus on long-term and open-ended ventures (also referred to as “perpetual vehicles”). We also access alternative sources ofequity through two publicly traded vehicles: Nippon Prologis REIT, Inc. in Japan and FIBRA Prologis in Mexico. We hold significant ownership interests in all ofour unconsolidated co-investment ventures (approximately 29% weighted average ownership based on each entity’s contribution of total assets, beforedepreciation, net of other liabilities at December 31, 2017), aligning our interests with those of our partners. This segment produces stable, long-term cash flows and generally contributes 10% of our consolidated revenues, earnings and FFO. We generate strategiccapital revenues from our unconsolidated co-investment ventures, primarily through asset and property management services, of which 90% are earned fromlong-term and open-ended ventures. We earn additional revenues by providing leasing, acquisition, construction, development, financing, legal and dispositionservices. In certain ventures, we also have the ability to earn revenues through incentive fees (“promotes”) periodically during the life of a venture or uponliquidation. We plan to profitably grow this business by increasing our assets under management in existing or new ventures. Generally, the majority of thestrategic capital revenues are generated outside the U.S. NOI in this segment is calculated directly from our financial statements as strategic capital revenuesless strategic capital expenses and does not include property-related NOI. FUTURE GROWTH We believe the quality and scale of our global portfolio, the expertise of our team, the depth of our customer relationships, and the strength of our balance sheetgive us unique competitive advantages. Our plan to grow revenues, NOI, earnings, FFO and cash flows is based on the following: • Rent Growth . We expect market rents to continue to grow over the next few years, driven by demand for the location and quality of our properties. Due
to strong market rent growth over the last several years, our in-place leases have considerable upside potential. We estimate that across our owned andmanaged portfolio, our leases on an aggregate basis are more than 14% below current market rent. Therefore, even if market rents remain flat, a leaserenewal will translate into increased future rental income, both on a consolidated basis and through the earnings we recognize from our unconsolidatedco-investment ventures based on our ownership. This is reflected in the positive rent change on rollover (comparing the net effective rent of the new leaseto the prior lease for the same space) in our owned and managed portfolio. We have experienced positive rent change on rollover for every quarter since2013 and we expect this to continue for several more years. For 2017, our net effective rents increased 15.4% on lease rollover that representedapproximately 23% of our owned and managed portfolio.
• Value Creation from Development. A successful development and redevelopment program involves maintaining control of well-located and entitled
land. Based on our current estimates, our land bank, excluding land we have under an option contract, has the potential to support the development of$7.8 billion of TEI of new logistics space. TEI is the total estimated cost of development or expansion, including land, development and leasing costswithout depreciation. We believe the carrying value of our land bank is below its current fair value, and we expect to realize this value going forward—primarily through development. During 2017, we stabilized development projects with a TEI of $1.9 billion, and we estimate the value of these buildings tobe 28.8% above our cost to develop (defined as estimated margin and calculated using estimated yield and capitalization rates from our underwritingmodels), while increasing NOI of our operating portfolio.
5

• Economies of Scale from Growth in Assets Under Manageme nt. We have increased our owned and managed real estate assets by 91 million square
feet (or approximately 17%) over the last three years through acquisitions and development, while strengthening our balance sheet and keeping ourgeneral and administrative (“G&A”) expenses relatively flat. We have invested in technologies that we will continue to leverage to further streamline ouroperations and reduce our costs as a percentage of assets under management.
Competition Competitively priced logistics space could impact our occupancy rates and have an adverse effect on how much rent we can charge, which in turn could affectour operating segments. We may face competition regarding our capital deployment activities, including local, regional and national operators or developers. Wealso face competition from investment managers for institutional capital within our strategic capital business. We believe we have competitive advantages due to our: • properties in markets characterized by large population densities and consumption and typically offer proximity to large labor pools and are supported by
extensive transportation infrastructure; • ability to quickly respond to customers’ needs for high-quality logistics facilities; • established relationships with key customers served by our local teams; • ability to leverage our organizational scale and structure to provide a single point of contact for our focus customers through our global customer solutions
team; • property management and leasing expertise; • relationships and proven track record with current and prospective investors in our strategic capital business; • strategic locations of our land bank; • local teams with development expertise; and
• balance sheet strength, credit ratings and significant liquidity. Customers Our broad customer base represents a spectrum of international, national, regional and local logistics users. At December 31, 2017, in our Real EstateOperations segment representing our consolidated properties, we had more than 2,800 customers occupying 299 million square feet of logistics operatingproperties. On an owned and managed basis, we had approximately 5,000 customers occupying 630 million square feet of logistics operating properties.
6

The following table details our top 25 customers at December 31, 2017 (square feet in millions): Consolidated – Real Estate Operations Owned and Managed
Top Customers % of NER (1) Total Occupied Square
Feet Top Customers % of NER (1) Total Occupied Square
Feet 1. Amazon.com 4.9 13 1. Amazon.com 3.0 17 2. Home Depot 1.8 6 2. DHL 1.5 11 3. FedEx 1.6 3 3. Geodis 1.2 9 4. Wal-Mart 1.3 4 4. XPO Logistics 1.2 10 5. XPO Logistics 0.9 3 5. Kuehne + Nagel 1.1 7 6. UPS 0.9 2 6. DSV Air and Sea Inc. 1.0 5 7. NFI 0.8 2 7. Home Depot 1.0 7 8. U.S. Government 0.8 1 8. FedEx 0.9 3 9. Geodis 0.8 2 9. Wal-Mart 0.8 5 10. DHL 0.7 2 10. CEVA Logistics 0.7 5
Top 10 Customers 14.5 38 Top 10 Customers 12.4 79 11. Kimberly-Clark Corporation 0.7 3 11. Nippon Express 0.7 3 12. PepsiCo 0.7 3 12. UPS 0.6 4 13. Office Depot 0.6 2 13. BMW 0.6 4 14. DSV Air and Sea Inc. 0.5 2 14. DB Schenker 0.6 4 15. Ingram Micro 0.5 2 15. Hitachi 0.6 2 16. Best Buy 0.5 1 16. Ingram Micro 0.5 4 17. Kuehne + Nagel 0.5 1 17. U.S. Government 0.5 1 18. APL Logistics 0.5 2 18. Panalpina 0.4 3 19. Georgia-Pacific Corporation 0.4 1 19. PepsiCo 0.3 3 20. Kohler 0.4 3 20. Office Depot 0.3 2 21. C&S Wholesale Grocers 0.4 1 21. Best Buy 0.3 2 22. Kellogg's 0.4 2 22. APL Logistics 0.3 3 23. Essendant 0.4 2 23. Kimberly-Clark Corporation 0.3 3 24. Ford Motor Company 0.3 1 24. Tesco 0.3 2 25. Mondelez International 0.3 1 25. Schneider Electric 0.3 1
Top 25 Customers 21.6 65 Top 25 Customers 19.0 120
(1) Net effective rent (“NER”) is calculated using the estimated total cash to be received over the term of the lease (including base rent and expense
reimbursements) divided by the lease term to determine the amount of rent and expense reimbursements received per year. Amounts derived in acurrency other than the U.S. dollar have been translated using the average rate from the previous twelve months.
In our Strategic Capital segment, we view our partners and investors as our customers. At December 31, 2017, in our private ventures, we partnered withapproximately 100 investors, several of which invest in multiple ventures. Employees The following table summarizes our employee base at December 31, 2017: Regions Number of Employees U.S. (1) 835 Other Americas 130 Europe 370 Asia 230 Total 1,565
(1) This includes employees who were employed in the U.S. but also support other regions. We allocate our employees who perform property management functions to our Real Estate Operations segment and Strategic Capital segment based on thesquare footage of the respective portfolios. Employees who perform only Strategic Capital functions are allocated directly to that segment. We believe we have good relationships with our employees. Prologis employees are not organized under collective bargaining agreements, although someemployees in Europe are represented by statutory Works Councils and as such, benefit from applicable labor agreements. CODE OF ETHICS AND BUSINESS CONDUCT We maintain a Code of Ethics and Business Conduct applicable to our board of directors (the “Board”) and all of our officers and employees, including theprincipal executive officer, the principal financial officer and the principal accounting officer, and other people performing similar functions. A copy of our Code ofEthics and Business Conduct is available on our website, www.prologis.com . In addition to being ac cessible through our website, copies of our Code of Ethicsand Business Conduct can be obtained, free of charge, upon written request to Investor Relations, Pier 1, Bay 1, San Francisco, California 94111. Anyamendments to or waivers of our Code
7

of Ethics and Business Conduct that apply to the principal executive officer, the principal financial officer, the principal accounting officer, or other peopleperforming similar functions, and that relate to any matter enumerated in Item 406(b) of Regulation S-K, will be disclosed on our website. ENVIRONMENTAL MATTERS We are exposed to various environmental risks that may result in unanticipated losses and affect our operating results and financial condition. Either the previousowners or we have conducted environmental reviews on a majority of the properties we have acquired, including land. While some of these assessments haveled to further investigation and sampling, none of the environmental assessments has revealed an environmental liability that we believe would have a materialadverse effect on our business, financial condition or results of operations. See further discussion in Item 1A. Risk Factors and Note 17 to the ConsolidatedFinancial Statements in Item 8. Financial Statements and Supplementary Data. INSURANCE COVERAGE We carry insurance coverage on our properties. We determine the type of coverage and the policy specifications and limits based on what we deem to be therisks associated with our ownership of properties and our business operations in specific markets. Such coverage typically includes property damage and rentalloss insurance resulting from such perils as fire, windstorm, flood, earthquake and terrorism; commercial general liability insurance; and environmentalinsurance. Insurance is maintained through a combination of commercial insurance, self-insurance and a wholly-owned captive insurance entity. The costs toinsure our properties are primarily covered through reimbursements from our customers. We believe our insurance coverage contains policy specifications andinsured limits that are customary for similar properties, business activities and markets and we believe our properties are adequately insured. See furtherdiscussion in Item 1A. Risk Factors. ITEM 1A. Risk Factors Our operations and structure involve various risks that could adversely affect our business and financial condition, including but not limited to, our financialposition, results of operations, cash flow, ability to make distributions and payments to security holders and the market value of our securities. These risks relateto Prologis as well as our investments in consolidated and unconsolidated entities and include among others, (i) general risks; (ii) risks related to our business;(iii) risks related to financing and capital; and (iv) income tax risks. General Risks As a global company, we are subject to social, political and economic risks of doing business in many countries. We conduct a significant portion of our business and employ a substantial number of people outside of the U.S. During 2017, we generated approximately $416million or 15.9% of our revenues from operations outside the U.S. Circumstances and developments related to international and U.S. operations that couldnegatively affect us include, but are not limited to, the following factors: • difficulties and costs of staffing and managing international operations in certain regions, including differing employment practices and labor issues; • local businesses and cultural factors that differ from our usual standards and practices; • volatility in currencies and currency restrictions, which may prevent the transfer of capital and profits to the U.S.; • challenges in establishing effective controls and procedures to regulate operations in different regions and to monitor compliance with applicable
regulations, such as the Foreign Corrupt Practices Act, the United Kingdom (“U.K.”) Bribery Act and other similar laws; • unexpected changes in regulatory requirements, tax, tariffs and other laws within the countries in which we operate; • potentially adverse tax consequences; • the responsibility of complying with multiple and potentially conflicting laws, e.g., with respect to corrupt practices, employment and licensing; • the impact of regional or country-specific business cycles and economic instability, including instability in, or further withdrawals from, the European Union
or other international trade alliances or agreements; • political instability, uncertainty over property rights, civil unrest, drug trafficking, political activism or the continuation or escalation of terrorist or gang
activities;
8

• foreign ownership restrictions in operations with the respective countries; and • access to capital may be more restricted, or unavailable on favorable terms or at all in certain locations. In addition, we may be impacted by the ability of our non-U.S. subsidiaries to dividend or otherwise transfer cash among our subsidiaries, including transfers ofcash to pay interest and principal on our debt, due to currency exchange control regulations, transfer pricing regulations and potentially adverse taxconsequences, among other factors. Disruptions in the global capital and credit markets may adversely affect our operating results and financial condition. To the extent there is turmoil in the global financial markets, this turmoil has the potential to adversely affect (i) the value of our properties; (ii) the availability orthe terms of financing that we have or may anticipate utilizing; (iii) our ability to make principal and interest payments on, or refinance any outstanding debt whendue; and (iv) the ability of our customers to enter into new leasing transactions or satisfy rental payments under existing leases. Disruptions in the capital andcredit markets may also adversely affect our ability to make distributions and payments to our security holders and the market price of our securities. Our business and operations could suffer in the event of system failures or cyber security attacks. Despite system redundancy, the implementation of security measures and the existence of a disaster recovery plan for our internal and hosted informationtechnology systems, our systems are vulnerable to damages from any number of sources, including energy blackouts, natural disasters, terrorism, war,telecommunication failures and cyber security attacks, such as computer viruses or unauthorized access. Any system failure or accident that causesinterruptions in our operations could result in a material disruption to our business. We may also incur additional costs to remedy damages caused by suchdisruptions. Any compromise of our security could result in a violation of applicable privacy and other laws, unauthorized access to information of ours andothers, significant legal and financial exposure, damage to our reputation, loss or misuse of the information and a loss of confidence in our security measures,which could harm our business. Risks associated with our dependence on key personnel. We depend on the deep industry knowledge and the efforts of our executive officers and other key employees. From time to time, our personnel and their rolesmay change. While we believe that we are able to retain our key talent and find suitable employees to meet our personnel needs, the loss of key personnel, anychange in their roles or the limitation of their availability could adversely affect our business. If we are unable to continue to attract and retain our executiveofficers, or if compensation costs required to attract and retain key employees become more expensive, our performance and competitive position could bematerially adversely affected. Our business could be adversely impacted if we have deficiencies in our disclosure controls and procedures or internal control over financialreporting. The design and effectiveness of our disclosure controls and procedures and internal control over financial reporting may not prevent all errors, misstatements ormisrepresentations. While management continually reviews the effectiveness of our disclosure controls and procedures and internal control over financialreporting, there can be no guarantee that our internal control over financial reporting will be effective in accomplishing all control objectives all of the time.Deficiencies, including any material weakness, in our internal control over financial reporting that may occur in the future could result in misstatements orrestatements of our financial statements or a decline in the price of our securities. The depreciation in the value of the foreign currency in countries where we have a significant investment may adversely affect our results ofoperations and financial position. We pursue growth opportunities in international markets where the U.S. dollar is not the functional currency. At December 31, 2017, approximately $7.4 billion or25.1% of our total consolidated assets were invested in a currency other than the U.S. dollar, primarily the Brazilian real, British pound sterling, Canadian dollar,euro and Japanese yen. As a result, we are subject to foreign currency risk due to potential fluctuations in exchange rates between foreign currencies and theU.S. dollar. A significant change in the value of the foreign currency of one or more countries where we have a significant investment may have a materialadverse effect on our business and, specifically, our U.S. dollar reported financial position and results of operations and debt covenant ratios. Although weattempt to mitigate adverse effects by borrowing under debt agreements denominated in foreign currencies and using derivative contracts, there can be noassurance that those attempts to mitigate foreign currency risk will be successful. Our hedging of foreign currency and interest rate risk may not effectively limit our exposure to other risks. Hedging arrangements involve risks, such as the risk of fluctuation in the relative value of the foreign currency or interest rates and the risk that counterpartiesmay fail to honor their obligations under these arrangements. The funds required to settle such arrangements could be significant depending on the stability andmovement of the hedged foreign currency or the size of the underlying financing and the applicable interest rates at the time of the breakage. The failure tohedge effectively against foreign exchange changes or interest rate changes may adversely affect our business.
9

Compliance or failure to comply with regulatory requirements could result in substantial costs. We are required to comply with many regulations in different countries, including (but not limited to) the Foreign Corrupt Practices Act, the U.K Bribery Act andsimilar laws and regulations. Our properties are also subject to various federal, state and local regulatory requirements, such as the Americans with DisabilitiesAct and state and local fire and life-safety requirements. Noncompliance could result in the imposition of governmental fines or the award of damages to privatelitigants. While we believe that we are currently in material compliance with these regulatory requirements, the requirements may change or new requirementsmay be imposed that could require significant unanticipated expenditures by us. If we are required to make unanticipated expenditures to comply with theseregulations, we may be adversely affected. Risks Related to our Business Real estate investments are not as liquid as certain other types of assets, which may reduce economic returns to investors. Real estate investments are not as liquid as certain other types of investments and this lack of liquidity may limit our ability to react promptly to changes ineconomic or other conditions. Significant expenditures associated with real estate investments, such as secured mortgage payments, real estate taxes andmaintenance costs, are generally not reduced when circumstances cause a reduction in income from the investments. As a REIT, under the Internal RevenueCode, we are only able to hold property for sale in the ordinary course of business through taxable REIT subsidiaries in order to not incur punitive taxation onany tax gain from the sale of such property. We may dispose of certain properties that have been held for investment to generate liquidity. If we do not satisfycertain safe harbors or we believe there is too much risk of incurring the punitive tax on any tax gain from the sale, we may not pursue such sales. We may decide to sell properties to certain of our unconsolidated co-investment ventures or third parties to generate proceeds to fund our capital deploymentactivities. Our ability to sell properties on advantageous terms is affected by: (i) competition from other owners of properties that are trying to dispose of theirproperties; (ii) market conditions, including the capitalization rates applicable to our properties; and (iii) other factors beyond our control. If our competitors sellassets similar to assets we intend to divest in the same markets or at valuations below our valuations for comparable assets, we may be unable to divest ourassets at favorable pricing or at all. The unconsolidated co-investment ventures or third parties who might acquire our properties may need to have access todebt and equity capital, in the private and public markets, in order to acquire properties from us. Should they have limited or no access to capital on favorableterms, then dispositions could be delayed. If we do not have sufficient cash available to us through our operations, sales or contributions of properties or available credit facilities to continue operating ourbusiness as usual, we may need to find alternative ways to increase our liquidity. Such alternatives may include, without limitation, divesting ourselves ofproperties, whether or not they otherwise meet our strategic objectives to keep in the long term, at less than optimal terms, incurring debt, entering into leaseswith new customers at lower rental rates or less than optimal terms or entering into lease renewals with our existing customers without an increase in rentalrates. There can be no assurance, however, that such alternative ways to increase our liquidity will be available to us. Additionally, taking such measures toincrease our liquidity may adversely affect our business, and in particular, our distributable cash flow and debt covenants. Our investments are concentrated in the logistics sector and our business would be adversely affected by an economic downturn in that sector. Our investments in real estate assets are concentrated in the logistics sector. This concentration may expose us to the risk of economic downturns in this sectorto a greater extent than if our business activities were more diversified. General economic conditions and other events or occurrences that affect areas in which our properties are geographically concentrated, may impactfinancial results. We are exposed to general economic conditions, local, regional, national and international economic conditions and other events and occurrences that affect themarkets in which we own properties. Our operating performance is further impacted by the economic conditions of the specific markets in which we haveconcentrations of properties. At December 31, 2017, 33.7% of our consolidated operating properties or $7.7 billion (based on consolidated gross book value, or investment beforedepreciation) were located in California, which represented 27.4% of the aggregate square footage of our operating properties and 34.1% of our NOI. Ourrevenues from, and the value of, our properties located in California may be affected by local real estate conditions (such as an oversupply of or reduceddemand for logistics properties) and the local economic climate. Business layoffs, downsizing, industry slowdowns, changing demographics and other factorsmay adversely impact California’s economic climate. Because of the number of properties we have located in California, a downturn in California’s economy orreal estate conditions could adversely affect our business. In addition to California, we also have significant holdings (defined as more than 3% of total consolidated investment before depreciation) in operating propertiesin certain markets located in Atlanta, Central and Eastern Pennsylvania, Chicago, Dallas/Fort Worth, New Jersey/New York City, Seattle and South Florida. Ouroperating performance could be adversely affected if conditions become less favorable in any of the markets in which we have a concentration of properties.Conditions such as an oversupply of logistics space or a reduction in demand for logistics space, among other factors, may impact operating conditions. Anymaterial oversupply of logistics space or material reduction in demand for logistics space could adversely affect our overall business.
10

Our owned and managed portfolio, which includes our wholly-owned properties and properties included in our co-investment ventures, has concentrations ofproperties in the sa me markets mentioned above, as well as in markets in France, Germany, Japan, Mexico, Netherlands, Poland and the U.K., and are subjectto the economic conditions in those markets. A number of our investments, both wholly-owned and owned through co-investment ventures, are located in areas that are known to be subject to earthquakeactivity. U.S. properties located in active seismic areas include properties in our markets in California and Seattle. International properties located in activeseismic areas include Japan and Mexico. We generally carry earthquake insurance on our properties located in areas historically subject to seismic activity,subject to coverage limitations and deductibles, if we believe it is commercially reasonable. We evaluate our earthquake insurance coverage annually in light ofcurrent industry practice through an analysis prepared by outside consultants and in some specific instances have elected to self-insure our earthquakeexposure based on this analysis. We have elected not to carry earthquake insurance for our assets in Japan based on this analysis. Furthermore, a number of our properties are located in areas that are known to be subject to hurricane or flood risk. We carry hurricane and flood hazardinsurance on all of our properties located in areas historically subject to such activity, subject to coverage limitations and deductibles, if we believe it iscommercially reasonable. We evaluate our insurance coverage annually in light of current industry practice through an analysis prepared by outside consultants. Investments in real estate properties are subject to risks that could adversely affect our business. Investments in real estate properties are subject to varying degrees of risk. While we seek to minimize these risks through geographic diversification of ourportfolio, market research and our asset management capabilities, these risks cannot be eliminated. Factors that may affect real estate values and cash flowsinclude: • local conditions, such as oversupply or a reduction in demand; • technological changes, such as reconfiguration of supply chains, autonomous vehicles, robotics, 3D printing or other technologies; • the attractiveness of our properties to potential customers and competition from other available properties; • increasing costs of maintaining, insuring, renovating and making improvements to our properties; • our ability to rehabilitate and reposition our properties due to changes in the business and logistics needs of our customers; • our ability to control rents and variable operating costs; and • governmental regulations and the associated potential liability under, and changes in, environmental, zoning, usage, tax, tariffs and other laws. We may be unable to lease vacant space or renew leases or re-lease space on favorable terms as leases expire. Our operating results and distributable cash flow would be adversely affected if a significant number of our customers were unable to meet their leaseobligations. We are also subject to the risk that, upon the expiration of leases for space located in our properties, leases may not be renewed by existingcustomers, the space may not be re-leased to new customers or the terms of renewal or re-leasing (including the cost of required renovations or concessions tocustomers) may be less favorable to us than current lease terms. Our competitors may offer space at rental rates below current market rates or below the rentalrates we currently charge our customers, we may lose potential customers, and we may be pressured to reduce our rental rates below those we currently chargeto retain customers when our customers’ leases expire. In the event of default by a significant number of customers, we may experience delays and incursubstantial costs in enforcing our rights as landlord, and we may be unable to re-lease spaces. A customer may experience a downturn in its business, whichmay cause the loss of the customer or may weaken its financial condition, resulting in the customer’s failure to make rental payments when due or requiring arestructuring that might reduce cash flow from the lease. In addition, a customer may seek the protection of bankruptcy, insolvency or similar laws, which couldresult in the rejection and termination of such customer’s lease and thereby cause a reduction in our available cash flow. We may acquire properties, which involves risks that could adversely affect our business and financial condition. We have acquired properties and will continue to acquire properties, both through the direct acquisition of real estate and through the acquisition of entities thatown the real estate and through additional investments in co-investment ventures that acquire properties. The acquisition of properties involves risks, includingthe risk that the acquired property will not perform as anticipated and that any actual costs for rehabilitation, repositioning, renovation and improvementsidentified in the pre-acquisition due diligence process will exceed estimates. When we acquire properties, we may face risks associated with a lack of marketknowledge or understanding of the local economy, forging new business relationships in the area and unfamiliarity with local government and permittingprocedures. Additionally, there is, and it is expected there will continue to be, significant competition for properties that meet our investment criteria as well asrisks associated with obtaining financing for acquisition activities. The acquired properties or entities may be subject to liabilities, which may be without anyrecourse, or with only limited recourse, with respect to unknown liabilities. As a result, if a liability were asserted against us based on ownership of any of theseentities or properties, then we may have to pay substantial sums to settle it.
11
Our real estate development strategies may not be successful. Our real estate development strategy is focused on monetizing land in the future through development of logistics facilities to hold for long-term investment,contribution or sale to a co-investment venture or third party, depending on market conditions, our liquidity needs and other factors. We may increase ourinvestment in the development, renovation and redevelopment business and we expect to complete the build-out and leasing of our current developmentportfolio. We may also develop, renovate and redevelop properties within existing or newly formed co-investment ventures. The real estate development,renovation and redevelopment business includes the following significant risks: • we may not be able to obtain financing for development projects on favorable terms or at all; • we may explore development opportunities that may be abandoned and the related investment impaired; • we may not be able to obtain, or may experience delays in obtaining, all necessary zoning, land-use, building, occupancy and other governmental permits
and authorizations; • we may have construction costs, total investment amounts and our share of remaining funding that exceed our estimates and projects may not be
completed, delivered or stabilized as planned due to defects or other issues; • we may not be able to attract third-party investment in new development co-investment ventures or sufficient customer demand for our product; • we may have properties that perform below anticipated levels, producing cash flow below budgeted amounts; • we may seek to sell certain land parcels and not be able to find a third party to acquire such land or the sales price will not allow us to recover our
investment, resulting in impairment charges; • we may not be able to lease properties we develop on favorable terms or at all; • we may not be able to capture the anticipated enhanced value created by our value-added properties on expected timetables or at all; • we may experience delays (temporary or permanent) if there is public or government opposition to our activities; and • we may have substantial renovation, new development and redevelopment activities, regardless of their ultimate success, that require a significant
amount of management’s time and attention, diverting their attention from our day-to-day operations. We are subject to risks and liabilities in connection with forming co-investment ventures, investing in new or existing co-investment ventures,attracting third-party investment and investing in and managing properties through co-investment ventures. At December 31, 2017, we had investments in real estate containing approximately 399 million square feet held through co-investment ventures, both public andprivate. Our organizational documents do not limit the amount of available funds that we may invest in these ventures, and we may and currently intend todevelop and acquire properties through co-investment ventures and investments in other entities when warranted by the circumstances. However, there can beno assurance that we will be able to form new co-investment ventures, or attract third-party investment or that additional investments in new or existing venturesto develop or acquire properties will be successful. Further, there can be no assurance that we are able to realize value from such investments. Our co-investment ventures involve certain additional risks that we do not otherwise face, including: • our partners may share certain approval rights over major decisions made on behalf of the ventures; • if our partners fail to fund their share of any required capital contributions, then we may choose to contribute such capital; • our partners might have economic or other business interests or goals that are inconsistent with our business interests or goals that would affect our
ability to operate the property; • the venture or other governing agreements often restrict the transfer of an interest in the co-investment venture or may otherwise restrict our ability to sell
the interest when we desire or on advantageous terms;
12
• our relationships with our partners are generally contractual in nature and may be terminated or dissolved under the terms of the agreements, and in such
event, we may not continue to manage or invest in the asset s underlying such relationships resulting in reduced fee revenues or causing a need topurchase such interest to continue ownership; and
• disputes between us and our partners may result in litigation or arbitration that would increase our expenses and prevent our officers and directors from
focusing their time and effort on our business and result in subjecting the properties owned by the applicable co-investment venture to additional risk. We generally seek to maintain sufficient influence over our co-investment ventures to permit us to achieve our business objectives; however, we may not be ableto continue to do so indefinitely. We have formed publicly traded investment vehicles, such as NPR and FIBRA Prologis, for which we serve as sponsor ormanager. We have contributed, and may continue to contribute, assets into such vehicles. There is a risk that our managerial relationship may be terminated. We are exposed to various environmental risks, including the potential impacts of future climate change, which may result in unanticipated lossesthat could affect our business and financial condition. Under various federal, state and local laws, ordinances and regulations, a current or previous owner, developer or operator of real estate may be liable for thecosts of removal or remediation of certain hazardous or toxic substances. The costs of removal or remediation of such substances could be substantial. Suchlaws often impose liability without regard to whether the owner or operator knew of, or was responsible for, the release or presence of such hazardoussubstances. In addition, third parties may sue the owner or operator of a site for damages based on personal injury, property damage or other costs, includinginvestigation and clean-up costs, resulting from the environmental contamination. Environmental laws in some countries, including the U.S., also require that owners or operators of buildings containing asbestos properly manage and maintainthe asbestos, adequately inform or train those who may come into contact with asbestos and undertake special precautions, including removal or otherabatement, in the event that asbestos is disturbed during building renovation or demolition. These laws may impose fines and penalties on building owners oroperators who fail to comply with these requirements and may allow third parties to seek recovery from owners or operators for personal injury associated withexposure to asbestos. Some of our properties are known to contain asbestos-containing building materials. In addition, some of our properties are leased or have been leased, in part, to owners and operators of businesses that use, store or otherwise handle petroleumproducts or other hazardous or toxic substances, creating a potential for the release of such hazardous or toxic substances. Furthermore, certain of ourproperties are on, adjacent to or near other properties that have contained or currently contain petroleum products or other hazardous or toxic substances, orupon which others have engaged, are engaged or may engage in activities that may release such hazardous or toxic substances. From time to time, we mayacquire properties, or interests in properties, with known adverse environmental conditions for which we believe that the environmental liabilities associated withthese conditions are quantifiable and that the acquisition will yield a superior risk-adjusted return. In connection with certain divested properties, we have agreedto remain responsible for, and to bear the cost of, remediating or monitoring certain environmental conditions on the properties. We are also exposed to potential physical risks from possible future changes in climate. Our logistics facilities may be exposed to rare catastrophic weatherevents, such as severe storms or floods. If the frequency of extreme weather events increases due to climate change, our exposure to these events couldincrease. We do not currently consider ourselves to be exposed to regulatory risks related to climate change, as our operations generally do not emit asignificant amount of greenhouse gases. However, we may be adversely impacted as a real estate developer in the future by potential impacts to the supplychain or stricter energy efficiency standards for buildings. We cannot give any assurance that other such conditions do not exist or may not arise in the future.The presence of such substances on our real estate properties could adversely affect our ability to lease, develop or sell such properties or to borrow using suchproperties as collateral. Our insurance coverage does not include all potential losses. We and our unconsolidated co-investment ventures carry insurance coverage including property damage and rental loss insurance resulting from certain perilssuch as fire and additional perils as covered under an extended coverage policy, namely windstorm, flood, earthquake and terrorism; commercial general liabilityinsurance; and environmental insurance, as appropriate for the markets where each of our properties and business operations are located. The insurancecoverage contains policy specifications and insured limits customarily carried for similar properties, business activities and markets. We believe our propertiesand the properties of our co-investment ventures are adequately insured. Certain losses, however, including losses from floods, earthquakes, acts of war, acts ofterrorism or riots, generally are not insured against or not fully insured against because it is not deemed economically feasible or prudent to do so. If anuninsured loss or a loss in excess of insured limits occurs with respect to one or more of our properties, we could experience a significant loss of capital investedand future revenues in these properties and could potentially remain obligated under any recourse debt associated with the property. Furthermore, we cannot be sure that the insurance companies will be able to continue to offer products with sufficient coverage at commercially reasonablerates. If we experience a loss that is uninsured or that exceeds insured limits with respect to one or more of our properties or if the insurance companies fail tomeet their coverage commitments to us in the event of an insured loss, then we could lose the capital invested in the damaged properties, as well as theanticipated future revenues from those properties and, if there
13

is recourse debt, then we would remain obligated for any mortgage debt or other financial obligations related to the properties. Any such losses or higherinsurance costs could adversely affe ct our business. Risks Related to Financing and Capital We may be unable to refinance our debt or our cash flow may be insufficient to make required debt payments. We are subject to risks normally associated with debt financing, including the risk that our cash flow will be insufficient to meet required payments of principaland interest. There can be no assurance that we will be able to refinance any maturing indebtedness, that such refinancing would be on terms as favorable asthe terms of the maturing indebtedness, or that we will be able to otherwise obtain funds by selling assets or raising equity to make required payments onmaturing indebtedness. If we are unable to refinance our indebtedness at maturity or meet our payment obligations, our business and financial condition will benegatively impacted and, if the maturing debt is secured, the lender may foreclose on the property securing such indebtedness. Our credit facilities and certainother debt bears interest at variable rates. Increases in interest rates would increase our interest expense under these agreements. Covenants in our credit agreements could limit our flexibility and breaches of these covenants could adversely affect our financial condition. The terms of our various credit agreements, including our credit facilities, the indentures under which our senior notes are issued and other note agreements,require us to comply with a number of customary financial covenants, such as maintaining debt service coverage, leverage ratios, fixed charge ratios and otheroperating covenants including maintaining insurance coverage. These covenants may limit our flexibility to run our business, and breaches of these covenantscould result in defaults under the instruments governing the applicable indebtedness. If we default under the covenant provisions and are unable to cure thedefault, refinance the indebtedness or meet payment obligations, our business and financial condition generally and, in particular, the amount of our distributablecash flow could be adversely affected. Adverse changes in our credit ratings could negatively affect our financing activity. The credit ratings of our senior unsecured notes and preferred stock are based on our operating performance, liquidity and leverage ratios, overall financialposition and other factors employed by the credit rating agencies in their rating analyses of us. Our credit ratings can affect the amount of capital we can access,as well as the terms and pricing of any debt we may incur. There can be no assurance that we will be able to maintain our current credit ratings, and in the eventour credit ratings are downgraded, we would likely incur higher borrowing costs and may encounter difficulty in obtaining additional financing. Also, a downgradein our credit ratings may trigger additional payments or other negative consequences under our credit facilities and other debt instruments. Adverse changes inour credit ratings could negatively impact our business and, in particular, our refinancing and other capital market activities, our ability to manage debt maturities,our future growth and our development and acquisition activity. At December 31, 2017, our credit ratings were A3 from Moody’s and A- from S&P, both with stable outlook. A securities rating is not a recommendation to buy,sell or hold securities and is subject to revision or withdrawal at any time by the rating organization. We depend on external sources of capital. To qualify as a REIT, we are required each year to distribute at least 90% of our REIT taxable income (determined without regard to the dividends-paiddeduction and by excluding any net capital gain) to our stockholders and we may be subject to tax to the extent our taxable income is not fully distributed.Historically, we have satisfied these distribution requirements by making cash distributions to our stockholders, but we may choose to satisfy these requirementsby making distributions of cash or other property, including, in limited circumstances, our own stock. For distributions with respect to taxable years that end on orbefore December 31, and in some cases declared as late as December 31, a REIT can satisfy up to 90% of the distribution requirements discussed abovethrough the distribution of shares of our stock if certain conditions are met. Assuming we continue to satisfy these distribution requirements with cash, we maynot be able to fund all future capital needs, including acquisition and development activities, from cash retained from operations and may have to rely on third-party sources of capital. Furthermore, to maintain our REIT status and not have to pay federal income and excise taxes, we may need to borrow funds on ashort-term basis to meet the REIT distribution requirements even if the then-prevailing market conditions are not favorable for these borrowings. These short-term borrowing needs could result from differences in timing between the actual receipt of cash and inclusion of income for federal income tax purposes, or theeffect of nondeductible capital expenditures, the creation of reserves or required debt or amortization payments. Our ability to access debt and equity capital onfavorable terms or at all depends on a number of factors, including general market conditions, the market’s perception of our growth potential, our current andpotential future earnings and cash distributions and the market price of our securities. Our stockholders may experience dilution if we issue additional common stock or units in the OP. Any additional future issuance of common stock or OP units will reduce the percentage of our common stock and units owned by investors. In mostcircumstances, stockholders and unitholders will not be entitled to vote on whether or not we issue additional common stock or units. In addition, depending onthe terms and pricing of any additional offering of our common stock or units and the value of the properties, our stockholders and unitholders may experiencedilution in both book value and fair value of their common stock or units.
14

Income Tax Risks The failure of Prologis, Inc. to qualify as a REIT would have serious adverse consequences. Prologis, Inc. elected to be taxed as a REIT under Sections 856 through 860 of the Internal Revenue Code commencing with the taxable year ended December31, 1997. We believe Prologis, Inc. has been organized and operated to qualify as a REIT under the Internal Revenue Code and believe that the currentorganization and method of operation comply with the rules and regulations promulgated under the Internal Revenue Code to enable Prologis, Inc. to continue toqualify as a REIT. However, it is possible that we are organized or have operated in a manner that would not allow Prologis, Inc. to qualify as a REIT, or that ourfuture operations could cause Prologis, Inc. to fail to qualify. Qualification as a REIT requires us to satisfy numerous requirements (some annually and others ona quarterly basis) established under highly technical and complex sections of the Internal Revenue Code for which there are only limited judicial andadministrative interpretations, and involves the determination of various factual matters and circumstances not entirely within our control. For example, to qualifyas a REIT, Prologis, Inc. must derive at least 95% of its gross income in any year from qualifying sources. In addition, Prologis, Inc. must pay dividends to itsstockholders aggregating annually at least 90% of its taxable income (determined without regard to the dividends paid deduction and by excluding capital gains)and must satisfy specified asset tests on a quarterly basis. The provisions of the Internal Revenue Code and applicable Treasury regulations regardingqualification as a REIT are more complicated for Prologis, Inc. because we hold assets through the OP. If Prologis, Inc. fails to qualify as a REIT in any taxable year, we will be required to pay federal income tax (including, for taxable years prior to 2018, anyapplicable alternative minimum tax) on taxable income at regular corporate rates. Unless we are entitled to relief under certain statutory provisions, Prologis, Inc.would be disqualified from treatment as a REIT for the four taxable years following the year in which it lost the qualification. If Prologis, Inc. lost its REIT status,our net earnings would be significantly reduced for each of the years involved. Furthermore, we own a direct or indirect interest in certain subsidiary REITs that elected to be taxed as REITs under Sections 856 through 860 of the InternalRevenue Code. Provided that each subsidiary REIT qualifies as a REIT, our interest in such subsidiary REIT will be treated as a qualifying real estate asset forpurposes of the REIT asset tests, and any dividend income or gains derived by us from such subsidiary REIT will generally be treated as income that qualifies forpurposes of the REIT 95% gross income test. To qualify as a REIT, the subsidiary REIT must independently satisfy all of the REIT qualification requirements. Ifsuch subsidiary REIT were to fail to qualify as a REIT, and certain relief provisions did not apply, it would be treated as a regular taxable corporation and itsincome would be subject to U.S. federal income tax. In addition, a failure of the subsidiary REIT to qualify as a REIT would have an adverse effect on the abilityof Prologis, Inc. to comply with the REIT income and asset tests, and thus its ability to qualify as a REIT. Certain property transfers may generate prohibited transaction income, resulting in a penalty tax on gain attributable to the transaction. From time to time, we may transfer or otherwise dispose of some of our properties, including by contributing properties to our co-investment ventures. Under theInternal Revenue Code, any gain resulting from transfers of properties we hold as inventory or primarily for sale to customers in the ordinary course of businessis treated as income from a prohibited transaction subject to a 100% penalty tax. We do not believe that our transfers or disposals of property or ourcontributions of properties into our co-investment ventures are prohibited transactions. However, whether property is held for investment purposes is a questionof fact that depends on all the facts and circumstances surrounding the particular transaction. The Internal Revenue Service may contend that certain transfersor dispositions of properties by us or contributions of properties into our co-investment ventures are prohibited transactions. While we believe that the InternalRevenue Service would not prevail in any such dispute, if the Internal Revenue Service were to argue successfully that a transfer, disposition or contribution ofproperty constituted a prohibited transaction, we would be required to pay a 100% penalty tax on any gain allocable to us from the prohibited transaction. Inaddition, income from a prohibited transaction might adversely affect our ability to satisfy the income tests for qualification as a REIT. Legislative or regulatory action could adversely affect us. In recent years, numerous legislative, judicial and administrative changes have been made to the U.S. and foreign income tax laws applicable to investments inreal estate, REITs, similar entities and investments. Additional changes are likely to continue to occur in the future, both in and outside of the U.S. and mayimpact our taxation or that of our stockholders. New tax legislation was enacted on December 22, 2017 and provides for significant changes to the U.S. federalincome tax laws, including the reduction of the corporate tax rate, a reduction or elimination of certain deductions (including new limitations on the deductibility ofinterest expense) and significant changes in the taxation of earnings from non-U.S. sources. Some of these changes could have an adverse impact on us, ourbusiness, and the results of our operations. The new rules are complex and lack developed administrative guidance; thus, the impact of certain aspects of theseprovisions on us is currently unclear. Technical corrections or other amendments to the new rules, and administrative guidance interpreting the new rules, maybe forthcoming at any time or may be significantly delayed. ITEM 1B. Unresolved Staff Comments None.
15

ITEM 2. Pr operties GEOGRAPHIC DISTRIBUTION We predominately invest in logistics facilities. Our properties are typically used for distribution, storage, packaging, assembly and light manufacturing ofconsumer products. The vast majority of our operating properties are used by our customers for bulk distribution. The following tables provide details of our consolidated operating properties, investment in land and development portfolio. We have also included operatingproperty information for our owned and managed portfolio. The owned and managed portfolio includes the properties we consolidate and the properties ownedby our unconsolidated co-investment ventures reflected at 100% of the amount included in the ventures’ financial statements as calculated on a GAAP basis, notour proportionate share. Included in the operating property information below for our consolidated operating properties are 404 buildings owned primarily by one co-investment venturethat we consolidate but of which we own less than 100% of the equity. No individual property or group of properties operating as a single business unit amountedto 10% or more of our consolidated total assets at December 31, 2017, or generated income equal to 10% or more of our consolidated gross revenues for theyear ended December 31, 2017. Dollars and square feet in the following tables are in millions and items notated by ‘0‘ indicate an amount that rounds to less than one million: Consolidated Operating Properties Owned and Managed
Region Rentable Square
Footage Gross Book
Value Encumbrances (1) Rentable Square
Footage Gross Book
Value U.S.: Atlanta 15 $ 710 $ 76 18 $ 872 Baltimore/Washington D.C. 4 327 30 7 679 Central and Eastern Pennsylvania 14 917 - 17 1,115 Central Valley California 10 573 11 12 725 Chicago 28 1,894 50 36 2,481 Dallas/Fort Worth 21 1,121 132 26 1,538 Houston 7 425 20 14 916 Las Vegas 7 511 18 8 629 New Jersey/New York City 26 2,553 167 32 3,286 San Francisco Bay Area 16 1,737 10 20 2,095 Seattle 9 856 42 16 1,571 South Florida 9 1,026 34 15 1,541 Southern California 56 5,411 106 73 7,160 Remaining Markets - U.S. (17 markets) (2) 46 2,340 126 62 3,292 Subtotal U.S. 268 20,401 822 356 27,900
Other Americas: Brazil 7 517 - 10 718 Canada 9 745 156 9 745 Mexico 2 113 - 36 2,165 Subtotal Other Americas 18 1,375 156 55 3,628
Europe: Belgium - - - 3 208 Czech Republic - - - 11 822 France 1 64 - 33 2,551 Germany 1 50 - 24 2,003 Hungary 0 4 - 7 443 Italy - - - 9 576 Netherlands 0 24 - 19 1,675 Poland 1 62 - 25 1,572 Slovakia 0 12 - 4 254 Spain 1 60 - 9 697 Sweden 1 47 - 5 420 U.K. 1 79 - 23 3,214 Subtotal Europe 6 402 - 172 14,435
Asia: China 1 43 - 15 774 Japan 3 340 - 29 4,965 Singapore 1 140 - 1 140 Subtotal Asia 5 523 - 45 5,879
Total operating portfolio (3) 297 22,701 978 628 51,842 Value-added properties (4) 2 181 - 2 245
Total operating properties 299 $ 22,882 $ 978 630 $ 52,087
16
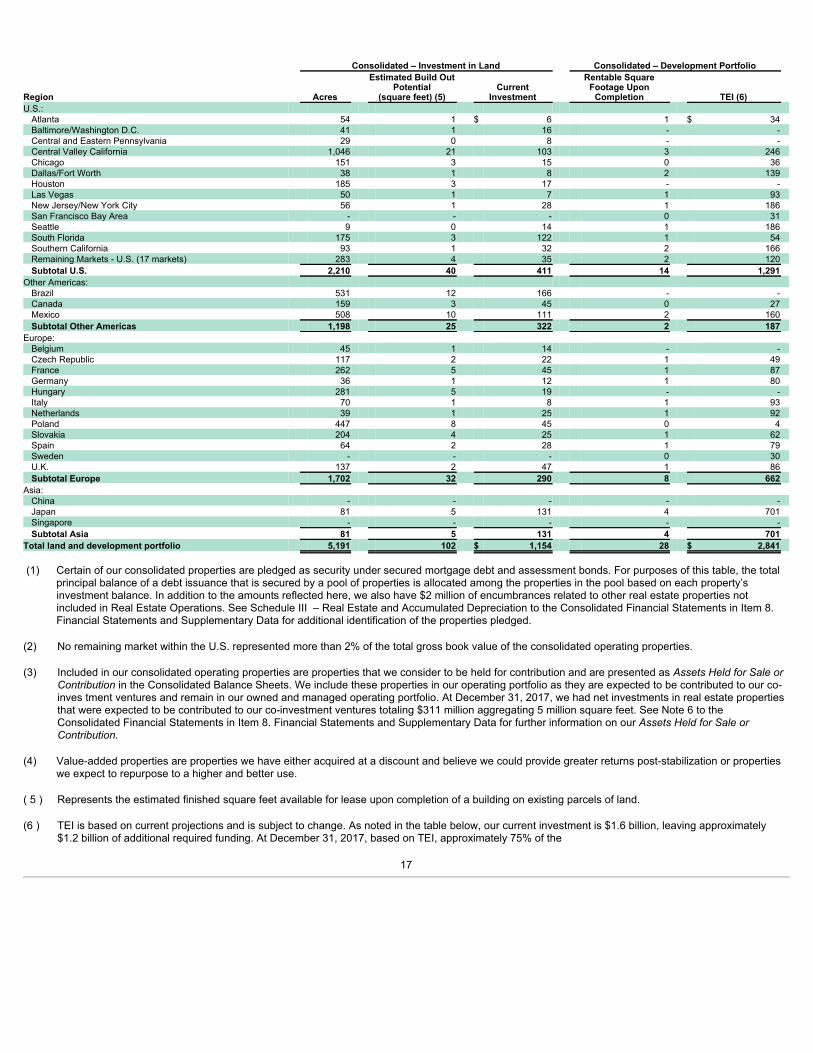
Consolidated – Investment in Land Consolidated – Development Portfolio
Region Acres
Estimated Build OutPotential
(square feet) (5) Current
Investment
Rentable SquareFootage Upon
Completion TEI (6) U.S.: Atlanta 54 1 $ 6 1 $ 34 Baltimore/Washington D.C. 41 1 16 - - Central and Eastern Pennsylvania 29 0 8 - - Central Valley California 1,046 21 103 3 246 Chicago 151 3 15 0 36 Dallas/Fort Worth 38 1 8 2 139 Houston 185 3 17 - - Las Vegas 50 1 7 1 93 New Jersey/New York City 56 1 28 1 186 San Francisco Bay Area - - - 0 31 Seattle 9 0 14 1 186 South Florida 175 3 122 1 54 Southern California 93 1 32 2 166 Remaining Markets - U.S. (17 markets) 283 4 35 2 120 Subtotal U.S. 2,210 40 411 14 1,291
Other Americas: Brazil 531 12 166 - - Canada 159 3 45 0 27 Mexico 508 10 111 2 160 Subtotal Other Americas 1,198 25 322 2 187
Europe: Belgium 45 1 14 - - Czech Republic 117 2 22 1 49 France 262 5 45 1 87 Germany 36 1 12 1 80 Hungary 281 5 19 - - Italy 70 1 8 1 93 Netherlands 39 1 25 1 92 Poland 447 8 45 0 4 Slovakia 204 4 25 1 62 Spain 64 2 28 1 79 Sweden - - - 0 30 U.K. 137 2 47 1 86 Subtotal Europe 1,702 32 290 8 662
Asia: China - - - - - Japan 81 5 131 4 701 Singapore - - - - - Subtotal Asia 81 5 131 4 701
Total land and development portfolio 5,191 102 $ 1,154 28 $ 2,841
(1) Certain of our consolidated properties are pledged as security under secured mortgage debt and assessment bonds. For purposes of this table, the totalprincipal balance of a debt issuance that is secured by a pool of properties is allocated among the properties in the pool based on each property’sinvestment balance. In addition to the amounts reflected here, we also have $2 million of encumbrances related to other real estate properties notincluded in Real Estate Operations. See Schedule III – Real Estate and Accumulated Depreciation to the Consolidated Financial Statements in Item 8.Financial Statements and Supplementary Data for additional identification of the properties pledged.
(2) No remaining market within the U.S. represented more than 2% of the total gross book value of the consolidated operating properties. (3) Included in our consolidated operating properties are properties that we consider to be held for contribution and are presented as Assets Held for Sale or
Contribution in the Consolidated Balance Sheets. We include these properties in our operating portfolio as they are expected to be contributed to our co-inves tment ventures and remain in our owned and managed operating portfolio. At December 31, 2017, we had net investments in real estate propertiesthat were expected to be contributed to our co-investment ventures totaling $311 million aggregating 5 million square feet. See Note 6 to theConsolidated Financial Statements in Item 8. Financial Statements and Supplementary Data for further information on our Assets Held for Sale orContribution.
(4) Value-added properties are properties we have either acquired at a discount and believe we could provide greater returns post-stabilization or properties
we expect to repurpose to a higher and better use. ( 5 ) Represents the estimated finished square feet available for lease upon completion of a building on existing parcels of land. (6 ) TEI is based on current projections and is subject to change. As noted in the table below, our current investment is $1.6 billion, leaving approximately
$1.2 billion of additional required funding. At December 31, 2017, based on TEI, approximately 75% of the
17

properties under development in the development portfolio were expected to be completed by December 31, 2018, and approximately 22% of theproperties in the development portfolio were already completed but not yet stabilized. The r emainder of ou r properties under development we reexpected to be completed before July 2019 .
The following table summarizes our investment in consolidated real estate properties at December 31, 2017 (in millions):
Investment Before
Depreciation Operating properties, excluding assets held for sale or contribution $ 22,586 Development portfolio, including cost of land 1,594 Land 1,154 Other real estate investments (1) 505 Total consolidated real estate properties $ 25,839
(1) Included in other real estate investments were: (i) non-logistics real estate; (ii) land parcels that are ground leased to third parties; (iii) our corporate office
buildings; (iv) costs related to future development projects, including purchase options on land; (v) infrastructure costs related to projects we aredeveloping on behalf of others; and (vi) earnest money deposits associated with potential acquisitions.
LEASE EXPIRATIONS We generally lease our properties on a long-term basis (the average term for leases signed in 2017 was 54 months). The following table summarizes the leaseexpirations of our consolidated operating portfolio for leases in place at December 31, 2017 (dollars and square feet in millions): NER
Number of
Leases Occupied
Square Feet Dollars Percent of
Total Dollars Per
Square Foot 2018 566 31 $ 168 10.6% $ 5.34 2019 639 47 231 14.6% 4.92 2020 607 33 182 11.5% 5.55 2021 585 44 237 14.9% 5.42 2022 517 42 236 14.8% 5.60 2023 243 25 142 9.0% 5.79 2024 118 13 80 5.1% 6.05 2025 87 14 85 5.3% 5.98 2026 35 7 46 2.9% 6.46 2027 57 9 54 3.4% 6.03 Thereafter 55 20 126 7.9% 6.42 3,509 285 $ 1,587 100.0% $ 5.57 Month to month 107 4 Total Consolidated 3,616 289
18

CO-INVESTMENT VENTURES Included in our owned and managed portfolio are consolidated and unconsolidated co-investment ventures that hold investments in real estate properties,primarily logistics facilities that we also manage. Our unconsolidated co-investment ventures are accounted for under the equity method. The amounts includedfor the unconsolidated ventures are reflected at 100% of the amount included in the ventures’ financial statements as calculated on a GAAP basis, not ourproportionate share. The following table summarizes our consolidated and unconsolidated co-investment ventures at December 31, 2017 (in millions): Operating Properties
Square Feet Gross
Book Value Investment
in Land DevelopmentPortfolio – TEI
Consolidated Co-Investment Ventures U.S.: Prologis U.S. Logistics Venture (“USLV”) 67 $ 5,931 $ 31 $ 106 Total 67 $ 5,931 $ 31 $ 106 Unconsolidated Co-Investment Ventures U.S.: Prologis Targeted U.S. Logistics Fund (“USLF”) 88 $ 7,543 $ - $ 34 Other Americas: FIBRA Prologis 35 2,052 4 - Europe: Prologis European Logistics Fund (“PELF”) 106 9,565 11 59 Prologis European Logistics Partners Sàrl (“PELP”) 58 4,203 30 6 Prologis UK Logistics Venture (“UKLV”) 2 285 110 220 Subtotal Europe 166 14,053 151 285
Asia: Nippon Prologis REIT (“NPR”) 26 4,625 - - Prologis China Logistics Venture 14 731 80 879 Subtotal Asia 40 5,356 80 879
Other: Brazil joint ventures 3 201 - -
Total 332 $ 29,205 $ 235 $ 1,198
For more information regarding our unconsolidated and consolidated co-investment ventures, see Notes 5 and 12 to the Consolidated Financial Statements inItem 8. Financial Statements and Supplementary Data. ITEM 3. Legal Proceedings From time to time, we and our co-investment ventures are parties to a variety of legal proceedings arising in the ordinary course of business. We believe that,with respect to any such matters to which we are currently a party, the ultimate disposition of any such matter will not result in a material adverse effect on ourbusiness, financial position or results of operations. ITEM 4. Mine Safety Disclosures Not Applicable.
19

PART II ITEM 5. Market for Registrant’s Common Equity, Related Stockholder Matters and Issuer Purchases of Equity Securities MARKET INFORMATION AND HOLDERS Our common stock is listed on the NYSE under the symbol “PLD.” The following table sets forth the high and low sale price of our common stock, as reported inthe NYSE Composite Tape, and the declared dividends per share, for the periods indicated. High Low Dividends 2017 Fourth Quarter $ 67.53 $ 62.99 $ 0.44 Third Quarter $ 65.49 $ 56.59 $ 0.44 Second Quarter $ 59.49 $ 51.66 $ 0.44 First Quarter $ 54.25 $ 48.33 $ 0.44
2016 Fourth Quarter $ 53.51 $ 45.93 $ 0.42 Third Quarter $ 54.87 $ 48.46 $ 0.42 Second Quarter $ 50.74 $ 43.45 $ 0.42 First Quarter $ 44.26 $ 35.25 $ 0.42
Our future common stock dividends, if and as declared, may vary and will be determined by the Board upon the circumstances prevailing at the time, includingour financial condition, operating results, estimated taxable income and REIT distribution requirements. These dividends, if and as declared, may be adjusted atthe discretion of the Board during the year. On February 12, 2018, we had approximately 533,054,000 shares of common stock outstanding, which were held of record by approximately 4,400stockholders. Stock Performance Graph The following line graph compares the change in Prologis, Inc. cumulative total stockholder’s return on shares of its common stock from December 31, 2012, tothe cumulative total return of the S&P 500 Stock Index and the Financial Times and Stock Exchange NAREIT Equity REITs Index from December 31, 2012, toDecember 31, 2017. The graph assumes an initial investment of $100 in our common stock and each of the indices on December 31, 2012, and, as required bythe SEC, the reinvestment of all dividends. The return shown on the graph is not necessarily indicative of future performance.
20

This graph and the accompanying text are not “soliciting material,” are not deemed filed with the SEC and are not to be incorporated by reference in any filing bythe C ompany under the Securities Act of 1933, as amended, or the Securities Exchange Act of 1934, as amended, whether made before or after the datehereof and irrespective of any general incorporation language in any such filing. PREFERRED STOCK DIVIDENDS At December 31, 2017, and 2016, we had 1.4 million and 1.6 million shares of the Series Q preferred stock with a liquidation preference of $50 per share.Dividends payable per share were $4.27 for the years ended December 31, 2017, and 2016. For more information regarding dividends, see Note 10 to the Consolidated Financial Statements in Item 8. Financial Statements and Supplementary Data. SALES OF UNREGISTERED SECURITIES During 2017, we issued an aggregate of 1.5 million shares of common stock of Prologis, Inc. in connection with the redemption of common units of Prologis, L.P.See Note 11 to the Consolidated Financial Statements in Item 8. Financial Statements and Supplementary Data for more information. The issuance of theshares of common stock was undertaken in reliance upon the exemption from registration requirements of the Securities Act of 1933, as amended, afforded bySection 4(a)(2) thereof. SECURITIES AUTHORIZED FOR ISSUANCE UNDER EQUITY COMPENSATION PLANS For information regarding securities authorized for issuance under our equity compensation plans, see Notes 10 and 13 to the Consolidated FinancialStatements in Item 8. Financial Statements and Supplementary Data. OTHER STOCKHOLDER MATTERS Common Stock Plans Further information relative to our equity compensation plans will be provided in our 2018 Proxy Statement or in an amendment filed on Form 10-K/A. ITEM 6. Selected Financial Data The following table summarizes selected financial data related to our historical financial condition and results of operations for both Prologis, Inc. and Prologis,L.P. (in millions, except for per share and unit amounts): 2017 2016 2015 2014 2013 Operating Data: Total revenues $ 2,618 $ 2,533 $ 2,197 $ 1,761 $ 1,750 Gains on dispositions of investments in real estate and revaluation of equity investments upon acquisition of a controlling interest, net $ 1,183 $ 757 $ 759 $ 726 $ 715 Consolidated net earnings $ 1,761 $ 1,293 $ 926 $ 739 $ 230 Net earnings per share attributable to common stockholders and unitholders – Basic (1) $ 3.10 $ 2.29 $ 1.66 $ 1.25 $ 0.65 Net earnings per share attributable to common stockholders and unitholders – Diluted (1) $ 3.06 $ 2.27 $ 1.64 $ 1.24 $ 0.64 Dividends per common share and distributions per common unit $ 1.76 $ 1.68 $ 1.52 $ 1.32 $ 1.12
Consolidated Balance Sheet Data: Total assets $ 29,481 $ 30,250 $ 31,395 $ 25,775 $ 24,534 Total debt $ 9,413 $ 10,608 $ 11,627 $ 9,337 $ 8,973
FFO (2): Reconciliation of net earnings to FFO: Net earnings attributable to common stockholders $ 1,642 $ 1,203 $ 863 $ 622 $ 315 Total NAREIT defined adjustments 101 534 461 299 504 Total our defined adjustments 52 (35) (15) (33) 36
FFO, as modified by Prologis (2) $ 1,795 $ 1,702 $ 1,309 $ 888 $ 855 Total core defined adjustments (244) (302) (128) 65 (42)
Core FFO (2) $ 1,551 $ 1,400 $ 1,181 $ 953 $ 813
(1) In 2014, the accounting standard changed for classifying and reporting discontinued operations and none of our dispositions since adoption met the
qualifications to be reported as discontinued operations. In 2013, our net earnings per share attributable to common stockholders and unitholders forbasic and diluted included $0.25 per share attributable to discontinued operations.
21

(2) FFO; FFO, as modified by Prologis and Core FFO are non-GAAP measures. See Item 7. Management’s Discussion and Analysis of Financial Condition
and Results of Operations for our definition of FFO measures and a complete reconciliati on to net earnings. ITEM 7. Management’s Discussion and Analysis of Financial Condition and Results of Operations The following discussion should be read in conjunction with the Consolidated Financial Statements included in Item 8. Financial Statements and SupplementaryData of this report and the matters described under Item 1A. Risk Factors. MANAGEMENT’S OVERVIEW Summary of 2017 During the year ended December 31, 2017, operating fundamentals remained strong for our owned and managed portfolio and we ended the year withoccupancy of 97.2%. See below for the results of our two business segments and details of operating activity of our owned and managed portfolio. In 2017, we completed the following significant activities as further described in the accompanying notes to the Consolidated Financial Statements: • We completed several transactions that repositioned our portfolio and streamlined our co-investment ventures, including:
o In January, we sold our investment in Europe Logistics Venture 1 (“ELV”) to our venture partner for $84 million and ELV contributed its properties
to Prologis Targeted Europe Logistics Fund (“PTELF”) in exchange for equity interests.
o In February, we formed UKLV, in which we have a 15.0% ownership interest. This unconsolidated co-investment venture was formed forinvestment in the U.K. and currently holds stabilized properties, properties under development and land.
o In March, we acquired our remaining partner’s interest in Prologis North American Industrial Fund (“NAIF”), a consolidated co-investment
venture, for $710 million. In July, we contributed 190 operating properties owned by NAIF to USLF. We received cash proceeds and additionalunits, which increased our ownership interest to 27.1%, and USLF assumed secured debt.
o In March, we purchased our venture partner’s interest in the Prologis Brazil Logistics Partners Fund I (“Brazil Fund”), a consolidated co-
investment venture, for $80 million to own 100% of the venture. In August, we acquired our partner’s interest in certain unconsolidated jointventures in Brazil for an aggregate price of R$1.2 billion ($382 million). As a result of these transactions, we consolidate the majority of ourinvestments in Brazil.
o In October, the assets and related liabilities of PTELF were contributed to Prologis European Properties Fund II (“PEPF II”) in exchange for units,and PEPF II was renamed PELF. In connection with the transaction, we exchanged our units in PTELF for new units in PELF resulting in ourownership interest decreasing to 25.6%, however, our economic investment did not substantially change.
o As a result of these activities, we had eight unconsolidated co-investment ventures at December 31, 2017.
o In addition to the transactions discussed above, we also contributed properties to existing co-investment ventures in Europe, Japan and Mexicoand we disposed of non-strategic operating properties to third parties, primarily in the U.S.
o These transactions generated proceeds of $4.5 billion and realized net gains of $1.2 billion. • In February, we amended our Japanese yen revolver and increased the total borrowing capacity to ¥50.0 billion ($444 million at December 31, 2017). • In June, we issued £500 million ($645 million) of senior notes with an effective interest rate of 2.3%, maturing in June 2029, at 99.9% of par value.
Following the issuance, we used the cash proceeds to redeem $618 million of previously issued senior notes, maturing in 2019, with an average couponrate of 5.4%.
RESULTS OF OPERATIONS We evaluate our business operations based on the NOI of our two operating segments: Real Estate Operations and Strategic Capital. NOI by segment is a non-GAAP financial measure that is calculated using revenues and expenses directly from our financial statements. We consider NOI by segment to be anappropriate supplemental measure of our performance because it helps management and investors understand the core operations of our real estate assets.
22

Below is a reconciliation of our NOI by segment to Operating Income per the Consolidated Financial Statements (in millions). Each segment’s N OI is reconciledto a line item in the Consolidated Financial Statements in the respective segment discussion below. 2017 2016 2015 Real Estate Operations – NOI $ 1,662 $ 1,646 $ 1,368 Strategic Capital – NOI 219 175 109 General and administrative expenses (231) (222) (217)Depreciation and amortization expenses (879) (931) (880)Operating income $ 771 $ 668 $ 380
See Note 18 to the Consolidated Financial Statements for more information on our segments and a reconciliation of each business segment’s NOI to OperatingIncome and Earnings Before Income Taxes. Real Estate Operations This operating segment principally includes rental revenues, rental recoveries and rental expenses recognized from our consolidated properties. We allocate thecosts of our property management functions to the Real Estate Operations segment through Rental Expenses and the Strategic Capital segment throughStrategic Capital Expenses based on the square footage of the relative portfolios as compared to our total owned and managed portfolio. The operatingfundamentals in the markets in which we operate continue to be strong, which has driven rents higher, kept occupancies high and has fueled developmentactivity. This segment is impacted by our development, acquisition and disposition activities. Below are the components of Real Estate Operations revenues, expenses and NOI (in millions), derived directly from line items in the Consolidated FinancialStatements. 2017 2016 2015 Rental revenues $ 1,738 $ 1,735 $ 1,536 Rental recoveries 487 486 437 Development management and other revenues 19 8 6 Rental expenses (570) (569) (544)Other expenses (12) (14) (67)Real Estate Operations – NOI $ 1,662 $ 1,646 $ 1,368
The change in Real Estate Operations NOI during these periods were impacted by the following items (in millions of dollars):
(1) The impact from acquisitions in 2016 from 2015 was primarily due to the acquisition of the real estate assets and operating platform of KTR Capital
Partners and its affiliates (“KTR”) in May 2015, which generated an additional $152 million of net revenues, including a decrease of $25 million inacquisition costs, in 2016. Approximately 45% of KTR activity is offset in Net Earnings Attributable to Noncontrolling Interests for our venture partner’sshare. See Note 3 in the Consolidated Financial Statements for further detail on the KTR transaction.
(2) During these periods, we experienced increased occupancy and positive rent rate growth. Rent rate growth (or rent change) is a combination of the
rollover of existing leases and increases in certain rental rates from contractual rent increases on existing leases. If a lease has a contractual rentincrease that is not known at the time the lease is signed, such as the consumer price index or a similar metric, the rent increase is not included in rentleveling and therefore, would impact the rental revenues we recognize. See below for key metrics on occupancy and rent change on rollover for theconsolidated operating portfolio.
(3) A developed property moves into the operating portfolio when it meets stabilization. The property is considered stabilized when a development project has
been completed for one year or at least 90% occupied, whichever occurs first. During these periods, NOI increased as developments stabilized. Seebelow for key metrics on our development stabilizations for our consolidated properties.
23

(4) Contribution and disposition activity increased in 2017, compared to 2016, primarily due to the contribution of the NAIF operating properties to USLF. (5) Other items include property tax expense recoveries, noncash adjustments for the amortization of above or below market leases, non-recoverable
expenses, termination fees and changes in foreign currency exchange rates. Below are key operating metrics of our consolidated operating portfolio over the last three years:
Development Start Activity The following table summarizes consolidated development starts (dollars and square feet in millions): 2017 (1) 2016 2015 Number of new development projects during the period 74 73 62 Estimated build out potential (square feet) 25 22 18 TEI $ 2,261 $ 1,754 $ 1,643 Percentage of build-to-suits based on TEI 48.5% 42.2% 47.2% (1) We expect our properties under development at December 31, 2017, to be completed before July 2019. Development Stabilization Activity The following table summarizes consolidated development stabilization activity (dollars and square feet in millions): 2017 2016 2015 Number of development projects stabilized during the period 76 75 63 Square feet upon completion 24 27 21 TEI $ 1,949 $ 2,178 $ 1,595 Weighted average expected yield on TEI (1) 6.5% 6.6% 7.2%Estimated value at completion $ 2,509 $ 2,723 $ 2,109 Estimated weighted average margin 28.8% 25.0% 32.2% (1) We calculate the weighted average expected yield on TEI as estimated NOI assuming stabilized occupancy divided by TEI. For information on our development portfolio at December 31, 2017, see Item 2. Properties.
24
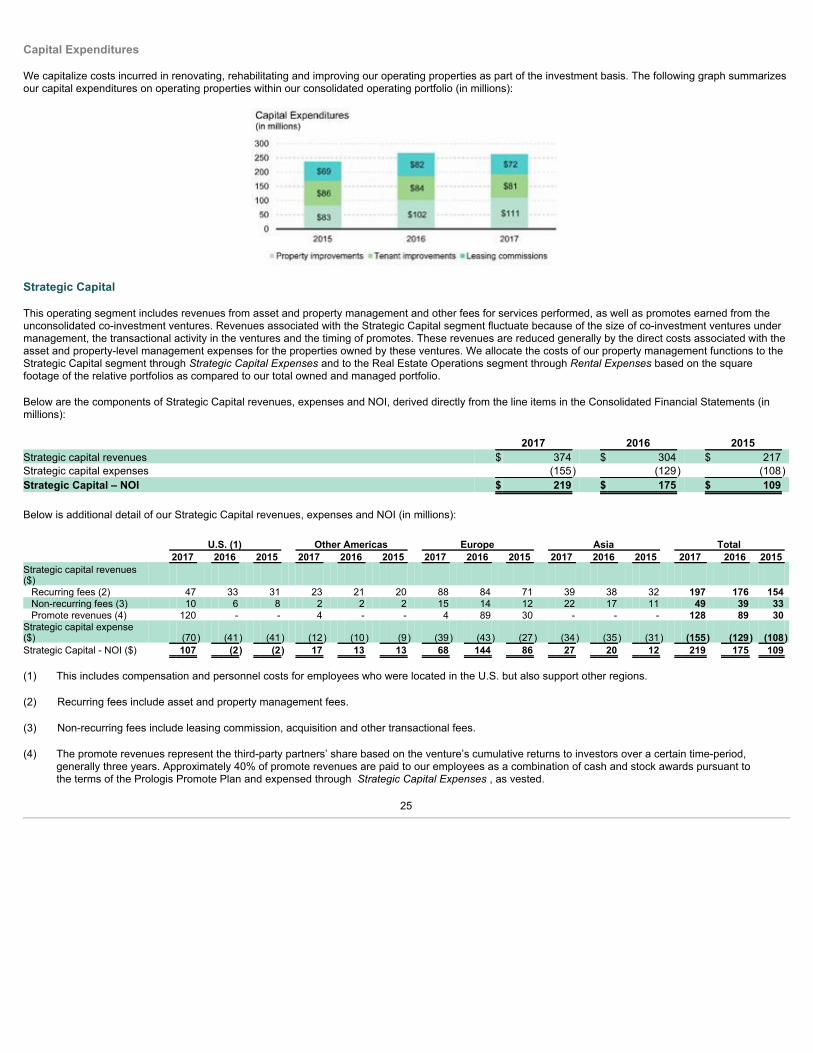
Capital Expenditures We capitalize costs incurred in renovating, rehabilitating and improving our operating properties as part of the investment basis. The following graph summarizesour capital expenditures on operating properties within our consolidated operating portfolio (in millions):
Strategic Capital This operating segment includes revenues from asset and property management and other fees for services performed, as well as promotes earned from theunconsolidated co-investment ventures. Revenues associated with the Strategic Capital segment fluctuate because of the size of co-investment ventures undermanagement, the transactional activity in the ventures and the timing of promotes. These revenues are reduced generally by the direct costs associated with theasset and property-level management expenses for the properties owned by these ventures. We allocate the costs of our property management functions to theStrategic Capital segment through Strategic Capital Expenses and to the Real Estate Operations segment through Rental Expenses based on the squarefootage of the relative portfolios as compared to our total owned and managed portfolio. Below are the components of Strategic Capital revenues, expenses and NOI, derived directly from the line items in the Consolidated Financial Statements (inmillions): 2017 2016 2015 Strategic capital revenues $ 374 $ 304 $ 217 Strategic capital expenses (155) (129) (108)Strategic Capital – NOI $ 219 $ 175 $ 109
Below is additional detail of our Strategic Capital revenues, expenses and NOI (in millions):
U.S. (1) Other Americas Europe Asia Total 2017 2016 2015 2017 2016 2015 2017 2016 2015 2017 2016 2015 2017 2016 2015
Strategic capital revenues($) Recurring fees (2) 47 33 31 23 21 20 88 84 71 39 38 32 197 176 154 Non-recurring fees (3) 10 6 8 2 2 2 15 14 12 22 17 11 49 39 33 Promote revenues (4) 120 - - 4 - - 4 89 30 - - - 128 89 30
Strategic capital expense($) (70) (41) (41) (12) (10) (9) (39) (43) (27) (34) (35) (31) (155) (129) (108)Strategic Capital - NOI ($) 107 (2) (2) 17 13 13 68 144 86 27 20 12 219 175 109
(1) This includes compensation and personnel costs for employees who were located in the U.S. but also support other regions. (2) Recurring fees include asset and property management fees. (3) Non-recurring fees include leasing commission, acquisition and other transactional fees. (4) The promote revenues represent the third-party partners’ share based on the venture’s cumulative returns to investors over a certain time-period,
generally three years. Approximately 40% of promote revenues are paid to our employees as a combination of cash and stock awards pursuant tothe terms of the Prologis Promote Plan and expensed through Strategic Capital Expenses , as vested.
25
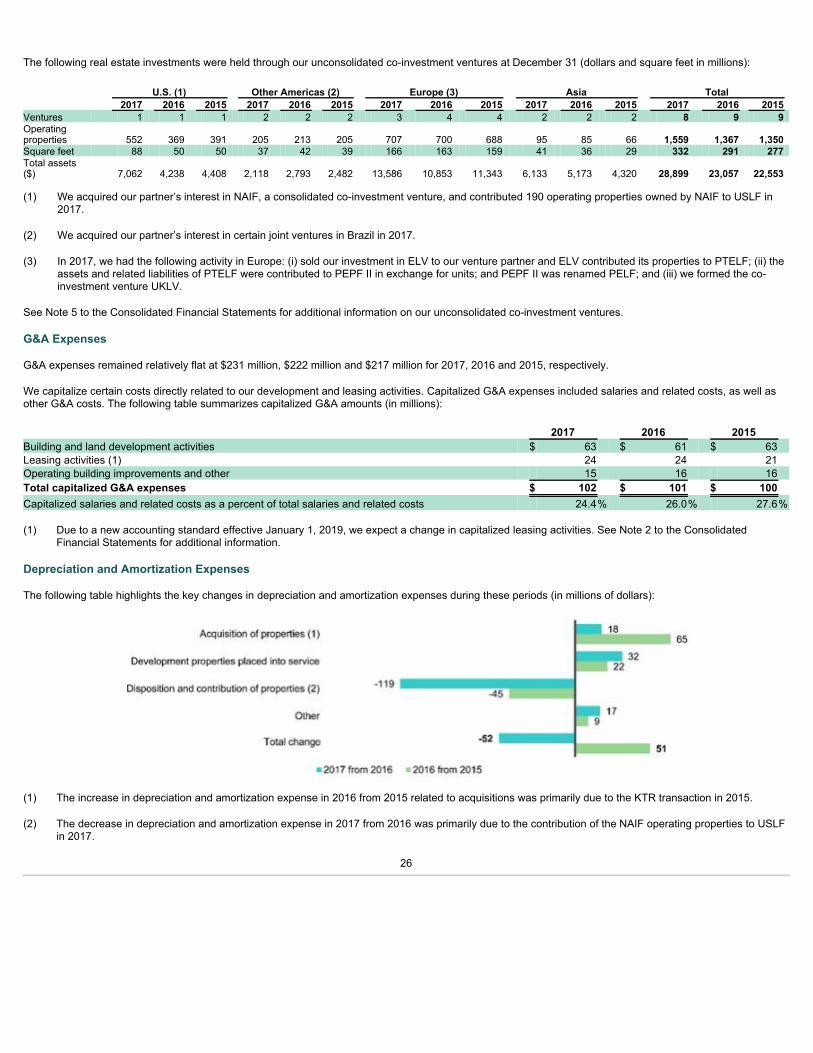
The following real estate investments were held through our unconsolidated co-investment ventures at December 31 (dollars and square feet in millions):
U.S. (1) Other Americas (2) Europe (3) Asia Total 2017 2016 2015 2017 2016 2015 2017 2016 2015 2017 2016 2015 2017 2016 2015
Ventures 1 1 1 2 2 2 3 4 4 2 2 2 8 9 9 Operatingproperties 552 369 391 205 213 205 707 700 688 95 85 66 1,559 1,367 1,350 Square feet 88 50 50 37 42 39 166 163 159 41 36 29 332 291 277 Total assets($) 7,062 4,238 4,408 2,118 2,793 2,482 13,586 10,853 11,343 6,133 5,173 4,320 28,899 23,057 22,553
(1) We acquired our partner’s interest in NAIF, a consolidated co-investment venture, and contributed 190 operating properties owned by NAIF to USLF in2017.
(2) We acquired our partner’s interest in certain joint ventures in Brazil in 2017. (3) In 2017, we had the following activity in Europe: (i) sold our investment in ELV to our venture partner and ELV contributed its properties to PTELF; (ii) the
assets and related liabilities of PTELF were contributed to PEPF II in exchange for units; and PEPF II was renamed PELF; and (iii) we formed the co-investment venture UKLV.
See Note 5 to the Consolidated Financial Statements for additional information on our unconsolidated co-investment ventures. G&A Expenses G&A expenses remained relatively flat at $231 million, $222 million and $217 million for 2017, 2016 and 2015, respectively. We capitalize certain costs directly related to our development and leasing activities. Capitalized G&A expenses included salaries and related costs, as well asother G&A costs. The following table summarizes capitalized G&A amounts (in millions): 2017 2016 2015 Building and land development activities $ 63 $ 61 $ 63 Leasing activities (1) 24 24 21 Operating building improvements and other 15 16 16 Total capitalized G&A expenses $ 102 $ 101 $ 100 Capitalized salaries and related costs as a percent of total salaries and related costs 24.4% 26.0% 27.6% (1) Due to a new accounting standard effective January 1, 2019, we expect a change in capitalized leasing activities. See Note 2 to the Consolidated
Financial Statements for additional information. Depreciation and Amortization Expenses The following table highlights the key changes in depreciation and amortization expenses during these periods (in millions of dollars):
(1) The increase in depreciation and amortization expense in 2016 from 2015 related to acquisitions was primarily due to the KTR transaction in 2015. (2) The decrease in depreciation and amortization expense in 2017 from 2016 was primarily due to the contribution of the NAIF operating properties to USLF
in 2017.
26
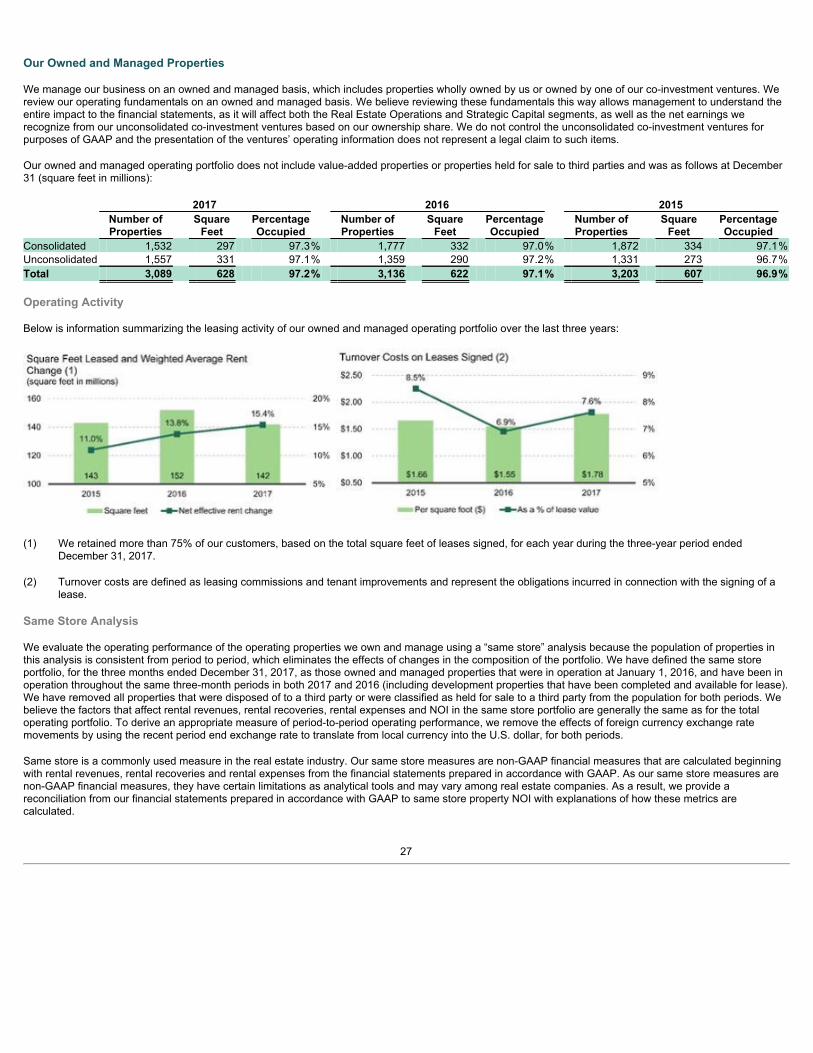
Our Owned and Managed Properties We manage our business on an owned and managed basis, which includes properties wholly owned by us or owned by one of our co-investment ventures. Wereview our operating fundamentals on an owned and managed basis. We believe reviewing these fundamentals this way allows management to understand theentire impact to the financial statements, as it will affect both the Real Estate Operations and Strategic Capital segments, as well as the net earnings werecognize from our unconsolidated co-investment ventures based on our ownership share. We do not control the unconsolidated co-investment ventures forpurposes of GAAP and the presentation of the ventures’ operating information does not represent a legal claim to such items. Our owned and managed operating portfolio does not include value-added properties or properties held for sale to third parties and was as follows at December31 (square feet in millions):
2017 2016 2015
Number ofProperties
SquareFeet
PercentageOccupied
Number ofProperties
SquareFeet
PercentageOccupied
Number ofProperties
SquareFeet
PercentageOccupied
Consolidated 1,532 297 97.3% 1,777 332 97.0% 1,872 334 97.1%Unconsolidated 1,557 331 97.1% 1,359 290 97.2% 1,331 273 96.7%Total 3,089 628 97.2% 3,136 622 97.1% 3,203 607 96.9% Operating Activity Below is information summarizing the leasing activity of our owned and managed operating portfolio over the last three years:
(1) We retained more than 75% of our customers, based on the total square feet of leases signed, for each year during the three-year period ended
December 31, 2017. (2) Turnover costs are defined as leasing commissions and tenant improvements and represent the obligations incurred in connection with the signing of a
lease. Same Store Analysis We evaluate the operating performance of the operating properties we own and manage using a “same store” analysis because the population of properties inthis analysis is consistent from period to period, which eliminates the effects of changes in the composition of the portfolio. We have defined the same storeportfolio, for the three months ended December 31, 2017, as those owned and managed properties that were in operation at January 1, 2016, and have been inoperation throughout the same three-month periods in both 2017 and 2016 (including development properties that have been completed and available for lease).We have removed all properties that were disposed of to a third party or were classified as held for sale to a third party from the population for both periods. Webelieve the factors that affect rental revenues, rental recoveries, rental expenses and NOI in the same store portfolio are generally the same as for the totaloperating portfolio. To derive an appropriate measure of period-to-period operating performance, we remove the effects of foreign currency exchange ratemovements by using the recent period end exchange rate to translate from local currency into the U.S. dollar, for both periods. Same store is a commonly used measure in the real estate industry. Our same store measures are non-GAAP financial measures that are calculated beginningwith rental revenues, rental recoveries and rental expenses from the financial statements prepared in accordance with GAAP. As our same store measures arenon-GAAP financial measures, they have certain limitations as analytical tools and may vary among real estate companies. As a result, we provide areconciliation from our financial statements prepared in accordance with GAAP to same store property NOI with explanations of how these metrics arecalculated.
27

We evaluate the results of our same store portfolio on a quarterly basis. The following is a reconciliation of our consolidated rental revenues, rental recoveries,rental expenses and property NOI for each quarter in 2017 and 2016 to the full year, as included in the Consolidated Statements of Income and within Note 20 tothe Co nsolidated Financial Statements and to the respective amounts in our same store portfolio analysis for the three months ended December 31 (dollars inmillions): Three Months Ended March 31, June 30, September 30, December 31, Full Year 2017 Rental revenues $ 440 $ 448 $ 416 $ 434 $ 1,738 Rental recoveries 127 128 115 117 487 Rental expenses (153) (148) (129) (140) (570)Property NOI $ 414 $ 428 $ 402 $ 411 $ 1,655 2016 Rental revenues $ 437 $ 426 $ 436 $ 436 $ 1,735 Rental recoveries 117 120 124 125 486 Rental expenses (146) (141) (141) (141) (569)Property NOI $ 408 $ 405 $ 419 $ 420 $ 1,652
Three Months Ended December 31,
2017 2016 Percentage
Change
Rental revenues (1) (2) Consolidated: Rental revenues (per the quarterly information table above) $ 434 $ 436 Rental recoveries (per the quarterly information table above) 117 125
Consolidated adjustments to derive same store results: Rental revenues and recoveries of properties not in the same store portfolio – properties developed, acquired and sold to third parties during the period and land subject to ground leases
(74) (66)
Effect of changes in foreign currency exchange rates and other (9) - Unconsolidated co-investment ventures – rental revenues 525 463
Owned and managed same store portfolio – rental revenues (2) $ 993 $ 958 3.7%Rental expenses (1) (3) Consolidated: Rental expenses (per the quarterly information table above) $ 140 $ 141
Consolidated adjustments to derive same store results: Rental expenses of properties not in the same store portfolio – properties developed, acquired and sold to third parties during the period and land subject to ground leases
(32) (22)
Effect of changes in foreign currency exchange rates and other 18 13 Unconsolidated co-investment ventures – rental expenses 124 105
Owned and managed same store portfolio – rental expenses (3) $ 250 $ 237 5.3%NOI (1) Consolidated: Property NOI (per the quarterly information table above) $ 411 $ 420
Consolidated adjustments to derive same store results: Property NOI of properties not in the same store portfolio – properties developed, acquired and sold to third parties during the period and land subject to ground leases
(42) (44)
Effect of changes in foreign currency exchange rates and other (27) (13) Unconsolidated co-investment ventures – property NOI 401 358
Owned and managed same store portfolio – NOI $ 743 $ 721 3.2%
(1) We include 100% of the same store NOI from the properties in our same store portfolio. During the periods presented, certain properties owned by uswere contributed to a co-investment venture and are included in the same store portfolio. Neither our consolidated results nor those of the co-investmentventures, when viewed individually, would be comparable on a same store basis because of the changes in composition of the respective portfolios fromperiod to period (e.g. the results of a contributed property are included in our consolidated results through the contribution date and in the results of theunconsolidated entities subsequent to the contribution date).
(2) We exclude the net termination and renegotiation fees from our same store rental revenues to allow us to evaluate the growth or decline in each
property’s rental revenues without regard to one-time items that are not indicative of the property’s recurring
28

operating performance. Net termination and renegotiation fees represent the gross fee negotiated to allow a customer to terminate or renegotiate theirlease, offset by the write-off of the asset recorded due to the adjustment to straight-line rents over th e lease term. The adjustments to remove theseitems are included in “effect of changes in foreign currency exchange rates and other” in this table.
(3) Rental expenses include the direct operating expenses of the property such as property taxes, insurance and utilities. In addition, we include an allocation
of the property management expenses for our direct-owned properties based on the property management services provided to each property (generally,based on a percentage of revenues). On consolidation, these amounts are eliminated and the actual costs of providing property management servicesare recognized as part of our consolidated rental expenses. These expenses fluctuate based on the level of properties included in the same storeportfolio and any adjustment is included as “effect of changes in foreign currency exchange rates and other” in this table.
Other Components of Income (Expense) Earnings from Unconsolidated Entities, Net We recognized net earnings from unconsolidated entities, which are accounted for using the equity method, of $249 million, $206 million and $159 million during2017, 2016 and 2015, respectively. The earnings we recognize can be impacted by: (i) variances in revenues and expenses of each venture; (ii) the size andoccupancy rate of the portfolio of properties owned by each venture; (iii) gains or losses from the dispositions of properties and extinguishment of debt; (iv) ourownership interest in each venture; and (v) fluctuations in foreign currency exchange rates used to translate our share of net earnings to U.S. dollars. See the discussion of our co-investment ventures above in the Strategic Capital segment discussion and in Note 5 to the Consolidated Financial Statements fora further breakdown of our share of net earnings recognized. Interest Expense The following table details our net interest expense (dollars in millions): 2017 2016 2015 Gross interest expense $ 328 $ 383 $ 394 Amortization of discount (premium) and debt issuance costs, net 1 (15) (32)Capitalized amounts (55) (65) (61)Net interest expense $ 274 $ 303 $ 301 Weighted average effective interest rate during the year 3.2% 3.3% 3.3% Our overall debt decreased by $1.2 billion from December 31, 2016 to December 31, 2017, primarily from USLF assuming secured debt in conjunction with ourcontribution of real estate properties. Gross interest expense decreased in 2017, compared to the same period in 2016, principally due to decreased secureddebt as a result of the USLF contribution and pay downs, and lower interest rates due to the change in the composition of our senior notes. Gross interestexpense decreased in 2016, compared with 2015, principally from lower outstanding debt balances from the repayment of the senior term loan related to theKTR acquisition and lower borrowing costs during 2016. See Note 9 to the Consolidated Financial Statements for a further breakdown of gross interest expense, amortization and capitalized amounts included in netinterest expense. See the Liquidity and Capital Resources section for further discussion of our debt and borrowing costs. Gains on Dispositions of Investments in Real Estate and Revaluation of Equity Investments Upon Acquisition of a Controlling Interest, Net During 2017, 2016 and 2015, we recognized gains on dispositions of investments in real estate and revaluation of equity investments upon acquisition of acontrolling interest, net of $1.2 billion, $757 million, and $759 million. We utilized the proceeds from both contributions and dispositions to fund our capitalinvestments. Over the last three years, we contributed properties, generally that we developed, to our co-investment ventures in Europe, Japan and Mexico. In 2017, we alsocontributed a significant portfolio of operating properties to USLF. We have also sold properties to third parties, primarily from our operating portfolio in the U.S.These dispositions have supported our strategic objective of owning a portfolio of high-quality properties in the most active centers of commerce. We expect tocontinue to develop and contribute properties to these ventures, depending on market conditions and other factors. For the three-year period ended December 31, 2017, we recognized a gain in connection with contributions to the extent of the third-party ownership in theventure acquiring the property. Beginning in 2018, we will recognize the entire gain under the new revenue recognition standard, as discussed in Note 2 to theConsolidated Financial Statements. See Note 4 and 5 to the Consolidated Financial Statements for further information on the gains we recognized.
29

Foreign Currency and Derivative Gains (Losses), Net The following table details our foreign currency and derivative gains (losses), net included in earnings (in millions): 2017 2016 2015 Realized foreign currency and derivative gains (losses): Gains on the settlement of unhedged derivative transactions $ 13 $ 3 $ 15 Losses on the settlement of transactions (2) (3) (4)Total realized foreign currency and derivative gains 11 - 11
Unrealized foreign currency and derivative gains (losses): Gains (losses) on the change in fair value of unhedged derivative transactions (74) 10 16 Gains (losses) on remeasurement of certain assets and liabilities (1) 5 (2) (20)Gains on embedded derivative, including amortization (settled March 2015) - - 5 Total unrealized foreign currency and derivative gains (losses) (69) 8 1
Total foreign currency and derivative gains (losses), net $ (58) $ 8 $ 12
(1) These gains or losses were primarily related to the remeasurement of assets and liabilities that are denominated in currencies other than the functional
currency of the entity, such as short-term intercompany loans between the U.S. parent and certain foreign consolidated subsidiaries, debt and taxreceivables and payables.
See Note 2 to the Consolidated Financial Statements for more information about our foreign currency and derivative policies and Note 16 to the ConsolidatedFinancial Statements for more information about our derivative transactions. Gains (Losses) on Early Extinguishment of Debt, Net We repurchased and redeemed portions of several series of senior notes, term loans and secured mortgage debt that resulted in the recognition of losses of $68million and $86 million in 2017 and 2015, respectively, and a gain of $2 million in 2016. As a result of these transactions, we reduced our effective interest rateand lengthened the maturities of our debt. See Note 9 to the Consolidated Financial Statements for more information regarding our debt repurchases. Income Tax Expense We recognize income tax expense related to our taxable REIT subsidiaries and the local, state and foreign jurisdictions in which we operate. Our current incometax expense fluctuates from period to period based primarily on the timing of our taxable income. Deferred income tax expense (benefit) is generally a function ofthe period’s temporary differences and the utilization of net operating losses generated in prior years that had been previously recognized as deferred incometax assets in taxable subsidiaries operating in the U.S. or in foreign jurisdictions. The following table summarizes our income tax expense (benefit) (in millions): 2017 2016 2015 Current income tax expense: Income tax expense $ 39 $ 36 $ 24 Income tax expense on dispositions 19 24 - Income tax expense on dispositions related to acquired tax liabilities 2 - 4 Total current income tax expense 60 60 28
Deferred income tax benefit: Income tax benefit (3) (5) (1)Income tax benefit on dispositions related to acquired tax liabilities (2) - (4)Total deferred income tax benefit (5) (5) (5)
Total income tax expense $ 55 $ 55 $ 23
Our income taxes are discussed in more detail in Note 14 to the Consolidated Financial Statements. Net Earnings Attributable to Noncontrolling Interests This amount represents the third-party investors’ share of the earnings generated from consolidated entities in which we do not own 100% of the equity, reducedby the third-party share of fees or promotes payable to us and earned during the period.
30

The following tabl e summarizes net earnings attributable to noncontrolling interests (in millions):
2017 2016 2015 Prologis U.S. Logistics Venture (1) $ 60 $ 18 $ 38 Prologis North American Industrial Fund (2) 3 23 4 Other consolidated entities 1 7 3 Prologis, L.P. 64 48 45 Limited partners in Prologis, L.P. 45 35 11 Prologis, Inc. $ 109 $ 83 $ 56
(1) The third-party share of the promote earned from USLV is included in 2016. (2) We acquired our remaining partner’s interest in NAIF in 2017. See Note 12 to the Consolidated Financial Statements for further information on our noncontrolling interests. Other Comprehensive Income (Loss) We recorded net gains of $63 million in 2017 and net losses of $136 million and $209 million in 2016 and 2015, respectively, in the Consolidated Statements ofComprehensive Income related to the foreign currency translation of our foreign subsidiaries into U.S. dollars upon consolidation and translation of our derivativeand nonderivative net investment hedges. These net gains and losses were primarily due to the strengthening and weakening of the currencies in which weoperate to the U.S. dollar. During 2017, we recorded unrealized gains of $23 million and during 2016 and 2015, we recorded unrealized losses of $1 million and $17 million, respectively, inour Consolidated Statements of Comprehensive Income, related to the change in fair value of our cash flow hedges and our share of derivatives in ourunconsolidated co-investment ventures. See Note 2 to the Consolidated Financial Statements for more information about our foreign currency and derivative policies and Note 16 to the ConsolidatedFinancial Statements for more information about our derivative transactions and other comprehensive income (loss). ENVIRONMENTAL MATTERS See Note 17 in the Consolidated Financial Statements for further information about environmental liabilities. LIQUIDITY AND CAPITAL RESOURCES Overview We consider our ability to generate cash from operating activities, distributions from our co-investment ventures, contributions and dispositions of properties andavailable financing sources to be adequate to meet our anticipated future development, acquisition, operating, debt service, dividend and distributionrequirements. Near-Term Principal Cash Sources and Uses In addition to dividends to the common and preferred stockholders of Prologis, Inc. and distributions to the holders of limited partnership units of Prologis, L.P.and our partner in our consolidated co-investment venture, we expect our primary cash needs will consist of the following: • completion of the development and leasing of the properties in our consolidated development portfolio (at December 31, 2017, 85 properties in our
development portfolio were 59.8% leased with a current investment of $1.6 billion and a TEI of $2.8 billion when completed and leased, leaving $1.2billion of additional required funding);
• development of new properties for long-term investment, including the acquisition of land in certain markets; • capital expenditures and leasing costs on properties in our operating portfolio; • repayment of debt and scheduled principal payments of $169 million in 2018; • additional investments in current unconsolidated entities or new investments in future unconsolidated entities;
• acquisition of operating properties or portfolios of operating properties (depending on market and other conditions) for direct, long-term investment in our
consolidated portfolio (this might include acquisitions from our co-investment ventures); and
31

• repurchase of our outstanding debt or equity securities (depending on prevailing market conditions, our liquidity, contractual restrictions and oth er
factors) through cash purchases, open-market purchases, privately negotiated transactions, tender offers or otherwise. We expect to fund our cash needs principally from the following sources (subject to market conditions): • available unrestricted cash balances ($447 million at December 31, 2017); • property operations; • fees earned for services performed on behalf of the co-investment ventures, including promotes; • distributions received from the co-investment ventures; • proceeds from the disposition of properties, land parcels or other investments to third parties; • proceeds from the contributions of properties to current or future co-investment ventures;
• proceeds from the sale of a portion of our investments in co-investment ventures; • borrowing capacity under our current credit facility arrangements, other facilities or borrowing arrangements ($3.1 billion available at December 31, 2017);
and • proceeds from the issuance of debt. We may also generate proceeds from the issuance of equity securities, subject to market conditions. Debt The following table summarizes information about our debt at December 31 (dollars in millions): 2017 2016 Debt outstanding $ 9,413 $ 10,608 Weighted average interest rate 2.9% 3.2%Weighted average maturity in months 67 60
We had the following significant debt activity for 2017, which resulted in lowering our average borrowing rate and extending our maturities: Credit Facilities • In February, we renewed and amended our Japanese yen revolver (“Revolver”) and increased our availability under
the Revolver to ¥50.0 billion ($444 million at December 31, 2017).
Senior Notes
• In June, we issued £500 million ($645 million) of senior notes with an effective interest rate of 2.3%, maturing inJune 2029. We used the cash proceeds to redeem $618 million of previously issued senior notes with anaverage coupon rate of 5.4%.
Term Loans
• In March, we entered into an unsecured senior term loan agreement (“March 2017 Yen Term Loan”) under whichwe can draw up to ¥12.0 billion ($107 million at December 31, 2017). In the first quarter, we borrowed ¥12.0billion ($107 million), causing the March 2017 Yen Term Loan to be fully drawn at December 31, 2017.
• In May, we renewed and amended our existing senior term loan agreement (“2017 Term Loan”) under which loanscan be obtained in British pounds sterling, euro, Japanese yen and U.S. dollars in an aggregate amount not toexceed $500 million. We may increase the borrowings up to $1.0 billion, subject to obtaining additional lendercommitments. We paid down $1.2 billion and reborrowed $1.5 billion in 2017. The 2017 Term Loan was fullydrawn at December 31, 2017.
• In October, we entered into an unsecured senior term loan agreement (“October 2017 Yen Term Loan”) underwhich we can draw up to ¥10.0 billion ($89 million at December 31, 2017). In the fourth quarter of 2017, weborrowed ¥10.0 billion ($89 million), causing the October 2017 Yen Term Loan to be fully drawn at December 31,2017.
32

Secured Mortgage Debt • In July, USLF assumed $956 million of secured mortgage debt in conjunction with our contribution of the associated
real estate properties, as discussed in Note 4 to theConsolidated Financial Statements.
At December 31, 2017, we had credit facilities with an aggregate borrowing capacity of $3.5 billion, of which $3.1 billion was available for borrowing. In January 2018, we issued €400 million ($495 million) senior notes bearing a floating rate of Euribor plus 0.3%, maturing in January 2020 and used the cashproceeds to repay borrowings under our 2017 Term Loan.
Our credit ratings at December 31, 2017, were A3 from Moody’s and A- from S&P, both with stable outlook. These ratings allow us to borrow at an advantageousrate. A securities rating is not a recommendation to buy, sell or hold securities and is subject to revision or withdrawal at any time by the rating organization. At December 31, 2017, we were in compliance with all of our debt covenants. These covenants include customary financial covenants for total debt,encumbered debt and fixed charge coverage ratios. See Note 9 to the Consolidated Financial Statements for further discussion on our debt. Equity Commitments Related to Certain Co-Investment Ventures Certain co-investment ventures have equity commitments from us and our venture partners. Our venture partners fulfill their equity commitment with cash. Wemay fulfill our equity commitment through contributions of properties or cash. See the Cash Flow Summary below for more information about our investmentactivity in our co-investment ventures. For more information on equity commitments for our unconsolidated co-investment ventures, see Note 5 to theConsolidated Financial Statements. Cash Flow Summary The following table summarizes our cash flow activity for the years ended December 31 (in millions): 2017 2016 2015 Net cash provided by operating activities $ 1,687 $ 1,417 $ 1,116 Net cash provided by (used in) investing activities $ 543 $ 1,252 $ (4,789)Net cash provided by (used in) financing activities $ (2,607) $ (2,125) $ 3,596
Cash Provided by Operating Activities Cash provided by operating activities, exclusive of changes in receivables and payables, was impacted by the following significant activities: • Real estate operations. We receive the majority of our operating cash through the net revenues of our Real Estate Operations segment. See the Results
of Operations section above for further explanation on our Real Estate Operations segment. The revenues from this segment include noncashadjustments for straight-lined rents and amortization of above and below market leases of $81 million, $94 million and $60 million for 2017, 2016 and2015, respectively.
• Strategic capital. We also generate operating cash through our Strategic Capital segment by providing management services to our unconsolidated co-investment ventures. See the Strategic Capital Results of Operations section above for the key drivers of our strategic capital revenues and expenses.Included in Strategic Capital Revenues is the third-party investors’ share of the total promote revenue, which is recognized in operating activities in theperiod it is received.
• G&A expenses. We incurred $231 million, $222 million and $217 million of G&A costs in 2017, 2016 and 2015, respectively. • Equity-based compensation awards. We record equity-based compensation expenses in Rental Expenses in the Real Estate Operations segment,
Strategic Capital Expenses in the Strategic Capital segment and G&A expenses. The total amounts expensed were $77 million, $60 million and $54million in 2017, 2016 and 2015, respectively.
• Distributions from unconsolidated entities. We received $307 million, $287 million and $285 million of distributions from our unconsolidated entities in2017, 2016 and 2015, respectively. Certain co-investment ventures distribute the total promote (third-party investors’ and our share) and our share isrecorded to Investment In and Advances to Unconsolidated Entities , and is recognized in operating activities in the period it is received.
• Cash paid for interest and income taxes. We paid combined amounts for interest and income taxes of $325 million, $352 million and $370 million in
2017, 2016 and 2015, respectively. See Note 9 and Note 14 to the Consolidated Financial Statements for further information on this activity.
33
Cash Prov ided by (Used in) Investing Activities Cash provided by investing activities is primarily driven by proceeds from contributions and dispositions of real estate properties. Cash used in investing activitiesis principally driven by our investments in real estate development, acquisitions and capital expenditures. See Note 4 to the Consolidated Financial Statementsfor further information on these real estate activities. In addition, the following significant transactions also impacted our cash provided by or used in investingactivities:
• Real estate development. We invested $1.6 billion during both 2017 and 2016 and $1.3 billion during 2015 in real estate development and leasing costs
for first generation space. We have 63 properties under development and 22 properties that were completed but not stabilized at December 31, 2017, andwe expect to continue to develop new properties as the opportunities arise.
• Real estate acquisitions. In 2017, we acquired total real estate of $443 million, which included 861 acres of land and four operating properties. In 2016,
we acquired total real estate of $459 million, which included 776 acres of land and nine operating properties. In 2015, we acquired total real estate of$890 million, which included 690 acres of land and 52 operating properties, excluding the KTR transaction.
• KTR transaction. We acquired the real estate assets of KTR for a net cash purchase price of $4.8 billion through our consolidated co-investment venture
USLV in 2015. See Note 3 to the Consolidated Financial Statements for more detail on the transaction. • Investments in and advances to. We invested cash in our unconsolidated co-investment ventures and other ventures, which represented our
proportionate share of $250 million, $266 million and $474 million in 2017, 2016 and 2015, respectively. The ventures use the funds for the acquisition ofoperating properties, development and repayment of debt. See Note 5 to the Consolidated Financial Statements for more detail on our unconsolidated co-investment ventures.
• Acquisition of a controlling interest. We paid net cash of $375 million to acquire a controlling interest in certain joint ventures in Brazil in 2017. See
Note 4 to the Consolidated Financial Statements for more detail on this transaction. • Return of investment. We received distributions from unconsolidated co-investment ventures and other ventures as a return of investment of $209
million, $777 million and $29 million during 2017, 2016 and 2015, respectively. Included in this amount for 2017 was $125 million from propertydispositions within our unconsolidated co-investment ventures and $84 million from the disposition of our investment in ELV. Included in this amount for2016 was $611 million from the redemption of a portion of our investments in PTELF and USLF and the remaining amount was from property dispositionswithin our unconsolidated co-investment ventures, primarily $68 million from Prologis European Logistics Partners Sàrl.
• Repayment of notes receivable. We received $32 million and $203 million for the payment of notes receivable received in connection with dispositions
of real estate to third parties in 2017 and 2016, respectively . See Note 7 to the Consolidated Financial Statements for further information about notesreceivable.
• Settlement of net investment hedges . We received net proceeds of $2 million, $80 million and $128 million from the settlement of net investment
hedges during 2017, 2016 and 2015, respectively. See Note 16 to the Consolidated Financial Statements for further information on our derivative activity. Cash Provided by (Used in) Financing Activities Cash provided by financing activities is primarily driven by proceeds from the issuance of debt. Cash used in financing activities is primarily driven by dividendspaid on common and preferred units, noncontrolling interest distributions and payments of debt and credit facilities. In addition, the following significanttransactions also impacted our cash provided by or used in financing activities: • Issuance of common stock. In addition to the net proceeds generated from the issuance of common stock under our incentive plans, we also generated
net proceeds of $72 million from the issuance of 1.7 million shares of common stock under our at-the-market program in 2015.
• Noncontrolling interests contributions. Our partner in USLV made contributions of $240 million for the pay down of secured mortgage debt in 2017and $2.4 billion in 2015 primarily for the KTR transaction.
• Noncontrolling interests distributions. Our consolidated ventures distributed $208 million, $344 million and $216 million to various noncontrolling
interests in 2017, 2016 and 2015, respectively, primarily due to operating results and dispositions of real estate. Included in these amounts were $37million in both 2017 and 2016, and $16 million in 2015 of distributions to common limited partnership unitholders of Prologis, L.P.
• Purchase of noncontrolling interests. We paid net cash of $710 million to acquire our partner’s interest in NAIF and $80 million to acquire our partner’s
interest in the Brazil Fund in 2017.
34

• Net proceeds from (payments on) credit facilities. We generated net proceeds of $283 million and $33 million from our credit facilities in 2017 and
2016, respectively. We made net payments of $8 million on our credit facilities in 2015. • Other debt activity. Our repurchase and payments of debt and proceeds from issuance of debt consisted of the following activity (in millions):
2017 2016 2015 Repurchase and payments of debt (including extinguishment costs) Regularly scheduled debt principal payments and payments at maturity $ 238 $ 233 $ 128 Senior notes 1,567 - 789 Term loans 1,236 1,612 1,643 Secured mortgage debt 538 457 596 Total repurchase and payments of debt (including extinguishment costs) $ 3,579 $ 2,302 $ 3,156 Proceeds from issuance of debt Senior notes $ 645 $ - $ 1,524 Term loans 1,735 973 3,195 Secured mortgage debt 40 397 663 Total proceeds from issuance of debt $ 2,420 $ 1,370 $ 5,382
See Note 9 to the Consolidated Financial Statements for more detail on debt. OFF-BALANCE SHEET ARRANGEMENTS Unconsolidated Co-Investment Venture Debt We had investments in and advances to our unconsolidated co-investment ventures, at December 31, 2017, of $5.3 billion. The ventures listed below had totalthird-party debt of $8.1 billion at December 31, 2017. Certain of our ventures do not have third-party debt and are therefore excluded. This debt is non-recourseto Prologis or the other investors in the co-investment ventures, matures and bears interest as follows (dollars in millions): Weighted Gross There- Disc/ Average Book Ownership 2018 2019 2020 after (Prem) Total Interest Rate Value % Prologis Targeted U.S. Logistics Fund $ 163 $ 14 $ 490 $ 1,626 $ 19 $ 2,312 3.9% $ 7,543 28.2% FIBRA Prologis 72 254 175 254 1 756 4.0% 2,052 46.3% Prologis European Logistics Fund 365 289 425 1,401 (5) 2,475 3.1% 9,565 26.3% Prologis UK Logistics Venture - - - 208 - 208 3.3% 285 15.0% Nippon Prologis REIT 113 27 - 1,565 - 1,705 0.7% 4,625 15.1% Prologis China Logistics Venture 1 325 152 145 - 623 5.0% 731 15.0% Total $ 714 $ 909 $ 1,242 $ 5,199 $ 15 $ 8,079 $ 24,801
At December 31, 2017, we did not guarantee any third-party debt of the unconsolidated co-investment ventures. In our role as the manager or sponsor, we workwith the co-investment ventures to maintain sufficient liquidity and refinance their maturing debt. There can be no assurance that the co-investment ventures willbe able to refinance any maturing indebtedness on terms as favorable as the maturing debt, or at all. If the ventures are unable to refinance the maturingindebtedness with newly issued debt, they may be able to obtain funds by voluntary capital contributions from us and our partners or by selling assets. Certain ofour ventures also have credit facilities, or unencumbered properties, both of which may be used to obtain funds.
35

CONTRACTUAL OBLIGATIONS Long-Term Contractual Obligations The following table summarizes our long-term contractual obligations at December 31, 2017 (in millions): Payments Due by Period
Less than 1
Year 1 to 3 Years 3 to 5 Years More than 5
Years Total Debt obligations, other than credit facilities $ 169 $ 1,680 $ 2,151 $ 5,152 $ 9,152 Interest on debt obligations, other than credit facilities 249 435 355 351 1,390 Unfunded commitments on the development portfolio (1) 1,121 59 - - 1,180 Operating lease payments 34 62 51 311 458 Total $ 1,573 $ 2,236 $ 2,557 $ 5,814 $ 12,180
(1) We had properties in our consolidated development portfolio (completed and under development) at December 31, 2017, with a TEI of $2.8 billion. The
unfunded commitments presented include not only those costs that we are obligated to fund under construction contracts, but all costs necessary to placethe property into service, including the estimated costs of tenant improvements, marketing and leasing costs that we expect to incur as the property isleased.
Distribution and Dividend Requirements Our dividend policy on our common stock is to distribute a percentage of our cash flow to ensure that we will meet the dividend requirements of the InternalRevenue Code, relative to maintaining our REIT status, while still allowing us to retain cash to fund capital improvements and other investment activities. Under the Internal Revenue Code, REITs may be subject to certain federal income and excise taxes on our undistributed taxable income. We do not expect theTax Cuts and Jobs Act, enacted on December 22, 2017, to modify our current distribution policy. In 2017, we paid quarterly cash dividends of $0.44 per common share. In 2016, we paid quarterly cash dividends of $0.42 per common share. Our futurecommon stock dividends, if and as declared, may vary and will be determined by the Board upon the circumstances prevailing at the time, including our financialcondition, operating results and REIT distribution requirements, and may be adjusted at the discretion of the Board during the year. We make distributions on the common limited partnership units outstanding at the same per unit amount as our common stock dividend. The Class A Units in theOP are entitled to a quarterly distribution equal to $0.64665 per unit so long as the common units receive a quarterly distribution of at least $0.40 per unit. Wepaid a quarterly distribution of $0.64665 per Class A Unit in 2017 and 2016. At December 31, 2017, we had 1.4 million shares of Series Q preferred stock outstanding with a liquidation preference of $50 per share. The annual dividendrate is 8.54% per share and dividends are payable quarterly in arrears. Pursuant to the terms of our preferred stock, we are restricted from declaring or payingany dividend with respect to our common stock unless and until all cumulative dividends with respect to the preferred stock have been paid and sufficient fundshave been set aside for dividends that have been declared for the relevant dividend period with respect to the preferred stock. Other Commitments On a continuing basis, we are engaged in various stages of negotiations for the acquisition or disposition of individual properties or portfolios of properties. CRITICAL ACCOUNTING POLICIES A critical accounting policy is one that is both important to the portrayal of an entity’s financial condition and results of operations and requires judgment on thepart of management. Generally, the judgment requires management to make estimates and assumptions about the effect of matters that are inherentlyuncertain. Estimates are prepared using management’s best judgment, after considering past and current economic conditions and expectations for the future.Changes in estimates could affect our financial position and specific items in our results of operations that are used by stockholders, potential investors, industryanalysts and lenders in their evaluation of our performance. Of the accounting policies discussed in Note 2 to the Consolidated Financial Statements, thosepresented below have been identified by us as critical accounting policies. Consolidation We consolidate all entities that are wholly owned and those in which we own less than 100% of the equity but control, as well as any variable interest entities inwhich we are the primary beneficiary. We evaluate our ability to control an entity including whether the entity is a variable interest entity and whether we are theprimary beneficiary. We consider the substantive terms of the arrangement to
36

identify which enterprise has the power to direct the activities of the entity that most significantly impa cts the entity’s economic performance and the obligation toabsorb losses of the entity or the right to receive benefits from the entity. Investments in entities that we do not control but over which we have the ability toexercise significant influence ov er operating and financial policies are accounted for using the equity method. Our ability to correctly assess our influence orcontrol over an entity affects the presentation of these investments in the Consolidated Financial Statements. Revenue Recognition We recognize gains from the contributions and sales of real estate assets, generally at the time the title is transferred, consideration is received and we nolonger have substantial continuing involvement with the real estate sold. In many of our transactions, an entity in which we have an equity investment will acquirea real estate asset from us. We make judgments based on the specific terms of each transaction as to the amount of the total profit from the transaction that werecognize given our continuing ownership interest and our level of future involvement with the entity that acquires the assets. In addition, we make judgmentsregarding recognition in earnings of certain fees and incentives earned for services provided to these entities based on when they are earned, fixed anddeterminable. Acquisitions Upon acquisition of real estate that constitutes a business or an asset, which includes acquiring a controlling interest in an entity previously accounted for usingthe equity method of accounting, we allocate the purchase price to the various components of the acquisition based on the fair value of each component. Thecomponents typically include buildings, land, intangible assets related to the acquired leases, debt, deferred tax liabilities and other assumed assets andliabilities. In an acquisition of multiple properties, we allocate the purchase price among the properties. The allocation of the purchase price is based on ourassessment of estimated fair value and often is based on the expected future cash flows of the property and various characteristics of the markets where theproperty is located. The fair value may also include an enterprise value premium that we estimate a third party would be willing to pay for a portfolio of propertiesfor acquisitions that qualify as a business. In the case of an acquisition of a controlling interest in an entity previously accounted for under the equity method (astep-acquisition under the business combination rules), this allocation may result in a gain or a loss. The initial allocation of the purchase price is based onmanagement’s preliminary assessment, which may differ when final information becomes available. The use of different assumptions in the allocation of thepurchase price of the acquired properties and liabilities assumed could affect the timing of recognition of the related revenues and expenses. Income Taxes Significant management judgment is required to estimate our income tax liability for each taxable entity, the liability associated with open tax years that are underreview, our REIT taxable income and our compliance with REIT requirements. Our estimates are based on interpretation of tax laws. We estimate our actualcurrent income tax due and assess temporary differences resulting from differing treatment of items for book and tax purposes resulting in the recognition ofdeferred income tax assets and liabilities. These estimates may have an impact on the income tax expense recognized. Adjustments may be required by achange in assessment of our deferred income tax assets and liabilities; changes in assessments of the recognition of income tax benefits for certain non-routinetransactions; changes due to audit adjustments by federal, international and state tax authorities; our inability to qualify as a REIT; the potential for built-in gainrecognition; changes in the assessment of properties to be contributed to taxable REIT subsidiaries and changes in tax laws. Adjustments required in any givenperiod are included within income tax expense. We recognize the tax benefit from an uncertain tax position only if it is more likely than not that the tax positionwill be sustained on examination by taxing authorities. Recoverability of Real Estate Assets We assess the carrying values of our respective long-lived assets whenever events or changes in circumstances indicate that the carrying amounts of theseassets may not be fully recoverable. Recoverability of real estate assets is measured by comparison of the carrying amount of the asset to the estimated future undiscounted cash flows. To reviewour real estate assets for recoverability, we consider current market conditions, as well as our intent with respect to holding or disposing of the asset. Our intentwith regard to the underlying assets might change as market conditions change. Fair value is determined through various valuation techniques, includingdiscounted cash flow models, applying a capitalization rate to estimated NOI of a property, quoted market values and third-party appraisals, where considerednecessary. The use of projected future cash flows is based on assumptions that are consistent with our estimates of future expectations and the strategic planwe use to manage our underlying business. If our analysis indicates that the carrying value of a property that we expect to hold is not recoverable on anundiscounted cash flow basis, we recognize an impairment charge for the amount by which the carrying value exceeds the current estimated fair value of theproperty. Assumptions and estimates used in the recoverability analyses for future cash flows, including market rents, discount rates and capitalization rates arecomplex and subjective. Changes in economic and operating conditions or our intent with regard to our investment that occurs subsequent to our impairmentanalyses could impact these assumptions and result in future impairment. Capitalization of Costs During the land development and construction periods (including renovating and rehabilitating), we capitalize interest, insurance, real estate taxes and certaingeneral and administrative costs of the personnel performing development, renovations and rehabilitation if such costs are incremental and identifiable to aspecific activity to get the asset ready for its intended use. The ability to specifically
37
identify internal personnel costs associated with development and the determination of when a development project is substantially complete and capitalizationmust cease, requires a high degree of judgment and failure to accurately assess these costs and timing could result in the misstatement of asset values andexpenses. Capitalized costs are included in the investment basis of real estate assets. NEW ACCOUNTING PRONOUNCEMENTS See Note 2 to the Consolidated Financial Statements. FUNDS FROM OPERATIONS ATTRIBUTABLE TO COMMON STOCKHOLDERS/UNITHOLDERS FFO is a non-GAAP financial measure that is commonly used in the real estate industry. The most directly comparable GAAP measure to FFO is net earnings. The National Association of Real Estate Investment Trusts (“NAREIT”) defines FFO as earnings computed under GAAP to exclude historical cost depreciationand gains and losses from the sales, along with impairment charges, of previously depreciated properties. We also exclude the gains on revaluation of equityinvestments upon acquisition of a controlling interest and the gain recognized from a partial sale of our investment, as these are similar to gains from the sales ofpreviously depreciated properties. We exclude similar adjustments from our unconsolidated entities and the third parties’ share of our consolidated co-investmentventures. Our FFO Measures Our FFO measures begin with NAREIT’s definition and we make certain adjustments to reflect our business and the way that management plans and executesour business strategy. While not infrequent or unusual, the additional items we adjust for in calculating FFO, as modified by Prologis, and Core FFO , both asdefined below, are subject to significant fluctuations from period to period. Although these items may have a material impact on our operations and are reflectedin our financial statements, the removal of the effects of these items allows us to better understand the core operating performance of our properties over thelong term. These items have both positive and negative short-term effects on our results of operations in inconsistent and unpredictable directions that are notrelevant to our long-term outlook. We calculate our FFO measures, as defined below, based on our proportionate ownership share of both our unconsolidated and consolidated ventures. Wereflect our share of our FFO measures for unconsolidated ventures by applying our average ownership percentage for the period to the applicable reconcilingitems on an entity by entity basis. We reflect our share for consolidated ventures in which we do not own 100% of the equity by adjusting our FFO measures toremove the noncontrolling interests share of the applicable reconciling items based on our average ownership percentage for the applicable periods. These FFO measures are used by management as supplemental financial measures of operating performance and we believe that it is important thatstockholders, potential investors and financial analysts understand the measures management uses. We do not use our FFO measures as, nor should they beconsidered to be, alternatives to net earnings computed under GAAP, as indicators of our operating performance, as alternatives to cash from operatingactivities computed under GAAP or as indicators of our ability to fund our cash needs. We analyze our operating performance primarily by the rental revenues of our real estate and the revenues from our strategic capital business, net of operating,administrative and financing expenses. This income stream is not directly impacted by fluctuations in the market value of our investments in real estate or debtsecurities. FFO, as modified by Prologis attributable to common stockholders and unitholders (“FFO, as modified by Prologis”) To arrive at FFO, as modified by Prologis , we adjust the NAREIT defined FFO measure to exclude the impact of foreign currency related items and deferred tax,specifically: • deferred income tax benefits and deferred income tax expenses recognized by our subsidiaries; • current income tax expense related to acquired tax liabilities that were recorded as deferred tax liabilities in an acquisition, to the extent the expense is
offset with a deferred income tax benefit in earnings that is excluded from our defined FFO measure; • unhedged foreign currency exchange gains and losses resulting from debt transactions between us and our foreign consolidated subsidiaries and our
foreign unconsolidated entities; • foreign currency exchange gains and losses from the remeasurement (based on current foreign currency exchange rates) of certain third-party debt of our
foreign consolidated and unconsolidated entities; and • mark-to-market adjustments associated with derivative financial instruments.
38

We use FFO, as modified by Prologis , so that management, analysts and investors are able to evaluate our performance against other REITs that do not havesimilar operations or operations in jurisdictions outside the U.S. Core FFO attributable to common stockholders and unitholders (“Core FFO”) In addition to FFO, as modified by Prologis , we also use Core FFO. To arrive at Core FFO, we adjust FFO, as modified by Prologis , to exclude the followingrecurring and nonrecurring items that we recognized directly in FFO, as modified by Prologis : • gains or losses from the disposition of land and development properties that were developed with the intent to contribute or sell; • income tax expense related to the sale of investments in real estate and third-party acquisition costs related to the acquisition of real estate; • impairment charges recognized related to our investments in real estate generally as a result of our change in intent to contribute or sell these properties;
• gains or losses from the early extinguishment of debt and redemption and repurchase of preferred stock; and
• expenses related to natural disasters. We use Core FFO , including by segment and region, to: (i) assess our operating performance as compared to other real estate companies; (ii) evaluate ourperformance and the performance of our properties in comparison with expected results and results of previous periods; (iii) evaluate the performance of ourmanagement; (iv) budget and forecast future results to assist in the allocation of resources; (v) provide guidance to the financial markets to understand ourexpected operating performance; and (vi) evaluate how a specific potential investment will impact our future results. Limitations on the use of our FFO measures While we believe our modified FFO measures are important supplemental measures, neither NAREIT’s nor our measures of FFO should be used alone becausethey exclude significant economic components of net earnings computed under GAAP and are, therefore, limited as an analytical tool. Accordingly, these areonly a few of the many measures we use when analyzing our business. Some of the limitations are: • The current income tax expenses and acquisition costs that are excluded from our modified FFO measures represent the taxes and transaction costs that
are payable. • Depreciation and amortization of real estate assets are economic costs that are excluded from FFO. FFO is limited, as it does not reflect the cash
requirements that may be necessary for future replacements of the real estate assets. Furthermore, the amortization of capital expenditures and leasingcosts necessary to maintain the operating performance of logistics facilities are not reflected in FFO.
• Gains or losses from non-development property and dispositions or impairment charges related to expected dispositions represent changes in value of
the properties. By excluding these gains and losses, FFO does not capture realized changes in the value of disposed properties arising from changes inmarket conditions.
• The deferred income tax benefits and expenses that are excluded from our modified FFO measures result from the creation of a deferred income tax
asset or liability that may have to be settled at some future point. Our modified FFO measures do not currently reflect any income or expense that mayresult from such settlement.
• The foreign currency exchange gains and losses that are excluded from our modified FFO measures are generally recognized based on movements in
foreign currency exchange rates through a specific point in time. The ultimate settlement of our foreign currency-denominated net assets is indefinite as totiming and amount. Our FFO measures are limited in that they do not reflect the current period changes in these net assets that result from periodicforeign currency exchange rate movements.
• The gains and losses on extinguishment of debt that we exclude from our Core FFO, may provide a benefit or cost to us as we may be settling our debt at
less or more than our future obligation. • The natural disaster expenses that we exclude from Core FFO are costs that we have incurred.
39

We compensate for these limitations by using our FFO measures only in conjunction with n et earnings computed under GAAP when making our decisions. Thisinformation should be read with our complete Consolidated Financial Statements prepared under GAAP. To assist investors in compensating for theselimitations, we reconcile our modified FFO mea sures to our net earnings computed under GAAP as follows (in millions). 2017 2016 2015 FFO Reconciliation of net earnings to FFO measures: Net earnings attributable to common stockholders $ 1,642 $ 1,203 $ 863 Add (deduct) NAREIT defined adjustments: Real estate related depreciation and amortization 848 900 855 Gains on dispositions of investments in real estate properties and revaluation of equity investments upon acquisition of a controlling interest, net (855) (423) (501)Reconciling items related to noncontrolling interests (39) (105) (78)Our share of reconciling items included in earnings from unconsolidated entities 147 162 185
NAREIT defined FFO 1,743 1,737 1,324 Add (deduct) our modified adjustments: Unrealized foreign currency and derivative losses (gains), net 69 (8) 1 Deferred income tax benefit (5) (5) (5)Current income tax expense related to acquired tax liabilities 2 - 4 Reconciling items related to noncontrolling interests - 1 (1)Our share of reconciling items included in earnings from unconsolidated entities (14) (23) (14)
FFO, as modified by Prologis 1,795 1,702 1,309 Adjustments to arrive at Core FFO: Gains on dispositions of development properties and land, net (328) (334) (258)Current income tax expense on dispositions 19 24 - Acquisition expenses - 4 47 Losses (gains) on early extinguishment of debt and repurchase of preferred stock, net 72 (2) 86 Reconciling items related to noncontrolling interests - 4 (11)Our share of reconciling items included in earnings from unconsolidated entities (7) 2 8
Core FFO $ 1,551 $ 1,400 $ 1,181
ITEM 7A. Quantitative and Qualitative Disclosures About Market Risk We are exposed to the impact of foreign exchange-related variability and earnings volatility on our foreign investments and interest rate changes. See our riskfactors in Item 1A. Risk Factors, specifically: The depreciation in the value of the foreign currency in countries where we have a significant investment mayadversely affect our results of operations and financial position and We may be unable to refinance our debt or our cash flow may be insufficient to makerequired debt payments. See also Notes 2 and 16 in the Consolidated Financial Statements in Item 8. Financial Statements and Supplementary Data for moreinformation about our foreign operations and derivative financial instruments. We monitor our market risk exposures using a sensitivity analysis. Our sensitivity analysis estimates the exposure to market risk sensitive instruments assuminga hypothetical 10% adverse change in foreign currency exchange rates or interest rates at December 31, 2017. The results of the sensitivity analysis aresummarized in the following sections. The sensitivity analysis is of limited predictive value. As a result, revenues and expenses, as well as our ultimate realizedgains or losses with respect to interest rate and foreign currency exchange rate fluctuations will depend on the exposures that arise during a future period,hedging strategies at the time and the prevailing interest and foreign currency exchange rates.
40

Foreign Currency Risk We are exposed to foreign currency exchange variability related to investments in and earnings from our foreign investments. Foreign currency market risk is thepossibility that our results of operations or financial position could be better or worse than planned because of changes in foreign currency exchange rates. Weprimarily hedge our foreign currency risk by borrowing in the currencies in which we invest. Generally, we borrow in the functional currency of the consolidatedsubsidiaries but we also borrow in the OP and may designate this borrowing as a nonderivative financial instrument. We also hedge our foreign currency risk bydesignating derivative financial instruments as net investment hedges, as these amounts offset the translation adjustments on the underlying net assets of ourforeign investments. At December 31, 2017, after consideration of our nonderivative and derivative financial instruments, we had net equity of approximately $1.0 billion denominatedin a currency other than the U.S. dollar representing 5.6% of total net equity. Based on our sensitivity analysis, a 10% strengthening of the U.S. dollar againstother currencies would cause a reduction of $105 million to our net equity. At December 31, 2017, we had foreign currency forward contracts, which were designated and qualify as net investment hedges, with an aggregate notionalamount of $99 million to hedge a portion of our investments in Canada. On the basis of our sensitivity analysis, a weakening of the U.S. dollar against theCanadian dollar by 10% would result in a $10 million negative change in our cash flows on settlement of these contracts. In addition, we also have British poundsterling, Canadian dollar, euro and Japanese yen forward and option contracts, which were not designated as hedges, and have an aggregate notional amountof $574 million to mitigate risk associated with the translation of the projected earnings of our subsidiaries in Canada, Europe and Japan. A weakening of theU.S. dollar against these currencies by 10% would result in a $57 million negative change in our net income and cash flows on settlement of these contracts. Interest Rate Risk We also are exposed to the impact of interest rate changes on future earnings and cash flows. At December 31, 2017, we had $2.3 billion of variable rate debtoutstanding, of which $1.9 billion was term loans, $317 million was credit facilities and $50 million was secured mortgage debt. At December 31, 2017, we hadinterest rate swap agreements to fix $297 million (CAD $372 million) of our Canadian term loan. On the basis of our sensitivity analysis, a 10% adverse changein interest rates based on our average outstanding variable rate debt balances not subject to interest rate swap agreements during the period would result inadditional annual interest expense of $2 million, which equates to a change in interest rates of 12 basis points. ITEM 8. Finan cial Statements and Supplementary Data The Consolidated Balance Sheets of Prologis, Inc. and Prologis, L.P. at December 31, 2017 and 2016, the Consolidated Statements of Income of Prologis, Inc.and Prologis, L.P., the Consolidated Statements of Comprehensive Income of Prologis, Inc. and Prologis, L.P., the Consolidated Statements of Equity ofPrologis, Inc., the Consolidated Statements of Capital of Prologis, L.P. and the Consolidated Statements Cash Flows of Prologis, Inc. and Prologis, L.P. for eachof the years in the three-year period ended December 31, 2017, Notes to Consolidated Financial Statements and Schedule III — Real Estate and AccumulatedDepreciation, together with the reports of KPMG LLP, independent registered public accounting firm, are included under Item 15 of this report and areincorporated herein by reference. Selected unaudited quarterly financial data are presented in Note 20 of the Consolidated Financial Statements. ITEM 9. Changes in and Disagreements with Accountants on Accounting and Financial Disclosure None. ITEM 9A. Controls and Procedures Controls and Procedures (The Parent) Prologis, Inc. carried out an evaluation under the supervision and with the participation of management, including the Chief Executive Officer and Chief FinancialOfficer, of the effectiveness of the disclosure controls and procedures (as defined in Rule 13a-15(e) under the Securities and Exchange Act of 1934 (the“Exchange Act”)) at December 31, 2017. Based on this evaluation, the Chief Executive Officer and the Chief Financial Officer have concluded that the disclosurecontrols and procedures are effective to ensure that information required to be disclosed by us in reports that we file or submit under the Exchange Act isrecorded, processed, summarized and reported within the time periods specified in the SEC rules and forms. Subsequent to December 31, 2017, there were nosignificant changes in the internal controls or in other factors that could significantly affect these controls, including any corrective actions with regard tosignificant deficiencies and material weaknesses. Changes in Internal Control over Financial Reporting There has been no change in our internal control over financial reporting (as such term is defined in Rules 13a-15(f) and 15(d)-15(f) under the Exchange Act)that occurred during the quarter ended December 31, 2017, that has materially affected, or is reasonably likely to materially affect, our internal control overfinancial reporting.
41

Management’s Annual Report on Internal Control over Financial Reporting We are responsible for establishing and maintaining adequate internal control over financial reporting as defined in Rules 13a-15(f) and 15d-15(f) under theExchange Act. Under the supervision and with the participation of management, including the Chief Executive Officer and Chief Financial Officer, an evaluation of theeffectiveness of the internal control over financial reporting was conducted at December 31, 2017, based on the criteria described in “Internal Control —Integrated Framework” (2013) issued by the Committee of Sponsoring Organizations of the Treadway Commission. Based on this assessment, managementdetermined that, at December 31, 2017, the internal control over financial reporting was effective. Our internal control over financial reporting at December 31, 2017, has been audited by KPMG LLP, an independent registered public accounting firm, as statedin their attestation report which is included herein. Limitations of the Effectiveness of Controls Management’s assessment included an evaluation of the design of the internal control over financial reporting and testing of the operational effectiveness of theinternal control over financial reporting. The internal control over financial reporting is a process designed to provide reasonable assurance regarding thereliability of financial reporting and the preparation of financial statements for external purposes in accordance with GAAP. Because of its inherent limitations,internal control over financial reporting may not prevent or detect misstatements. Also, projections of any evaluation of effectiveness to future periods are subjectto the risk that controls may become inadequate because of changes in conditions, or that the degree of compliance with the policies or procedures maydeteriorate. Controls and Procedures (The OP) Prologis, L.P. carried out an evaluation under the supervision and with the participation of management, including the Chief Executive Officer and Chief FinancialOfficer, of the effectiveness of the disclosure controls and procedures (as defined in Rule 13a-15(e) under the Exchange Act) at December 31, 2017. Based onthis evaluation, the Chief Executive Officer and the Chief Financial Officer have concluded that the disclosure controls and procedures are effective to ensurethat information required to be disclosed by us in reports that we file or submit under the Exchange Act is recorded, processed, summarized and reported withinthe time periods specified in the SEC rules and forms. Subsequent to December 31, 2017, there were no significant changes in the internal controls or in otherfactors that could significantly affect these controls, including any corrective actions with regard to significant deficiencies and material weaknesses. Changes in Internal Control over Financial Reporting There has been no change in our internal control over financial reporting (as such term is defined in Rules 13a-15(f) and 15(d)-15(f) under the Exchange Act)that occurred during the quarter ended December 31, 2017, that has materially affected, or is reasonably likely to materially affect, our internal control overfinancial reporting. Management’s Annual Report on Internal Control over Financial Reporting We are responsible for establishing and maintaining adequate internal control over financial reporting as defined in Rules 13a-15(f) and 15d-15(f) under theExchange Act. Under the supervision and with the participation of management, including the Chief Executive Officer and Chief Financial Officer, an evaluation of theeffectiveness of the internal control over financial reporting was conducted at December 31, 2017, based on the criteria described in “Internal Control —Integrated Framework” (2013) issued by the Committee of Sponsoring Organizations of the Treadway Commission. Based on this assessment, managementdetermined that, at December 31, 2017, the internal control over financial reporting was effective. Limitations of the Effectiveness of Controls Management’s assessment included an evaluation of the design of the internal control over financial reporting and testing of the operational effectiveness of theinternal control over financial reporting. The internal control over financial reporting is a process designed to provide reasonable assurance regarding thereliability of financial reporting and the preparation of financial statements for external purposes in accordance with GAAP. Because of its inherent limitations,internal control over financial reporting may not prevent or detect misstatements. Also, projections of any evaluation of effectiveness to future periods are subjectto the risk that controls may become inadequate because of changes in conditions, or that the degree of compliance with the policies or procedures maydeteriorate. ITEM 9B. Other Information None.
42

PART III ITEM 10. Directors, Executive Officers and Corporate Governance The information required by this item is incorporated herein by reference to, including relevant sections in our 2018 Proxy Statement, under the captions entitledBoard of Directors and Corporate Governance; Executive Officers; Executive Compensation; Director Compensation; Security Ownership; Equity CompensationPlans and Additional Information or will be provided in an amendment filed on Form 10-K/A. ITEM 11. Executive Compensation The information required by this item is incorporated herein by reference to the relevant sections in our 2018 Proxy Statement, under the captions entitled Boardof Directors and Corporate Governance; Executive Officers; Executive Compensation and Director Compensation or will be provided in an amendment filed onForm 10-K/A. ITEM 12. Security Ownership of Certain Beneficial Owners and Management and Related Stockholder Matters The information required by this item is incorporated herein by reference to the relevant sections in our 2018 Proxy Statement, under the captions entitledSecurity Ownership and Equity Compensation Plans or will be provided in an amendment filed on Form 10-K/A. ITEM 13. Certain Relationships and Related Transactions, and Director Independence The information required by this item is incorporated herein by reference to the relevant sections in our 2018 Proxy Statement, under the caption entitled Boardof Directors and Corporate Governance or will be provided in an amendment filed on Form 10-K/A. ITEM 14. P rincipal Accounting Fees and Services The information required by this item is incorporated herein by reference to the relevant sections in our 2018 Proxy Statement, under the caption entitled AuditMatters or will be provided in an amendment filed on Form 10-K/A. PART IV ITEM 15. Exhibits, Financial Statements and Schedules The following documents are filed as a part of this report: (a) Financial Statements and Schedules:
1. Financial Statements:
See Index to the Consolidated Financial Statements and Schedule III on page 44 of this report, which is incorporated herein by reference.
2. Financial Statement Schedules:
Schedule III — Real Estate and Accumulated Depreciation
All other schedules have been omitted since the required information is presented in the Consolidated Financial Statements and the related notes or is notapplicable. (b) Exhibits: The Exhibits required by Item 601 of Regulation S-K are listed in the Index to the Exhibits on pages 104 to 110 of this report, which is incorporatedherein by reference. (c) Financial Statements: See Index to the Consolidated Financial Statements and Schedule III on page 44 of this report, which is incorporated by reference. ITEM 16. Form 10-K Summary Not Applicable.
43
INDEX TO THE CONSOLIDATED FINANCIAL STATEMENTS AND SCHEDULE III
Page
NumberPrologis, Inc. and Prologis, L.P.:
Reports of Independent Registered Public Accounting Firm 45Prologis, Inc.:
Consolidated Balance Sheets 48Consolidated Statements of Income 49Consolidated Statements of Comprehensive Income 50Consolidated Statements of Equity 51Consolidated Statements of Cash Flows 52
Prologis, L.P.: Consolidated Balance Sheets 53Consolidated Statements of Income 54Consolidated Statements of Comprehensive Income 55Consolidated Statements of Capital 56Consolidated Statements of Cash Flows 57
Prologis, Inc. and Prologis, L.P.: Notes to the Consolidated Financial Statements 58 Note 1. Description of the Business 58 Note 2. Summary of Significant Accounting Policies 58 Note 3. Business Combinations 65 Note 4. Real Estate 66 Note 5. Unconsolidated Entities 68 Note 6. Assets Held for Sale or Contribution 71 Note 7. Notes Receivable Backed by Real Estate 71 Note 8. Other Assets and Other Liabilities 71 Note 9. Debt 72 Note 10. Stockholders' Equity of Prologis, Inc. 75 Note 11. Partners' Capital of Prologis, L.P. 77 Note 12. Noncontrolling Interests 77 Note 13. Long-Term Compensation 78 Note 14. Income Taxes 81 Note 15. Earnings Per Common Share or Unit 82 Note 16. Financial Instruments and Fair Value Measurements 84 Note 17. Commitments and Contingencies 87 Note 18. Business Segments 88 Note 19. Supplemental Cash Flow Information 90 Note 20. Selected Quarterly Financial Data (Unaudited) 91Schedule III — Real Estate and Accumulated Depreciation 93
44
REP ORT OF INDEPENDENT REGISTERED PUBLIC ACCOUNTING FIRM
To the Stockholders and Board of DirectorsPrologis, Inc.: Opinion on the Consolidated Financial Statements We have audited the accompanying consolidated balance sheets of Prologis, Inc. and subsidiaries (the Company) as of December 31, 2017 and 2016, therelated consolidated statements of income, comprehensive income, equity, and cash flows for each of the years in the three-year period ended December 31,2017, and the related notes and financial statement schedule III (collectively, the consolidated financial statements). In our opinion, the consolidated financialstatements present fairly, in all material respects, the financial position of the Company as of December 31, 2017 and 2016, and the results of its operations andits cash flows for each of the years in the three-year period ended December 31, 2017, in conformity with U.S. generally accepted accounting principles. We also have audited, in accordance with the standards of the Public Company Accounting Oversight Board (United States) (PCAOB), the Company’s internalcontrol over financial reporting as of December 31, 2017, based on criteria established in Internal Control – Integrated Framework (2013) issued by theCommittee of Sponsoring Organizations of the Treadway Commission, and our report dated February 15, 2018 expressed an unqualified opinion on theeffectiveness of the Company’s internal control over financial reporting. Adoption of a New Accounting Pronouncement As discussed in Note 2 to the consolidated financial statements, the Company has changed its method of accounting for evaluating whether a transactionqualifies as an acquisition of an asset or a business in 2017 due to the adoption of Accounting Standards Update No. 2017-01. Basis for Opinion These consolidated financial statements are the responsibility of the Company’s management. Our responsibility is to express an opinion on these consolidatedfinancial statements based on our audits. We are a public accounting firm registered with the PCAOB and are required to be independent with respect to theCompany in accordance with the U.S. federal securities laws and the applicable rules and regulations of the Securities and Exchange Commission and thePCAOB. We conducted our audits in accordance with the standards of the PCAOB. Those standards require that we plan and perform the audit to obtain reasonableassurance about whether the consolidated financial statements are free of material misstatement, whether due to error or fraud. Our audits included performingprocedures to assess the risks of material misstatement of the consolidated financial statements, whether due to error or fraud, and performing procedures thatrespond to those risks. Such procedures included examining, on a test basis, evidence regarding the amounts and disclosures in the consolidated financialstatements. Our audits also included evaluating the accounting principles used and significant estimates made by management, as well as evaluating the overallpresentation of the consolidated financial statements. We believe that our audits provide a reasonable basis for our opinion.
/s/ KPMG LLP
We have served as the Company’s auditor since 2002. Denver, ColoradoFebruary 15, 2018
45

REPORT OF INDEPENDENT REGISTERED PUBLIC ACCOUNTING FIRM
To the PartnersPrologis, L.P.: Opinion on the Consolidated Financial Statements We have audited the accompanying consolidated balance sheets of Prologis, L.P. and subsidiaries (the Company) as of December 31, 2017 and 2016, therelated consolidated statements of income, comprehensive income, capital, and cash flows for each of the years in the three-year period ended December 31,2017, and the related notes to the consolidated financial statements and financial statement schedule III (collectively, the consolidated financial statements). Inour opinion, the consolidated financial statements present fairly, in all material respects, the financial position of the Company as of December 31, 2017 and2016, and the results of its operations and its cash flows for each of the years in the three-year period ended December 31, 2017, in conformity with U.S.generally accepted accounting principles. Adoption of a New Accounting Pronouncement As discussed in Note 2 to the consolidated financial statements, the Company has changed its method of accounting for evaluating whether a transactionqualifies as an acquisition of an asset or a business in 2017 due to the adoption of Accounting Standards Update No. 2017-01. Basis for Opinion These consolidated financial statements are the responsibility of the Company’s management. Our responsibility is to express an opinion on these consolidatedfinancial statements based on our audits. We are a public accounting firm registered with the Public Company Accounting Oversight Board (United States)(PCAOB) and are required to be independent with respect to the Company in accordance with the U.S. federal securities laws and the applicable rules andregulations of the Securities and Exchange Commission and the PCAOB. We conducted our audits in accordance with the standards of the PCAOB. Those standards require that we plan and perform the audit to obtain reasonableassurance about whether the consolidated financial statements are free of material misstatement, whether due to error or fraud. The Company is not required tohave, nor were we engaged to perform, an audit of its internal control over financial reporting. As part of our audits, we are required to obtain an understandingof internal control over financial reporting but not for the purpose of expressing an opinion on the effectiveness of the Company’s internal control over financialreporting. Accordingly, we express no such opinion. Our audits included performing procedures to assess the risks of material misstatement of the consolidated financial statements, whether due to error or fraud,and performing procedures that respond to those risks. Such procedures included examining, on a test basis, evidence regarding the amounts and disclosures inthe consolidated financial statements. Our audits also included evaluating the accounting principles used and significant estimates made by management, aswell as evaluating the overall presentation of the consolidated financial statements. We believe that our audits provide a reasonable basis for our opinion.
/s/ KPMG LLP
We have served as the Company’s auditor since 2002. Denver, ColoradoFebruary 15, 2018
46
REPORT OF INDEPENDENT REGISTERED PUBLIC ACCOUNTING FIRM
To the Stockholders and Board of DirectorsPrologis, Inc.: Opinion on Internal Control Over Financial Reporting We have audited Prologis, Inc. and subsidiaries (the Company) internal control over financial reporting as of December 31, 2017, based on criteria established inInternal Control – Integrated Framework (2013) issued by the Committee of Sponsoring Organizations of the Treadway Commission. In our opinion, theCompany maintained, in all material respects, effective internal control over financial reporting as of December 31, 2017, based on criteria established in InternalControl – Integrated Framework (2013) issued by the Committee of Sponsoring Organizations of the Treadway Commission. We also have audited, in accordance with the standards of the Public Company Accounting Oversight Board (United States) (PCAOB), the consolidated balancesheets of the Company as of December 31, 2017 and 2016, the related consolidated statements of income, comprehensive income, equity, and cash flows foreach of the years in the three-year period ended December 31, 2017, and the related notes and financial statement schedule III (collectively, the consolidatedfinancial statements), and our report dated February 15, 2018 expressed an unqualified opinion on those consolidated financial statements. Basis for Opinion The Company’s management is responsible for maintaining effective internal control over financial reporting and for its assessment of the effectiveness ofinternal control over financial reporting, included in the accompanying Management’s Annual Report on Internal Control over Financial Reporting. Ourresponsibility is to express an opinion on the Company’s internal control over financial reporting based on our audit. We are a public accounting firm registeredwith the PCAOB and are required to be independent with respect to the Company in accordance with the U.S. federal securities laws and the applicable rulesand regulations of the Securities and Exchange Commission and the PCAOB. We conducted our audit in accordance with the standards of the PCAOB. Those standards require that we plan and perform the audit to obtain reasonableassurance about whether effective internal control over financial reporting was maintained in all material respects. Our audit of internal control over financialreporting included obtaining an understanding of internal control over financial reporting, assessing the risk that a material weakness exists, and testing andevaluating the design and operating effectiveness of internal control based on the assessed risk. Our audit also included performing such other procedures aswe considered necessary in the circumstances. We believe that our audit provides a reasonable basis for our opinion. Definition and Limitations of Internal Control Over Financial Reporting A company’s internal control over financial reporting is a process designed to provide reasonable assurance regarding the reliability of financial reporting and thepreparation of financial statements for external purposes in accordance with generally accepted accounting principles. A company’s internal control over financialreporting includes those policies and procedures that (1) pertain to the maintenance of records that, in reasonable detail, accurately and fairly reflect thetransactions and dispositions of the assets of the company; (2) provide reasonable assurance that transactions are recorded as necessary to permit preparationof financial statements in accordance with generally accepted accounting principles, and that receipts and expenditures of the company are being made only inaccordance with authorizations of management and directors of the company; and (3) provide reasonable assurance regarding prevention or timely detection ofunauthorized acquisition, use, or disposition of the company’s assets that could have a material effect on the financial statements. Because of its inherent limitations, internal control over financial reporting may not prevent or detect misstatements. Also, projections of any evaluation ofeffectiveness to future periods are subject to the risk that controls may become inadequate because of changes in conditions, or that the degree of compliancewith the policies or procedures may deteriorate.
/s/ KPMG LLP Denver, ColoradoFebruary 15, 2018
47

PROLOGIS, INC.
CONSOLIDATED BALANCE SHEETS(In thousands, except per share data)
December 31, 2017 2016 ASSETS Investments in real estate properties $ 25,838,644 $ 27,119,330 Less accumulated depreciation 4,059,348 3,758,372 Net investments in real estate properties 21,779,296 23,360,958
Investments in and advances to unconsolidated entities 5,496,450 4,230,429 Assets held for sale or contribution 342,060 322,139 Notes receivable backed by real estate 34,260 32,100 Net investments in real estate 27,652,066 27,945,626
Cash and cash equivalents 447,046 807,316 Other assets 1,381,963 1,496,990
Total assets $ 29,481,075 $ 30,249,932 LIABILITIES AND EQUITY Liabilities: Debt $ 9,412,631 $ 10,608,294 Accounts payable and accrued expenses 702,804 556,179 Other liabilities 659,899 627,319 Total liabilities 10,775,334 11,791,792
Equity: Prologis, Inc. stockholders’ equity: Series Q preferred stock at stated liquidation preference of $50 per share; $0.01 par value; 1,379 and 1,565 shares issued and outstanding and 100,000 preferred shares authorized at December 31, 2017, and 2016, respectively 68,948 78,235 Common stock; $0.01 par value; 532,186 shares and 528,671 shares issued and outstanding at December 31, 2017, and 2016, respectively 5,322 5,287 Additional paid-in capital 19,363,007 19,455,039 Accumulated other comprehensive loss (901,658) (937,473)Distributions in excess of net earnings (2,904,461) (3,610,007)Total Prologis, Inc. stockholders’ equity 15,631,158 14,991,081
Noncontrolling interests 3,074,583 3,467,059 Total equity 18,705,741 18,458,140
Total liabilities and equity $ 29,481,075 $ 30,249,932
The accompanying notes are an integral part of these Consolidated Financial Statements.
48
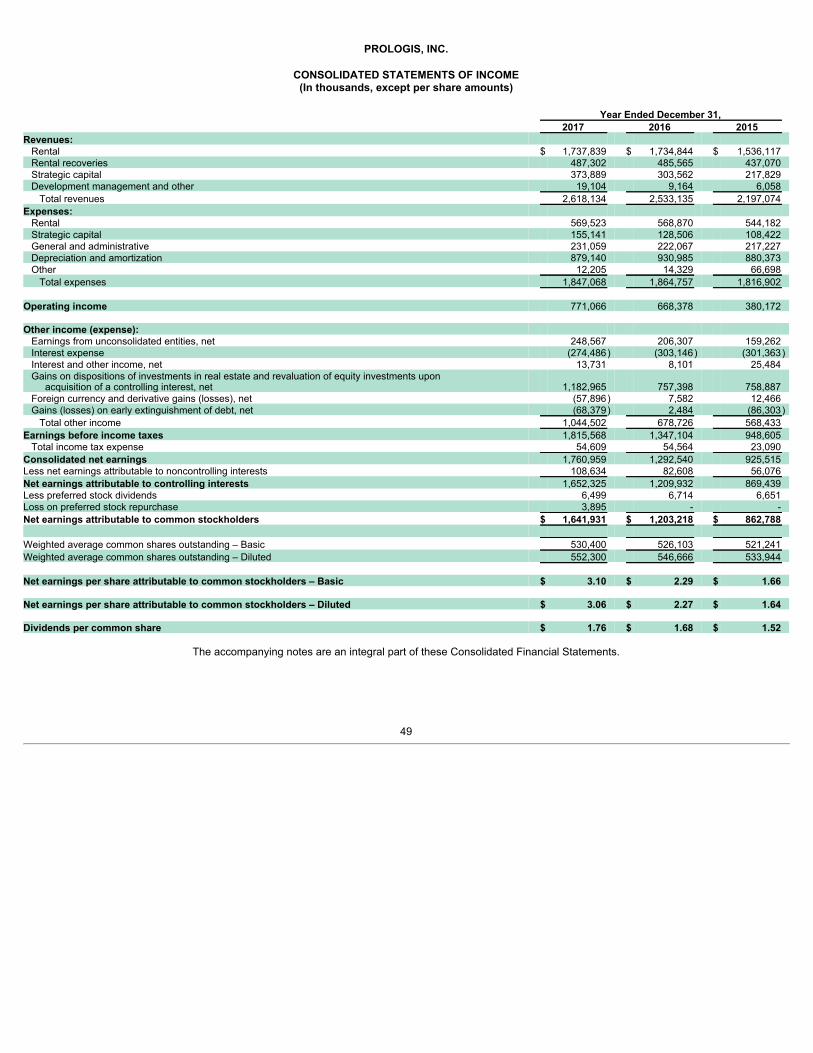
PROLOGIS, INC.
CONSOLIDATED STATEMENTS OF INCOME
(In thousands, except per share amounts) Year Ended December 31, 2017 2016 2015 Revenues: Rental $ 1,737,839 $ 1,734,844 $ 1,536,117 Rental recoveries 487,302 485,565 437,070 Strategic capital 373,889 303,562 217,829 Development management and other 19,104 9,164 6,058 Total revenues 2,618,134 2,533,135 2,197,074
Expenses: Rental 569,523 568,870 544,182 Strategic capital 155,141 128,506 108,422 General and administrative 231,059 222,067 217,227 Depreciation and amortization 879,140 930,985 880,373 Other 12,205 14,329 66,698 Total expenses 1,847,068 1,864,757 1,816,902
Operating income 771,066 668,378 380,172 Other income (expense): Earnings from unconsolidated entities, net 248,567 206,307 159,262 Interest expense (274,486) (303,146) (301,363)Interest and other income, net 13,731 8,101 25,484 Gains on dispositions of investments in real estate and revaluation of equity investments upon acquisition of a controlling interest, net 1,182,965 757,398 758,887 Foreign currency and derivative gains (losses), net (57,896) 7,582 12,466 Gains (losses) on early extinguishment of debt, net (68,379) 2,484 (86,303)Total other income 1,044,502 678,726 568,433
Earnings before income taxes 1,815,568 1,347,104 948,605 Total income tax expense 54,609 54,564 23,090
Consolidated net earnings 1,760,959 1,292,540 925,515 Less net earnings attributable to noncontrolling interests 108,634 82,608 56,076 Net earnings attributable to controlling interests 1,652,325 1,209,932 869,439 Less preferred stock dividends 6,499 6,714 6,651 Loss on preferred stock repurchase 3,895 - - Net earnings attributable to common stockholders $ 1,641,931 $ 1,203,218 $ 862,788 Weighted average common shares outstanding – Basic 530,400 526,103 521,241 Weighted average common shares outstanding – Diluted 552,300 546,666 533,944 Net earnings per share attributable to common stockholders – Basic $ 3.10 $ 2.29 $ 1.66 Net earnings per share attributable to common stockholders – Diluted $ 3.06 $ 2.27 $ 1.64 Dividends per common share $ 1.76 $ 1.68 $ 1.52
The accompanying notes are an integral part of these Consolidated Financial Statements.
49

PROLOGIS, INC.
CONSOLIDATED ST ATEMENTS OF COMPREHENSIVE INCOME
(In thousands ) Year Ended December 31, 2017 2016 2015 Consolidated net earnings $ 1,760,959 $ 1,292,540 $ 925,515 Other comprehensive income (loss): Foreign currency translation gains (losses), net 63,455 (135,958) (208,901)Unrealized gains (losses) on derivative contracts, net 22,591 (1,349) (17,457)
Comprehensive income 1,847,005 1,155,233 699,157 Net earnings attributable to noncontrolling interests (108,634) (82,608) (56,076)Other comprehensive loss (gain) attributable to noncontrolling interests (50,231) (8,737) 35,266
Comprehensive income attributable to common stockholders $ 1,688,140 $ 1,063,888 $ 678,347
The accompanying notes are an integral part of these Consolidated Financial Statements.
50
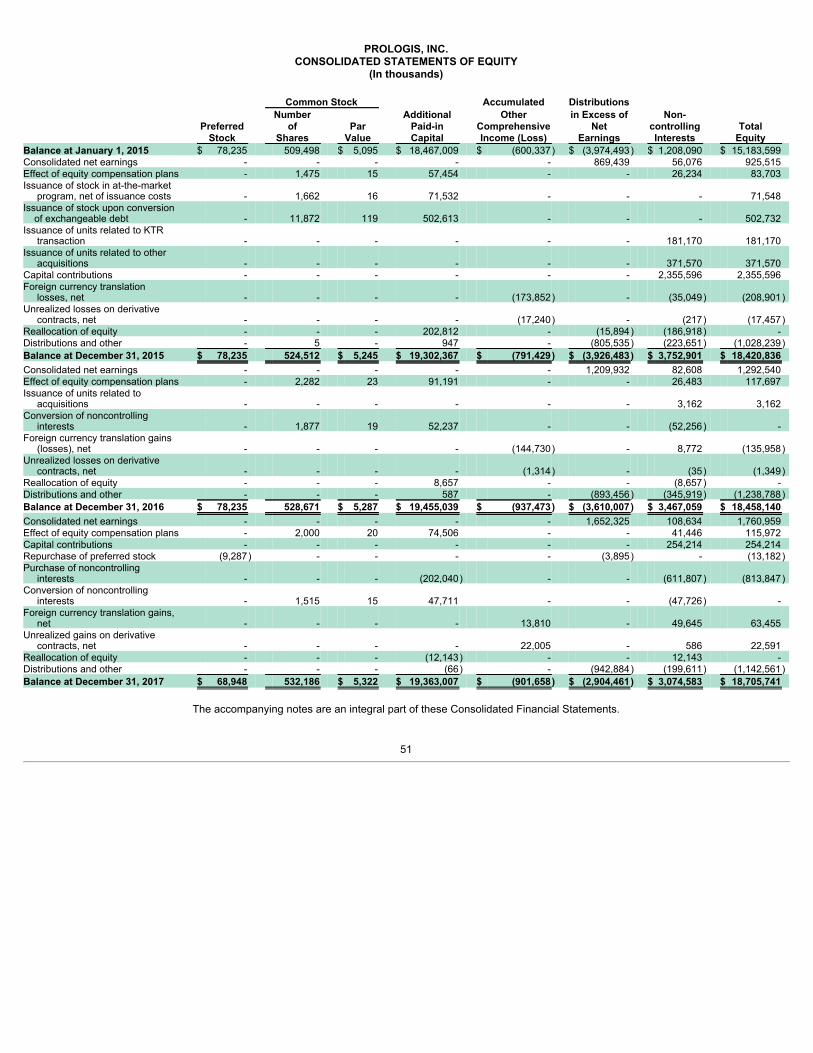
PROLOGIS, INC.
CONSOLIDATED STATEMENTS OF EQUITY(In thousands)
Common Stock Accumulated Distributions
Number Additional Other in Excess of Non- Preferred of Par Paid-in Comprehensive Net controlling Total
Stock Shares Value Capital Income (Loss) Earnings Interests Equity Balance at January 1, 2015 $ 78,235 509,498 $ 5,095 $ 18,467,009 $ (600,337) $ (3,974,493) $ 1,208,090 $ 15,183,599 Consolidated net earnings - - - - - 869,439 56,076 925,515 Effect of equity compensation plans - 1,475 15 57,454 - - 26,234 83,703 Issuance of stock in at-the-market program, net of issuance costs - 1,662 16 71,532 - - - 71,548 Issuance of stock upon conversion of exchangeable debt - 11,872 119 502,613 - - - 502,732 Issuance of units related to KTR transaction - - - - - - 181,170 181,170 Issuance of units related to other acquisitions - - - - - - 371,570 371,570 Capital contributions - - - - - - 2,355,596 2,355,596 Foreign currency translation losses, net - - - - (173,852) - (35,049) (208,901)Unrealized losses on derivative contracts, net - - - - (17,240) - (217) (17,457)Reallocation of equity - - - 202,812 - (15,894) (186,918) - Distributions and other - 5 - 947 - (805,535) (223,651) (1,028,239)Balance at December 31, 2015 $ 78,235 524,512 $ 5,245 $ 19,302,367 $ (791,429) $ (3,926,483) $ 3,752,901 $ 18,420,836 Consolidated net earnings - - - - - 1,209,932 82,608 1,292,540 Effect of equity compensation plans - 2,282 23 91,191 - - 26,483 117,697 Issuance of units related to acquisitions - - - - - - 3,162 3,162 Conversion of noncontrolling interests - 1,877 19 52,237 - - (52,256) - Foreign currency translation gains (losses), net - - - - (144,730) - 8,772 (135,958)Unrealized losses on derivative contracts, net - - - - (1,314) - (35) (1,349)Reallocation of equity - - - 8,657 - - (8,657) - Distributions and other - - - 587 - (893,456) (345,919) (1,238,788)Balance at December 31, 2016 $ 78,235 528,671 $ 5,287 $ 19,455,039 $ (937,473) $ (3,610,007) $ 3,467,059 $ 18,458,140 Consolidated net earnings - - - - - 1,652,325 108,634 1,760,959 Effect of equity compensation plans - 2,000 20 74,506 - - 41,446 115,972 Capital contributions - - - - - - 254,214 254,214 Repurchase of preferred stock (9,287) - - - - (3,895) - (13,182)Purchase of noncontrolling interests - - - (202,040) - - (611,807) (813,847)Conversion of noncontrolling interests - 1,515 15 47,711 - - (47,726) - Foreign currency translation gains, net - - - - 13,810 - 49,645 63,455 Unrealized gains on derivative contracts, net - - - - 22,005 - 586 22,591 Reallocation of equity - - - (12,143) - - 12,143 - Distributions and other - - - (66) - (942,884) (199,611) (1,142,561)Balance at December 31, 2017 $ 68,948 532,186 $ 5,322 $ 19,363,007 $ (901,658) $ (2,904,461) $ 3,074,583 $ 18,705,741
The accompanying notes are an integral part of these Consolidated Financial Statements.
51

PROLOGIS, INC.
CONSOLI DATED STATEMENTS OF CASH FLOWS
(In thousands) Years Ended December 31, 2017 2016 2015 Operating activities: Consolidated net earnings $ 1,760,959 $ 1,292,540 $ 925,515 Adjustments to reconcile net earnings to net cash provided by operating activities: Straight-lined rents and amortization of above and below market leases (81,021) (93,608) (59,619)Equity-based compensation awards 76,640 60,341 53,665 Depreciation and amortization 879,140 930,985 880,373 Earnings from unconsolidated entities, net (248,567) (206,307) (159,262)Distributions from unconsolidated entities 307,220 286,651 284,664 Decrease (increase) in operating receivables from unconsolidated entities (30,893) 14,823 (38,185)Amortization of debt discounts (premiums), net of debt issuance costs 751 (15,137) (31,841)Gains on dispositions of investments in real estate and revaluation of equity investments upon acquisition of a controlling interest, net (1,182,965) (757,398) (758,887)Unrealized foreign currency and derivative losses (gains), net 68,956 (8,052) (1,019)Losses (gains) on early extinguishment of debt, net 68,379 (2,484) 86,303 Deferred income tax benefit (5,005) (5,525) (5,057)
Decrease (increase) in accounts receivable and other assets 37,278 (106,337) (64,749)Increase in accounts payable and accrued expenses and other liabilities 36,374 26,513 4,426
Net cash provided by operating activities 1,687,246 1,417,005 1,116,327 Investing activities: Real estate development (1,606,133) (1,641,560) (1,339,904)Real estate acquisitions (442,696) (458,516) (890,183)KTR transaction, net of cash received - - (4,809,499)Tenant improvements and lease commissions on previously leased space (153,255) (165,933) (154,564)Nondevelopment capital expenditures (110,635) (101,677) (83,351)Proceeds from dispositions and contributions of real estate properties 3,236,603 2,826,408 2,795,249 Investments in and advances to unconsolidated entities (249,735) (265,951) (474,420)Acquisition of a controlling interest in an unconsolidated venture, net of cash received (374,605) - - Return of investment from unconsolidated entities 209,151 776,550 29,406 Proceeds from repayment of notes receivable backed by real estate 32,100 202,950 9,866 Proceeds from the settlement of net investment hedges 7,541 79,767 129,149 Payments on the settlement of net investment hedges (5,058) - (981)Net cash provided by (used in) investing activities 543,278 1,252,038 (4,789,232)
Financing activities: Proceeds from issuance of common stock 32,858 39,470 90,258 Dividends paid on common and preferred stock (942,884) (893,455) (804,697)Repurchase of preferred stock (13,182) - - Noncontrolling interests contributions 240,925 2,168 2,355,367 Noncontrolling interests distributions (207,788) (343,550) (215,740)Purchase of noncontrolling interests (813,847) (3,083) (2,560)Tax paid for shares withheld (19,775) (8,570) (12,298)Debt and equity issuance costs paid (7,054) (20,123) (32,012)Net proceeds from (payments on) credit facilities 283,255 33,435 (7,970)Repurchase and payments of debt (3,578,889) (2,301,647) (3,156,294)Proceeds from issuance of debt 2,419,797 1,369,890 5,381,862 Net cash provided by (used in) financing activities (2,606,584) (2,125,465) 3,595,916
Effect of foreign currency exchange rate changes on cash 15,790 (342) (9,623)Net increase (decrease) in cash and cash equivalents (360,270) 543,236 (86,612)Cash and cash equivalents, beginning of year 807,316 264,080 350,692 Cash and cash equivalents, end of year $ 447,046 $ 807,316 $ 264,080
See Note 19 for information on noncash investing and financing activities and other information.
The accompanying notes are an integral part of these Consolidated Financial Statements.
52
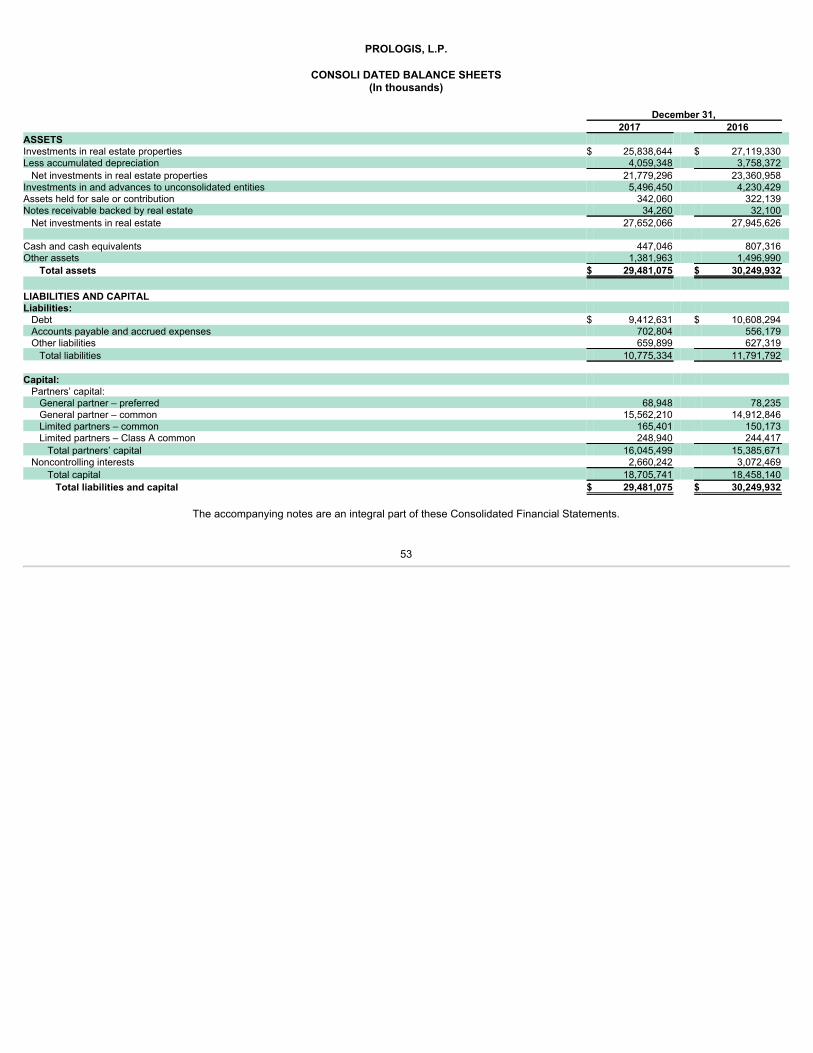
PROLOGIS, L.P.
CONSOLI DATED BALANCE SHEETS
(In thousands) December 31, 2017 2016 ASSETS Investments in real estate properties $ 25,838,644 $ 27,119,330 Less accumulated depreciation 4,059,348 3,758,372 Net investments in real estate properties 21,779,296 23,360,958
Investments in and advances to unconsolidated entities 5,496,450 4,230,429 Assets held for sale or contribution 342,060 322,139 Notes receivable backed by real estate 34,260 32,100 Net investments in real estate 27,652,066 27,945,626
Cash and cash equivalents 447,046 807,316 Other assets 1,381,963 1,496,990
Total assets $ 29,481,075 $ 30,249,932 LIABILITIES AND CAPITAL Liabilities: Debt $ 9,412,631 $ 10,608,294 Accounts payable and accrued expenses 702,804 556,179 Other liabilities 659,899 627,319 Total liabilities 10,775,334 11,791,792
Capital: Partners’ capital: General partner – preferred 68,948 78,235 General partner – common 15,562,210 14,912,846 Limited partners – common 165,401 150,173 Limited partners – Class A common 248,940 244,417 Total partners’ capital 16,045,499 15,385,671
Noncontrolling interests 2,660,242 3,072,469 Total capital 18,705,741 18,458,140
Total liabilities and capital $ 29,481,075 $ 30,249,932
The accompanying notes are an integral part of these Consolidated Financial Statements.
53

PROLOGIS, L.P.
CONSOL IDATED STATEMENTS OF INCOME
(In thousands, except per unit amounts) Year Ended December 31, 2017 2016 2015 Revenues: Rental $ 1,737,839 $ 1,734,844 $ 1,536,117 Rental recoveries 487,302 485,565 437,070 Strategic capital 373,889 303,562 217,829 Development management and other 19,104 9,164 6,058 Total revenues 2,618,134 2,533,135 2,197,074
Expenses: Rental 569,523 568,870 544,182 Strategic capital 155,141 128,506 108,422 General and administrative 231,059 222,067 217,227 Depreciation and amortization 879,140 930,985 880,373 Other 12,205 14,329 66,698 Total expenses 1,847,068 1,864,757 1,816,902
Operating income 771,066 668,378 380,172 Other income (expense): Earnings from unconsolidated entities, net 248,567 206,307 159,262 Interest expense (274,486) (303,146) (301,363)Interest and other income, net 13,731 8,101 25,484 Gains on dispositions of investments in real estate and revaluation of equity investments upon acquisition of a controlling interest, net 1,182,965 757,398 758,887 Foreign currency and derivative gains (losses), net (57,896) 7,582 12,466 Gains (losses) on early extinguishment of debt, net (68,379) 2,484 (86,303)Total other income 1,044,502 678,726 568,433
Earnings before income taxes 1,815,568 1,347,104 948,605 Total income tax expense 54,609 54,564 23,090
Consolidated net earnings 1,760,959 1,292,540 925,515 Less net earnings attributable to noncontrolling interests 63,620 48,307 44,950 Net earnings attributable to controlling interests 1,697,339 1,244,233 880,565 Less preferred unit distributions 6,499 6,714 6,651 Loss on preferred unit repurchase 3,895 - - Net earnings attributable to common unitholders $ 1,686,945 $ 1,237,519 $ 873,914 Weighted average common units outstanding – Basic 536,335 532,326 525,912 Weighted average common units outstanding – Diluted 552,300 546,666 533,944 Net earnings per unit attributable to common unitholders – Basic $ 3.10 $ 2.29 $ 1.66 Net earnings per unit attributable to common unitholders – Diluted $ 3.06 $ 2.27 $ 1.64 Distributions per common unit $ 1.76 $ 1.68 $ 1.52
The accompanying notes are an integral part of these Consolidated Financial Statements.
54
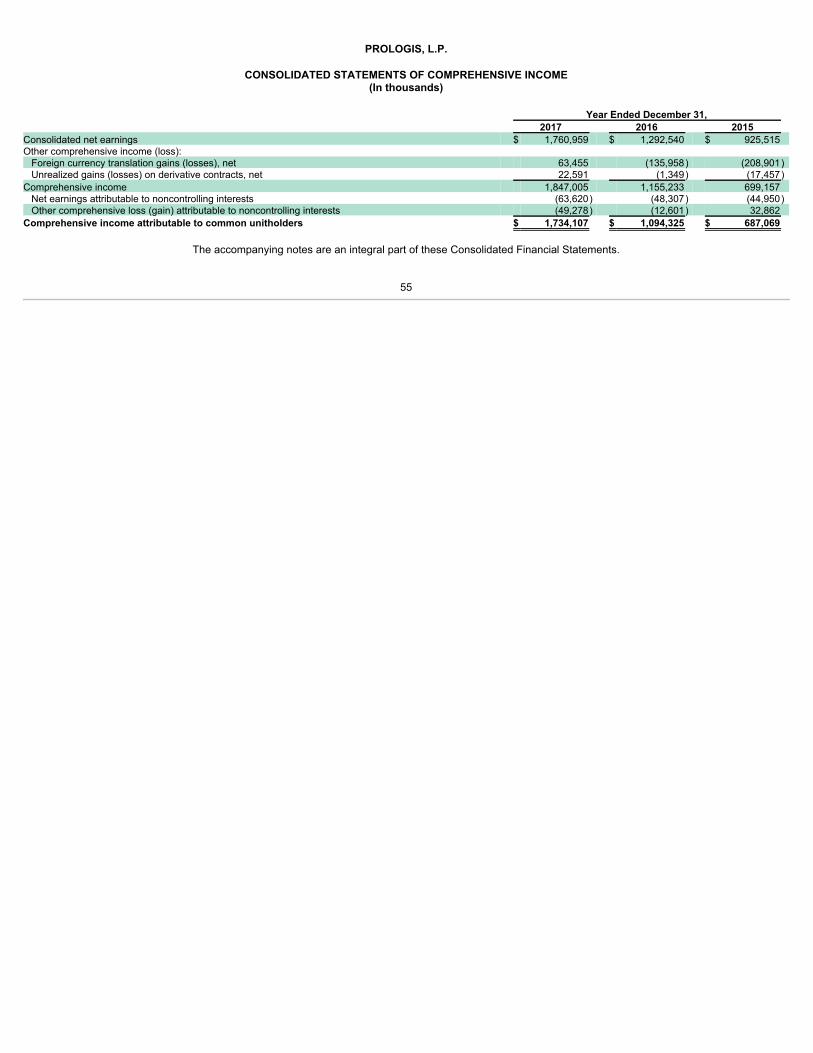
PROLOGIS, L.P.
CONSOLIDATED STATEMENTS OF COMPREHENSIVE INCOME
(In thousands) Year Ended December 31, 2017 2016 2015 Consolidated net earnings $ 1,760,959 $ 1,292,540 $ 925,515 Other comprehensive income (loss): Foreign currency translation gains (losses), net 63,455 (135,958) (208,901)Unrealized gains (losses) on derivative contracts, net 22,591 (1,349) (17,457)
Comprehensive income 1,847,005 1,155,233 699,157 Net earnings attributable to noncontrolling interests (63,620) (48,307) (44,950)Other comprehensive loss (gain) attributable to noncontrolling interests (49,278) (12,601) 32,862
Comprehensive income attributable to common unitholders $ 1,734,107 $ 1,094,325 $ 687,069
The accompanying notes are an integral part of these Consolidated Financial Statements.
55
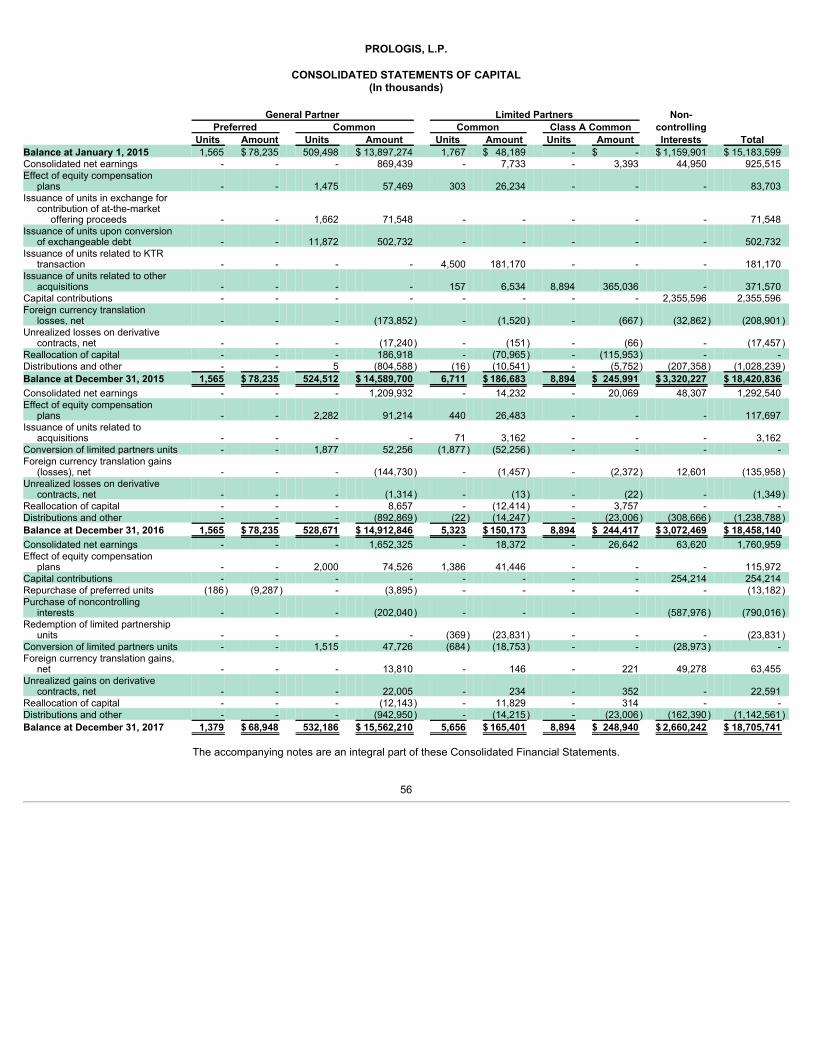
PROLOGIS, L.P.
CONSOLIDATED STATEMENTS OF CAPITAL
(In thousands) General Partner Limited Partners Non-
Preferred Common Common Class A Common controlling Units Amount Units Amount Units Amount Units Amount Interests Total Balance at January 1, 2015 1,565 $ 78,235 509,498 $ 13,897,274 1,767 $ 48,189 - $ - $ 1,159,901 $ 15,183,599 Consolidated net earnings - - - 869,439 - 7,733 - 3,393 44,950 925,515 Effect of equity compensation plans - - 1,475 57,469 303 26,234 - - - 83,703 Issuance of units in exchange for contribution of at-the-market offering proceeds - - 1,662 71,548 - - - - - 71,548 Issuance of units upon conversion of exchangeable debt - - 11,872 502,732 - - - - - 502,732 Issuance of units related to KTR transaction - - - - 4,500 181,170 - - - 181,170 Issuance of units related to other acquisitions - - - - 157 6,534 8,894 365,036 - 371,570 Capital contributions - - - - - - - - 2,355,596 2,355,596 Foreign currency translation losses, net - - - (173,852) - (1,520) - (667) (32,862) (208,901)Unrealized losses on derivative contracts, net - - - (17,240) - (151) - (66) - (17,457)Reallocation of capital - - - 186,918 - (70,965) - (115,953) - - Distributions and other - - 5 (804,588) (16) (10,541) - (5,752) (207,358) (1,028,239)Balance at December 31, 2015 1,565 $ 78,235 524,512 $ 14,589,700 6,711 $ 186,683 8,894 $ 245,991 $ 3,320,227 $ 18,420,836 Consolidated net earnings - - - 1,209,932 - 14,232 - 20,069 48,307 1,292,540 Effect of equity compensation plans - - 2,282 91,214 440 26,483 - - - 117,697 Issuance of units related to acquisitions - - - - 71 3,162 - - - 3,162 Conversion of limited partners units - - 1,877 52,256 (1,877) (52,256) - - - - Foreign currency translation gains (losses), net - - - (144,730) - (1,457) - (2,372) 12,601 (135,958)Unrealized losses on derivative contracts, net - - - (1,314) - (13) - (22) - (1,349)Reallocation of capital - - - 8,657 - (12,414) - 3,757 - - Distributions and other - - - (892,869) (22) (14,247) - (23,006) (308,666) (1,238,788)Balance at December 31, 2016 1,565 $ 78,235 528,671 $ 14,912,846 5,323 $ 150,173 8,894 $ 244,417 $ 3,072,469 $ 18,458,140 Consolidated net earnings - - - 1,652,325 - 18,372 - 26,642 63,620 1,760,959 Effect of equity compensation plans - - 2,000 74,526 1,386 41,446 - - - 115,972 Capital contributions - - - - - - - - 254,214 254,214 Repurchase of preferred units (186) (9,287) - (3,895) - - - - - (13,182)Purchase of noncontrolling interests - - - (202,040) - - - - (587,976) (790,016)Redemption of limited partnership units - - - - (369) (23,831) - - - (23,831)Conversion of limited partners units - - 1,515 47,726 (684) (18,753) - - (28,973) - Foreign currency translation gains, net - - - 13,810 - 146 - 221 49,278 63,455 Unrealized gains on derivative contracts, net - - - 22,005 - 234 - 352 - 22,591 Reallocation of capital - - - (12,143) - 11,829 - 314 - - Distributions and other - - - (942,950) - (14,215) - (23,006) (162,390) (1,142,561)Balance at December 31, 2017 1,379 $ 68,948 532,186 $ 15,562,210 5,656 $ 165,401 8,894 $ 248,940 $ 2,660,242 $ 18,705,741
The accompanying notes are an integral part of these Consolidated Financial Statements.
56

PROLOGIS, L.P
CONSOLIDATED STATEMENTS OF CASH FLOWS
(In thousands) Years Ended December 31, 2017 2016 2015 Operating activities: Consolidated net earnings $ 1,760,959 $ 1,292,540 $ 925,515 Adjustments to reconcile net earnings to net cash provided by operating activities: Straight-lined rents and amortization of above and below market leases (81,021) (93,608) (59,619)Equity-based compensation awards 76,640 60,341 53,665 Depreciation and amortization 879,140 930,985 880,373 Earnings from unconsolidated entities, net (248,567) (206,307) (159,262)Distributions from unconsolidated entities 307,220 286,651 284,664 Decrease (increase) in operating receivables from unconsolidated entities (30,893) 14,823 (38,185)Amortization of debt discounts (premiums), net of debt issuance costs 751 (15,137) (31,841)Gains on dispositions of investments in real estate and revaluation of equity investments upon acquisition of a controlling interest, net (1,182,965) (757,398) (758,887)Unrealized foreign currency and derivative losses (gains), net 68,956 (8,052) (1,019)Losses (gains) on early extinguishment of debt, net 68,379 (2,484) 86,303 Deferred income tax benefit (5,005) (5,525) (5,057)
Decrease (increase) in accounts receivable and other assets 37,278 (106,337) (64,749)Increase in accounts payable and accrued expenses and other liabilities 36,374 26,513 4,426
Net cash provided by operating activities 1,687,246 1,417,005 1,116,327 Investing activities: Real estate development (1,606,133) (1,641,560) (1,339,904)Real estate acquisitions (442,696) (458,516) (890,183)KTR transaction, net of cash received - - (4,809,499)Tenant improvements and lease commissions on previously leased space (153,255) (165,933) (154,564)Nondevelopment capital expenditures (110,635) (101,677) (83,351)Proceeds from dispositions and contributions of real estate properties 3,236,603 2,826,408 2,795,249 Investments in and advances to unconsolidated entities (249,735) (265,951) (474,420)Acquisition of a controlling interest in an unconsolidated venture, net of cash received (374,605) - - Return of investment from unconsolidated entities 209,151 776,550 29,406 Proceeds from repayment of notes receivable backed by real estate 32,100 202,950 9,866 Proceeds from the settlement of net investment hedges 7,541 79,767 129,149 Payments on the settlement of net investment hedges (5,058) - (981)Net cash provided by (used in) investing activities 543,278 1,252,038 (4,789,232)
Financing activities: Proceeds from issuance of common partnership units in exchange for contributions from Prologis, Inc. 32,858 39,470 90,258 Distributions paid on common and preferred units (980,105) (931,559) (820,989)Repurchase of preferred units (13,182) - - Noncontrolling interests contributions 240,925 2,168 2,355,367 Noncontrolling interests distributions (170,567) (306,297) (199,845)Purchase of noncontrolling interests (790,016) (2,232) (2,163)Redemption of common limited partnership units (23,831) - - Tax paid for shares of the Parent withheld (19,775) (8,570) (12,298)Debt and capital issuance costs paid (7,054) (20,123) (32,012)Net proceeds from (payments on) credit facilities 283,255 33,435 (7,970)Repurchase and payments of debt (3,578,889) (2,301,647) (3,156,294)Proceeds from issuance of debt 2,419,797 1,369,890 5,381,862 Net cash provided by (used in) financing activities (2,606,584) (2,125,465) 3,595,916
Effect of foreign currency exchange rate changes on cash 15,790 (342) (9,623)Net increase (decrease) in cash and cash equivalents (360,270) 543,236 (86,612)Cash and cash equivalents, beginning of year 807,316 264,080 350,692 Cash and cash equivalents, end of year $ 447,046 $ 807,316 $ 264,080
See Note 19 for information on noncash investing and financing activities and other information.
The accompanying notes are an integral part of these Consolidated Financial Statements.
57

PROLOGIS, INC. AND PROLOGIS, L.P.
NOTES TO THE CONSOLIDATED FINANCIAL STATEMENTS NOTE 1. DESCRIPTION OF THE BUSINESS Prologis, Inc. (or the “Parent”) commenced operations as a fully integrated real estate company in 1997, elected to be taxed as a real estate investment trust(“REIT”) under the Internal Revenue Code of 1986, as amended (the “Internal Revenue Code”), and believes the current organization and method of operationwill enable it to maintain its status as a REIT. The Parent is the general partner of Prologis, L.P. (or the “Operating Partnership” or “OP”). Through the OP, we areengaged in the ownership, acquisition, development and management of logistics properties in the world’s primary population centers and in those supported byextensive transportation infrastructure. We invest in real estate through wholly owned subsidiaries and other entities through which we co-invest with partnersand investors. We maintain a significant level of ownership in these co-investment ventures, which may be consolidated or unconsolidated based on our level ofcontrol of the entity. Our current business strategy consists of two operating business segments: Real Estate Operations and Strategic Capital. Our Real EstateOperations segment represents the ownership and development of logistics properties. Our Strategic Capital segment represents the management of co-investment ventures and other unconsolidated entities. See Note 18 for further discussion of our business segments. Unless otherwise indicated, the Notes tothe Consolidated Financial Statements apply to both the Parent and the OP. The terms “the Company,” “Prologis,” “we,” “our” or “us” means the Parent and OPcollectively. For each share of common stock or preferred stock the Parent issues, the OP issues a corresponding common or preferred partnership unit, as applicable, tothe Parent in exchange for the contribution of the proceeds from the stock issuance. At December 31, 2017, the Parent owned an approximate 97.41% commongeneral partnership interest in the OP and 100% of the preferred units in the OP. The remaining approximate 2.59% common limited partnership interests, whichinclude 8.9 million Class A common limited partnership units (“Class A Units”) in the OP, are owned by unaffiliated investors and certain current and formerdirectors and officers of the Parent. Each partner’s percentage interest in the OP is determined based on the number of OP units held, including the number ofOP units into which Class A Units are convertible, compared to total OP units outstanding at each period end and is used as the basis for the allocation of netincome or loss to each partner. At the end of each reporting period, a capital adjustment is made in the OP to reflect the appropriate ownership interest for eachof the common unitholders. These adjustments are reflected in the line items Reallocation of Equity in the Consolidated Statement of Equity of the Parent andReallocation of Capital in the Consolidated Statement of Capital of the OP. As the sole general partner of the OP, the Parent has complete responsibility and discretion in the day-to-day management and control of the OP and weoperate the Parent and the OP as one enterprise. The management of the Parent consists of the same members as the management of the OP. Thesemembers are officers of the Parent and employees of the OP or one of its subsidiaries. As general partner with control of the OP, the Parent is the primarybeneficiary and therefore consolidates the OP. Because the Parent’s only significant asset is its investment in the OP, the assets and liabilities of the Parent andthe OP are the same on their respective financial statements. Information with respect to the square footage, number of buildings and acres of land is unaudited. NOTE 2. SUMMARY OF SIGNIFICANT ACCOUNTING POLICIES Basis of Presentation and Consolidation. The accompanying Consolidated Financial Statements are prepared in accordance with United States(“U.S.”) generally accepted accounting principles (“GAAP”) and are presented in our reporting currency, the U.S. dollar. All material intercompany transactionswith consolidated entities have been eliminated. We consolidate all entities that are wholly owned and those in which we own less than 100% of the equity but control, as well as any variable interest entities(“VIEs”) in which we are the primary beneficiary. We evaluate our ability to control an entity and whether the entity is a VIE and we are the primary beneficiarythrough consideration of substantive terms of the arrangement to identify which enterprise has the power to direct the activities of the entity that mostsignificantly impacts the entity’s economic performance and the obligation to absorb losses and the right to receive benefits from the entity. For entities that are not defined as VIEs, we first consider whether we are the general partner or the limited partner (or the equivalent in such investments thatare not structured as partnerships). We consolidate entities in which we are the general partner and the limited partners in such entities do not have rights thatwould preclude control. For entities in which we are the general partner but do not control the entity as the other partners hold substantive participating or kick-out rights, we apply the equity method of accounting since, as the general partner, we have the ability to influence the venture. For ventures for which we are alimited partner or our investment is in an entity that is not structured similar to a partnership, we consider factors such as ownership interest, voting control,authority to make decisions, and contractual and substantive participating rights of the partners. In instances where the factors indicate that we have a controllingfinancial interest in the venture, we consolidate the entity. Reclassifications. Certain amounts included in the Consolidated Financial Statements for 2016 and 2015 have been reclassified to conform to the 2017financial statement presentation. Use of Estimates. GAAP requires us to make estimates and assumptions that affect the reported amounts of assets and liabilities, disclosure of contingentassets and liabilities at the date of the financial statements, and revenues and expenses during the reporting
58

period. Although we believe the assumptions and estimates we made are reasonable and appropriate, as discussed in the applicable sections throughout theConsolidated Financial Statements, different assumptions and es timates could materially impact our reported results. Foreign Operations. The U.S. dollar is the functional currency for our consolidated subsidiaries and unconsolidated entities operating in the U.S. and Mexicoand certain of our consolidated subsidiaries that operate as holding companies for foreign investments. The functional currency for our consolidated subsidiariesand unconsolidated entities operating in other countries is the principal currency in which the entity’s assets, liabilities, income and expenses are denominated,which may be different from the local currency of the country of incorporation or where the entity conducts its operations. The functional currencies of entitiesoutside of the U.S. and Mexico generally include the Brazilian real, British pound sterling, Canadian dollar, Chinese yuan, euro, Japanese yen and Singaporedollar. We take part in business transactions denominated in these and other local currencies where we operate. For our consolidated subsidiaries whose functional currency is not the U.S. dollar, we translate their financial statements into the U.S. dollar at the time weconsolidate those subsidiaries’ financial statements. Generally, assets and liabilities are translated at the exchange rate in effect at the balance sheet date. Theresulting translation adjustments are included in Accumulated Other Comprehensive Income (Loss) (“ AOCI/L ”) in the Consolidated Balance Sheets. Certainbalance sheet items, primarily equity and capital-related accounts, are reflected at the historical exchange rate. Income statement accounts are translated usingthe average exchange rate for the period and income statement accounts that represent significant nonrecurring transactions are translated at the rate in effectat the date of the transaction. We translate our share of the net operating income or losses of our unconsolidated entities at the average exchange rate for theperiod and significant nonrecurring transactions of the unconsolidated entities are translated at the rate in effect at the date of the transaction. We and certain of our consolidated subsidiaries have intercompany and third-party debt that is not denominated in the entity’s functional currency. When thedebt is remeasured against the functional currency of the entity, a gain or loss can result. The resulting adjustment is reflected in Foreign Currency andDerivative Gains (Losses), Net in the Consolidated Statements of Income, unless it is intercompany debt that is deemed to be long-term in nature and then theadjustment is reflected as a cumulative translation adjustment in AOCI/L . Acquisitions. Based on new accounting guidance, beginning January 1, 2017, we apply a screen test to evaluate if substantially all the fair value of theacquired property is concentrated in a single identifiable asset or group of similar identifiable assets to determine whether a transaction is accounted for as anasset acquisition or business combination. As most of our real estate acquisitions are concentrated in either a single or a group of similar identifiable assets, ourreal estate transactions are generally accounted for as asset acquisitions , which permits the capitalization of transaction costs to the basis of the acquiredproperty. For transactions that qualify as a business combination in 2017 and for all acquisitions in 2016 and 2015, transaction costs are expensed as incurred.Whether a transaction is determined to be an acquisition of a business or asset, we allocate the purchase price to the various components of the acquisitionbased on the fair value of the acquired assets and assumed liabilities, including an allocation to the individual buildings acquired. The initial allocation of thepurchase price is based on management’s preliminary assessment, which may differ when final information becomes available. The transaction costs related tothe acquisition of land and the formation of equity method investments are capitalized. When we obtain control of an unconsolidated entity and the acquisition qualifies as a business, we account for the acquisition in accordance with the guidancefor a business combination achieved in stages. We remeasure our previously held interest in the unconsolidated entity at its acquisition-date fair value andrecognize the resulting gain or loss, if any, in earnings at the acquisition date. We allocate the purchase price using primarily Level 2 and Level 3 inputs (further defined in Fair Value Measurements below) as follows: Investments in Real Estate Properties. We value operating properties as if vacant. We estimate fair value generally by applying an income approachmethodology using a discounted cash flow analysis. Key assumptions in the discounted cash flow analysis include market rents, growth rates and discount andcapitalization rates. We determine discount and capitalization rates by market based on recent transactions and other market data. The fair value of land isgenerally based on relevant market data, such as a comparison of the subject site to similar parcels that have recently been sold or are currently being offeredon the market for sale. Lease Intangibles . We determine the portion of the purchase price related to intangible assets and liabilities as follows:
• Above and Below Market Leases . We recognize an asset or liability for acquired in-place leases with favorable or unfavorable rents based on our estimate
of current market rents of the applicable markets. The value is recorded in either Other Assets or Other Liabilities , as appropriate, and is amortized overthe term of the respective leases, including any bargain renewal options, to rental revenues.
• Foregone Rent . We calculate the value of the revenue and recovery of costs foregone during a reasonable lease-up period, as if the space was vacant, ineach of the applicable markets. The values are recorded in Other Assets and amortized over the remaining life of the respective leases to amortizationexpense.
• Leasing Commissions. We recognize an asset for leasing commissions upon the acquisition of in-place leases based on our estimate of the cost to lease
space in the applicable markets. The value is recorded in Other Assets and amortized over the remaining life of the respective leases to amortizationexpense.
59
Debt . We estimate the fair value of debt based on contractual future cash flows discounted using borrowing spreads and market interest rates that would beavailable to us for the issuance of debt with similar terms and remaining maturities. In the case of publicly traded debt, we estimate the fair value based onavailable market data. Any discount or premium to the principal amount is included in the carrying value and amortized to interest expense over the remainingterm of the related debt using the effective interest method. Noncontrolling Interests . We estimate the portion of the fair value of the net assets owned by third parties based on the fair value of the consolidated net assets,principally real estate properties and debt. Working Capital . We estimate the fair value of other acquired assets and assumed liabilities on the best information available. Fair Value Measurements. The objective of fair value is to determine the price that would be received on the sale of an asset or paid to transfer a liability in anorderly transaction between market participants at the measurement date (the exit price). We estimate fair value using available market information and valuationmethodologies we believe to be appropriate for these purposes. Considerable judgment and a high degree of subjectivity are involved in developing theseestimates and, accordingly, they are not necessarily indicative of amounts that we would realize on disposition. The fair value hierarchy consists of three broadlevels: • Level 1 — Quoted prices (unadjusted) in active markets for identical assets or liabilities that the entity can access at the measurement date. • Level 2 — Inputs other than quoted prices included within Level 1 that are observable for the asset or liability, either directly or indirectly. • Level 3 — Unobservable inputs for the asset or liability. Fair Value Measurements on a Recurring Basis. We estimate the fair value of our financial instruments using available market information and valuationmethodologies we believe to be appropriate for these purposes. We determine the fair value of our derivative financial instruments using widely accepted valuation techniques including discounted cash flow analysis on theexpected cash flows of each derivative. This analysis reflects the contractual terms of the derivatives, including the period to maturity, and uses observablemarket-based inputs, including interest rate curves, foreign exchange rates, and implied volatilities. We determine the fair values of our interest rate swaps usingthe market standard methodology of netting the discounted future fixed cash receipts or payments and the discounted expected variable cash payments. Webase the variable cash payments on an expectation of future interest rates, or forward curves, derived from observable market interest rate curves. We base thefair values of our net investment hedges on the change in the spot rate at the end of the period as compared with the strike price at inception. We incorporate credit valuation adjustments to appropriately reflect nonperformance risk for us and the respective counterparty in the fair value measurements.In adjusting the fair value of our derivative contracts for the effect of nonperformance risk, we consider the impact of netting and any applicable creditenhancements, such as collateral postings, thresholds, mutual puts and guarantees. We have determined that the majority of the inputs used to value our derivatives fall within Level 2 of the fair value hierarchy. Although the credit valuationadjustments associated with our derivatives utilize Level 3 inputs, such as estimates of current credit spreads to evaluate the likelihood of default by us and ourcounterparties, we assess the significance of the impact of the credit valuation adjustments on the overall valuation of our derivative positions and havedetermined that the credit valuation adjustments are not significant to the overall valuation of our derivatives. Fair Value Measurements on a Nonrecurring Basis. Assets measured at fair value on a nonrecurring basis generally consist of real estate assets andinvestments in unconsolidated entities that were subject to impairment charges related to our change of intent to sell the investments and through ourrecoverability analysis discussed below. We estimate fair value based on expected sales prices in the market (Level 2) or by applying the income approachmethodology using a discounted cash flow analysis (Level 3). Fair Value of Financial Instruments. We estimate the fair value of our senior notes for disclosure purposes based on quoted market prices for the same (Level 1)or similar (Level 2) issues when current quoted market prices are available. We estimate the fair value of our credit facilities, term loans, secured mortgage debtand assessment bonds by discounting the future cash flows using rates and borrowing spreads currently available to us (Level 3). Real Estate Assets. Real estate assets are carried at depreciated cost. We capitalize costs incurred in developing, renovating, rehabilitating and improving realestate assets as part of the investment basis. We expense costs for repairs and maintenance as incurred. During the land development and construction periods of qualifying projects, we capitalize interest costs, insurance, real estate taxes and general andadministrative costs of the personnel performing the development, renovation, and rehabilitation; if such costs are incremental and identifiable to a specificactivity to ready the asset for its intended use. We capitalize transaction costs related to the acquisition of land for future development and operating propertiesthat qualify as asset acquisitions. We capitalize costs incurred to successfully originate a lease that result directly from and are essential to acquire that lease,including internal costs that are
60

incremental and identifiable as leasing activities. Leasing costs that meet the requirements for capitalization are presented as a component of Other Assets . We charge the depreciable portions of real estate assets to depreciation expense on a straight-line basis over the respective estimated useful lives. Depreciationcommences when the asset is ready for its intended use, which we define as the earlier of stabilization (90% occupied) or one year after completion ofconstruction. We generally use the following useful lives: 5 to 7 years for capital improvements, 10 years for standard tenant improvements, 25 years fordepreciable land improvements, 30 years for operating properties acquired and 40 years for operating properties we develop. We depreciate buildingimprovements on land parcels subject to ground leases over the shorter of the estimated building improvement life or the contractual term of the underlyingground lease. Capitalized leasing costs are amortized over the estimated remaining lease term. Our weighted average lease term on leases signed during 2017,based on square feet for all leases, was 54 months. We assess the carrying values of our respective real estate assets, whenever events or changes in circumstances indicate that the carrying amounts of theseassets may not be fully recoverable. We measure the recoverability of the asset by comparing the carrying amount of the asset to the estimated futureundiscounted cash flows. If our analysis indicates that the carrying value of the real estate property is not recoverable on an undiscounted cash flow basis, werecognize an impairment charge for the amount by which the carrying value exceeds the current estimated fair value of the real estate property. We estimate the future undiscounted cash flows and fair value based on our intent as follows: • for real estate properties that we intend to hold long-term; including land held for development, properties currently under development and operating
properties; recoverability is assessed based on the estimated undiscounted future net rental income from operating the property and the terminal value,including anticipated costs to develop;
• for real estate properties we intend to sell, including properties currently under development and operating properties; recoverability is assessed based on
proceeds from disposition that are estimated based on future net rental income of the property, expected market capitalization rates and anticipated coststo develop;
• for land parcels we intend to sell, recoverability is assessed based on estimated proceeds from disposition; and • for costs incurred related to the potential acquisition of land, operating properties or development of a real estate property, recoverability is assessed based
on the probability that the acquisition or development is likely to occur at the measurement date. Assets Held for Sale or Contribution. We classify a property as held for sale or contribution when certain criteria are met in accordance with GAAP. Assetsclassified as held for sale are expected to be sold to a third party and assets classified as held for contribution are newly developed assets we intend tocontribute to an unconsolidated co-investment venture or to a third party within twelve months. At such time, the respective assets and liabilities are presentedseparately in the Consolidated Balance Sheets and depreciation is no longer recognized. Assets held for sale or contribution are reported at the lower of theircarrying amount or their estimated fair value less the costs to sell. Investments in Unconsolidated Entities. We present our investments in certain entities under the equity method. We use the equity method when we havethe ability to exercise significant influence over operating and financial policies of the venture but do not have control of the entity. Under the equity method, weinitially recognize these investments (including advances) in the balance sheet at our cost, including formation costs and net of deferred gains from thecontribution of properties, if applicable. We subsequently adjust the accounts to reflect our proportionate share of net earnings or losses recognized andaccumulated other comprehensive income or loss, distributions received, contributions made and certain other adjustments, as appropriate. Whencircumstances indicate there may have been a reduction in the value of an equity investment, we evaluate whether the loss in value is other than temporary. Ifwe conclude it is other than temporary, we recognize an impairment charge to reflect the equity investment at fair value. With regard to distributions from unconsolidated entities, we have elected the nature of distribution approach as the information is available to us to determinethe nature of the underlying activity that generated the distributions. In accordance with the nature of distribution approach, cash flows generated from theoperations of an unconsolidated entity are classified as a return on investment (cash inflow from operating activities) and cash flows that are generated fromproperty sales, debt refinancing or sales of our investments are classified as a return of investment (cash inflow from investing activities). Cash and Cash Equivalents. We consider all cash on hand, demand deposits with financial institutions and short-term highly liquid investments with originalmaturities of three months or less to be cash equivalents. Our cash and cash equivalents are financial instruments that are exposed to concentrations of creditrisk. We invest our cash with high-credit quality institutions. Cash balances may be invested in money market accounts that are not insured. We have notrealized any losses in such cash investments or accounts and believe that we are not exposed to any significant credit risk. Derivative Financial Instruments. We primarily hedge our foreign currency risk by borrowing in the currencies in which we invest. Generally, we borrow in thefunctional currency of our consolidated subsidiaries but we also borrow in currencies other than the U.S. dollar in the OP. We may use derivative financialinstruments, such as foreign currency forward and option contracts to manage foreign currency exchange rate risk related to both our foreign investments andthe related earnings. In addition, we occasionally use interest rate swap and forward contracts to manage interest rate risk and limit the impact of future interestrate changes on earnings and cash flows, primarily with variable-rate debt.
61

We do not use derivative financial instruments for trading or speculative purposes. Each derivative transaction is customized and not exchange-traded. Werecognize all derivatives at fair value within the line items Other Assets or Other Liabilities . We do not net our derivative position by counterparty for purposes ofbalance sheet presentation and disclosure. Management reviews our derivative positions, overall risk management strategy and hedging program, on a regularbasis. We only enter into transactions that we believe will be highly effective at offsetting the underlying risk. Our use of derivatives involves the risk thatcounterparties may default on a derivative contract; therefore we: (i) establish exposure limits for each counterparty to minimize this risk and providecounterparty diversification; (ii) contract with counterparties that have long-term credit ratings of single-A or better; (iii) enter into master agreements thatgenerally allow for netting of certain exposures; thereby significantly reducing the actual loss that would be incurred should a counterparty fail to perform itscontractual obligations; and (iv) set minimum credit standards that become more stringent as the duration of the derivative financial instrument increases. Basedon these factors, we consider the risk of counterparty default to be minimal. Designated Derivatives. We may choose to designate our derivative financial instruments, generally foreign currency forwards as net investment hedges inforeign operations or interest rate swaps or forwards as cash flow hedges. At inception of the transaction, we formally designate and document the derivativefinancial instrument as a hedge of a specific underlying exposure, the risk management objective and the strategy for undertaking the hedge transaction. Weformally assess both at inception and at least quarterly thereafter, the effectiveness of our hedging transactions. Due to the high degree of effectiveness betweenthe hedging instruments and the underlying exposures hedged, fluctuations in the value of the derivative financial instruments will generally be offset by changesin the cash flows or fair values of the underlying exposures being hedged. Changes in the fair value of derivatives that are designated and qualify as net investment hedges in foreign operations and cash flow hedges are recorded inAOCI/L . For net investment hedges, these amounts offset the translation adjustments on the underlying net assets of our foreign investments, which we alsorecord in AOCI/L . The ineffective portion of a derivative financial instrument's change in fair value, if any, is immediately recognized in earnings within the lineitem Foreign Currency and Derivative Gains (Losses), Net in the Consolidated Statements of Income. For cash flow hedges, we report the effective portion of thegain or loss as a component of AOCI/ L and reclassify it to the applicable line item in the Consolidated Statements of Income, generally Interest Expense , overthe corresponding period of the underlying hedged item. The ineffective portion of a derivative financial instrument’s change in fair value is recognized inearnings, generally Interest Expense , at the time the ineffectiveness occurred. To the extent the hedged debt related to our interest rate swaps and forwards ispaid off early, we write off the remaining balance in AOCI/L and recognize the amount in Interest Expense in the Consolidated Statements of Income. In addition to the net investment hedges described above, we may issue debt in the OP in a currency that is not the same functional currency of the borrowingentity to hedge our international investments. We designate the debt as a nonderivative financial instrument to offset the translation and economic exposuresrelated to our net investment in international subsidiaries. Undesignated Derivatives. We also use derivatives, such as foreign currency forwards and option contracts, that are not designated as hedges to manageforeign currency exchange rate risk related to our results of operations. The changes in fair values of these derivatives that were not designated or did not qualifyas hedging instruments are immediately recognized in earnings within the line item Foreign Currency and Derivative Gains (Losses), Net in the ConsolidatedStatements of Income. These gains or losses are generally offset by lower or higher earnings as a result in exchange rates that were different than ourexpectations. In addition, we may choose to not designate our interest rate swap and forward contracts. If a swap or forward contract is not designated as a hedge, thechanges in fair value of these instruments is immediately recognized in earnings within the line item Interest Expense in the Consolidated Statements of Income . Costs of Raising Capital. We treat costs incurred in connection with the issuance of common and preferred stock as a reduction to additional paid-in capital.We capitalize costs incurred in connection with the issuance of debt. Costs related to our credit facilities are included in Other Assets and costs related to all ourother debt are recorded as a direct reduction of the liability. AOCI/L. For the Parent, we include AOCI/L as a separate component of stockholders' equity in the Consolidated Balance Sheets. For the OP, AOCI/L isincluded in partners’ capital in the Consolidated Balance Sheets. Any reference to AOCI/L in this document is referring to the component of stockholders’ equityfor the Parent and partners’ capital for the OP. Noncontrolling Interests. Noncontrolling interests represent the share of consolidated entities owned by third parties. We recognize each noncontrollingholder’s respective share of the estimated fair value of the net assets at the date of formation or acquisition. Noncontrolling interests are subsequently adjustedfor the noncontrolling holder’s share of additional contributions, distributions and their share of the net earnings or losses of each respective consolidated entity.We allocate net income to noncontrolling interests based on the weighted average ownership interest during the period. The net income that is not attributable tous is reflected in the line item Net Earnings Attributable to Noncontrolling Interests . We do not recognize a gain or loss on transactions with a consolidated entityin which we do not own 100% of the equity, but we reflect the difference in cash received or paid from the noncontrolling interests carrying amount as additionalpaid-in-capital. Certain limited partnership interests are exchangeable into our common stock. Common stock issued upon exchange of a holder’s noncontrolling interest isaccounted for at the carrying value of the surrendered limited partnership interest and the difference between the carrying value and the fair value of thecommon stock issued is recorded to additional paid-in-capital.
62

Revenue Recognition.Rental Revenues. We lease our operating properties to customers under agreements that are classified as operating leases. We recognize the total minimumlease payments provided for under the leases on a straight-line basis over the lease term. Generally, under the terms of our leases, the majority of our rentalexpenses are recovered from our customers. We reflect amounts recovered from customers as revenues in the period that the applicable expenses are incurred.We make a provision for possible loss if the collection of a receivable balance is considered doubtful. Strategic Capital Revenues. Strategic capital revenues include revenues we earn from the management services we provide to unconsolidated entities. Thesefees are determined in accordance with the terms specific to each arrangement and may include property and asset management fees or transactional fees forleasing, acquisition, development, construction, financing, legal and tax services provided. We may also earn incentive returns (called “promotes”) based onthird-party investor returns over time, which may be during the duration of the venture or at the time of liquidation. We recognize fees when they are earned,fixed and determinable or on a percentage of completion basis for development fees. We report these fees in Strategic Capital Revenues . The fees we earn todevelop properties within these ventures are also recorded on a percentage of completion basis. We also earn fees from ventures that we consolidate. Upon consolidation, these fees are eliminated from our earnings and the third-party share of these fees arerecognized as a reduction of Net Earnings Attributable to Noncontrolling Interests. Gains on Dispositions of Investments in Real Estate and Revaluation of Equity Investments Upon Acquisition of a Controlling Interest, Net. We recognize gainson the disposition of real estate when the recognition criteria have been met, generally at the time the risks and rewards and title have transferred and we nolonger have substantial continuing involvement with the real estate sold. We recognize losses from the disposition of real estate when known. We recognizegains or losses on the remeasurement of equity investments to fair value upon acquisition of a controlling interest in any of our previously unconsolidated entitiesand the transaction is considered the acquisition of a business. When we contribute a property to an unconsolidated entity in which we have an ownership interest, we do not recognize a portion of the gain realized. Theamount of gain not recognized, based on our ownership interest in the entity acquiring the property, is deferred by recognizing a reduction to our investment inthe applicable unconsolidated entity. We adjust our proportionate share of net earnings or losses recognized in future periods to reflect the entities’ recordeddepreciation expense as if it were computed on our lower basis in the contributed properties rather than on the entity’s basis. When a property that we originally contributed to an unconsolidated entity is disposed of to a third party, we recognize the amount of the gain we previouslydeferred, along with our proportionate share of the gain recognized by the unconsolidated entity. If our ownership interest in an unconsolidated entity decreasesand the decrease is expected to be permanent, we recognize the amounts relating to previously deferred gains to coincide with our new ownership interest. Rental Expenses. Rental expenses primarily include the cost of our property management personnel, utilities, repairs and maintenance, property insurance,real estate taxes and the other costs of managing the properties. Strategic Capital Expenses. Strategic capital expenses generally include the direct expenses associated with the asset management of the unconsolidated co-investment ventures provided by our employees who are assigned to our Strategic Capital segment and the costs of our Prologis Promote Plan based on earnedpromotes. In addition, in order to achieve efficiencies and economies of scale, all of our property management functions are provided by property managementpersonnel who are assigned to our Real Estate Operations segment. These individuals perform the property-level management of the properties in our ownedand managed portfolio, which include properties we consolidate and those we manage that are owned by the unconsolidated co-investment ventures. Weallocate the costs of our property management to the properties we consolidate (included in Rental Expenses ) and the properties owned by the unconsolidatedco-investment ventures (included in Strategic Capital Expenses ) by using the square feet owned by the respective portfolios. Equity-Based Compensation. We account for equity-based compensation by measuring the cost of employee services received in exchange for an award ofan equity instrument based on the fair value of the award on the grant date. We recognize the cost of the award on a straight-line basis over the period duringwhich an employee is required to provide service in exchange for the award, generally the vesting period. Income Taxes. Under the Internal Revenue Code, REITs are generally not required to pay federal income taxes if they distribute 100% of their taxable incomeand meet certain income, asset and stockholder tests. If we fail to qualify as a REIT in any taxable year, we will be subject to federal income taxes at regularcorporate rates (including any alternative minimum tax) and may not be able to qualify as a REIT for the four subsequent taxable years. Even as a REIT, we maybe subject to certain foreign state and local taxes on our own income and property, and to federal income and excise taxes on our undistributed taxable income. We have elected taxable REIT subsidiary (“TRS”) status for some of our consolidated subsidiaries. This allows us to provide services that would otherwise beconsidered impermissible for REITs. Many of the foreign countries in which we have operations do not recognize REITs or do not accord REIT status under theirrespective tax laws to our entities that operate in their jurisdiction. In the U.S., we are taxed in certain states in which we operate. Accordingly, we recognizeincome tax expense for the federal and state income taxes incurred by our TRSs, taxes incurred in certain states and foreign jurisdictions, and interest andpenalties associated with our unrecognized tax benefit liabilities.
63

We evaluate tax positions taken in the Consolidated Financial St atements under the interpretation for accounting for uncertainty in income taxes. As a result ofthis evaluation, we may recognize a tax benefit from an uncertain tax position only if it is more likely than not that the tax position will be sustained on examination by taxing authorities. We recognize deferred income taxes in certain taxable entities. For federal income tax purposes, certain acquisitions have been treated as tax-free transactionsresulting in a carry-over basis in assets and liabilities. For financial reporting purposes and in accordance with purchase accounting, we record all of the acquiredassets and assumed liabilities at the estimated fair value at the date of acquisition. For our taxable subsidiaries, including certain international jurisdictions, werecognize the deferred income tax liabilities that represent the tax effect of the difference between the tax basis carried over and the fair value of the tangible andintangible assets at the date of acquisition. Any subsequent increases or decreases to the deferred income tax liability recorded in connection with theseacquisitions, are reflected in earnings. If taxable income is generated in these subsidiaries, we recognize a benefit in earnings as a result of the reversal of the deferred income tax liability previouslyrecorded at the acquisition date and we record current income tax expense representing the entire current income tax liability. If the reversal of the deferredincome tax liability results from a sale or contribution of assets, the classification of the reversal to the Consolidated Statement of Income is based on thetaxability of the transaction. We record the reversal to deferred income tax benefit as a taxable transaction if we dispose of the asset. We record the reversal asGains on Dispositions of Investments in Real Estate and Revaluation of Equity Investments Upon Acquisition of a Controlling Interest, Net as a non-taxabletransaction if we dispose of the asset along with the entity that owns the asset. Deferred income tax expense is generally a function of the period’s temporary differences (items that are treated differently for tax purposes than for financialreporting purposes) and the utilization of tax net operating losses (“NOL”) generated in prior years that had been previously recognized as deferred income taxassets. We provide for a valuation allowance for deferred income tax assets if we believe all or some portion of the deferred income tax asset may not berealized. Any increase or decrease in the valuation allowance that results from a change in circumstances that causes a change in the estimated ability to realizethe related deferred income tax asset is included in deferred tax expense. Environmental Costs. We incur certain environmental remediation costs, including cleanup costs, consulting fees for environmental studies and investigations,monitoring costs, and legal costs relating to cleanup, litigation defense, and the pursuit of responsible third parties. We expense costs incurred in connection withoperating properties and properties previously sold. We capitalize costs related to undeveloped land as development costs and include any expected futureenvironmental liabilities at the time of acquisition. We include costs incurred for properties to be disposed in the cost of the properties upon disposition. Wemaintain a liability for the estimated costs of environmental remediation expected to be incurred in connection with undeveloped land, operating properties andproperties previously sold that we adjust as appropriate as information becomes available. New Accounting Pronouncements. New Accounting Standards Adopted In January 2017, the Financial Accounting Standards Board (“FASB”) issued an accounting standard update (“ASU”) that clarifies the definition of a business.The update added further guidance that assists preparers in evaluating whether a transaction will be accounted for as an acquisition of an asset or a business.As discussed above, we adopted this standard on January 1, 2017, on a prospective basis. The adoption did not have a significant impact on the ConsolidatedFinancial Statements. New Accounting Standards Issued but not yet Adopted Revenue Recognition . In May 2014, the FASB issued an ASU that requires companies to use a five-step model to determine when to recognize revenue fromcustomer contracts in an effort to increase consistency and comparability throughout global capital markets and across industries. We evaluated each of ourrevenue streams and their related accounting policies under the standard. Rental revenues and recoveries earned from leasing our operating properties areexcluded from this standard and will be assessed with the adoption of the lease ASU discussed below. Our evaluation under the revenue recognition standardincludes recurring fees and promotes earned from our co-investment ventures as well as sales to third parties and contributions of properties to unconsolidatedco-investment ventures. While we do not expect changes in the recognition of recurring fees earned, we will evaluate promote fees earlier in the incentive periodand recognize promote fees to the extent it is probable that a revenue reversal will not occur in a future period. For dispositions of real estate to third parties, we do not expect the standard to impact the recognition of the sale. In February 2017, the FASB issued anadditional ASU that provides the accounting treatment for gains and losses from the derecognition of non-financial assets, including the accounting for partialsales of real estate properties. Upon adoption of this standard, we will recognize, on a prospective basis, the entire gain attributed to contributions of real estateproperties to unconsolidated co-investment ventures rather than the third-party share we recognize today. For deferred gains from existing partial sales recordedprior to the adoption of the standard, we will continue to recognize these gains into earnings over the lives of the underlying real estate properties. In addition tothe recognition changes discussed above, expanded quantitative and qualitative disclosures regarding revenue recognition will be required for contracts that aresubject to these standards. We will adopt the practical expedient to only assess the recognition of revenue for open contracts during the transition period and donot anticipate any material retained earnings adjustments upon adoption. We adopted the revenue recognition and derecognition of non-financial assetsstandards on January 1, 2018, on a modified retrospective basis.
64

Leases. In February 2016, the FASB issued an ASU that provides the principles for the recognition, measurement, presentation and disclosure of leases. • As a lessor. The accounting for lessors will remain largely unchanged from current GAAP; however, the standard requires that lessors expense, on an as-
incurred basis, certain initial direct costs that are not incremental in negotiating a lease. Under existing standards, these costs are capitalizable andtherefore this new standard will result in certain of these costs being expensed as incurred after adoption. During 2017 and 2016, we capitalized $23.8million and $23.9 million, respectively, of internal costs related to our leasing activities. This standard may also impact the timing, recognition, presentationand disclosures related to our rental recoveries from tenants earned from leasing our operating properties, although we do not expect a significant impact.
• As a lessee. Under the standard, lessees apply a dual approach, classifying leases as either operating or finance leases. A lessee is required to record a
right-of-use (“ROU”) asset and a lease liability for all leases with a term of greater than 12 months, regardless of their lease classification. We are a lesseeof ground leases and office space leases. At December 31, 2017, we had approximately 88 ground and office space leases that will require us tomeasure and record a ROU asset and a lease liability upon adoption of the standard. We continue to evaluate the key drivers in the measurement of theROU asset and lease liability including the discount rate and lease term. Details of our future minimum rental payments under these ground and officespace leases are disclosed in Note 4.
The standard is effective for us on January 1, 2019. We expect to adopt the practical expedients available for implementation under the standard. By adoptingthese practical expedients, we will not be required to reassess (i) whether an expired or existing contract meets the definition of a lease; (ii) the leaseclassification at the adoption date for expired or existing leases; and (iii) whether costs previously capitalized as initial direct costs would continue to beamortized. This allows us to continue to account for our ground and office space leases as operating leases, however, any new or renewed ground leases maybe classified as financing leases unless they meet certain conditions to be considered a lease involving facilities owned by a government unit or authority. Thestandard will also require new disclosures within the accompanying notes to the Consolidated Financial Statements. While we are well into our analysis of theadoption, we will continue to assess the impact the adoption will have on the Consolidated Financial Statements based on industry practice and potentialupdates to the ASU. Derivatives and Hedging . In August 2017, the FASB issued an ASU that simplifies the application of hedge accounting guidance in current GAAP and improvesthe reporting of hedging relationships to better portray the economic results of an entity’s risk management activities in its financial statements. Among thesimplification updates, the standard eliminates the requirement in current GAAP to separately recognize periodic hedge ineffectiveness. Mismatches betweenthe changes in value of the hedged item and hedging instrument may still occur but they will no longer be separately reported. The standard requires thepresentation of the earnings effect of the hedging instrument in the same income statement line item in which the earnings effect of the hedged item is reported.The standard is effective for us on January 1, 2019, but early adoption is permitted. We are currently evaluating the impact the adoption of this standard will haveon the Consolidated Financial Statements. NOTE 3. BUSINESS COMBINATIONS KTR Capital Partners and Its Affiliates In 2015, we acquired high quality real estate assets and the operating platform of KTR Capital Partners and its affiliates (“KTR”) through our consolidated co-investment venture, Prologis U.S. Logistics Venture (“USLV”). The portfolio consisted of 315 operating properties, aggregating 59.0 million square feet, 3.6million square feet of properties under development and land parcels. The total purchase price was $5.0 billion, net of assumed debt of $735.2 million. Thepurchase price was funded through cash contributions of $2.6 billion from Prologis and $2.3 billion from our venture partner, and the issuance of 4.5 millioncommon limited partnership units in the OP. We incurred $24.7 million of acquisition costs that are included in Other Expenses during 2015. The following unaudited pro forma financial information presents our results as though the KTR transaction had been completed on January 1, 2015. The proforma information does not reflect the actual results of operations had the transaction actually been completed on January 1, 2015, and it is not indicative offuture operating results. The results for the year ended December 31, 2015, include approximately seven months of actual results for the transaction, theacquisition expenses, and five months of pro forma adjustments. Actual results in 2015 include rental revenues and rental expenses of the properties acquired of$235.7 million and $56.9 million, respectively, representing the period from acquisition through December 31, 2015. The following amounts are in thousands, except per share amounts: 2015 Total revenues $ 2,358,643 Net earnings attributable to common stockholders $ 866,753 Net earnings per share attributable to common stockholders – Basic $ 1.66 Net earnings per share attributable to common stockholders – Diluted $ 1.65
These results include certain adjustments, primarily: (i) decreased revenues from the amortization of the net assets from the acquired leases with net favorablerents relative to estimated market rents; (ii) increased depreciation and amortization expense resulting from the adjustment of real estate assets to estimated fairvalue and recognition of intangible assets related to in-place leases; and (iii)
65
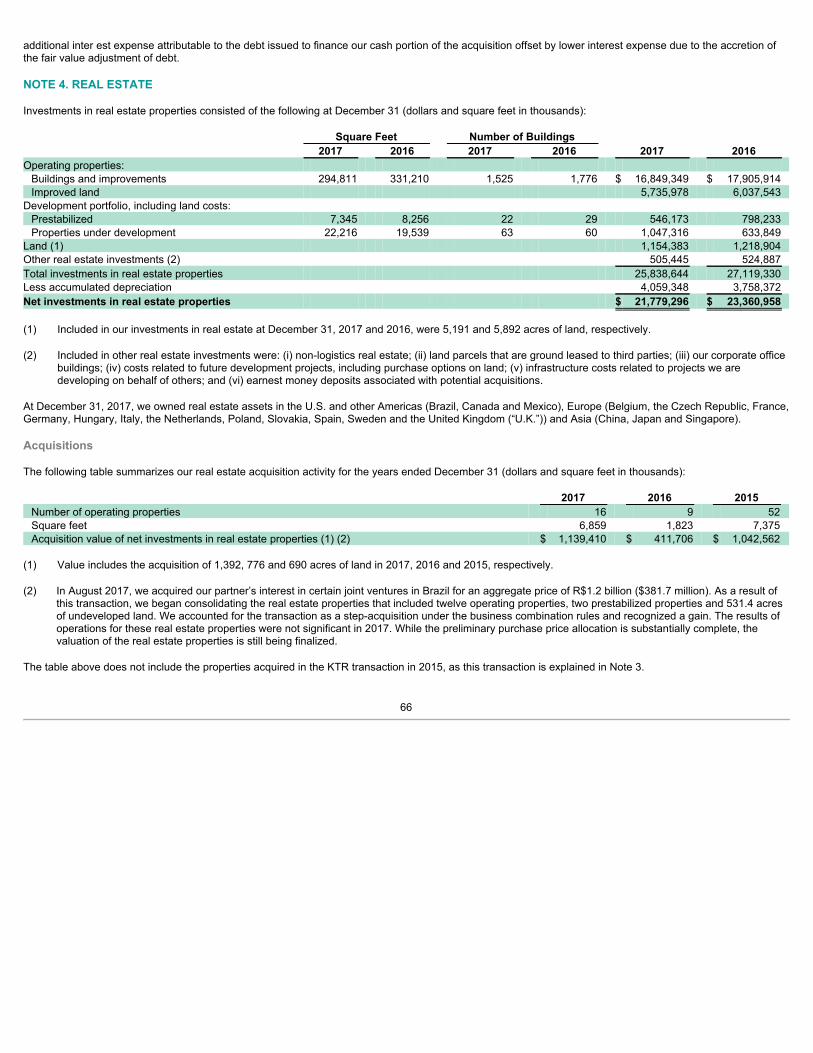
additional inter est expense attributable to the debt issued to finance our cash portion of the acquisition offset by lower interest expense due to the accretion ofthe fair value adjustment of debt. NOTE 4. REAL ESTATE Investments in real estate properties consisted of the following at December 31 (dollars and square feet in thousands): Square Feet Number of Buildings 2017 2016 2017 2016 2017 2016 Operating properties: Buildings and improvements 294,811 331,210 1,525 1,776 $ 16,849,349 $ 17,905,914 Improved land 5,735,978 6,037,543
Development portfolio, including land costs: Prestabilized 7,345 8,256 22 29 546,173 798,233 Properties under development 22,216 19,539 63 60 1,047,316 633,849
Land (1) 1,154,383 1,218,904 Other real estate investments (2) 505,445 524,887 Total investments in real estate properties 25,838,644 27,119,330 Less accumulated depreciation 4,059,348 3,758,372 Net investments in real estate properties $ 21,779,296 $ 23,360,958
(1) Included in our investments in real estate at December 31, 2017 and 2016, were 5,191 and 5,892 acres of land, respectively. (2) Included in other real estate investments were: (i) non-logistics real estate; (ii) land parcels that are ground leased to third parties; (iii) our corporate office
buildings; (iv) costs related to future development projects, including purchase options on land; (v) infrastructure costs related to projects we aredeveloping on behalf of others; and (vi) earnest money deposits associated with potential acquisitions.
At December 31, 2017, we owned real estate assets in the U.S. and other Americas (Brazil, Canada and Mexico), Europe (Belgium, the Czech Republic, France,Germany, Hungary, Italy, the Netherlands, Poland, Slovakia, Spain, Sweden and the United Kingdom (“U.K.”)) and Asia (China, Japan and Singapore). Acquisitions The following table summarizes our real estate acquisition activity for the years ended December 31 (dollars and square feet in thousands):
2017 2016 2015 Number of operating properties 16 9 52 Square feet 6,859 1,823 7,375 Acquisition value of net investments in real estate properties (1) (2) $ 1,139,410 $ 411,706 $ 1,042,562
(1) Value includes the acquisition of 1,392, 776 and 690 acres of land in 2017, 2016 and 2015, respectively. (2) In August 2017, we acquired our partner’s interest in certain joint ventures in Brazil for an aggregate price of R$1.2 billion ($381.7 million). As a result of
this transaction, we began consolidating the real estate properties that included twelve operating properties, two prestabilized properties and 531.4 acresof undeveloped land. We accounted for the transaction as a step-acquisition under the business combination rules and recognized a gain. The results ofoperations for these real estate properties were not significant in 2017. While the preliminary purchase price allocation is substantially complete, thevaluation of the real estate properties is still being finalized.
The table above does not include the properties acquired in the KTR transaction in 2015, as this transaction is explained in Note 3.
66

Dispositions The following table summarizes our real estate disposition activity for the years ended December 31 (dollars and square feet in thousands):
2017 2016 2015 Contributions to unconsolidated co-investment ventures (1)
Number of properties 222 35 31 Square feet 48,171 11,624 8,355 Net proceeds (2) $ 3,201,986 $ 1,231,878 $ 835,385 Gains on contributions, net (2) $ 847,034 $ 267,441 $ 148,987
Dispositions to third parties Number of properties 110 172 136 Square feet 17,147 20,360 23,024 Net proceeds (2) (3) $ 1,281,501 $ 1,760,048 $ 2,352,645 Gains on dispositions, net (2) (3) $ 274,711 $ 353,668 $ 609,900
Total gains on contributions and dispositions, net $ 1,121,745 $ 621,109 $ 758,887 Gains on revaluation of equity investments upon acquisition of a controlling interest 61,220 - - Gains on redemptions of investments in co-investment ventures (4) - 136,289 - Total gains on dispositions of investments in real estate and revaluation of equity investments upon acquisition of a controlling interest, net $ 1,182,965 $ 757,398 $ 758,887
(1) In July 2017, we contributed 190 operating properties totaling 37.1 million square feet owned by Prologis North American Industrial Fund (“NAIF”) to
Prologis Targeted U.S. Logistics Fund (“USLF”), our unconsolidated co-investment venture. In exchange for the contribution, we received additional unitsand USLF assumed $956.0 million of secured debt.
(2) Includes the contribution and disposition of land parcels. (3) Includes the sale of our investment in Europe Logistics Venture 1 (“ELV”) in January 2017. See Note 5 for more information on this transaction. (4) In 2016, we redeemed a portion of our investment in two co-investment ventures. Operating Lease Agreements We lease our operating properties and certain land parcels to customers under agreements that are generally classified as operating leases. Our weightedaverage lease term remaining, based on square feet for all leases in effect at December 31, 2017, was 48 months. The following table summarizes our minimum lease payments on leases with lease periods greater than one year for space in our operating properties, pre-stabilized development properties and leases of land subject to ground leases at December 31, 2017 (in thousands): 2018 $ 1,602,708 2019 1,440,452 2020 1,255,182 2021 1,015,212 2022 770,119 Thereafter 2,312,372 Total $ 8,396,045
These amounts do not reflect future rental revenues from the renewal or replacement of existing leases and exclude reimbursements of operating expenses.
67

Lease Commitments We have entered into operating ground leases as a lessee on certain land parcels, primarily on-tarmac facilities and office space with remaining lease terms of 1to 65 years. The following table summarizes our future minimum rental payments under non-cancelable operating leases in effect at December 31, 2017 (inthousands): 2018 $ 34,413 2019 31,819 2020 30,420 2021 25,964 2022 24,399 Thereafter 311,372 Total $ 458,387
NOTE 5. UNCONSOLIDATED ENTITIES Summary of Investments We have investments in entities through a variety of ventures. We co-invest in entities that own multiple properties with partners and investors and we provideasset and property management services to these entities, which we refer to as co-investment ventures. These entities may be consolidated or unconsolidated,depending on the structure, our partner’s participation and other rights and our level of control of the entity. This note details our investments in unconsolidatedco-investment ventures, which are accounted for using the equity method of accounting. See Note 12 for more detail regarding our consolidated investments thatare not wholly owned. We also have other ventures, generally with one partner and that we do not manage, which we account for using the equity method. We refer to our investmentsin all entities accounted for using the equity method, both unconsolidated co-investment ventures and other ventures, collectively, as unconsolidated entities. The following table summarizes our investments in and advances to our unconsolidated entities at December 31 (in thousands): 2017 2016 Unconsolidated co-investment ventures $ 5,274,702 $ 4,057,524 Other ventures 221,748 172,905 Total $ 5,496,450 $ 4,230,429
Unconsolidated Co-Investment Ventures The following table summarizes our investments in the individual co-investment ventures at December 31 (dollars in thousands):
OwnershipPercentage Investment in
and Advances to
Co-Investment Venture 2017 2016 2017 2016 Prologis Targeted U.S. Logistics Fund, L.P. (“USLF”) (1) 28.2% 14.9% $ 1,383,021 $ 434,818 FIBRA Prologis (2) (3) 46.3% 45.9% 533,941 547,744 Prologis European Logistics Partners Sàrl (“PELP”) (4) 50.0% 50.0% 1,766,075 1,623,707 Prologis European Logistics Fund ("PELF") (5) 26.3% 31.2% 1,017,361 344,200 Prologis UK Logistics Venture ("UKLV") (4) (6) 15.0% N/A 29,382 - Prologis Targeted Europe Logistics Fund, FCP-FIS (“PTELF”) (5) N/A 23.5% - 310,118 Europe Logistics Venture 1, FCP-FIS (“ELV”) (7) N/A 15.0% - 48,289 Nippon Prologis REIT, Inc. (“NPR”) (8) (9) 15.1% 15.1% 406,568 348,570 Prologis China Logistics Venture I, LP and II, LP ("Prologis China Logistics Venture") (4) 15.0% 15.0% 116,890 102,778 Brazil joint ventures (10) 10.0% various 21,464 297,300 Total $ 5,274,702 $ 4,057,524
(1) In July 2017, we contributed operating properties to USLF. We received cash proceeds and additional units, which increased our ownership interest and
USLF assumed secured debt. (2) At December 31, 2017, we owned 295.5 million units of FIBRA Prologis that had a closing price of Ps 34.01 ($1.72) per unit on the Mexican Stock
Exchange. (3) We have granted FIBRA Prologis a right of first refusal with respect to stabilized properties that we plan to sell in Mexico. (4) We have one partner in each of these co-investment ventures.
68

(5) In October, the assets and related liabilities of PTELF were contributed to Prologis European Properties Fund II (“PEPF II”) in exchange for units, and
PEPF II was renamed PELF. In connection with the transaction, we exchanged our units in PTELF for new units in PELF resulting in our ownershipinterest decreasing to 25.6%, however, our economic investment did not substantially change. As the contribution resulted in the exchange of ourinvestment in PTELF for an equity investment in PELF, we carried over our investment in PTELF to PELF at the historical cost and no gain wasrecognized.
(6 ) In February 2017, we formed UKLV, an unconsolidated co-investment venture in which we have a 15.0% ownership interest. UKLV will acquire land,
develop buildings and operate and hold logistics real estate assets in the U.K. Upon formation, we, along with our venture partner, committed £380.0million ($477.5 million), of which our share was £57.0 million ($71.6 million).
(7) In January 2017, we sold our investment in ELV to our venture partner for $84.3 million and ELV contributed its properties to PTELF in exchange for
equity interests. (8 ) At December 31, 2017, we owned 0.3 million units of NPR that had a closing price of ¥238,300 ($2,117) per share on the Tokyo Stock Exchange. At
December 31, 2017 and 2016, we had receivables from NPR of $106.2 million and $96.9 million, respectively, related to customer security deposits thatoriginated through a leasing company owned by us that pertain to properties owned by NPR. We have a corresponding payable to NPR’s customers inOther Liabilities . These amounts are repaid to us as the leases turn over.
(9 ) For any properties we develop and plan to sell in Japan, we have committed to offer those properties to NPR. (10) In March 2017, we acquired all our partner’s interest in the Prologis Brazil Logistics Partners Fund I, L.P. (“Brazil Fund”). In August 2017, we acquired our
partner’s interest in certain joint ventures in Brazil. See Note 4 for more information on this acquisition. The remaining investment balance includes nineproperties aggregating 2.8 million square feet held with various partners.
The amounts recognized in Strategic Capital Revenues and Earnings from Unconsolidated Entities, Net depend on the size and operations of theunconsolidated co-investment ventures, the timing of revenues earned through promotes, as well as fluctuations in foreign currency exchange rates and ourownership interest. We recognized Strategic Capital Expenses for direct costs associated with the asset management of these ventures and allocated property-level management costs for the properties owned by the ventures. The following table summarizes the amounts we recognized in the Consolidated Statements of Income related to the unconsolidated co-investment ventures forthe years ended December 31 (in thousands): 2017 2016 2015 Strategic capital revenues from unconsolidated co-investment ventures, net: U.S. $ 174,586 $ 37,911 $ 36,964 Other Americas 28,493 22,799 22,735 Europe 106,768 186,113 112,626 Asia 61,410 54,352 42,750
Total (1) $ 371,257 $ 301,175 $ 215,075 Earnings from unconsolidated co-investment ventures, net: U.S. $ 32,989 $ 10,441 $ 7,124 Other Americas 26,200 27,155 28,842 Europe 145,792 137,652 106,656 Asia 29,187 16,629 12,780
Total $ 234,168 $ 191,877 $ 155,402
(1) We earned promote revenue (third-party share) of $127.5 million, $88.5 million and $29.5 million in 2017, 2016 and 2015, respectively. Promote revenueis based on the venture’s cumulative returns to investors over a certain time-period, generally three years.
69

The following table summarizes the financial position and operating information of our unconsolidated co-investment ventures (not our proportionate share), atDecember 31 and for the years ended December 31 as presented at our adjusted basis derived from the ventures’ U.S. GAAP information (dollars and squarefeet in millions):
U.S. Other Americas Europe Asia Total 2017 2016 2015 2017 2016 2015 2017 2016 2015 2017 2016 2015 2017 2016 2015 Financial Position: Ventures 1 1 1 2 2 2 3 4 4 2 2 2 8 9 9 Operating properties 552 369 391 205 213 205 707 700 688 95 85 66 1,559 1,367 1,350 Square feet 88 50 50 37 42 39 166 163 159 41 36 29 332 291 277 Total assets ($) 7,062 4,238 4,408 2,118 2,793 2,482 13,586 10,853 11,343 6,133 5,173 4,320 28,899 23,057 22,553 Third-party debt ($) 2,313 1,414 1,433 756 739 657 2,682 2,446 2,640 2,328 1,947 1,520 8,079 6,546 6,250 Total liabilities ($) 2,520 1,540 1,550 782 814 708 3,655 3,283 3,584 2,685 2,239 1,751 9,642 7,876 7,593 Investment balance ($) (1) 1,383 435 690 555 845 786 2,813 2,327 2,707 524 451 402 5,275 4,058 4,585 Wtd avg ownership (2) 28.2% 14.9% 22.5% 43.4% 43.9% 43.8% 32.8% 35.1% 38.9% 15.1% 15.1% 15.0% 28.8% 27.9% 31.6% Operating Information: Revenues ($) 533 395 382 245 242 228 1,030 964 947 372 342 275 2,180 1,943 1,832 Net earnings ($) 139 57 35 71 71 78 406 333 261 182 101 77 798 562 451
(1 ) The difference between our ownership interest of a venture’s equity and our investment balance at December 31, 2017, 2016 and 2015, resultsprincipally from three types of transactions: (i) deferring a portion of the gains we recognize from a contribution of a property to a venture ($667.3 million,$469.9 million and $430.7 million, respectively); (ii) recording additional costs associated with our investment in the venture ($94.2 million, $124.1 millionand $122.1 million, respectively); and (iii) advances to a venture ($210.0 million, $166.1 million and $189.7 million, respectively).
(2) Represents our weighted average ownership interest in all co-investment ventures based on each entity’s contribution of total assets, before depreciation,
net of other liabilities. Equity Commitments Related to Certain Unconsolidated Co-Investment Ventures Certain co-investment ventures have equity commitments from us and our venture partners. Our venture partners fulfill their equity commitment with cash. Wemay fulfill our equity commitment through contributions of properties or cash. The equity contributions are generally used for the acquisition or development ofproperties, but may be used for the repayment of debt or other general uses. The venture may obtain financing for the acquisition of properties and therefore theacquisition price of additional investments that the venture could make may be more than the equity commitment. Depending on market conditions, theinvestment objectives of the ventures, our liquidity needs and other factors, we may make additional contributions of properties or additional cash investments inthese ventures through the remaining commitment period. The following table summarizes the remaining equity commitments at December 31, 2017 (in millions):
Equity Commitments
Expiration Datefor RemainingCommitments
Prologis VenturePartners Total
Prologis Targeted U.S. Logistics Fund $ - $ 73 $ 73 2019Prologis European Logistics Fund (1) - 1,061 1,061 2018 – 2019Prologis UK Logistics Venture (2) 27 151 178 2021Prologis China Logistics Venture 294 1,665 1,959 2020 – 2024Total $ 321 $ 2,950 $ 3,271 (1) During 2017, the remaining equity commitments of PTELF were transferred to PELF when the assets and related liabilities of PTELF were contributed to
PEPF II, and PEPF II was renamed PELF. Equity commitments are denominated in euro and reported in U.S. dollars based on an exchange rate of $1.20U.S. dollars to the euro.
(2) Equity commitments are denominated in British pounds sterling and reported in U.S. dollars based on an exchange rate of $1.35 U.S. dollars to the British
pound sterling.
70
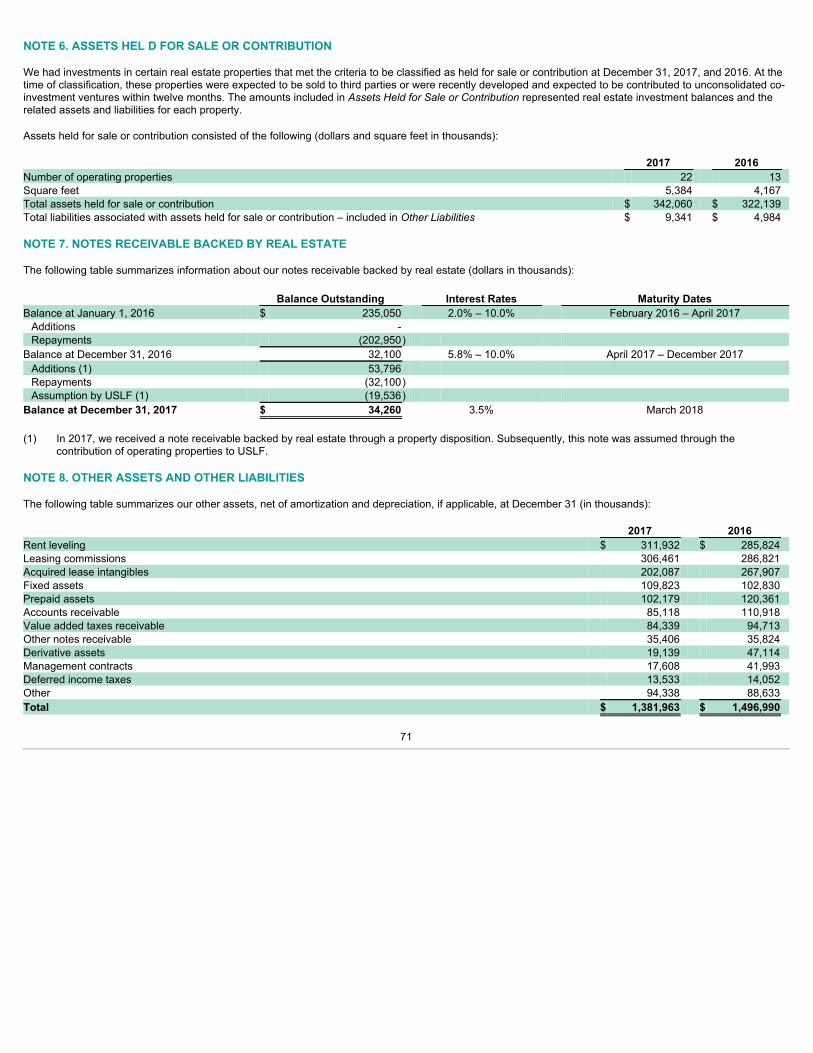
NOTE 6. ASSETS HEL D FOR SALE OR CONTRIBUTION We had investments in certain real estate properties that met the criteria to be classified as held for sale or contribution at December 31, 2017, and 2016. At thetime of classification, these properties were expected to be sold to third parties or were recently developed and expected to be contributed to unconsolidated co-investment ventures within twelve months. The amounts included in Assets Held for Sale or Contribution represented real estate investment balances and therelated assets and liabilities for each property. Assets held for sale or contribution consisted of the following (dollars and square feet in thousands): 2017 2016 Number of operating properties 22 13 Square feet 5,384 4,167 Total assets held for sale or contribution $ 342,060 $ 322,139 Total liabilities associated with assets held for sale or contribution – included in Other Liabilities $ 9,341 $ 4,984
NOTE 7. NOTES RECEIVABLE BACKED BY REAL ESTATE The following table summarizes information about our notes receivable backed by real estate (dollars in thousands): Balance Outstanding Interest Rates Maturity DatesBalance at January 1, 2016 $ 235,050 2.0% – 10.0% February 2016 – April 2017Additions - Repayments (202,950)
Balance at December 31, 2016 32,100 5.8% – 10.0% April 2017 – December 2017Additions (1) 53,796 Repayments (32,100) Assumption by USLF (1) (19,536)
Balance at December 31, 2017 $ 34,260 3.5% March 2018 (1) In 2017, we received a note receivable backed by real estate through a property disposition. Subsequently, this note was assumed through the
contribution of operating properties to USLF. NOTE 8. OTHER ASSETS AND OTHER LIABILITIES The following table summarizes our other assets, net of amortization and depreciation, if applicable, at December 31 (in thousands): 2017 2016 Rent leveling $ 311,932 $ 285,824 Leasing commissions 306,461 286,821 Acquired lease intangibles 202,087 267,907 Fixed assets 109,823 102,830 Prepaid assets 102,179 120,361 Accounts receivable 85,118 110,918 Value added taxes receivable 84,339 94,713 Other notes receivable 35,406 35,824 Derivative assets 19,139 47,114 Management contracts 17,608 41,993 Deferred income taxes 13,533 14,052 Other 94,338 88,633 Total $ 1,381,963 $ 1,496,990
71

The following table summarizes our other liabilities, net of amortization, if applicable, at December 31 (in thousands): 2017 2016 Tenant security deposits $ 209,741 $ 206,301 Unearned rents 71,392 90,233 Income tax liabilities 56,988 68,666 Indemnification liability 39,480 32,843 Derivative liabilities 32,229 1,268 Environmental liabilities 25,728 24,572 Acquired lease intangibles 24,769 31,707 Deferred income 15,754 21,629 Value added taxes payable 10,081 15,888 Other 173,737 134,212 Total $ 659,899 $ 627,319
The following table summarizes the expected future amortization of leasing commissions and forgone rent (included in acquired lease intangibles) intoamortization expense and above and below market leases (included in acquired lease intangibles) and rent leveling net assets into rental revenues, all based onthe balances at December 31, 2017 (in thousands):
Amortization Expense Net (Increase) Decrease to
Rental Revenues
2018 $ 107,897 $ (13,862)2019 90,168 25,635 2020 73,790 42,140 2021 56,494 46,332 2022 41,689 41,855 Thereafter 98,233 185,340 Total $ 468,271 $ 327,440
NOTE 9. DEBT All debt is incurred by the OP. The Parent does not have any indebtedness, but guarantees the unsecured debt of the OP. The following table summarizes our debt at December 31 (dollars in thousands): 2017 2016
Weighted Average
Interest Rate (1) Amount
Outstanding (2) Weighted Average
Interest Rate (1) Amount
Outstanding Credit facilities 1.8% $ 317,392 1.0% $ 35,023 Senior notes (3) 3.0% 6,067,277 3.3% 6,417,492 Term loans 1.7% 2,046,945 1.4% 1,484,523 Unsecured other 6.1% 13,546 6.1% 14,478 Secured mortgages (4) 5.7% 808,096 4.9% 979,585 Secured mortgages of consolidated entities (5) 2.9% 159,375 3.0% 1,677,193 Total 2.9% $ 9,412,631 3.2% $ 10,608,294
(1) The interest rates presented represent the effective interest rates (including amortization of debt issuance costs and the noncash premiums or discounts)
at the end of the year for the debt outstanding. (2) Included in the outstanding balances were borrowings denominated in non-U.S. dollars, principally: euro ($3.8 billion), Japanese yen ($1.3 billion), British
pound sterling ($0.7 billion) and Canadian dollars ($0.5 billion). (3) Notes are due October 2020 to June 2029 with effective interest rates ranging from 1.5% to 4.4% at December 31, 2017. (4 ) Debt is due May 2018 to December 2025 with effective interest rates ranging from 2.7% to 7.8% at December 31, 2017. The debt is secured by 144 real
estate properties with an aggregate undepreciated cost of $2.2 billion at December 31, 2017. (5 ) Debt is due April 2019 to December 2027 with effective interest rates ranging from 2.9% to 3.4% at December 31, 2017. The debt is secured by 18 real
estate properties with an aggregate undepreciated cost of $0.3 billion at December 31, 2017.
72
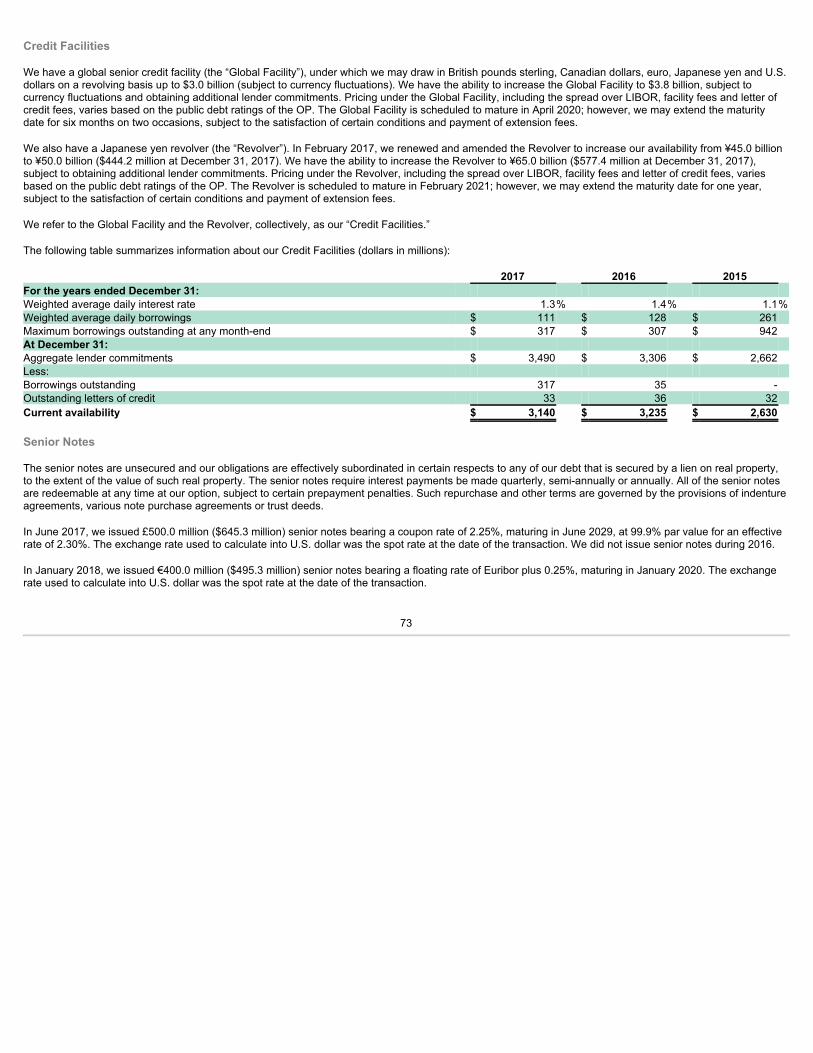
Credit Facilities We have a global senior credit facility (the “Global Facility”), under which we may draw in British pounds sterling, Canadian dollars, euro, Japanese yen and U.S.dollars on a revolving basis up to $3.0 billion (subject to currency fluctuations). We have the ability to increase the Global Facility to $3.8 billion, subject tocurrency fluctuations and obtaining additional lender commitments. Pricing under the Global Facility, including the spread over LIBOR, facility fees and letter ofcredit fees, varies based on the public debt ratings of the OP. The Global Facility is scheduled to mature in April 2020; however, we may extend the maturitydate for six months on two occasions, subject to the satisfaction of certain conditions and payment of extension fees. We also have a Japanese yen revolver (the “Revolver”). In February 2017, we renewed and amended the Revolver to increase our availability from ¥45.0 billionto ¥50.0 billion ($444.2 million at December 31, 2017). We have the ability to increase the Revolver to ¥65.0 billion ($577.4 million at December 31, 2017),subject to obtaining additional lender commitments. Pricing under the Revolver, including the spread over LIBOR, facility fees and letter of credit fees, variesbased on the public debt ratings of the OP. The Revolver is scheduled to mature in February 2021; however, we may extend the maturity date for one year,subject to the satisfaction of certain conditions and payment of extension fees. We refer to the Global Facility and the Revolver, collectively, as our “Credit Facilities.” The following table summarizes information about our Credit Facilities (dollars in millions): 2017 2016 2015 For the years ended December 31: Weighted average daily interest rate 1.3% 1.4% 1.1%Weighted average daily borrowings $ 111 $ 128 $ 261 Maximum borrowings outstanding at any month-end $ 317 $ 307 $ 942 At December 31: Aggregate lender commitments $ 3,490 $ 3,306 $ 2,662 Less: Borrowings outstanding 317 35 - Outstanding letters of credit 33 36 32 Current availability $ 3,140 $ 3,235 $ 2,630
Senior Notes The senior notes are unsecured and our obligations are effectively subordinated in certain respects to any of our debt that is secured by a lien on real property,to the extent of the value of such real property. The senior notes require interest payments be made quarterly, semi-annually or annually. All of the senior notesare redeemable at any time at our option, subject to certain prepayment penalties. Such repurchase and other terms are governed by the provisions of indentureagreements, various note purchase agreements or trust deeds. In June 2017, we issued £500.0 million ($645.3 million) senior notes bearing a coupon rate of 2.25%, maturing in June 2029, at 99.9% par value for an effectiverate of 2.30%. The exchange rate used to calculate into U.S. dollar was the spot rate at the date of the transaction. We did not issue senior notes during 2016. In January 2018, we issued €400.0 million ($495.3 million) senior notes bearing a floating rate of Euribor plus 0.25%, maturing in January 2020. The exchangerate used to calculate into U.S. dollar was the spot rate at the date of the transaction.
73

Term Loans The following table summarizes our outstanding term loans at December 31 (dollars and borrowing currency in thousands):
Term LoanBorrowingCurrency
InitialBorrowing
Date Lender Commitment at
2017
AmountOutstanding
at 2017
AmountOutstanding
at 2016 Interest Rate Maturity Date
BorrowingCurrency USD USD USD
2017 Term Loan (1) (2)USD, EUR, JPY
and GBP June 2014 $ 500,000 $ 500,000 $ 500,000 $ 193,293 LIBOR plus0.90% May 2020
2015 Canadian Term Loan CAD December
2015 $ 371,925 $ 296,595 296,595 276,322 CDOR rate plus
1.50% February 2023
2016 Yen Term Loan JPY August 2016 ¥ 120,000,000 $ 1,065,965 1,065,965 1,025,057 Yen LIBOR plus
0.65% August 2022and 2023
March 2017 Yen Term Loan JPY March 2017 ¥ 12,000,000 $ 106,597 106,597 -
0.92% and1.01%
March 2027and 2028
October 2017 Yen Term Loan JPY October 2017 ¥ 10,000,000 $ 88,830 88,830 - 0.85% October 2032Subtotal 2,057,987 1,494,672 Debt issuance costs, net (11,042) (10,149) Total $ 2,046,945 $ 1,484,523 (1) In May 2017, we renewed and amended our existing senior term loan agreement (the “2017 Term Loan”). We may increase the borrowings up to $1.0
billion, subject to obtaining additional lender commitments. We may pay down and reborrow on this term loan. We may extend the maturity date twice, byone year each, subject to the satisfaction of certain conditions and the payment of an extension fee.
(2) We paid down $1.2 billion and $1.2 billion and reborrowed $1.5 billion and $0.8 billion in 2017 and 2016, respectively. Secured Mortgage Debt In July 2017, USLF assumed $956.0 million of secured mortgage debt in conjunction with our contribution of the associated real estate properties, as discussedin Note 4. TMK bonds are a financing vehicle in Japan for special purpose companies known as TMKs. In June 2017, we issued ¥4.5 billion ($40.2 million) of new TMKbonds. We subsequently paid off or transferred all of our outstanding TMK bonds and there were no TMK bonds outstanding at December 31, 2017. During2016, we issued new TMK bonds totaling ¥25.7 billion ($244.6 million). Long-Term Debt Maturities Principal payments due on our debt, for each year through the period ended December 31, 2022, and thereafter were as follows at December 31, 2017 (inthousands): Unsecured Credit Senior Term Loans Secured Maturity Facilities Notes and Other Mortgage Debt Total 2018 (1) $ - $ - $ 934 $ 167,960 $ 168,894 2019 - - 1,013 446,324 447,337 2020 (2) (3) 264,982 719,580 501,077 12,401 1,498,040 2021 (3) 52,410 839,510 910 14,780 907,610 2022 - 839,510 444,890 10,791 1,295,191 Thereafter - 3,715,027 1,122,709 314,298 5,152,034 Subtotal 317,392 6,113,627 2,071,533 966,554 9,469,106
Premiums (discounts), net - (21,333) - 4,660 (16,673)Debt issuance costs, net - (25,017) (11,042) (3,743) (39,802)
Total $ 317,392 $ 6,067,277 $ 2,060,491 $ 967,471 $ 9,412,631
(1) We expect to repay the amounts maturing in 2018 with cash generated from operations, proceeds from dispositions of real estate properties, or as
necessary, with borrowings on our Credit Facilities. (2) Included in the 2020 maturities was the 2017 Term Loan that can be extended until 2022, as discussed above. (3) Included in the 2020 and 2021 maturities were the Credit Facilities that can be extended until 2021 and 2022, respectively, as discussed above.
74

Interest Expense The following table summarizes the components of interest expense for the years ended December 31 (in thousands): 2017 2016 2015 Gross interest expense $ 328,228 $ 383,098 $ 394,012 Amortization of premium, net (13,728) (30,596) (45,253)Amortization of debt issuance costs 14,479 15,459 13,412 Interest expense before capitalization $ 328,979 $ 367,961 $ 362,171 Capitalized amounts (54,493) (64,815) (60,808)Net interest expense $ 274,486 $ 303,146 $ 301,363 Total cash paid for interest, net of amounts capitalized $ 278,313 $ 322,442 $ 345,916
Early Extinguishment of Debt In 2017 and 2015, we repurchased or repaid certain debt before the maturity date in an effort to reduce our borrowing costs and extend our debt maturities. As aresult, we recognized gains or losses represented by the difference between the recorded debt (including premiums and discounts and related debt issuancecosts) and the consideration we paid to retire the debt, including fees. Fees associated with the restructuring of debt that meets the modification criteria, alongwith existing unamortized premium or discount and debt issuance costs, are amortized over the term of the new debt. The following table summarizes the activity related to the repurchase of debt and net loss on early extinguishment of debt for the years ended December 31 (inmillions): 2017 2015 Senior notes: Original principal amount $ 1,495.3 $ 709.7 Cash purchase price $ 1,566.5 $ 789.0
Term loans: Original principal amount $ - $ 600.0 Cash repayment price $ - $ 600.0
Secured mortgage debt: Original principal amount $ 538.3 $ 571.5 Cash repayment price $ 538.3 $ 595.5
Total: Original principal amount $ 2,033.6 $ 1,881.2 Cash purchase / repayment price $ 2,104.8 $ 1,984.5 Losses on early extinguishment of debt $ 68.4 $ 86.3
During 2016, we repaid certain debt at the earliest available payment date with no prepayment costs. We recorded a gain of $2.5 million that related tounamortized premiums associated with the extinguished debt and were net of unamortized debt issuance costs. Financial Debt Covenants We have $6.1 billion of senior notes and $2.0 billion of term loans outstanding at December 31, 2017 under two separate indentures, as supplemented, andwere subject to certain financial covenants. We are also subject to financial covenants under our Credit Facilities and certain secured mortgage debt. AtDecember 31, 2017, we were in compliance with all of our financial debt covenants. NOTE 10. STOCKHOLDERS’ EQUITY OF PROLOGIS, INC. Shares Authorized At December 31, 2017, 1.1 billion shares were authorized to be issued by the Parent, of which 1.0 billion shares represent common stock. Our board of directors(the “Board”) may, without stockholder approval, classify or reclassify any unissued shares of our stock from time to time by setting or changing the preferences,conversion or other rights, voting powers, restrictions, limitations as to distributions, qualifications and terms or conditions of redemption of such shares. Common Stock We issued 1.7 million shares of common stock under our at-the-market program during 2015, which generated $71.5 million in net proceeds. We have an equitydistribution agreement that allows us to sell up to $750.0 million aggregate gross sales proceeds of shares of common stock, of which $535.2 million remainsavailable for sale, through six designated agents, who earn a fee of up to 2% of the gross proceeds, as agreed to on a transaction-by-transaction basis.
75
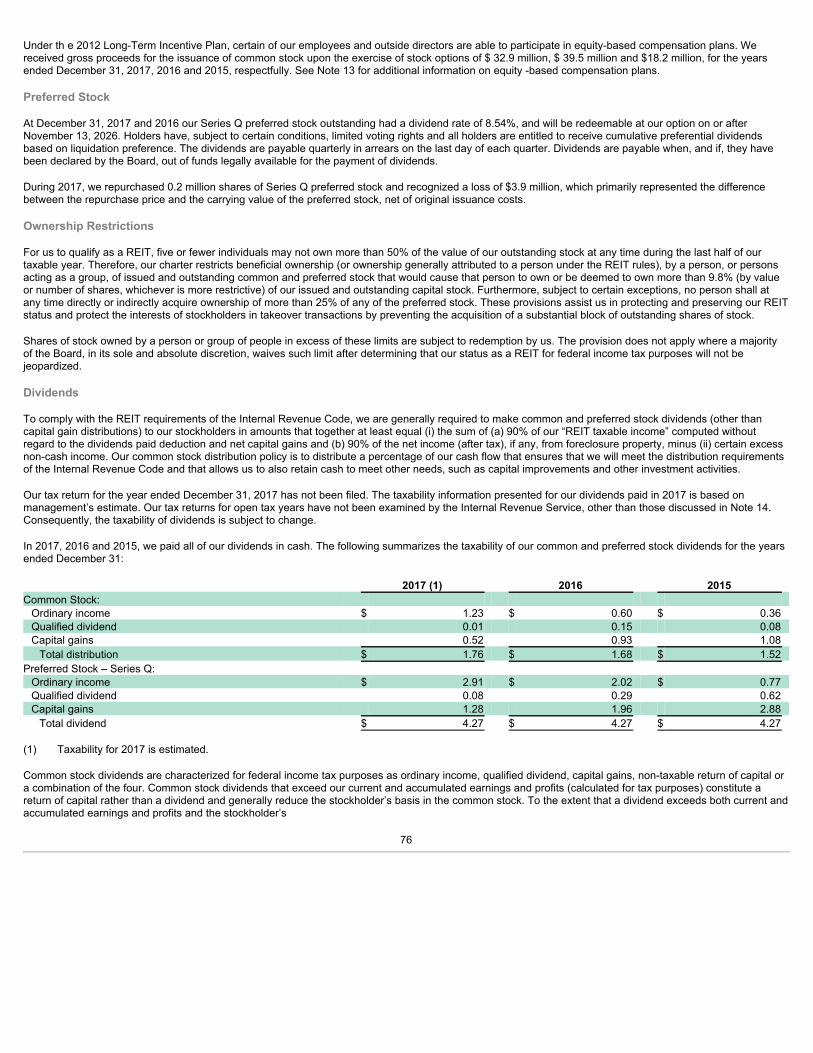
Under th e 2012 Long-Term Incentive Plan, certain of our employees and outside directors are able to participate in equity-based compensation plans. Wereceived gross proceeds for the issuance of common stock upon the exercise of stock options of $ 32.9 million, $ 39.5 million and $18.2 million, for the yearsended December 31, 2017, 2016 and 2015, respectfully. See Note 13 for additional information on equity -based compensation plans. Preferred Stock At December 31, 2017 and 2016 our Series Q preferred stock outstanding had a dividend rate of 8.54%, and will be redeemable at our option on or afterNovember 13, 2026. Holders have, subject to certain conditions, limited voting rights and all holders are entitled to receive cumulative preferential dividendsbased on liquidation preference. The dividends are payable quarterly in arrears on the last day of each quarter. Dividends are payable when, and if, they havebeen declared by the Board, out of funds legally available for the payment of dividends. During 2017, we repurchased 0.2 million shares of Series Q preferred stock and recognized a loss of $3.9 million, which primarily represented the differencebetween the repurchase price and the carrying value of the preferred stock, net of original issuance costs. Ownership Restrictions For us to qualify as a REIT, five or fewer individuals may not own more than 50% of the value of our outstanding stock at any time during the last half of ourtaxable year. Therefore, our charter restricts beneficial ownership (or ownership generally attributed to a person under the REIT rules), by a person, or personsacting as a group, of issued and outstanding common and preferred stock that would cause that person to own or be deemed to own more than 9.8% (by valueor number of shares, whichever is more restrictive) of our issued and outstanding capital stock. Furthermore, subject to certain exceptions, no person shall atany time directly or indirectly acquire ownership of more than 25% of any of the preferred stock. These provisions assist us in protecting and preserving our REITstatus and protect the interests of stockholders in takeover transactions by preventing the acquisition of a substantial block of outstanding shares of stock. Shares of stock owned by a person or group of people in excess of these limits are subject to redemption by us. The provision does not apply where a majorityof the Board, in its sole and absolute discretion, waives such limit after determining that our status as a REIT for federal income tax purposes will not bejeopardized. Dividends To comply with the REIT requirements of the Internal Revenue Code, we are generally required to make common and preferred stock dividends (other thancapital gain distributions) to our stockholders in amounts that together at least equal (i) the sum of (a) 90% of our “REIT taxable income” computed withoutregard to the dividends paid deduction and net capital gains and (b) 90% of the net income (after tax), if any, from foreclosure property, minus (ii) certain excessnon-cash income. Our common stock distribution policy is to distribute a percentage of our cash flow that ensures that we will meet the distribution requirementsof the Internal Revenue Code and that allows us to also retain cash to meet other needs, such as capital improvements and other investment activities. Our tax return for the year ended December 31, 2017 has not been filed. The taxability information presented for our dividends paid in 2017 is based onmanagement’s estimate. Our tax returns for open tax years have not been examined by the Internal Revenue Service, other than those discussed in Note 14.Consequently, the taxability of dividends is subject to change. In 2017, 2016 and 2015, we paid all of our dividends in cash. The following summarizes the taxability of our common and preferred stock dividends for the yearsended December 31: 2017 (1) 2016 2015 Common Stock: Ordinary income $ 1.23 $ 0.60 $ 0.36 Qualified dividend 0.01 0.15 0.08 Capital gains 0.52 0.93 1.08 Total distribution $ 1.76 $ 1.68 $ 1.52
Preferred Stock – Series Q: Ordinary income $ 2.91 $ 2.02 $ 0.77 Qualified dividend 0.08 0.29 0.62 Capital gains 1.28 1.96 2.88 Total dividend $ 4.27 $ 4.27 $ 4.27
(1) Taxability for 2017 is estimated. Common stock dividends are characterized for federal income tax purposes as ordinary income, qualified dividend, capital gains, non-taxable return of capital ora combination of the four. Common stock dividends that exceed our current and accumulated earnings and profits (calculated for tax purposes) constitute areturn of capital rather than a dividend and generally reduce the stockholder’s basis in the common stock. To the extent that a dividend exceeds both current andaccumulated earnings and profits and the stockholder’s
76

basis in the common stock, it will generally be treated as a gain from the sale or exchange of that stockholder’s common stock. At the beginning of each year, wenotify our stockholders of the taxability of the common stock dividends pa id during the preceding year. Pursuant to the terms of our preferred stock, we are restricted from declaring or paying any dividend with respect to our common stock unless and until allcumulative dividends with respect to the preferred stock have been paid and sufficient funds have been set aside for dividends that have been declared for therelevant dividend period with respect to the preferred stock. NOTE 11. PARTNERS’ CAPITAL OF PROLOGIS, L.P. Distributions paid on the common limited partnership units, and the taxability of those distributions, are similar to dividends paid on the Parent’s common stockdisclosed above. In connection with the acquisition of a portfolio of properties in October 2015, we issued 0.2 million common limited partnership units and 8.9 million Class AUnits in the OP. The number of units issued was based upon an agreed upon price and had a per unit weighted average fair value at the date of issuance of$41.06. The Class A Units generally have the same rights as the existing common limited partnership units of the OP, except that the Class A Units are entitledto a quarterly distribution equal to $0.64665 per unit so long as the common limited partnership units receive a quarterly distribution of at least $0.40 per unit (inthe event the common limited partnership units receive a quarterly distribution of less than $0.40 per unit, the Class A Unit distribution would be reduced by aproportionate amount). Class A Units are convertible into common limited partnership units at an initial conversion rate of one-for-one. The conversion rate willbe increased or decreased to the extent that, at the time of conversion, the net present value of the distributions paid with respect to the Class A Units are less ormore than the distributions paid on common limited partnership units from the time of issuance of the Class A Units until the time of conversion. At December 31,2017 and 2016, the Class A Units were convertible into 8.5 million and 8.7 million common limited partnership units. The OP may redeem the Class A Units atany time after October 7, 2025, for an amount in cash equal to the then-current number of the common limited partnership units into which the Class A Units areconvertible, multiplied by $43.11, subject to the holders’ right to convert the Class A Units into common limited partnership units. In May 2015, we issued 4.5 million common limited partnership units in the OP in connection with the KTR transaction. See Note 3 for more details on thetransaction. NOTE 12. NONCONTROLLING INTERESTS Prologis, L.P. We report noncontrolling interests related to several entities we consolidate but of which we do not own 100% of the equity. These entities include two realestate partnerships that have issued limited partnership units to third parties. Depending on the specific partnership agreements, these limited partnership unitsare redeemable for cash or, at our option into shares of the Parent’s common stock, generally at a rate of one share of common stock to one unit. We alsoconsolidate several entities in which we do not own 100% of the equity but the equity of these entities are not exchangeable into our common stock. As discussed in Note 1, the Parent has complete responsibility, power and discretion in the day-to-day management of the OP. The Parent, through its majorityinterest, has the right to receive benefits from and incur losses of the OP. In addition, the OP does not have either substantive liquidation rights or substantivekick-out rights without cause or substantive participating rights that could be exercised by a simple majority of noncontrolling interests. The absence of suchrights renders the OP as a VIE. Accordingly, the Parent is the primary beneficiary and therefore consolidates the OP. Prologis, Inc. The noncontrolling interests of the Parent include the noncontrolling interests presented above for the OP, as well as the limited partnership units in the OP thatare not owned by the Parent. The following table summarizes our ownership percentages and noncontrolling interests and the consolidated entities’ total assets and total liabilities atDecember 31 (dollars in thousands):
Our Ownership
Percentage Noncontrolling Interests Total Assets Total Liabilities 2017 2016 2017 2016 2017 2016 2017 2016
Prologis U.S. Logistics Venture 55.0% 55.0% $2,581,629 $ 2,424,800 $ 6,030,819 $ 6,201,278 $ 284,162 $ 797,593 Prologis North American Industrial Fund (1) N/A 66.1% - 486,648 - 2,479,072 - 1,038,708 Prologis Brazil Logistics Partners Fund I (2) N/A 50.0% - 61,836 - 131,581 - 720 Other consolidated entities (3) various various 78,613 99,185 806,138 866,821 30,330 34,073 Prologis, L.P. 2,660,242 3,072,469 6,836,957 9,678,752 314,492 1,871,094 Limited partners in Prologis, L.P. (4) (5) 414,341 394,590 - - - - Prologis, Inc. $ 3,074,583 $ 3,467,059 $ 6,836,957 $ 9,678,752 $ 314,492 $ 1,871,094
77

(1) In March 2017, we acquired all our partner’s interest for $710.2 million. The difference between the amount we paid and the noncontrolling interest
balance was recorded to Additional Paid-in Capital with no gain or loss recognized. In July 2017, we contributed substantially all the assets formerlyowned by NAIF to our unconsolidated co-investment venture, USLF.
(2) In March 2017, we acquired all our partner’s interest for $79.8 million. The difference between the amount we paid and the noncontrolling interest balance
was recorded to Additional Paid-in Capital with no gain or loss recognized. At December 31, 2016, the assets of the Prologis Brazil Logistics PartnersFund I were primarily investments in unconsolidated entities of $113.1 million, most of which we gained control of and began consolidating in August2017. See Note 4 for more information on the acquisition of our partner’s interest in certain joint ventures in Brazil.
(3) This line item includes our two partnerships that have issued limited partnership units to third parties, as discussed above, along with various other
consolidated entities. The limited partnership units outstanding at December 31, 2017 and 2016 were exchangeable into cash or, at our option, 1.0 millionand 1.8 million shares of the Parent’s common stock with a fair value of $64.3 million and $96.9 million, respectively, based on the closing stock price ofthe Parent’s common stock. In 2017, limited partnership units were exchanged for 0.8 million shares of the Parent’s common stock. All of theseoutstanding limited partnership units receive quarterly cash distributions equal to the quarterly dividends paid on our common stock pursuant to the termsof the applicable partnership agreements.
(4) We had 8.9 million Class A Units that were convertible into 8.5 million and 8.7 million limited partnership units of the OP at December 31, 2017 and 2016,
respectively. See Note 11 for further discussion of our Class A Units. (5) At December 31, 2017 and 2016, excluding the Class A Units, there were limited partnership units in the OP that were exchangeable into cash or, at our
option, 4.1 million and 4.6 million shares of the Parent’s common stock with a fair value of $266.1 million and $241.8 million, respectively, based on theclosing stock price of the Parent’s common stock. In 2017 and 2016 unitholders exchanged 0.7 million and 1.9 million limited partnership units into anequal number of shares of the Parent’s common stock.
At December 31, 2017 and 2016, there were 3.4 million and 2.2 million LTIP Units (as defined in Note 13) outstanding, respectively, associated with ourlong-term compensation plan that were exchangeable into limited partnership units of the OP and redeemable into the Parent’s common stock after theyvest and other applicable conditions have been met. All of these outstanding limited partnership units receive quarterly cash distributions equal to thequarterly distributions paid on our common stock pursuant to the terms of the partnership agreement.
NOTE 13. LONG-TERM COMPENSATION The 2012 Long-Term Incentive Plan (“2012 LTIP”) provides for grants of awards to officers, directors, employees and consultants of the Parent or itssubsidiaries. Awards can be in the form of: full value awards, stock appreciation rights, stock options (non-qualified options and incentive stock options) and cashincentive awards. Full value awards generally consist of: (i) common stock; (ii) restricted stock units (“RSUs”); (iii) OP LTIP units (“LTIP Units”) and (iv) PrologisOutperformance Plan (“POP”) OP LTIP units (“POP LTIP Units”). The awards under the 2012 LTIP have been issued under the following components of our equity-based compensation plans and programs at December 31,2017: (i) POP; (ii) Prologis Promote Plan (“PPP”); (iii) annual long-term incentive (“LTI”) equity award program (“Annual LTI Award”); and (iv) annual bonusexchange program. Under all of these components, certain employees may elect to receive their equity award payout either in the form of RSUs or other equityof the Parent or LTIP Units of the OP. No participant can be granted more than 1.5 million shares of common stock under the 2012 LTIP in any one calendaryear. Awards may be made under the 2012 LTIP until it is terminated by the Board or until the ten-year anniversary of the effective date of the plan. We have 27.2 million shares reserved for issuance, of which 17.2 million shares of common stock were available for future issuance at December 31, 2017.Each LTIP Unit counts as one share of common stock for purposes of calculating the limit on shares that may be issued. Equity-Based Compensation Plans and Programs Prologis Outperformance Plan (“POP”) We allocate participation points to participants under our POP corresponding to three-year performance periods beginning January 1. The fair value of theawards is measured at the grant date and amortized over the period from the grant date to the date at which the awards would become vested. POP awards areearned to the extent our total stockholder return (“TSR”) for the performance period exceeds the TSR for the Morgan Stanley Capital International (“MSCI”) USREIT Index for the same period plus 100 basis points (“Index”). If this outperformance hurdle is met, the compensation pool is equal to 3.0% of the excess valuecreated, subject to a maximum of the greater of $75.0 million or 0.5% of our equity market capitalization at the start of the performance period (“CapitalizationsCap”). Each participant is eligible to receive a percentage of the total compensation pool based on the number of participation points allocated to the participant.If the performance criteria are met, the participants’ points will generally be paid in the form of common stock or POP LTIP Units, as elected by the participant.Annually, a participant may exchange their participation points for POP LTIP Units. If the performance criteria are not met, the participants’ points and POP LTIPUnits will be forfeited. If we
78

outperform the Index, but the absolute TSR is not positiv e, payment will be delayed until our absolute TSR becomes positive. If after seven years our absoluteTSR has not become positive, the awards will be forfeited. Beginning with 2016 – 2018 performance period, the plan requires an additional performance hurdle. The Index performance must be met or exceeded for anadditional three years after the initial three-year performance period (“Initial Award”) to earn any amounts above $75.0 million up to the Capitalization Cap(“Excess Award”). One-third of this Excess Award can be earned at the end of each of the three years after the Initial Award is earned, if our performance meetsor exceeds the Index in each of such three years. In addition, participants will not be able to sell or transfer any equity they receive as Initial or Excess Awardsuntil three years after the end of the initial performance period. At December 31, 2017, all awards were equity classified. We use a Monte Carlo valuation model to value the participation points allocated under the POP. The following table details the assumptions used for each grant based on the year it was granted (dollars in thousands): 2017 2016 2015 Risk free interest rate 1.49% 0.99% 0.86%Expected volatility 22.2% 20.5% 28.0%Aggregate fair value $ 20,400 $ 26,600 $ 26,500
Total remaining compensation cost related to the POP at December 31, 2017, was $22.9 million, prior to adjustments for capitalized amounts due to ourdevelopment and leasing activities. The remaining compensation cost will be recognized through 2022, with a weighted average period of 1.1 years. The performance criteria were met for the 2015 – 2017 and 2014 – 2016 performance periods, which resulted in the pool being awarded in January 2018 and2017, respectively, in the form of common stock and vested POP LTIP Units. See below for details on these performance periods (dollars and units inthousands): 2015 – 2017 2014 – 2016 Performance pool $ 110,230 $ 62,220 Common stock 582 486 Vested POP LTIP Units and LTIP Units 1,170 698 Grant date fair value $ 62.65 $ 52.53
The POP performance criteria were not met for 2013 – 2015 performance period, therefore, no awards were earned and the participants’ points and POP LTIPUnits were forfeited. As the POP has market-based performance criteria, there is no adjustment to the expense previously recognized at the completion of theperformance period regardless of the outcome. Other Equity-Based Compensation Plans and Programs Awards may be issued in the form of RSUs or LTIP Units at the participants’ elections under the following equity-based compensation plans and programs.RSUs and LTIP Units are valued based on the market price of the Parent’s common stock on the date the award is granted and is charged to compensationexpense over the service period, which is generally three years. Dividends and distributions are paid with respect to both RSUs and LTIP Units during thevesting period, and therefore they are considered participating securities. The value of the dividend is charged to retained earnings for RSUs and the distributionis charged to Net Income Attributable to Noncontrolling Interests in the OP for LTIP Units. Prologis Promote Plan (“PPP”) Under the PPP, we establish a compensation pool for certain employees that is equal to 40% of the promotes earned by Prologis from the co-investmentventures representing the third-party portion of the promotes. The awards may be settled in some combination of cash and full value awards, at our election. Annual LTI Equity Award Program (“Annual LTI Award”) The Annual LTI Award provides for grants to certain employees subject to our performance against benchmark indices that relate to the most recent year’sperformance. Annual Bonus Exchange Program Under our bonus exchange program, generally all our employees may elect to receive all or a portion of their annual cash bonus in equity. Equity awards grantedthrough the bonus exchange are generally valued at a premium to the cash bonus exchanged.
79
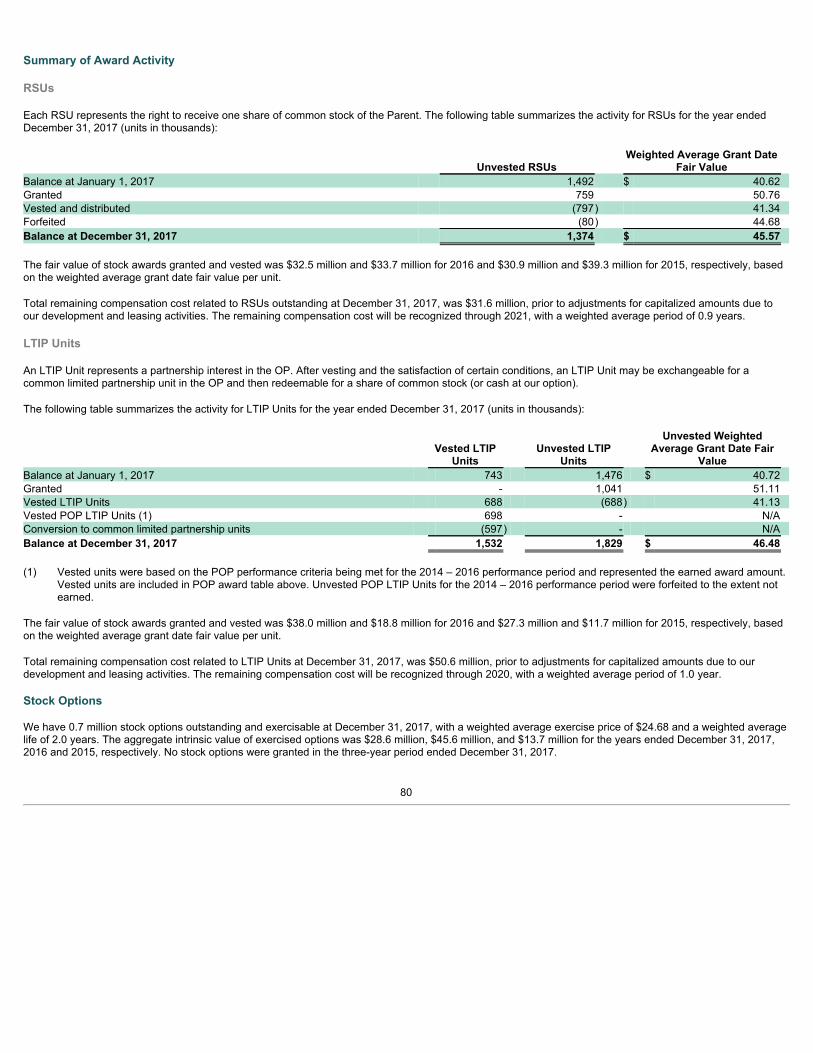
Summary of Award Activity RSUs Each RSU represents the right to receive one share of common stock of the Parent. The following table summarizes the activity for RSUs for the year endedDecember 31, 2017 (units in thousands):
Unvested RSUs Weighted Average Grant Date
Fair Value Balance at January 1, 2017 1,492 $ 40.62 Granted 759 50.76 Vested and distributed (797) 41.34 Forfeited (80) 44.68 Balance at December 31, 2017 1,374 $ 45.57
The fair value of stock awards granted and vested was $32.5 million and $33.7 million for 2016 and $30.9 million and $39.3 million for 2015, respectively, basedon the weighted average grant date fair value per unit. Total remaining compensation cost related to RSUs outstanding at December 31, 2017, was $31.6 million, prior to adjustments for capitalized amounts due toour development and leasing activities. The remaining compensation cost will be recognized through 2021, with a weighted average period of 0.9 years. LTIP Units An LTIP Unit represents a partnership interest in the OP. After vesting and the satisfaction of certain conditions, an LTIP Unit may be exchangeable for acommon limited partnership unit in the OP and then redeemable for a share of common stock (or cash at our option). The following table summarizes the activity for LTIP Units for the year ended December 31, 2017 (units in thousands):
Vested LTIP
Units Unvested LTIP
Units
Unvested WeightedAverage Grant Date Fair
Value Balance at January 1, 2017 743 1,476 $ 40.72 Granted - 1,041 51.11 Vested LTIP Units 688 (688) 41.13 Vested POP LTIP Units (1) 698 - N/A Conversion to common limited partnership units (597) - N/A Balance at December 31, 2017 1,532 1,829 $ 46.48
(1) Vested units were based on the POP performance criteria being met for the 2014 – 2016 performance period and represented the earned award amount.
Vested units are included in POP award table above. Unvested POP LTIP Units for the 2014 – 2016 performance period were forfeited to the extent notearned.
The fair value of stock awards granted and vested was $38.0 million and $18.8 million for 2016 and $27.3 million and $11.7 million for 2015, respectively, basedon the weighted average grant date fair value per unit. Total remaining compensation cost related to LTIP Units at December 31, 2017, was $50.6 million, prior to adjustments for capitalized amounts due to ourdevelopment and leasing activities. The remaining compensation cost will be recognized through 2020, with a weighted average period of 1.0 year. Stock Options We have 0.7 million stock options outstanding and exercisable at December 31, 2017, with a weighted average exercise price of $24.68 and a weighted averagelife of 2.0 years. The aggregate intrinsic value of exercised options was $28.6 million, $45.6 million, and $13.7 million for the years ended December 31, 2017,2016 and 2015, respectively. No stock options were granted in the three-year period ended December 31, 2017.
80
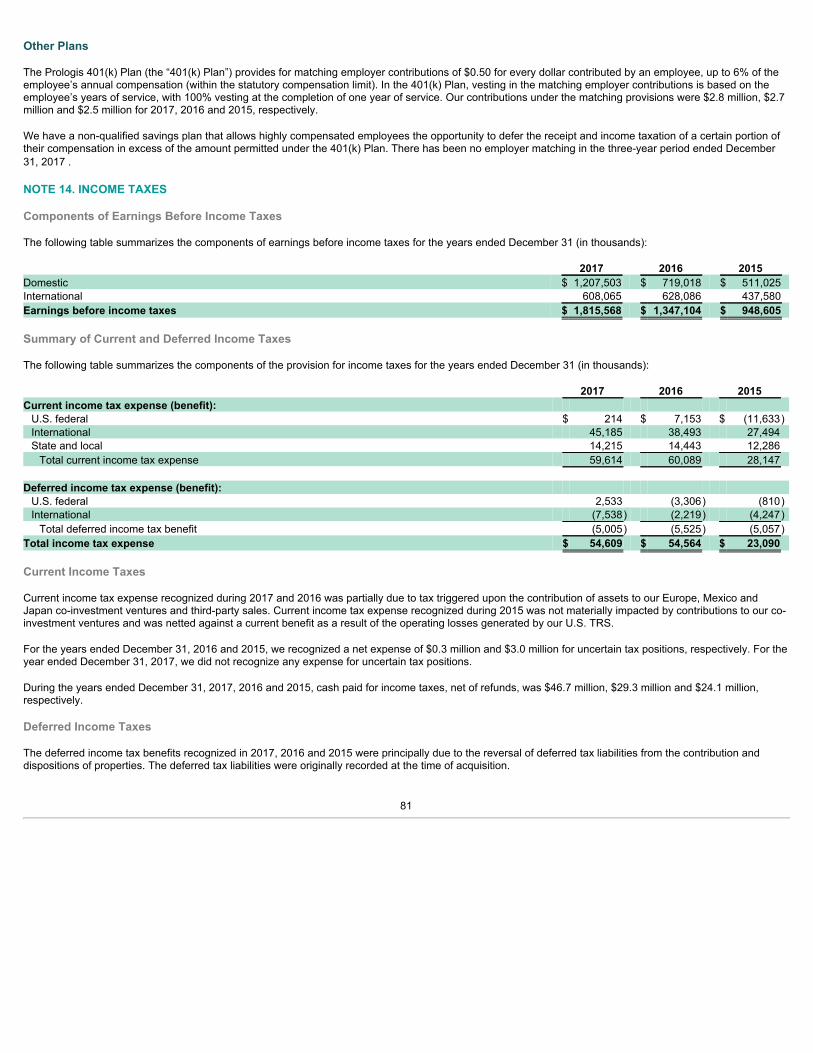
Other Plans The Prologis 401(k) Plan (the “401(k) Plan”) provides for matching employer contributions of $0.50 for every dollar contributed by an employee, up to 6% of theemployee’s annual compensation (within the statutory compensation limit). In the 401(k) Plan, vesting in the matching employer contributions is based on theemployee’s years of service, with 100% vesting at the completion of one year of service. Our contributions under the matching provisions were $2.8 million, $2.7million and $2.5 million for 2017, 2016 and 2015, respectively. We have a non-qualified savings plan that allows highly compensated employees the opportunity to defer the receipt and income taxation of a certain portion oftheir compensation in excess of the amount permitted under the 401(k) Plan. There has been no employer matching in the three-year period ended December31, 2017 . NOTE 14. INCOME TAXES Components of Earnings Before Income Taxes The following table summarizes the components of earnings before income taxes for the years ended December 31 (in thousands): 2017 2016 2015 Domestic $ 1,207,503 $ 719,018 $ 511,025 International 608,065 628,086 437,580 Earnings before income taxes $ 1,815,568 $ 1,347,104 $ 948,605
Summary of Current and Deferred Income Taxes The following table summarizes the components of the provision for income taxes for the years ended December 31 (in thousands): 2017 2016 2015 Current income tax expense (benefit): U.S. federal $ 214 $ 7,153 $ (11,633)International 45,185 38,493 27,494 State and local 14,215 14,443 12,286 Total current income tax expense 59,614 60,089 28,147
Deferred income tax expense (benefit): U.S. federal 2,533 (3,306) (810)International (7,538) (2,219) (4,247)Total deferred income tax benefit (5,005) (5,525) (5,057)
Total income tax expense $ 54,609 $ 54,564 $ 23,090
Current Income Taxes Current income tax expense recognized during 2017 and 2016 was partially due to tax triggered upon the contribution of assets to our Europe, Mexico andJapan co-investment ventures and third-party sales. Current income tax expense recognized during 2015 was not materially impacted by contributions to our co-investment ventures and was netted against a current benefit as a result of the operating losses generated by our U.S. TRS. For the years ended December 31, 2016 and 2015, we recognized a net expense of $0.3 million and $3.0 million for uncertain tax positions, respectively. For theyear ended December 31, 2017, we did not recognize any expense for uncertain tax positions. During the years ended December 31, 2017, 2016 and 2015, cash paid for income taxes, net of refunds, was $46.7 million, $29.3 million and $24.1 million,respectively. Deferred Income Taxes The deferred income tax benefits recognized in 2017, 2016 and 2015 were principally due to the reversal of deferred tax liabilities from the contribution anddispositions of properties. The deferred tax liabilities were originally recorded at the time of acquisition.
81

The following table summarizes the deferred income tax assets and liabilities at December 31 (in thousands): 2017 2016 Gross deferred income tax assets: NOL carryforwards $ 334,358 $ 350,909 Basis difference – real estate properties 53,902 56,827 Basis difference – equity investments and intangibles 4,740 4,666 Section 163(j) interest limitation 26,280 40,766 Capital loss carryforward 10,566 25,145 Other – temporary differences 5,724 5,578 Total gross deferred income tax assets 435,570 483,891
Valuation allowance (410,896) (456,699)Gross deferred income tax assets, net of valuation allowance 24,674 27,192
Gross deferred income tax liabilities: Basis difference – real estate properties 63,246 70,914 Basis difference – equity investments and intangibles 1,114 6,864 Other – temporary differences 769 1,028 Total gross deferred income tax liabilities 65,129 78,806
Net deferred income tax liabilities $ 40,455 $ 51,614
The Tax Cuts and Jobs Act, enacted on December 22, 2017, reduced the corporate federal tax rate in the U.S. to 21.0%, effective upon enactment. As such,deferred tax assets and liabilities were remeasured using the lower corporate federal tax rate at December 31, 2017. While we do not expect other materialimpacts, the new rules are complex and lack developed administrative guidance; thus, the impact of certain aspects of these provisions on us is currentlyunclear. At December 31, 2017, we had NOL carryforwards as follows (in thousands): U.S. Europe Mexico Japan Other Gross NOL carryforward $ 106,594 $ 721,225 $ 334,290 $ 130,679 $ 44,084 Tax-effected NOL carryforward 26,040 168,588 103,671 25,419 10,640 Valuation allowance (26,040) (152,911) (103,671) (25,419) (10,640)Net deferred tax asset – NOL carryforward $ - $ 15,677 $ - $ - $ - Expiration periods 2022 – 2037 2018 – indefinite 2018 – 2028 2018 – 2026 2018 – indefinite
The deferred tax asset valuation allowance at December 31, 2017, was adequate to reduce the total deferred tax asset to an amount that we estimate will morelikely than not be realized. Liability for Uncertain Tax Positions During the years ended December 31, 2017, 2016 and 2015, we believe that we have complied with the REIT requirements of the Internal Revenue Code. Thestatute of limitations for our tax returns is generally three years. As such, our tax returns that remain subject to examination would be primarily from 2014 andthereafter. The liability for uncertain tax positions was $3.0 million for the years ended December 31, 2017 and 2016, and $3.3 million for the year ended December 31,2015, and primarily consisted of estimated income tax liabilities in Mexico and included accrued interest and penalties. NOTE 15. EARNINGS PER COMMON SHARE OR UNIT We determine basic earnings per share or unit based on the weighted average number of shares of common stock or units outstanding during the period. Wecompute diluted earnings per share or unit based on the weighted average number of shares or units outstanding combined with the incremental weightedaverage effect from all outstanding potentially dilutive instruments.
82
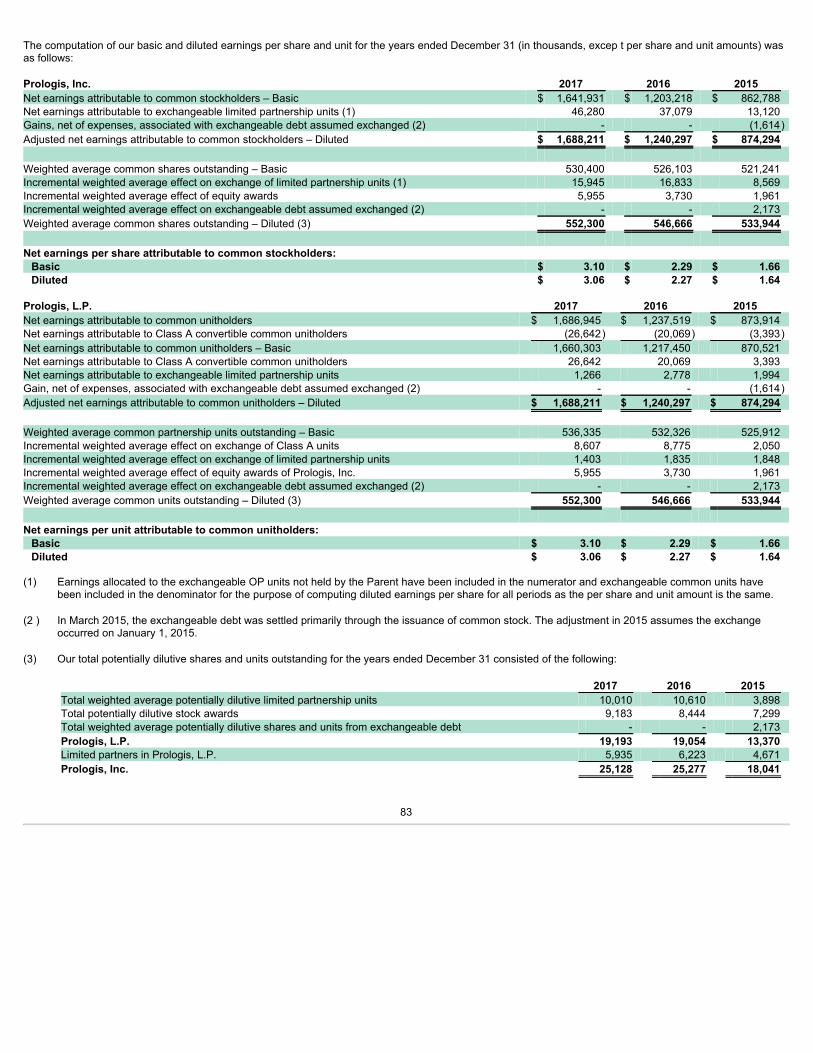
The computation of our basic and diluted earnings per share and unit for the years ended December 31 (in thousands, excep t per share and unit amounts) wasas follows: Prologis, Inc. 2017 2016 2015 Net earnings attributable to common stockholders – Basic $ 1,641,931 $ 1,203,218 $ 862,788 Net earnings attributable to exchangeable limited partnership units (1) 46,280 37,079 13,120 Gains, net of expenses, associated with exchangeable debt assumed exchanged (2) - - (1,614)Adjusted net earnings attributable to common stockholders – Diluted $ 1,688,211 $ 1,240,297 $ 874,294 Weighted average common shares outstanding – Basic 530,400 526,103 521,241 Incremental weighted average effect on exchange of limited partnership units (1) 15,945 16,833 8,569 Incremental weighted average effect of equity awards 5,955 3,730 1,961 Incremental weighted average effect on exchangeable debt assumed exchanged (2) - - 2,173 Weighted average common shares outstanding – Diluted (3) 552,300 546,666 533,944 Net earnings per share attributable to common stockholders:
Basic $ 3.10 $ 2.29 $ 1.66 Diluted $ 3.06 $ 2.27 $ 1.64
Prologis, L.P. 2017 2016 2015 Net earnings attributable to common unitholders $ 1,686,945 $ 1,237,519 $ 873,914 Net earnings attributable to Class A convertible common unitholders (26,642) (20,069) (3,393)Net earnings attributable to common unitholders – Basic 1,660,303 1,217,450 870,521 Net earnings attributable to Class A convertible common unitholders 26,642 20,069 3,393 Net earnings attributable to exchangeable limited partnership units 1,266 2,778 1,994 Gain, net of expenses, associated with exchangeable debt assumed exchanged (2) - - (1,614)Adjusted net earnings attributable to common unitholders – Diluted $ 1,688,211 $ 1,240,297 $ 874,294 Weighted average common partnership units outstanding – Basic 536,335 532,326 525,912 Incremental weighted average effect on exchange of Class A units 8,607 8,775 2,050 Incremental weighted average effect on exchange of limited partnership units 1,403 1,835 1,848 Incremental weighted average effect of equity awards of Prologis, Inc. 5,955 3,730 1,961 Incremental weighted average effect on exchangeable debt assumed exchanged (2) - - 2,173 Weighted average common units outstanding – Diluted (3) 552,300 546,666 533,944 Net earnings per unit attributable to common unitholders:
Basic $ 3.10 $ 2.29 $ 1.66 Diluted $ 3.06 $ 2.27 $ 1.64
(1) Earnings allocated to the exchangeable OP units not held by the Parent have been included in the numerator and exchangeable common units have
been included in the denominator for the purpose of computing diluted earnings per share for all periods as the per share and unit amount is the same. (2 ) In March 2015, the exchangeable debt was settled primarily through the issuance of common stock. The adjustment in 2015 assumes the exchange
occurred on January 1, 2015. (3) Our total potentially dilutive shares and units outstanding for the years ended December 31 consisted of the following: 2017 2016 2015 Total weighted average potentially dilutive limited partnership units 10,010 10,610 3,898 Total potentially dilutive stock awards 9,183 8,444 7,299 Total weighted average potentially dilutive shares and units from exchangeable debt - - 2,173 Prologis, L.P. 19,193 19,054 13,370 Limited partners in Prologis, L.P. 5,935 6,223 4,671 Prologis, Inc. 25,128 25,277 18,041
83
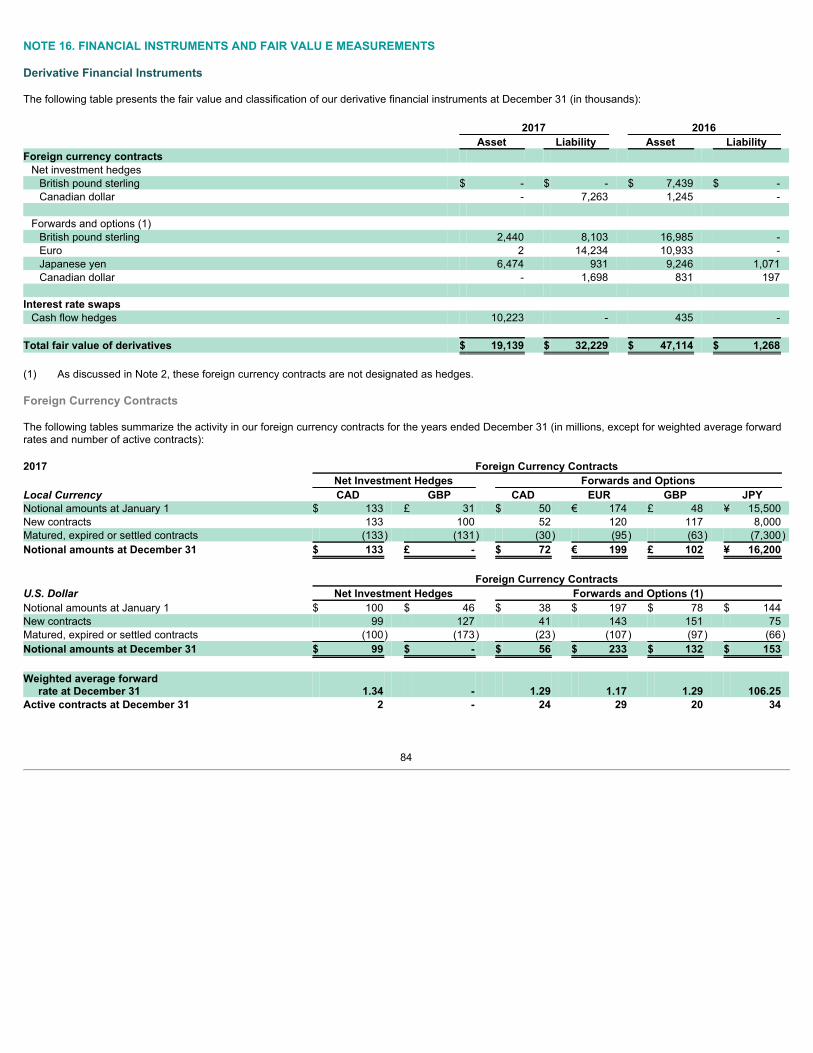
NOTE 16. FINANCIAL INSTRUMENTS AND FAIR VALU E MEASUREMENTS Derivative Financial Instruments The following table presents the fair value and classification of our derivative financial instruments at December 31 (in thousands): 2017 2016 Asset Liability Asset Liability Foreign currency contracts Net investment hedges British pound sterling $ - $ - $ 7,439 $ - Canadian dollar - 7,263 1,245 -
Forwards and options (1) British pound sterling 2,440 8,103 16,985 - Euro 2 14,234 10,933 - Japanese yen 6,474 931 9,246 1,071 Canadian dollar - 1,698 831 197
Interest rate swaps Cash flow hedges 10,223 - 435 -
Total fair value of derivatives $ 19,139 $ 32,229 $ 47,114 $ 1,268
(1) As discussed in Note 2, these foreign currency contracts are not designated as hedges. Foreign Currency Contracts The following tables summarize the activity in our foreign currency contracts for the years ended December 31 (in millions, except for weighted average forwardrates and number of active contracts): 2017 Foreign Currency Contracts Net Investment Hedges Forwards and Options Local Currency CAD GBP CAD EUR GBP JPY Notional amounts at January 1 $ 133 £ 31 $ 50 € 174 £ 48 ¥ 15,500 New contracts 133 100 52 120 117 8,000 Matured, expired or settled contracts (133) (131) (30) (95) (63) (7,300)Notional amounts at December 31 $ 133 £ - $ 72 € 199 £ 102 ¥ 16,200 Foreign Currency Contracts U.S. Dollar Net Investment Hedges Forwards and Options (1) Notional amounts at January 1 $ 100 $ 46 $ 38 $ 197 $ 78 $ 144 New contracts 99 127 41 143 151 75 Matured, expired or settled contracts (100) (173) (23) (107) (97) (66)Notional amounts at December 31 $ 99 $ - $ 56 $ 233 $ 132 $ 153 Weighted average forward rate at December 31 1.34 - 1.29 1.17 1.29 106.25 Active contracts at December 31 2 - 24 29 20 34
84
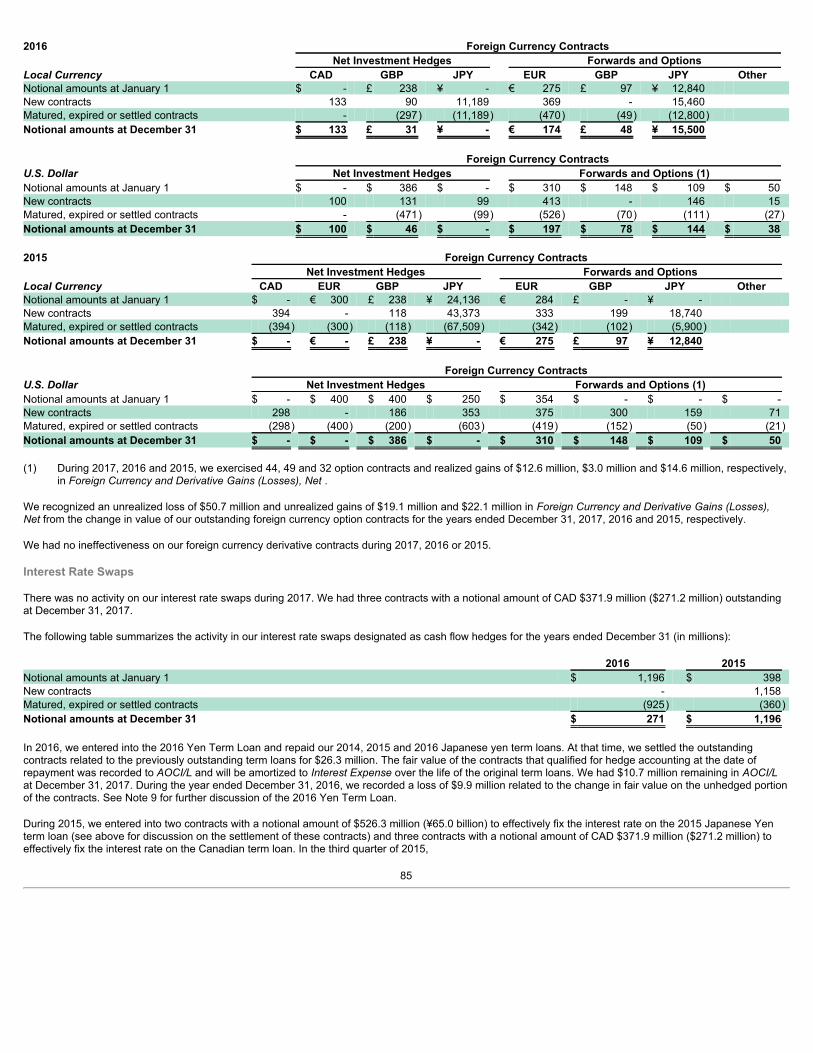
2016 Foreign Currency Contracts Net Investment Hedges Forwards and Options Local Currency CAD GBP JPY EUR GBP JPY Other Notional amounts at January 1 $ - £ 238 ¥ - € 275 £ 97 ¥ 12,840 New contracts 133 90 11,189 369 - 15,460 Matured, expired or settled contracts - (297) (11,189) (470) (49) (12,800) Notional amounts at December 31 $ 133 £ 31 ¥ - € 174 £ 48 ¥ 15,500 Foreign Currency Contracts U.S. Dollar Net Investment Hedges Forwards and Options (1) Notional amounts at January 1 $ - $ 386 $ - $ 310 $ 148 $ 109 $ 50 New contracts 100 131 99 413 - 146 15 Matured, expired or settled contracts - (471) (99) (526) (70) (111) (27)Notional amounts at December 31 $ 100 $ 46 $ - $ 197 $ 78 $ 144 $ 38
2015 Foreign Currency Contracts Net Investment Hedges Forwards and Options Local Currency CAD EUR GBP JPY EUR GBP JPY Other Notional amounts at January 1 $ - € 300 £ 238 ¥ 24,136 € 284 £ - ¥ - New contracts 394 - 118 43,373 333 199 18,740 Matured, expired or settled contracts (394) (300) (118) (67,509) (342) (102) (5,900) Notional amounts at December 31 $ - € - £ 238 ¥ - € 275 £ 97 ¥ 12,840 Foreign Currency Contracts U.S. Dollar Net Investment Hedges Forwards and Options (1) Notional amounts at January 1 $ - $ 400 $ 400 $ 250 $ 354 $ - $ - $ - New contracts 298 - 186 353 375 300 159 71 Matured, expired or settled contracts (298) (400) (200) (603) (419) (152) (50) (21)Notional amounts at December 31 $ - $ - $ 386 $ - $ 310 $ 148 $ 109 $ 50
(1) During 2017, 2016 and 2015, we exercised 44, 49 and 32 option contracts and realized gains of $12.6 million, $3.0 million and $14.6 million, respectively,
in Foreign Currency and Derivative Gains (Losses), Net . We recognized an unrealized loss of $50.7 million and unrealized gains of $19.1 million and $22.1 million in Foreign Currency and Derivative Gains (Losses),Net from the change in value of our outstanding foreign currency option contracts for the years ended December 31, 2017, 2016 and 2015, respectively. We had no ineffectiveness on our foreign currency derivative contracts during 2017, 2016 or 2015. Interest Rate Swaps There was no activity on our interest rate swaps during 2017. We had three contracts with a notional amount of CAD $371.9 million ($271.2 million) outstandingat December 31, 2017. The following table summarizes the activity in our interest rate swaps designated as cash flow hedges for the years ended December 31 (in millions): 2016 2015 Notional amounts at January 1 $ 1,196 $ 398 New contracts - 1,158 Matured, expired or settled contracts (925) (360)Notional amounts at December 31 $ 271 $ 1,196
In 2016, we entered into the 2016 Yen Term Loan and repaid our 2014, 2015 and 2016 Japanese yen term loans. At that time, we settled the outstandingcontracts related to the previously outstanding term loans for $26.3 million. The fair value of the contracts that qualified for hedge accounting at the date ofrepayment was recorded to AOCI/L and will be amortized to Interest Expense over the life of the original term loans. We had $10.7 million remaining in AOCI/Lat December 31, 2017. During the year ended December 31, 2016, we recorded a loss of $9.9 million related to the change in fair value on the unhedged portionof the contracts. See Note 9 for further discussion of the 2016 Yen Term Loan. During 2015, we entered into two contracts with a notional amount of $526.3 million (¥65.0 billion) to effectively fix the interest rate on the 2015 Japanese Yenterm loan (see above for discussion on the settlement of these contracts) and three contracts with a notional amount of CAD $371.9 million ($271.2 million) toeffectively fix the interest rate on the Canadian term loan. In the third quarter of 2015,
85

we entered into two contracts with a notional amount of $360.0 million to effectively fix t he interest rate at the three-month LIBOR rate of 2.3% on expectedfuture debt issuances. These contracts were settled in the fourth quarter of 2015 when we entered into $750.0 million of senior notes. We recorded a loss of$11.0 million associated with th ese derivatives that will be amortized to Interest Expense , in accordance with our policy. See Note 9 for more information on our term loans. Other Comprehensive Income (Loss) The change in Other Comprehensive Income (Loss) in the Consolidated Statements of Comprehensive Income during the periods presented is due to thetranslation into U.S. dollars on consolidation of the financial statements of our consolidated subsidiaries whose functional currency is not the U.S. dollar. Werecorded net gains of $554.0 million for the year ended December 31, 2017, and net losses of $304.0 million and $594.0 million for the years ended December31, 2016 and 2015, respectively. These gains and losses recognized in Other Comprehensive Income (Loss) during the periods were offset by net losses on thetranslation of our derivative and nonderivative net investment hedges discussed below. This includes the change in fair value for the effective portion of ourderivative and nonderivative instruments that have been designated as hedges. The following table presents the gains and (losses) associated with the change in fair value for the effective portion of our derivative and nonderivative hedginginstruments included in Other Comprehensive Income for the years ended December 31 (in thousands): 2017 2016 2015 Derivative net investment hedges (1) $ (12,762) $ 55,460 $ 63,934 Interest rate and cash flow hedges (2) 12,726 (551) (21,714)Our share of derivatives from unconsolidated co-investment ventures 9,865 (798) 4,257 Total derivative hedging instruments 9,829 54,111 46,477
Nonderivative net investment hedges (3) (4) (477,755) 112,591 321,148 Total derivative and nonderivative hedging instruments – gains (losses) $ (467,926) $ 166,702 $ 367,625
(1) We received $2.5 million, $79.8 million and $128.2 million for the years ended December 31, 2017, 2016 and 2015, respectively, on the settlement of net
investment hedges. (2) The amount reclassified to interest expense was $5.4 million for 2017 and $5.5 million for 2016. The amount for 2015 was not considered significant. For
the next 12 months from December 31, 2017, we estimate an additional expense of $3.1 million will be reclassified to Interest Expense . (3) At December 31, 2017, 2016 and 2015, we had €3.1 billion ($3.6 billion), €3.2 billion ($3.4 billion) and €3.2 billion ($3.5 billion) of debt, net of accrued
interest, respectively, designated as nonderivative financial instrument hedges of our net investment in international subsidiaries. We recognizedunrealized losses of $17.9 million and unrealized gains of $10.0 million in Foreign Currency and Derivative Gains (Losses), Net on the undesignatedportion of our debt for the years ended December 31, 2017 and 2015, respectively. There were no unrealized gains or losses recognized for the yearended December 31, 2016.
(4) In June 2017, we issued £500.0 million ($645.3 million) of debt, as discussed in Note 9, and £323.7 million ($436.0 million) of the debt was designated as
a nonderivative financial instrument hedge of our net investment in international subsidiaries at December 31, 2017. We recognized unrealized losses of$5.4 million in Foreign Currency and Derivative Gains (Losses), Net on the undesignated portion of our debt for the year ended December 31, 2017.
Fair Value Measurements We have estimated the fair value of our financial instruments using available market information and valuation methodologies we believe to be appropriate forthese purposes. Considerable judgment and a high degree of subjectivity are involved in developing these estimates and, accordingly, they are not necessarilyindicative of amounts that we would realize on disposition. See Note 2 for more information on our fair value measurements policy. Fair Value Measurements on a Recurring Basis At December 31, 2017 and 2016, other than the derivatives discussed previously, we did not have any significant financial assets or financial liabilities that weremeasured at fair value on a recurring basis in the Consolidated Financial Statements. All of our derivatives held at December 31, 2017 and 2016, were classifiedas Level 2 of the fair value hierarchy. Fair Value Measurements on Nonrecurring Basis Acquired properties and assets we expect to sell or contribute met the criteria to be measured at fair value on a nonrecurring basis at December 31, 2017 and2016, as discussed in Notes 3, 4 and 6.
86

Fair Value of Financial Instruments At December 31, 2017 and 2016, the carrying amounts of certain financial instruments, including cash and cash equivalents, accounts and notes receivable,accounts payable and accrued expenses were representative of their fair values. The differences in the fair value of our debt from the carrying value in the table below were the result of differences in interest rates or borrowing spreads thatwere available to us at December 31, 2017 and 2016, as compared with those in effect when the debt was issued or assumed, including reduced borrowingspreads due to our improved credit ratings. The senior notes and many of the issuances of secured mortgage debt contain pre-payment penalties or yieldmaintenance provisions that could make the cost of refinancing the debt at lower rates exceed the benefit that would be derived from doing so. The following table reflects the carrying amounts and estimated fair values of our debt at December 31 (in thousands): 2017 2016
Carrying Value Fair Value Carrying Value Fair Value Credit Facilities $ 317,392 $ 317,496 $ 35,023 $ 35,061 Senior notes 6,067,277 6,537,100 6,417,492 6,935,485 Term loans and unsecured other 2,060,491 2,075,002 1,499,001 1,510,661 Secured mortgages 808,096 867,067 979,585 1,055,020 Secured mortgages of consolidated entities 159,375 159,130 1,677,193 1,683,489 Total debt $ 9,412,631 $ 9,955,795 $ 10,608,294 $ 11,219,716
NOTE 17. COMMITMENTS AND CONTINGENCIES Environmental Matters A majority of the properties we acquire, including land, are subjected to environmental reviews either by us or the previous owners. In addition, we may incurenvironmental remediation costs associated with certain land parcels we acquire in connection with the development of the land. We have acquired certainproperties that may have been leased to or previously owned by companies that discharged hazardous materials. We establish a liability at the time ofacquisition to cover such costs and adjust the liabilities as appropriate when additional information becomes available. We record our environmental liabilities inOther Liabilities . We purchase various environmental insurance policies to mitigate our exposure to environmental liabilities. We are not aware of anyenvironmental liabilities that would have a material adverse effect on our business, financial condition or results of operations. Indemnification Agreements We may enter into agreements whereby we indemnify certain co-investment ventures, or our venture partners, outside of the U.S. for taxes that may beassessed with respect to certain properties we contributed to these ventures. Our contributions to these ventures are generally structured as contributions ofshares of companies that own the real estate assets. Accordingly, the capital gains associated with the step up in the value of the underlying real estate assets,for tax purposes, are deferred and transferred at contribution. We have generally indemnified these ventures to the extent that the ventures: (i) incur capital gainsor withholding tax as a result of a direct sale of the real estate asset, as opposed to a transaction in which the shares of the company owning the real estateasset are transferred or sold or (ii) are required to grant a discount to the buyer of shares under a share transfer transaction as a result of the venturestransferring the embedded capital gain tax liability to the buyer of the shares in the transaction. The agreements limit the amount that is subject to ourindemnification with respect to each property to 100% of the actual tax liabilities related to the capital gains that are deferred and transferred by us to theventures at the time of the initial contribution less any deferred tax assets transferred with the property. The outcome under these agreements is uncertain as it depends on the method and timing of dissolution of the related venture or disposition of any propertiesby the venture. We record liabilities related to the indemnification agreements in Other Liabilities . We continue to monitor these agreements and the likelihood ofthe sale of assets that would result in recognition and will adjust the potential liability in the future as facts and circumstances dictate. Off-Balance Sheet Liabilities We have issued performance and surety bonds and standby letters of credit in connection with certain development projects. Performance and surety bonds arecommonly required by public agencies from real estate developers. Performance and surety bonds are renewable and expire on the completion of theimprovements and infrastructure. At December 31, 2017 and 2016, we had approximately $178.4 million and $123.5 million, respectively, outstanding undersuch arrangements. We may be required under capital commitments or we may choose to make additional capital contributions to certain of our unconsolidated entities, representingour proportionate ownership interest, should additional capital contributions be necessary to fund development or acquisition costs, repayment of debt oroperation shortfalls. See Note 5 for further discussion related to equity commitments to our unconsolidated entities.
87

Litigation From time to time, we are party to a variety of legal proceedings arising in the ordinary course of business. We believe that, with respect to any such matters thatwe are currently a party to, the ultimate disposition of any such matter will not have material adverse effect on our business, financial position or results ofoperations. NOTE 18. BUSINESS SEGMENTS Our current business strategy includes two operating segments: Real Estate Operations and Strategic Capital. We generate revenues, earnings, net operatingincome and cash flows through our segments, as follows: • Real Estate Operations. This operating segment represents the ownership and development of operating properties and is the largest component of our
revenues and earnings. We collect rent from our customers through operating leases, including reimbursements for the majority of our property operatingcosts. Each operating property is considered to be an individual operating segment with similar economic characteristics; these properties are combinedwithin the reportable business segment based on geographic location. Our Real Estate Operations segment also includes development activities that leadto rental operations, including land held for development and properties currently under development. Within this line of business, we utilize the following:(i) our land bank; (ii) the development expertise of our local teams; and (iii) our customer relationships. Land we own and lease to customers underground leases is also included in this segment.
• Strategic Capital. This operating segment represents the management of unconsolidated co-investment ventures. We generate strategic capital
revenues primarily from our unconsolidated co-investment ventures through asset management and property management services and we earnadditional revenues by providing leasing, acquisition, construction, development, financing and disposition services. Depending on the structure of theventure and the returns provided to our partners, we also earn revenues through promotes periodically during the life of a venture or upon liquidation.Each unconsolidated co-investment venture we manage is considered to be an individual operating segment with similar economic characteristics; theseventures are combined within the reportable business segment based on geographic location.
Reconciliations are presented below for: (i) each reportable business segment’s revenues from external customers to Total Revenues ; (ii) each reportablebusiness segment’s net operating income from external customers to Operating Income and Earnings Before Income Taxes ; and (iii) each reportable businesssegment’s assets to Total Assets . Our chief operating decision makers rely primarily on net operating income and similar measures to make decisions aboutallocating resources and assessing segment performance. The applicable components of Total Revenues, Operating Income, Earnings Before Income Taxesand Total Assets are allocated to each reportable business segment’s revenues, net operating income and assets. Items that are not directly assignable to asegment, such as certain corporate income and expenses, are not allocated but reflected as reconciling items. The following reconciliations are presented inthousands:
88

Years Ended December 31, 2017 2016 2015 Revenues: Real estate operations segment: U.S. $ 2,025,184 $ 2,040,308 $ 1,801,858 Other Americas 84,789 58,519 57,316 Europe 73,708 75,602 69,576 Asia 60,564 55,144 50,495 Total real estate operations segment 2,244,245 2,229,573 1,979,245
Strategic capital segment: U.S. 176,720 39,360 39,396 Other Americas 28,494 22,799 22,507 Europe 106,862 186,652 112,744 Asia 61,813 54,751 43,182 Total strategic capital segment 373,889 303,562 217,829
Total revenues 2,618,134 2,533,135 2,197,074 Segment net operating income: Real estate operations segment: U.S. (1) 1,519,164 1,520,571 1,256,188 Other Americas 58,842 38,114 38,061 Europe 51,277 54,406 39,721 Asia 33,234 33,283 34,395 Total real estate operations segment 1,662,517 1,646,374 1,368,365
Strategic capital segment: U.S. (1) 106,471 (1,622) (1,925)Other Americas 16,811 12,777 13,496 Europe 68,127 144,132 86,215 Asia 27,339 19,769 11,621 Total strategic capital segment 218,748 175,056 109,407
Total segment net operating income 1,881,265 1,821,430 1,477,772
Reconciling items: General and administrative expenses 231,059 222,067 217,227 Depreciation and amortization expenses 879,140 930,985 880,373
Operating income 771,066 668,378 380,172 Earnings from unconsolidated entities, net 248,567 206,307 159,262 Interest expense (274,486) (303,146) (301,363)Interest and other income, net 13,731 8,101 25,484 Gains on dispositions of investments in real estate and revaluation of equity investments upon acquisition of a controlling interest, net 1,182,965 757,398 758,887 Foreign currency and derivative gains (losses), net (57,896) 7,582 12,466 Gains (losses) on early extinguishment of debt, net (68,379) 2,484 (86,303)
Earnings before income taxes $ 1,815,568 $ 1,347,104 $ 948,605
89
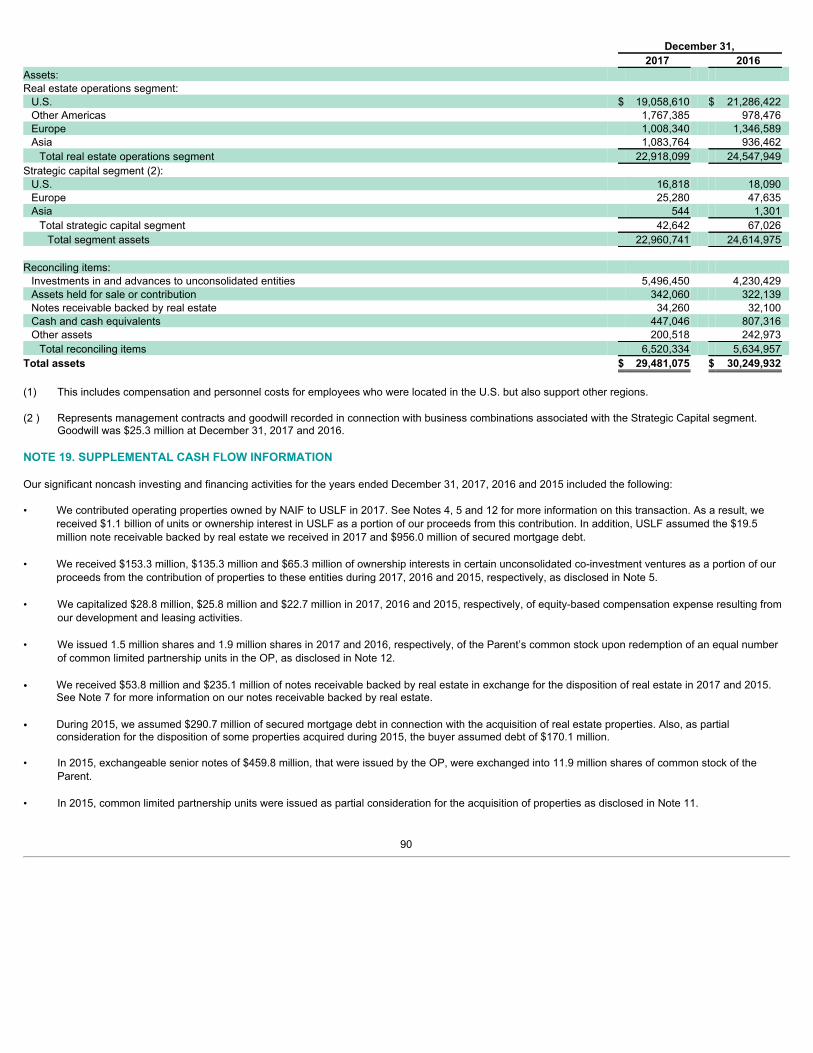
December 31, 2017 2016 Assets: Real estate operations segment: U.S. $ 19,058,610 $ 21,286,422 Other Americas 1,767,385 978,476 Europe 1,008,340 1,346,589 Asia 1,083,764 936,462 Total real estate operations segment 22,918,099 24,547,949
Strategic capital segment (2): U.S. 16,818 18,090 Europe 25,280 47,635 Asia 544 1,301 Total strategic capital segment 42,642 67,026 Total segment assets 22,960,741 24,614,975
Reconciling items: Investments in and advances to unconsolidated entities 5,496,450 4,230,429 Assets held for sale or contribution 342,060 322,139 Notes receivable backed by real estate 34,260 32,100 Cash and cash equivalents 447,046 807,316 Other assets 200,518 242,973 Total reconciling items 6,520,334 5,634,957
Total assets $ 29,481,075 $ 30,249,932
(1) This includes compensation and personnel costs for employees who were located in the U.S. but also support other regions. (2 ) Represents management contracts and goodwill recorded in connection with business combinations associated with the Strategic Capital segment.
Goodwill was $25.3 million at December 31, 2017 and 2016. NOTE 19. SUPPLEMENTAL CASH FLOW INFORMATION Our significant noncash investing and financing activities for the years ended December 31, 2017, 2016 and 2015 included the following: • We contributed operating properties owned by NAIF to USLF in 2017. See Notes 4, 5 and 12 for more information on this transaction. As a result, we
received $1.1 billion of units or ownership interest in USLF as a portion of our proceeds from this contribution. In addition, USLF assumed the $19.5million note receivable backed by real estate we received in 2017 and $956.0 million of secured mortgage debt.
• We received $153.3 million, $135.3 million and $65.3 million of ownership interests in certain unconsolidated co-investment ventures as a portion of ourproceeds from the contribution of properties to these entities during 2017, 2016 and 2015, respectively, as disclosed in Note 5.
• We capitalized $28.8 million, $25.8 million and $22.7 million in 2017, 2016 and 2015, respectively, of equity-based compensation expense resulting from
our development and leasing activities. • We issued 1.5 million shares and 1.9 million shares in 2017 and 2016, respectively, of the Parent’s common stock upon redemption of an equal number
of common limited partnership units in the OP, as disclosed in Note 12. • We received $53.8 million and $235.1 million of notes receivable backed by real estate in exchange for the disposition of real estate in 2017 and 2015.
See Note 7 for more information on our notes receivable backed by real estate. • During 2015, we assumed $290.7 million of secured mortgage debt in connection with the acquisition of real estate properties. Also, as partial
consideration for the disposition of some properties acquired during 2015, the buyer assumed debt of $170.1 million. • In 2015, exchangeable senior notes of $459.8 million, that were issued by the OP, were exchanged into 11.9 million shares of common stock of the
Parent.
• In 2015, common limited partnership units were issued as partial consideration for the acquisition of properties as disclosed in Note 11.
90

• See Note 3 for information related to the KTR transaction in 2015. NOTE 20. SELECTED QUARTERLY FINANCIAL DATA (UNAUDITED) The following table details our selected quarterly financial data (in thousands, except per share and unit data): Three Months Ended, Prologis, Inc. March 31, June 30, September 30, December 31, 2017: Rental revenues $ 439,884 $ 447,960 $ 416,427 $ 433,568 Rental recoveries $ 127,049 $ 128,417 $ 114,755 $ 117,081 Total revenues $ 629,155 $ 766,183 $ 602,874 $ 619,922 Rental expenses $ (152,656) $ (147,794) $ (128,735) $ (140,338)Operating income $ 161,886 $ 275,272 $ 175,491 $ 158,417 Consolidated net earnings $ 220,689 $ 287,980 $ 913,417 $ 338,873 Net earnings attributable to common stockholders $ 203,255 $ 266,943 $ 876,218 $ 295,515 Net earnings per share attributable to common stockholders – Basic (1) $ 0.38 $ 0.50 $ 1.65 $ 0.56 Net earnings per share attributable to common stockholders – Diluted (1) (2) $ 0.38 $ 0.50 $ 1.63 $ 0.55
2016: Rental revenues $ 437,104 $ 426,150 $ 435,868 $ 435,722 Rental recoveries $ 117,012 $ 119,981 $ 124,409 $ 124,163 Total revenues $ 606,300 $ 602,155 $ 704,565 $ 620,115 Rental expenses $ (146,581) $ (140,725) $ (140,514) $ (141,050)Operating income $ 129,198 $ 142,348 $ 232,624 $ 164,208 Consolidated net earnings $ 222,805 $ 295,791 $ 307,242 $ 466,702 Net earnings attributable to common stockholders $ 208,041 $ 275,383 $ 279,255 $ 440,539 Net earnings per share attributable to common stockholders – Basic (1) $ 0.40 $ 0.52 $ 0.53 $ 0.83 Net earnings per share attributable to common stockholders – Diluted (1) (2) $ 0.39 $ 0.52 $ 0.52 $ 0.82
Prologis, L.P. 2017: Rental revenues $ 439,884 $ 447,960 $ 416,427 $ 433,568 Rental recoveries $ 127,049 $ 128,417 $ 114,755 $ 117,081 Total revenues $ 629,155 $ 766,183 $ 602,874 $ 619,922 Rental expenses $ (152,656) $ (147,794) $ (128,735) $ (140,338)Operating income $ 161,886 $ 275,272 $ 175,491 $ 158,417 Consolidated net earnings $ 220,689 $ 287,980 $ 913,417 $ 338,873 Net earnings attributable to common unitholders $ 208,878 $ 274,320 $ 900,331 $ 303,416 Net earnings per unit attributable to common unitholders – Basic (1) $ 0.38 $ 0.50 $ 1.65 $ 0.56 Net earnings per unit attributable to common unitholders – Diluted (1) (2) $ 0.38 $ 0.50 $ 1.63 $ 0.55
2016: Rental revenues $ 437,104 $ 426,150 $ 435,868 $ 435,722 Rental recoveries $ 117,012 $ 119,981 $ 124,409 $ 124,163 Total revenues $ 606,300 $ 602,155 $ 704,565 $ 620,115 Rental expenses $ (146,581) $ (140,725) $ (140,514) $ (141,050)Operating income $ 129,198 $ 142,348 $ 232,624 $ 164,208 Consolidated net earnings $ 222,805 $ 295,791 $ 307,242 $ 466,702 Net earnings attributable to common unitholders $ 214,275 $ 283,699 $ 286,943 $ 452,602 Net earnings per unit attributable to common unitholders – Basic (1) $ 0.40 $ 0.52 $ 0.53 $ 0.83 Net earnings per unit attributable to common unitholders – Diluted (1) (2) $ 0.39 $ 0.52 $ 0.52 $ 0.82
(1) Quarterly earnings per common share or unit amounts may not total to the annual amounts due to rounding and the changes in the number of weighted
average common shares or units outstanding included in the calculation of basic and diluted shares or units.
91

(2) Income allocated to the exchangeable OP units not held by the Parent has been included in the numerator and exchangeable OP units have been
included in the denominator for the purpose of computing dilu ted earnings per share for all periods since the per share and unit is the same.
92

PROLOGIS, INC. AND PROLOGIS, L.P.
SCHEDULE III – REAL ESTATE AND ACCUMULATED DEPRECIATIONDECEMBER 31, 2017
(In thousands of U.S. dollars, as applicable)
Initial Cost to
Prologis Costs
Capitalized Gross Amounts at Which Carried
at December 31, 2017
Description No. ofBldgs.
Encum-brances Land
Building &Improvements
Subsequentto
Acquisition Land Building &
Improvements Total(a,b)
AccumulatedDepreciation
(c)
Date ofConstruction/Acquisition
Operating Properties (d) United States Markets Atlanta, Georgia Atlanta NE Distribution Center 14 (d) 14,559 41,096 38,852 15,165 79,342 94,507 (37,280) 1995, 1996, 1997, 2012, 2015Atlanta South Business Park 11 9,153 40,834 6,159 9,153 46,993 56,146 (12,197) 2011, 2015Atlanta West Distribution Center 4 (d) 12,311 38,291 7,719 12,311 46,010 58,321 (8,818) 2006, 2015Berkeley Lake Distribution Center 1 (d) 2,046 8,712 1,274 2,046 9,986 12,032 (3,009) 2006Buford Distribution Center 2 2,659 8,847 6,302 2,659 15,149 17,808 (2,734) 2007, 2015Cobb Place Distribution Center 2 2,970 12,702 2,008 2,970 14,710 17,680 (3,135) 2012Douglas Hill Distribution Center 4 11,599 46,826 5,169 11,677 51,917 63,594 (21,357) 2005Hartsfield East Distribution Center 2 1,883 9,325 1,307 1,883 10,632 12,515 (2,517) 2011Midland Distribution Center 1 1,919 7,679 1,636 1,919 9,315 11,234 (3,580) 2006Northmont Industrial Center 1 566 3,209 1,786 566 4,995 5,561 (3,798) 1994Park I-75 South 3 (d) 21,261 18,808 74,549 21,460 93,158 114,618 (7,627) 2013, 2015, 2017Park I-85 4 6,391 11,585 26,541 6,390 38,127 44,517 (2,978) 2015Peachtree Corners Business Center 5 (d) 1,413 4,992 6,645 1,501 11,549 13,050 (7,851) 1994, 1997Riverside Distribution Center (ATL) 3 2,533 13,336 4,578 2,556 17,891 20,447 (11,588) 1999Royal 85 Industrial Center 3 3,306 16,859 840 3,306 17,699 21,005 (1,771) 2015Savannah Logistics Center 2 (d) 5,114 46,844 607 5,114 47,451 52,565 (4,034) 2015Suwanee Creek Distribution Center 4 8,409 40,216 2,192 8,409 42,408 50,817 (6,893) 2006, 2010, 2013, 2015Tradeport Distribution Center 3 (d) 1,464 4,563 9,926 1,479 14,474 15,953 (9,544) 1994, 1996Westfork Industrial Center 3 6,216 19,382 2,476 6,216 21,858 28,074 (2,124) 2015Atlanta, Georgia 72 115,772 394,106 200,566 116,780 593,664 710,444 (152,835)
Austin, Texas MET PHASE 1 95 LTD 5 9,893 37,667 1,862 9,893 39,529 49,422 (9,460) 2011Montopolis Distribution Center 1 580 3,384 2,687 580 6,071 6,651 (5,118) 1994Riverside Distribution Center (AUS) 1 1,849 7,195 202 1,849 7,397 9,246 (714) 2015Walnut Creek Corporate Center 3 461 4,089 613 515 4,648 5,163 (3,641) 1994Austin, Texas 10 12,783 52,335 5,364 12,837 57,645 70,482 (18,933)
Baltimore/Washington DC 1901 Park 100 Drive 1 (d) 2,409 7,227 1,347 2,409 8,574 10,983 (3,654) 2006Airport Commons Distribution Center 2 (d) 2,320 - 10,777 2,360 10,737 13,097 (5,891) 1997Beltway Distribution 1 9,211 33,922 937 9,211 34,859 44,070 (8,248) 2011BWI Cargo Center E 1 - 10,725 115 - 10,840 10,840 (8,458) 2011Corridor Industrial 10 18,600 66,872 7,514 18,600 74,386 92,986 (18,921) 2011Gateway Business Center 14 (d) 20,440 33,927 33,687 21,161 66,893 88,054 (21,209) 1995, 1998, 2012, 2014Meadowridge Distribution Center 6 (d) 9,098 31,191 12,897 9,243 43,943 53,186 (12,207) 1998, 2011, 2012White Marsh Distribution Center 1 4,714 6,955 2,090 4,714 9,045 13,759 (502) 2015Baltimore/Washington DC 36 66,792 190,819 69,364 67,698 259,277 326,975 (79,090)
Central & Eastern, Pennsylvania Carlisle Distribution Center 10 94,504 350,096 50,800 95,016 400,384 495,400 (57,041) 2011, 2012, 2013, 2015Chambersburg Distribution Center 1 4,188 17,796 1,280 4,188 19,076 23,264 (2,964) 2013Harrisburg Distribution Center 5 21,950 96,007 4,405 21,950 100,412 122,362 (20,688) 2004Harrisburg Industrial Center 1 782 6,190 1,837 782 8,027 8,809 (4,047) 202Lehigh Valley Distribution Center 8 41,135 104,794 54,069 41,741 158,257 199,998 (27,298) 2004, 2010, 2011, 2013, 2015Park 33 Distribution Center 1 13,411 - 41,585 15,698 39,298 54,996 (9,504) 2007PHL Cargo Center C2 1 - 11,966 93 - 12,059 12,059 (7,939) 2011Central & Eastern, Pennsylvania 27 175,970 586,849 154,069 179,375 737,513 916,888 (129,481)
Central Valley, California Arch Road Logistics Center 2 (d) 9,492 38,060 2,471 9,492 40,531 50,023 (10,255) 2010Central Valley Industrial Center 2 (d) 8,812 33,525 6,640 9,159 39,818 48,977 (21,050) 1999, 2005Manteca Distribution Center 1 9,280 27,840 2,695 9,480 30,335 39,815 (11,709) 2005Patterson Pass Business Center 5 15,475 19,547 106,788 18,598 123,212 141,810 (10,420) 2007, 2012, 2015, 2016, 2017
Tracy II Distribution Center 8 30,630 54,918 162,882 36,090 212,340 248,430 (49,787) 2002, 2007, 2009, 2011, 2012,
2013Central Valley, California 18 73,689 173,890 281,476 82,819 446,236 529,055 (103,221)
Charlotte, North Carolina Charlotte Distribution Center 9 (d) 4,578 - 30,929 6,096 29,411 35,507 (18,353) 1995, 1996, 1997, 1998Northpark Distribution Center 2 (d) 1,183 6,707 3,716 1,184 10,422 11,606 (7,291) 1994, 1998West Pointe Business Center 5 (d) 9,441 26,182 21,627 10,185 47,065 57,250 (9,031) 2006, 2012, 2014, 2015Charlotte, North Carolina 16 15,202 32,889 56,272 17,465 86,898 104,363 (34,675)
Chicago, Illinois Addison Distribution Center 3 3,887 14,687 3,509 3,887 18,196 22,083 (5,627) 1997, 2011, 2015Arlington Heights Distribution Center 1 4,432 7,035 1,138 4,432 8,173 12,605 (669) 2015
93

PROLOGIS, INC. AND PROLOGIS, L.P.
SCHEDULE III – REAL ESTATE AND ACCUMULATED DEPRECIATIONDECEMBER 31, 2017
(In thousands of U.S. dollars, as applicable)
Initial Cost to
Prologis Costs
Capitalized Gross Amounts at Which Carried
at December 31, 2017
Description No. ofBldgs.
Encum-brances Land
Building &Improvements
Subsequentto
Acquisition Land Building &
Improvements Total(a,b)
AccumulatedDepreciation
(c)
Date ofConstruction/Acquisition
Aurora Distribution Center 6 9,921 53,571 2,666 9,921 56,237 66,158 (6,104) 2015Bensenville Industrial Park 14 43,455 111,007 12,352 43,455 123,359 166,814 (30,362) 2011, 2015Chicago Industrial Portfolio 1 1,330 2,876 434 1,330 3,310 4,640 (1,120) 2011Des Plaines Distribution Center 4 10,118 22,262 2,141 10,118 24,403 34,521 (6,646) 1996, 2011, 2015
Elk Grove Distribution Center 11 (d) 33,947 70,193 36,556 33,947 106,749 140,696 (43,818) 1995, 1997, 1999, 2006, 2009,
2015Elk Grove Du Page 21 14,830 64,408 15,984 14,830 80,392 95,222 (23,121) 2012Elk Grove Village SG 2 1,081 2,007 593 1,081 2,600 3,681 (817) 2011Elmhurst Distribution Center 1 1,862 3,263 525 1,862 3,788 5,650 (366) 2015Franklin Park Distribution Center 3 22,998 49,906 1,896 22,998 51,802 74,800 (4,093) 2015Glendale Heights Distribution Center 4 5,826 23,990 13,419 6,047 37,188 43,235 (7,330) 1999, 2015, 2016Gurnee Distribution Center 1 1,961 3,654 116 1,961 3,770 5,731 (465) 2015
I-55 Distribution Center 19 (d) 69,397 273,462 80,014 75,799 347,074 422,873 (101,004) 1999, 2005, 2006, 2007, 2011,
2015Itasca Industrial Portfolio 9 9,273 19,686 2,211 9,273 21,897 31,170 (6,836) 2011Kehoe Industrial 2 2,975 7,876 556 2,975 8,432 11,407 (1,322) 2011, 2015Kenosha Distribution Center 2 14,484 117,728 778 14,484 118,506 132,990 (8,227) 2015McCook Distribution Center 1 1,968 6,784 282 1,968 7,066 9,034 (545) 2015Melrose Park Distribution Center 2 9,544 27,851 550 9,544 28,401 37,945 (2,284) 2015Minooka Distribution Center 2 12,240 41,745 17,968 13,223 58,730 71,953 (23,104) 2005, 2008NDP - Chicago 1 461 1,362 108 461 1,470 1,931 (353) 2011Northbrook Distribution Center 1 2,056 8,227 4,033 2,056 12,260 14,316 (4,290) 2007Northlake Distribution Center 1 5,015 13,569 978 5,015 14,547 19,562 (1,254) 2015Palatine Distribution Center 1 497 2,723 496 497 3,219 3,716 (332) 2015Pleasant Prairie Distribution Center 2 3,293 16,321 3,762 3,293 20,083 23,376 (8,107) 1999, 2015S.C. Johnson & Son 1 2,267 15,911 1,842 3,152 16,868 20,020 (4,884) 2008Shiller Park Distribution Center 17 17,339 33,001 4,893 17,339 37,894 55,233 (4,085) 2015Tower Distribution Center 1 2,050 1,279 76 2,050 1,355 3,405 (102) 2015Waukegan Distribution Center 1 2,451 9,438 807 2,451 10,245 12,696 (3,603) 2007Woodale Distribution Center 1 263 1,490 599 263 2,089 2,352 (1,524) 1997Woodridge Distribution Center 17 (d) 55,010 230,533 39,757 58,383 266,917 325,300 (94,312) 2005, 2007, 2015, 2016Yohan Industrial 3 4,219 12,306 2,123 4,219 14,429 18,648 (3,564) 2011Chicago, Illinois 156 370,450 1,270,151 253,162 382,314 1,511,449 1,893,763 (400,270)
Cincinnati, Ohio Airpark Distribution Center 2 (d) 2,958 9,894 15,828 3,938 24,742 28,680 (10,356) 1996, 2012DAY Cargo Center 5 - 4,749 711 - 5,460 5,460 (2,851) 2011Gateway International Distribution Center 1 2,676 - 18,541 2,698 18,519 21,217 (1,014) 2015Park I-275 2 (d) 7,109 26,097 3,930 7,109 30,027 37,136 (7,397) 2008, 2012Sharonville Distribution Center 2 (d) 1,202 - 16,045 2,424 14,823 17,247 (8,085) 1997West Chester Commerce Park I 2 1,939 8,224 2,432 1,939 10,656 12,595 (2,694) 2012Cincinnati, Ohio 14 15,884 48,964 57,487 18,108 104,227 122,335 (32,397)
Columbus, Ohio Alum Creek Distribution Center 3 3,945 33,239 482 3,945 33,721 37,666 (3,013) 2015Brookham Distribution Center 4 (d) 9,307 39,040 8,909 9,308 47,948 57,256 (23,968) 1999, 2005Capital Park South Distribution Center 7 (d) 8,484 30,385 33,368 8,876 63,361 72,237 (25,769) 1996, 2012International Street Commerce Center 2 1,503 6,356 886 1,503 7,242 8,745 (1,612) 2012Westpointe Distribution Center 2 1,446 7,601 1,811 1,446 9,412 10,858 (4,684) 2007Columbus, Ohio 18 24,685 116,621 45,456 25,078 161,684 186,762 (59,046)
Dallas/Fort Worth, Texas Arlington Corporate Center 2 (d) 6,084 28,420 962 6,084 29,382 35,466 (5,912) 2012, 2015
Dallas Corporate Center 24 (d) 23,912 48,079 84,030 26,417 129,604 156,021 (41,745) 1996, 1997, 1998, 1999, 2001,2006, 2011, 2012, 2015, 2016
DFW Cargo Center 1 2 - 63,032 1,600 - 64,632 64,632 (16,496) 2011DFW Logistics Center 6 1 2,010 8,153 759 2,010 8,912 10,922 (691) 2015Flower Mound Distribution Center 1 (d) 5,157 20,991 4,825 5,157 25,816 30,973 (9,199) 2007Frankford Trade Center 5 (d) 7,618 31,304 2,390 7,618 33,694 41,312 (4,812) 1999, 2015
Freeport Distribution Center 10 (d) 10,890 63,497 16,616 10,844 80,159 91,003 (25,402) 1996, 1997, 1998, 2011, 2012,
2014Gold Spike Distribution Center 1 3,629 - 21,167 3,629 21,167 24,796 (798) 2015
Great Southwest Distribution Center 21 (d) 42,328 181,859 27,697 42,328 209,556 251,884 (75,063) 1995, 1996, 1997, 1999, 2000,
2005, 2012, 2015Heritage Business Park 9 (d) 20,153 93,145 31,467 20,142 124,623 144,765 (8,920) 2015Mesquite Distribution Center 1 3,692 15,473 930 3,692 16,403 20,095 (3,489) 2012Mountain Creek 2 13,181 - 63,365 13,217 63,329 76,546 (3,419) 2015, 2016Northgate Distribution Center 8 (d) 10,411 51,454 9,575 10,898 60,542 71,440 (24,736) 1999, 2005, 2008, 2012Park 121 Distribution Center 2 9,061 - 23,608 9,886 22,783 32,669 (692) 2016, 2017Pinnacle Park Distribution Center 1 2,396 7,839 2,852 2,396 10,691 13,087 (3,264) 2011Riverside Drive Distribution Center 1 5,107 14,919 98 5,107 15,017 20,124 (1,649) 2015Stemmons Industrial Center 9 1,925 12,070 7,913 1,926 19,982 21,908 (15,225) 1994, 1995, 1996, 1999Watersridge Distribution Center 1 1,939 11,365 103 1,939 11,468 13,407 (1,009) 2015Dallas/Fort Worth, Texas 101 169,493 651,600 299,957 173,290 947,760 1,121,050 (242,521)
94
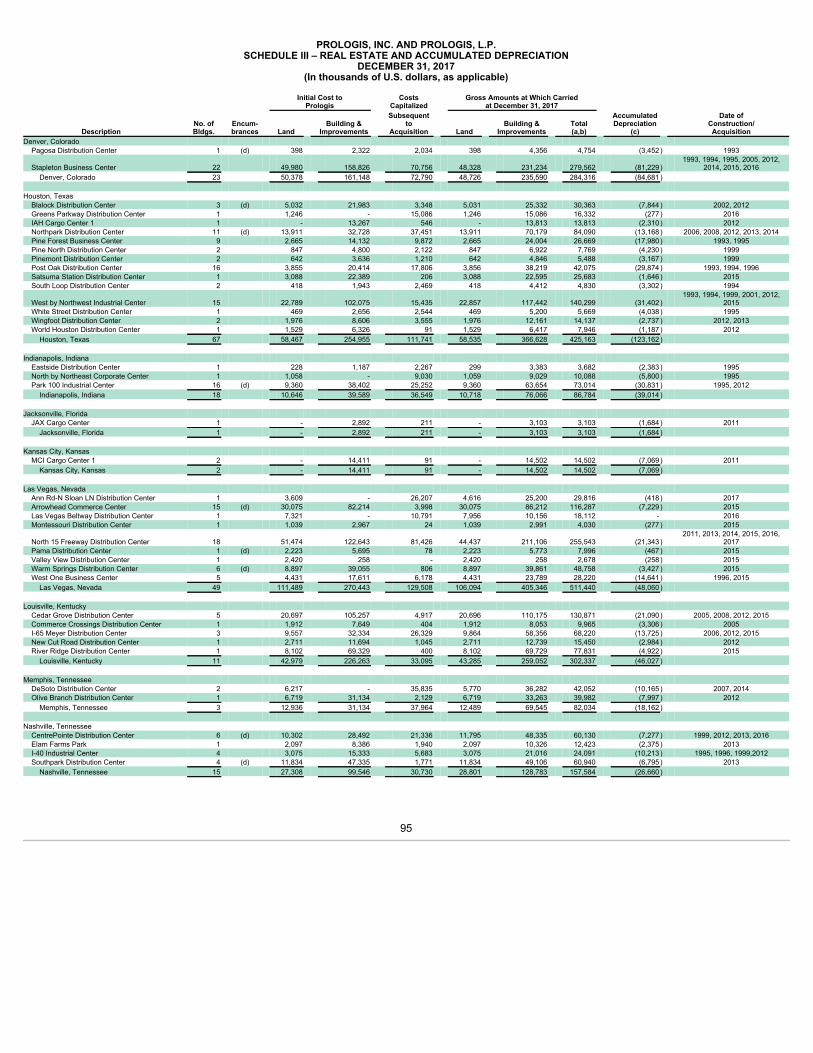
PROLOGIS, INC. AND PROLOGIS, L.P.
SCHEDULE III – REAL ESTATE AND ACCUMULATED DEPRECIATIONDECEMBER 31, 2017
(In thousands of U.S. dollars, as applicable)
Initial Cost to
Prologis Costs
Capitalized Gross Amounts at Which Carried
at December 31, 2017
Description No. ofBldgs.
Encum-brances Land
Building &Improvements
Subsequentto
Acquisition Land Building &
Improvements Total(a,b)
AccumulatedDepreciation
(c)
Date ofConstruction/Acquisition
Denver, Colorado Pagosa Distribution Center 1 (d) 398 2,322 2,034 398 4,356 4,754 (3,452) 1993
Stapleton Business Center 22 49,980 158,826 70,756 48,328 231,234 279,562 (81,229) 1993, 1994, 1995, 2005, 2012,
2014, 2015, 2016Denver, Colorado 23 50,378 161,148 72,790 48,726 235,590 284,316 (84,681)
Houston, Texas Blalock Distribution Center 3 (d) 5,032 21,983 3,348 5,031 25,332 30,363 (7,844) 2002, 2012Greens Parkway Distribution Center 1 1,246 - 15,086 1,246 15,086 16,332 (277) 2016IAH Cargo Center 1 1 - 13,267 546 - 13,813 13,813 (2,310) 2012Northpark Distribution Center 11 (d) 13,911 32,728 37,451 13,911 70,179 84,090 (13,168) 2006, 2008, 2012, 2013, 2014Pine Forest Business Center 9 2,665 14,132 9,872 2,665 24,004 26,669 (17,980) 1993, 1995Pine North Distribution Center 2 847 4,800 2,122 847 6,922 7,769 (4,230) 1999Pinemont Distribution Center 2 642 3,636 1,210 642 4,846 5,488 (3,167) 1999Post Oak Distribution Center 16 3,855 20,414 17,806 3,856 38,219 42,075 (29,874) 1993, 1994, 1996Satsuma Station Distribution Center 1 3,088 22,389 206 3,088 22,595 25,683 (1,646) 2015South Loop Distribution Center 2 418 1,943 2,469 418 4,412 4,830 (3,302) 1994
West by Northwest Industrial Center 15 22,789 102,075 15,435 22,857 117,442 140,299 (31,402) 1993, 1994, 1999, 2001, 2012,
2015White Street Distribution Center 1 469 2,656 2,544 469 5,200 5,669 (4,038) 1995Wingfoot Distribution Center 2 1,976 8,606 3,555 1,976 12,161 14,137 (2,737) 2012, 2013World Houston Distribution Center 1 1,529 6,326 91 1,529 6,417 7,946 (1,187) 2012Houston, Texas 67 58,467 254,955 111,741 58,535 366,628 425,163 (123,162)
Indianapolis, Indiana Eastside Distribution Center 1 228 1,187 2,267 299 3,383 3,682 (2,383) 1995North by Northeast Corporate Center 1 1,058 - 9,030 1,059 9,029 10,088 (5,800) 1995Park 100 Industrial Center 16 (d) 9,360 38,402 25,252 9,360 63,654 73,014 (30,831) 1995, 2012Indianapolis, Indiana 18 10,646 39,589 36,549 10,718 76,066 86,784 (39,014)
Jacksonville, Florida JAX Cargo Center 1 - 2,892 211 - 3,103 3,103 (1,684) 2011Jacksonville, Florida 1 - 2,892 211 - 3,103 3,103 (1,684)
Kansas City, Kansas MCI Cargo Center 1 2 - 14,411 91 - 14,502 14,502 (7,069) 2011Kansas City, Kansas 2 - 14,411 91 - 14,502 14,502 (7,069)
Las Vegas, Nevada Ann Rd-N Sloan LN Distribution Center 1 3,609 - 26,207 4,616 25,200 29,816 (418) 2017Arrowhead Commerce Center 15 (d) 30,075 82,214 3,998 30,075 86,212 116,287 (7,229) 2015Las Vegas Beltway Distribution Center 1 7,321 - 10,791 7,956 10,156 18,112 - 2016Montessouri Distribution Center 1 1,039 2,967 24 1,039 2,991 4,030 (277) 2015
North 15 Freeway Distribution Center 18 51,474 122,643 81,426 44,437 211,106 255,543 (21,343) 2011, 2013, 2014, 2015, 2016,
2017Pama Distribution Center 1 (d) 2,223 5,695 78 2,223 5,773 7,996 (467) 2015Valley View Distribution Center 1 2,420 258 - 2,420 258 2,678 (258) 2015Warm Springs Distribution Center 6 (d) 8,897 39,055 806 8,897 39,861 48,758 (3,427) 2015West One Business Center 5 4,431 17,611 6,178 4,431 23,789 28,220 (14,641) 1996, 2015Las Vegas, Nevada 49 111,489 270,443 129,508 106,094 405,346 511,440 (48,060)
Louisville, Kentucky Cedar Grove Distribution Center 5 20,697 105,257 4,917 20,696 110,175 130,871 (21,090) 2005, 2008, 2012, 2015Commerce Crossings Distribution Center 1 1,912 7,649 404 1,912 8,053 9,965 (3,306) 2005I-65 Meyer Distribution Center 3 9,557 32,334 26,329 9,864 58,356 68,220 (13,725) 2006, 2012, 2015New Cut Road Distribution Center 1 2,711 11,694 1,045 2,711 12,739 15,450 (2,984) 2012River Ridge Distribution Center 1 8,102 69,329 400 8,102 69,729 77,831 (4,922) 2015Louisville, Kentucky 11 42,979 226,263 33,095 43,285 259,052 302,337 (46,027)
Memphis, Tennessee DeSoto Distribution Center 2 6,217 - 35,835 5,770 36,282 42,052 (10,165) 2007, 2014Olive Branch Distribution Center 1 6,719 31,134 2,129 6,719 33,263 39,982 (7,997) 2012Memphis, Tennessee 3 12,936 31,134 37,964 12,489 69,545 82,034 (18,162)
Nashville, Tennessee CentrePointe Distribution Center 6 (d) 10,302 28,492 21,336 11,795 48,335 60,130 (7,277) 1999, 2012, 2013, 2016Elam Farms Park 1 2,097 8,386 1,940 2,097 10,326 12,423 (2,375) 2013I-40 Industrial Center 4 3,075 15,333 5,683 3,075 21,016 24,091 (10,213) 1995, 1996, 1999,2012Southpark Distribution Center 4 (d) 11,834 47,335 1,771 11,834 49,106 60,940 (6,795) 2013Nashville, Tennessee 15 27,308 99,546 30,730 28,801 128,783 157,584 (26,660)
95

PROLOGIS, INC. AN D PROLOGIS, L.P.
SCHEDULE III – REAL ESTATE AND ACCUMULATED DEPRECIATIONDECEMBER 31, 2017
(In thousands of U.S. dollars, as applicable)
Initial Cost to
Prologis Costs
Capitalized Gross Amounts at Which Carried
at December 31, 2017
Description No. ofBldgs.
Encum-brances Land
Building &Improvements
Subsequentto
Acquisition Land Building &
Improvements Total(a,b)
AccumulatedDepreciation
(c)
Date ofConstruction/Acquisition
New Jersey/New York Carteret Distribution Center 3 39,148 109,124 939 39,148 110,063 149,211 (10,093) 2015CenterPoint Distribution Center 2 7,227 20,899 3,337 7,227 24,236 31,463 (6,981) 2011, 2012Cranbury Business Park 6 (d) 25,712 97,351 12,767 25,712 110,118 135,830 (31,184) 2005, 2012Docks Corner SG (Phase II) 1 16,232 19,264 9,378 16,232 28,642 44,874 (11,955) 2011Edison Distribution Center 7 (d) 34,006 71,431 20,531 34,006 91,962 125,968 (23,497) 1996, 1997, 2015Exit 10 Distribution Center 9 (d) 85,713 171,031 51,732 89,747 218,729 308,476 (63,230) 2005, 2015, 2016Exit 7 Distribution Center 2 35,728 117,157 836 35,728 117,993 153,721 (8,269) 2015Interstate Distribution Center 3 30,188 76,705 1,029 30,188 77,734 107,922 (5,897) 2015JFK Cargo Center 75_77 2 - 35,916 5,881 - 41,797 41,797 (22,433) 2011Liberty Logistics Center 1 3,273 24,029 841 3,273 24,870 28,143 (4,425) 2011Linden Industrial 1 (d) 17,332 24,264 2,084 17,332 26,348 43,680 (1,682) 2015Lister Distribution Center 1 16,855 21,802 3,251 16,855 25,053 41,908 (1,413) 2015Maspeth Distribution Center 1 (d) 23,784 10,849 278 23,784 11,127 34,911 (668) 2015Meadowland Distribution Center 33 (d) 45,277 204,583 23,090 45,277 227,673 272,950 (78,690) 1998, 2005, 2010, 2011Meadowland Industrial Center 3 (d) 10,657 27,868 14,730 10,657 42,598 53,255 (17,618) 1996, 2011, 2015Meadowlands ALFII 1 1,790 8,778 1,937 1,790 10,715 12,505 (2,617) 2011Newwark Airport I and II 5 (d) 28,622 43,516 20,071 28,842 63,367 92,209 (9,810) 2011, 2012, 2015Perth Amboy Corporate Park 2 (d) 54,701 66,534 4,461 54,701 70,995 125,696 (4,687) 2015Port Reading Business Park 9 (d) 186,928 219,716 121,307 176,811 351,140 527,951 (34,659) 2005, 2014, 2015Ports Jersey City Distribution Center 1 34,133 - 61,025 34,435 60,723 95,158 (6,427) 2014Secaucus Distribution Center 2 (d) 9,603 - 26,930 9,603 26,930 36,533 (4,025) 2012Skyland Crossdock 1 - 9,831 1,318 - 11,149 11,149 (3,616) 2011South Jersey Distribution Center 1 6,912 17,437 216 6,912 17,653 24,565 (3,015) 2013Teterboro Meadowlands 15 2 18,169 34,604 226 18,169 34,830 52,999 (7,171) 2011, 2015New Jersey/New York 99 731,990 1,432,689 388,195 726,429 1,826,445 2,552,874 (364,062)
Orlando, Florida Beltway Commerce Center 4 18,835 25,526 15,384 18,840 40,905 59,745 (8,704) 2008, 2015Consulate Distribution Center 3 4,148 23,617 5,136 4,148 28,753 32,901 (16,531) 1999Crowne Pointe Park 1 3,888 7,497 1,846 3,888 9,343 13,231 (718) 2015Davenport Distribution Center 1 934 3,991 205 934 4,196 5,130 (928) 2012Orlando Airport Park 1 5,259 - 17,071 5,750 16,580 22,330 (458) 2016Orlando Central Park 14 12,327 58,861 11,502 12,327 70,363 82,690 (22,978) 1994, 2011, 2012Orlando, Florida 24 45,391 119,492 51,144 45,887 170,140 216,027 (50,317)
Phoenix, Arizona 24th Street Industrial Center 2 503 2,852 2,388 561 5,182 5,743 (3,940) 1994Alameda Distribution Center 3 5,145 19,451 4,232 5,145 23,683 28,828 (10,433) 2005Hohokam 10 Business Center 1 1,317 7,468 1,744 1,318 9,211 10,529 (5,745) 1999Kyrene Commons Distribution Center 3 1,093 5,475 3,110 1,093 8,585 9,678 (5,903) 1992, 1998, 1999Papago Distribution Center 3 4,828 20,017 5,613 4,829 25,629 30,458 (12,836) 1994, 2005Phoenix Distribution Center 1 1,441 5,578 1,215 1,441 6,793 8,234 (1,285) 2012Watkins Street Distribution Center 2 925 4,110 2,025 925 6,135 7,060 (3,022) 1995, 2005Riverside Distribution Center (PHX) 2 3,729 - 33,039 3,818 32,950 36,768 (175) 2017Sky Harbor Distribution Center 3 - 14,023 3,353 - 17,376 17,376 (878) 2016Phoenix, Arizona 20 18,981 78,974 56,719 19,130 135,544 154,674 (44,217)
Portland, Oregon Clackamas Distribution Center 1 (d) 1,540 6,420 841 1,540 7,261 8,801 (1,417) 2012PDX Cargo Center Airtrans 2 - 13,697 246 - 13,943 13,943 (5,059) 2011PDX Corporate Center North Phase II 1 (d)(e) 5,051 9,895 1,856 5,051 11,751 16,802 (3,450) 2008Portland Northwest Corporate Park 10 13,666 40,999 3,078 13,666 44,077 57,743 (3,942) 2015Southshore Corporate Center 2 (d) 5,941 13,915 11,156 4,604 26,408 31,012 (6,138) 2006, 2015Portland, Oregon 16 26,198 84,926 17,177 24,861 103,440 128,301 (20,006)
Reno, Nevada Damonte Ranch Distribution Center 2 7,056 29,742 1,144 7,056 30,886 37,942 (6,843) 2012Golden Valley Distribution Center 1 940 13,686 4,317 2,415 16,528 18,943 (6,450) 2005Reno Aircenter 1 544 12,292 1,726 544 14,018 14,562 (925) 2015RNO Cargo Center 10_11 2 - 4,265 430 - 4,695 4,695 (1,976) 2011Sage Point Business Park 1 1,705 6,821 457 1,705 7,278 8,983 (643) 2015Stead Distribution Center 1 (d) 1,046 19,330 1,036 1,046 20,366 21,412 (1,541) 2015Tahoe-Reno Industrial Center 3 6,705 30,381 60,239 6,704 90,621 97,325 (11,116) 2007, 2015Vista Industrial Park 6 (d) 5,923 26,807 12,576 5,923 39,383 45,306 (22,137) 1994, 2001Reno, Nevada 17 23,919 143,324 81,925 25,393 223,775 249,168 (51,631)
San Antonio, Texas Director Drive Distribution Center 2 1,271 5,455 389 1,271 5,844 7,115 (1,547) 2012Interchange East Distribution Center 2 3,670 6,535 15,424 3,892 21,737 25,629 (2,967) 2012, 2016
96
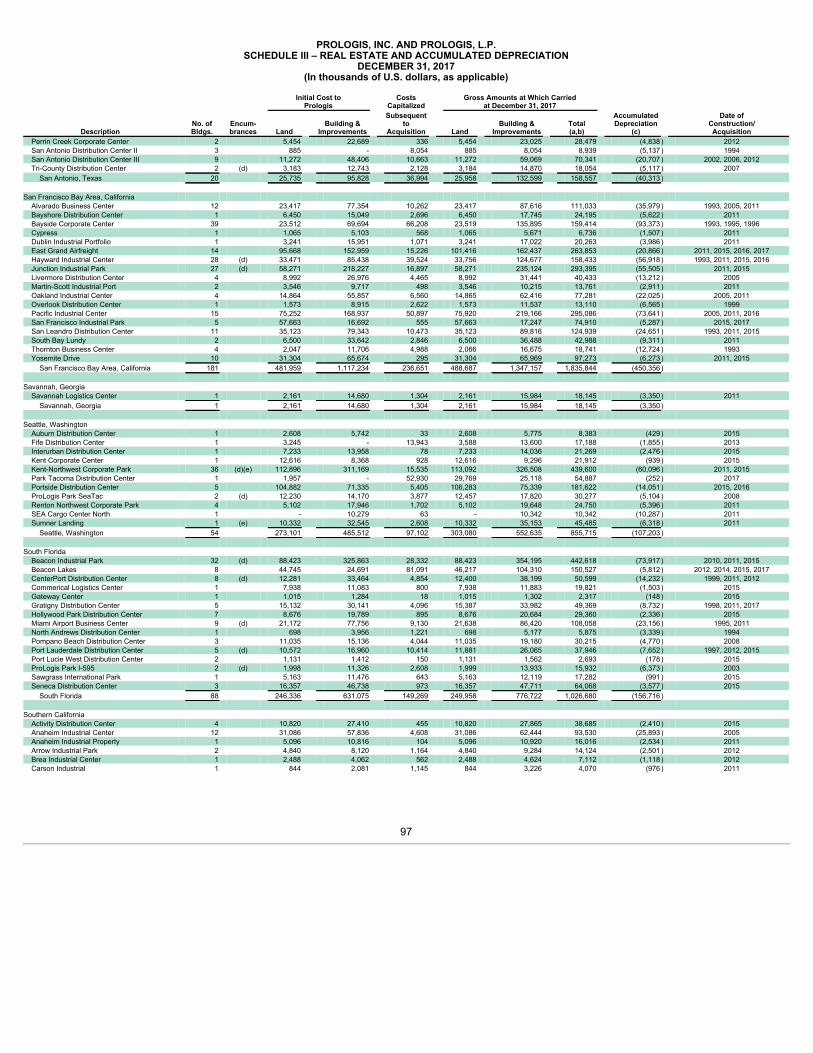
PROLOGIS, INC. AND PROLOGIS, L.P.
SCHEDULE III – REAL ESTATE AND ACCUMULATED DEPRECIATIONDECEMBER 31, 2017
(In thousands of U.S. dollars, as applicable)
Initial Cost to
Prologis Costs
Capitalized Gross Amounts at Which Carried
at December 31, 2017
Description No. ofBldgs.
Encum-brances Land
Building &Improvements
Subsequentto
Acquisition Land Building &
Improvements Total(a,b)
AccumulatedDepreciation
(c)
Date ofConstruction/Acquisition
Perrin Creek Corporate Center 2 5,454 22,689 336 5,454 23,025 28,479 (4,838) 2012San Antonio Distribution Center II 3 885 - 8,054 885 8,054 8,939 (5,137) 1994San Antonio Distribution Center III 9 11,272 48,406 10,663 11,272 59,069 70,341 (20,707) 2002, 2006, 2012Tri-County Distribution Center 2 (d) 3,183 12,743 2,128 3,184 14,870 18,054 (5,117) 2007San Antonio, Texas 20 25,735 95,828 36,994 25,958 132,599 158,557 (40,313)
San Francisco Bay Area, California Alvarado Business Center 12 23,417 77,354 10,262 23,417 87,616 111,033 (35,979) 1993, 2005, 2011Bayshore Distribution Center 1 6,450 15,049 2,696 6,450 17,745 24,195 (5,622) 2011Bayside Corporate Center 39 23,512 69,694 66,208 23,519 135,895 159,414 (93,373) 1993, 1995, 1996Cypress 1 1,065 5,103 568 1,065 5,671 6,736 (1,507) 2011Dublin Industrial Portfolio 1 3,241 15,951 1,071 3,241 17,022 20,263 (3,986) 2011East Grand Airfreight 14 95,668 152,959 15,226 101,416 162,437 263,853 (20,866) 2011, 2015, 2016, 2017Hayward Industrial Center 28 (d) 33,471 85,438 39,524 33,756 124,677 158,433 (56,918) 1993, 2011, 2015, 2016Junction Industrial Park 27 (d) 58,271 218,227 16,897 58,271 235,124 293,395 (55,505) 2011, 2015Livermore Distribution Center 4 8,992 26,976 4,465 8,992 31,441 40,433 (13,212) 2005Martin-Scott Industrial Port 2 3,546 9,717 498 3,546 10,215 13,761 (2,911) 2011Oakland Industrial Center 4 14,864 55,857 6,560 14,865 62,416 77,281 (22,025) 2005, 2011Overlook Distribution Center 1 1,573 8,915 2,622 1,573 11,537 13,110 (6,565) 1999Pacific Industrial Center 15 75,252 168,937 50,897 75,920 219,166 295,086 (73,641) 2005, 2011, 2016San Francisco Industrial Park 5 57,663 16,692 555 57,663 17,247 74,910 (5,287) 2015, 2017San Leandro Distribution Center 11 35,123 79,343 10,473 35,123 89,816 124,939 (24,651) 1993, 2011, 2015South Bay Lundy 2 6,500 33,642 2,846 6,500 36,488 42,988 (9,311) 2011Thornton Business Center 4 2,047 11,706 4,988 2,066 16,675 18,741 (12,724) 1993Yosemite Drive 10 31,304 65,674 295 31,304 65,969 97,273 (6,273) 2011, 2015San Francisco Bay Area, California 181 481,959 1,117,234 236,651 488,687 1,347,157 1,835,844 (450,356)
Savannah, Georgia Savannah Logistics Center 1 2,161 14,680 1,304 2,161 15,984 18,145 (3,350) 2011Savannah, Georgia 1 2,161 14,680 1,304 2,161 15,984 18,145 (3,350)
Seattle, Washington Auburn Distribution Center 1 2,608 5,742 33 2,608 5,775 8,383 (429) 2015Fife Distribution Center 1 3,245 - 13,943 3,588 13,600 17,188 (1,855) 2013Interurban Distribution Center 1 7,233 13,958 78 7,233 14,036 21,269 (2,476) 2015Kent Corporate Center 1 12,616 8,368 928 12,616 9,296 21,912 (939) 2015Kent-Northwest Corporate Park 36 (d)(e) 112,896 311,169 15,535 113,092 326,508 439,600 (60,096) 2011, 2015Park Tacoma Distribution Center 1 1,957 - 52,930 29,769 25,118 54,887 (252) 2017Portside Distribution Center 5 104,882 71,335 5,405 106,283 75,339 181,622 (14,051) 2015, 2016ProLogis Park SeaTac 2 (d) 12,230 14,170 3,877 12,457 17,820 30,277 (5,104) 2008Renton Northwest Corporate Park 4 5,102 17,946 1,702 5,102 19,648 24,750 (5,396) 2011SEA Cargo Center North 1 - 10,279 63 - 10,342 10,342 (10,287) 2011Sumner Landing 1 (e) 10,332 32,545 2,608 10,332 35,153 45,485 (6,318) 2011Seattle, Washington 54 273,101 485,512 97,102 303,080 552,635 855,715 (107,203)
South Florida Beacon Industrial Park 32 (d) 88,423 325,863 28,332 88,423 354,195 442,618 (73,917) 2010, 2011, 2015Beacon Lakes 8 44,745 24,691 81,091 46,217 104,310 150,527 (5,812) 2012, 2014, 2015, 2017CenterPort Distribution Center 8 (d) 12,281 33,464 4,854 12,400 38,199 50,599 (14,232) 1999, 2011, 2012Commerical Logistics Center 1 7,938 11,083 800 7,938 11,883 19,821 (1,503) 2015Gateway Center 1 1,015 1,284 18 1,015 1,302 2,317 (148) 2015Gratigny Distribution Center 5 15,132 30,141 4,096 15,387 33,982 49,369 (8,732) 1998, 2011, 2017Hollywood Park Distribution Center 7 8,676 19,789 895 8,676 20,684 29,360 (2,336) 2015Miami Airport Business Center 9 (d) 21,172 77,756 9,130 21,638 86,420 108,058 (23,156) 1995, 2011North Andrews Distribution Center 1 698 3,956 1,221 698 5,177 5,875 (3,339) 1994Pompano Beach Distribution Center 3 11,035 15,136 4,044 11,035 19,180 30,215 (4,770) 2008Port Lauderdale Distribution Center 5 (d) 10,572 16,960 10,414 11,881 26,065 37,946 (7,652) 1997, 2012, 2015Port Lucie West Distribution Center 2 1,131 1,412 150 1,131 1,562 2,693 (178) 2015ProLogis Park I-595 2 (d) 1,998 11,326 2,608 1,999 13,933 15,932 (6,373) 2003Sawgrass International Park 1 5,163 11,476 643 5,163 12,119 17,282 (991) 2015Seneca Distribution Center 3 16,357 46,738 973 16,357 47,711 64,068 (3,577) 2015South Florida 88 246,336 631,075 149,269 249,958 776,722 1,026,680 (156,716)
Southern California Activity Distribution Center 4 10,820 27,410 455 10,820 27,865 38,685 (2,410) 2015Anaheim Industrial Center 12 31,086 57,836 4,608 31,086 62,444 93,530 (25,893) 2005Anaheim Industrial Property 1 5,096 10,816 104 5,096 10,920 16,016 (2,534) 2011Arrow Industrial Park 2 4,840 8,120 1,164 4,840 9,284 14,124 (2,501) 2012Brea Industrial Center 1 2,488 4,062 562 2,488 4,624 7,112 (1,118) 2012Carson Industrial 1 844 2,081 1,145 844 3,226 4,070 (976) 2011
97
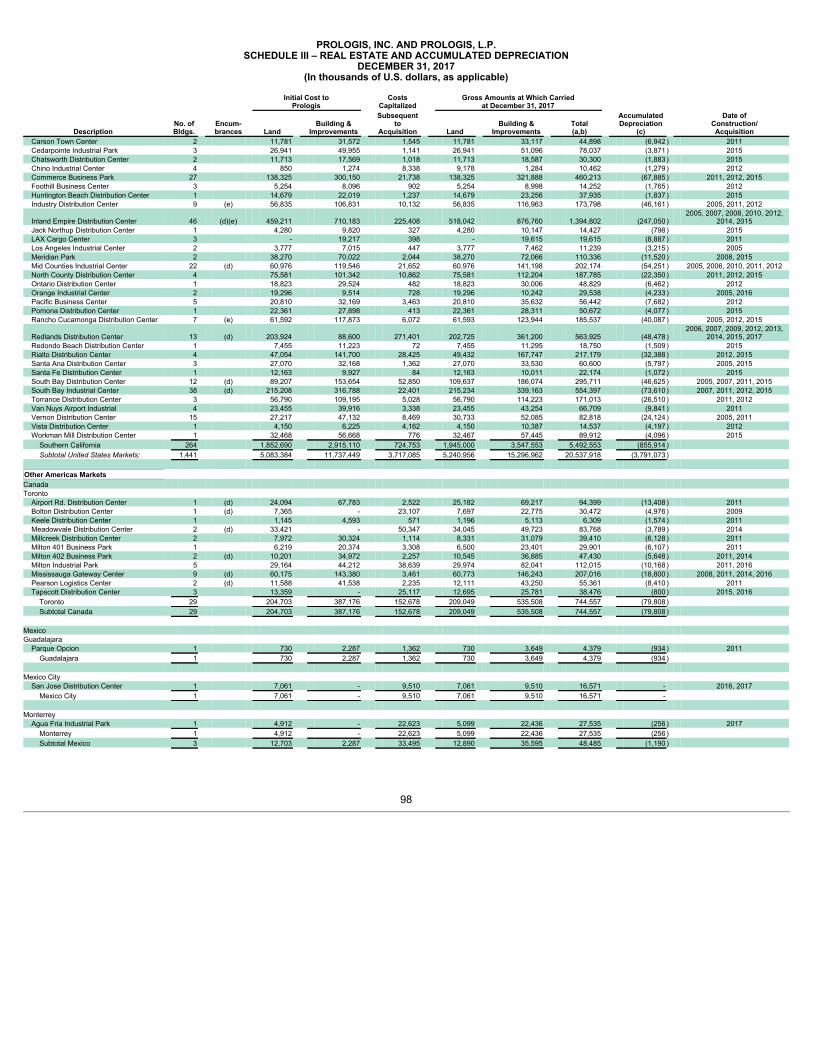
PROLOGIS, INC. AND PROLOGIS, L.P.
SCHEDULE III – REAL ESTATE AND ACCUMULATED DEPRECIATIONDECEMBER 31, 2017
(In thousands of U.S. dollars, as applicable)
Initial Cost to
Prologis Costs
Capitalized Gross Amounts at Which Carried
at December 31, 2017
Description No. ofBldgs.
Encum-brances Land
Building &Improvements
Subsequentto
Acquisition Land Building &
Improvements Total(a,b)
AccumulatedDepreciation
(c)
Date ofConstruction/Acquisition
Carson Town Center 2 11,781 31,572 1,545 11,781 33,117 44,898 (6,942) 2011Cedarpointe Industrial Park 3 26,941 49,955 1,141 26,941 51,096 78,037 (3,871) 2015Chatsworth Distribution Center 2 11,713 17,569 1,018 11,713 18,587 30,300 (1,883) 2015Chino Industrial Center 4 850 1,274 8,338 9,178 1,284 10,462 (1,279) 2012Commerce Business Park 27 138,325 300,150 21,738 138,325 321,888 460,213 (67,885) 2011, 2012, 2015Foothill Business Center 3 5,254 8,096 902 5,254 8,998 14,252 (1,765) 2012Huntington Beach Distribution Center 1 14,679 22,019 1,237 14,679 23,256 37,935 (1,837) 2015Industry Distribution Center 9 (e) 56,835 106,831 10,132 56,835 116,963 173,798 (46,161) 2005, 2011, 2012
Inland Empire Distribution Center 46 (d)(e) 459,211 710,183 225,408 518,042 876,760 1,394,802 (247,050) 2005, 2007, 2008, 2010, 2012,
2014, 2015Jack Northup Distribution Center 1 4,280 9,820 327 4,280 10,147 14,427 (798) 2015LAX Cargo Center 3 - 19,217 398 - 19,615 19,615 (8,887) 2011Los Angeles Industrial Center 2 3,777 7,015 447 3,777 7,462 11,239 (3,215) 2005Meridian Park 2 38,270 70,022 2,044 38,270 72,066 110,336 (11,520) 2008, 2015Mid Counties Industrial Center 22 (d) 60,976 119,546 21,652 60,976 141,198 202,174 (54,251) 2005, 2006, 2010, 2011, 2012North County Distribution Center 4 75,581 101,342 10,862 75,581 112,204 187,785 (22,350) 2011, 2012, 2015Ontario Distribution Center 1 18,823 29,524 482 18,823 30,006 48,829 (6,462) 2012Orange Industrial Center 2 19,296 9,514 728 19,296 10,242 29,538 (4,233) 2005, 2016Pacific Business Center 5 20,810 32,169 3,463 20,810 35,632 56,442 (7,682) 2012Pomona Distribution Center 1 22,361 27,898 413 22,361 28,311 50,672 (4,077) 2015Rancho Cucamonga Distribution Center 7 (e) 61,592 117,873 6,072 61,593 123,944 185,537 (40,087) 2005, 2012, 2015
Redlands Distribution Center 13 (d) 203,924 88,600 271,401 202,725 361,200 563,925 (48,478) 2006, 2007, 2009, 2012, 2013,
2014, 2015, 2017Redondo Beach Distribution Center 1 7,455 11,223 72 7,455 11,295 18,750 (1,509) 2015Rialto Distribution Center 4 47,054 141,700 28,425 49,432 167,747 217,179 (32,388) 2012, 2015Santa Ana Distribution Center 3 27,070 32,168 1,362 27,070 33,530 60,600 (5,797) 2005, 2015Santa Fe Distribution Center 1 12,163 9,927 84 12,163 10,011 22,174 (1,072) 2015South Bay Distribution Center 12 (d) 89,207 153,654 52,850 109,637 186,074 295,711 (46,625) 2005, 2007, 2011, 2015South Bay Industrial Center 38 (d) 215,208 316,788 22,401 215,234 339,163 554,397 (73,610) 2007, 2011, 2012, 2015Torrance Distribution Center 3 56,790 109,195 5,028 56,790 114,223 171,013 (26,510) 2011, 2012Van Nuys Airport Industrial 4 23,455 39,916 3,338 23,455 43,254 66,709 (9,841) 2011Vernon Distribution Center 15 27,217 47,132 8,469 30,733 52,085 82,818 (24,124) 2005, 2011Vista Distribution Center 1 4,150 6,225 4,162 4,150 10,387 14,537 (4,197) 2012Workman Mill Distribution Center 1 32,468 56,668 776 32,467 57,445 89,912 (4,096) 2015Southern California 264 1,852,690 2,915,110 724,753 1,945,000 3,547,553 5,492,553 (855,914) Subtotal United States Markets: 1,441 5,083,384 11,737,449 3,717,085 5,240,956 15,296,962 20,537,918 (3,791,073 )
Other Americas Markets Canada Toronto Airport Rd. Distribution Center 1 (d) 24,094 67,783 2,522 25,182 69,217 94,399 (13,408) 2011Bolton Distribution Center 1 (d) 7,365 - 23,107 7,697 22,775 30,472 (4,976) 2009Keele Distribution Center 1 1,145 4,593 571 1,196 5,113 6,309 (1,574) 2011Meadowvale Distribution Center 2 (d) 33,421 - 50,347 34,045 49,723 83,768 (3,789) 2014Millcreek Distribution Center 2 7,972 30,324 1,114 8,331 31,079 39,410 (6,128) 2011Milton 401 Business Park 1 6,219 20,374 3,308 6,500 23,401 29,901 (6,107) 2011Milton 402 Business Park 2 (d) 10,201 34,972 2,257 10,545 36,885 47,430 (5,648) 2011, 2014Milton Industrial Park 5 29,164 44,212 38,639 29,974 82,041 112,015 (10,168) 2011, 2016Mississauga Gateway Center 9 (d) 60,175 143,380 3,461 60,773 146,243 207,016 (18,800) 2008, 2011, 2014, 2016Pearson Logistics Center 2 (d) 11,588 41,538 2,235 12,111 43,250 55,361 (8,410) 2011Tapscott Distribution Center 3 13,359 - 25,117 12,695 25,781 38,476 (800) 2015, 2016Toronto 29 204,703 387,176 152,678 209,049 535,508 744,557 (79,808) Subtotal Canada 29 204,703 387,176 152,678 209,049 535,508 744,557 (79,808)
Mexico Guadalajara Parque Opcion 1 730 2,287 1,362 730 3,649 4,379 (934) 2011Guadalajara 1 730 2,287 1,362 730 3,649 4,379 (934)
Mexico City San Jose Distribution Center 1 7,061 - 9,510 7,061 9,510 16,571 - 2016, 2017Mexico City 1 7,061 - 9,510 7,061 9,510 16,571 -
Monterrey Agua Fria Industrial Park 1 4,912 - 22,623 5,099 22,436 27,535 (256) 2017Monterrey 1 4,912 - 22,623 5,099 22,436 27,535 (256) Subtotal Mexico 3 12,703 2,287 33,495 12,890 35,595 48,485 (1,190)
98

P ROLOGIS, INC. AND PROLOGIS, L.P.
SCHEDULE III – REAL ESTATE AND ACCUMULATED DEPRECIATIONDECEMBER 31, 2017
(In thousands of U.S. dollars, as applicable)
Initial Cost to
Prologis Costs
Capitalized Gross Amounts at Which Carried
at December 31, 2017
Description No. ofBldgs.
Encum-brances Land
Building &Improvements
Subsequentto
Acquisition Land Building &
Improvements Total(a,b)
AccumulatedDepreciation
(c)
Date ofConstruction/Acquisition
Brazil Sao Paulo Cajamar II 6 85,382 173,351 23,780 85,382 197,131 282,513 (1,833) 2017Castelo Distribution Center 3 36,034 73,161 11,371 36,034 84,532 120,566 (519) 2017Dutra Industrial Park 2 12,288 24,948 3,666 12,288 28,614 40,902 (265) 2017Sao Paulo 11 133,704 271,460 38,817 133,704 310,277 443,981 (2,617)
Rio De Janeiro Caxias Industrial Park 2 13,185 35,648 3,873 13,185 39,521 52,706 (367) 2017Rio Guandu 1 4,881 13,198 2,229 4,881 15,427 20,308 (144) 2017Rio De Janeiro 3 18,066 48,846 6,102 18,066 54,948 73,014 (511) Subtotal Brazil 14 151,770 320,306 44,919 151,770 365,225 516,995 (3,128) Subtotal Other Americas Markets: 46 369,176 709,769 231,092 373,709 936,328 1,310,037 (84,126)
Europe Markets France Bonneuil Distribution Center 1 - - 13,645 - 13,645 13,645 (1,819) 2012Le Havre Distribution Center 1 705 - 8,621 836 8,490 9,326 (417) 2016LGR Genevill. 1 SAS 1 2,209 2,398 853 2,209 3,251 5,460 (589) 2011LGR Genevill. 2 SAS 1 1,699 3,521 51 1,699 3,572 5,271 (639) 2011Moissy II Distribution Center 1 5,427 4,044 441 5,433 4,479 9,912 (4,039) 2014France 5 10,040 9,963 23,611 10,177 33,437 43,614 (7,503)
Germany Hausbruch Industrial Center 4-B 2 11,143 5,784 633 11,143 6,417 17,560 (3,060) 2011Lauenau Distribution Center 1 2,750 6,121 374 2,750 6,495 9,245 (1,512) 2011Germany 3 13,893 11,905 1,007 13,893 12,912 26,805 (4,572)
Hungary Hegyeshalom Distribution Center 1 279 - 3,377 - 3,656 3,656 - 2015Hungary 1 279 - 3,377 - 3,656 3,656 -
Poland Chorzow Distribution Center 1 4,191 - 8,669 4,193 8,667 12,860 (52 ) 2016Nadarzyn Distribution Center 1 2,480 - 8,070 2,550 8,000 10,550 (1,967) 2009Piotrkow II Distribution Center 1 1,613 - 5,566 1,588 5,591 7,179 (1,538) 2009, 2017Szczecin Distribution Center 2 1,052 - 15,069 1,077 15,044 16,121 (365) 2014, 2015Poland 5 9,336 - 37,374 9,408 37,302 46,710 (3,922)
Spain Barajas MAD Logistics 4 - 38,797 1,485 - 40,282 40,282 (10,680) 2011Spain 4 - 38,797 1,485 - 40,282 40,282 (10,680)
Sweden Orebro Distribution Center 1 9,942 21,736 2,541 9,942 24,277 34,219 (8,481) 2011Sweden 1 9,942 21,736 2,541 9,942 24,277 34,219 (8,481)
United Kingdom Birmingham International Gateway Distribution Center 2 2,746 - 2,025 2,851 1,920 4,771 - 2016United Kingdom 2 2,746 - 2,025 2,851 1,920 4,771 - Subtotal Europe Markets: 21 46,236 82,401 71,420 46,271 153,786 200,057 (35,158)
Asia Markets China Fengxian Logistics Center 3 - 12,898 1,142 - 14,039 14,039 (6,451) 2011Jiaxing Distribution Center 4 10,726 10,399 11,629 8,865 23,889 32,754 (3,576) 2011, 2013Tianjim Bonded Logistics Park 2 1,465 8,882 35 1,298 9,084 10,382 (1,907) 2011China 9 12,191 32,179 12,806 10,163 47,012 57,175 (11,934)
Japan Chiba New Town Distribution Center 1 32,659 - 139,888 32,659 139,888 172,547 (2,364) 2016Narita 1 1 9,848 - 24,706 9,848 24,706 34,554 (1,393) 2015Yoshimi Distribution Center 1 22,342 - 111,141 22,372 111,111 133,483 (3,678) 2015Japan 3 64,849 - 275,735 64,879 275,705 340,584 (7,435)
99

PROLOGIS, INC. AND PROLOGIS, L.P.
SCHEDULE III – REAL ESTATE AND ACCUMULATED DEPRECIATIONDECEMBER 31, 2017
(In thousands of U.S. dollars, as applicable)
Initial Cost toPrologis
CostsCapitalized
Gross Amounts at Which Carriedat December 31, 2017
Description No. ofBldgs.
Encum-brances Land
Building &Improvements
Subsequentto
Acquisition Land Building &
Improvements Total(a,b)
AccumulatedDepreciation
(c)
Date ofConstruction/Acquisition
Singapore Changi South Distribution Center 1 1 - 41,518 112 - 41,630 41,630 (11,138) 2011Changi-North Distribution Center 1 1 - 15,442 222 - 15,664 15,664 (4,082) 2011Singapore Airport Logistics Center 2 - 62,367 452 - 62,819 62,819 (18,305) 2011Tuas Distribution Center 1 - 18,738 705 - 19,443 19,443 (8,250) 2011Singapore 5 - 138,065 1,491 - 139,556 139,556 (41,775) Subtotal Asia Markets: 17 77,040 170,244 290,032 75,042 462,273 537,315 (61,144)
Total Operating Properties 1,525 5,575,836 12,699,863 4,309,628 5,735,978 16,849,349 22,585,327 (3,971,501 )
Development Portfolio
United States Markets Atlanta, Georgia Augusta Distribution Center 1 3,037 - - 3,037 - 3,037 Atlanta, Georgia 1 3,037 - - 3,037 - 3,037
Central Valley, California International Park of Commerce 3 10,226 - 43,902 10,226 43,902 54,128 Mustang International 1 613 - 15,373 613 15,373 15,986 2017Patterson Pass Business Center 2 5,522 - 19,377 5,522 19,377 24,899 Central Valley, California 6 16,361 - 78,652 16,361 78,652 95,013
Chicago, Illinois Bolingbrook Distribution Center 1 2,242 - 4,933 2,242 4,933 7,175 Woodridge Distribution Center 1 9,475 - 5,092 9,475 5,092 14,567 Chicago, Illinois 2 11,717 - 10,025 11,717 10,025 21,742
Dallas/Fort Worth, Texas Interchange Distribution Center 1 9,587 - 32,195 9,587 32,195 41,782 Park 121 Distribution Center 3 9,761 - 16,800 9,761 16,800 26,561 2017ST Micro Distribution Center 2 9,065 - 11,053 9,065 11,053 20,118 2017Dallas/Fort Worth, Texas 6 28,413 - 60,048 28,413 60,048 88,461
Denver, Colorado Park Central Distribution Center 3 14,329 - 533 14,329 533 14,862 Denver, Colorado 3 14,329 - 533 14,329 533 14,862
Las Vegas, Nevada Ann Rd-N Sloan LN Distribution Center 1 6,523 - 26,687 6,523 26,687 33,210 2017Las Vegas Corporate Center 2 4,783 - 10,018 4,783 10,018 14,801 Warm Springs Distribution Center 4 6,553 - 127 6,553 127 6,680 Las Vegas, Nevada 7 17,859 - 36,832 17,859 36,832 54,691
Memphis, Tennessee DeSoto Distribution Center 1 4,304 - 29,614 4,304 29,614 33,918 2017Memphis, Tennessee 1 4,304 - 29,614 4,304 29,614 33,918
New Jersey Cranbury Business Park 1 25,693 - 15,254 25,693 15,254 40,947 Elizabeth Seaport 1 17,154 - 15,569 17,154 15,569 32,723 2017Tri-Port Distribution Center 1 39,827 - 9,874 39,827 9,874 49,701 New Jersey 3 82,674 - 40,697 82,674 40,697 123,371
Reno, Nevada Sage Point Business Park 1 869 - 11,274 869 11,274 12,143 2017Reno, Nevada 1 869 - 11,274 869 11,274 12,143
San Francisco Bay Area, California Oakland Logistics Park 1 992 - 24,354 992 24,354 25,346 2017San Francisco Bay Area, California 1 992 - 24,354 992 24,354 25,346
Seattle, Washington Park Tacoma Distribution Center 2 10,000 - 16,185 10,000 16,185 26,185 2017Portside Distribution Center 1 29,881 - 82,214 29,881 82,214 112,095 Seattle, Washington 3 39,881 - 98,399 39,881 98,399 138,280
South Florida Beacon Lakes 3 15,902 - 7,808 15,902 7,808 23,710 South Florida 3 15,902 - 7,808 15,902 7,808 23,710
100

PROLOGIS, INC. AND PROLOGIS, L.P.
SCHEDULE III – REAL ESTATE AND ACCUMULATED DEPRECIATIONDECEMBER 31, 2017
(In thousands of U.S. dollars, as applicable)
Initial Cost to
Prologis Costs
Capitalized Gross Amounts at Which Carried
at December 31, 2017
Description No. ofBldgs.
Encum-brances Land
Building &Improvements
Subsequentto
Acquisition Land Building &
Improvements Total(a,b)
AccumulatedDepreciation
(c)
Date ofConstruction/Acquisition
Southern California Meridian Park 1 17,709 - 21,497 17,709 21,497 39,206 2017Moreno Valley 4 12,841 - 2,588 12,841 2,588 15,429 Southern California 5 30,550 - 24,085 30,550 24,085 54,635 Subtotal United States Markets: 42 266,888 - 422,321 266,888 422,321 689,209
Other Americas Markets Canada Meadowvale Distribution Center 1 7,402 - 9,478 7,402 9,478 16,880 Canada 1 7,402 - 9,478 7,402 9,478 16,880
Mexico Centro Industrial Center 1 1,601 - 3,692 1,601 3,692 5,293 Monterrey Airport 1 2,686 - 6,783 2,686 6,783 9,469 2017San Jose Distribution Center 4 59,230 - 25,310 59,230 25,310 84,540 2017Mexico 6 63,517 - 35,785 63,517 35,785 99,302 Subtotal Other Americas Market: 7 70,919 - 45,263 70,919 45,263 116,182
Europe Markets Czech Republic Prague Airport Distribution Center 1 3,137 - 6,338 3,137 6,338 9,475 2017Prague Rudna Distribution Center 1 5,464 - 6,208 5,464 6,208 11,672 Uzice Distribution Center 1 2,821 - 184 2,821 184 3,005 Czech Republic 3 11,422 - 12,730 11,422 12,730 24,152
France Le Havre Distribution Center 1 1,001 - 12,337 1,001 12,337 13,338 2017Marly Distribution Center 1 5,084 - 9,292 5,084 9,292 14,376 Moissy II Distribution Center 1 11,554 - 12,966 11,554 12,966 24,520 France 3 17,639 - 34,595 17,639 34,595 52,234
Germany Kerpen 1 6,963 - 17,286 6,963 17,286 24,249 Unna Distribution Center 1 8,706 - 21,092 8,706 21,092 29,798 2017Germany 2 15,669 - 38,378 15,669 38,378 54,047
Italy Bologna Distribution Center 3 15,349 - 14,876 15,349 14,876 30,225 Padua Distribution Center 1 649 - 276 649 276 925 Pozzuolo Distribution Center 1 8,328 - 12,549 8,328 12,549 20,877 Italy 5 24,326 - 27,701 24,326 27,701 52,027
Netherlands Oosterhout Distribution Center 1 13,961 - 19,220 13,961 19,220 33,181 2017Tilburg Distribution Center 1 6,004 - 9,819 6,004 9,819 15,823 Venlo Distribution Center 1 6,117 - 10,145 6,117 10,145 16,262 Netherlands 3 26,082 - 39,184 26,082 39,184 65,266
Poland Szczecin Distribution Center 1 374 - 3,341 374 3,341 3,715 2017Poland 1 374 - 3,341 374 3,341 3,715
Slovakia Bratislava Distribution Center 1 1,052 - - 1,052 - 1,052 Nitra Distribution Center 2 3,410 - 11,377 3,410 11,377 14,787 ProLogis Park Nove Mesto 1 2,013 - 8,077 2,013 8,077 10,090 2017Slovakia 4 6,475 - 19,454 6,475 19,454 25,929
Spain Massalaves Distribution Center 1 5,513 - 2,976 5,513 2,976 8,489 Penedes Distribution Center 2 13,657 - 13,032 13,657 13,032 26,689 2017San Fernando Distribution Center 1 7,224 - 9,190 7,224 9,190 16,414 2017Spain 4 26,394 - 25,198 26,394 25,198 51,592
Sweden Gothenburg Distribution Center 1 9,864 - 16,273 9,864 16,273 26,137 2017Sweden 1 9,864 - 16,273 9,864 16,273 26,137
101
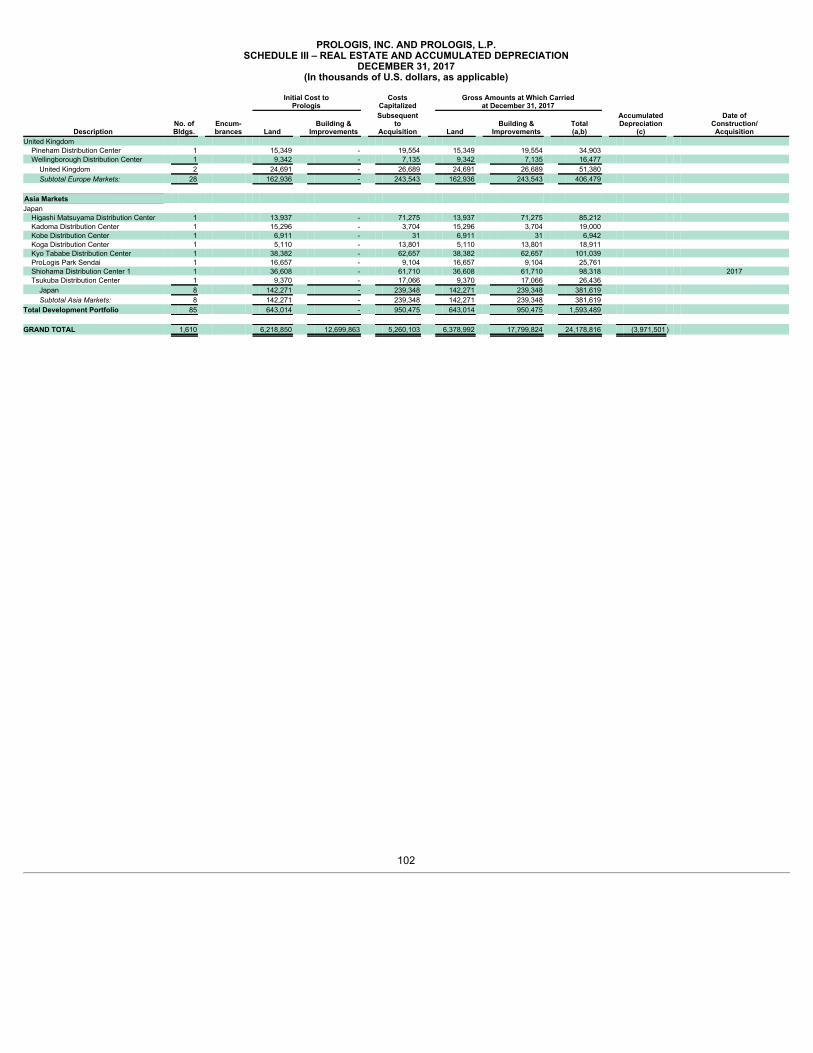
PROLOGIS, INC. AND PROLOGIS, L.P.
SCHEDULE III – REAL ESTATE AND ACCUMULATED DEPRECIATIONDECEMBER 31, 2017
(In thousands of U.S. dollars, as applicable)
Initial Cost to
Prologis Costs
Capitalized Gross Amounts at Which Carried
at December 31, 2017
Description No. ofBldgs.
Encum-brances Land
Building &Improvements
Subsequentto
Acquisition Land Building &
Improvements Total(a,b)
AccumulatedDepreciation
(c)
Date ofConstruction/Acquisition
United Kingdom Pineham Distribution Center 1 15,349 - 19,554 15,349 19,554 34,903 Wellingborough Distribution Center 1 9,342 - 7,135 9,342 7,135 16,477 United Kingdom 2 24,691 - 26,689 24,691 26,689 51,380 Subtotal Europe Markets: 28 162,936 - 243,543 162,936 243,543 406,479
Asia Markets Japan Higashi Matsuyama Distribution Center 1 13,937 - 71,275 13,937 71,275 85,212 Kadoma Distribution Center 1 15,296 - 3,704 15,296 3,704 19,000 Kobe Distribution Center 1 6,911 - 31 6,911 31 6,942 Koga Distribution Center 1 5,110 - 13,801 5,110 13,801 18,911 Kyo Tababe Distribution Center 1 38,382 - 62,657 38,382 62,657 101,039 ProLogis Park Sendai 1 16,657 - 9,104 16,657 9,104 25,761 Shiohama Distribution Center 1 1 36,608 - 61,710 36,608 61,710 98,318 2017Tsukuba Distribution Center 1 9,370 - 17,066 9,370 17,066 26,436 Japan 8 142,271 - 239,348 142,271 239,348 381,619 Subtotal Asia Markets: 8 142,271 - 239,348 142,271 239,348 381,619
Total Development Portfolio 85 643,014 - 950,475 643,014 950,475 1,593,489
GRAND TOTAL 1,610 6,218,850 12,699,863 5,260,103 6,378,992 17,799,824 24,178,816 (3,971,501 )
102
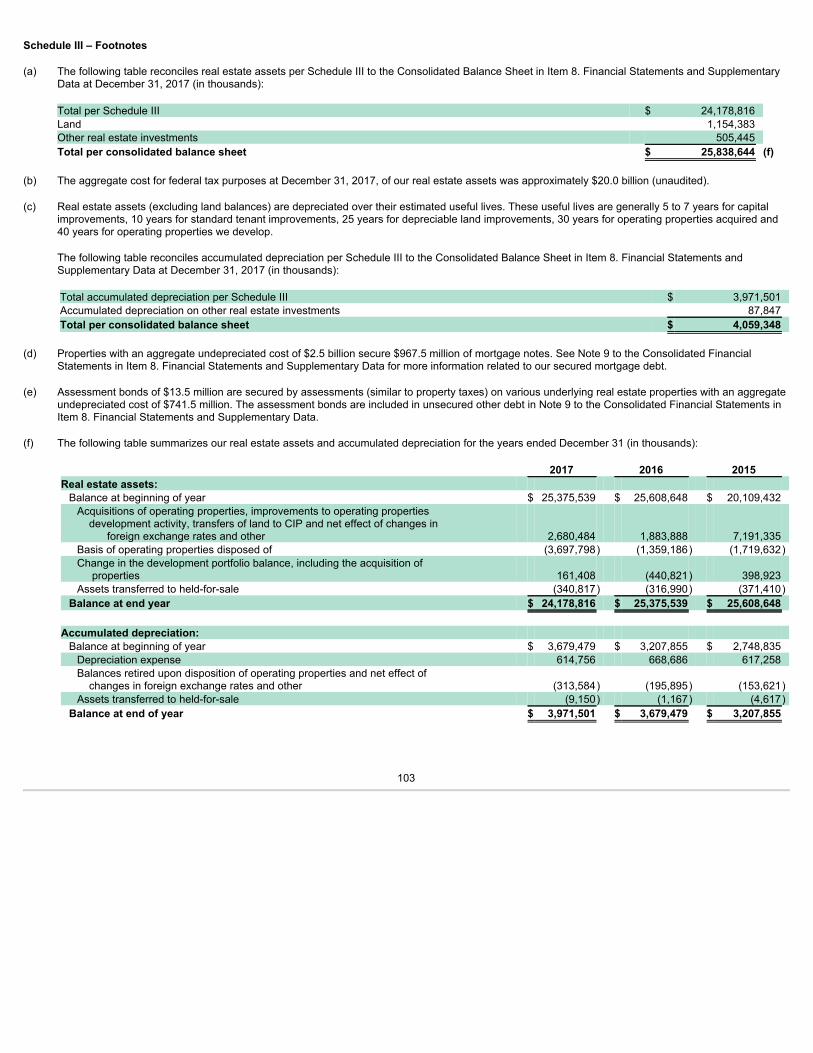
Schedule III – Footnotes (a) The following table reconciles real estate assets per Schedule III to the Consolidated Balance Sheet in Item 8. Financial Statements and Supplementary
Data at December 31, 2017 (in thousands): Total per Schedule III $ 24,178,816 Land 1,154,383 Other real estate investments 505,445 Total per consolidated balance sheet $ 25,838,644 (f) (b) The aggregate cost for federal tax purposes at December 31, 2017, of our real estate assets was approximately $20.0 billion (unaudited). (c) Real estate assets (excluding land balances) are depreciated over their estimated useful lives. These useful lives are generally 5 to 7 years for capital
improvements, 10 years for standard tenant improvements, 25 years for depreciable land improvements, 30 years for operating properties acquired and40 years for operating properties we develop. The following table reconciles accumulated depreciation per Schedule III to the Consolidated Balance Sheet in Item 8. Financial Statements andSupplementary Data at December 31, 2017 (in thousands):
Total accumulated depreciation per Schedule III $ 3,971,501 Accumulated depreciation on other real estate investments 87,847 Total per consolidated balance sheet $ 4,059,348
(d) Properties with an aggregate undepreciated cost of $2.5 billion secure $967.5 million of mortgage notes. See Note 9 to the Consolidated Financial
Statements in Item 8. Financial Statements and Supplementary Data for more information related to our secured mortgage debt. (e) Assessment bonds of $13.5 million are secured by assessments (similar to property taxes) on various underlying real estate properties with an aggregate
undepreciated cost of $741.5 million. The assessment bonds are included in unsecured other debt in Note 9 to the Consolidated Financial Statements inItem 8. Financial Statements and Supplementary Data.
(f) The following table summarizes our real estate assets and accumulated depreciation for the years ended December 31 (in thousands): 2017 2016 2015 Real estate assets: Balance at beginning of year $ 25,375,539 $ 25,608,648 $ 20,109,432
Acquisitions of operating properties, improvements to operating properties development activity, transfers of land to CIP and net effect of changes in foreign exchange rates and other 2,680,484 1,883,888 7,191,335
Basis of operating properties disposed of (3,697,798) (1,359,186) (1,719,632)
Change in the development portfolio balance, including the acquisition of properties 161,408 (440,821) 398,923
Assets transferred to held-for-sale (340,817) (316,990) (371,410) Balance at end year $ 24,178,816 $ 25,375,539 $ 25,608,648 Accumulated depreciation: Balance at beginning of year $ 3,679,479 $ 3,207,855 $ 2,748,835 Depreciation expense 614,756 668,686 617,258
Balances retired upon disposition of operating properties and net effect of changes in foreign exchange rates and other (313,584) (195,895) (153,621)
Assets transferred to held-for-sale (9,150) (1,167) (4,617) Balance at end of year $ 3,971,501 $ 3,679,479 $ 3,207,855
103
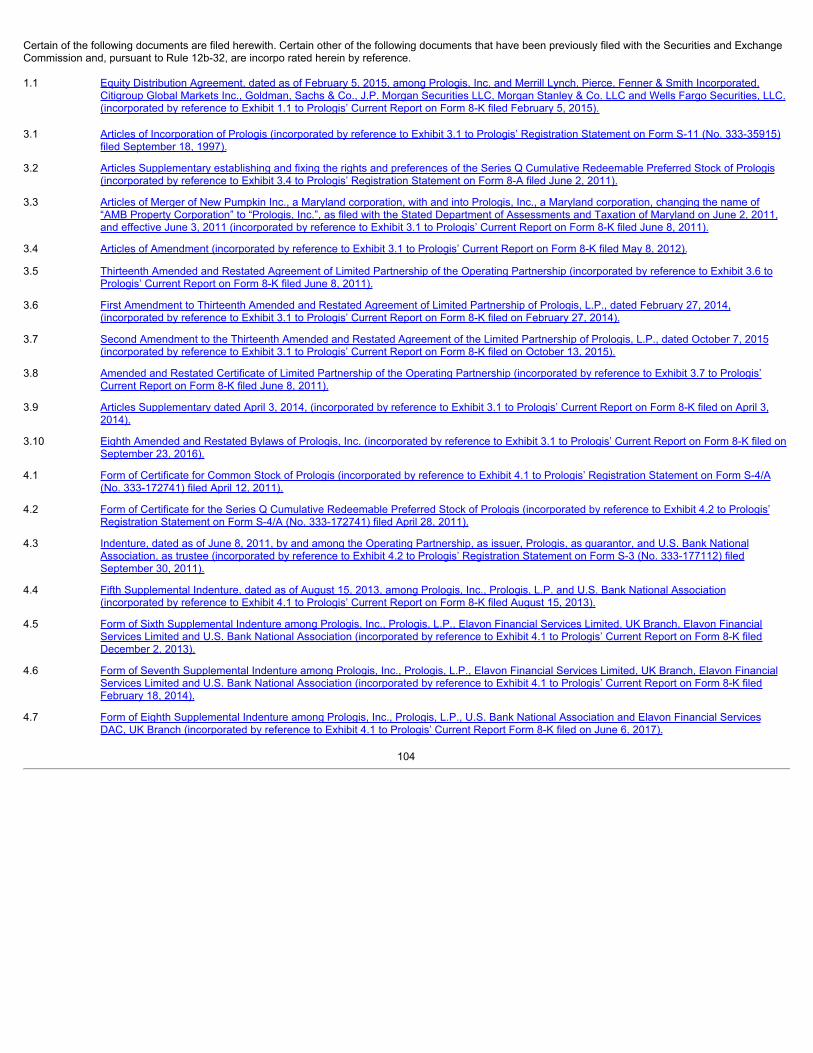
Certain of the following documents are filed herewith. Certain other of the following documents that have been previously filed with the Securities and ExchangeCommission and, pursuant to Rule 12b-32, are incorpo rated herein by reference. 1.1
Equity Distribution Agreement, dated as of February 5, 2015, among Prologis, Inc. and Merrill Lynch, Pierce, Fenner & Smith Incorporated,Citigroup Global Markets Inc., Goldman, Sachs & Co., J.P. Morgan Securities LLC, Morgan Stanley & Co. LLC and Wells Fargo Securities, LLC.(incorporated by reference to Exhibit 1.1 to Prologis’ Current Report on Form 8-K filed February 5, 2015).
3.1 Articles of Incorporation of Prologis (incorporated by reference to Exhibit 3.1 to Prologis’ Registration Statement on Form S-11 (No. 333-35915)filed September 18, 1997).
3.2 Articles Supplementary establishing and fixing the rights and preferences of the Series Q Cumulative Redeemable Preferred Stock of Prologis(incorporated by reference to Exhibit 3.4 to Prologis’ Registration Statement on Form 8-A filed June 2, 2011).
3.3 Articles of Merger of New Pumpkin Inc., a Maryland corporation, with and into Prologis, Inc., a Maryland corporation, changing the name of“AMB Property Corporation” to “Prologis, Inc.”, as filed with the Stated Department of Assessments and Taxation of Maryland on June 2, 2011,and effective June 3, 2011 (incorporated by reference to Exhibit 3.1 to Prologis’ Current Report on Form 8-K filed June 8, 2011).
3.4 Articles of Amendment (incorporated by reference to Exhibit 3.1 to Prologis’ Current Report on Form 8-K filed May 8, 2012).
3.5 Thirteenth Amended and Restated Agreement of Limited Partnership of the Operating Partnership (incorporated by reference to Exhibit 3.6 toPrologis’ Current Report on Form 8-K filed June 8, 2011).
3.6 First Amendment to Thirteenth Amended and Restated Agreement of Limited Partnership of Prologis, L.P., dated February 27, 2014,(incorporated by reference to Exhibit 3.1 to Prologis’ Current Report on Form 8-K filed on February 27, 2014).
3.7 Second Amendment to the Thirteenth Amended and Restated Agreement of the Limited Partnership of Prologis, L.P., dated October 7, 2015(incorporated by reference to Exhibit 3.1 to Prologis’ Current Report on Form 8-K filed on October 13, 2015).
3.8 Amended and Restated Certificate of Limited Partnership of the Operating Partnership (incorporated by reference to Exhibit 3.7 to Prologis’Current Report on Form 8-K filed June 8, 2011).
3.9 Articles Supplementary dated April 3, 2014, (incorporated by reference to Exhibit 3.1 to Prologis’ Current Report on Form 8-K filed on April 3,2014).
3.10 Eighth Amended and Restated Bylaws of Prologis, Inc. (incorporated by reference to Exhibit 3.1 to Prologis’ Current Report on Form 8-K filed onSeptember 23, 2016).
4.1 Form of Certificate for Common Stock of Prologis (incorporated by reference to Exhibit 4.1 to Prologis’ Registration Statement on Form S-4/A(No. 333-172741) filed April 12, 2011).
4.2 Form of Certificate for the Series Q Cumulative Redeemable Preferred Stock of Prologis (incorporated by reference to Exhibit 4.2 to Prologis’Registration Statement on Form S-4/A (No. 333-172741) filed April 28, 2011).
4.3 Indenture, dated as of June 8, 2011, by and among the Operating Partnership, as issuer, Prologis, as guarantor, and U.S. Bank NationalAssociation, as trustee (incorporated by reference to Exhibit 4.2 to Prologis’ Registration Statement on Form S-3 (No. 333-177112) filedSeptember 30, 2011).
4.4 Fifth Supplemental Indenture, dated as of August 15, 2013, among Prologis, Inc., Prologis, L.P. and U.S. Bank National Association(incorporated by reference to Exhibit 4.1 to Prologis’ Current Report on Form 8-K filed August 15, 2013).
4.5 Form of Sixth Supplemental Indenture among Prologis, Inc., Prologis, L.P., Elavon Financial Services Limited, UK Branch, Elavon FinancialServices Limited and U.S. Bank National Association (incorporated by reference to Exhibit 4.1 to Prologis’ Current Report on Form 8-K filedDecember 2, 2013).
4.6 Form of Seventh Supplemental Indenture among Prologis, Inc., Prologis, L.P., Elavon Financial Services Limited, UK Branch, Elavon FinancialServices Limited and U.S. Bank National Association (incorporated by reference to Exhibit 4.1 to Prologis’ Current Report on Form 8-K filedFebruary 18, 2014).
4.7 Form of Eighth Supplemental Indenture among Prologis, Inc., Prologis, L.P., U.S. Bank National Association and Elavon Financial ServicesDAC, UK Branch (incorporated by reference to Exhibit 4.1 to Prologis’ Current Report Form 8-K filed on June 6, 2017).
104

4.8 Indenture, dated as of June 30, 1998, by and among the Operating Partnership, Prologis and State Street Bank and Trust Company ofCalifornia, N.A., as trustee (incorporated by reference to Exhibit 4.1 to Prologis’ Current Report on Form 8-K filed August 10, 2006 and alsoincorporated by reference to Exhibit 4.1 to the Operating Partnership’s Current Report on Form 8-K filed August 10, 2006).
4.9 First Supplemental Indenture, dated as of June 30, 1998, by and among the Operating Partnership, Prologis and State Street Bank and TrustCompany of California, N.A., as trustee (incorporated by reference to Exhibit 4.2 to Prologis’ Registration Statement on Form S-11 (No. 333-49163) filed April 2, 1998).
4.10 Second Supplemental Indenture, dated as of June 30, 1998, by and among the Operating Partnership, Prologis and State Street Bank and TrustCompany of California, N.A., as trustee (incorporated by reference to Exhibit 4.3 to Prologis’ Registration Statement on Form S-11 (No. 333-49163) filed April 2, 1998).
4.11 Third Supplemental Indenture, dated as of June 30, 1998, by and among the Operating Partnership, Prologis and State Street Bank and TrustCompany of California, N.A., as trustee (incorporated by reference to Exhibit 4.4 to Prologis’ Registration Statement on Form S-11 (No. 333-49163) filed April 2, 1998).
4.12 Seventh Supplemental Indenture, dated as of August 10, 2006, by and among the Operating Partnership, Prologis and U.S. Bank NationalAssociation, as successor-in-interest to State Street Bank and Trust Company of California, N.A., as trustee (incorporated by reference to Exhibit4.2 to Prologis’ Current Report on Form 8-K filed August 10, 2006 and also incorporated by reference to Exhibit 4.2 to the OperatingPartnership’s Current Report on Form 8-K filed August 10, 2006).
4.13 Eighth Supplemental Indenture, dated as of November 20, 2009, by and among the Operating Partnership, Prologis and U.S. Bank NationalAssociation, as successor-in-interest to State Street Bank and Trust Company of California, N.A., as trustee (incorporated by reference to Exhibit4.1 to Prologis’ Current Report on Form 8-K filed November 20, 2009).
4.14 Ninth Supplemental Indenture, dated as of November 20, 2009, by and among the Operating Partnership, Prologis and U.S. Bank NationalAssociation, as successor-in-interest to State Street Bank and Trust Company of California, N.A., as trustee (incorporated by reference to Exhibit4.2 to Prologis’ Current Report on Form 8-K filed November 20, 2009).
4.15 Tenth Supplemental Indenture, dated as of August 9, 2010, by and among the Operating Partnership, Prologis and U.S. Bank NationalAssociation, as successor-in-interest to State Street Bank and Trust Company of California, N.A., as trustee (incorporated by reference to Exhibit4.1 to Prologis’ Current Report on Form 8-K filed August 9, 2010).
4.16 Eleventh Supplemental Indenture, dated as of November 12, 2010, by and among the Operating Partnership, Prologis and U.S. Bank NationalAssociation, as successor-in-interest to State Street Bank and Trust Company of California, N.A., as trustee (incorporated by reference to Exhibit4.1 to Prologis’ Current Report on Form 8-K filed November 10, 2010).
4.17 4.00% Notes due 2018 and Related Guarantee (incorporated by reference to Exhibit 4.2 to Prologis’ Current Report on Form 8-K filed November10, 2010).
4.18 Form of 2.750% Notes due 2019 (incorporated by reference to Exhibit 4.4 to Prologis’ Current Report on Form 8-K filed August 15, 2013).
4.19 Form of 4.250% Notes due 2023 (incorporated by reference to Exhibit 4.5 to Prologis’ Current Report on Form 8-K filed August 15, 2013).
4.20 3.350% Notes due 2021 (incorporated by reference to Exhibit 4.2 to Prologis’ Current Report on Form 8-K filed November 1, 2013).
4.21 Form of 3.000% Notes due 2022 (incorporated by reference to Exhibit 4.2 to Prologis’ Current Report on Form 8-K filed December 2, 2013).
4.22 Form of 3.375% Notes due 2024 (incorporated by reference to Exhibit 4.3 to Prologis’ Current Report on Form 8-K filed February 18, 2014).
4.23 Form of 3.00% Notes due 2026 (incorporated by reference to Exhibit 4.2 to Prologis’ Current Report on Form 8-K filed on May 28, 2014).
4.24 Form of 1.375% Notes due 2020 (incorporated by reference to Exhibit 4.2 to Prologis’ Current Report on Form 8-K filed on October 6, 2014).
4.25 Form of 1.375% Notes due 2021 (incorporated by reference to Exhibit 4.2 of Prologis’ Current Report on Form 8-K filed May 12, 2015).
4.26 Form of 3.750% Notes due 2025 (incorporated by reference to Exhibit 4.2 of Prologis’ Current Report on Form 8-K filed October 30, 2015).
4.27 Form of Floating Rate Notes due 2020 (incorporated by reference to Exhibit 4.2 to Prologis’ Current Report Form 8-K filed on January 26, 2018).
105

4.28 Form of 2.250% Notes due 2029 (incorporated by reference to Exhibit 4.3 to Prologis’ Current Report Form 8-K filed on June 6, 2017).
4.29 Form of Officers’ Certificate related to the 2.750% Notes due 2019 (incorporated by reference to Exhibit 4.2 to Prologis’ Current Report on Form8-K filed August 15, 2013).
4.30 Form of Officers’ Certificate related to the 4.250% Notes due 2023 (incorporated by reference to Exhibit 4.3 to Prologis’ Current Report on Form8-K filed August 15, 2013).
4.31 Form of Officers’ Certificate related to the 3.350% Notes due 2021 (incorporated by reference to Exhibit 4.1 to Prologis’ Current Report on Form8-K filed November 1, 2013).
4.32 Form of Officers’ Certificate related to the 3.375% Notes due 2024 (incorporated by reference to Exhibit 4.2 to Prologis’ Current Report on Form8-K filed February 18, 2014).
4.33 Form of Officer’s Certificate related to the 3.00% Notes due 2026 (incorporated by reference to Exhibit 4.1 to Prologis’ Current Report on Form8-K filed on May 28, 2014).
4.34 Form of Officer’s Certificate related to 1.375% Notes due 2020 (incorporated by reference to Exhibit 4.1 to Prologis’ Current Report on Form 8-kfiled on October 6, 2014).
4.35 Form of Officers’ Certificate related to the 1.375% Notes due 2021 (incorporated by reference to Exhibit 4.1 of Prologis’ Current Report on Form8-K filed May 12, 2015).
4.36 Form of Officers’ Certificate related to the 3.750% Notes due 2025 (incorporated by reference to Exhibit 4.1 to Prologis’ Current Report on Form8-K filed on October 30, 2015).
4.37 Form of Officers’ Certificate related to 2.250% Notes due 2029 (incorporated by reference to Exhibit 4.2 to Prologis’ Current Report Form 8-Kfiled on June 6, 2017).
4.38 Form of Officers’ Certificate related to Floating Rate Notes due 2020 (incorporated by reference to Exhibit 4.1 to Prologis’ Current Report Form8-K filed on January 26, 2018).
Other debt instruments are omitted in accordance with Item 601(b)(4)(iii)(A) of Registration S-K. Copies of such instruments will be furnished to the Securitiesand Exchange Commission upon request.
10.1 Amended and Restated Agreement of Limited Partnership of ProLogis Fraser, L.P., dated as of August 4, 2004 (incorporated by reference toExhibit 10.1 to the Trust’s Quarterly Report on Form 10-Q for the quarter ended September 30, 2004).
10.2 Fifteenth Amended and Restated Agreement of Limited Partnership of Prologis 2, L.P., (f/k/a AMB Property II, L.P.) dated February 19, 2010(incorporated by reference to Exhibit 10.6 to Prologis’ Annual Report on Form 10-K for the year ended December 31, 2009).
10.3* The Third Amended and Restated 1997 Stock Option and Incentive Plan of AMB Property Corporation and AMB Property, L.P. (incorporated byreference to Exhibit 10.22 to Prologis’ Annual Report on Form 10-K for the year ended December 31, 2001 and also incorporated by reference toExhibit 10.19 to the Operating Partnership’s Annual Report on Form 10-K for the year ended December 31, 2001).
10.4* Amendment No. 1 to the Third Amended and Restated 1997 Stock Option and Incentive Plan of AMB Property Corporation and AMB Property,L.P. (incorporated by reference to Exhibit 10.23 to Prologis’ Annual Report on Form 10-K for the year ended December 31, 2001 and alsoincorporated by reference to Exhibit 10.20 to the Operating Partnership’s Annual Report on Form 10-K for the year ended December 31, 2001).
10.5* Amendment No. 2 to the Third Amended and Restated 1997 Stock Option and Incentive Plan of AMB Property Corporation and AMB Property,L.P. (incorporated by reference to Exhibit 10.5 to Prologis’ Quarterly Report on Form 10-Q for the quarter ended September 30, 2004 and alsoincorporated by reference to Exhibit 10.4 to the Operating Partnership’s Quarterly Report on Form 10-Q for the quarter ended September 30,2004).
10.6* Amended and Restated 2002 Nonqualified Deferred Compensation Plan (incorporated by reference to Exhibit 10.2 to Prologis’ Current Reporton Form 8-K filed October 4, 2006 and also incorporated by reference to Exhibit 10.2 to the Operating Partnership’s Current Report on Form 8-Kfiled October 4, 2006).
10.7* The Amended and Restated 2002 Stock Option and Incentive Plan of AMB Property Corporation and AMB Property, L.P. (incorporated byreference to Exhibit 10.1 to Prologis’ Current Report on Form 8-K filed May 15, 2007 and also incorporated by reference to Exhibit 10.1 to theOperating Partnership’s Current Report on Form 8-K filed May 15, 2007).
10.8* Prologis Outperformance Plan (incorporated by reference to Exhibit 10.1 to Prologis’ Current Report on Form 8-K filed December 22, 2011).
106
10. 9 * Prologis, Inc. 2016 Outperformance Plan (incorporated by reference to Exhibit 10.1 to Prologis’ Current Report on Form 8-K filed on August 16,2016).
10.10 Prologis, Inc. 2018 Outperformance Plan (incorporated by reference to Exhibit 10.1 to Prologis’ Current Report on Form 8-K filed on January 18,2018).
10.11* Form of Prologis, Inc. 2016 Outperformance Plan LTIP Unit Award Agreement (incorporated by reference to Exhibit 10.2 to Prologis’ CurrentReport on Form 8-K filed on August 16, 2016).
10.12* Form of Participation Points and LTIP Unit Award Agreement (incorporated by reference to Exhibit 10.1 to Prologis’ Current Report on Form 8-Kfiled on February 27, 2014).
10.13* Second Amended and Restated Prologis Promote Plan (incorporated by reference to Exhibit 10.1 to Prologis’ Current Report on Form 8-K filedon August 1, 2014).
10.14* Form of Prologis, Inc. Second Amended and Restated Prologis Promote Plan LTIP Unit Award Agreement (incorporated by reference to Exhibit10.1 to Prologis’ Current Report on Form 8-K filed on August 18, 2014).
10.15* Form of Prologis, Inc. Long-Term Incentive Plan LTIP Unit Award Agreement (General) (incorporated by reference to Exhibit 10.3 to Prologis’Quarterly Report on Form 10-Q for the quarter ended September 30, 2014).
10.16* Form of Prologis, Inc. 2012 Long-Term Incentive Plan Restricted Stock Unit Agreement (LTIP Unit election) (incorporated by reference to Exhibit10.27 to Prologis’ Annual Report on Form 10-K for the year ended December 31, 2015).
10.17* Form of Prologis, Inc. 2012 Long-Term Incentive Plan Restricted Stock Unit Agreement (incorporated by reference to Exhibit 10.5 to Prologis’Quarterly Report on Form 10-Q for the quarter ended September 30, 2014).
10.18* Form of Prologis, Inc. 2012 Long-Term Incentive Plan Restricted Stock Unit Agreement (Bonus exchange) (incorporated by reference to Exhibit10.6 to Prologis’ Quarterly Report on Form 10-Q for the quarter ended September 30, 2014).
10.19* ProLogis 2006 Long-Term Incentive Plan (incorporated by reference to Exhibit 10.2 to the Trust’s Current Report on Form 8-K filed June 2,2006).
10.20* First Amendment of the ProLogis 2006 Long-Term Incentive Plan (incorporated by reference to Exhibit 10.1 to the Trust’s Quarterly Report onForm 10-Q for the quarter ended March 31, 2010).
10.21* Second Amendment of the ProLogis 2006 Long-Term Incentive Plan (incorporated by reference to Exhibit 10.1 to the Trust’s Current Report onForm 8-K filed May 19, 2010).
10.22* Third Amendment of the ProLogis 2006 Long-Term Incentive Plan (incorporated by reference to Exhibit 10.1 to the Trust’s Quarterly Report onForm 10-Q for the quarter ended September 30, 2010).
10.23* Form of Non-Qualified Share Option Award Terms; The Trust 2006 Long-Term Incentive Plan (incorporated by reference to Exhibit 10.25 to theTrust’s Annual Report on Form 10-K for the year ended December 31, 2009).
10.24* Form of Restricted Share Award Terms; ProLogis 2006 Long-Term Incentive Plan (incorporated by reference to Exhibit 10.27 to the Trust’sAnnual Report on Form 10-K for the year ended December 31, 2009).
10.25* Form of Performance Share Award Terms; ProLogis 2006 Long-Term Incentive Plan (incorporated by reference to Exhibit 10.26 to the Trust’sAnnual Report on Form 10-K for the year ended December 31, 2009).
10.26* ProLogis 2000 Share Option Plan for Outside Trustees (as Amended and Restated Effective as of December 31, 2008) (incorporated byreference to exhibit 10.13 to ProLogis’ Form 10-K for the year ended December 31, 2008).
10.27* ProLogis Trust 1997 Long-Term Incentive Plan (as Amended and Restated Effective as of September 26, 2002) (incorporated by reference toexhibit 10.1 to ProLogis’ Form 8-K dated February 19, 2003).
10.28* First Amendment of ProLogis 1997 Long-Term Incentive Plan (incorporated by reference to exhibit 10.2 to ProLogis’ Form 8-K filed on May 19,2010).
10.29* ProLogis Deferred Fee Plan for Trustees (As Amended and Restated Effective as of May 14, 2010) (incorporated by reference to exhibit 10.3 toProLogis’ Form 8-K filed on May 19, 2010).
10.30* Form of Indemnification Agreement between ProLogis and certain directors and executive officers (incorporated by reference to Exhibit 10.1 toPrologis’ Current Report on Form 8-K filed June 8, 2011).
10.31* Form of Restricted Stock Unit Agreement; Prologis, Inc. 2012 Long-Term Incentive Plan (incorporated by reference to Exhibit 10.1 to Prologis’Quarterly Report on Form 10-Q for the quarter ended September 30, 2012).
10.32* Prologis, Inc. 2012 Long-Term Incentive Plan (incorporated by reference to Exhibit 10.1 to Prologis’ Current Report on Form 8-K filed May 8,2012).
107

10.3 3 * Form of Director Deferred Stock Unit Award terms (incorporated by reference to Exhibit 10.2 to Prologis’ Current Report on Form 8-K filed May8, 2012).
10.34* Form of Change of Control and Noncompetition Agreement by and between Prologis, Inc. and its executive officers (incorporated by reference toExhibit 10.2 to Prologis’ Current Report on Form 8-K filed August 16, 2013).
10.35* Form of Prologis, Inc. Long-Term Incentive Plan LTIP Unit Award Agreement (General form 2015) (incorporated by reference to Exhibit 10.57 toPrologis’ Annual Report on Form 10-K for the year ended December 31, 2014).
10.36* Form of Prologis, Inc. Long-Term Incentive Plan LTIP Unit Award Agreement (Bonus exchange) (incorporated by reference to Exhibit 10.2 toPrologis’ Quarterly Report on Form 10-Q for the quarter ended March 31, 2015).
10.37* Form of Prologis, Inc. Long-Term Incentive Plan LTIP Unit Award Agreement (General form 2016) (incorporated by reference to Exhibit 10.48 toPrologis’ Annual Report on Form 10-K for the year ended December 31, 2015).
10.38* Form of Prologis, Inc. Outperformance Plan LTIP Unit Exchange Award Agreement (incorporated by reference to Exhibit 10.58 to Prologis’Annual Report on Form 10-K for the year ended December 31, 2014).
10.39* Form of Prologis, Inc. Long-Term Incentive Plan Equity Exchange Offer LTIP Unit Award Agreement (incorporated by reference to Exhibit 10.59to Prologis’ Annual Report on Form 10-K for the year ended December 31, 2014).
10.40* Amended and Restated Prologis, Inc. 2011 Notional Account Deferred Compensation Plan (incorporated by reference to Exhibit 10.60 toPrologis’ Annual Report on Form 10-K for the year ended December 31, 2014).
10.41* Amended and Restated Prologis, Inc. Nonqualified Deferred Compensation Plan (incorporated by reference to Exhibit 10.61 to Prologis’ AnnualReport on Form 10-K for the year ended December 31, 2014).
10.42* Second Amended and Restated Prologis 2005 Nonqualified Deferred Compensation Plan (incorporated by reference to Exhibit 10.62 to Prologis’Annual Report on Form 10-K for the year ended December 31, 2014).
10.43 Time-Sharing Agreement, dated January 21, 2015, by and between ProLogis Logistics Services Incorporated and Hamid R. Moghadam(incorporated by reference to Exhibit 10.63 to Prologis’ Annual Report on Form 10-K for the year ended December 31, 2014).
10.44 Amended and Restated Time-Sharing Agreement, dated January 11, 2016, by and between ProLogis Logistics Services Incorporated andHamid R. Moghadam (incorporated by reference to Exhibit 10.55 to Prologis’ Annual Report on Form 10-K for the year ended December 31,2015).
10.45 Global Senior Credit Agreement dated as of July 11, 2013, among Prologis, Inc., Prologis, L.P., various affiliates of Prologis, L.P., variouslenders and agents, and Bank of America, N.A., as Administrative Agent (incorporated by reference to Exhibit 10.1 to Prologis’ Current Reporton Form 8-K filed July 15, 2013).
10.46 First Amendment to the Global Senior Credit Agreement dated as of June 26, 2014 among Prologis, Inc., Prologis, L.P., various affiliates ofPrologis, L.P., various lenders and Bank of America, N.A. as administrative agent (incorporated by reference to Exhibit 10.1 to Prologis’ CurrentReport Form 8-K filed on June 30, 2014).
10.47 Second Amendment to the Global Senior Credit Agreement dated as of January 22, 2015 among Prologis, L.P., various affiliates of Prologis,L.P., various lenders and Bank of America, N.A. as global administrative agent. (incorporated by reference to Exhibit 10.1 to Prologis’ CurrentReport Form 10-Q filed on May 4, 2015).
10.48 Fourth Amended and Restated Revolving Credit Agreement dated as of August 14, 2013 among Prologis Japan Finance Y.K., as initialborrower, Prologis, Inc. and Prologis, L.P., as guarantors, the banks listed on the signature pages thereof, and Sumitomo Mitsui BankingCorporation, as Administrative Agent (incorporated by reference to Exhibit 10.1 to Prologis’ Current Report on Form 8-K filed August 16, 2013).
10.49 Guaranty of Payment, dated as of August 14, 2013, among Prologis, Inc. and Prologis, L.P., as guarantors, Sumitomo Mitsui BankingCorporation, as Administrative Agent, for the banks that are from time to time parties to the Fourth Amended and Restated Revolving CreditAgreement, dated at August 14, 2013 (incorporated by reference to Exhibit 10.2 to Prologis’ Current Report on Form 8-K filed August 16, 2013).
10.50 Senior Term Loan Agreement dated as of June 19, 2014 among Prologis, Inc., Prologis, L.P., various affiliates of Prologis, L.P., various lendersand Bank of America, N.A. as administrative agent (incorporated by reference to Exhibit 10.1 to Prologis’ Current Report Form 8-K filed on June24, 2014).
10.51 Senior Term Loan Agreement dated as of May 28, 2015 among Prologis, L.P., as Borrower, Prologis, Inc., as Guarantor, various lenders andBank of America N.A., as Administrative Agent (incorporated by reference to Exhibit 10.1 of Prologis’ Current Report on Form 8-K filed June 1,2015).
10.52 First Amendment, dated January 22, 2015, to the Senior Term Loan Agreement dated as of June 19, 2014, among Prologis, L.P., variousaffiliates thereof, various lenders and Bank of America, N.A. as Administrative Agent (incorporated by reference to Exhibit 10.63 to Prologis’Annual Report on Form 10-K for the year ended December 31, 2015).
108

10.5 3 Term Loan Agreement dated as of August 18, 2016 among Prologis GK Holdings Y.K., as borrower, Prologis, Inc. and Prologis, L.P., asguarantors, the banks listed on the signature pages thereof, and Sumitomo Mitsui Banking Corporation, as Administrative Agent (incorporated byreference to Exhibit 10.1 to Prologis’ Current Report on Form 8-K filed on August 22, 2016).
10.54 Guaranty of Payment dated as of August 18, 2016 among Prologis, Inc. and Prologis, L.P., as guarantors, and Sumitomo Mitsui BankingCorporation, as Administrative Agent, for the banks that are from time to time parties to the Term Loan Agreement dated as of August 18, 2016(incorporated by reference to Exhibit 10.2 to Prologis’ Current Report on Form 8-K filed on August 22, 2016).
10.55 Amended and Restated Global Senior Credit Agreement dated as of April 14, 2016 among Prologis, Inc., Prologis, L.P., various affiliates ofPrologis, L.P., various lenders and agents, and Bank of America, N.A., as Administrative Agent (incorporated by reference to Exhibit 10.1 toPrologis’ Current Report on Form 8-K filed on April 18, 2016).
10.56 Letter Agreement dated February 3, 2017 by and between Prologis, Inc. and Hamid R. Moghadam (incorporated by reference to Exhibit 10.1 toPrologis’ Current Report Form 8-K filed on February 3, 2017).
10.57 Fifth Amended and Restated Revolving Credit Agreement, dated as of February 16, 2017, among Prologis Marunouchi Finance InvestmentLimited Partnership, as initial borrower, Prologis, Inc. and Prologis, L.P., as guarantors, the lenders listed on the signature pages thereof, andSumitomo Mitsui Banking Corporation, as Administrative Agent (incorporated by reference to Exhibit 10.1 to Prologis’ Current Report Form 8-Kfiled on February 21, 2017).
10.58 Guaranty of Payment, date as of February 16, 2017, among Prologis, Inc. and Prologis, L.P., as guarantors, Sumitomo Mitsui BankingCorporation, as Administrative Agent, for the banks that are from time to time parties to the Fifth Amend and Restated Revolving CreditAgreement, dated as of February 16, 2017 (incorporated by reference to Exhibit 10.2 to Prologis’ Current Report Form 8-K filed on February 22,2017).
10.59 Amended and Restated Senior Term Loan Agreement dated as of May 4, 2017 among Prologis, Inc., Prologis, L.P., various affiliates of Prologis,L.P., various lenders and Bank of America, N.A., as Administrative Agent (incorporated by reference to Exhibit 10.1 to Prologis’ Current ReportForm 8-K on May 8, 2017).
10.60 First Amendment, dated as of May 4, 2017, to the Amended and Restated Global Senior Credit Agreement by and among Prologis, Inc.,Prologis, L.P., various affiliates of Prologis, L.P., various lenders and Bank of America, N.A., as Global Administrative Agent (incorporated byreference to Exhibit 10.2 to Prologis’ Current Report Form 8-K on May 8, 2017).
12.1† Computation of Ratio of Earnings to Fixed Charges of Prologis, Inc. and Prologis, L.P.
12.2† Computation of Ratio of Earnings to Combined Fixed Charges and Preferred Stock/Unit Dividends of Prologis, Inc. and Prologis, L.P.
21.1† Subsidiaries of Prologis, Inc. and Prologis, L.P.
23.1† Consent of KPMG LLP with respect to Prologis, Inc.
23.2† Consent of KPMG LLP with respect to Prologis, L.P.
24.1† Power of Attorney for Prologis, Inc. (included in signature page of this annual report).
24.2† Power of Attorney for Prologis, L.P. (included in signature page of this annual report).
31.1† Certification of Chief Executive Officer of Prologis, Inc.
31.2† Certification of Chief Financial Officer of Prologis, Inc.
31.3† Certification of Chief Executive Officer for Prologis, L.P.
31.4† Certification of Chief Financial Officer for Prologis, L.P.
32.1† Certification of Chief Executive Officer and Chief Financial Officer of Prologis, Inc., pursuant to Section 906 of the Sarbanes-Oxley Act of 2002.
32.2† Certification of Chief Executive Officer and Chief Financial Officer for Prologis, L.P., pursuant to Section 906 of the Sarbanes-Oxley Act of 2002.
99.1 Supplemental United States Federal Income Tax Considerations (incorporated by reference to Exhibit 99.1 to Prologis’ Current Report on Form8-K filed June 20, 2016).
101. INS† XBRL Instance Document
101. SCH† XBRL Taxonomy Extension Schema
109

101. CAL† XBRL Taxonomy Extension Calculation Linkbase
101. DEF† XBRL Taxonomy Extension Definition Linkbase
101. LAB† XBRL Taxonomy Extension Label Linkbase
101. PRE† XBRL Taxonomy Extension Presentation Linkbase * Management Contract or Compensatory Plan or Arrangement† Filed herewith
110

SIGNATURES
Pursuant to the requirements of Section 13 or 15(d) of the Securities Exchange Act of 1934, the registrant has duly caused this report to be signed on its behalfby the undersigned, thereunto duly authorized.
PROLOGIS, INC. By: /s/ Hamid R. Moghadam Hamid R. Moghadam Chief Executive Officer
Date: February 15, 2018
POWER OF ATTORNEY KNOW ALL MEN BY THESE PRESENTS, that we, the undersigned officers and directors of Prologis, Inc., hereby severally constitute Hamid R. Moghadam,Thomas S. Olinger and Edward S. Nekritz, and each of them singly, our true and lawful attorneys with full power to them, and each of them singly, to sign for usand in our names in the capacities indicated below, the Form 10-K filed herewith and any and all amendments to said Form 10-K, and generally to do all suchthings in our names and in our capacities as officers and directors to enable Prologis, Inc. to comply with the provisions of the Securities Exchange Act of 1934,and all requirements of the U.S. Securities and Exchange Commission, hereby ratifying and confirming our signatures as they may be signed by our saidattorneys, or any of them, to said Form 10-K and any and all amendments thereto. Pursuant to the requirements of the Securities Exchange Act of 1934, this report has been signed below by the following persons on behalf of the registrant andin the capacities and on the dates indicated. Signature Title Date
/s/ Hamid R. Moghadam Chairman of the Board and Chief ExecutiveOfficer
February 15, 2018Hamid R. Moghadam
/s/ Thomas S. Olinger Chief Financial Officer February 15, 2018Thomas S. Olinger
/s/ Lori A. Palazzolo Managing Director and Chief Accounting Officer February 15, 2018Lori A. Palazzolo
/s/ George L. Fotiades Director February 15, 2018George L. Fotiades
/s/ Lydia H. Kennard Director February 15, 2018Lydia H. Kennard
/s/ J. Michael Losh Director February 15, 2018J. Michael Losh
/s/ Irving F. Lyons III Director February 15, 2018Irving F. Lyons III
/s/ David P. O’Connor Director February 15, 2018David P. O’Connor
/s/ Olivier Piani Director February 15, 2018Olivier Piani
/s/ Jeffrey L. Skelton Director February 15, 2018Jeffrey L. Skelton
/s/ Carl B. Webb Director February 15, 2018Carl B. Webb
/s/ William D. Zollars Director February 15, 2018William D. Zollars
111

SIGNATURES
Pursuant to the requirements of Section 13 or 15(d) of the Securities Exchange Act of 1934, the registrant has duly caused this report to be signed on its behalfby the undersigned, thereunto duly authorized.
PROLOGIS, L.P.By: Prologis, Inc., its general partner By: /s/ Hamid R. Moghadam Hamid R. Moghadam Chief Executive Officer
Date: February 15, 2018
POWER OF ATTORNEY KNOW ALL MEN BY THESE PRESENTS, that we, the undersigned officers and directors of Prologis, L.P., hereby severally constitute Hamid R. Moghadam,Thomas S. Olinger and Edward S. Nekritz, and each of them singly, our true and lawful attorneys with full power to them, and each of them singly, to sign for usand in our names in the capacities indicated below, the Form 10-K filed herewith and any and all amendments to said Form 10-K, and generally to do all suchthings in our names and in our capacities as officers and directors to enable Prologis, L.P. to comply with the provisions of the Securities Exchange Act of 1934,and all requirements of the U.S. Securities and Exchange Commission, hereby ratifying and confirming our signatures as they may be signed by our saidattorneys, or any of them, to said Form 10-K and any and all amendments thereto. Pursuant to the requirements of the Securities Exchange Act of 1934, this report has been signed below by the following persons on behalf of the registrant andin the capacities and on the dates indicated. Signature Title Date
/s/ Hamid R. Moghadam Chairman of the Board and Chief ExecutiveOfficer
February 15, 2018Hamid R. Moghadam
/s/ Thomas S. Olinger Chief Financial Officer February 15, 2018Thomas S. Olinger
/s/ Lori A. Palazzolo Managing Director and Chief Accounting Officer February 15, 2018Lori A. Palazzolo
/s/ George L. Fotiades Director February 15, 2018George L. Fotiades
/s/ Lydia H. Kennard Director February 15, 2018Lydia H. Kennard
/s/ J. Michael Losh Director February 15, 2018J. Michael Losh
/s/ Irving F. Lyons III Director February 15, 2018Irving F. Lyons III
/s/ David P. O’Connor Director February 15, 2018David P. O’Connor
/s/ Olivier Piani Director February 15, 2018Olivier Piani
/s/ Jeffrey L. Skelton Director February 15, 2018Jeffrey L. Skelton
/s/ Carl B. Webb Director February 15, 2018Carl B. Webb
/s/ William D. Zollars Director February 15, 2018William D. Zollars
112
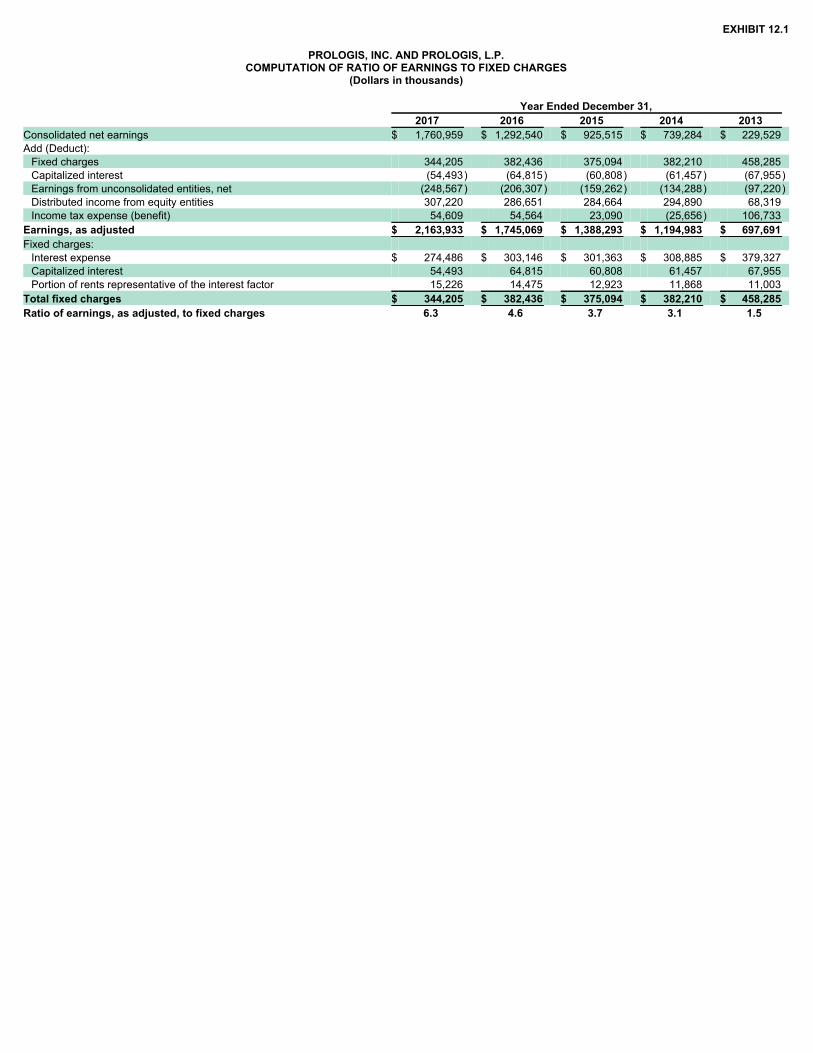
EXHIBIT 12.1
PROLOGIS, INC. AND PROLOGIS, L.P.COMPUTATION OF RATIO OF EARNINGS TO FIXED CHARGES
(Dollars in thousands)
Year Ended December 31, 2017 2016 2015 2014 2013
Consolidated net earnings $ 1,760,959 $ 1,292,540 $ 925,515 $ 739,284 $ 229,529 Add (Deduct): Fixed charges 344,205 382,436 375,094 382,210 458,285 Capitalized interest (54,493) (64,815) (60,808) (61,457) (67,955)Earnings from unconsolidated entities, net (248,567) (206,307) (159,262) (134,288) (97,220)Distributed income from equity entities 307,220 286,651 284,664 294,890 68,319 Income tax expense (benefit) 54,609 54,564 23,090 (25,656) 106,733
Earnings, as adjusted $ 2,163,933 $ 1,745,069 $ 1,388,293 $ 1,194,983 $ 697,691 Fixed charges: Interest expense $ 274,486 $ 303,146 $ 301,363 $ 308,885 $ 379,327 Capitalized interest 54,493 64,815 60,808 61,457 67,955 Portion of rents representative of the interest factor 15,226 14,475 12,923 11,868 11,003
Total fixed charges $ 344,205 $ 382,436 $ 375,094 $ 382,210 $ 458,285 Ratio of earnings, as adjusted, to fixed charges 6.3 4.6 3.7 3.1 1.5

EXHIBIT 12.2
PROLOGIS, INC. AND PROLOGIS, L.P.COMPUTATION OF RATIO OF EARNINGS TO COMBINED FIXED CHARGES
AND PREFERRED STOCK DIVIDENDS AND UNIT DISTRIBUTIONS(Dollars in thousands)
Year Ended December 31, 2017 2016 2015 2014 2013
Consolidated net earnings $ 1,760,959 $ 1,292,540 $ 925,515 $ 739,284 $ 229,529 Add (Deduct): Fixed charges 344,205 382,436 375,094 382,210 458,285 Capitalized interest (54,493) (64,815) (60,808) (61,457) (67,955)Earnings from unconsolidated entities, net (248,567) (206,307) (159,262) (134,288) (97,220)Distributed income from equity entities 307,220 286,651 284,664 294,890 68,319 Income tax expense (benefit) 54,609 54,564 23,090 (25,656) 106,733
Earnings, as adjusted $ 2,163,933 $ 1,745,069 $ 1,388,293 $ 1,194,983 $ 697,691 Combined fixed charges and preferred stock dividends and unit distributions: Interest expense $ 274,486 $ 303,146 $ 301,363 $ 308,885 $ 379,327 Capitalized interest 54,493 64,815 60,808 61,457 67,955 Portion of rents representative of the interest factor 15,226 14,475 12,923 11,868 11,003 Total fixed charges 344,205 382,436 375,094 382,210 458,285
Preferred stock dividends and unit distributions 6,499 6,714 6,651 7,431 18,391 Combined fixed charges and preferred stock dividends and unit distributions $ 350,704 $ 389,150 $ 381,745 $ 389,641 $ 476,676 Ratio of earnings, as adjusted, to combined fixed charges and preferred stock dividends and unit distributions
6.2 4.5 3.6 3.1 1.5

EXHIBIT 21.1 SUBSIDIARIES OF PROLOGIS, INC. AND PROLOGIS L.P. Prologis, L.P. is a direct subsidiary of Prologis, Inc. Prologis, L.P. and its 491 subsidiaries are in the real estate operations, development and strategic capitalbusiness. The following is a list of additional subsidiaries of Prologis, L.P. at December 31, 2017:
Name of Entity Jurisdiction of Organization
Entities that engage in real estate operations, development and strategic capital: AMB/AFCO Cargo, LLC and eight subsidiaries DelawareAMB HFC LP and eight subsidiaries DelawareAMB/IMDH Beacon Lakes, LLC and one subsidiary DelawareAMB Portview Center, LLC DelawareIMD Holding Corporation and two subsidiaries DelawarePalmtree Acquisition Corporation and thirty-two subsidiaries DelawarePLD-TRS Holding LLC and one subsidiary DelawarePLD International Finance, LLC and two domestic and five foreign subsidiaries DelawarePLD International Holding LLC and one hundred forty-five foreign subsidiaries DelawarePrologis 2, L.P. and five subsidiaries DelawarePrologis Brazil Logistics Partners Fund I, L.P. and twenty foreign subsidiaries DelawarePrologis Fraser, L.P. and two subsidiaries DelawarePrologis USLV Operating Partnership, L.P. and one hundred nineteen subsidiaries DelawarePrologis Logistics Services Incorporated and thirteen domestic and thirty-two foreign subsidiaries DelawarePrologis North American Industrial Fund II, L.P. and eleven foreign subsidiaries DelawarePrologis CCIG Oakland Global, LLC DelawarePrologis Park Chicago LLLP IllinoisPrologis Park Redlands 5 LLC DelawarePrologis Fondo Logistico 5, S. de R.L. de C. V. MexicoPrologis Poland Developments FIZ AN LuxembourgPrologis UK Holdings S.A. and forty-four foreign subsidiaries LuxembourgSiziano Logistics Park S.R.L. ItalySaint Pathus SAS and one foreign subsidiary France Entities that engage in providing management services: Prologis Management LLC DelawareKeystone Realty Services, Inc. PennsylvaniaPrologis de Mexico S.A. de C.V. MexicoPrologis Japan Management LLC and two foreign subsidiaries DelawarePrologis Management Services Sarl and two foreign subsidiaries LuxembourgPrologis Directorship BV NetherlandsPrologis Directorship II BV NetherlandsPrologis Directorship Sarl LuxembourgPrologis Park Bradford Management Company Limited United KingdomPrologis Park Bromford Gate Management Company Limited United KingdomPrologis Park Ryton Management Company Limited United KingdomPrologis Park Midpoint 2 Management Company Limited United KingdomPrologis Park Littlebrook Management Company Limited United KingdomPrologis B.V. and fourteen foreign subsidiaries NetherlandsPrologis UK Financial Services Limited United KingdomPLD Finance Management LLC DelawarePLD Finance Management BV NetherlandsPrologis RFI DIRFT Management Limited United Kingdom Other entities: Solutions Insurance Ltd. Bermuda

EXHIBIT 23.1
Consent of Independent Registered Public Accounting Firm The Board of DirectorsPrologis, Inc.: We consent to the incorporation by reference in Registration Statement Nos. 333-216491 on Form S-3 and Registration Statement Nos. 333-42015, 333-78779,333-90042, 333-100214, 333-144489, 333-177378, 333-178955, and 333-181529 on Form S-8 of Prologis, Inc. of our reports dated February 15, 2018, withrespect to the consolidated balance sheets of Prologis, Inc. and subsidiaries as of December 31, 2017 and 2016, and the related consolidated statements ofincome, comprehensive income, equity, and cash flows for each of the years in the three-year period ended December 31, 2017, and the related notes andfinancial statement schedule III (collectively, the consolidated financial statements), and the effectiveness of internal control over financial reporting as ofDecember 31, 2017, which reports appear in the December 31, 2017 annual report on Form 10-K of Prologis, Inc. and Prologis L.P. Our report dated February 15, 2018 refers to a change in method of accounting for evaluating whether a transaction qualifies as an acquisition of an asset orbusiness.
/s/ KPMG LLP Denver, ColoradoFebruary 15, 2018

EXHIBIT 23.2
Consent of Independent Registered Public Accounting Firm The PartnersPrologis, L.P.: We consent to the incorporation by reference in Registration Statement No. 333-216491 on Form S-3; and Registration Statement No. 333-100214 on Form S-8of Prologis, L.P. of our reports dated February 15, 2018, with respect to the consolidated balance sheets of Prologis, L.P. and subsidiaries at December 31, 2017and 2016, and the related consolidated statements of income, comprehensive income, capital, and cash flows for each of the years in the three-year periodended December 31, 2017, and the related notes and financial statement schedule III (collectively, the consolidated financial statements), which reports appearin the December 31, 2017 annual report on Form 10-K of Prologis, Inc. and Prologis, L.P. Our report dated February 15, 2018 refers to a change in method of accounting for evaluating whether a transaction qualifies as an acquisition of an asset orbusiness.
/s/ KPMG LLP Denver, ColoradoFebruary 15, 2018
EXHIBIT 31.1
CERTIFICATION I, Hamid R. Moghadam, certify that: 1. I have reviewed this annual report on Form 10-K of Prologis, Inc.;
2. Based on my knowledge, this report does not contain any untrue statement of a material fact or omit to state a material fact necessary to make the
statements made, in light of the circumstances under which such statements were made, not misleading with respect to the period covered by this report;
3. Based on my knowledge, the financial statements, and other financial information included in this report, fairly present in all material respects the financialcondition, results of operations and cash flows of the registrant as of, and for, the periods presented in this report;
4. The registrant’s other certifying officer and I are responsible for establishing and maintaining disclosure controls and procedures, (as defined in ExchangeAct Rules 13a-15(e) and 15d-15(e)) and internal control over financial reporting (as defined in Exchange Act Rules 13a-15(f) and 15d-15(f) for theregistrant and have:
a) Designed such disclosure controls and procedures or caused such disclosure controls and procedures to be designed under our supervision, to ensurethat material information relating to the registrant, including its consolidated subsidiaries, is made known to us by others within those entities, particularlyduring the period in which this report is being prepared;
b) Designed such internal control over financial reporting, or caused such internal control over financial reporting to be designed under our supervision, toprovide reasonable assurance regarding the reliability of financial reporting and the preparation of financial statements for external purposes inaccordance with generally accepted accounting principles;
c) Evaluated the effectiveness of the registrant’s disclosure controls and procedures and presented in this report our conclusions about the effectiveness ofthe disclosure controls and procedures as of the end of the period covered by this report based on such evaluation; and
d) Disclosed in this report any change in the registrant’s internal control over financial reporting that occurred during the registrant’s most recent fiscalquarter (the registrant’s fourth fiscal quarter in the case of an annual report) that has materially affected, or is reasonably likely to materially affect, theregistrant’s internal control over financial reporting; and
5. The registrant’s other certifying officer and I have disclosed, based on our most recent evaluation of internal control over financial reporting, to theregistrant’s auditors and the audit committee of registrant’s board of directors (or persons performing the equivalent functions):
a) All significant deficiencies and material weaknesses in the design or operation of internal control over financial reporting which are reasonably likely toadversely affect the registrant’s ability to record, process, summarize and report financial information; and
b) Any fraud, whether or not material, that involves management or other employees who have a significant role in the registrant’s internal control overfinancial reporting.
Dated: February 15, 2018 By: /s/ Hamid R. Moghadam Name: Hamid R. Moghadam Title: Chief Executive Officer

EXHIBIT 31.2
CERTIFICATION I, Thomas S. Olinger, certify that: 1. I have reviewed this annual report on Form 10-K of Prologis, Inc.; 2. Based on my knowledge, this report does not contain any untrue statement of a material fact or omit to state a material fact necessary to make the
statements made, in light of the circumstances under which such statements were made, not misleading with respect to the period covered by this report; 3. Based on my knowledge, the financial statements, and other financial information included in this report, fairly present in all material respects the financial
condition, results of operations and cash flows of the registrant as of, and for, the periods presented in this report; 4. The registrant’s other certifying officer and I are responsible for establishing and maintaining disclosure controls and procedures, (as defined in Exchange
Act Rules 13a-15(e) and 15d-15(e)) and internal control over financial reporting (as defined in Exchange Act Rules 13a-15(f) and 15d-15(f) for theregistrant and have:
a) Designed such disclosure controls and procedures or caused such disclosure controls and procedures to be designed under our supervision, to ensure
that material information relating to the registrant, including its consolidated subsidiaries, is made known to us by others within those entities, particularlyduring the period in which this report is being prepared;
b) Designed such internal control over financial reporting, or caused such internal control over financial reporting to be designed under our supervision, to
provide reasonable assurance regarding the reliability of financial reporting and the preparation of financial statements for external purposes inaccordance with generally accepted accounting principles;
c) Evaluated the effectiveness of the registrant’s disclosure controls and procedures and presented in this report our conclusions about the effectiveness of
the disclosure controls and procedures as of the end of the period covered by this report based on such evaluation; and d) Disclosed in this report any change in the registrant’s internal control over financial reporting that occurred during the registrant’s most recent fiscal
quarter (the registrant’s fourth fiscal quarter in the case of an annual report) that has materially affected, or is reasonably likely to materially affect, theregistrant’s internal control over financial reporting; and
5. The registrant’s other certifying officer and I have disclosed, based on our most recent evaluation of internal control over financial reporting, to the
registrant’s auditors and the audit committee of registrant’s board of directors (or persons performing the equivalent functions): a) All significant deficiencies and material weaknesses in the design or operation of internal control over financial reporting which are reasonably likely to
adversely affect the registrant’s ability to record, process, summarize and report financial information; and b) Any fraud, whether or not material, that involves management or other employees who have a significant role in the registrant’s internal control over
financial reporting. Dated: February 15, 2018 By: /s/ Thomas S. Olinger Name: Thomas S. Olinger Title: Chief Financial Officer

EXHIBIT 31.3
CERTIFICATION I, Hamid R. Moghadam, certify that: 1. I have reviewed this annual report on Form 10-K of Prologis, L.P.; 2. Based on my knowledge, this report does not contain any untrue statement of a material fact or omit to state a material fact necessary to make the
statements made, in light of the circumstances under which such statements were made, not misleading with respect to the period covered by this report; 3. Based on my knowledge, the financial statements, and other financial information included in this report, fairly present in all material respects the financial
condition, results of operations and cash flows of the registrant as of, and for, the periods presented in this report; 4. The registrant’s other certifying officer and I are responsible for establishing and maintaining disclosure controls and procedures, (as defined in Exchange
Act Rules 13a-15(e) and 15d-15(e)) and internal control over financial reporting (as defined in Exchange Act Rules 13a-15(f) and 15d-15(f) for theregistrant and have:
a) Designed such disclosure controls and procedures or caused such disclosure controls and procedures to be designed under our supervision, to ensure
that material information relating to the registrant, including its consolidated subsidiaries, is made known to us by others within those entities, particularlyduring the period in which this report is being prepared;
b) Designed such internal control over financial reporting, or caused such internal control over financial reporting to be designed under our supervision, to
provide reasonable assurance regarding the reliability of financial reporting and the preparation of financial statements for external purposes inaccordance with generally accepted accounting principles;
c) Evaluated the effectiveness of the registrant’s disclosure controls and procedures and presented in this report our conclusions about the effectiveness of
the disclosure controls and procedures as of the end of the period covered by this report based on such evaluation; and d) Disclosed in this report any change in the registrant’s internal control over financial reporting that occurred during the registrant’s most recent fiscal
quarter (the registrant’s fourth fiscal quarter in the case of an annual report) that has materially affected, or is reasonably likely to materially affect, theregistrant’s internal control over financial reporting; and
5. The registrant’s other certifying officer and I have disclosed, based on our most recent evaluation of internal control over financial reporting, to the
registrant’s auditors and the audit committee of registrant’s board of directors (or persons performing the equivalent functions): a) All significant deficiencies and material weaknesses in the design or operation of internal control over financial reporting which are reasonably likely to
adversely affect the registrant’s ability to record, process, summarize and report financial information; and b) Any fraud, whether or not material, that involves management or other employees who have a significant role in the registrant’s internal control over
financial reporting. Dated: February 15, 2018 By: /s/ Hamid R. Moghadam Name: Hamid R. Moghadam Title: Chief Executive Officer

EXHIBIT 31.4
CERTIFICATION I, Thomas S. Olinger, certify that: 1. I have reviewed this annual report on Form 10-K of Prologis, L.P.; 2. Based on my knowledge, this report does not contain any untrue statement of a material fact or omit to state a material fact necessary to make the
statements made, in light of the circumstances under which such statements were made, not misleading with respect to the period covered by this report; 3. Based on my knowledge, the financial statements, and other financial information included in this report, fairly present in all material respects the financial
condition, results of operations and cash flows of the registrant as of, and for, the periods presented in this report; 4. The registrant’s other certifying officer and I are responsible for establishing and maintaining disclosure controls and procedures, (as defined in Exchange
Act Rules 13a-15(e) and 15d-15(e)) and internal control over financial reporting (as defined in Exchange Act Rules 13a-15(f) and 15d-15(f) for theregistrant and have:
a) Designed such disclosure controls and procedures or caused such disclosure controls and procedures to be designed under our supervision, to ensure
that material information relating to the registrant, including its consolidated subsidiaries, is made known to us by others within those entities, particularlyduring the period in which this report is being prepared;
b) Designed such internal control over financial reporting, or caused such internal control over financial reporting to be designed under our supervision, to
provide reasonable assurance regarding the reliability of financial reporting and the preparation of financial statements for external purposes inaccordance with generally accepted accounting principles;
c) Evaluated the effectiveness of the registrant’s disclosure controls and procedures and presented in this report our conclusions about the effectiveness of
the disclosure controls and procedures as of the end of the period covered by this report based on such evaluation; and d) Disclosed in this report any change in the registrant’s internal control over financial reporting that occurred during the registrant’s most recent fiscal
quarter (the registrant’s fourth fiscal quarter in the case of an annual report) that has materially affected, or is reasonably likely to materially affect, theregistrant’s internal control over financial reporting; and
5. The registrant’s other certifying officer and I have disclosed, based on our most recent evaluation of internal control over financial reporting, to the
registrant’s auditors and the audit committee of registrant’s board of directors (or persons performing the equivalent functions): a) All significant deficiencies and material weaknesses in the design or operation of internal control over financial reporting which are reasonably likely to
adversely affect the registrant’s ability to record, process, summarize and report financial information; and b) Any fraud, whether or not material, that involves management or other employees who have a significant role in the registrant’s internal control over
financial reporting. Dated: February 15, 2018 By: /s/ Thomas S. Olinger Name: Thomas S. Olinger Title: Chief Financial Officer

EXHIBIT 32.1
CERTIFICATION Pursuant to Section 906 of the Sarbanes-Oxley Act of 2002, each of the undersigned officers of Prologis, Inc. (the “Company”), hereby certifies, to such officer’sknowledge, that the Company’s Annual Report on Form 10-K for the annual period ended December 31, 2017 (the “Report”), which accompanies thesecertifications, fully complies with the requirements of Section 13(a) of the Securities Exchange Act of 1934, as amended and that the information contained in theReport fairly presents, in all material respects, the financial condition and results of operations of the Company. Dated: February 15, 2018 By: /s/ Hamid R. Moghadam Name: Hamid R. Moghadam Title: Chief Executive Officer Dated: February 15, 2018 By: /s/ Thomas S. Olinger Name: Thomas S. Olinger Title: Chief Financial Officer

EXHIBIT 32.2
CERTIFICATION Pursuant to Section 906 of the Sarbanes-Oxley Act of 2002, each of the undersigned officers of Prologis, L.P. (the “Company”), hereby certifies, to such officer’sknowledge, that the Company’s Annual Report on Form 10-K for the annual period ended December 31, 2017 (the “Report”), which accompanies thesecertifications, fully complies with the requirements of Section 13(a) of the Securities Exchange Act of 1934, as amended and that the information contained in theReport fairly presents, in all material respects, the financial condition and results of operations of the Company. Dated: February 15, 2018 By: /s/ Hamid R. Moghadam Name: Hamid R. Moghadam Title: Chief Executive Officer Dated: February 15, 2018 By: /s/ Thomas S. Olinger Name: Thomas S. Olinger Title: Chief Financial Officer