Embed Size (px)
DESCRIPTION
Media Market Overview - Cormac O’Shea, Clear Blue Water
Citation preview

Welcome!
Housekeeping
Thank yous

Cormac O’Shea

Media Market Overview
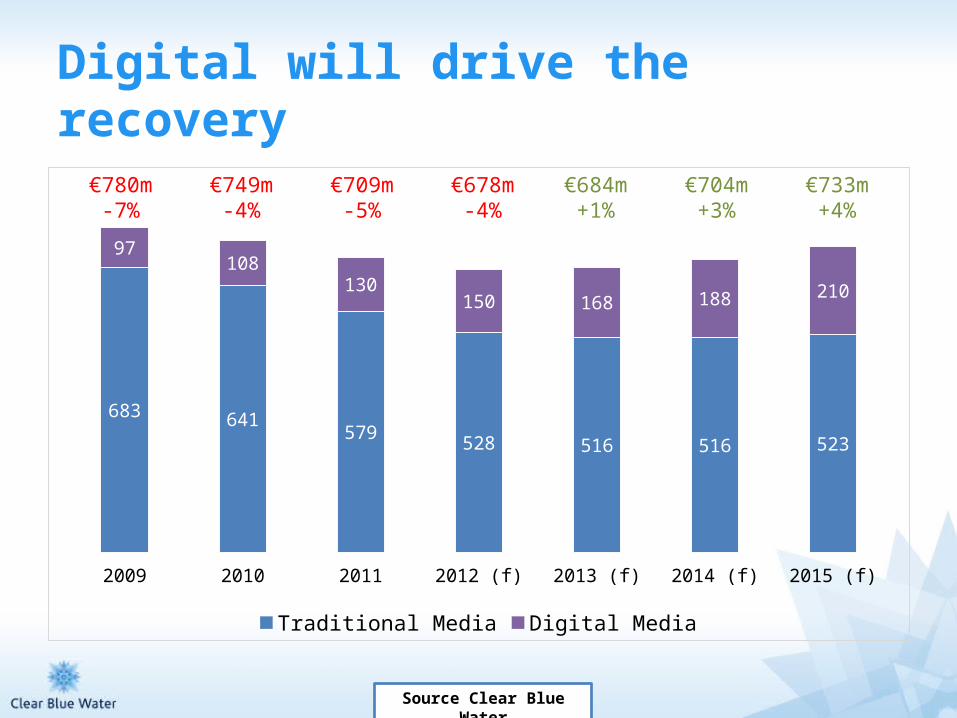
Digital will drive the recovery
2009 2010 2011 2012 (f) 2013 (f) 2014 (f) 2015 (f)
683 641579 528 516 516 523
97108
130150 168 188 210
Traditional Media Digital Media
€709m-5%
€678m-4%
€684m+1%
€704m+3%
€780m-7%
€749m-4%
€733m+4%
Source Clear Blue Water

Value
+2 to 5%

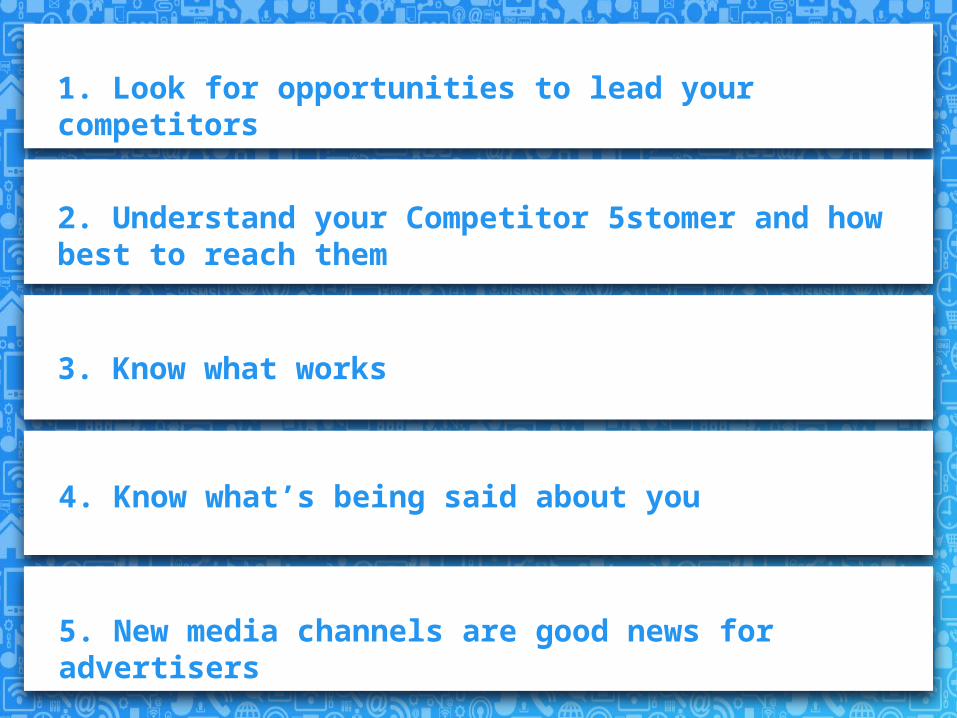
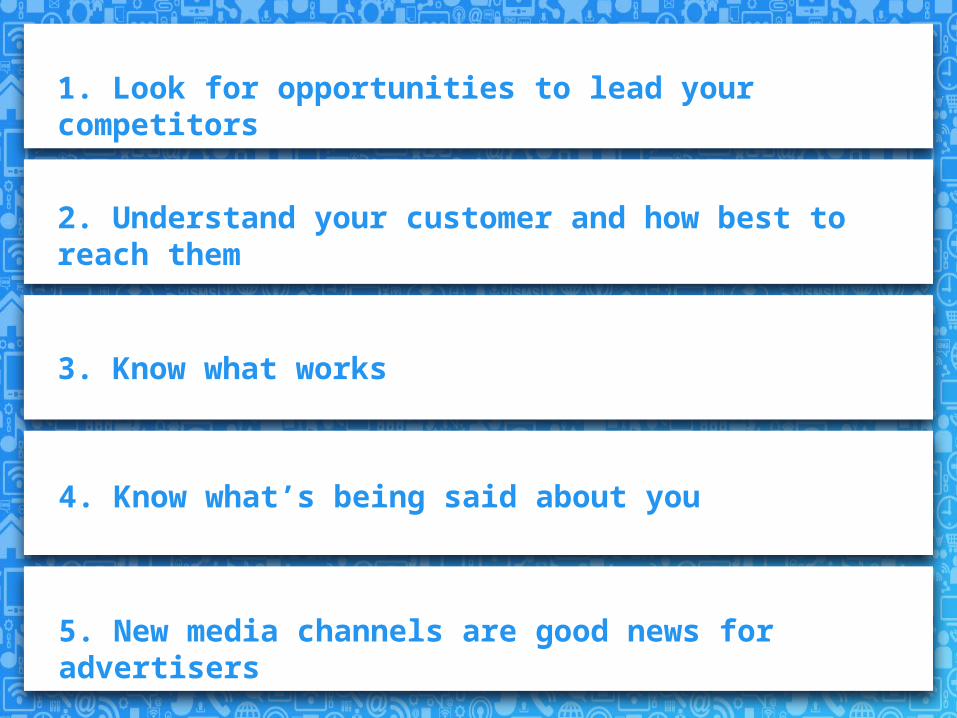
1. Look for opportunities to lead your competitors
2. Understand your Competitor 5stomer and how best to reach them
3. Know what works
4. Know what’s being said about you
5. New media channels are good news for advertisers

1

Look for opportunities to lead your competitors
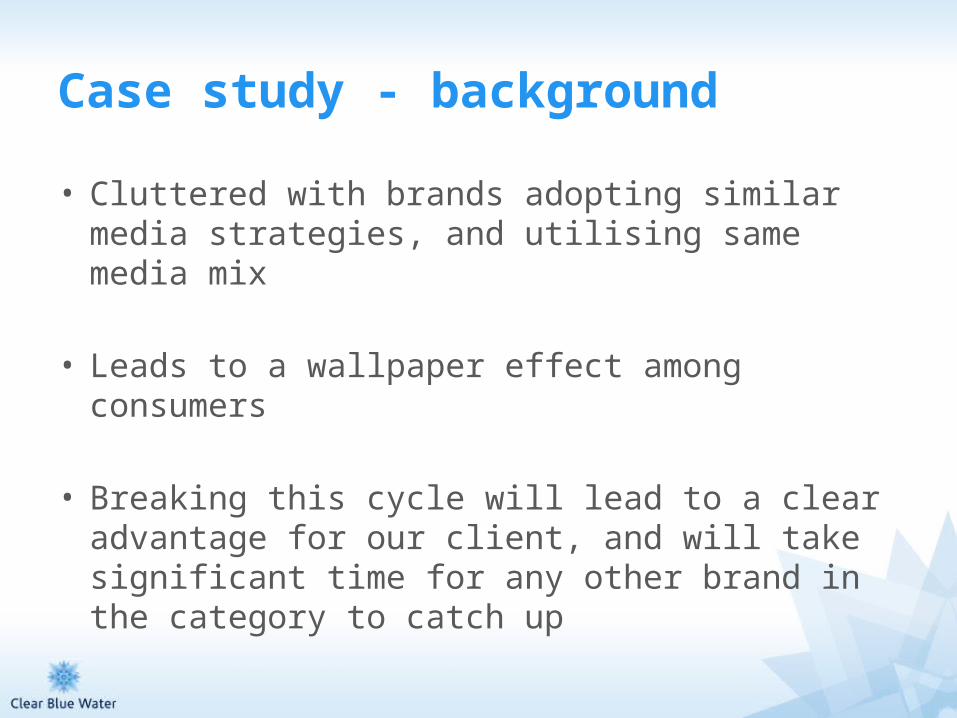
Case study - background
• Cluttered with brands adopting similar media strategies, and utilising same media mix
• Leads to a wallpaper effect among consumers
• Breaking this cycle will lead to a clear advantage for our client, and will take significant time for any other brand in the category to catch up
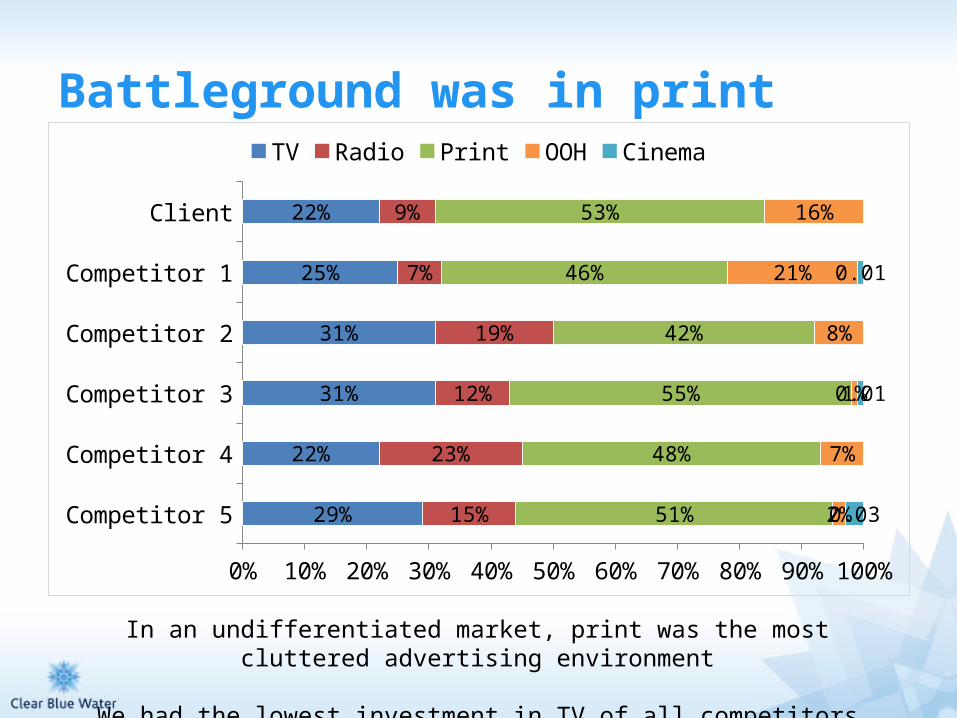
Battleground was in print
Competitor 5
Competitor 4
Competitor 3
Competitor 2
Competitor 1
Client
0% 10% 20% 30% 40% 50% 60% 70% 80% 90% 100%
29%
22%
31%
31%
25%
22%
15%
23%
12%
19%
7%
9%
51%
48%
55%
42%
46%
53%
2%
7%
1%
8%
21%
16%
0.03
0.01
0.01
TV Radio Print OOH Cinema
In an undifferentiated market, print was the most cluttered advertising environment
We had the lowest investment in TV of all competitors
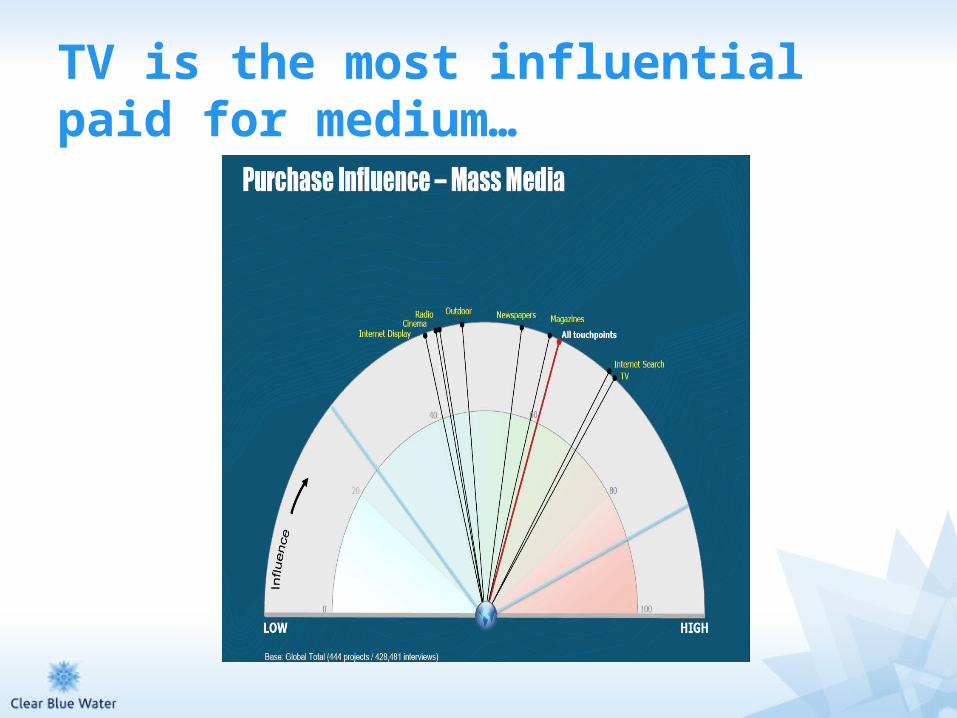
TV is the most influential paid for medium…
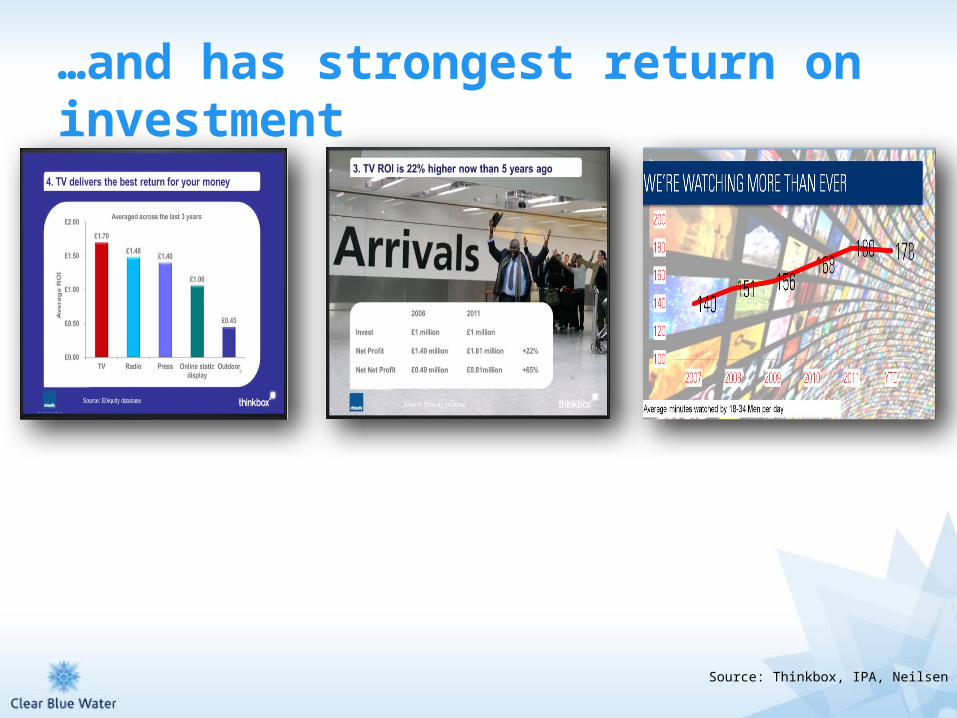
…and has strongest return on investment
Source: Thinkbox, IPA, Neilsen

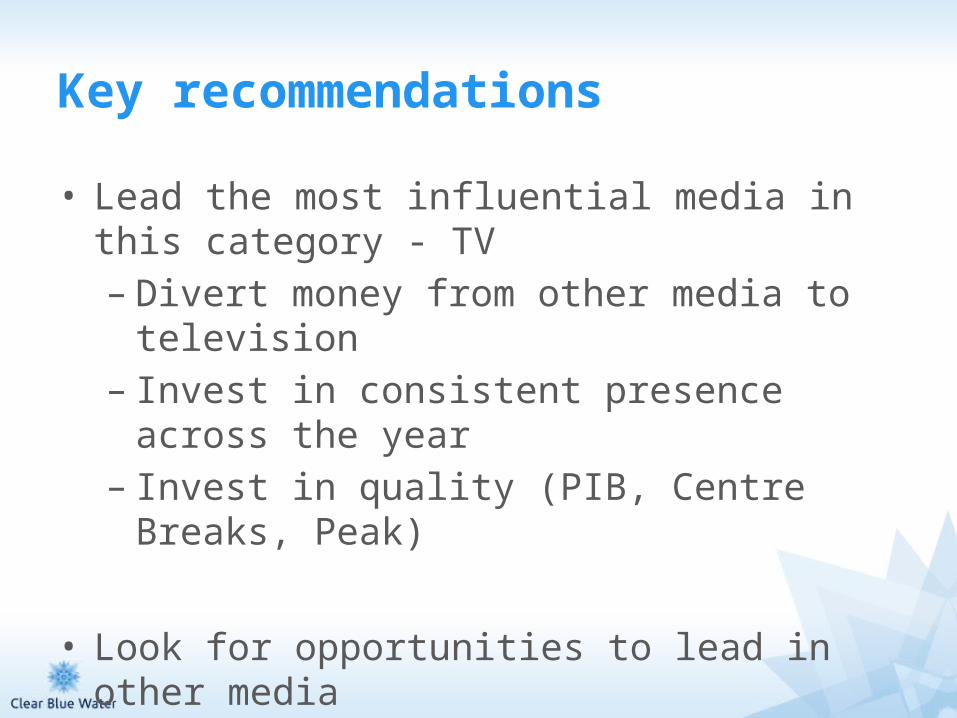
Key recommendations
• Lead the most influential media in this category - TV– Divert money from other media to television– Invest in consistent presence across the year– Invest in quality (PIB, Centre Breaks, Peak)
• Look for opportunities to lead in other media
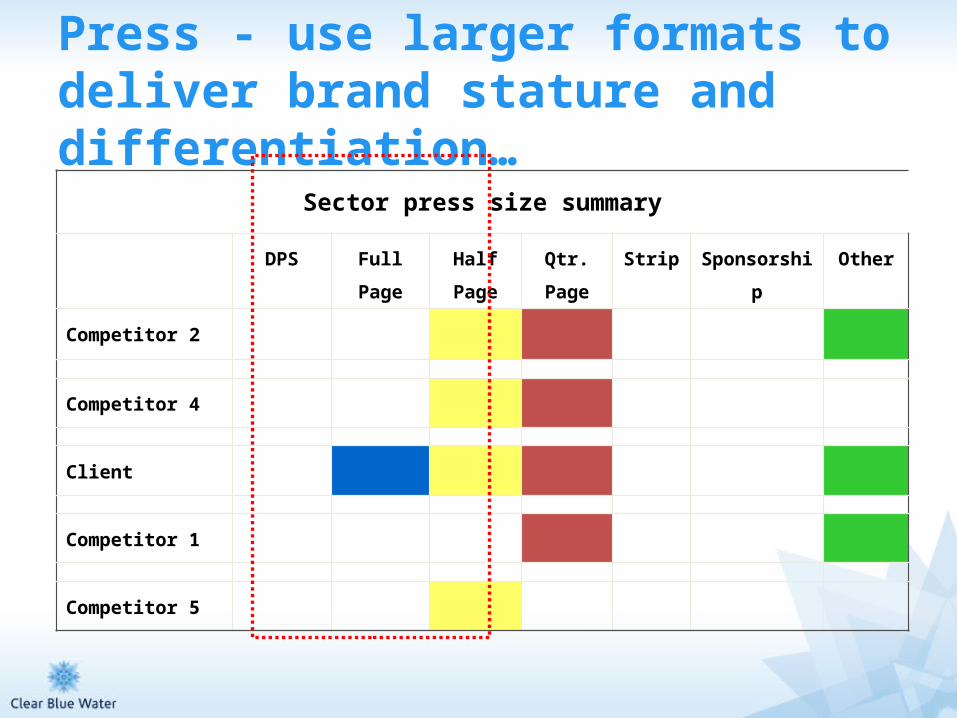
Press - use larger formats to deliver brand stature and differentiation…
Sector press size summary
DPS Full Page Half Page Qtr. Page Strip Sponsorship Other
Competitor 2
Competitor 4
Client
Competitor 1
Competitor 5
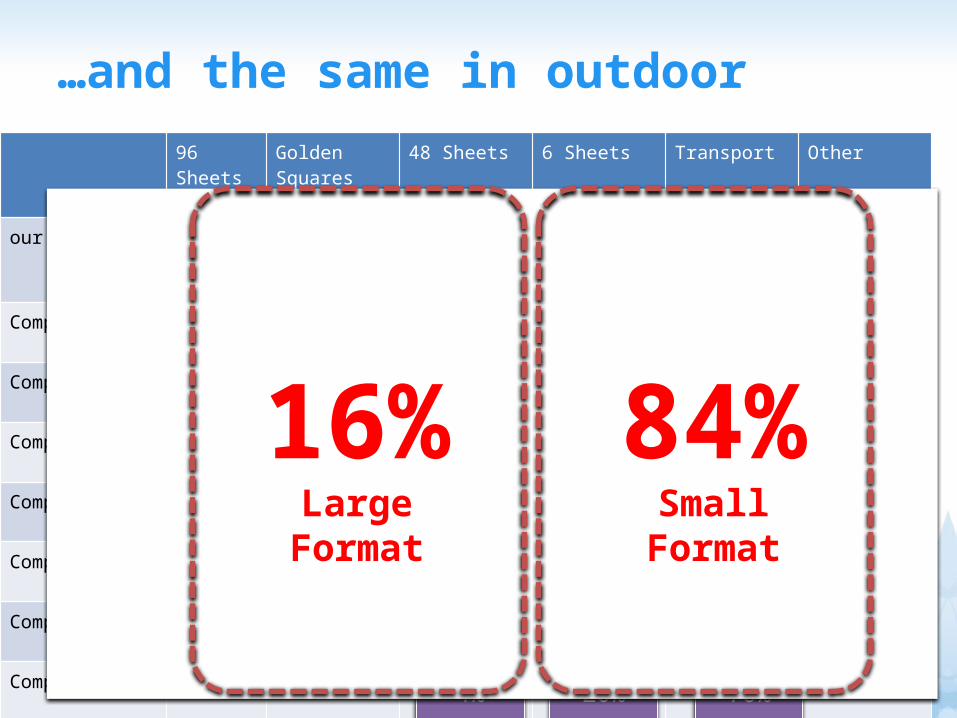
…and the same in outdoor96 Sheets Golden
Squares48 Sheets 6 Sheets Transport Other
our client
Competitor 1
Competitor 2
Competitor 4
Competitor 5
Competitor 6
Competitor 3
Competitor 7
1% 35% 34% 11% 18%
17% 2% 80%
10% 67% 19% 4%
45% 23% 32%
1% 42% 2%55%
46% 54%
4% 20% 76%
5% 3% 4% 89%
1% 35% 34% 11% 18%
17% 2% 80%
10% 67% 19% 4%
45% 23% 32%
1% 42% 2%55%
46% 54%
4% 20% 76%
5% 3% 4% 89%
16%Large
Format
84%Small
Format
What happened?
Consideration increased by 12% over the yearShare of market increased by 1.4% over the year

2

Understand your customer and how best to reach them

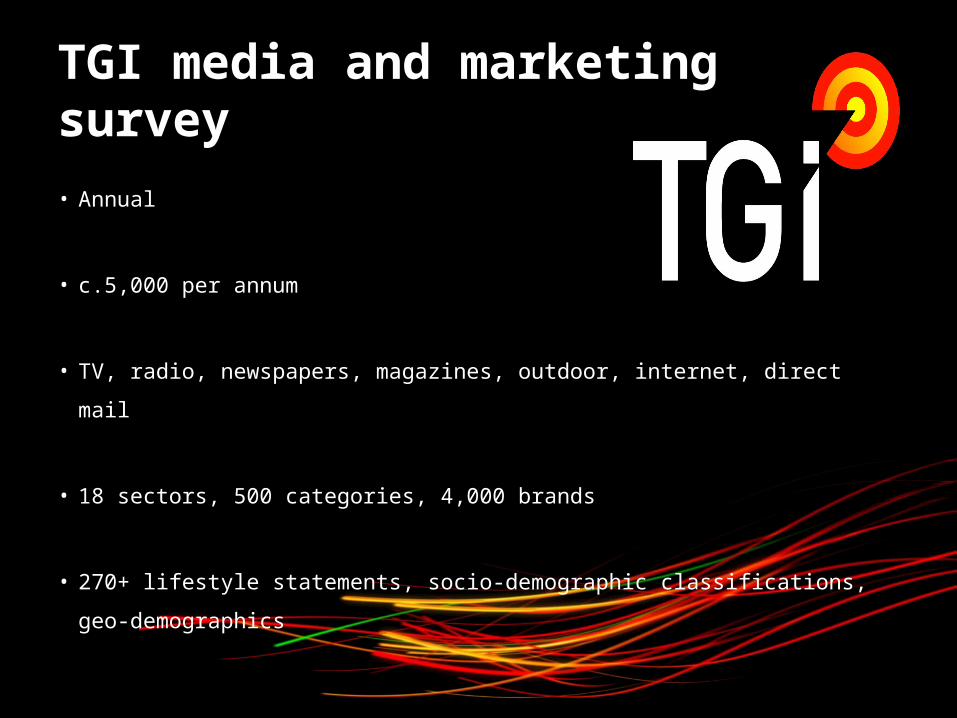
TGI media and marketing survey
• Annual
• c.5,000 per annum
• TV, radio, newspapers, magazines, outdoor, internet, direct mail
• 18 sectors, 500 categories, 4,000 brands
• 270+ lifestyle statements, socio-demographic classifications, geo-demographics
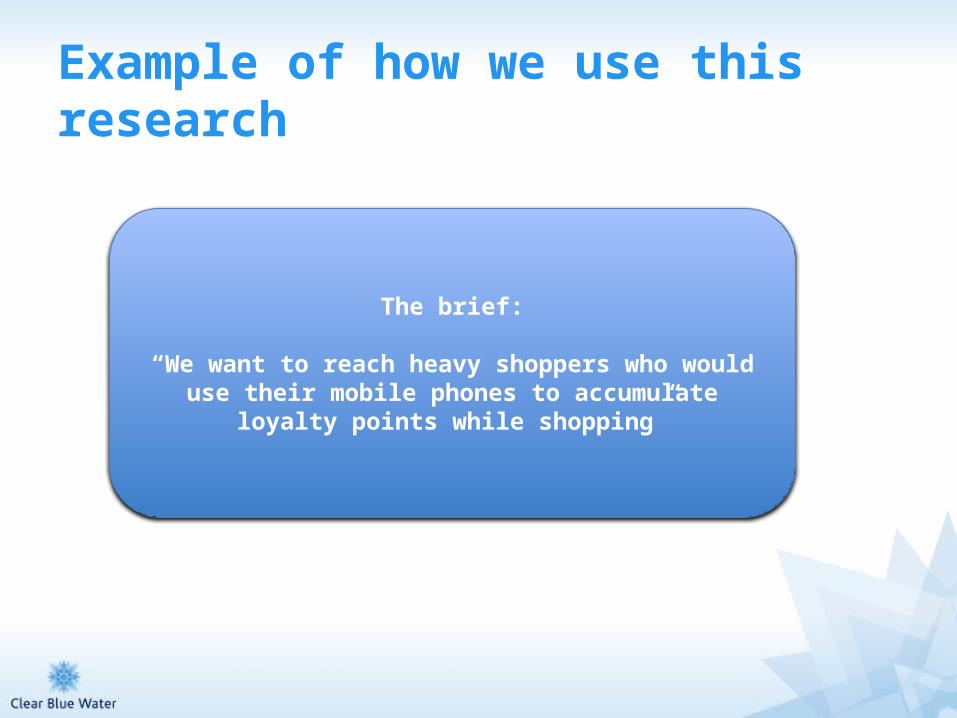
Example of how we use this research
The brief:
“We want to reach heavy shoppers who would use their mobile phones to accumulate loyalty points while shopping”
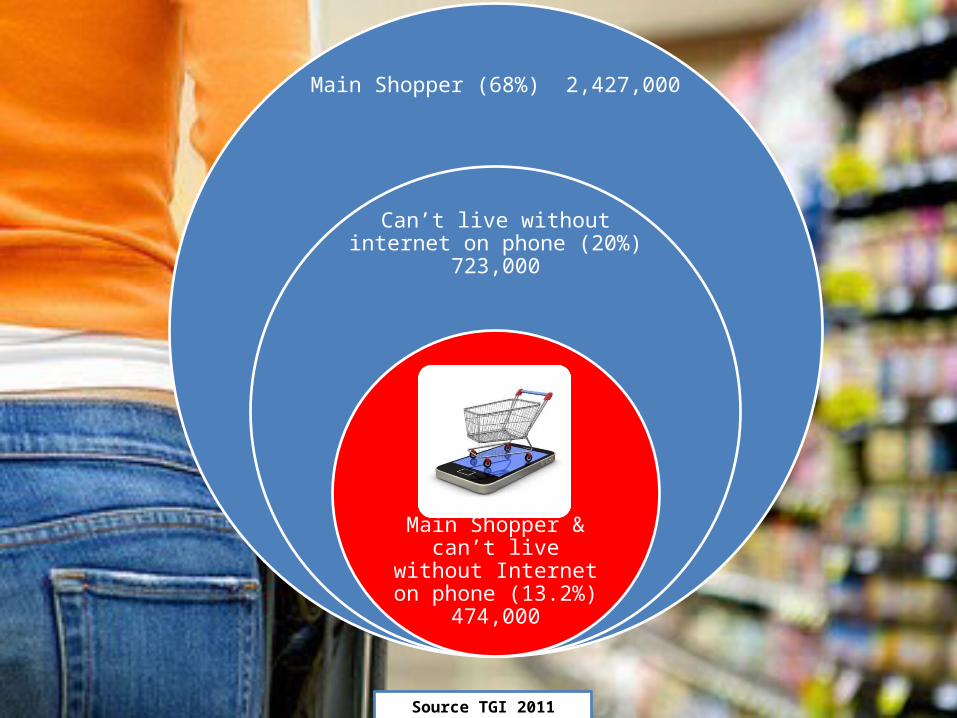
Main Shopper (68%) 2,427,000
Can’t live without internet on phone
(20%) 723,000
Main Shopper & can’t live without Internet on phone (13.2%) 474,000
Source TGI 2011
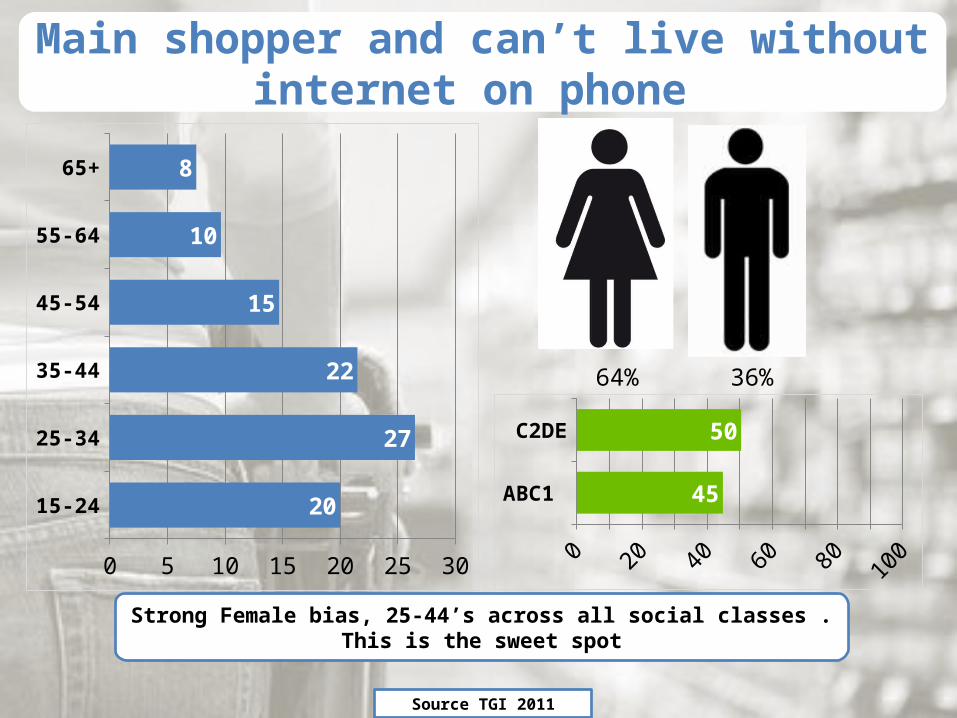
15-24
25-34
35-44
45-54
55-64
65+
0 5 10 15 20 25 30
20
27
22
15
10
8
ABC1
C2DE
0 10 20 30 40 50 60 70 80 90 100
45
50
64% 36%
Strong Female bias, 25-44’s across all social classes . This is the sweet spot
Main shopper and can’t live without internet on phone
Source TGI 2011

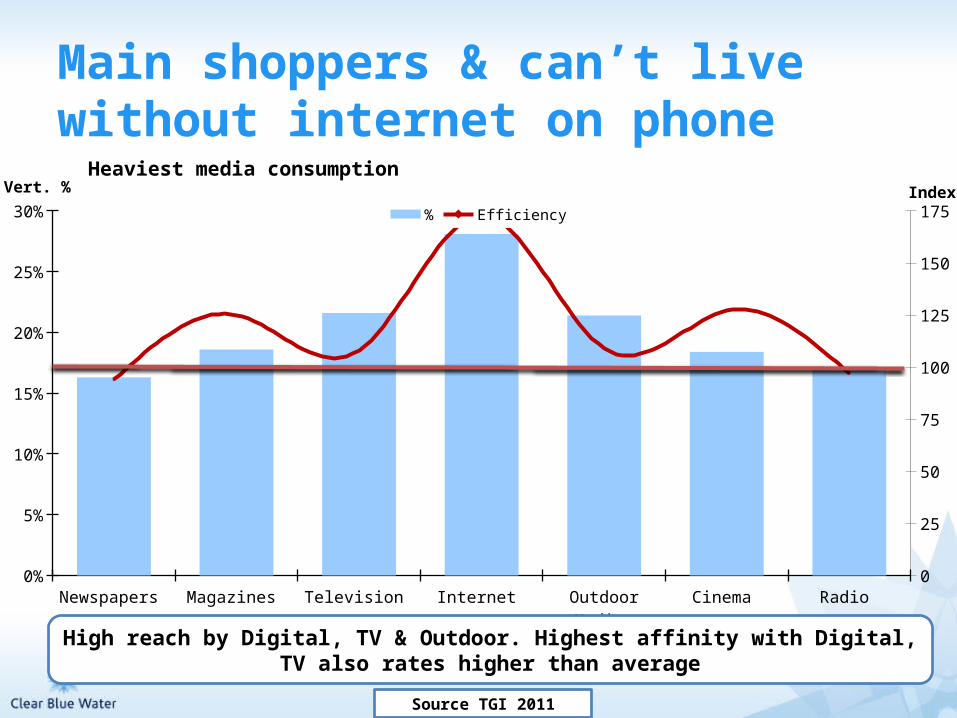
Newspapers Magazines Television Internet Outdoor Media Cinema Radio 0%
5%
10%
15%
20%
25%
30%
0
25
50
75
100
125
150
175
Heaviest media consumption
% EfficiencyVert. % Index
High reach by Digital, TV & Outdoor. Highest affinity with Digital, TV also rates higher than average
Source TGI 2011
Main shoppers & can’t live without internet on phone
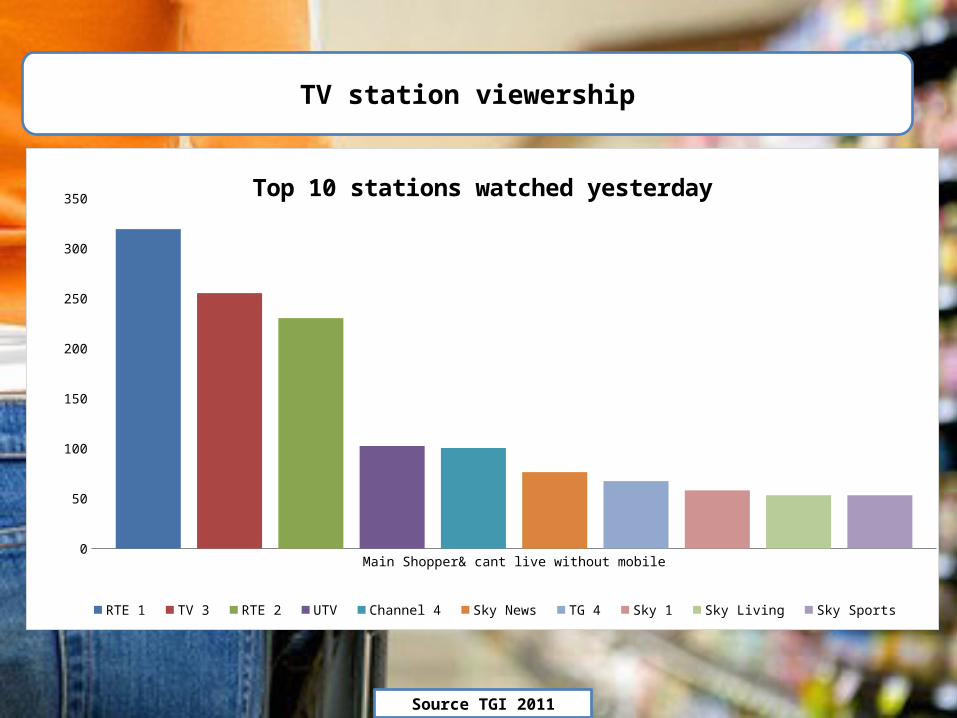
Main Shopper& cant live without mobile0
50
100
150
200
250
300
350Top 10 stations watched yesterday
RTE 1 TV 3 RTE 2 UTV Channel 4 Sky News TG 4 Sky 1 Sky Living Sky Sports
TV station viewership
Source TGI 2011
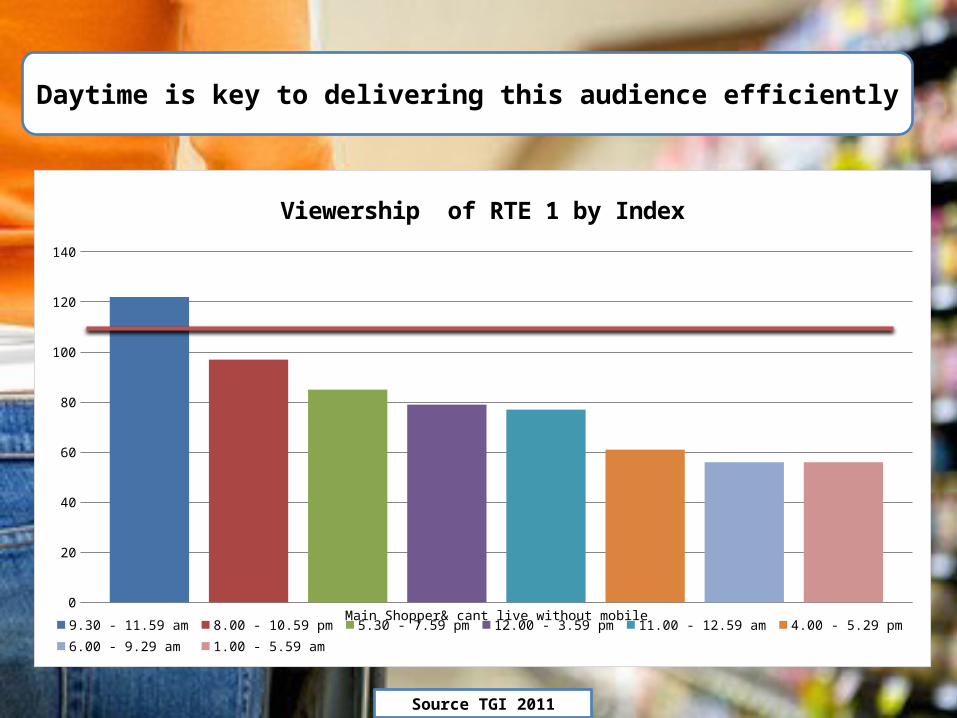
Daytime is key to delivering this audience efficiently
Main Shopper& cant live without mobile0
20
40
60
80
100
120
140
Viewership of RTE 1 by Index
9.30 - 11.59 am 8.00 - 10.59 pm 5.30 - 7.59 pm 12.00 - 3.59 pm 11.00 - 12.59 am 4.00 - 5.29 pm 6.00 - 9.29 am 1.00 - 5.59 am
Source TGI 2011
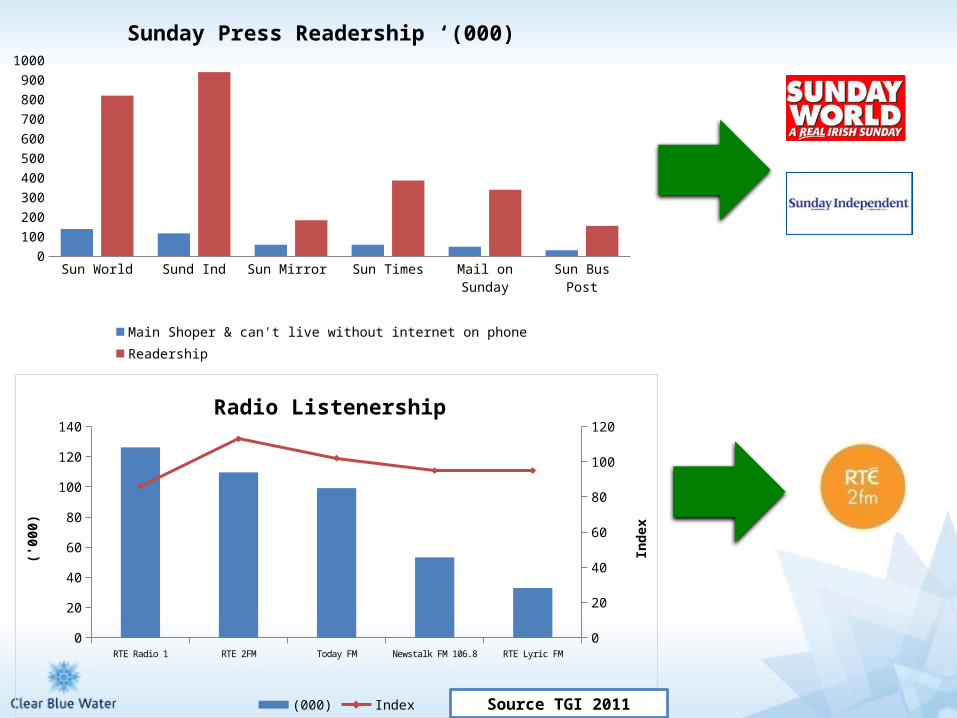
Sun World Sund Ind Sun Mirror Sun Times Mail on Sunday Sun Bus Post0
100
200
300
400
500
600
700
800
900
1000
Sunday Press Readership ‘(000)
Main Shoper & can't live without internet on phone Readership
RTE Radio 1 RTE 2FM Today FM Newstalk FM 106.8 RTE Lyric FM0
20
40
60
80
100
120
140
0
20
40
60
80
100
120
Radio Listenership
(000) Index
('000
)
Inde
x
Source TGI 2011

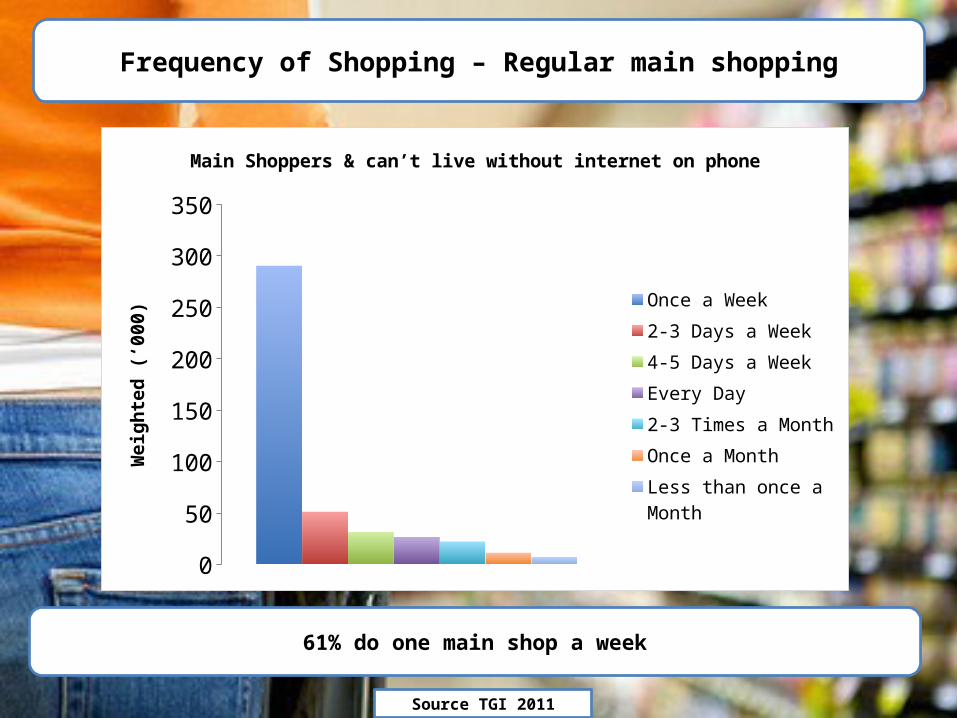
Frequency of Shopping – Regular main shopping
61% do one main shop a week
0
50
100
150
200
250
300
350
Main Shoppers & can’t live without internet on phone
Once a Week
2-3 Days a Week
4-5 Days a Week
Every Day
2-3 Times a Month
Once a Month
Less than once a Month
Wei
ghte
d (‘0
00)
Source TGI 2011
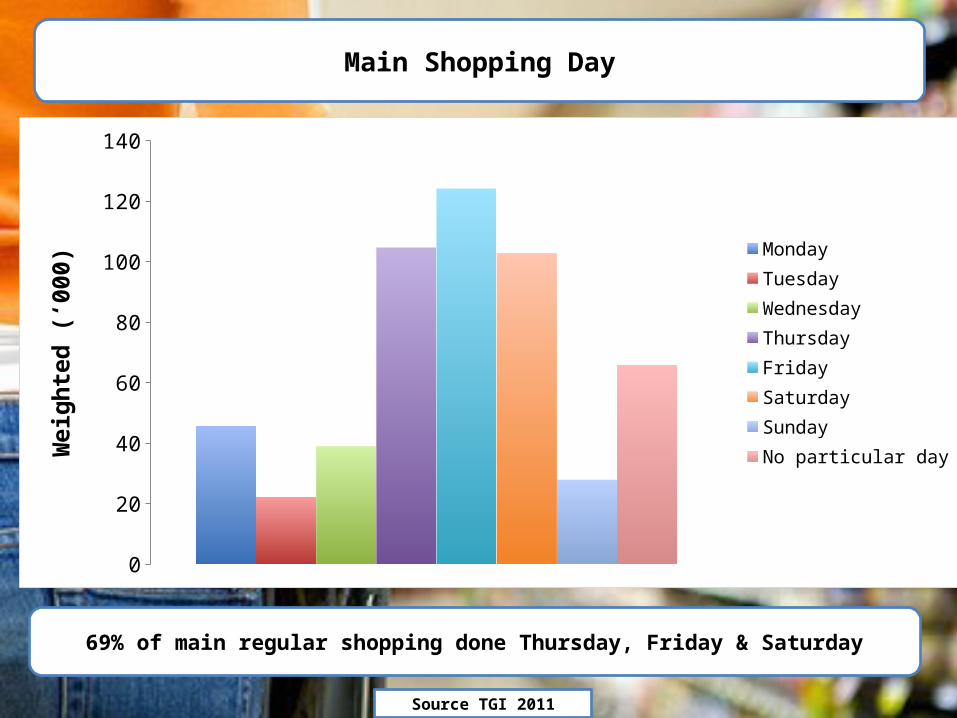
Main Shopping Day
69% of main regular shopping done Thursday, Friday & Saturday
0
20
40
60
80
100
120
140
MondayTuesdayWednesdayThursdayFridaySaturdaySundayNo particular dayW
eigh
ted
(‘000
)
Source TGI 2011

3

Know what works

Which elements of your marketing mix work?
Econometric modelling - relates the size and timings of different marketing mix activity to movements in sales
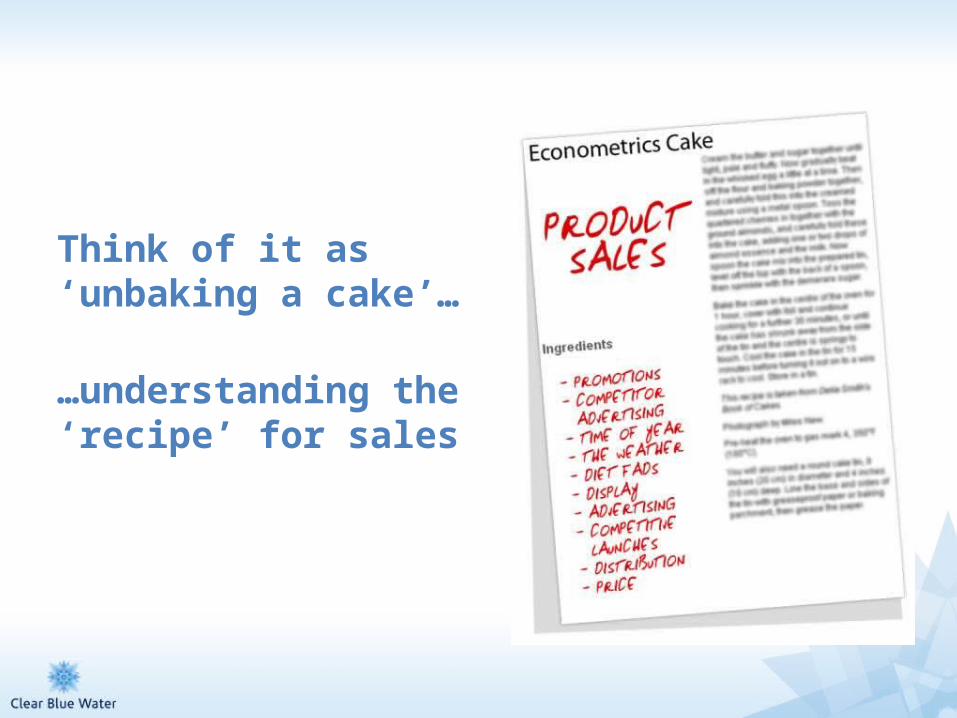
Think of it as ‘unbaking a cake’…
…understanding the ‘recipe’ for sales
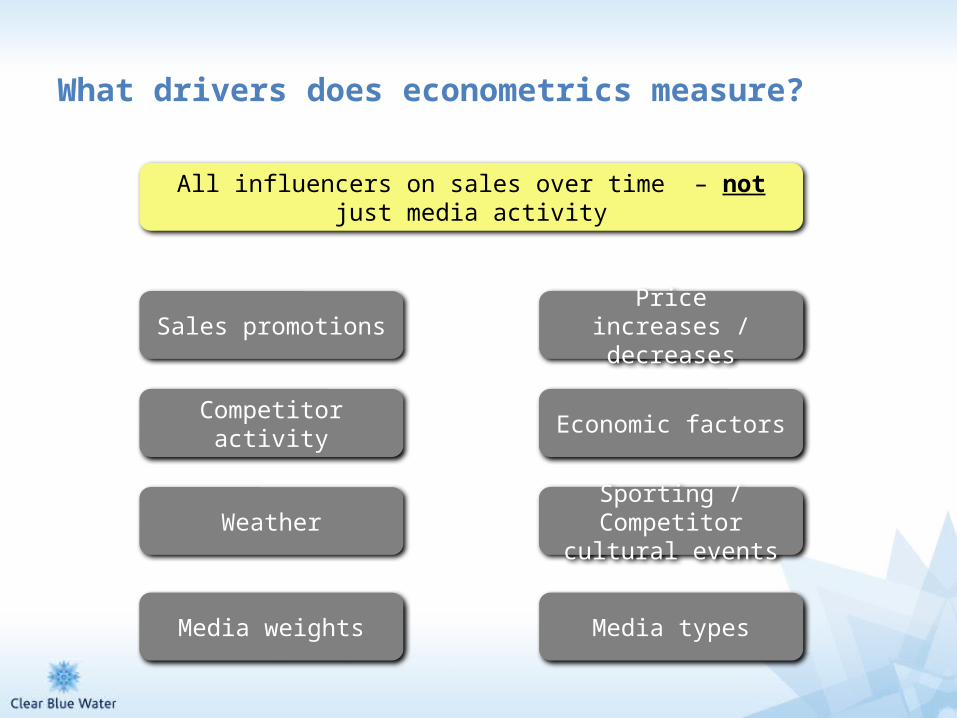
What drivers does econometrics measure?
Sales promotions
Competitor activity
Media weights
Economic factors
Weather Sporting / Competitor cultural events
All influencers on sales over time – not just media activity
Media types
Price increases / decreases
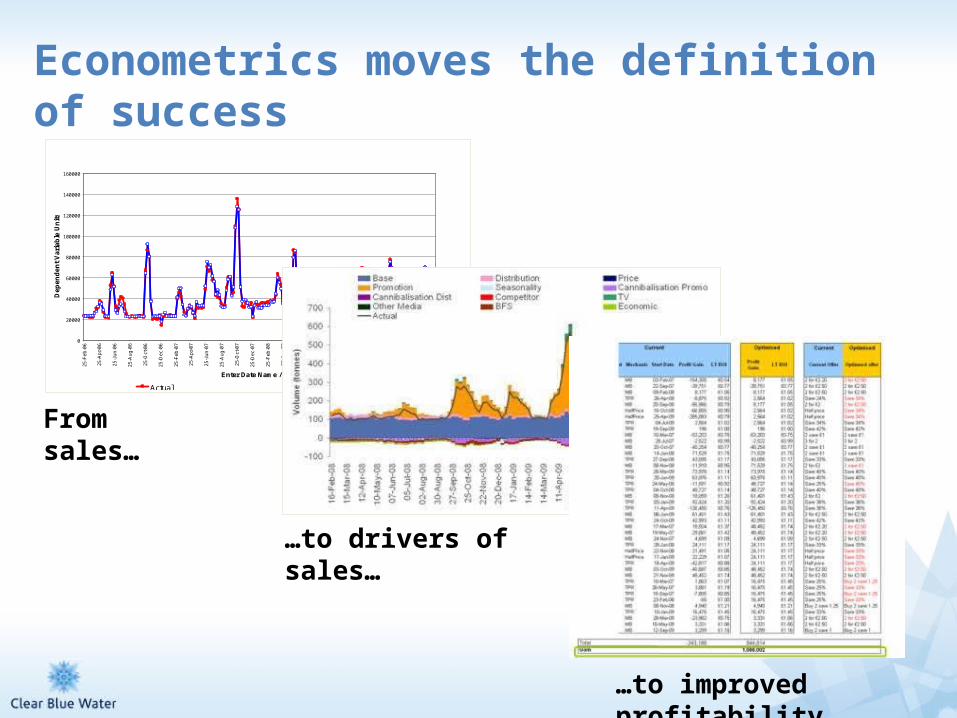
Econometrics moves the definition of success
0
20000
40000
60000
80000
100000
120000
140000
160000
25
-Fe
b-0
6
25
-Ap
r-0
6
25
-Ju
n-0
6
25
-Au
g-0
6
25
-Oct
-06
25
-De
c-0
6
25
-Fe
b-0
7
25
-Ap
r-0
7
25
-Ju
n-0
7
25
-Au
g-0
7
25
-Oct
-07
25
-De
c-0
7
25
-Fe
b-0
8
25
-Ap
r-0
8
25
-Ju
n-0
8
25
-Au
g-0
8
25
-Oct
-08
25
-De
c-0
8
25
-Fe
b-0
9
25
-Ap
r-0
9
25
-Ju
n-0
9
25
-Au
g-0
9
25
-Oct
-09
25
-De
c-0
9
Enter Date Name / Type
Dep
en
den
t V
ari
ab
le U
nit
s
Actual Model
Sum of Fitted Regions
Real
From sales…
…to drivers of sales…
…to improved profitability
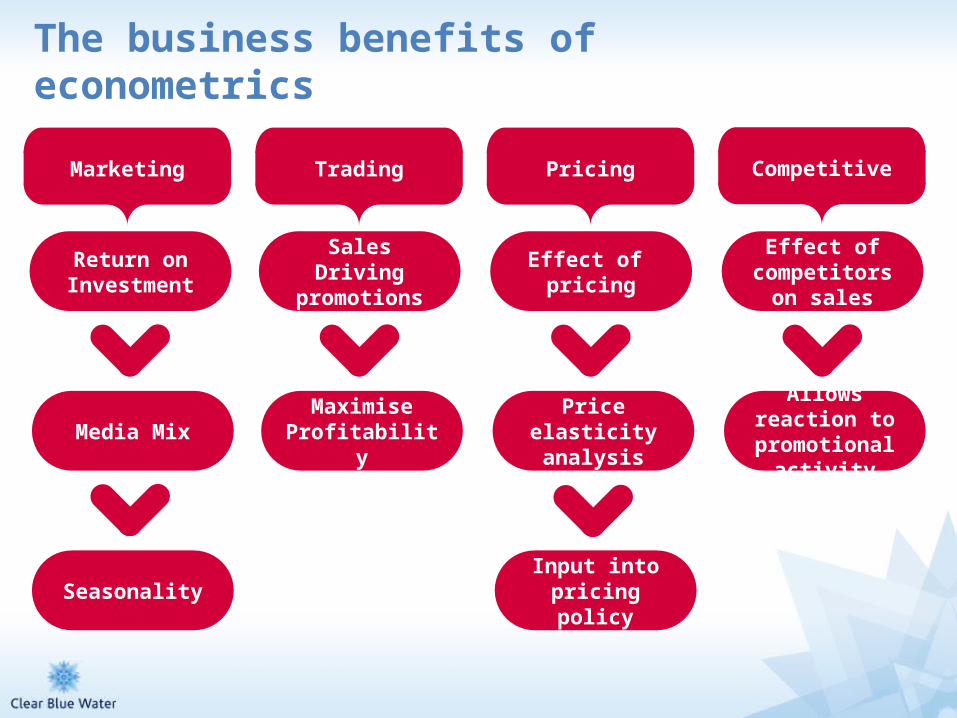
The business benefits of econometrics
Marketing Trading Pricing Competitive
Return on Investment
Media Mix
Seasonality
Sales Driving promotions
Maximise Profitability
Effect of pricing
Price elasticity analysis
Input into pricing policy
Effect of competitors
on sales
Allows reaction to promotional
activity
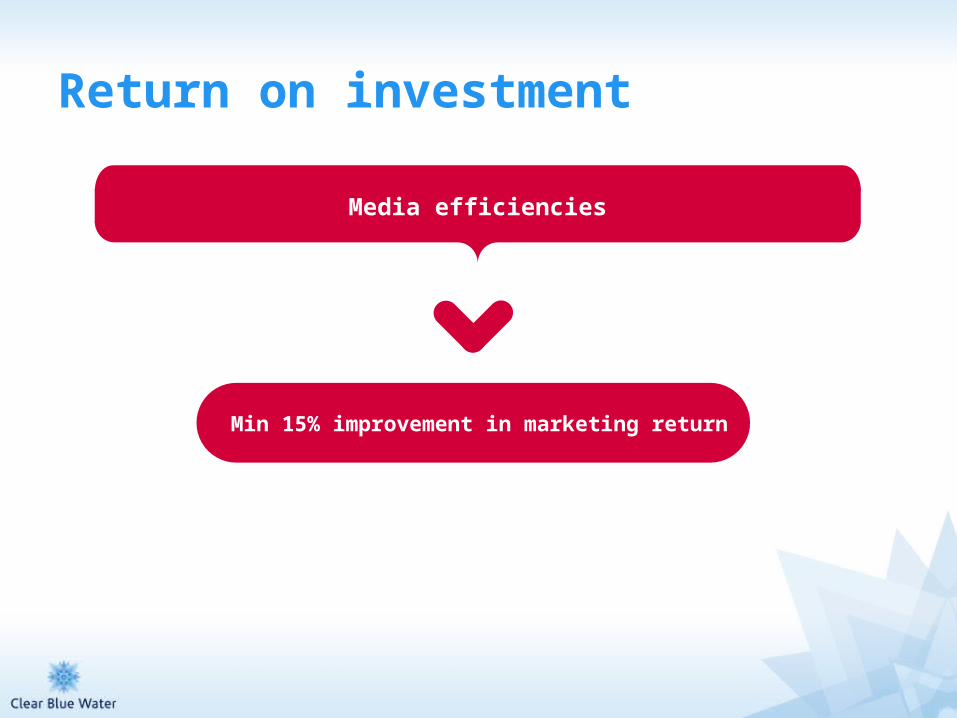
Return on investment
Media efficiencies
Min 15% improvement in marketing return

4

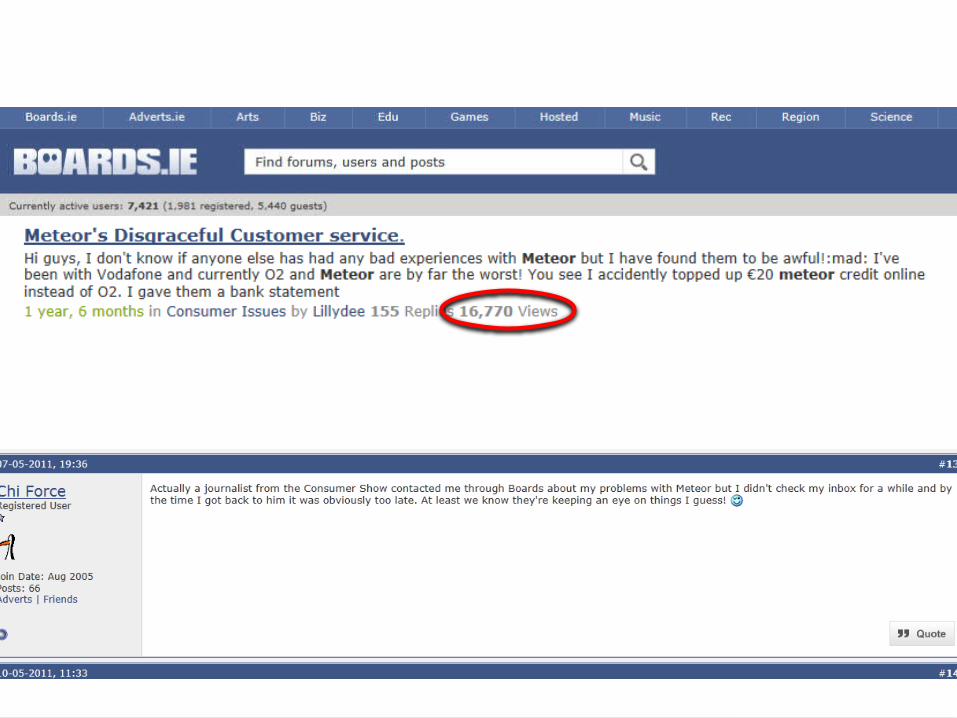
Know what’s being said about you


Pre digital age
Family and friendsPotential reach - 10-20

Digital age
Family and friendsPotential reach - 100’s

Digital age
Forums, blogs etc.Potential reach – 1,000’s ++


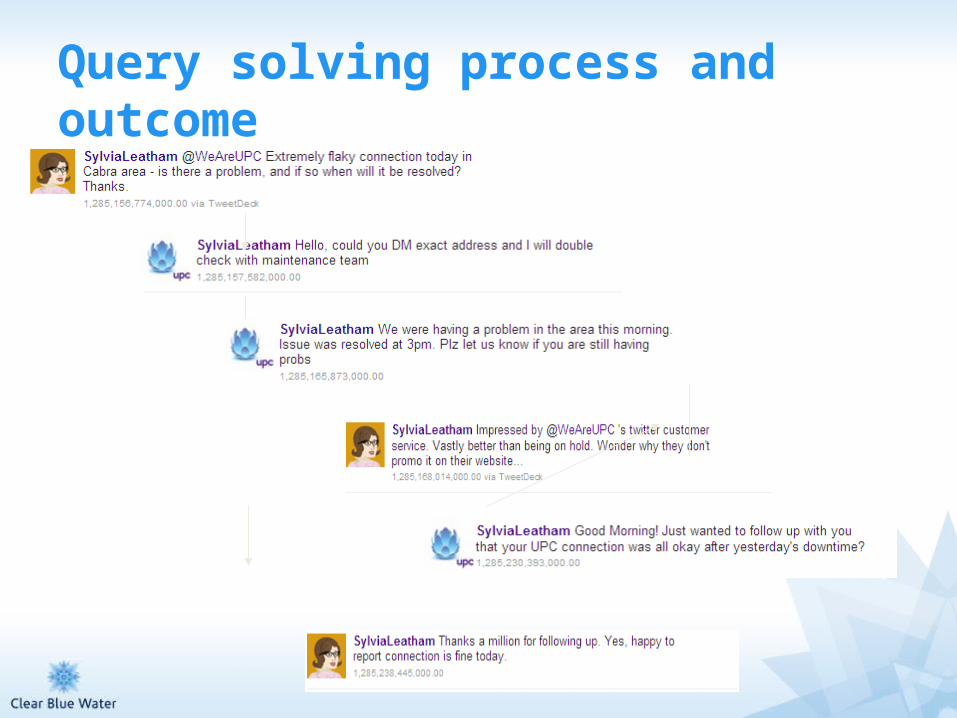
Query solving process and outcome

5

New media channels are good for advertisers
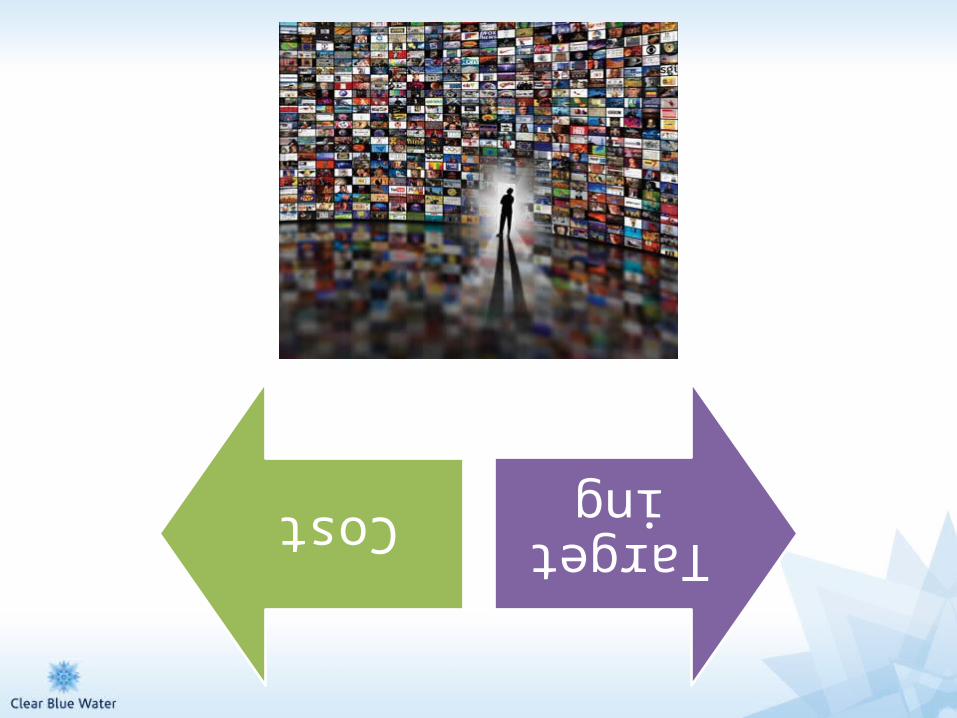
CostTargetin
g
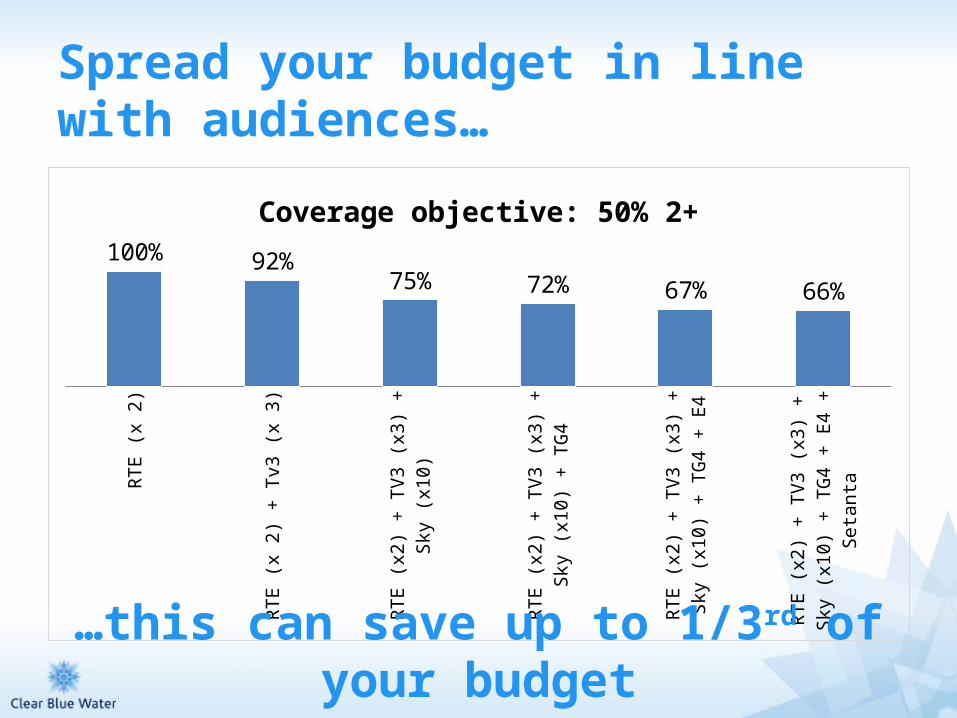
Spread your budget in line with audiences…
RTE
(x 2
)
RTE
(x 2
) + T
v3 (x
3)
RTE
(x2)
+ T
V3 (x
3) +
Sky
(x10
)
RTE
(x2)
+ T
V3 (x
3) +
Sky
(x10
) +
TG4
RTE
(x2)
+ T
V3 (x
3) +
Sky
(x10
) +
TG4
+ E4
RTE
(x2)
+ T
V3 (x
3) +
Sky
(x10
) +
TG4
+ E4
+ S
etan
ta
100% 92%75% 72% 67% 66%
Coverage objective: 50% 2+
…this can save up to 1/3rd of your budget
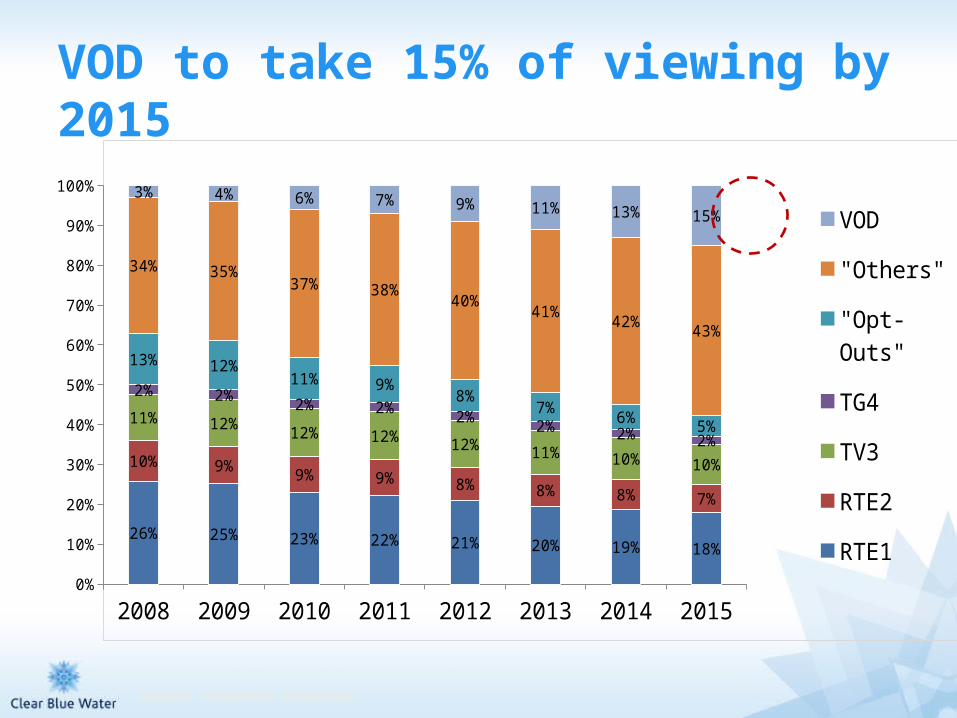
VOD to take 15% of viewing by 2015
2008 2009 2010 2011 2012 2013 2014 20150%
10%
20%
30%
40%
50%
60%
70%
80%
90%
100%
26% 25% 23% 22% 21% 20% 19% 18%
10% 9% 9% 9% 8% 8% 8% 7%
11% 12% 12% 12% 12% 11% 10% 10%
2% 2% 2% 2% 2% 2% 2% 2%
13% 12%11% 9%
8%7%
6% 5%
34% 35%37% 38%
40%41%
42% 43%
3% 4% 6% 7% 9% 11% 13% 15% VOD
"Others"
"Opt-Outs"
TG4
TV3
RTE2
RTE1
Source: MediaVest estimates
1. Look for opportunities to lead your competitors
2. Understand your customer and how best to reach them
3. Know what works
4. Know what’s being said about you
5. New media channels are good news for advertisers