Embed Size (px)
Citation preview
Food Policy 48 (2014) 168–181
brought to you by COREView metadata, citation and similar papers at core.ac.uk
provided by Elsevier - Publisher Connector
Contents lists available at ScienceDirect
Food Policy
journal homepage: www.elsevier .com/ locate/ foodpol
Mechanization in Ghana: Emerging demand, and the search foralternative supply models
http://dx.doi.org/10.1016/j.foodpol.2014.05.0130306-9192 � 2014 Published by Elsevier Ltd.
⇑ Corresponding author.E-mail addresses: [email protected] (X. Diao), [email protected] (F. Cossar),
[email protected] (N. Houssou), [email protected] (S. Kolavalli).
Open access under CC BY-NC-ND license.
Xinshen Diao a,⇑, Frances Cossar a, Nazaire Houssou a, Shashidhara Kolavalli b
a Development Strategy and Governance Division, International Food Policy Research Institute, Washington DC, USAb Development Strategy and Governance Division, Ghana Strategy Support Program, International Food Policy Research Institute, Accra, Ghana
a r t i c l e i n f o
Article history:Available online 18 June 2014
Keywords:Agricultural mechanization policyAgricultural intensificationAgribusinessGhana
a b s t r a c t
Influential studies in the 1980s and early 1990s drew on the Boserup–Ruthenberg theories of farmingsystems evolution to argue that African countries were not yet ready for widespread agriculturalmechanization. Through applying the theories of farming systems evolution and of induced innovationin technical change, this paper shows that demand for certain mechanized farming operationsparticularly plowing has emerged even among smallholders, suggesting that supply issues may nowbe the main constraint to successful mechanization. We therefore adopt a supply chain approach toanalyze two types of mechanization practices in Ghana, i.e., a recent state-led mechanization programand the private sector-led service hiring market, against an international perspective by drawing on threeAsian supply models. We identify two major flaws in existing policies. First, the agricultural mechaniza-tion service centers that the government promotes fail to use tractors services with sufficient intensity.Second, direct importation of agricultural machinery by the government inhibits imports of appropriateand affordable machinery. In contrast, the development of mechanized service hiring market in whichmedium and large scale farmers who are tractor owners provide hiring-out services to small-scalefarmers represents a promising model for sustainable mechanization in Ghana. This private sector-ledsecond model is consistent with international experiences.
� 2014 Published by Elsevier Ltd. Open access under CC BY-NC-ND license.
Introduction
Agricultural mechanization represents technology changethrough the adoption of non-human sources of power to undertakeagricultural operations such as plowing, harvesting, shelling, andplanting. Adoption of mechanization by farmers is an evolutionaryprocess influenced or induced by a set of country specific agro-cli-matic factors, economic factors and social conditions for which thegovernment’s policy choices have impact. Because of this, the liter-ature on mechanization in Africa that is dated to the 1970s and1980s focuses on evaluating governments’ early interventions inmechanization services. The consensus was that the early push inmechanization failed in Africa due to lack of economic demandfrom farmers and the fiscal burden of state-sponsored programs(Pingali et al., 1987; Mrema et al., 2008). Donors’ and governments’appetite for mechanization policy fell considerably after the 1980s.However, with the recent emphasis on agricultural developmentand public investment in the sector, some African countries have
started to devote public resources to promote agricultural mecha-nization, including through direct subsidization of machineryimports. The objective of this paper is to bring the attention ofresearchers to the role of mechanization in agricultural transfor-mation and the role that governments can play in the developmentof the machinery supply chain. Through applying the theories offarming systems evolution developed by Boserup (1965) andRuthenberg (1980) and of induced innovation in technical changedeveloped by Hayami and Ruttan (1970, 1985), the paper firstassesses whether mechanization demand has emerged. Afterproviding a concrete assessment on emerging demand for mecha-nization, the second part of the paper focuses on the alternativesupply models of agricultural mechanization for addressing suchemerging demand. Based on a cross-country comparative analysisand recent development of mechanization in Ghana, the paperexamines the appropriateness of mechanization strategies of thegovernment of Ghana. We find that demand for certain mecha-nized farming operations particularly plowing has emerged evenamong smallholders. The development of the mechanized servicehiring market in which medium and large scale farmers who aretractor owners provide hiring-out services to small-scale farmersrepresents a promising model for sustainable mechanization. On
X. Diao et al. / Food Policy 48 (2014) 168–181 169
the other hand, the specialized service provision model recentlypromoted by the government seems to be not viable. Continuousimplementation of such model will not only increase the financialburden to the government, but also encourage more rent-seekingbehaviors, a negative factor to hurt the private sector as the leaderin developing mechanization supply chain.
Ghana has experienced steady economic growth since the late1980s, and the growth is accompanied by rapid urbanization andrising nonfarm opportunities in the rural areas. During this period,the government of Ghana has adopted a market-driven agenda inwhich its policies and investments have been remarkably neutralwith respect to the production sectors. Apart from cocoa, the ‘‘win-ner-picking’’ type of government intervention is rarely adopted inthe agricultural sector. However, beginning in 2003, the Govern-ment started to reemphasize the importance of mechanization,directly engaged in tractor imports, and established subsidizedagricultural mechanization service centers in the last a few years.Several African countries are considering similar mechanizationpolicies. In Nigeria, for example, the government is the primaryimporter of tractors, which were sold at subsidized prices to farm-ers (PropCom, 2012). Similarly, the Government of Tanzania hassold more than 5000 sets of imported agricultural machinery atsubsidized prices since 2009 (Lyimo, 2011). The government ofMali imported 400 tractors from India in 2006; DRC imported920 sets of tractor and farm equipment; and Cameroon plannedto import 1000 tractors from India in 2013, all at the subsidizedprices (FAO, 2013a). Many of these imports and associated policiesare facilitated by lines of credit from the emerging economies suchas Brazil, China and India. The records of the Export-Import Bank ofIndia show that Angola, Benin, Burkina Faso, Burundi, Chad, GuineaBissau and Swaziland have received similar lines of credit rangingfrom $4 million to $50 million from India to purchase agriculturalmachinery (pipeline and operative, as of August 2013). China’sexports of agricultural machinery have increased in value from$410,000 in 1994 to nearly $65 million in 2008, with much ofthe increase driven by large tractor exports and 11% of suchexports going to Africa (FAO, 2013a). While exports through thesecredit arrangements with African countries’ governments areencouraging these countries to increase agricultural machineryimports, it is a question whether it also presents potential chal-lenges for these countries to be able to establish a private sector-led sustainable supply chain for agricultural mechanization.
Against this background in the recent development of mechani-zation policy among African countries, we employ a methodologythat is a combination of qualitative interviews, secondary dataanalysis and literature review for a diagnostic analysis of demandfor and supply of agricultural mechanization. We focus on Ghanaand have interviewed farmers, tractor owners, government offi-cials, importers and other stakeholders there in April 2012 – July2013.1 The hypotheses emerging from the field work were testedand refined by analyzing both aggregate and household survey data.A number of small-scale surveys or field studies conducted by IFPRI’sGhana Strategy Support Program, including a farm budgetsurvey (Akramov and Malek, 2012), a study of animal traction use(Houssou et al., 2013a), a survey of input use for maize and rice pro-duction (Chapoto and Ragasa, 2013), a survey of government-sup-ported mechanization service centers (Benin et al. 2012), and astudy of cropping practices and labor requirements for farm opera-tions (Ngeleza et al., 2011). Part of the data from a recent surveyof tractor owners and medium and large scale farmers jointlyconducted by IFPRI and Ghana’s Savannah Agricultural ResearchInstitute (SARI) in October – December 2013 is also used. The
1 In April 2012, 44 interviews were conducted in Central and Northern Ghana, andin July 2013, 35 interviews were further conducted in two districts, Ejura andSavelugu Nanton.
cross-country comparison of agricultural mechanization experienceswas developed through an extensive literature review.
Very little research has examined the supply side factors ofmechanization (e.g., Mrema et al., 2008), and those have usuallyfocused on provision of services alone rather than the entire supplychain with service provision at the end. This paper tries to fill theknowledge gap by analyzing the entire supply chain both in thecross-country comparison and in Ghana’s case study.
The paper begins by examining the demand side of mechaniza-tion in the next section. Using the frameworks of evolution offarming systems that was used by Pingali et al. (1987) and inducedinnovation in technical change developed by Hayami and Ruttan(1970, 1985), the third section provides a contemporary assess-ment of demand for mechanization services in Ghana. Supplyissues are then examined. Three stylized models of mechanizationsupply based on the experiences of selected Asian countries arepresented in the fourth section. The penultimate section has adiagnostic case study of Ghana’s current practices in mechaniza-tion supply, which covers the model promoted by the governmentthrough Agricultural Mechanization Service Enterprise Centers(AMSECs) and the practice led by the private sector. The final sec-tion concludes.
Agriculture since 1980s: Is demand for mechanizationemerging in Ghana?
Since the early 1970s, all over the developing world, powerintensive operations of land preparation, threshing, pumping andtransport have been largely motorized via tractors and stationarymachines (Binswanger, 1986). However, Africa is an exception.The early push of tractorization by African governments and somedonors largely failed, and animal traction was also processing veryslowly in many countries. Applying the Boserup–Ruthenbergmodel, Pingali et al. (1987) have provided a formal analysis onthe main reasons for the slow progress of agricultural mechaniza-tion in Africa. By examining the existing farming systems in Africacarefully, the authors argue that the slow transition from hand hoeto mechanized plow can be explained by lack of the evolution infarming systems. Only when the systems move from long fallowto short fallow or permanent agriculture does plowing becomenecessary to deal with grassy weeds and hardening soils whichare difficult to remove with the hand hoe.
How have farming systems evolved in Africa in the last 30 yearsafter the publication of Pingali et al. (1987)? Understanding suchevolution is the first necessary step for better assessing possiblechanging situation of demand for mechanization in Africa in therecent years. In the following subsection we first investigate ameasure of farming systems, commonly used by Boserup andRuthenberg, for Ghana in the last five decades. We then applythe induced technical change framework of Hayami and Ruttan(1970, 1985) for an analysis of the changing characteristics of theeconomic environment to explain the emerging demand forlabor-saving technology among farmers.
Long term drivers of agricultural evolution
Farming system evolutionThe fundamental contribution of Boserup–Ruthenberg theory in
farming system evolution is to interpret agricultural technologicalchanges and practices as endogenous rather than exogenous to theeconomic system, that is, such endogenous progress is influencedby agro-ecological conditions and induced by changing character-istics of the socio-economic environment with which the farmersare confronted (Binswanger, 1986). According to Boserup andRuthenberg, and further formalized and tested by Pingali et al.
170 X. Diao et al. / Food Policy 48 (2014) 168–181
(1987), Binswanger and McIntire (1987) and McIntire et al. (1992),the main driving force of the evolution of the farming systemstowards higher intensification are population density and marketaccess. To assess such evolution of farming systems in a stylizedway, the R-value, which is used both by Boserup and Ruthenbergin slightly modified form, is used as an indicator to measure theintensity of the farming system. In Ruthenberg (1980), R-valuetakes account of both cultivated and fallowed land, as well as thenumber of cropping seasons per year. According to Ruthenberg,animal traction appears only at the short fallow2 stage when R-val-ues rise to above 33% (i.e., the average fallow period is shortened toless than two years for each year of cultivation, Ruthenberg, 1980 p.18). Pingali et al. (1987) further argue that animal traction started tobe used when some stumps remain in the fields under the short fal-low system, but for tractor to be able to operate for land preparation,stumps have to be completely removed, meaning that it may appearlater in the agricultural intensification sequence.
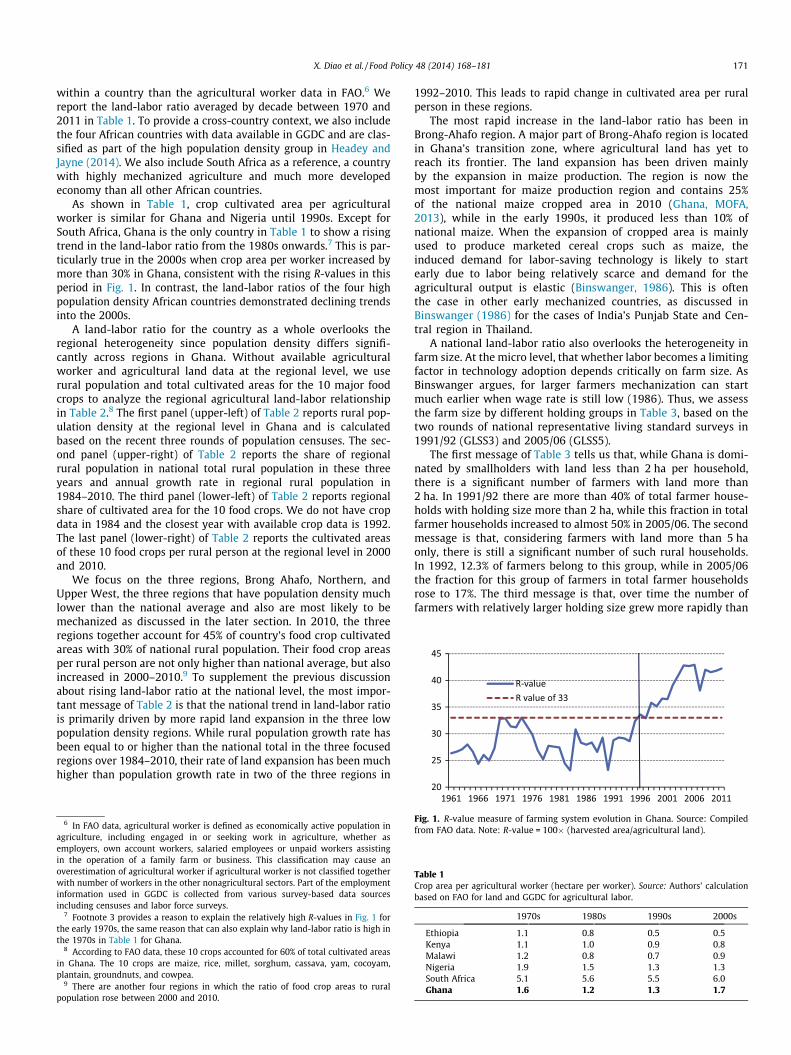
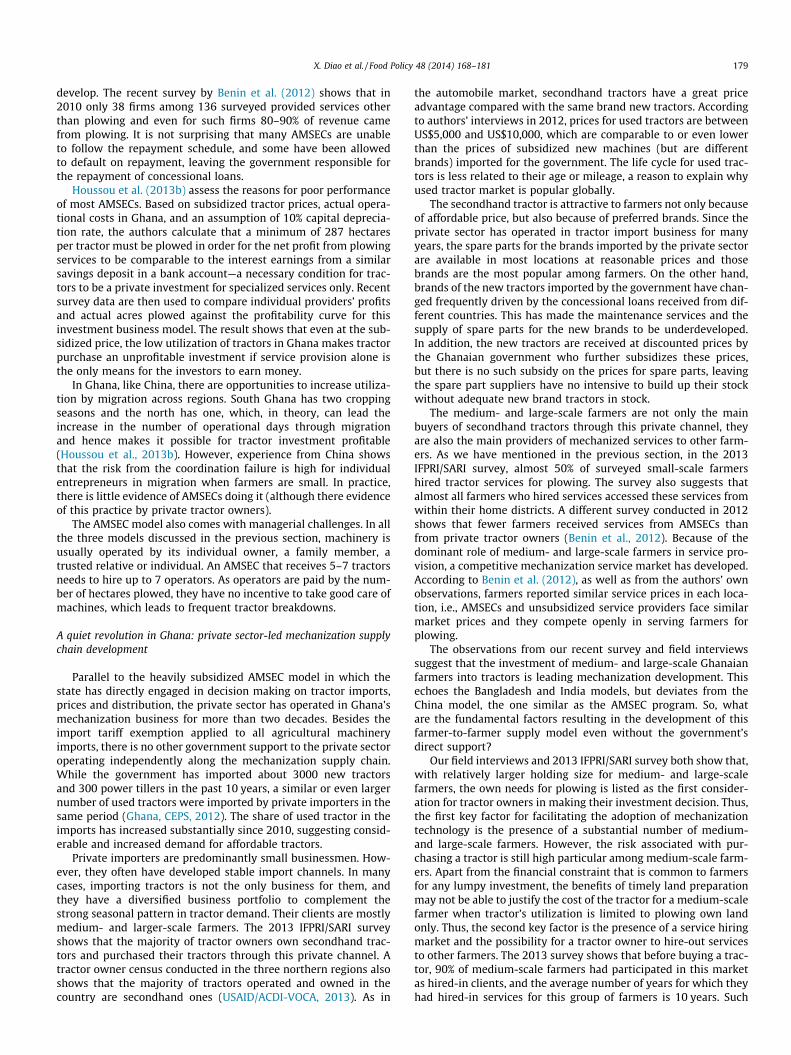
This stylized measure of land use intensity is used here to assessfarming system evolution in Ghana. The R-values for Ghana are cal-culated using the Food and Agriculture Organization’s data on har-vested area and available agricultural land, which is the sum ofarable land and permanent meadows and pastures, and is pre-sented in Fig. 1 (FAO, 2013b).3 Ghana is known as a relatively landabundant country in Africa, which is captured by a low R-value inmost years until the late 1990s (Fig. 1).4 This is consistent with theargument of Pingali et al (1987), i.e., the farming systems character-ized by the low R-values for Ghana indicate that at this stage farmersin general did not have enough demand for plowing nor tractorizedland preparation.
From the late 1990s onwards, however, the R-values have per-manently risen above the threshold of 33, reaching 40–43 in thelate 2000s. While this highly aggregated data fails to capture regio-nal and spatial variations, rising R-values at the national level nev-ertheless suggest that farming systems have changed significantlyin Ghana since the late 1990s, compared with the periods coveredby Pingali et al. (1987).
Case studies done over the years and in different parts of thecountry also suggest the progress of farming system evolution.They indicate the shortening of fallow periods over time, and themove to annual cultivation recently in the 2000s. For example,Nye and Greenland (1961) find that relatively long-fallow systemswith cropping for 3–4 years followed by fallowing of 7–10 yearswas a common practice in Northern Ghana before the 1960s. A1972 study done by Rourke (1974) in Begoro in the Eastern Regionshowed that land was prepared using hoes only during the firstyear, but was cropped for three more years without land prepara-tion and left fallow for six years. The dramatic reduction in forestarea in the southern Ghana transition zone seems to begin in the1970s.5 The study done by Gyasi et al. (1995) shows that in 199334–42% of the studied area was under fallow compared to 40–57%
2 Long fallow or shifting cultivation is when the period of cultivation is much lessthan the time land left uncultivated. This gives enough time for forest or bushvegetation to regrow. Short fallow is when the period of cultivation is more than halfof the fallow period. Under this system in sub-humid and humid areas, regrowth isprimarily grasses (Ruthenberg, 1980).
3 Without fallow land information and using pasture land instead, it may cause theR-values to be underestimated. Moreover, 50% of Ghana’s land area was forest in1960s and only after early 1990s has the forested area fallen to less than one-third oftotal area. The exclusion of forest fallow land from FAO’s measure of agricultural landmay further lead to an underestimation of the R-values.
4 Interestingly, the government’s investments in agricultural development includ-ing the creation of large scale state farms under Operation Feed Yourself (Agyeman-Duah, 2008) in the early 1970s may explain the temporary rise of R-values between1970 and 1976.
5 The transition zone as a major food production region covers parts of the Ashantiand Brong-Ahafo regions of Ghana and lies between humid forest and dry savannawith area approximately 6200 km2.
in 1974. In Wuripe, Northern Ghana, cultivated area increased by14% and open woodland area decreased by 13% between 1992 and1999 (Braimoh, 2004). In the dry and derived savannahs of Ghana,there is a transition to annual cultivation (Codjoe and Bilsborrow,2011).
While the Boserup–Ruthenberg model and the R-values calcu-lated based on this model emphasize the endogenous change infarming systems in responding to the changes in economic andsocial conditions, if the evolution is only characterized by landuse intensity, agriculture has yet to transform from a naturalresource-based to a science-based system (Ruttan, 2002). Thus,most agricultural economists refer to this type of evolutionthrough land use intensity as agricultural extensification insteadof intensification. Obviously, land use intensity measured byincreased R-values is only a necessary but not sufficient conditionfor assessing the demand for mechanization. Once African farmershave moved beyond the long fallow farming system, the economicdecisions at farmer-level for technology adoption, including mech-anization, become more diverse and are influenced by many fac-tors beyond population density and agro-ecological conditions.
Induced technology adoptionBeginning in the early 1970s, Hayami and Ruttan (1970, 1985)
and Binswanger and Ruttan (1978) formulated a model of inducedtechnical change in which the development and application of newtechnology is endogenous to the economic system (Ruttan, 2002).This framework allows us to assess emerging demand for mechani-zation as part of a technology adoption process. The induced tech-nical change model emphasizes agricultural technology innovationand adoption as a continuous sequence often biased toward savingthe limiting factor – land or labor – as the relative scarcity of landor labor endowment is reflected in the change in their relativeprices (Hayami and Ruttan, 1970). In this model, alternative agri-cultural technologies are developed (and adopted by farmers) tofacilitate the substitution of relatively abundant (cheap) factorsfor relatively scarce (expensive) factors (Ruttan, 2002). Mechanicaltechnology is regarded as ‘‘labor saving’’ and is designed to substi-tute power and machinery for labor, while biological and chemicaltechnology is ‘‘land saving.’’ Moreover, changes in land and laborproductivity are relatively independent (Griliches, 1968), indicat-ing that adoption of labor-saving technology by farmers is not nec-essarily driven by an incentive to improve land productivity, whichis the case for adoption of biological technology.
Armed by the induced technology change theory, we focus onchanging economic factors that are relevant for inducing demandfor labor-saving technology, and specifically mechanization. Westart with the rural population density. Rapid population growthin Africa is a well-known fact and declining farm sizes in manyAfrican countries particularly in relatively high population densityareas is a theme for this special issue. Has farming system evolu-tion characterized by the increased R-values in Ghana also beenaccompanied by a declining land-labor ratio such that labor-inten-sive farming practice would been preferred and adopted in Ghana?This is a question we need to address in order to understand therecently emerging demand for mechanization. If farm sizes are get-ting smaller and smaller, and if rural labor supply is abundant, therelative prices of labor to land are unlikely to rise, and hence, theincentives for farmers to adopt labor-saving technology such asmechanization would be limited even under the short-fallow orannual cultivation farming systems.
We calculate the land-labor ratio at the national level based ontwo sources of data. Data for crop cultivated areas from FAO is usedto represent agricultural land, and the data for agricultural workersis from Groningen Growth and Development Center (GGDC), whichcovers employment data of 10 sectors including 9 nonagriculturalsectors, and provides a more complete picture of labor mobility
X. Diao et al. / Food Policy 48 (2014) 168–181 171
within a country than the agricultural worker data in FAO.6 Wereport the land-labor ratio averaged by decade between 1970 and2011 in Table 1. To provide a cross-country context, we also includethe four African countries with data available in GGDC and are clas-sified as part of the high population density group in Headey andJayne (2014). We also include South Africa as a reference, a countrywith highly mechanized agriculture and much more developedeconomy than all other African countries.
As shown in Table 1, crop cultivated area per agriculturalworker is similar for Ghana and Nigeria until 1990s. Except forSouth Africa, Ghana is the only country in Table 1 to show a risingtrend in the land-labor ratio from the 1980s onwards.7 This is par-ticularly true in the 2000s when crop area per worker increased bymore than 30% in Ghana, consistent with the rising R-values in thisperiod in Fig. 1. In contrast, the land-labor ratios of the four highpopulation density African countries demonstrated declining trendsinto the 2000s.
A land-labor ratio for the country as a whole overlooks theregional heterogeneity since population density differs signifi-cantly across regions in Ghana. Without available agriculturalworker and agricultural land data at the regional level, we userural population and total cultivated areas for the 10 major foodcrops to analyze the regional agricultural land-labor relationshipin Table 2.8 The first panel (upper-left) of Table 2 reports rural pop-ulation density at the regional level in Ghana and is calculatedbased on the recent three rounds of population censuses. The sec-ond panel (upper-right) of Table 2 reports the share of regionalrural population in national total rural population in these threeyears and annual growth rate in regional rural population in1984–2010. The third panel (lower-left) of Table 2 reports regionalshare of cultivated area for the 10 food crops. We do not have cropdata in 1984 and the closest year with available crop data is 1992.The last panel (lower-right) of Table 2 reports the cultivated areasof these 10 food crops per rural person at the regional level in 2000and 2010.
We focus on the three regions, Brong Ahafo, Northern, andUpper West, the three regions that have population density muchlower than the national average and also are most likely to bemechanized as discussed in the later section. In 2010, the threeregions together account for 45% of country’s food crop cultivatedareas with 30% of national rural population. Their food crop areasper rural person are not only higher than national average, but alsoincreased in 2000–2010.9 To supplement the previous discussionabout rising land-labor ratio at the national level, the most impor-tant message of Table 2 is that the national trend in land-labor ratiois primarily driven by more rapid land expansion in the three lowpopulation density regions. While rural population growth rate hasbeen equal to or higher than the national total in the three focusedregions over 1984–2010, their rate of land expansion has been muchhigher than population growth rate in two of the three regions in
6 In FAO data, agricultural worker is defined as economically active population inagriculture, including engaged in or seeking work in agriculture, whether asemployers, own account workers, salaried employees or unpaid workers assistingin the operation of a family farm or business. This classification may cause anoverestimation of agricultural worker if agricultural worker is not classified togetherwith number of workers in the other nonagricultural sectors. Part of the employmentinformation used in GGDC is collected from various survey-based data sourcesincluding censuses and labor force surveys.
7 Footnote 3 provides a reason to explain the relatively high R-values in Fig. 1 forthe early 1970s, the same reason that can also explain why land-labor ratio is high inthe 1970s in Table 1 for Ghana.
8 According to FAO data, these 10 crops accounted for 60% of total cultivated areasin Ghana. The 10 crops are maize, rice, millet, sorghum, cassava, yam, cocoyam,plantain, groundnuts, and cowpea.
9 There are another four regions in which the ratio of food crop areas to ruralpopulation rose between 2000 and 2010.
1992–2010. This leads to rapid change in cultivated area per ruralperson in these regions.
The most rapid increase in the land-labor ratio has been inBrong-Ahafo region. A major part of Brong-Ahafo region is locatedin Ghana’s transition zone, where agricultural land has yet toreach its frontier. The land expansion has been driven mainlyby the expansion in maize production. The region is now themost important for maize production region and contains 25%of the national maize cropped area in 2010 (Ghana, MOFA,2013), while in the early 1990s, it produced less than 10% ofnational maize. When the expansion of cropped area is mainlyused to produce marketed cereal crops such as maize, theinduced demand for labor-saving technology is likely to startearly due to labor being relatively scarce and demand for theagricultural output is elastic (Binswanger, 1986). This is oftenthe case in other early mechanized countries, as discussed inBinswanger (1986) for the cases of India’s Punjab State and Cen-tral region in Thailand.
A national land-labor ratio also overlooks the heterogeneity infarm size. At the micro level, that whether labor becomes a limitingfactor in technology adoption depends critically on farm size. AsBinswanger argues, for larger farmers mechanization can startmuch earlier when wage rate is still low (1986). Thus, we assessthe farm size by different holding groups in Table 3, based on thetwo rounds of national representative living standard surveys in1991/92 (GLSS3) and 2005/06 (GLSS5).
The first message of Table 3 tells us that, while Ghana is domi-nated by smallholders with land less than 2 ha per household,there is a significant number of farmers with land more than2 ha. In 1991/92 there are more than 40% of total farmer house-holds with holding size more than 2 ha, while this fraction in totalfarmer households increased to almost 50% in 2005/06. The secondmessage is that, considering farmers with land more than 5 haonly, there is still a significant number of such rural households.In 1992, 12.3% of farmers belong to this group, while in 2005/06the fraction for this group of farmers in total farmer householdsrose to 17%. The third message is that, over time the number offarmers with relatively larger holding size grew more rapidly than
Fig. 1. R-value measure of farming system evolution in Ghana. Source: Compiledfrom FAO data. Note: R-value = 100� (harvested area/agricultural land).
Table 1Crop area per agricultural worker (hectare per worker). Source: Authors’ calculationbased on FAO for land and GGDC for agricultural labor.
1970s 1980s 1990s 2000s
Ethiopia 1.1 0.8 0.5 0.5Kenya 1.1 1.0 0.9 0.8Malawi 1.2 0.8 0.7 0.9Nigeria 1.9 1.5 1.3 1.3South Africa 5.1 5.6 5.5 6.0Ghana 1.6 1.2 1.3 1.7
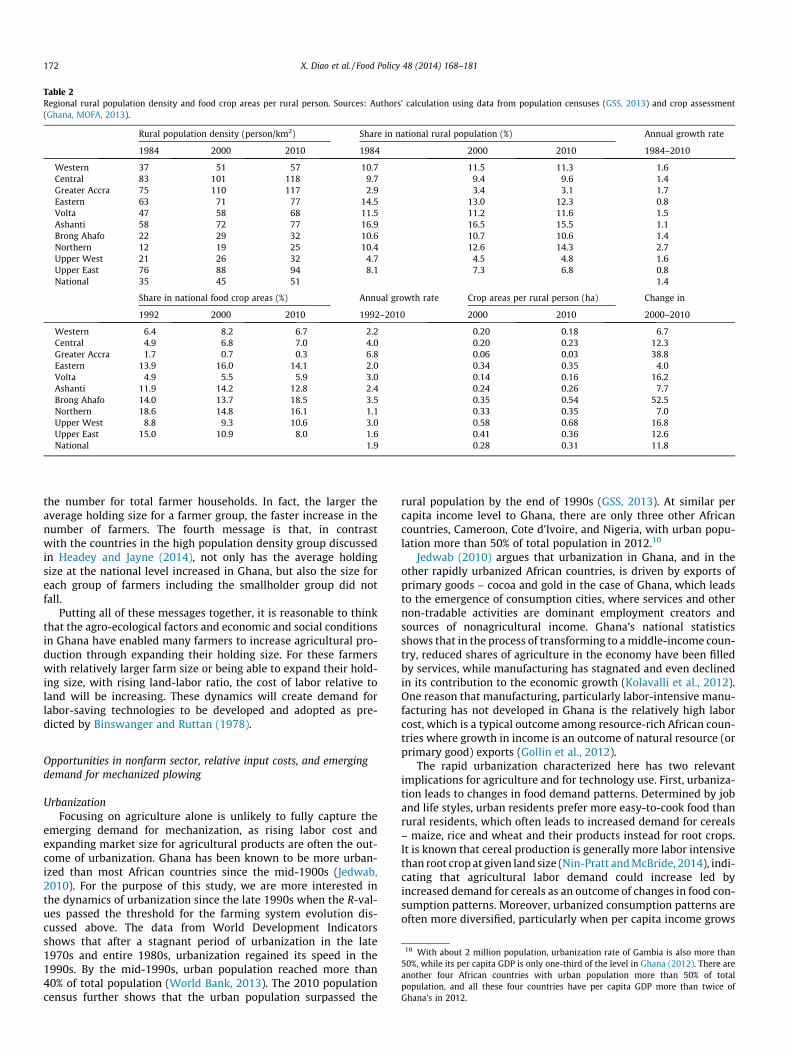
Table 2Regional rural population density and food crop areas per rural person. Sources: Authors’ calculation using data from population censuses (GSS, 2013) and crop assessment(Ghana, MOFA, 2013).
Rural population density (person/km2) Share in national rural population (%) Annual growth rate
1984 2000 2010 1984 2000 2010 1984–2010
Western 37 51 57 10.7 11.5 11.3 1.6Central 83 101 118 9.7 9.4 9.6 1.4Greater Accra 75 110 117 2.9 3.4 3.1 1.7Eastern 63 71 77 14.5 13.0 12.3 0.8Volta 47 58 68 11.5 11.2 11.6 1.5Ashanti 58 72 77 16.9 16.5 15.5 1.1Brong Ahafo 22 29 32 10.6 10.7 10.6 1.4Northern 12 19 25 10.4 12.6 14.3 2.7Upper West 21 26 32 4.7 4.5 4.8 1.6Upper East 76 88 94 8.1 7.3 6.8 0.8National 35 45 51 1.4
Share in national food crop areas (%) Annual growth rate Crop areas per rural person (ha) Change in
1992 2000 2010 1992–2010 2000 2010 2000–2010
Western 6.4 8.2 6.7 2.2 0.20 0.18 �6.7Central 4.9 6.8 7.0 4.0 0.20 0.23 12.3Greater Accra 1.7 0.7 0.3 �6.8 0.06 0.03 �38.8Eastern 13.9 16.0 14.1 2.0 0.34 0.35 4.0Volta 4.9 5.5 5.9 3.0 0.14 0.16 16.2Ashanti 11.9 14.2 12.8 2.4 0.24 0.26 7.7Brong Ahafo 14.0 13.7 18.5 3.5 0.35 0.54 52.5Northern 18.6 14.8 16.1 1.1 0.33 0.35 7.0Upper West 8.8 9.3 10.6 3.0 0.58 0.68 16.8Upper East 15.0 10.9 8.0 �1.6 0.41 0.36 �12.6National 1.9 0.28 0.31 11.8
172 X. Diao et al. / Food Policy 48 (2014) 168–181
the number for total farmer households. In fact, the larger theaverage holding size for a farmer group, the faster increase in thenumber of farmers. The fourth message is that, in contrastwith the countries in the high population density group discussedin Headey and Jayne (2014), not only has the average holdingsize at the national level increased in Ghana, but also the size foreach group of farmers including the smallholder group did notfall.
Putting all of these messages together, it is reasonable to thinkthat the agro-ecological factors and economic and social conditionsin Ghana have enabled many farmers to increase agricultural pro-duction through expanding their holding size. For these farmerswith relatively larger farm size or being able to expand their hold-ing size, with rising land-labor ratio, the cost of labor relative toland will be increasing. These dynamics will create demand forlabor-saving technologies to be developed and adopted as pre-dicted by Binswanger and Ruttan (1978).
10 With about 2 million population, urbanization rate of Gambia is also more than50%, while its per capita GDP is only one-third of the level in Ghana (2012). There areanother four African countries with urban population more than 50% of totalpopulation, and all these four countries have per capita GDP more than twice ofGhana’s in 2012.
Opportunities in nonfarm sector, relative input costs, and emergingdemand for mechanized plowing
UrbanizationFocusing on agriculture alone is unlikely to fully capture the
emerging demand for mechanization, as rising labor cost andexpanding market size for agricultural products are often the out-come of urbanization. Ghana has been known to be more urban-ized than most African countries since the mid-1900s (Jedwab,2010). For the purpose of this study, we are more interested inthe dynamics of urbanization since the late 1990s when the R-val-ues passed the threshold for the farming system evolution dis-cussed above. The data from World Development Indicatorsshows that after a stagnant period of urbanization in the late1970s and entire 1980s, urbanization regained its speed in the1990s. By the mid-1990s, urban population reached more than40% of total population (World Bank, 2013). The 2010 populationcensus further shows that the urban population surpassed the
rural population by the end of 1990s (GSS, 2013). At similar percapita income level to Ghana, there are only three other Africancountries, Cameroon, Cote d’Ivoire, and Nigeria, with urban popu-lation more than 50% of total population in 2012.10
Jedwab (2010) argues that urbanization in Ghana, and in theother rapidly urbanized African countries, is driven by exports ofprimary goods – cocoa and gold in the case of Ghana, which leadsto the emergence of consumption cities, where services and othernon-tradable activities are dominant employment creators andsources of nonagricultural income. Ghana’s national statisticsshows that in the process of transforming to a middle-income coun-try, reduced shares of agriculture in the economy have been filledby services, while manufacturing has stagnated and even declinedin its contribution to the economic growth (Kolavalli et al., 2012).One reason that manufacturing, particularly labor-intensive manu-facturing has not developed in Ghana is the relatively high laborcost, which is a typical outcome among resource-rich African coun-tries where growth in income is an outcome of natural resource (orprimary good) exports (Gollin et al., 2012).
The rapid urbanization characterized here has two relevantimplications for agriculture and for technology use. First, urbaniza-tion leads to changes in food demand patterns. Determined by joband life styles, urban residents prefer more easy-to-cook food thanrural residents, which often leads to increased demand for cereals– maize, rice and wheat and their products instead for root crops.It is known that cereal production is generally more labor intensivethan root crop at given land size (Nin-Pratt and McBride, 2014), indi-cating that agricultural labor demand could increase led byincreased demand for cereals as an outcome of changes in food con-sumption patterns. Moreover, urbanized consumption patterns areoften more diversified, particularly when per capita income grows
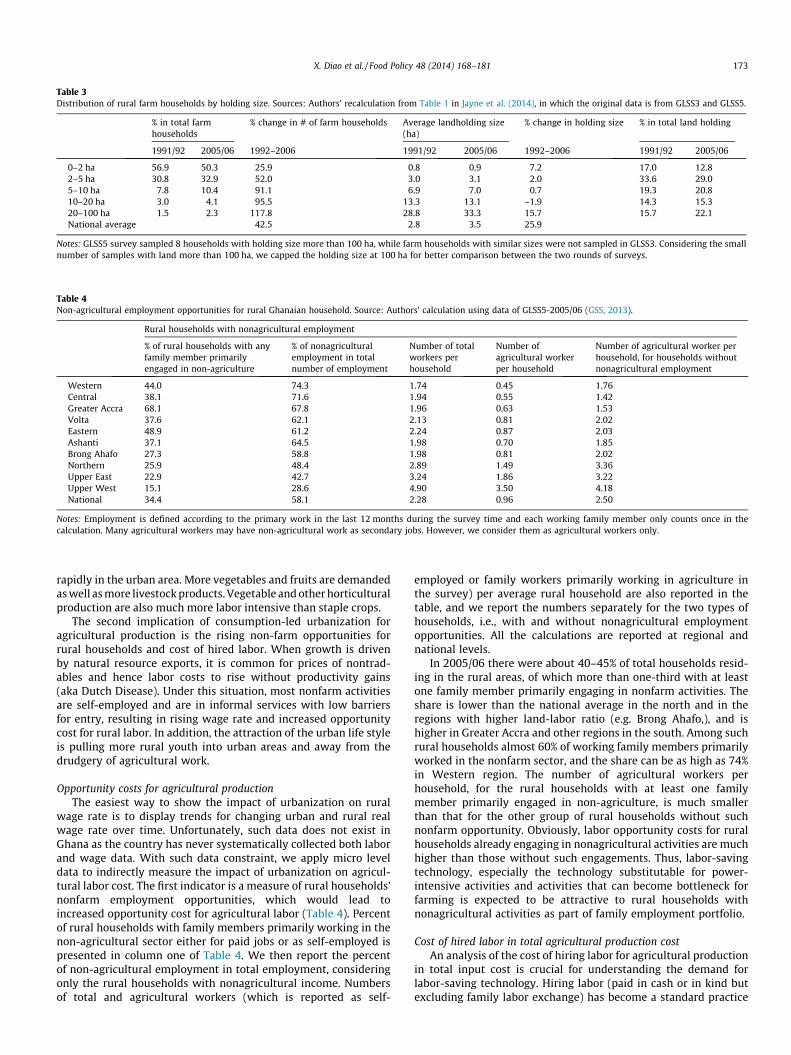
Table 3Distribution of rural farm households by holding size. Sources: Authors’ recalculation from Table 1 in Jayne et al. (2014), in which the original data is from GLSS3 and GLSS5.
% in total farmhouseholds
% change in # of farm households Average landholding size(ha)
% change in holding size % in total land holding
1991/92 2005/06 1992–2006 1991/92 2005/06 1992–2006 1991/92 2005/06
0–2 ha 56.9 50.3 25.9 0.8 0.9 7.2 17.0 12.82–5 ha 30.8 32.9 52.0 3.0 3.1 2.0 33.6 29.05–10 ha 7.8 10.4 91.1 6.9 7.0 0.7 19.3 20.810–20 ha 3.0 4.1 95.5 13.3 13.1 –1.9 14.3 15.320–100 ha 1.5 2.3 117.8 28.8 33.3 15.7 15.7 22.1National average 42.5 2.8 3.5 25.9
Notes: GLSS5 survey sampled 8 households with holding size more than 100 ha, while farm households with similar sizes were not sampled in GLSS3. Considering the smallnumber of samples with land more than 100 ha, we capped the holding size at 100 ha for better comparison between the two rounds of surveys.
Table 4Non-agricultural employment opportunities for rural Ghanaian household. Source: Authors’ calculation using data of GLSS5-2005/06 (GSS, 2013).
Rural households with nonagricultural employment
% of rural households with anyfamily member primarilyengaged in non-agriculture
% of nonagriculturalemployment in totalnumber of employment
Number of totalworkers perhousehold
Number ofagricultural workerper household
Number of agricultural worker perhousehold, for households withoutnonagricultural employment
Western 44.0 74.3 1.74 0.45 1.76Central 38.1 71.6 1.94 0.55 1.42Greater Accra 68.1 67.8 1.96 0.63 1.53Volta 37.6 62.1 2.13 0.81 2.02Eastern 48.9 61.2 2.24 0.87 2.03Ashanti 37.1 64.5 1.98 0.70 1.85Brong Ahafo 27.3 58.8 1.98 0.81 2.02Northern 25.9 48.4 2.89 1.49 3.36Upper East 22.9 42.7 3.24 1.86 3.22Upper West 15.1 28.6 4.90 3.50 4.18National 34.4 58.1 2.28 0.96 2.50
Notes: Employment is defined according to the primary work in the last 12 months during the survey time and each working family member only counts once in thecalculation. Many agricultural workers may have non-agricultural work as secondary jobs. However, we consider them as agricultural workers only.
X. Diao et al. / Food Policy 48 (2014) 168–181 173
rapidly in the urban area. More vegetables and fruits are demandedas well as more livestock products. Vegetable and other horticulturalproduction are also much more labor intensive than staple crops.
The second implication of consumption-led urbanization foragricultural production is the rising non-farm opportunities forrural households and cost of hired labor. When growth is drivenby natural resource exports, it is common for prices of nontrad-ables and hence labor costs to rise without productivity gains(aka Dutch Disease). Under this situation, most nonfarm activitiesare self-employed and are in informal services with low barriersfor entry, resulting in rising wage rate and increased opportunitycost for rural labor. In addition, the attraction of the urban life styleis pulling more rural youth into urban areas and away from thedrudgery of agricultural work.
Opportunity costs for agricultural productionThe easiest way to show the impact of urbanization on rural
wage rate is to display trends for changing urban and rural realwage rate over time. Unfortunately, such data does not exist inGhana as the country has never systematically collected both laborand wage data. With such data constraint, we apply micro leveldata to indirectly measure the impact of urbanization on agricul-tural labor cost. The first indicator is a measure of rural households’nonfarm employment opportunities, which would lead toincreased opportunity cost for agricultural labor (Table 4). Percentof rural households with family members primarily working in thenon-agricultural sector either for paid jobs or as self-employed ispresented in column one of Table 4. We then report the percentof non-agricultural employment in total employment, consideringonly the rural households with nonagricultural income. Numbersof total and agricultural workers (which is reported as self-
employed or family workers primarily working in agriculture inthe survey) per average rural household are also reported in thetable, and we report the numbers separately for the two types ofhouseholds, i.e., with and without nonagricultural employmentopportunities. All the calculations are reported at regional andnational levels.
In 2005/06 there were about 40–45% of total households resid-ing in the rural areas, of which more than one-third with at leastone family member primarily engaging in nonfarm activities. Theshare is lower than the national average in the north and in theregions with higher land-labor ratio (e.g. Brong Ahafo,), and ishigher in Greater Accra and other regions in the south. Among suchrural households almost 60% of working family members primarilyworked in the nonfarm sector, and the share can be as high as 74%in Western region. The number of agricultural workers perhousehold, for the rural households with at least one familymember primarily engaged in non-agriculture, is much smallerthan that for the other group of rural households without suchnonfarm opportunity. Obviously, labor opportunity costs for ruralhouseholds already engaging in nonagricultural activities are muchhigher than those without such engagements. Thus, labor-savingtechnology, especially the technology substitutable for power-intensive activities and activities that can become bottleneck forfarming is expected to be attractive to rural households withnonagricultural activities as part of family employment portfolio.
Cost of hired labor in total agricultural production costAn analysis of the cost of hiring labor for agricultural production
in total input cost is crucial for understanding the demand forlabor-saving technology. Hiring labor (paid in cash or in kind butexcluding family labor exchange) has become a standard practice
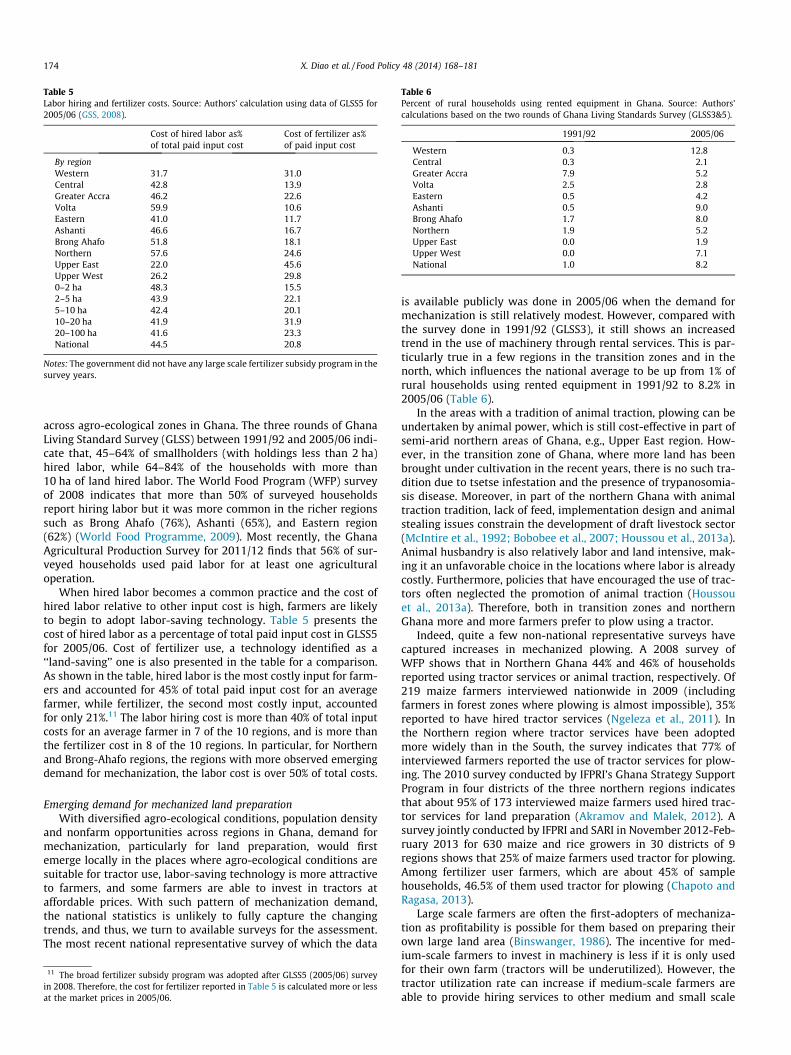
Table 5Labor hiring and fertilizer costs. Source: Authors’ calculation using data of GLSS5 for2005/06 (GSS, 2008).
Cost of hired labor as%of total paid input cost
Cost of fertilizer as%of paid input cost
By regionWestern 31.7 31.0Central 42.8 13.9Greater Accra 46.2 22.6Volta 59.9 10.6Eastern 41.0 11.7Ashanti 46.6 16.7Brong Ahafo 51.8 18.1Northern 57.6 24.6Upper East 22.0 45.6Upper West 26.2 29.80–2 ha 48.3 15.52–5 ha 43.9 22.15–10 ha 42.4 20.110–20 ha 41.9 31.920–100 ha 41.6 23.3National 44.5 20.8
Notes: The government did not have any large scale fertilizer subsidy program in thesurvey years.
Table 6Percent of rural households using rented equipment in Ghana. Source: Authors’calculations based on the two rounds of Ghana Living Standards Survey (GLSS3&5).
1991/92 2005/06
Western 0.3 12.8Central 0.3 2.1Greater Accra 7.9 5.2Volta 2.5 2.8Eastern 0.5 4.2Ashanti 0.5 9.0Brong Ahafo 1.7 8.0Northern 1.9 5.2Upper East 0.0 1.9Upper West 0.0 7.1National 1.0 8.2
174 X. Diao et al. / Food Policy 48 (2014) 168–181
across agro-ecological zones in Ghana. The three rounds of GhanaLiving Standard Survey (GLSS) between 1991/92 and 2005/06 indi-cate that, 45–64% of smallholders (with holdings less than 2 ha)hired labor, while 64–84% of the households with more than10 ha of land hired labor. The World Food Program (WFP) surveyof 2008 indicates that more than 50% of surveyed householdsreport hiring labor but it was more common in the richer regionssuch as Brong Ahafo (76%), Ashanti (65%), and Eastern region(62%) (World Food Programme, 2009). Most recently, the GhanaAgricultural Production Survey for 2011/12 finds that 56% of sur-veyed households used paid labor for at least one agriculturaloperation.
When hired labor becomes a common practice and the cost ofhired labor relative to other input cost is high, farmers are likelyto begin to adopt labor-saving technology. Table 5 presents thecost of hired labor as a percentage of total paid input cost in GLSS5for 2005/06. Cost of fertilizer use, a technology identified as a‘‘land-saving’’ one is also presented in the table for a comparison.As shown in the table, hired labor is the most costly input for farm-ers and accounted for 45% of total paid input cost for an averagefarmer, while fertilizer, the second most costly input, accountedfor only 21%.11 The labor hiring cost is more than 40% of total inputcosts for an average farmer in 7 of the 10 regions, and is more thanthe fertilizer cost in 8 of the 10 regions. In particular, for Northernand Brong-Ahafo regions, the regions with more observed emergingdemand for mechanization, the labor cost is over 50% of total costs.
Emerging demand for mechanized land preparationWith diversified agro-ecological conditions, population density
and nonfarm opportunities across regions in Ghana, demand formechanization, particularly for land preparation, would firstemerge locally in the places where agro-ecological conditions aresuitable for tractor use, labor-saving technology is more attractiveto farmers, and some farmers are able to invest in tractors ataffordable prices. With such pattern of mechanization demand,the national statistics is unlikely to fully capture the changingtrends, and thus, we turn to available surveys for the assessment.The most recent national representative survey of which the data
11 The broad fertilizer subsidy program was adopted after GLSS5 (2005/06) surveyin 2008. Therefore, the cost for fertilizer reported in Table 5 is calculated more or lessat the market prices in 2005/06.
is available publicly was done in 2005/06 when the demand formechanization is still relatively modest. However, compared withthe survey done in 1991/92 (GLSS3), it still shows an increasedtrend in the use of machinery through rental services. This is par-ticularly true in a few regions in the transition zones and in thenorth, which influences the national average to be up from 1% ofrural households using rented equipment in 1991/92 to 8.2% in2005/06 (Table 6).
In the areas with a tradition of animal traction, plowing can beundertaken by animal power, which is still cost-effective in part ofsemi-arid northern areas of Ghana, e.g., Upper East region. How-ever, in the transition zone of Ghana, where more land has beenbrought under cultivation in the recent years, there is no such tra-dition due to tsetse infestation and the presence of trypanosomia-sis disease. Moreover, in part of the northern Ghana with animaltraction tradition, lack of feed, implementation design and animalstealing issues constrain the development of draft livestock sector(McIntire et al., 1992; Bobobee et al., 2007; Houssou et al., 2013a).Animal husbandry is also relatively labor and land intensive, mak-ing it an unfavorable choice in the locations where labor is alreadycostly. Furthermore, policies that have encouraged the use of trac-tors often neglected the promotion of animal traction (Houssouet al., 2013a). Therefore, both in transition zones and northernGhana more and more farmers prefer to plow using a tractor.
Indeed, quite a few non-national representative surveys havecaptured increases in mechanized plowing. A 2008 survey ofWFP shows that in Northern Ghana 44% and 46% of householdsreported using tractor services or animal traction, respectively. Of219 maize farmers interviewed nationwide in 2009 (includingfarmers in forest zones where plowing is almost impossible), 35%reported to have hired tractor services (Ngeleza et al., 2011). Inthe Northern region where tractor services have been adoptedmore widely than in the South, the survey indicates that 77% ofinterviewed farmers reported the use of tractor services for plow-ing. The 2010 survey conducted by IFPRI’s Ghana Strategy SupportProgram in four districts of the three northern regions indicatesthat about 95% of 173 interviewed maize farmers used hired trac-tor services for land preparation (Akramov and Malek, 2012). Asurvey jointly conducted by IFPRI and SARI in November 2012-Feb-ruary 2013 for 630 maize and rice growers in 30 districts of 9regions shows that 25% of maize farmers used tractor for plowing.Among fertilizer user farmers, which are about 45% of samplehouseholds, 46.5% of them used tractor for plowing (Chapoto andRagasa, 2013).
Large scale farmers are often the first-adopters of mechaniza-tion as profitability is possible for them based on preparing theirown large land area (Binswanger, 1986). The incentive for med-ium-scale farmers to invest in machinery is less if it is only usedfor their own farm (tractors will be underutilized). However, thetractor utilization rate can increase if medium-scale farmers areable to provide hiring services to other medium and small scale
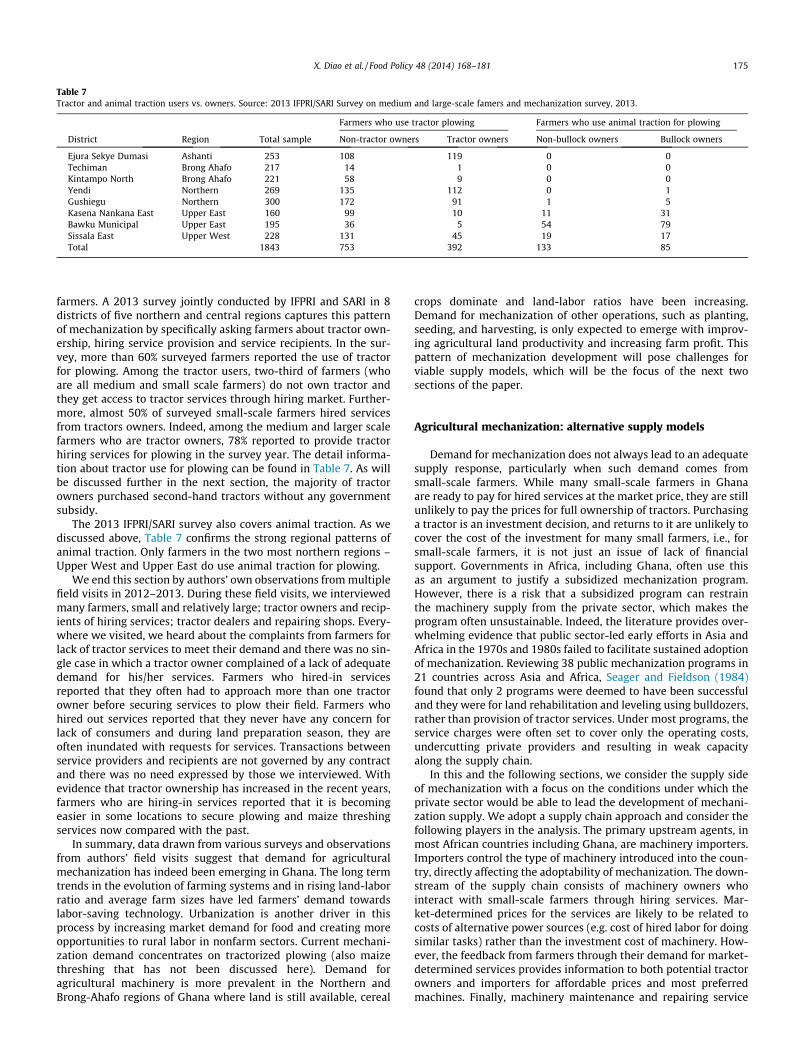
Table 7Tractor and animal traction users vs. owners. Source: 2013 IFPRI/SARI Survey on medium and large-scale famers and mechanization survey, 2013.
Farmers who use tractor plowing Farmers who use animal traction for plowing
District Region Total sample Non-tractor owners Tractor owners Non-bullock owners Bullock owners
Ejura Sekye Dumasi Ashanti 253 108 119 0 0Techiman Brong Ahafo 217 14 1 0 0Kintampo North Brong Ahafo 221 58 9 0 0Yendi Northern 269 135 112 0 1Gushiegu Northern 300 172 91 1 5Kasena Nankana East Upper East 160 99 10 11 31Bawku Municipal Upper East 195 36 5 54 79Sissala East Upper West 228 131 45 19 17Total 1843 753 392 133 85
X. Diao et al. / Food Policy 48 (2014) 168–181 175
farmers. A 2013 survey jointly conducted by IFPRI and SARI in 8districts of five northern and central regions captures this patternof mechanization by specifically asking farmers about tractor own-ership, hiring service provision and service recipients. In the sur-vey, more than 60% surveyed farmers reported the use of tractorfor plowing. Among the tractor users, two-third of farmers (whoare all medium and small scale farmers) do not own tractor andthey get access to tractor services through hiring market. Further-more, almost 50% of surveyed small-scale farmers hired servicesfrom tractors owners. Indeed, among the medium and larger scalefarmers who are tractor owners, 78% reported to provide tractorhiring services for plowing in the survey year. The detail informa-tion about tractor use for plowing can be found in Table 7. As willbe discussed further in the next section, the majority of tractorowners purchased second-hand tractors without any governmentsubsidy.
The 2013 IFPRI/SARI survey also covers animal traction. As wediscussed above, Table 7 confirms the strong regional patterns ofanimal traction. Only farmers in the two most northern regions –Upper West and Upper East do use animal traction for plowing.
We end this section by authors’ own observations from multiplefield visits in 2012–2013. During these field visits, we interviewedmany farmers, small and relatively large; tractor owners and recip-ients of hiring services; tractor dealers and repairing shops. Every-where we visited, we heard about the complaints from farmers forlack of tractor services to meet their demand and there was no sin-gle case in which a tractor owner complained of a lack of adequatedemand for his/her services. Farmers who hired-in servicesreported that they often had to approach more than one tractorowner before securing services to plow their field. Farmers whohired out services reported that they never have any concern forlack of consumers and during land preparation season, they areoften inundated with requests for services. Transactions betweenservice providers and recipients are not governed by any contractand there was no need expressed by those we interviewed. Withevidence that tractor ownership has increased in the recent years,farmers who are hiring-in services reported that it is becomingeasier in some locations to secure plowing and maize threshingservices now compared with the past.
In summary, data drawn from various surveys and observationsfrom authors’ field visits suggest that demand for agriculturalmechanization has indeed been emerging in Ghana. The long termtrends in the evolution of farming systems and in rising land-laborratio and average farm sizes have led farmers’ demand towardslabor-saving technology. Urbanization is another driver in thisprocess by increasing market demand for food and creating moreopportunities to rural labor in nonfarm sectors. Current mechani-zation demand concentrates on tractorized plowing (also maizethreshing that has not been discussed here). Demand foragricultural machinery is more prevalent in the Northern andBrong-Ahafo regions of Ghana where land is still available, cereal
crops dominate and land-labor ratios have been increasing.Demand for mechanization of other operations, such as planting,seeding, and harvesting, is only expected to emerge with improv-ing agricultural land productivity and increasing farm profit. Thispattern of mechanization development will pose challenges forviable supply models, which will be the focus of the next twosections of the paper.
Agricultural mechanization: alternative supply models
Demand for mechanization does not always lead to an adequatesupply response, particularly when such demand comes fromsmall-scale farmers. While many small-scale farmers in Ghanaare ready to pay for hired services at the market price, they are stillunlikely to pay the prices for full ownership of tractors. Purchasinga tractor is an investment decision, and returns to it are unlikely tocover the cost of the investment for many small farmers, i.e., forsmall-scale farmers, it is not just an issue of lack of financialsupport. Governments in Africa, including Ghana, often use thisas an argument to justify a subsidized mechanization program.However, there is a risk that a subsidized program can restrainthe machinery supply from the private sector, which makes theprogram often unsustainable. Indeed, the literature provides over-whelming evidence that public sector-led early efforts in Asia andAfrica in the 1970s and 1980s failed to facilitate sustained adoptionof mechanization. Reviewing 38 public mechanization programs in21 countries across Asia and Africa, Seager and Fieldson (1984)found that only 2 programs were deemed to have been successfuland they were for land rehabilitation and leveling using bulldozers,rather than provision of tractor services. Under most programs, theservice charges were often set to cover only the operating costs,undercutting private providers and resulting in weak capacityalong the supply chain.
In this and the following sections, we consider the supply sideof mechanization with a focus on the conditions under which theprivate sector would be able to lead the development of mechani-zation supply. We adopt a supply chain approach and consider thefollowing players in the analysis. The primary upstream agents, inmost African countries including Ghana, are machinery importers.Importers control the type of machinery introduced into the coun-try, directly affecting the adoptability of mechanization. The down-stream of the supply chain consists of machinery owners whointeract with small-scale farmers through hiring services. Mar-ket-determined prices for the services are likely to be related tocosts of alternative power sources (e.g. cost of hired labor for doingsimilar tasks) rather than the investment cost of machinery. How-ever, the feedback from farmers through their demand for market-determined services provides information to both potential tractorowners and importers for affordable prices and most preferredmachines. Finally, machinery maintenance and repairing service
176 X. Diao et al. / Food Policy 48 (2014) 168–181
providers are also important players along the supply chain. Thequality and cost of maintenance services has a bearing on theinvestment decision of potential machinery owners, while devel-opment of such service business is influenced by the number ofmachinery and number of owners in a given location.
Using the supply chain approach, we develop three stylizedmodels to demonstrate the alternative relationships betweendemand for mechanization when it is mainly from small-scalefarmers and supply of mechanization services that are providedby the private sector. The three stylized models are named afterthree Asian countries, while they represent experiences from manyother Asian countries.
Small-scale farmers owning small machines: the bangladesh model
The Bangladesh model is characterized by the ownership bysmall-scale farmers of small and low cost machines includingwater pumps, power tiller and threshers. Bangladesh is a countrywith limited agricultural land and extremely high populationdensity, which leads to a general perception that the country isunlikely to mechanize its agriculture. Indeed, the early push bythe government in mechanization in the 1970s and 1980s largelyfailed, and the country was dominated by animal traction forland preparation until the late 1980s. A series of major floodsand cyclone hit Bangladesh in the late 1980s, affecting signifi-cantly draught oxen population. From some points of view, thisunexpected exogenous factor led to rapid mechanization amongsmall-scale farmers in Bangladesh through importation of smallChinese-made power tillers since early 1990s. To find the mostappropriate way for the quick replacement of the lost animaldraught power, the president was told by his agricultural policyadvisers that Chinese power tillers would be a feasible option,which led to the removal of the national standard committeewho restricted the imports of such machinery (Biggs et al.,2011; Ahmed, 1995). Before this policy change, the Ministry ofAgriculture permitted the imports of only certain makes andmodels, and a parastatal has responsibility for import and mar-keting of the machines (Gisselquist and Grether, 2000). Whilethe parastatal continued to import for several more years, privatetraders quickly took over by importing cheaper equipment fromChina, which resulted in a 40% drop in the cost of importedmachinery (Gisselquist and Grether 2000; Roy and Singh,2008). The result is that Bangladesh now has a highly mecha-nized but still labor-intensive agricultural system. By 2007,approximately 400,000 power tillers were in use in Bangladeshand nearly 62,000 units were being imported annually (Alamand Khan, 2008; Ziauddin and Ahmed, 2010). Yet strikingly, 4-wheel tractors accounted for only 8% of the combined horse-power of all 2- and 4-wheel tractors (Biggs and Justice, 2013),and only 16% of farmers use 4-wheel tractor services (Ahmed,2013).
A recent national representative survey shows that while only2% of farmers in Bangladesh own power tillers, 72% of farmers usedpower tiller, an indication of highly developed and well functionalhiring market (Ahmed, 2013).12 A different estimation by Roy andSingh (2008) has a consistent result, which shows that 80–90% ofcultivated areas for paddy rice, wheat, maize, and other crops areprepared using power tiller. Even the poorest farmers hire power til-lers as they are cheaper than hiring bullocks or 4-wheel tractors (Royand Singh, 2008). In the recent survey, it shows that 58% of marginalfarmers, who are among the poorest farmers and have land less than0.2 ha, are power tiller users, and 80% of small-scale farmers, withland less than 0.6 ha, also belong to this group (Ahmed, 2013).
12 Only 30% of farmers still use draft animal for land preparation.
With the extremely small landholding size for farmers, the useof power tillers for land preparation alone limits their utilizationand hence profitability for their owners. To overcome such limita-tion, farmers are innovative in their use of power tillers. In Bangla-desh, and in other Asian countries, it is common to see a powertiller being used as an engine in crop threshing and water pumpingfor irrigation, or as a vehicle to cart agricultural and nonagricul-tural products to local markets and to transport people. In fact,the availability of suitable implements for power tillers has ledto the mechanization of many farming activities. Planting and har-vesting are exceptions to this since power tillers are not suitableand these activities continue to depend on human power. This pat-tern of mechanization tells us that there is no single universalmechanization sequence. Without price distortions caused by thegovernment’s subsidies on selected machines, farmers and the pri-vate sector are able to select the right machines and make their usemore efficient and effective. In fact, Roy and Singh (2008) showthat power tiller owners in Bangladesh can repay their investment1–2 years after the purchase. While Bangladesh still does not havethe capacity to produce power tillers, local fabricators haveemerged to manufacture spare parts, basic implements, and otherequipment such as threshers and trailers, which has not onlyenabled power tiller owners to use their machines for a broadrange of activities but also induced mechanization in other agricul-tural activities beyond land preparation.
Medium-scale farmers owning tractors and supplying hired services:the india model
The Indian model differs significantly from the Bangladeshmodel in terms of who owns machines and the kind of machineswhich are used. As in Bangladesh, draught animals were a tradi-tional source of farm power in India. In some areas, farmers beganto mechanize much earlier than the rest of the country, following asubstantial rise in real wages around 1968 (Gupta and Shangari,1979; Binswanger, 1986). At the national level, the share of totalfarm power supplied by tractors and power tillers increased from7.8% in 1970–71 to 42.5% in 2000–01 (Singh, 2000). In contrastto Bangladesh, medium-sized tractors with 20–40 horsepower(hp) dominate the Indian market, and 65% of Indian tractor salesin 2000–01 were machines of this type (Singh, 2000). The seconddifference from the Bangladesh model is that tractors were usedby medium and large farmers before small-scale farmers: morethan 60% of farmers using tractors had farms larger than 4 hectaresin the early 1980s (Singh, 2000). Although the population ofdraught animals fell from 80 million in 1960 to 56 million in2004, animal traction remains important for small and marginalfarmers who may also use tractor hire services (Kulakarni, 2009).
The role of the state in mechanization also differs between Indiaand Bangladesh. India is well known for government’s support toboth agricultural and manufacturing sectors through subsidies.The subsidy received by farmers is complemented by public invest-ments in research and development to encourage the developmentof domestic agricultural machinery industry. The subsidy policyhas covered a wide range of agricultural machinery and toolsincluding animal-drawn implements, power tillers and tractors,which ensured that the choice of machinery was demand-drivenrather than subsidy-driven. Since the 1980s, small-scale farmershave begun to use tractors, and in the early 1990s, 65% of farmsusing tractors were smaller than 4 ha (Singh, 2000). In recent years,policies have started to encourage the ownership of smaller trac-tors, which helps small-scale farmers to be able to purchase trac-tor. For example, a 2008 subsidy policy covers tractors under 40hp, power tillers, self-propelled paddy reapers, and transplanters(India, Ministry of Agriculture, 2008). Furthermore, credit has beenmade available to farmers. According to Singh (2000), the financial
13 With the Japanese grant to the Ghanaian government, machinery is supplied bycompanies based in countries which belong to the OECD’s Development AssistanceCommittee.
X. Diao et al. / Food Policy 48 (2014) 168–181 177
sector extended US$2.9 billion worth of long-term credit to agri-culture, mostly for the purchase of agricultural machinery in1998–1999. Foster and Rosenzweig (2011) show a strong linkbetween bank proximity and farm investment in machinery inIndia.
The important aspect of India model is that medium to largerfarmers offered hiring services and they were critical in expandingmechanization. When there is potential to hire out services, thefarm size of the tractor owner has much less influence on thechoice of size of the machines (Binswanger, 1986). A similar pat-tern of hiring service market development has been observed inother Asian countries where there is a substantial number of med-ium to larger farmers. In Thailand and Malaysia, for example, thevast majority of tractor owners in the survey areas are farmerswhose landholdings are about twice the size of those of tractor-hir-ing farmers (Chancellor, 1971). In Thailand custom plowing by a 4-wheel tractor was found to bring its owner off-farm net income$400 in average per year (Pak-uthai, 1981). Contracting out ricethreshing services in Thailand could bring in a net income of aboutUS$640 to US$1,013 per unit in 1979 (Pathnopas, 1980). The 1971agriculture census of the Philippines, cited by Binswanger (1986),indicates that harvesting and threshing equipment, tractors, andmotor vehicles are used by five to seven times more farms thanthe number owning them. A recent study of Paman Ujang andUchida (2012) for the case of Riau province in Indonesia found thatabout 85% of farmers had hired power tillers for land preparation,and 64% hired thresher for threshing rice. The role of the hiringmarket in mechanization adoption has important implications forGhana and other African countries. As discussed in the previoussection, Ghana has both small-scale farmers with landholding sizeless than 2 ha and a substantial number of medium and larger scalefarmers, indicating that the country is suitable for developing trac-tor hiring service market as Binswanger suggested in his 1986article.
Professional service enterprises: The China model
The China model is used to represent the pattern of specializedservice provision for control-intensive farming activities. Whilethere is a similarity between China and other Asian countries inthe progress of power- intensive mechanization, rapid industriali-zation has significantly raised the rural wage rate in China in therecent years, which has led to increasing demand for mechanizingagricultural operations beyond those which are power-intensive.When mechanization advances to include control-intensiveoperations, individual farmers, including most medium- and lar-ger-scale farmers, are unlikely to own such specialized machinery.Consequently, specialized businesses of service provision for con-trol-intensive operations starts to develop, which we refer to asthe China model. In this model, non-farmer entrepreneurs provideprofessional services to farmers for harvesting. Service provisionthrough migration is a necessary condition for this model to be via-ble. Indeed, with China’s vast farmland across different agro-ecol-ogies, the same crop can be harvested at different times whichallows service providers to be able to operate up to eight monthsper year through migration (Yang et al., 2013).
The specialized service through migration described here is notunique to China. A similar contract-hire system for combine har-vesters existed in the United States in the 1970s. By migrating tofollow the harvest from Texas-Oklahoma to the northern states,where harvesting takes place months later, contractors achievedhigher rates of machinery utilization (Binswanger, 1986). Special-ized suppliers providing wheat and rapeseed harvest services wereseen in Punjab, India since 1990s, where almost all crops are har-vested by such specialized service providers currently. In all thesecountries, the necessary condition to enable suppliers to migrate is
that harvesting time for the same crop (maize, rice or wheat) dif-fers in different parts of the countries. However, for long-distanceservice provision to become a reality, many other economic condi-tions exist, particularly the existence of a sufficiently high qualityroad network. Coordination difficulties also exist when servicedfarm sizes are small and fragmented. As documented by Yanget al. (2013), the local government in China has played a facilitatingrole in this process to help clusters of private service providersovercome the coordination failure caused by many unexpectedgeographic, institutional, and technical barriers.
The key message from the China model is that the ability andopportunity to move services across locations is critical for the pri-vate sector to participate in a specialized mechanization servicebusiness. The innovations from the manufacturing side can be afacilitator in this model. For example, the design and productionof a small-size combine harvester by a Chinese manufacturerenables the machine to be transported easily on a pick-up truck.This innovation made it profitable for private service providers toservice very small plots across provinces.
Key lessons learned from the three models
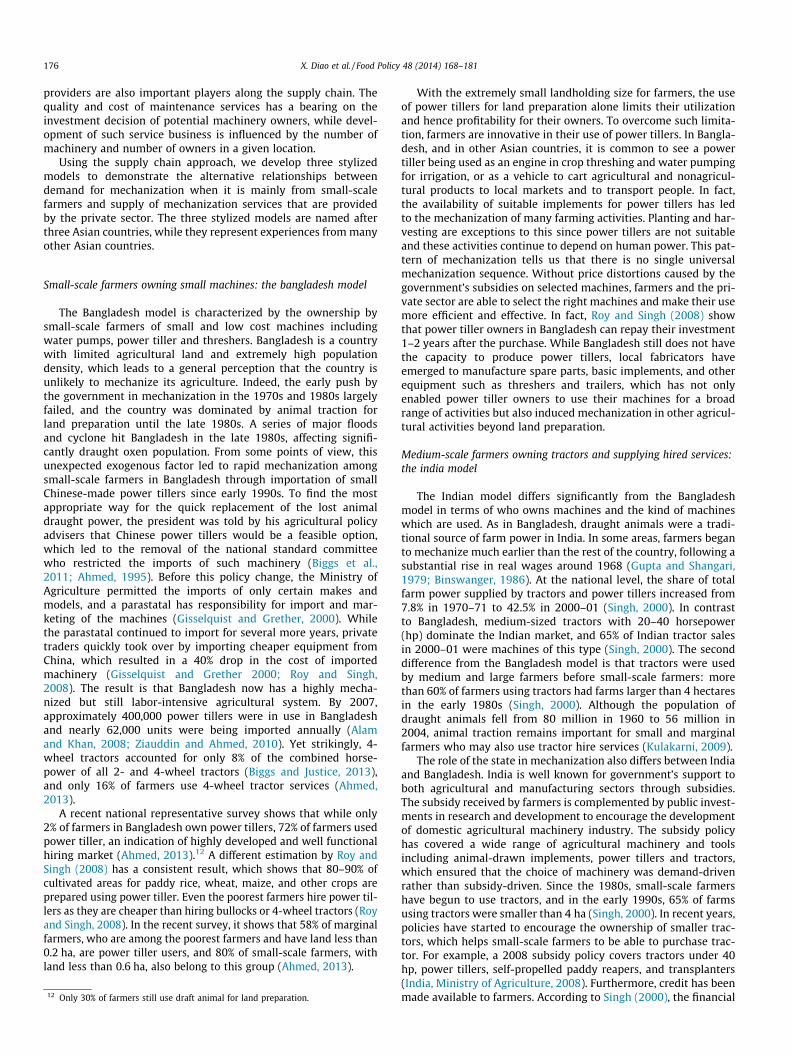
We use the three stylized models to demonstrate that there arevarious pathways for the private sector to lead development of asupply chain for mechanization under different economic andsocial conditions. Table 8 summarizes and compares the stylizedfacts drawn from the three models.
Mechanization supply in Ghana: AMSECs vs. the private sector-led supply chain
The government’s involvement in mechanization is not a newphenomenon in Ghana. In the 1960s, the Ministry of Agricultureowned and operated an estimated 1500 tractors in its 32 districtmechanization stations in the savannah zone (Seager andFieldson, 1984). Low service charges for the provision of plowingservices, which were estimated to be 50% of real costs in 1973,made the scheme unsustainable. From then until 2003, supply ofmechanization was left largely to the private sector, while the cre-ation of AMSECs represents a re-emphasis of the government’s rolein mechanization. Thus, applying the similar supply chainapproach used in the previous section, we start with the AMSECmodel for the Ghana case.
The AMSEC model
State-influenced tractor importationThe main financial source for the establishment of AMSEC is
through concessional loans received by the government from var-ious emerging economies such as Brazil, China and India. Such con-cessional loan agreements require that Ghana import tractors fromthe lender country.13 Therefore, different loan agreements havebrought in different brands of tractors from different countries. Intheory, the government does not directly conduct the imports, anda Ghanaian company selected as an agent does. However, as anagent, the selected company is not in the position to determinethe type of machinery imported or to negotiate the price. Theseare determined as part of the loan agreement. We use imports ofFarmtrac tractors as an example to illustrate the process and itsproblems. After receiving a concessional loan from the Export-Import Bank of India in 2007 and 2008, a Ghanaian company was
Table 8Comparison of the three supply models of mechanization. Source: Authors’ creation based on model summaries.
Bangladesh model India model China model
Service provision Ownership Small-scale farmers Early stages: medium to large farmers Individual persons as privateenterprises
Currently: increasing ownership by small-scale farmers
Type ofmachinery
Power tiller Medium-size tractors: 20–40 hp Small combine harvesters
Type ofoperation
Self and paid services in land preparation,and multifunctional operations
Self and paid services with well-developedhire market
Migration across country to providespecialized service in harvest
Machinery supply Marketplayers
Private sector in importation and domestictrade
Early stages: private sector in importationand domestic trade
Private manufacturers producing fordomestic market
Currently: Private manufacturers producingfor domestic markets and exports
Supply ofattachments
Marketplayers
Private sector; some basic attachmentsproduced domestically
Private sector; most manufactureddomestically
Private sector; most manufactureddomestically
The key role ofthegovernment
Policyinstruments
Trade liberalization and deregulation Broad-based subsidies across manymechanical power sources
Facilitative role in overcomingcoordination difficulties
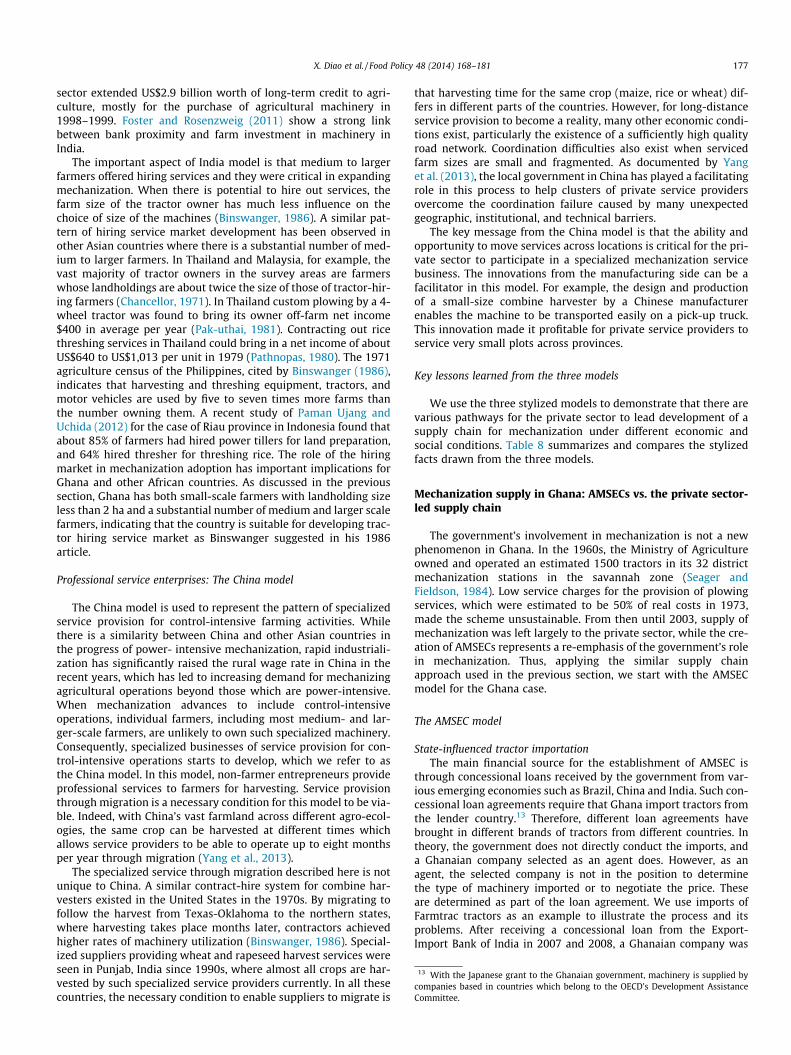
Table 9Summary of Ghana’s current supply models for agricultural mechanization. Source: Authors’ creation based on fieldwork interviews and review of policy documents.
AMSECs The private sector
Service provision Who ownsmachinery
Nonfarm private enterprises Medium and larger farmers
Type ofmachinery
New tractors (50–80 hp) Used tractors and some subsidized new tractors
Type of mainoperation
Hiring services: mainly plowing Self-service and hiring services: plowing, carting, andmaize shelling
Scale ofoperation
5–7 tractors 1–2 tractors
Machinerysupply
Key supplier Government Private importers for used machinery, and governmentfor new tractors
Supply ofattachments
Marketplayers
Government for imported attachments and private sector forimported spare parts
Private sector; some basic implements manufactureddomestically
The key role ofthegovernment
Policyinstruments
Direct importation and distribution of new machinery; heavy pricesubsidy and no interest charge on outstanding payment
Duty-free imports of new and used machinery; some newtractors received from MoFA at the subsidized price
Source offinancing
Concessional loans from foreign countries’ government Cash transaction in used machinery and no financialsupport to the private importers
178 X. Diao et al. / Food Policy 48 (2014) 168–181
selected by the government as an agent to handle the imports. Thecompany brought in 500 Farmtrac tractors over two years fromIndia. The Farmtrac brand and which types of Farmtrac are notdetermined by this company, nor the import prices. Expecting thebusiness to continue with the government, the company constructeda large warehouse and built up stocks of spare parts with its ownmoney. However, when John Deere machinery, instead of Farmtrac,was decided under a new concessional loan by the government inthe following year, a new local company was selected as the govern-ment’s agent to conduct John Deere tractor imports. The companythat imported Farmtrac tractors was adversely affected not onlybecause it did not secure the new business opportunity but alsobecause it used its own money to invest heavily in spare parts forFarmtrac brand, with an expectation for more Farmtrac tractors tobe imported. Similar one-time arrangements have been made toimport Mahindra tractors from India and other brands from China,Brazil, and other countries recently.
Government-selected ‘‘private’’ entities as AMSECsThe AMSEC program is one of four initiatives recently intro-
duced by Government of Ghana that originated from the country’sagricultural development strategy (Ghana, MoFA, 2007), whichrepresents an important shift in recent government policy. In thecase of mechanization, AMSECs are designed for promoting mech-anization, as the government believes that without the state sup-port and subsidy, private-led mechanization supply would be tooslow to develop and to meet the demand from smallholders(Ghana, MoFA, 2003). In order to avoid direct government manage-
ment of mechanization services, AMSECs are designed as privateentities, while their selection was done by the government. Thefirst group of 12 AMSECs was established in 2007/08 and each cen-ter was given a package of seven tractors with basic attachmentsby the government. The centers paid only 20% of the subsidizedprices with the outstanding payment to be paid off over the subse-quent four years without interest. A further 77 AMSECs wereestablished in 2009–2010 through a similar process and underthe same payment arrangement.
As part of the agreements with the lending countries, prices forthe machinery imported by the government are often lower thantheir market prices, which are further subsidized by the govern-ment. Together with a down payment of only 20%, it makesAMSECs a lucrative and attractive business. Unsurprisingly, thenumber of applicants far outpaced the supply of available tractors,and only a limited number of AMSECs were selected by the govern-ment. Thus, transparency in the selection process is unlikely to beestablished.
Unfeasible operational model for AMSECsThe AMSEC scheme was designed to establish specialized ser-
vices in mechanization without consideration of whether it is prof-itable. The design is alike the China model discussed in theprevious section. However, in the China model, the profitabilityfor the private providers becomes possible by across spatial oper-ation, resulting in high utilization rates of specialized equipment.In Ghana, the AMSECs are mainly to provide plowing serviceslocally and demand for other mechanized operations is yet to
X. Diao et al. / Food Policy 48 (2014) 168–181 179
develop. The recent survey by Benin et al. (2012) shows that in2010 only 38 firms among 136 surveyed provided services otherthan plowing and even for such firms 80–90% of revenue camefrom plowing. It is not surprising that many AMSECs are unableto follow the repayment schedule, and some have been allowedto default on repayment, leaving the government responsible forthe repayment of concessional loans.
Houssou et al. (2013b) assess the reasons for poor performanceof most AMSECs. Based on subsidized tractor prices, actual opera-tional costs in Ghana, and an assumption of 10% capital deprecia-tion rate, the authors calculate that a minimum of 287 hectaresper tractor must be plowed in order for the net profit from plowingservices to be comparable to the interest earnings from a similarsavings deposit in a bank account—a necessary condition for trac-tors to be a private investment for specialized services only. Recentsurvey data are then used to compare individual providers’ profitsand actual acres plowed against the profitability curve for thisinvestment business model. The result shows that even at the sub-sidized price, the low utilization of tractors in Ghana makes tractorpurchase an unprofitable investment if service provision alone isthe only means for the investors to earn money.
In Ghana, like China, there are opportunities to increase utiliza-tion by migration across regions. South Ghana has two croppingseasons and the north has one, which, in theory, can lead theincrease in the number of operational days through migrationand hence makes it possible for tractor investment profitable(Houssou et al., 2013b). However, experience from China showsthat the risk from the coordination failure is high for individualentrepreneurs in migration when farmers are small. In practice,there is little evidence of AMSECs doing it (although there evidenceof this practice by private tractor owners).
The AMSEC model also comes with managerial challenges. In allthe three models discussed in the previous section, machinery isusually operated by its individual owner, a family member, atrusted relative or individual. An AMSEC that receives 5–7 tractorsneeds to hire up to 7 operators. As operators are paid by the num-ber of hectares plowed, they have no incentive to take good care ofmachines, which leads to frequent tractor breakdowns.
A quiet revolution in Ghana: private sector-led mechanization supplychain development
Parallel to the heavily subsidized AMSEC model in which thestate has directly engaged in decision making on tractor imports,prices and distribution, the private sector has operated in Ghana’smechanization business for more than two decades. Besides theimport tariff exemption applied to all agricultural machineryimports, there is no other government support to the private sectoroperating independently along the mechanization supply chain.While the government has imported about 3000 new tractorsand 300 power tillers in the past 10 years, a similar or even largernumber of used tractors were imported by private importers in thesame period (Ghana, CEPS, 2012). The share of used tractor in theimports has increased substantially since 2010, suggesting consid-erable and increased demand for affordable tractors.
Private importers are predominantly small businessmen. How-ever, they often have developed stable import channels. In manycases, importing tractors is not the only business for them, andthey have a diversified business portfolio to complement thestrong seasonal pattern in tractor demand. Their clients are mostlymedium- and larger-scale farmers. The 2013 IFPRI/SARI surveyshows that the majority of tractor owners own secondhand trac-tors and purchased their tractors through this private channel. Atractor owner census conducted in the three northern regions alsoshows that the majority of tractors operated and owned in thecountry are secondhand ones (USAID/ACDI-VOCA, 2013). As in
the automobile market, secondhand tractors have a great priceadvantage compared with the same brand new tractors. Accordingto authors’ interviews in 2012, prices for used tractors are betweenUS$5,000 and US$10,000, which are comparable to or even lowerthan the prices of subsidized new machines (but are differentbrands) imported for the government. The life cycle for used trac-tors is less related to their age or mileage, a reason to explain whyused tractor market is popular globally.
The secondhand tractor is attractive to farmers not only becauseof affordable price, but also because of preferred brands. Since theprivate sector has operated in tractor import business for manyyears, the spare parts for the brands imported by the private sectorare available in most locations at reasonable prices and thosebrands are the most popular among farmers. On the other hand,brands of the new tractors imported by the government have chan-ged frequently driven by the concessional loans received from dif-ferent countries. This has made the maintenance services and thesupply of spare parts for the new brands to be underdeveloped.In addition, the new tractors are received at discounted prices bythe Ghanaian government who further subsidizes these prices,but there is no such subsidy on the prices for spare parts, leavingthe spare part suppliers have no intensive to build up their stockwithout adequate new brand tractors in stock.
The medium- and large-scale farmers are not only the mainbuyers of secondhand tractors through this private channel, theyare also the main providers of mechanized services to other farm-ers. As we have mentioned in the previous section, in the 2013IFPRI/SARI survey, almost 50% of surveyed small-scale farmershired tractor services for plowing. The survey also suggests thatalmost all farmers who hired services accessed these services fromwithin their home districts. A different survey conducted in 2012shows that fewer farmers received services from AMSECs thanfrom private tractor owners (Benin et al., 2012). Because of thedominant role of medium- and large-scale farmers in service pro-vision, a competitive mechanization service market has developed.According to Benin et al. (2012), as well as from the authors’ ownobservations, farmers reported similar service prices in each loca-tion, i.e., AMSECs and unsubsidized service providers face similarmarket prices and they compete openly in serving farmers forplowing.
The observations from our recent survey and field interviewssuggest that the investment of medium- and large-scale Ghanaianfarmers into tractors is leading mechanization development. Thisechoes the Bangladesh and India models, but deviates from theChina model, the one similar as the AMSEC program. So, whatare the fundamental factors resulting in the development of thisfarmer-to-farmer supply model even without the government’sdirect support?
Our field interviews and 2013 IFPRI/SARI survey both show that,with relatively larger holding size for medium- and large-scalefarmers, the own needs for plowing is listed as the first consider-ation for tractor owners in making their investment decision. Thus,the first key factor for facilitating the adoption of mechanizationtechnology is the presence of a substantial number of medium-and large-scale farmers. However, the risk associated with pur-chasing a tractor is still high particular among medium-scale farm-ers. Apart from the financial constraint that is common to farmersfor any lumpy investment, the benefits of timely land preparationmay not be able to justify the cost of the tractor for a medium-scalefarmer when tractor’s utilization is limited to plowing own landonly. Thus, the second key factor is the presence of a service hiringmarket and the possibility for a tractor owner to hire-out servicesto other farmers. The 2013 survey shows that before buying a trac-tor, 90% of medium-scale farmers had participated in this marketas hired-in clients, and the average number of years for which theyhad hired-in services for this group of farmers is 10 years. Such
180 X. Diao et al. / Food Policy 48 (2014) 168–181
experience not only allows medium-scale farmers to fully appreci-ate the benefit of owning a tractor for their own use, but also pro-vides them enough time for learning how to hire out services oncethey become owners. While medium-scale farmers participate inthis market first as hiring-in clients and then as service providers,if demand for such services is limited to medium-scale farmersonly, there is not enough space in this market to attract more med-ium-scale farmers to become tractor owners and to increase ser-vice supply. Thus, the third key factor is the growth potential ofthis market through increased service demand from small-scalefarmers also. The 2013 survey seems to indicate such potential.The survey data shows that the ratio of service providers to serviceusers is 1 to 100–120 in 2012, i.e., in average, a tractor owner pro-vided hiring-out services to 100–120 farmers, of which 45–51 aresmall-scale farmers (with land less than 2 ha). There are more than50% of small-scale farmers in the survey who still do not hire-inmechanization services and are potential clients in the future,thereby allowing for further market expansion and developmentof mechanization.
In conclusion, the emergence of the three key factors discussedhere reveals a viable model through which the private sector canlead the sustainable development of mechanization – the hiringservice market in which medium- and large-scale farmers are bothtractor owners and service providers. On the other hand, the modelof specialized service provision promoted through AMSEC programis unlikely to be sustainable without heavy subsidy of the govern-ment. Corresponding to Table 8 in the previous section, Table 9 isdeveloped to summarize this two models in the case of Ghana.
Conclusions
This paper first examines the demand for mechanization ofagricultural operations in the context of the evolution of farmingsystems and induced technology adoption. Ghana’s farming sys-tems have undergone significant changes in the last 30 years. Landexpansion in responding to increased market demand for agricul-tural products has led to rising land-labor ratio and increased num-bers of medium- and large-scale farmers. In combination with therising wage rate and increased opportunities for rural workers innonfarm sectors, it has induced the demand for labor-saving tech-nology and demand for certain mechanized farming operations,particularly plowing, has emerged even among small-scalefarmers.
The paper then employs a supply chain approach to analyze thesupply side of mechanization. The three stylized models based onAsia’s experiences display that private-sector led supply chainmodels vary according to different economic and social conditions.In the countries without capacity of manufacturing tractor, such asin Bangladesh, the private sector has brought in appropriatemachinery at affordable prices. While a ‘‘smart’’ subsidy policycan be used to encourage private investment, such as in the caseof India, there is a crucial difference between subsidies appliedacross an extensive range of machinery and those applied only tothe tractors imported by the government. The subsidy policy hasto avoid winner-picking in types and sources of machinery, as itcan distort the incentives for both importers and tractor ownersand encourage rent-seeking behavior.
Two different supply models in Ghana are discussed in thepaper and have communicated a similar message as the three styl-ized Asian models do. In the case of Ghana, the development of thehiring service market led by tractor ownership among medium-and large-scale farmers seems to be a promising model for sustain-able mechanization to reach farmers of all sizes. On the other hand,the AMSEC model recently promoted by the government seems tobe not viable. Continuous implementation of such model will not
only increase the financial burden to the government, but alsoencourage more rent-seeking behavior and diminish the role ofthe private sector in developing mechanization supply chain.
Most tractors imported by the private sector are secondhand atmuch lower prices than the new ones, indicating the price sensitiv-ity for tractor buyers, while such lumpy investments have yet toreceive any financial support from either the government orprivate financial sector. India’s experience shows that through gov-ernment support to financial institutions, domestic banks (particu-larly development banks) can provide longer-term lending toenable the private sector to invest in agricultural development,including in mechanization. Policies and interventions to assistthe private sector in overcoming market failures in credit marketshave been documented for other Asian countries too. Will Ghana’sgovernment be able to indirectly promote mechanization throughthe engagement of the financial sector instead of establishingAMSECs? This is a policy option that deserves more research.
References
Agyeman-Duah, I., 2008. An economic history of Ghana: reflections on a half-century of challenges and progress. Ayebia Clarke Pub Ltd.
Ahmed, A., 2013. Farm Mechanization in Bangladesh: Evidence from IFPRI NationalHousehold Survey. A presentation at Rural Mechanization: Policy andTechnology Lessons from Bangladesh and Other Asian Countries, 7–8 March2013, Dhaka, Bangladesh.
Ahmed, R., 1995. Liberalisation of agriculture input markets in Bangladesh: process,impcodjact, and lessons. Agric. Econom. 12, 115–128.
Akramov, K., Malek, M., 2012. Analyzing Profitability of Maize, Rice, and SoybeanProduction in Ghana: Results of PAM and DEA Analysis. International FoodPolicy Research Institute, Ghana Strategy Support Program Working Paper No.0028.
Alam, M., Khan, M., 2008. Manufacturing of Agricultural Machinery in Bangladesh:Opportunities and Constraints.’’ Proceedings of the Regional Workshop on FarmMechanization for Small Holder Agriculture in SAARC Countries, 22–24September 2008. <http://www.saarcagri.org/images/abook_file/wp_2008_01.pdf>.
Benin, S., Johnson, M., Jimah, K., Taabazuing, J., Tenga, A., Abokyi, E., Nasser, G. et al.2012. Evaluation of Four Special Initiatives of the Ministry of Food andAgriculture, Government of Ghana. Draft Report, International Food PolicyResearch Institute, Washington, DC.
Biggs, S., Justice, S., 2013. Political Power in Innovation Systems: SmallholderSustainable Intensification and Rural Mechanization. 2013 version.
Biggs, S., Justice, S., Lewis, D., 2011. Patterns of rural mechanization, energy andemployment in South Asia: reopening the debate. Econom. Political Weekly XLVI (9), 78–82.
Binswanger, H., 1986. Agricoultural mechanization: a comparative historicalperspective. World Bank Research Observer 1 (1), : 27–56.
Binswanger, H., McIntire, J., 1987. Behavioral and material determinants ofproduction relations in land-abundant tropical agriculture. Econom. Develop.Cultural Change 36 (1), 73–99.
Binswanger, H., Ruttan, V.W., 1978. Induced Innovation. The Johns HopkinsUniversity Press, Baltimore and London.
Bobobee, E.Y., Sraku-Lartey, K., Fialor, S.C., Canacoo, E.A., Agodzo, S.K., Yawson, A.,Gebresenbet, G., 2007. Wear rate of animal-drawn ploughshares in selectedGhanaian soils. Soil Tillage Res. 93 (2), 299–308.
Boserup, E. 1965. The Conditions of Agricultural Growth: the economics of agrarianchange under population pressure, London, George Allen and Unwin.
Braimoh, A.K., 2004. Seasonal migration and land-use change in Ghana. LandDegrad. Develop. 15 (1), 37–47.
Chancellor, W.J., 1971. Mechanization of small farms in Thailand and Malaysia bytractor hire services. Trans. ASAE 14 (6), 847–854.
Chapoto, A., Ragasa, C., 2013.‘‘Moving in the right direction? Maize productivity andfertilizer use and use intensity in Ghana. IFPRI Discussion Paper No. 1314December 2013. International Food Policy Research Institute.
Codjoe, S.N.A., Bilsborrow, R.E., 2011. Population and agriculture in the dry andderived savannah zones of Ghana. Popul. Environ. 33 (1), 80–107.
FAO (Food and Agriculture Organization of the United Nations). 2013a.Mechanization for Rural Development: a review of patterns and progressaround the world. Integrated Crop Management, vol. 20–2013. Rome: FAO.
FAO (Food and Agriculture Organization of the United Nations). 2013b. FAOSTATDatabase. Rome: FAO.
Foster, A., Rosenzweig, M., 2011. Are Indian Farms Too Small? Mechanization,Agency Costs, and Farm Efficiency. <http://mailhost.econ.yale.edu/seminars/develop/tdw11/rosenzweig-111114.pdf> (December 3, 2012).
Ghana, CEPS (Customs, Excise and Preventive Services), 2012. Import data.Ghana, MoFA (Ministry of Food and Agriculture), 2003. AMSEC Proposal. Accra,
Ghana: MoFA.Ghana, MoFA (Ministry of Food and Agriculture), 2007. Food and Agricultural Sector
Development Policy FADESP II. Accra, Ghana: MoFA.
X. Diao et al. / Food Policy 48 (2014) 168–181 181
Ghana, MoFA (Ministry of Food and Agriculture), 2012. Agriculture EngineeringServices Division data. Ghana: AESD.
Ghana, MoFA (Ministry of Food and Agriculture), 2013. National Crop Assessments .Ghana: MoFA.
Ghana Statistic Service, 2013. Consumer Price Index 2012.Ghana Statistical Service, 2008. Ghana Living Standards Survey, report of the fifth
round (GLSS 5).Gisselquist, D., Grether, J.M., 2000. An argument for deregulating the transfer of
agricultural technologies to developing countries. World Bank Econom. Rev. 14(1), 111–127.
Gollin, D., Jedwab, R., Vollrath, D., 2012. Urbanization without StructuralTransformation: Evidence from Sub-Saharan Africa, 2012 version.
Griliches, Zvi., 1968. Agriculture: productivity and technology. InternationalEncyclopedia of the Social Services, vol. 1. Free Press, New York.
Gupta, D.P., Shangari, K.K., 1979. Agricultural development in Punjab, 1952–53 to1976–77. Agricultural Economics Research Centre, University of Delhi.
Gyasi, E., Agyepong, G.T., Ardayfio-Schandorf, E., Enu-Kwesi, L., Nabila, J.S., Owusu-Bennoah, E., 1995. Production pressure and environmental change in the forest-savanna zone of southern Ghana. Glob. Environ. Change 5 (4), 355–366.
Hayami, Y., Ruttan, V.W., 1985. Agricultural development: An internationalperspective. Johns Hopkins University Press, Baltimore.
Hayami, Y., Ruttan, V.W., 1970. Factor prices and technical change in agriculturaldevelopment: The United States and Japan, 1880–1960. J. Polit. Econom. 78 (5),1115–1141.
Headey, D., Jayne, T.S., 2014. Adaptation to land constraints: Is Africa different?Food Policy (Forthcoming).
Houssou, N., Kolavalli, S., Bobobee, E., Owusu, V., 2013a. Animal Traction in Ghana.International Food Policy Research Institute, Ghana Strategy Support ProgramWorking Paper No. 34.
Houssou, N., Diao, X., Cossar, F., Kolavalli, S., Jimah, K., Aboagye, P., 2013b.Agricultural mechanization in Ghana: is specialization in agriculturalmechanization a viable business model? Am. J. Agric. Econom. 95 (5), 1237–1244. http://dx.doi.org/10.1093/ajae/aat026.
India, Ministry of Agriculture, Department of Agriculture & Cooperation. 2008.Guidelines on the Revised Macro Management of Agriculture (MMA) Scheme.(accessed 13.12.12) <http://agricoop.nic.in/dacdivision/RMMAGuidelines20July2008-Final.pdf>.
Jayne, T.S., Chapoto, A., Sitko, N., Nkonde, C., Muyanga, M., Chamberlin, J., 2014. Isthe Scramble for Land in Africa Foreclosing a Smallholder AgriculturalExpansion Strategy? Journal of International Affairs Spring 2014 Issue onFood Security.
Jedwab, R., 2010. African Cities and the Structural Transformation: Evidence fromGhana and Ivory Coast, 2010 version.
Kolavalli, S., Robison, E., Diao, X., Alpureto, V., Folledo, R., Slavova, M., Ngeleza, G.,Asante, F., 2012. Economic transformation in ghana: where will the path lead? J.African Develop. 14 (2), 41–78.
Kulakarni, S. 2009. Mechanization of Agriculture: Indian Scenario. Paper presentedat the Fifth Session of the Technical Committee of the UNAPCAEM & ExpertGroup Meeting on Application of Agricultural Machinery for SustainableAgriculture in the Asia-Pacific Region, Los Banos, the Philippines, October 14–16.
Lyimo, M., 2011. Country presentation on Agricultural Mechanization in Tanzania’’,presentation to Workshop on ‘Boosting agricultural mechanization in rice-based systems in sub-Saharan Africa’, Saint Louis, Senegal, 6–8 June 2011.
Mcintire, J., Bourzat, D., Pingali, P.L., 1992. Crop-Livestock Interaction in Sub-Saharan Africa. World Bank.
Mrema, C. G., D. Baker, and D. Kahan. 2008. Agricultural Mechanization in Sub-Saharan Africa: Time for a New Look. Rome: Food and Agriculture Organizationof the United Nations.
Ngeleza, G.K., Owusua, R., Jimah, K., Kolavalli, S., 2011. Cropping practices and laborrequirements in field operations for major crops in Ghana: What needs to bemechanized?. International Food Policy Research Institute Discussion Paper No.1074, Washington DC.
Nin-Pratt, A., McBride, L.,. 2014. Green Revolution in West Africa: Is increasingpopulation density triggering an Asian-style agricultural intensification inGhana? Food Policy, (forthcoming).
Nye, P.H., Greenland, D.J., 1961. The soil under shifting cultivation. Soil Sci. 92 (5),354.
Pak-uthai, V. 1981. An Economic Analysis of Farm Machinery: A Case Study of HiredTractor in 1979’, M.Sc. thesis, Kasetsart University, Bangkok, (in Thai).
Paman Ujang, S.I., Uchida, S., 2012. Power availability and requirements for small-scale rice farm operations: a case in Riau Province, Indonesia. Am. J. Agric. Sci.Eng. Technol. 2 (2012), 27–36.
Pathnopas, R. 1980. The Economics of Rice Threshing Machines in Thailand: A CaseStudy of Chachoengsao and Supanburi Provinces. Master’s thesis, Faculty ofEconomics, Thammasat University, Bangkok.
Pingali, P., Y. Bigot, and H. Binswanger. 1987. Agricultural Mechanization and theEvolution of Farming Systems in Sub-Saharan Africa. Washington, DC: WorldBank.
PrOpCom, 2012. Making tractor markets work for the poor in Nigeria, funded byDepartment for International Development, UK.
Rourke, B.E., 1974. Profitability of Cocoa and Alternative Crops in Eastern Region,Ghana. Economics of Cacao Production and Marketing.
Roy, K.C., Singh, G., 2008. Agricultural Mechanization in Bangladesh. AgriculturalMechanization in Asia. Africa Latin Am. 39 (2).
Ruthenberg, H., 1980. Farming Systems in the Tropics. Oxford University Press.Ruttan, V.W. 2002. Productivity Growth in World Agriculture: Sources and
Constraints. Journal of Economic Perspectives. Oxford University Press.Seager, P.J., Fieldson, R.S., 1984. Public sector: tractor hire and equipment hire schemes
in developing countries. Paper Prepared by the Overseas Division of NIAE.Singh, G., 2000. Agricultural Machinery Industry in India (Manufacturing, Marketing
and Mechanization Promotion). In Status of Farm Mechanization in India. NewDelhi: Indian Agricultural Statistics Research Institute.
USAID/ACDI-VOCA. 2013. ADVANCE Tractor Census of Northern Ghana.World Bank, 2013. World Development Indicators.World Food Programme. 2009. Comprehensive Food Security & Vulnerability
Analysis Ghana. United Nations World Food Programme, Rome.Yang, J., Huang, Z., Zhang, X., Reardon, T., 2013. The Rapid Rise of Cross-Regional
Agricultural Mechanization Services in China. Am. J. Agric. Econom. 95 (5).Ziauddin, A.T.M., Ahmed, S., 2010. Agricultural Research Priority: Vision 2030 and
Beyond: Farm Machinery, Irrigation and Water Management and Post-harvestTechnology. Dhaka, Bangladesh: Bangladesh Agricultural Research Council.