Embed Size (px)
Citation preview
Mechanism-Based Pharmacokinetic/PharmacodynamicModeling of the Electroencephalogram Effects of GABAAReceptor Modulators: In Vitro-in Vivo Correlations
S.A.G. VISSER,1 F.L.C. WOLTERS, J. M. GUBBENS-STIBBE, E. TUKKER, P. H. VAN DER GRAAF, L. A. PELETIER, andM. DANHOF
Division of Pharmacology, Leiden/Amsterdam Center for Drug Research, Leiden University, Leiden, The Netherlands (S.A.G.V., F.L.C.W.,J.M.G.-S., E.T., M.D.); Pfizer Global Research and Development, Discovery Biology, Sandwich, Kent, United Kingdom (P.H.v.G.); andMathematical Institute, Leiden University, Leiden, The Netherlands (L.A.P.)
Received July 30, 2002; accepted September 18, 2002
ABSTRACTA mechanism-based pharmacokinetic-pharmacodynamic (PK/PD) model for neuroactive steroids, comprising a separatecharacterization of 1) the receptor activation process and 2) thestimulus-response relationship, was applied to various nonste-roidal GABAA receptor modulators. The EEG effects of nineprototypical GABAA receptor modulators (six benzodiazepines,one imidazopyridine, one cyclopyrrolone, and one �-carboline)were determined in rats in conjunction with plasma concentra-tions. Population PK/PD modeling revealed monophasic con-centration-EEG effect relationships with large differences inpotency (EC50) and intrinsic activity between the compounds.The data were analyzed on the basis of the mechanism-basedPK/PD model for (synthetic) neuroactive steroids on the as-sumption of a single and unique stimulus-response relation-ship. The model converged yielding estimates of both the ap-
parent in vivo receptor affinity (KPD) and the in vivo intrinsicefficacy (ePD). The values of KPD ranged from 0.41 � 0 ng�ml�1
for bretazenil to 436 � 72 ng�ml�1 for clobazam and the valuesfor ePD from �0.27 � 0 for methyl 6,7-dimethoxy-4-ethyl-�-carboline-3-carboxylate to 0.54 � 0.02 for diazepam. Signifi-cant linear correlations were observed between KPD for un-bound concentrations and the affinity in an in vitro receptorbioassay (r � 0.93) and between ePD and the GABA-shift in vitro(r � 0.95). The findings of this investigation show that the in vivoeffects of nonsteroidal GABAA receptor modulators and (syn-thetic) neuroactive steroids can be described on the basis of asingle unique transducer function. In this paradigm, the non-steroidal GABAA receptor modulators behave as partial ago-nists relative to neuroactive steroids.
The pharmacokinetic-pharmacodynamic correlations ofbenzodiazepines have been the subject of numerous studiesin both animals and humans (Danhof and Mandema, 1992;for review, see Laurijssens and Greenblatt, 1996), but thepredictive value of the proposed models seems to be limited.To date, there is an increasing interest in the development ofmechanism-based PK/PD models because they allow the pre-diction of drug effects in vivo in a strict, quantitative manneron the basis of results obtained in in vitro test systems. Thesemodels not only provide a scientific basis for the prediction ofdrug effects in humans on the basis of results obtained inanimal studies but also allow a mechanistic understanding
for observed interindividual variability in drug response(Van der Graaf and Danhof, 1997).
The need for mechanism-based modeling is illustrated bythe difficulty of predicting the in vivo intrinsic activity ofbenzodiazepine receptor partial agonists in humans on thebasis of results obtained in preclinical investigations. Forexample, in humans, the new benzodiazepine Ro 46-2153behaved as a full agonist, whereas it was selected from pre-clinical studies based on its partial agonist properties (Gog-gin et al., 2000).
In mechanism-based PK/PD models that are based on re-ceptor theory, a separation is made between the drug-specificproperties and the system-specific properties (Van der Graafand Danhof, 1997). In previous investigations, the full para-metric operational model of agonism (Black and Leff, 1983)has been applied successfully to synthetic opiates (Cox et al.,1998), adenosine A1 agonists (Van der Graaf et al., 1997,1999), and 5-hydroxytryptamine1A agonists (Zuideveld et al.,
1 Current address: AstraZeneca R&D Sodertalje, DMPK and BAC, S 15185Sodertalje, Sweden.
Article, publication date, and citation information can be found athttp://jpet.aspetjournals.org.
DOI: 10.1124/jpet.102.042341.
ABBREVIATIONS: PK/PD, pharmacokinetic/pharmacodynamic; DMCM, methyl 6,7-dimethoxy-4-ethyl-�-carboline-3-carboxylate; HPLC, high-pres-sure liquid chromatography; CCV, constant coefficient of variation; FOCE, first-order estimation method with interaction; ORG 21465, 2�-3�-5�-3-hydroxy-2-(2,2-dimethylmorpholin-4-yl)-pregnan-11,20-dione; ORG 20599, 2�-3�-5�-21-chloro-3-hydroxy-2-(4-morpholinyl)-pregnan-20-one.
0022-3565/03/3041-88–101$7.00THE JOURNAL OF PHARMACOLOGY AND EXPERIMENTAL THERAPEUTICS Vol. 304, No. 1Copyright © 2003 by The American Society for Pharmacology and Experimental Therapeutics 42341/1029541JPET 304:88–101, 2003 Printed in U.S.A.
88
2001). A characteristic feature of the operational model of ago-nism is that it contains a specific expression for the maximumeffect that is achievable in the system. However, attempts todevelop a mechanism-based PK/PD model for the effects ofbenzodiazepines have been only partially successful, which canbe explained by the fact that in the studies reported to date, nosaturation in the stimulus-response relationship has been ob-served (Tuk et al., 1999). Recently, however, significantlyhigher EEG effects have been observed for neuroactive steroidscompared with benzodiazepines, indicating that with benzodi-azepines the system maximum has not been reached (Visser etal., 2002a,b). Similar to benzodiazepines, neuroactive steroidsare selective and potent modulators of GABAA receptor function(for review, see Lambert et al., 1995). Benzodiazepines andother ligands for the benzodiazepine site exert their effectsthrough allosteric modulation of the GABAA receptor, therebyenhancing the actions of endogenous GABA (Sigel and Baur,1988). Neuroactive steroids have dual effects at the GABAA
receptor. At nanomolar concentrations neuroactive steroids po-tentiate the effect of GABA, whereas at micromolar concentra-tions they can directly activate the GABAA receptor (Cottrell etal., 1987).
Interestingly, all investigated neuroactive steroids (al-phaxalone, pregnanolone, ORG 20599, and ORG 21465)exhibited biphasic concentration-effect relationships invivo. At low concentrations the EEG effect increased frombaseline to a maximum value that was the same for eachneuroactive steroid and approximately 2 to 3 times higherthan the maximum observed for the benzodiazepine dis-playing the highest intrinsic activity (diazepam). At higherconcentrations of neuroactive steroids the effect decreasedunder the baseline toward isoelectric EEG. Based on theseobservations, a new mechanism-based PK/PD modelingapproach was proposed, which features a parameterizedbiphasic stimulus response. For alphaxalone the biphasicstimulus-response relationship was successfully charac-terized by a parabolic function (Visser et al., 2002b). Next,it was shown that a single and unique stimulus-responserelationship characterizes the effects of an array of differ-ent synthetic neuroactive steroids showing large differ-ences in potency but not in intrinsic efficacy at the GABAA
receptor (Visser et al., 2002a).In the present investigation, the mechanism-based PK/PD
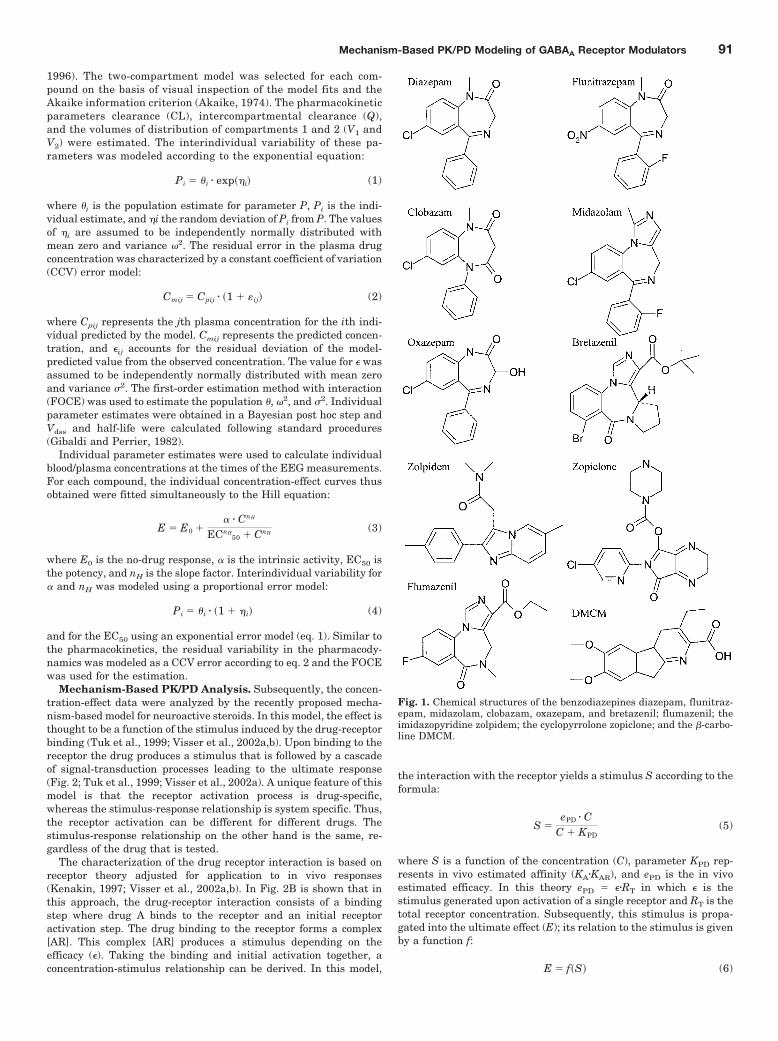
model for neuroactive steroids has been applied to the EEGeffects of various nonsteroidal GABAA receptor modulators.The EEG effects and the plasma concentrations of six benzo-diazepines (diazepam, flunitrazepam, midazolam, clobazam,oxazepam, and bretazenil), an imidazopyridine (zolpidem), acyclopyrrolone (zopiclone), and a �-carboline (methyl 6,7-dimethoxy-4-ethyl-�-carboline-3-carboxylate, DMCM) wereinvestigated in rats upon 5-min intravenous infusion. Inaddition, receptor binding studies were performed to obtainin vitro estimates of the affinity and the intrinsic efficacy onthe basis of the so-called “GABA-shift” properties (Wood etal., 1983) at the GABAA receptor.
Materials and MethodsAnimals and Surgical Procedures. The protocol of this in-
vestigation was approved by the Ethical Committee on AnimalExperimentation of Leiden University. Male Wistar rats [289 �33 g (mean � S.D.); Broekman Breeding Facilities, Someren, The
Netherlands] were used in this investigation. After surgery, therats were housed individually in standard plastic cages with anormal 12-h day/night schedule (lights on 7:00 AM) at a temper-ature of 21°C. The animals had access to standard laboratorychow (RMH-TM; Hope Farms, Woerden, The Netherlands) andacidified water ad libitum.
Nine days before the start of the experiments seven cortical elec-trodes were implanted into the skull at the locations 11 mm anteriorand 2.5 mm lateral (Fl and Fr), 3 mm anterior and 3.5 mm lateral (Cl
and Cr), and 3 mm posterior and 2.5 mm lateral (Ol and Or) tolambda, where a reference electrode was placed (Visser et al., 2002b).Stainless steel screws were used as electrodes and connected to aminiature connector, which was insulated and fixed to the skull withdental acrylic cement.
Three days before the start of the experiment, indwelling cannulaewere implanted in the right femoral artery for the serial collection ofblood samples and in the right jugular vein for drug administration.The cannulae, filled with heparinized 25% polyvinyl pyrrolidonesolution, were tunneled subcutaneously to the back of the neckwhere they were exteriorized and fixed with a rubber ring. Thesurgical procedures were performed under anesthesia with 0.1mg � kg�1 i.m. medetomidine hydrochloride (Domitor; Pfizer, Capellea/d IJssel, The Netherlands) and 1 mg � kg�1 s.c. ketamine base(Ketalar; Parke-Davis, Hoofddorp, The Netherlands). After the firstsurgery, 4 mg of ampicillin (A.U.V., Cuijk, The Netherlands) wasadministered to aid recovery.
Drugs and Dosages. Midazolam, oxazepam and diazepam werepurchased from Duchefa Pharma BV (Haarlem, The Netherlands).Clobazam, flunitrazepam, zolpidem, and DMCM were obtained fromSigma-Aldrich BV (Zwijndrecht, The Netherlands). 4-Methyl-1-piperazinecarboxylic acid 6-(5-chloro-2-pyridinyl)-6,7-dihydro-7-oxo-5H-pyrrolo[3,4-�] pyrazin-5-yl ester (zopiclone) was purchased fromTocris Cookson Inc. (Bristol, UK). Bretazenil was kindly donated byF. Hoffmann-La Roche (Basel, Switzerland). Midazolam and zolpi-dem were dissolved in 250 �l of saline with equimolar hydrochloricacid, and the other compounds were dissolved in 100 �l of dimethy-lacetamide. Rats were randomly assigned to treatment groups (n �6–9) that received 9.4 � 0.3 mg � kg�1 diazepam, 2.2 � 0.07mg � kg�1 flunitrazepam, 18.0 � 0.9 mg � kg�1 clobazam, 4.7 � 0.1mg � kg�1 midazolam, 4.0 � 0.1 mg � kg�1 zolpidem, 8.9 � 0.1mg � kg�1 oxazepam, 3.9 � 0.1 mg � kg�1 zopiclone, 2.9 � 0.1mg � kg�1 bretazenil, 0.81 � 0.03 mg � kg�1 DMCM, or vehicle in a5-min zero-order infusion.
In Vivo Pharmacological Experiments. The studies wereconducted in accordance with the requirements of national legis-lation and appropriate guidelines for animal care. All experimentswere started between 8:30 and 9:30 AM to exclude influences ofcircadian rhythms. The rats were placed in a rotating drum tocontrol the level of vigilance, thereby avoiding the interference ofsleep patterns. During the experiments, the rats were deprived offood and water. Bipolar EEG leads on the left hemisphere (Fl–Cl)were continuously recorded using a Nihon-Kohden AB-621G bio-electric amplifier (Hoekloos BV, Amsterdam, The Netherlands)and concurrently digitized at a rate of 256 Hz using a CED1401plus interface (CED, Cambridge, UK). The signal was fed intoan 80486 computer (Intel BV, Sassenheim, The Netherlands) andstored on hard disk for off-line analysis. After recording the EEGbaseline for 45 min, a zero-order intravenous infusion of one of thecompounds was administered to the conscious and freely movingrats using an infusion pump (BAS Bioanalytical Systems Inc.,West Lafayette, IN). For each 5-s epoch, quantitative EEG param-eters were obtained off-line by Fast Fourier transformation with auser-defined script within the data analysis software packageSpike 2, version 4.6 (CED). Amplitudes in the �-frequency band ofthe EEG (11.5–30 Hz) averaged over 1-min time intervals wereused as a measure of drug effect intensity.
Serial arterial blood samples were taken at predefined timepoints, and the total volume of blood sampled was kept equal to 1.8
Mechanism-Based PK/PD Modeling of GABAA Receptor Modulators 89
ml during each experiment. Bretazenil and clobazam samples wereimmediately hemolyzed in MilliQ water, to which NaF had beenadded to stop esterase activity. For the other compounds, the bloodsamples were heparinized and centrifuged at 5000 rpm for 15 min forplasma collection. Blood and plasma samples were stored at �20°Cuntil high-pressure liquid chromatographic (HPLC) analysis.
HPLC Analysis. The blood or plasma concentrations of the com-pounds were determined by a specific HPLC assay with UV detection(slightly modified from Mandema et al., 1991a; Hoogerkamp et al.,1996; Cleton et al., 1999). The procedure was as follows. The blood/plasma samples were diluted with 0.5 ml of 0.1 M NaOH, 50 �l of aninternal standard was added and the mixture was extracted with 5ml of dichloromethane/petroleum ether [45:55 (v/v)]. The mixturewas vortexed for 5 min and subsequently centrifuged for 15 min at4500g. The samples were placed at �20°C to freeze the water phase.The organic phase was transferred to a clean tube and evaporatedunder reduced pressure at 37°C. The residue was dissolved in 150 �lof mobile phase of which 40 �l was injected into the HPLC system. Amixture of 25 mM phosphate buffer and acetonitrile was used asmobile phase for midazolam [50:50 (v/v), pH 7.5], flunitrazepam[58:42 (v/v), pH 5.0], zolpidem [60:40 (v/v), pH 7.0], clobazam [60:40(v/v), pH 7.0], and DMCM [60:40 (v/v), pH 7.0]. A mixture of 25 mMacetate buffer and acetonitrile was used as mobile phase for breta-zenil [55:45 (v/v), pH 5.0], oxazepam [60:40 (v/v), pH 3.8], zopiclone[56:44 (v/v), pH 5.0], and diazepam [53:47 (v/v), pH 3.8]. The chro-matographic system consisted of a M-45 solvent delivery pump, aWISP 717 automatic injector (all of Millipore Corporation, Bedford,MA), a column (150 � 4.6 mm C18, 5 �m; Alltech BV, Breda, TheNetherlands) equipped with a hand-packed C18 guard column (20 �2 mm i.d.), and a spectroflow 757 Kratus UV detector (Spark HollandBV, Emmen, The Netherlands). Bretazenil, clobazam, diazepam,DMCM, flunitrazepam, midazolam, oxazepam, and zolpidem weredetected at wavelengths of 235, 222, 227, 278, 218, 222, 230, and 215nm, respectively. The detector output was recorded using a Shi-madzu C-R3A integrator (Shimadzu, Hertogenbosch, The Nether-lands). In some cases the analytical procedure was slightly modified(Berrueta et al., 1992). The zopiclone and flunitrazepam plasmasamples were diluted with 0.5 ml of 0.2 M borate buffer, pH 8.0, and0.5 ml of 1 M borate buffer, pH 9.5, respectively. The oxazepamsamples were diluted with 0.5 ml of 0.1 M phosphate buffer, pH 5.0,followed by methanol extraction using octadecyl 3-ml solid phaseextraction columns (Bakerbond; Baker BV, Deventer, The Nether-lands) (Mawa et al., 1996). Zopiclone concentrations were measuredusing a PerkinElmer LC240 fluorescence detector (Beaconsfield, UK)at wavelengths for excitation of 300 nm and for emission of 470 nm(Foster et al., 1994).
Linear calibration curves were obtained in the range of 0.01 to 10�g � ml�1 for each compound. Inter- and intraday variability and theextraction recovery were determined using two quality controls (0.3 and9 �g � ml�1). Limit of quantification for each compound, based on a 50-�lplasma (or 100-�l blood) sample, the inter- and intra-assay variability,and the extraction recovery were for bretazenil 0.025 �g � ml�1, 8, 5, and85%; for clobazam 0.013 �g � ml�1, 20, 20, and 83%; for diazepam 0.025�g � ml�1, 9, 8, and 95%; for DMCM 0.01 �g � ml�1, 15, 10, and 80%; forflunitrazepam 0.025 �g � ml�1, 4, 4, and 98%; for midazolam 0.025�g � ml�1, 6, 6, and 110%; for oxazepam 0.10 �g � ml�1, 5, 5, and 89%; forzolpidem 0.05 �g � ml�1, 10, 9, and 96%; and for zopiclone 0.025�g � ml�1, 10, 7, and 86%, respectively.
Protein Binding. Plasma protein binding was determined exvivo after administration of 5 mg � kg�1 (n � 3) and 10 mg � kg�1 (n �3) zopiclone or 1 mg � kg�1 DMCM (n � 6). At two time points 2-mlblood samples were drawn. For the other benzodiazepines the degreeof plasma protein binding was determined in vitro at two concentra-tions (n � 3). Freshly heparinized blood (2 ml) was spiked with thecompound and placed in a water bath at 37°C for 30 min. Afterequilibration, two samples (100 �l) of the spiked blood were hemo-lyzed with 500 �l of MilliQ water. Subsequently, the tubes werecentrifuged for 10 min at 5000 rpm for plasma collection. From each
tube, two plasma samples of 50 �l were taken and the remainingplasma was centrifuged at 37°C (15 min, 2000g) using an ultrafil-tration device (Centrifree; Millipore Corporation). Two samples of100- to 400-�l ultrafiltrate were taken. The concentration of drug inthe blood, plasma, and ultrafiltrate samples was measured by HPLC,according to the methods described above. The free fraction (fu) wascalculated by dividing the free concentration in ultrafiltrate by thetotal (bound and free) concentration in plasma.
In Vitro Pharmacology. The receptor binding affinity and theGABA-shift were determined in rat cortex homogenates in vitro.Briefly, the procedures of these assays were as follows: three groupsof rats (n � 12–15) were used to obtain three brain homogenates. Therats were sacrificed by decapitation and the whole brain was excised.The homogenates were prepared using the method described byMandema et al. (1991b), which was slightly modified. The cortex wasremoved from the whole brain and gently homogenized in 10 volumesof ice-cold “enriched” Tris buffer, pH 7.4, containing 50 mM Tris(Sigma-Aldrich), 120 mM NaCl, 5 mM KCl, 2 mM CaCl2, and 1 mMMgCl2 (all of Baker), in a Potter-Elvehjem homogenizer (10� at 4°C;Braun Potter S, Melsungen, Germany). The homogenates were cen-trifuged for 20 min at 45,000g at 4°C and the supernatant wasdiscarded. The pellets were resuspended in 10 volumes of the en-riched Tris buffer. This procedure was repeated four times. Proteinconcentration was measured using a DC protein assay (Bio-Rad BV,Veenendaal, The Netherlands). The homogenates (3 mg protein/ml)were stored in 1-ml fractions at �80°C until use.
The receptor binding characteristics (Kd and Bmax) of the radioli-gand [3H]flumazenil (specific activity 87.0 Ci/mmol; New EnglandNuclear 757, Hoofddorp, The Netherlands) were determined in sat-uration experiments in all three homogenates. Brain homogenatealiquots containing 1 mg of protein were incubated for 35 min at37°C with increasing concentrations of the radioligand (0.5–330 nM)in the absence and presence of 50 �M GABA. Subsequently, for eachcompound, the GABAA receptor binding was determined by displace-ment of [3H]flumazenil. Cortex homogenate aliquots containing 1 mgof protein were incubated for 35 min at 37°C with increasing con-centrations of the compounds and a final assay concentration of 7 nM[3H]flumazenil.
In both the saturation and the displacement experiments theefficacy of the various compounds was evaluated by examining theeffect of 50 �M GABA on the receptor binding, the so-called GABA-shift. It has been shown that the ratio of the IC50 values in theabsence and in the presence of GABA is a reflection of the agonistefficacy of the compound (Wood et al., 1983). Thus, saturation anddisplacement experiments were carried out in the absence and pres-ence of 50 �M GABA. In all experiments the nonspecific binding wasdetermined in presence of 20 �M unlabeled flumazenil. In each tube,the final assay volume was 100 �l, including the ethanol concentra-tion necessary to dissolve the compounds, fixed at 0.5% and the NaClconcentration at 1 M, to improve the assay performance. After incu-bation, the reaction was terminated by filtration through a pre-soaked GF/B filter (Whatman, Maidstone, UK) under mild suctionusing a harvester (Brandel Inc., Gaithersburg, MD). The filters werewashed three times (or five times in saturation experiments) with 5ml of ice-cold enriched Tris buffer. The filters were submerged in 5ml of Emulsifier Safe scintillation fluid (PerkinElmer Life Sciences,Boston, MA) and vortexed. After incubation of 2 h, the radioactivitywas measured with a Packard TriCarb 4640 liquid scintillationcounter. Each experiment was performed in duplicate.
Pharmacokinetic-Pharmacodynamic Data Analysis. Phar-macokinetic compartmental analysis was performed by fitting of atwo-compartment model to the concentration-time profiles of thecompounds by use of the ADVAN3 TRANS4 subroutine within thenonlinear mixed effect modeling software package NONMEM(NONMEM project group, University of California, San Francisco,CA). The NONMEM program is based on a statistical model,which explicitly takes into account both interindividual variabil-ity and intraindividual residual error (Schoemaker and Cohen,
90 Visser et al.
1996). The two-compartment model was selected for each com-pound on the basis of visual inspection of the model fits and theAkaike information criterion (Akaike, 1974). The pharmacokineticparameters clearance (CL), intercompartmental clearance (Q),and the volumes of distribution of compartments 1 and 2 (V1 andV2) were estimated. The interindividual variability of these pa-rameters was modeled according to the exponential equation:
Pi � �i � exp��i� (1)
where �i is the population estimate for parameter P, Pi is the indi-vidual estimate, and �i the random deviation of Pi from P. The valuesof �i are assumed to be independently normally distributed withmean zero and variance �2. The residual error in the plasma drugconcentration was characterized by a constant coefficient of variation(CCV) error model:
Cmij � Cpij � �1 � ij� (2)
where Cpij represents the jth plasma concentration for the ith indi-vidual predicted by the model. Cmij represents the predicted concen-tration, and ij accounts for the residual deviation of the model-predicted value from the observed concentration. The value for wasassumed to be independently normally distributed with mean zeroand variance �2. The first-order estimation method with interaction(FOCE) was used to estimate the population �, �2, and �2. Individualparameter estimates were obtained in a Bayesian post hoc step andVdss and half-life were calculated following standard procedures(Gibaldi and Perrier, 1982).
Individual parameter estimates were used to calculate individualblood/plasma concentrations at the times of the EEG measurements.For each compound, the individual concentration-effect curves thusobtained were fitted simultaneously to the Hill equation:
E � E0 �� � CnH
ECnH50 � CnH
(3)
where E0 is the no-drug response, � is the intrinsic activity, EC50 isthe potency, and nH is the slope factor. Interindividual variability for� and nH was modeled using a proportional error model:
Pi � �i � �1 � �i� (4)
and for the EC50 using an exponential error model (eq. 1). Similar tothe pharmacokinetics, the residual variability in the pharmacody-namics was modeled as a CCV error according to eq. 2 and the FOCEwas used for the estimation.
Mechanism-Based PK/PD Analysis. Subsequently, the concen-tration-effect data were analyzed by the recently proposed mecha-nism-based model for neuroactive steroids. In this model, the effect isthought to be a function of the stimulus induced by the drug-receptorbinding (Tuk et al., 1999; Visser et al., 2002a,b). Upon binding to thereceptor the drug produces a stimulus that is followed by a cascadeof signal-transduction processes leading to the ultimate response(Fig. 2; Tuk et al., 1999; Visser et al., 2002a). A unique feature of thismodel is that the receptor activation process is drug-specific,whereas the stimulus-response relationship is system specific. Thus,the receptor activation can be different for different drugs. Thestimulus-response relationship on the other hand is the same, re-gardless of the drug that is tested.
The characterization of the drug receptor interaction is based onreceptor theory adjusted for application to in vivo responses(Kenakin, 1997; Visser et al., 2002a,b). In Fig. 2B is shown that inthis approach, the drug-receptor interaction consists of a bindingstep where drug A binds to the receptor and an initial receptoractivation step. The drug binding to the receptor forms a complex[AR]. This complex [AR] produces a stimulus depending on theefficacy (). Taking the binding and initial activation together, aconcentration-stimulus relationship can be derived. In this model,
the interaction with the receptor yields a stimulus S according to theformula:
S �ePD � C
C � KPD(5)
where S is a function of the concentration (C), parameter KPD rep-resents in vivo estimated affinity (KA�KAR), and ePD is the in vivoestimated efficacy. In this theory ePD � �RT in which is thestimulus generated upon activation of a single receptor and RT is thetotal receptor concentration. Subsequently, this stimulus is propa-gated into the ultimate effect (E); its relation to the stimulus is givenby a function f:
E � f�S� (6)
Fig. 1. Chemical structures of the benzodiazepines diazepam, flunitraz-epam, midazolam, clobazam, oxazepam, and bretazenil; flumazenil; theimidazopyridine zolpidem; the cyclopyrrolone zopiclone; and the �-carbo-line DMCM.
Mechanism-Based PK/PD Modeling of GABAA Receptor Modulators 91
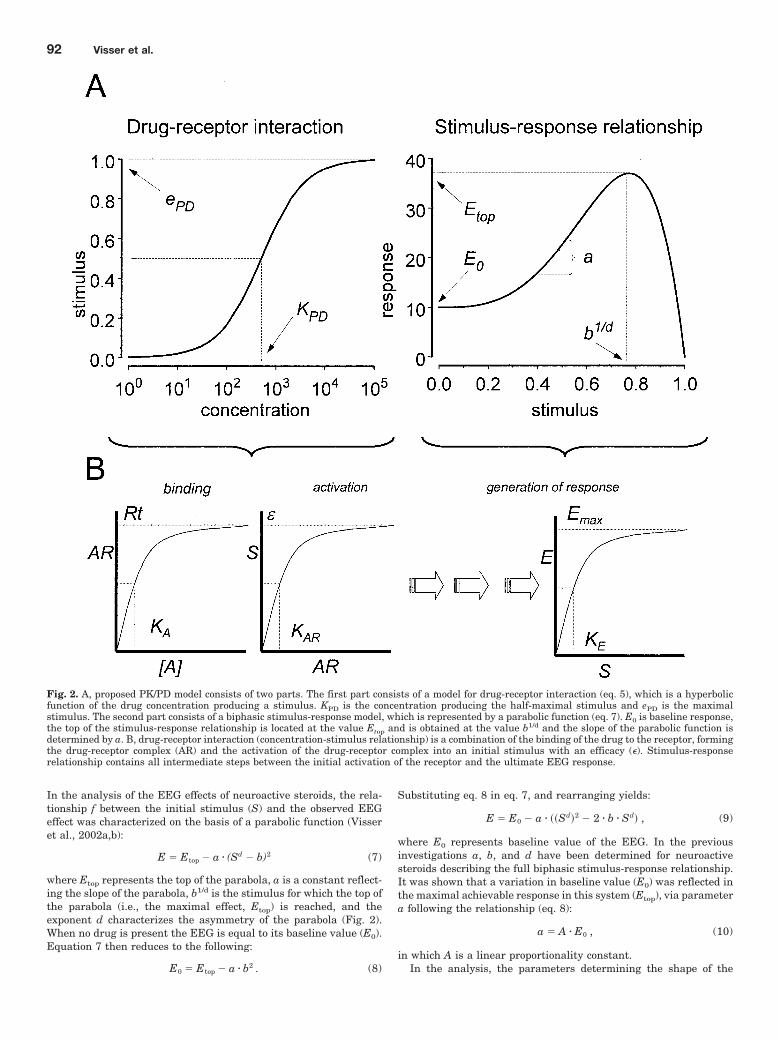
In the analysis of the EEG effects of neuroactive steroids, the rela-tionship f between the initial stimulus (S) and the observed EEGeffect was characterized on the basis of a parabolic function (Visseret al., 2002a,b):
E � Etop � a � (Sd � b)2 (7)
where Etop represents the top of the parabola, a is a constant reflect-ing the slope of the parabola, b1/d is the stimulus for which the top ofthe parabola (i.e., the maximal effect, Etop) is reached, and theexponent d characterizes the asymmetry of the parabola (Fig. 2).When no drug is present the EEG is equal to its baseline value (E0).Equation 7 then reduces to the following:
E0 � Etop � a � b2 . (8)
Substituting eq. 8 in eq. 7, and rearranging yields:
E � E0 � a � ��Sd�2 � 2 � b � Sd� , (9)
where E0 represents baseline value of the EEG. In the previousinvestigations a, b, and d have been determined for neuroactivesteroids describing the full biphasic stimulus-response relationship.It was shown that a variation in baseline value (E0) was reflected inthe maximal achievable response in this system (Etop), via parametera following the relationship (eq. 8):
a � A � E0 , (10)
in which A is a linear proportionality constant.In the analysis, the parameters determining the shape of the
Fig. 2. A, proposed PK/PD model consists of two parts. The first part consists of a model for drug-receptor interaction (eq. 5), which is a hyperbolicfunction of the drug concentration producing a stimulus. KPD is the concentration producing the half-maximal stimulus and ePD is the maximalstimulus. The second part consists of a biphasic stimulus-response model, which is represented by a parabolic function (eq. 7). E0 is baseline response,the top of the stimulus-response relationship is located at the value Etop and is obtained at the value b1/d and the slope of the parabolic function isdetermined by a. B, drug-receptor interaction (concentration-stimulus relationship) is a combination of the binding of the drug to the receptor, formingthe drug-receptor complex (AR) and the activation of the drug-receptor complex into an initial stimulus with an efficacy (). Stimulus-responserelationship contains all intermediate steps between the initial activation of the receptor and the ultimate EEG response.
92 Visser et al.
stimulus-response relationship were fixed at the previously obtainedvalues for synthetic neuroactive steroids with the correspondinginterindividual variability [A � 9.2 (22%), b � 0.44 (7%), and d �3.36 (�)], respectively (Visser et al., 2002a,b). To characterize theeffects of inverse agonists, negative ePD values must be estimated.For this reason, Sd was rewritten:
Sd � S d � 1 � S (11)
which is equal to Sd when S � 0, and equal to �(�S)d when S � 0.For each GABAA receptor modulator the values of KPD and ePD
were estimated. The ePD was estimated relative to alphaxalone forwhich ePD is 1 (i.e., maximal stimulus). Averaged amplitudes over 40min of individual EEG recordings before infusion served as input forindividual baseline values.
The interindividual variability of KPD was modeled using an ex-ponential error model, whereas interindividual variability of ePD wasmodeled using a CCV error model. Similar to the pharmacokinetics,the residual variability in the pharmacodynamics was modeled as aCCV error according to eq. 2. The FOCE method with interaction wasused to estimate the population �, �2, and �2. All fitting procedureswere performed on an IBM-compatible personal computer (PentiumIII, 450 MHz) running under Windows NT 4.0 and Visual-NM 2.2.2.(RDPP, Montpellier, France) with the use of the Microsoft FOR-TRAN PowerStation 4.0 compiler with NONMEM, version V.
In Vitro Data Analysis. The specific binding of [3H]flumazenilwas calculated by subtracting the nonspecific binding from the totalbinding measured in the saturation experiments. The [3H]flumazenilconcentrations versus the specific binding were fitted using the equa-tion:
B �Bmax � LKd � L
(12)
where B is the amount ligand bound at specific binding sites, Bmax isthe maximal amount of bound radioligand at specific binding sites,Kd is the ligand concentration at which 50% of the radioligand isbound to the receptor, and L is the free ligand concentration in thetube.
The displacement curves were described using the following equa-tion:
B � B0 �Dmax � Cd
IC50 � Cd(13)
where B0 is the specific binding of the radioligand with no displacerpresent, Dmax is the maximal displaced percentage, Cd is the concen-tration of displacer, and IC50 is the concentration of the displacer at50% inhibition of the binding of the radioligand. Estimates for Ki
values were derived from the IC50 values according to the Cheng-Prusoff equation:
Ki �IC50
1 �LKd
(14)
where Ki is the affinity of the displacer and L is the concentration ofradioligand used in the displacement studies. The GABA-shift wascalculated by dividing the IC50 in absence of GABA by the IC50 inpresence of GABA. Nonlinear regression analysis for the saturationand displacement experiments was performed by implementing theequations in NONMEM.
Statistical Analysis. Goodness-of-fit was evaluated on basis ofvisual inspection of the model fits and the value of the objectivefunction. Model selection was based on the Akaike Information Cri-terion (Akaike, 1974) and assessment of the parameter correlation.Statistical analysis was performed using one-way analysis of vari-ance (ANOVA) and a Tukey-Kramer multiple comparison test. Incase of nonhomogeneity, as determined by Bartlett’s test, the non-parametric Kruskal-Wallis test was used. Statistical tests were per-
formed using InStat, version 3.0, for Windows (GraphPad, San Di-ego, CA). All data are represented as mean � S.E.M and thesignificance level was set to � � 0.05.
ResultsPharmacokinetics and Pharmacodynamics. The con-
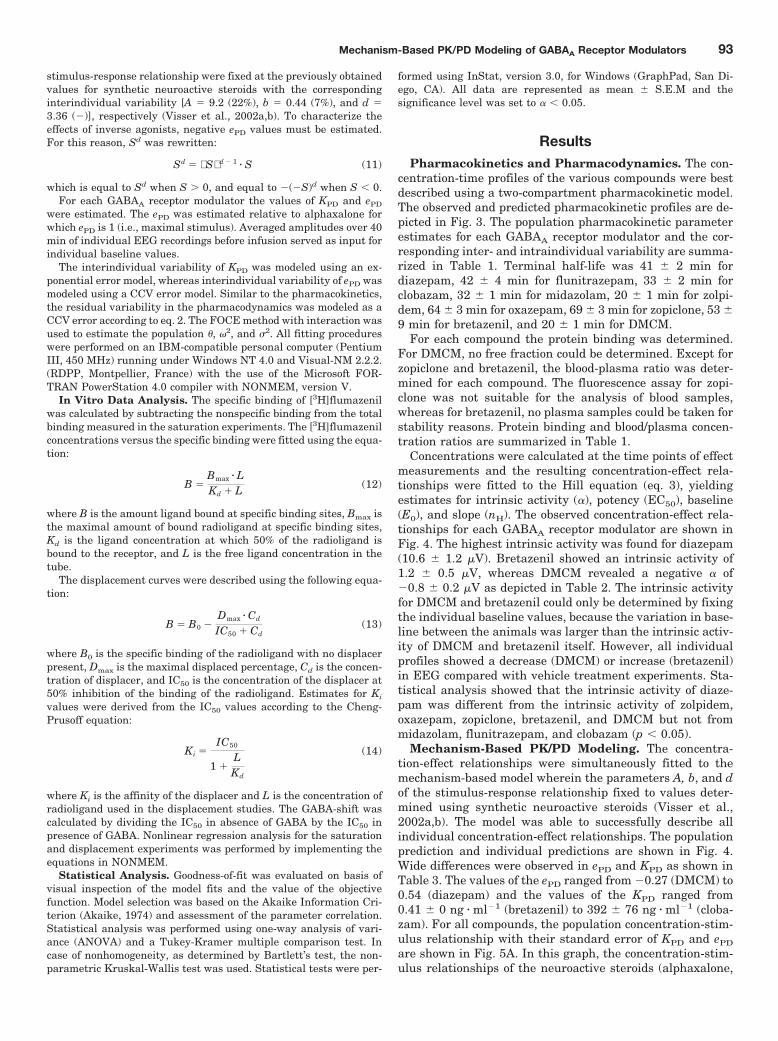
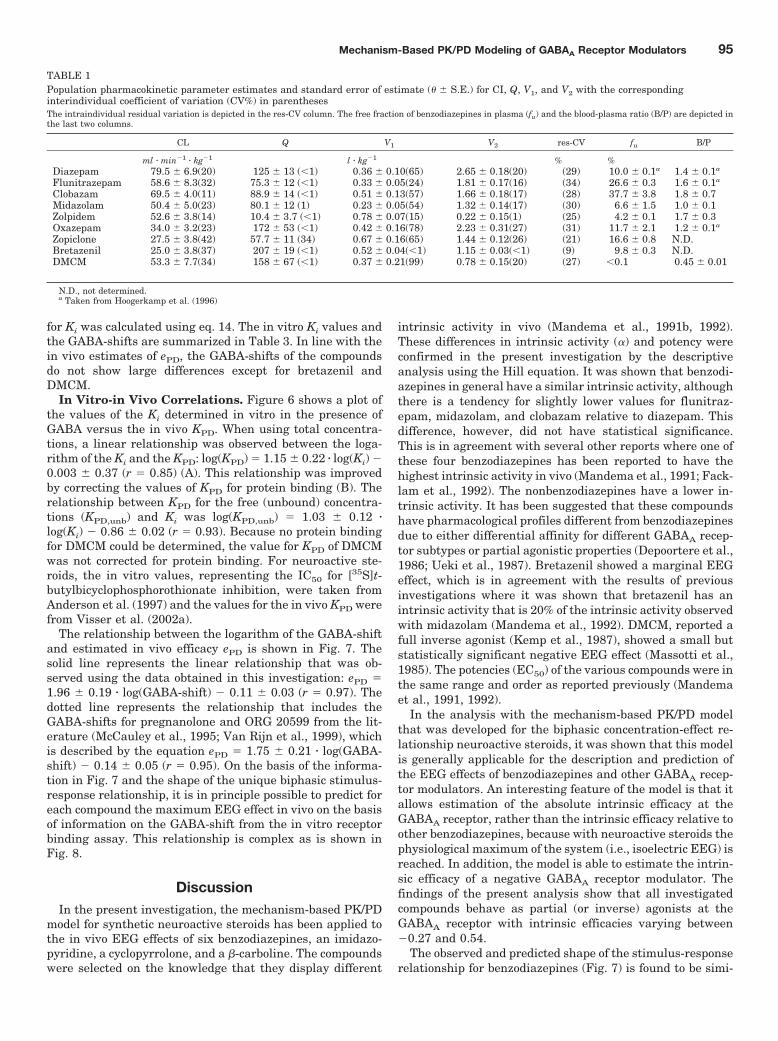
centration-time profiles of the various compounds were bestdescribed using a two-compartment pharmacokinetic model.The observed and predicted pharmacokinetic profiles are de-picted in Fig. 3. The population pharmacokinetic parameterestimates for each GABAA receptor modulator and the cor-responding inter- and intraindividual variability are summa-rized in Table 1. Terminal half-life was 41 � 2 min fordiazepam, 42 � 4 min for flunitrazepam, 33 � 2 min forclobazam, 32 � 1 min for midazolam, 20 � 1 min for zolpi-dem, 64 � 3 min for oxazepam, 69 � 3 min for zopiclone, 53 �9 min for bretazenil, and 20 � 1 min for DMCM.
For each compound the protein binding was determined.For DMCM, no free fraction could be determined. Except forzopiclone and bretazenil, the blood-plasma ratio was deter-mined for each compound. The fluorescence assay for zopi-clone was not suitable for the analysis of blood samples,whereas for bretazenil, no plasma samples could be taken forstability reasons. Protein binding and blood/plasma concen-tration ratios are summarized in Table 1.
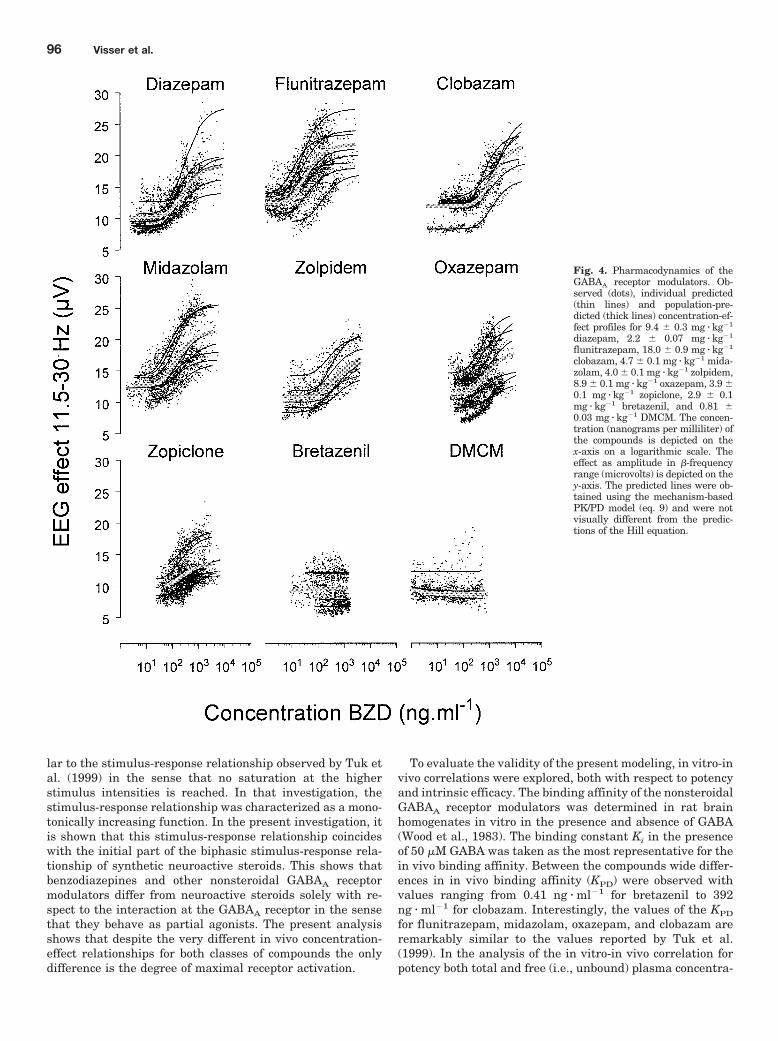
Concentrations were calculated at the time points of effectmeasurements and the resulting concentration-effect rela-tionships were fitted to the Hill equation (eq. 3), yieldingestimates for intrinsic activity (�), potency (EC50), baseline(E0), and slope (nH). The observed concentration-effect rela-tionships for each GABAA receptor modulator are shown inFig. 4. The highest intrinsic activity was found for diazepam(10.6 � 1.2 �V). Bretazenil showed an intrinsic activity of1.2 � 0.5 �V, whereas DMCM revealed a negative � of�0.8 � 0.2 �V as depicted in Table 2. The intrinsic activityfor DMCM and bretazenil could only be determined by fixingthe individual baseline values, because the variation in base-line between the animals was larger than the intrinsic activ-ity of DMCM and bretazenil itself. However, all individualprofiles showed a decrease (DMCM) or increase (bretazenil)in EEG compared with vehicle treatment experiments. Sta-tistical analysis showed that the intrinsic activity of diaze-pam was different from the intrinsic activity of zolpidem,oxazepam, zopiclone, bretazenil, and DMCM but not frommidazolam, flunitrazepam, and clobazam (p � 0.05).
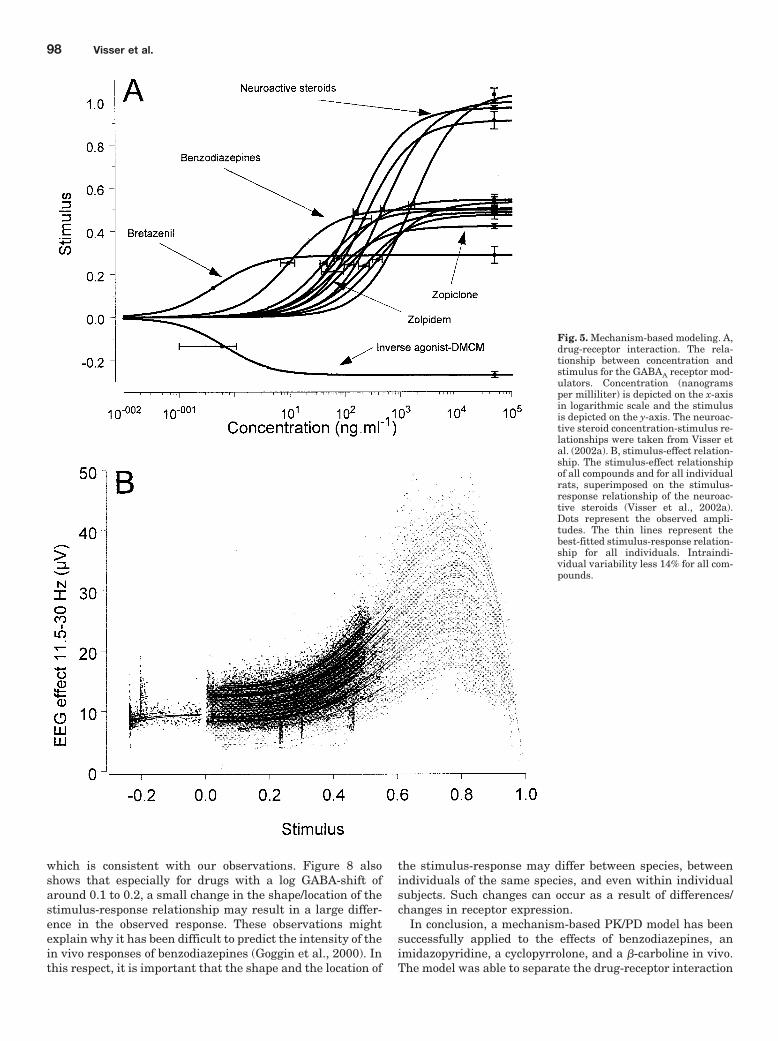
Mechanism-Based PK/PD Modeling. The concentra-tion-effect relationships were simultaneously fitted to themechanism-based model wherein the parameters A, b, and dof the stimulus-response relationship fixed to values deter-mined using synthetic neuroactive steroids (Visser et al.,2002a,b). The model was able to successfully describe allindividual concentration-effect relationships. The populationprediction and individual predictions are shown in Fig. 4.Wide differences were observed in ePD and KPD as shown inTable 3. The values of the ePD ranged from �0.27 (DMCM) to0.54 (diazepam) and the values of the KPD ranged from0.41 � 0 ng � ml�1 (bretazenil) to 392 � 76 ng � ml�1 (cloba-zam). For all compounds, the population concentration-stim-ulus relationship with their standard error of KPD and ePD
are shown in Fig. 5A. In this graph, the concentration-stim-ulus relationships of the neuroactive steroids (alphaxalone,
Mechanism-Based PK/PD Modeling of GABAA Receptor Modulators 93
pregnanolone, ORG 20599, and ORG 21465) are included(Visser et al., 2002a). Interestingly, it was observed that theGABAA receptor modulators with little difference in their invivo efficacy, show large differences in intrinsic activity (e.g.,zolpidem versus midazolam), whereas bretazenil and DMCMhad significant different estimates for in vivo efficacy, butshowed marginal EEG effects.
In Fig. 5B, the stimulus-response relationship of the ben-zodiazepines, imidazopyridine, cyclopyrrolone, and �-carbo-line are superimposed on the stimulus-response relationshipthat was found for the neuroactive steroids (Visser et al.,2002a). This analysis shows that benzodiazepines and otherallosteric GABAA receptor modulators differ from neuroac-tive steroids both with respect to affinity and intrinsic effi-cacy at the GABAA receptor.
In Vitro Pharmacology. In three homogenates, the Kd
and Bmax of [3H]flumazenil were estimated using NONMEM.The Kd and Bmax of flumazenil in absence of GABA were10.6 � 2.7 nM (51%) and 111 � 10 fmol � mg�1 protein (18%),respectively. The Kd and Bmax were not significantly affectedby the presence of 50 �M GABA [10.4 � 1.2 nM (16%) and124 � 5 fmol � mg�1 protein (15%), respectively]. This isconsistent with the fact that flumazenil acts as a competitiveantagonist at the GABAA receptor with an intrinsic efficacythat is not significantly different from zero.
Subsequently, in displacement studies, for each compoundthe IC50 for displacement of [3H]flumazenil was measured inthe presence and absence of 50 �M GABA. The displacementstudies were performed in duplicate in three homogenates.All curves were successfully described by eq. 13. The value
Fig. 3. Pharmacokinetics of theGABAA receptor modulators. Ob-served (open circles with dottedline), individual predicted (thinlines), and population predicted(thick lines) concentration-time pro-files for all compounds. Time in min-utes is depicted on the x-axis andthe concentration is depicted on they-axis on a logarithmic scale. Thename of the compound and the doseare depicted in the graphs.
94 Visser et al.
for Ki was calculated using eq. 14. The in vitro Ki values andthe GABA-shifts are summarized in Table 3. In line with thein vivo estimates of ePD, the GABA-shifts of the compoundsdo not show large differences except for bretazenil andDMCM.
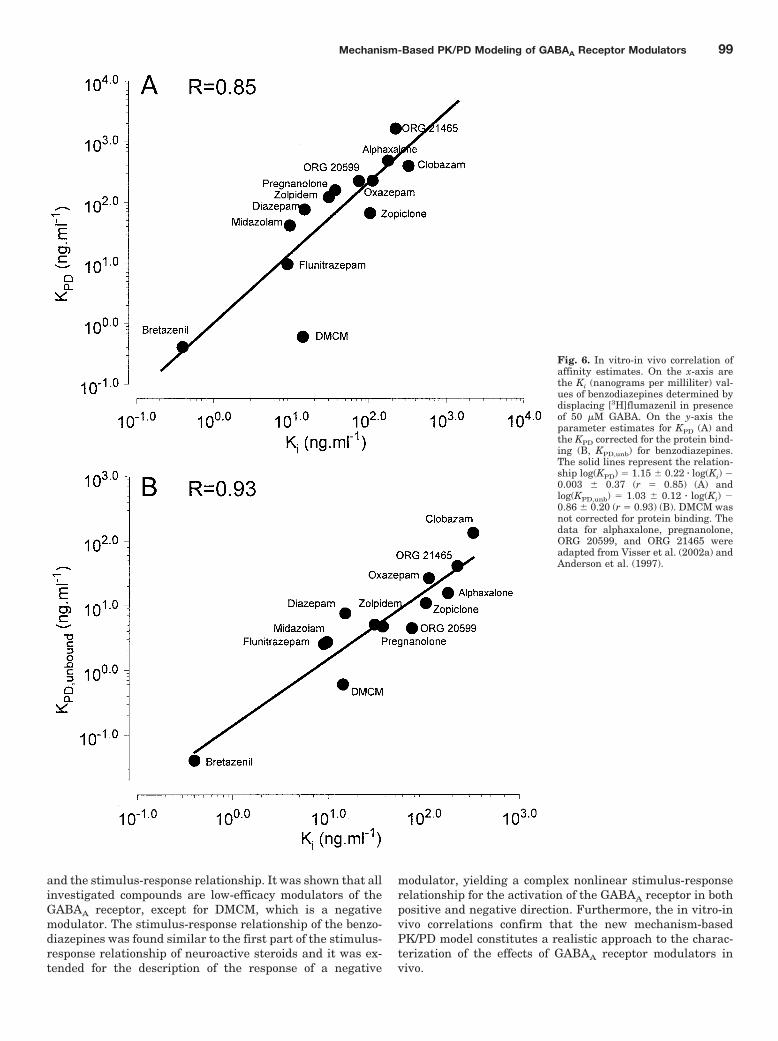
In Vitro-in Vivo Correlations. Figure 6 shows a plot ofthe values of the Ki determined in vitro in the presence ofGABA versus the in vivo KPD. When using total concentra-tions, a linear relationship was observed between the loga-rithm of the Ki and the KPD: log(KPD) � 1.15 � 0.22 � log(Ki) �0.003 � 0.37 (r � 0.85) (A). This relationship was improvedby correcting the values of KPD for protein binding (B). Therelationship between KPD for the free (unbound) concentra-tions (KPD,unb) and Ki was log(KPD,unb) � 1.03 � 0.12 �log(Ki) � 0.86 � 0.02 (r � 0.93). Because no protein bindingfor DMCM could be determined, the value for KPD of DMCMwas not corrected for protein binding. For neuroactive ste-roids, the in vitro values, representing the IC50 for [35S]t-butylbicyclophosphorothionate inhibition, were taken fromAnderson et al. (1997) and the values for the in vivo KPD werefrom Visser et al. (2002a).
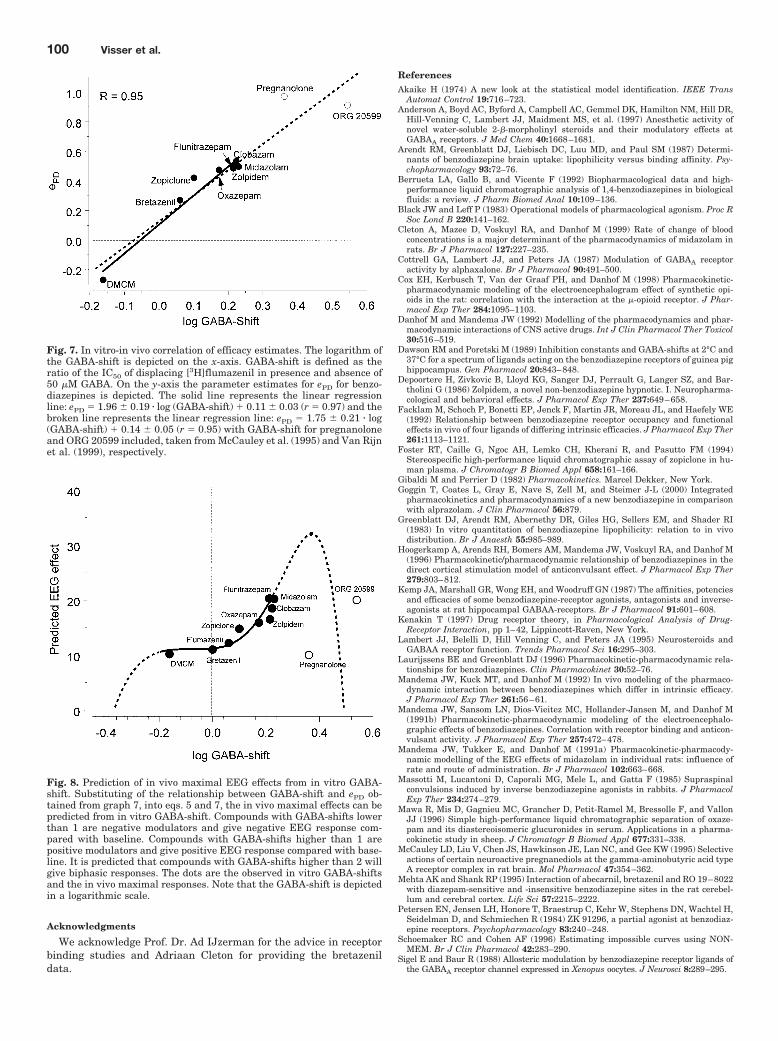
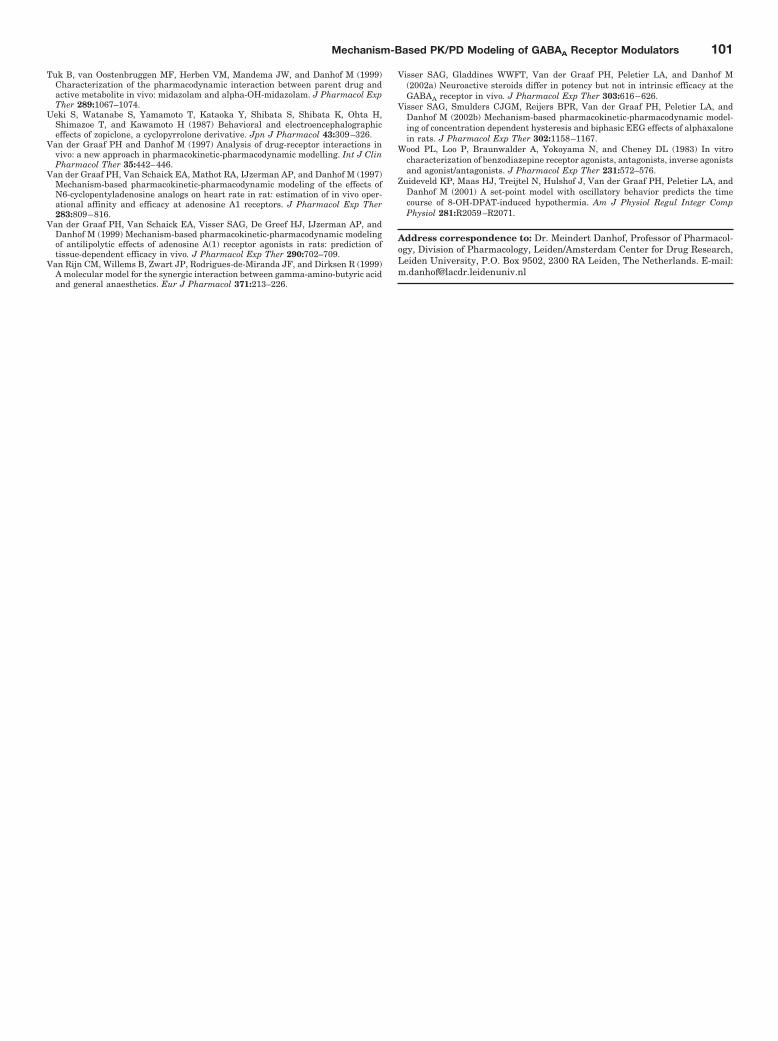
The relationship between the logarithm of the GABA-shiftand estimated in vivo efficacy ePD is shown in Fig. 7. Thesolid line represents the linear relationship that was ob-served using the data obtained in this investigation: ePD �1.96 � 0.19 � log(GABA-shift) � 0.11 � 0.03 (r � 0.97). Thedotted line represents the relationship that includes theGABA-shifts for pregnanolone and ORG 20599 from the lit-erature (McCauley et al., 1995; Van Rijn et al., 1999), whichis described by the equation ePD � 1.75 � 0.21 � log(GABA-shift) � 0.14 � 0.05 (r � 0.95). On the basis of the informa-tion in Fig. 7 and the shape of the unique biphasic stimulus-response relationship, it is in principle possible to predict foreach compound the maximum EEG effect in vivo on the basisof information on the GABA-shift from the in vitro receptorbinding assay. This relationship is complex as is shown inFig. 8.
DiscussionIn the present investigation, the mechanism-based PK/PD
model for synthetic neuroactive steroids has been applied tothe in vivo EEG effects of six benzodiazepines, an imidazo-pyridine, a cyclopyrrolone, and a �-carboline. The compoundswere selected on the knowledge that they display different
intrinsic activity in vivo (Mandema et al., 1991b, 1992).These differences in intrinsic activity (�) and potency wereconfirmed in the present investigation by the descriptiveanalysis using the Hill equation. It was shown that benzodi-azepines in general have a similar intrinsic activity, althoughthere is a tendency for slightly lower values for flunitraz-epam, midazolam, and clobazam relative to diazepam. Thisdifference, however, did not have statistical significance.This is in agreement with several other reports where one ofthese four benzodiazepines has been reported to have thehighest intrinsic activity in vivo (Mandema et al., 1991; Fack-lam et al., 1992). The nonbenzodiazepines have a lower in-trinsic activity. It has been suggested that these compoundshave pharmacological profiles different from benzodiazepinesdue to either differential affinity for different GABAA recep-tor subtypes or partial agonistic properties (Depoortere et al.,1986; Ueki et al., 1987). Bretazenil showed a marginal EEGeffect, which is in agreement with the results of previousinvestigations where it was shown that bretazenil has anintrinsic activity that is 20% of the intrinsic activity observedwith midazolam (Mandema et al., 1992). DMCM, reported afull inverse agonist (Kemp et al., 1987), showed a small butstatistically significant negative EEG effect (Massotti et al.,1985). The potencies (EC50) of the various compounds were inthe same range and order as reported previously (Mandemaet al., 1991, 1992).
In the analysis with the mechanism-based PK/PD modelthat was developed for the biphasic concentration-effect re-lationship neuroactive steroids, it was shown that this modelis generally applicable for the description and prediction ofthe EEG effects of benzodiazepines and other GABAA recep-tor modulators. An interesting feature of the model is that itallows estimation of the absolute intrinsic efficacy at theGABAA receptor, rather than the intrinsic efficacy relative toother benzodiazepines, because with neuroactive steroids thephysiological maximum of the system (i.e., isoelectric EEG) isreached. In addition, the model is able to estimate the intrin-sic efficacy of a negative GABAA receptor modulator. Thefindings of the present analysis show that all investigatedcompounds behave as partial (or inverse) agonists at theGABAA receptor with intrinsic efficacies varying between�0.27 and 0.54.
The observed and predicted shape of the stimulus-responserelationship for benzodiazepines (Fig. 7) is found to be simi-
TABLE 1Population pharmacokinetic parameter estimates and standard error of estimate (� � S.E.) for CI, Q, V1, and V2 with the correspondinginterindividual coefficient of variation (CV%) in parenthesesThe intraindividual residual variation is depicted in the res-CV column. The free fraction of benzodiazepines in plasma (fu) and the blood-plasma ratio (B/P) are depicted inthe last two columns.
CL Q V1 V2 res-CV fu B/P
ml � min�1 � kg�1 l � kg�1 % %Diazepam 79.5 � 6.9(20) 125 � 13 (�1) 0.36 � 0.10(65) 2.65 � 0.18(20) (29) 10.0 � 0.1a 1.4 � 0.1a
Flunitrazepam 58.6 � 8.3(32) 75.3 � 12 (�1) 0.33 � 0.05(24) 1.81 � 0.17(16) (34) 26.6 � 0.3 1.6 � 0.1a
Clobazam 69.5 � 4.0(11) 88.9 � 14 (�1) 0.51 � 0.13(57) 1.66 � 0.18(17) (28) 37.7 � 3.8 1.8 � 0.7Midazolam 50.4 � 5.0(23) 80.1 � 12 (1) 0.23 � 0.05(54) 1.32 � 0.14(17) (30) 6.6 � 1.5 1.0 � 0.1Zolpidem 52.6 � 3.8(14) 10.4 � 3.7 (�1) 0.78 � 0.07(15) 0.22 � 0.15(1) (25) 4.2 � 0.1 1.7 � 0.3Oxazepam 34.0 � 3.2(23) 172 � 53 (�1) 0.42 � 0.16(78) 2.23 � 0.31(27) (31) 11.7 � 2.1 1.2 � 0.1a
Zopiclone 27.5 � 3.8(42) 57.7 � 11 (34) 0.67 � 0.16(65) 1.44 � 0.12(26) (21) 16.6 � 0.8 N.D.Bretazenil 25.0 � 3.8(37) 207 � 19 (�1) 0.52 � 0.04(�1) 1.15 � 0.03(�1) (9) 9.8 � 0.3 N.D.DMCM 53.3 � 7.7(34) 158 � 67 (�1) 0.37 � 0.21(99) 0.78 � 0.15(20) (27) �0.1 0.45 � 0.01
N.D., not determined.a Taken from Hoogerkamp et al. (1996)
Mechanism-Based PK/PD Modeling of GABAA Receptor Modulators 95
lar to the stimulus-response relationship observed by Tuk etal. (1999) in the sense that no saturation at the higherstimulus intensities is reached. In that investigation, thestimulus-response relationship was characterized as a mono-tonically increasing function. In the present investigation, itis shown that this stimulus-response relationship coincideswith the initial part of the biphasic stimulus-response rela-tionship of synthetic neuroactive steroids. This shows thatbenzodiazepines and other nonsteroidal GABAA receptormodulators differ from neuroactive steroids solely with re-spect to the interaction at the GABAA receptor in the sensethat they behave as partial agonists. The present analysisshows that despite the very different in vivo concentration-effect relationships for both classes of compounds the onlydifference is the degree of maximal receptor activation.
To evaluate the validity of the present modeling, in vitro-invivo correlations were explored, both with respect to potencyand intrinsic efficacy. The binding affinity of the nonsteroidalGABAA receptor modulators was determined in rat brainhomogenates in vitro in the presence and absence of GABA(Wood et al., 1983). The binding constant Ki in the presenceof 50 �M GABA was taken as the most representative for thein vivo binding affinity. Between the compounds wide differ-ences in in vivo binding affinity (KPD) were observed withvalues ranging from 0.41 ng � ml�1 for bretazenil to 392ng � ml�1 for clobazam. Interestingly, the values of the KPD
for flunitrazepam, midazolam, oxazepam, and clobazam areremarkably similar to the values reported by Tuk et al.(1999). In the analysis of the in vitro-in vivo correlation forpotency both total and free (i.e., unbound) plasma concentra-
Fig. 4. Pharmacodynamics of theGABAA receptor modulators. Ob-served (dots), individual predicted(thin lines) and population-pre-dicted (thick lines) concentration-ef-fect profiles for 9.4 � 0.3 mg � kg�1
diazepam, 2.2 � 0.07 mg � kg�1
flunitrazepam, 18.0 � 0.9 mg � kg�1
clobazam, 4.7 � 0.1 mg � kg�1 mida-zolam, 4.0 � 0.1 mg � kg�1 zolpidem,8.9 � 0.1 mg � kg�1 oxazepam, 3.9 �0.1 mg � kg�1 zopiclone, 2.9 � 0.1mg � kg�1 bretazenil, and 0.81 �0.03 mg � kg�1 DMCM. The concen-tration (nanograms per milliliter) ofthe compounds is depicted on thex-axis on a logarithmic scale. Theeffect as amplitude in �-frequencyrange (microvolts) is depicted on they-axis. The predicted lines were ob-tained using the mechanism-basedPK/PD model (eq. 9) and were notvisually different from the predic-tions of the Hill equation.
96 Visser et al.
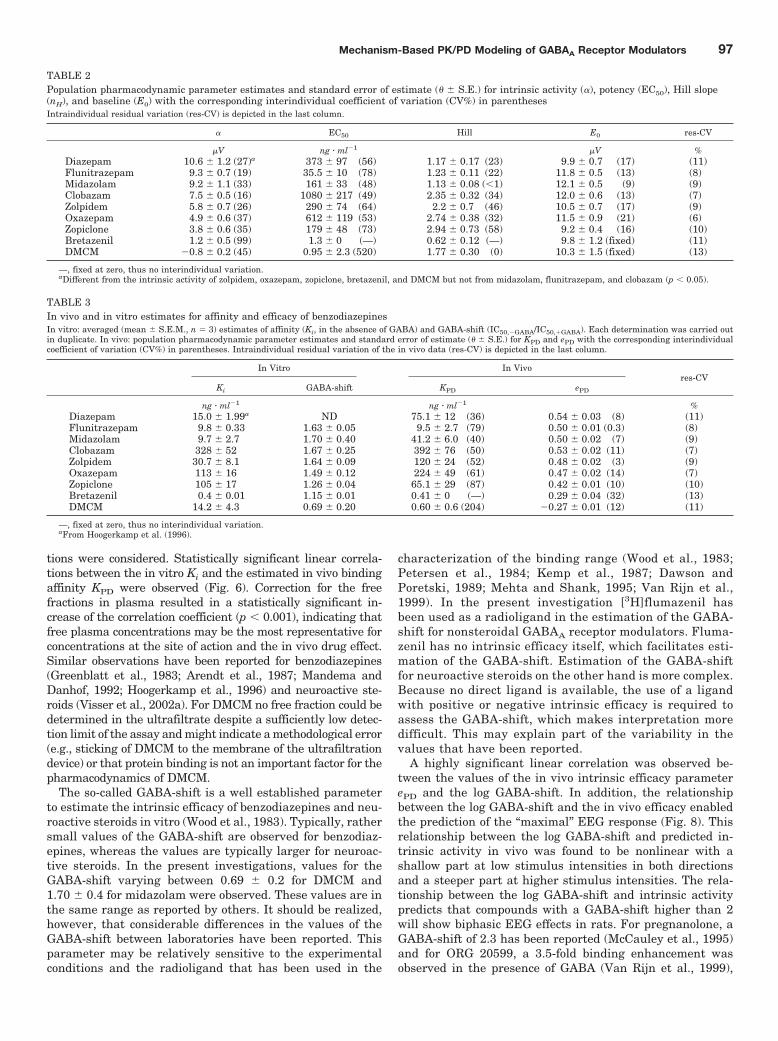
tions were considered. Statistically significant linear correla-tions between the in vitro Ki and the estimated in vivo bindingaffinity KPD were observed (Fig. 6). Correction for the freefractions in plasma resulted in a statistically significant in-crease of the correlation coefficient (p � 0.001), indicating thatfree plasma concentrations may be the most representative forconcentrations at the site of action and the in vivo drug effect.Similar observations have been reported for benzodiazepines(Greenblatt et al., 1983; Arendt et al., 1987; Mandema andDanhof, 1992; Hoogerkamp et al., 1996) and neuroactive ste-roids (Visser et al., 2002a). For DMCM no free fraction could bedetermined in the ultrafiltrate despite a sufficiently low detec-tion limit of the assay and might indicate a methodological error(e.g., sticking of DMCM to the membrane of the ultrafiltrationdevice) or that protein binding is not an important factor for thepharmacodynamics of DMCM.
The so-called GABA-shift is a well established parameterto estimate the intrinsic efficacy of benzodiazepines and neu-roactive steroids in vitro (Wood et al., 1983). Typically, rathersmall values of the GABA-shift are observed for benzodiaz-epines, whereas the values are typically larger for neuroac-tive steroids. In the present investigations, values for theGABA-shift varying between 0.69 � 0.2 for DMCM and1.70 � 0.4 for midazolam were observed. These values are inthe same range as reported by others. It should be realized,however, that considerable differences in the values of theGABA-shift between laboratories have been reported. Thisparameter may be relatively sensitive to the experimentalconditions and the radioligand that has been used in the
characterization of the binding range (Wood et al., 1983;Petersen et al., 1984; Kemp et al., 1987; Dawson andPoretski, 1989; Mehta and Shank, 1995; Van Rijn et al.,1999). In the present investigation [3H]flumazenil hasbeen used as a radioligand in the estimation of the GABA-shift for nonsteroidal GABAA receptor modulators. Fluma-zenil has no intrinsic efficacy itself, which facilitates esti-mation of the GABA-shift. Estimation of the GABA-shiftfor neuroactive steroids on the other hand is more complex.Because no direct ligand is available, the use of a ligandwith positive or negative intrinsic efficacy is required toassess the GABA-shift, which makes interpretation moredifficult. This may explain part of the variability in thevalues that have been reported.
A highly significant linear correlation was observed be-tween the values of the in vivo intrinsic efficacy parameterePD and the log GABA-shift. In addition, the relationshipbetween the log GABA-shift and the in vivo efficacy enabledthe prediction of the “maximal” EEG response (Fig. 8). Thisrelationship between the log GABA-shift and predicted in-trinsic activity in vivo was found to be nonlinear with ashallow part at low stimulus intensities in both directionsand a steeper part at higher stimulus intensities. The rela-tionship between the log GABA-shift and intrinsic activitypredicts that compounds with a GABA-shift higher than 2will show biphasic EEG effects in rats. For pregnanolone, aGABA-shift of 2.3 has been reported (McCauley et al., 1995)and for ORG 20599, a 3.5-fold binding enhancement wasobserved in the presence of GABA (Van Rijn et al., 1999),
TABLE 2Population pharmacodynamic parameter estimates and standard error of estimate (� � S.E.) for intrinsic activity (�), potency (EC50), Hill slope(nH), and baseline (E0) with the corresponding interindividual coefficient of variation (CV%) in parenthesesIntraindividual residual variation (res-CV) is depicted in the last column.
� EC50 Hill E0 res-CV
�V ng � ml�1 �V %Diazepam 10.6 � 1.2 (27)a 373 � 97 (56) 1.17 � 0.17 (23) 9.9 � 0.7 (17) (11)Flunitrazepam 9.3 � 0.7 (19) 35.5 � 10 (78) 1.23 � 0.11 (22) 11.8 � 0.5 (13) (8)Midazolam 9.2 � 1.1 (33) 161 � 33 (48) 1.13 � 0.08 (�1) 12.1 � 0.5 (9) (9)Clobazam 7.5 � 0.5 (16) 1080 � 217 (49) 2.35 � 0.32 (34) 12.0 � 0.6 (13) (7)Zolpidem 5.8 � 0.7 (26) 290 � 74 (64) 2.2 � 0.7 (46) 10.5 � 0.7 (17) (9)Oxazepam 4.9 � 0.6 (37) 612 � 119 (53) 2.74 � 0.38 (32) 11.5 � 0.9 (21) (6)Zopiclone 3.8 � 0.6 (35) 179 � 48 (73) 2.94 � 0.73 (58) 9.2 � 0.4 (16) (10)Bretazenil 1.2 � 0.5 (99) 1.3 � 0 (—) 0.62 � 0.12 (—) 9.8 � 1.2 (fixed) (11)DMCM �0.8 � 0.2 (45) 0.95 � 2.3 (520) 1.77 � 0.30 (0) 10.3 � 1.5 (fixed) (13)
—, fixed at zero, thus no interindividual variation.aDifferent from the intrinsic activity of zolpidem, oxazepam, zopiclone, bretazenil, and DMCM but not from midazolam, flunitrazepam, and clobazam (p � 0.05).
TABLE 3In vivo and in vitro estimates for affinity and efficacy of benzodiazepinesIn vitro: averaged (mean � S.E.M., n � 3) estimates of affinity (Ki, in the absence of GABA) and GABA-shift (IC50,�GABA/IC50,GABA). Each determination was carried outin duplicate. In vivo: population pharmacodynamic parameter estimates and standard error of estimate (� � S.E.) for KPD and ePD with the corresponding interindividualcoefficient of variation (CV%) in parentheses. Intraindividual residual variation of the in vivo data (res-CV) is depicted in the last column.
In Vitro In Vivores-CV
Ki GABA-shift KPD ePD
ng � ml�1 ng � ml�1 %Diazepam 15.0 � 1.99a ND 75.1 � 12 (36) 0.54 � 0.03 (8) (11)Flunitrazepam 9.8 � 0.33 1.63 � 0.05 9.5 � 2.7 (79) 0.50 � 0.01 (0.3) (8)Midazolam 9.7 � 2.7 1.70 � 0.40 41.2 � 6.0 (40) 0.50 � 0.02 (7) (9)Clobazam 328 � 52 1.67 � 0.25 392 � 76 (50) 0.53 � 0.02 (11) (7)Zolpidem 30.7 � 8.1 1.64 � 0.09 120 � 24 (52) 0.48 � 0.02 (3) (9)Oxazepam 113 � 16 1.49 � 0.12 224 � 49 (61) 0.47 � 0.02 (14) (7)Zopiclone 105 � 17 1.26 � 0.04 65.1 � 29 (87) 0.42 � 0.01 (10) (10)Bretazenil 0.4 � 0.01 1.15 � 0.01 0.41 � 0 (—) 0.29 � 0.04 (32) (13)DMCM 14.2 � 4.3 0.69 � 0.20 0.60 � 0.6 (204) �0.27 � 0.01 (12) (11)
—, fixed at zero, thus no interindividual variation.aFrom Hoogerkamp et al. (1996).
Mechanism-Based PK/PD Modeling of GABAA Receptor Modulators 97
which is consistent with our observations. Figure 8 alsoshows that especially for drugs with a log GABA-shift ofaround 0.1 to 0.2, a small change in the shape/location of thestimulus-response relationship may result in a large differ-ence in the observed response. These observations mightexplain why it has been difficult to predict the intensity of thein vivo responses of benzodiazepines (Goggin et al., 2000). Inthis respect, it is important that the shape and the location of
the stimulus-response may differ between species, betweenindividuals of the same species, and even within individualsubjects. Such changes can occur as a result of differences/changes in receptor expression.
In conclusion, a mechanism-based PK/PD model has beensuccessfully applied to the effects of benzodiazepines, animidazopyridine, a cyclopyrrolone, and a �-carboline in vivo.The model was able to separate the drug-receptor interaction
Fig. 5. Mechanism-based modeling. A,drug-receptor interaction. The rela-tionship between concentration andstimulus for the GABAA receptor mod-ulators. Concentration (nanogramsper milliliter) is depicted on the x-axisin logarithmic scale and the stimulusis depicted on the y-axis. The neuroac-tive steroid concentration-stimulus re-lationships were taken from Visser etal. (2002a). B, stimulus-effect relation-ship. The stimulus-effect relationshipof all compounds and for all individualrats, superimposed on the stimulus-response relationship of the neuroac-tive steroids (Visser et al., 2002a).Dots represent the observed ampli-tudes. The thin lines represent thebest-fitted stimulus-response relation-ship for all individuals. Intraindi-vidual variability less 14% for all com-pounds.
98 Visser et al.
and the stimulus-response relationship. It was shown that allinvestigated compounds are low-efficacy modulators of theGABAA receptor, except for DMCM, which is a negativemodulator. The stimulus-response relationship of the benzo-diazepines was found similar to the first part of the stimulus-response relationship of neuroactive steroids and it was ex-tended for the description of the response of a negative
modulator, yielding a complex nonlinear stimulus-responserelationship for the activation of the GABAA receptor in bothpositive and negative direction. Furthermore, the in vitro-invivo correlations confirm that the new mechanism-basedPK/PD model constitutes a realistic approach to the charac-terization of the effects of GABAA receptor modulators invivo.
Fig. 6. In vitro-in vivo correlation ofaffinity estimates. On the x-axis arethe Ki (nanograms per milliliter) val-ues of benzodiazepines determined bydisplacing [3H]flumazenil in presenceof 50 �M GABA. On the y-axis theparameter estimates for KPD (A) andthe KPD corrected for the protein bind-ing (B, KPD,unb) for benzodiazepines.The solid lines represent the relation-ship log(KPD) � 1.15 � 0.22 � log(Ki) �0.003 � 0.37 (r � 0.85) (A) andlog(KPD,unb) � 1.03 � 0.12 � log(Ki) �0.86 � 0.20 (r � 0.93) (B). DMCM wasnot corrected for protein binding. Thedata for alphaxalone, pregnanolone,ORG 20599, and ORG 21465 wereadapted from Visser et al. (2002a) andAnderson et al. (1997).
Mechanism-Based PK/PD Modeling of GABAA Receptor Modulators 99
Acknowledgments
We acknowledge Prof. Dr. Ad IJzerman for the advice in receptorbinding studies and Adriaan Cleton for providing the bretazenildata.
ReferencesAkaike H (1974) A new look at the statistical model identification. IEEE Trans
Automat Control 19:716–723.Anderson A, Boyd AC, Byford A, Campbell AC, Gemmel DK, Hamilton NM, Hill DR,
Hill-Venning C, Lambert JJ, Maidment MS, et al. (1997) Anesthetic activity ofnovel water-soluble 2-�-morpholinyl steroids and their modulatory effects atGABAA receptors. J Med Chem 40:1668–1681.
Arendt RM, Greenblatt DJ, Liebisch DC, Luu MD, and Paul SM (1987) Determi-nants of benzodiazepine brain uptake: lipophilicity versus binding affinity. Psy-chopharmacology 93:72–76.
Berrueta LA, Gallo B, and Vicente F (1992) Biopharmacological data and high-performance liquid chromatographic analysis of 1,4-benzodiazepines in biologicalfluids: a review. J Pharm Biomed Anal 10:109–136.
Black JW and Leff P (1983) Operational models of pharmacological agonism. Proc RSoc Lond B 220:141–162.
Cleton A, Mazee D, Voskuyl RA, and Danhof M (1999) Rate of change of bloodconcentrations is a major determinant of the pharmacodynamics of midazolam inrats. Br J Pharmacol 127:227–235.
Cottrell GA, Lambert JJ, and Peters JA (1987) Modulation of GABAA receptoractivity by alphaxalone. Br J Pharmacol 90:491–500.
Cox EH, Kerbusch T, Van der Graaf PH, and Danhof M (1998) Pharmacokinetic-pharmacodynamic modeling of the electroencephalogram effect of synthetic opi-oids in the rat: correlation with the interaction at the �-opioid receptor. J Phar-macol Exp Ther 284:1095–1103.
Danhof M and Mandema JW (1992) Modelling of the pharmacodynamics and phar-macodynamic interactions of CNS active drugs. Int J Clin Pharmacol Ther Toxicol30:516–519.
Dawson RM and Poretski M (1989) Inhibition constants and GABA-shifts at 2°C and37°C for a spectrum of ligands acting on the benzodiazepine receptors of guinea pighippocampus. Gen Pharmacol 20:843–848.
Depoortere H, Zivkovic B, Lloyd KG, Sanger DJ, Perrault G, Langer SZ, and Bar-tholini G (1986) Zolpidem, a novel non-benzodiazepine hypnotic. I. Neuropharma-cological and behavioral effects. J Pharmacol Exp Ther 237:649–658.
Facklam M, Schoch P, Bonetti EP, Jenck F, Martin JR, Moreau JL, and Haefely WE(1992) Relationship between benzodiazepine receptor occupancy and functionaleffects in vivo of four ligands of differing intrinsic efficacies. J Pharmacol Exp Ther261:1113–1121.
Foster RT, Caille G, Ngoc AH, Lemko CH, Kherani R, and Pasutto FM (1994)Stereospecific high-performance liquid chromatographic assay of zopiclone in hu-man plasma. J Chromatogr B Biomed Appl 658:161–166.
Gibaldi M and Perrier D (1982) Pharmacokinetics. Marcel Dekker, New York.Goggin T, Coates L, Gray E, Nave S, Zell M, and Steimer J-L (2000) Integrated
pharmacokinetics and pharmacodynamics of a new benzodiazepine in comparisonwith alprazolam. J Clin Pharmacol 56:879.
Greenblatt DJ, Arendt RM, Abernethy DR, Giles HG, Sellers EM, and Shader RI(1983) In vitro quantitation of benzodiazepine lipophilicity: relation to in vivodistribution. Br J Anaesth 55:985–989.
Hoogerkamp A, Arends RH, Bomers AM, Mandema JW, Voskuyl RA, and Danhof M(1996) Pharmacokinetic/pharmacodynamic relationship of benzodiazepines in thedirect cortical stimulation model of anticonvulsant effect. J Pharmacol Exp Ther279:803–812.
Kemp JA, Marshall GR, Wong EH, and Woodruff GN (1987) The affinities, potenciesand efficacies of some benzodiazepine-receptor agonists, antagonists and inverse-agonists at rat hippocampal GABAA-receptors. Br J Pharmacol 91:601–608.
Kenakin T (1997) Drug receptor theory, in Pharmacological Analysis of Drug-Receptor Interaction, pp 1–42, Lippincott-Raven, New York.
Lambert JJ, Belelli D, Hill Venning C, and Peters JA (1995) Neurosteroids andGABAA receptor function. Trends Pharmacol Sci 16:295–303.
Laurijssens BE and Greenblatt DJ (1996) Pharmacokinetic-pharmacodynamic rela-tionships for benzodiazepines. Clin Pharmacokinet 30:52–76.
Mandema JW, Kuck MT, and Danhof M (1992) In vivo modeling of the pharmaco-dynamic interaction between benzodiazepines which differ in intrinsic efficacy.J Pharmacol Exp Ther 261:56–61.
Mandema JW, Sansom LN, Dios-Vieitez MC, Hollander-Jansen M, and Danhof M(1991b) Pharmacokinetic-pharmacodynamic modeling of the electroencephalo-graphic effects of benzodiazepines. Correlation with receptor binding and anticon-vulsant activity. J Pharmacol Exp Ther 257:472–478.
Mandema JW, Tukker E, and Danhof M (1991a) Pharmacokinetic-pharmacody-namic modelling of the EEG effects of midazolam in individual rats: influence ofrate and route of administration. Br J Pharmacol 102:663–668.
Massotti M, Lucantoni D, Caporali MG, Mele L, and Gatta F (1985) Supraspinalconvulsions induced by inverse benzodiazepine agonists in rabbits. J PharmacolExp Ther 234:274–279.
Mawa R, Mis D, Gagnieu MC, Grancher D, Petit-Ramel M, Bressolle F, and VallonJJ (1996) Simple high-performance liquid chromatographic separation of oxaze-pam and its diastereoisomeric glucuronides in serum. Applications in a pharma-cokinetic study in sheep. J Chromatogr B Biomed Appl 677:331–338.
McCauley LD, Liu V, Chen JS, Hawkinson JE, Lan NC, and Gee KW (1995) Selectiveactions of certain neuroactive pregnanediols at the gamma-aminobutyric acid typeA receptor complex in rat brain. Mol Pharmacol 47:354–362.
Mehta AK and Shank RP (1995) Interaction of abecarnil, bretazenil and RO 19–8022with diazepam-sensitive and -insensitive benzodiazepine sites in the rat cerebel-lum and cerebral cortex. Life Sci 57:2215–2222.
Petersen EN, Jensen LH, Honore T, Braestrup C, Kehr W, Stephens DN, Wachtel H,Seidelman D, and Schmiechen R (1984) ZK 91296, a partial agonist at benzodiaz-epine receptors. Psychopharmacology 83:240–248.
Schoemaker RC and Cohen AF (1996) Estimating impossible curves using NON-MEM. Br J Clin Pharmacol 42:283–290.
Sigel E and Baur R (1988) Allosteric modulation by benzodiazepine receptor ligands ofthe GABAA receptor channel expressed in Xenopus oocytes. J Neurosci 8:289–295.
Fig. 8. Prediction of in vivo maximal EEG effects from in vitro GABA-shift. Substituting of the relationship between GABA-shift and ePD ob-tained from graph 7, into eqs. 5 and 7, the in vivo maximal effects can bepredicted from in vitro GABA-shift. Compounds with GABA-shifts lowerthan 1 are negative modulators and give negative EEG response com-pared with baseline. Compounds with GABA-shifts higher than 1 arepositive modulators and give positive EEG response compared with base-line. It is predicted that compounds with GABA-shifts higher than 2 willgive biphasic responses. The dots are the observed in vitro GABA-shiftsand the in vivo maximal responses. Note that the GABA-shift is depictedin a logarithmic scale.
Fig. 7. In vitro-in vivo correlation of efficacy estimates. The logarithm ofthe GABA-shift is depicted on the x-axis. GABA-shift is defined as theratio of the IC50 of displacing [3H]flumazenil in presence and absence of50 �M GABA. On the y-axis the parameter estimates for ePD for benzo-diazepines is depicted. The solid line represents the linear regressionline: ePD � 1.96 � 0.19 � log (GABA-shift) 0.11 � 0.03 (r � 0.97) and thebroken line represents the linear regression line: ePD � 1.75 � 0.21 � log(GABA-shift) 0.14 � 0.05 (r � 0.95) with GABA-shift for pregnanoloneand ORG 20599 included, taken from McCauley et al. (1995) and Van Rijnet al. (1999), respectively.
100 Visser et al.
Tuk B, van Oostenbruggen MF, Herben VM, Mandema JW, and Danhof M (1999)Characterization of the pharmacodynamic interaction between parent drug andactive metabolite in vivo: midazolam and alpha-OH-midazolam. J Pharmacol ExpTher 289:1067–1074.
Ueki S, Watanabe S, Yamamoto T, Kataoka Y, Shibata S, Shibata K, Ohta H,Shimazoe T, and Kawamoto H (1987) Behavioral and electroencephalographiceffects of zopiclone, a cyclopyrrolone derivative. Jpn J Pharmacol 43:309–326.
Van der Graaf PH and Danhof M (1997) Analysis of drug-receptor interactions invivo: a new approach in pharmacokinetic-pharmacodynamic modelling. Int J ClinPharmacol Ther 35:442–446.
Van der Graaf PH, Van Schaick EA, Mathot RA, IJzerman AP, and Danhof M (1997)Mechanism-based pharmacokinetic-pharmacodynamic modeling of the effects ofN6-cyclopentyladenosine analogs on heart rate in rat: estimation of in vivo oper-ational affinity and efficacy at adenosine A1 receptors. J Pharmacol Exp Ther283:809–816.
Van der Graaf PH, Van Schaick EA, Visser SAG, De Greef HJ, IJzerman AP, andDanhof M (1999) Mechanism-based pharmacokinetic-pharmacodynamic modelingof antilipolytic effects of adenosine A(1) receptor agonists in rats: prediction oftissue-dependent efficacy in vivo. J Pharmacol Exp Ther 290:702–709.
Van Rijn CM, Willems B, Zwart JP, Rodrigues-de-Miranda JF, and Dirksen R (1999)A molecular model for the synergic interaction between gamma-amino-butyric acidand general anaesthetics. Eur J Pharmacol 371:213–226.
Visser SAG, Gladdines WWFT, Van der Graaf PH, Peletier LA, and Danhof M(2002a) Neuroactive steroids differ in potency but not in intrinsic efficacy at theGABAA receptor in vivo. J Pharmacol Exp Ther 303:616–626.
Visser SAG, Smulders CJGM, Reijers BPR, Van der Graaf PH, Peletier LA, andDanhof M (2002b) Mechanism-based pharmacokinetic-pharmacodynamic model-ing of concentration dependent hysteresis and biphasic EEG effects of alphaxalonein rats. J Pharmacol Exp Ther 302:1158–1167.
Wood PL, Loo P, Braunwalder A, Yokoyama N, and Cheney DL (1983) In vitrocharacterization of benzodiazepine receptor agonists, antagonists, inverse agonistsand agonist/antagonists. J Pharmacol Exp Ther 231:572–576.
Zuideveld KP, Maas HJ, Treijtel N, Hulshof J, Van der Graaf PH, Peletier LA, andDanhof M (2001) A set-point model with oscillatory behavior predicts the timecourse of 8-OH-DPAT-induced hypothermia. Am J Physiol Regul Integr CompPhysiol 281:R2059–R2071.
Address correspondence to: Dr. Meindert Danhof, Professor of Pharmacol-ogy, Division of Pharmacology, Leiden/Amsterdam Center for Drug Research,Leiden University, P.O. Box 9502, 2300 RA Leiden, The Netherlands. E-mail:[email protected]
Mechanism-Based PK/PD Modeling of GABAA Receptor Modulators 101