Embed Size (px)
Citation preview
MECHANICAL PROPERTYCHARACTERIZATION AND ENHANCEMENT
OF RIGID ROD POLYMER FIBERS
by
MAUREEN THERESA FAHEY
submitted to
THE DEPARTMENT OFMATE~SSCffiNCEANDENGThffiERING
in partial fulfillment of therequirement for the degree of
BACHELOR OF SCffiNCE
at the
MASSACHUSETIS INSTITUTE OF TECHNOLOGY
June 1990
@ Massachusetts Institute of Technology 1990All rights reserved
Signature of Author -I-- --+ _
pepartment of Matert~ls Sciellce and EngineeringMay 11, 1990
Certified by _
Accepted by ______
ARC\-\\VES
re .ck J. McGarrycience and Engineering
Thesis Supervisor
\ David K. RoylanceChairman, Department Undergraduate Committee
MASSACHUSETTS INSTiTUTEOF TECHNOl.OGY
L-~UL19 1990- .• oJ
LIBRARIES
MECHANICAL PROPERTYCHARACTERIZATION AND ENHANCEMENT
OF RIGID ROD POLYMER FIBERS
by
MAUREEN T. FAHEY
Submitted to the Department of Materials Science and Engineering on May 11, 1990 in partialfulfillment of the requirements for the degree of Bachelor of Science.
ABSTRACT
Despite promising tensile behavior, the use of rigid rod polymer fibers such asKevlar™ 49 and PBO is limited by fiber compressive strength. By depositing thin coatings ofhigh modulus materials on the fiber, ultimate compressive strength as well as averageultimate tensile strength is increased.
Tensile and tensile recoil tests were performed on pretreated fibers with coatingthicknesses ranging from 3000A to 900oA. Kevlar fibers were more fully characterized thanPBO because of the difficulty obtaining lengths of unkinked PBO fibers. Propertyenhancement is related to coating thickness, with greatest UCS increase around 3300 and6900 A and greatest UTS increase near 6200A for Kevlar. Improvement for PBO is seenmost clearly around 4000 and 6800 A (UCS) and 4000 A (UTS).
Thesis supervisor: Frederick J. McGarryTitle: Professor of Materials Science and Engineering
2
TABLE OF CONTENTS
~Abstract 2
List of Illustrations and Figures.. 5
List of Tables... 7
Acknowledgements................................................................................................................ 8
1. Introduction............ 8
1.1. Composite Materials.... 9
1.2. Literature Survey.................................................................................. 10
1.3. Outline of Work................................................ 11
2. Experimental Apparatus and Procedure........................................................... 12
2.1. Fibers.................................................................................................... 12
2.1.1 SPECI'RA............................................................................... 14
2.1.2 PBO......................................................................................... 14
2.1.3 Kevlar 49................................................................................. 14
2.2. Rack Systems....................................................................................... 15
2.2.1. A~ligatorClip Rack................................................................ 15
2.2.2. Prong rack.......... 16
2.2.3. R3 Rotating Rack............................................................ 17
2.3. Fiber Preparation......................................................................... 19
2.4. Coating 19
2.5. Sample Preparation......................................................... 21
2.6. Tensile Testing.................................................................................. 22
2.7. Tensile Recoil Testing...................................................................... 22
2.8. Microscopy......................................................................................... 25
3
2.8.1 Scanning Electron Microscopy............................................. 25
2.8.2 Light Microscopy.................................................................. 25
3. Results and Discussion.................................................................................... 27
3.1 PBO 27
3.2 Kevlar™ 49......................................................................................... 28
4. Conclusions....................................................................................................... 33
5. Suggestions for Further Work.......................................................................... 34
Appendix A: Fiber Test Results....................................................................................... 35
Appendix B: Scanning electron micrographs..................................................................... 48
1. Small kink band formation leading to a fully developed kink............................ 49
2. Tensile side of coated PBO kink band: good adhesion........................... 49
3. SE Micrograph of coated Kevlar 49 loaded to 80% UTS and unloaded............ 50
References.................................................................................................................... 51
4
List of Illustrations and Figures
Figure ~1A. Chemical structure of poly (phenylene terephthalate) monomer.............................. 12
lB. Chemical structure of poly (phenylene benzobisoxazole) monomer......................... 12
2. Microfibrillar structure of Kevlar 49 and PBO 12
3. Fiber kinking schematic....................................................................................... 13
4A. Alligator clip rack......................................................................................................... 16
4B. Original rack system base plate.................................................................................. 16
5. Circumferential coating distribution.......................................... 16
6A. Prong attachments for rack..... 17
6B. "Tool" for turning prongs............................................................................................ 17
7. R3 rotating rack..... 18
8. Fiber (uncoated and coated) behavior in compression.............................................. 20
9. Forces on coating during compression..................................................................... 20
lOA. Tensile specimen configuration................................................................................. 21
lOB. Tensile recoil specimen configuration....................................................................... 21
11. FI-RE-CUT................................................................................................................ 24
12. Scalpel blade edges.................................................................................................. 24
13A. PBO UCS vs. Coating thickness........................................................................ ..... 27
13B. PBO % increase in UCS with coating thickness................................................ 27
14A. PBO UTS vs. coating thickness compared to uncoated batch values.................... 28
14B. PBO % increase in UTS with coating thickness..................................................... 28
15A. Kevlar™ 49 UCS vs. Coating thickness............................................................... 29
15B. Kevlar™ 49 % increase in UCS with coating thickness......................................... 29
16A. Kevlar™ 49 UTS vs. coating thickness................................................................... 30
5
16B. Kevlar™ 49 % increase in UTS with coating thickness.......................................... 31
17. Fiber ues vs. thickness (Kevlar and PBO)............................................................. 32
6
List of Tables
Table ~
1. Some important material properties for lightweight design............................................. 9
2. Properties of highly crystalline, oriented polymer fibers......................................... 13
3. Material suitability parameters for stress wave reflection............................................... 23
4. Fiber compressive strength compared to fiber type and corresponding thickness 31
7

Acknowledgements
The members of Professor McGarry's research group, especially John Moalli, RodrigoRubiano have been essential to the progress of this research. Along with Maria Raposa andRamnath Subramanian, they have been an anchor of reason and a welcome source of advice.
Most of this work could not have been accomplished without the help of the staff of theMicroelectronics Laboratory: Rich Perilli, Darrell Roan, Tim McClure and Brian McDonald.Arthur and Stephen Rudolph provided design advice and fine workmanship at all stages.Also, David Greenberg, Mike Groleau and Shari Schuchmann cheerfully helped out when Ineeded an extra pair of hands.
The support and commiseration of my friends Raquel D'Oyen and Daniel Aalbertshave helped me avoid many pitfalls on the way to a complete thesis. Raquel has been animportant companion, assistant and "babysitter" during my stay at MIT.
I will always remember the friendship and good times shared with the brothers of PhiGamma Delta. Their camaraderie and quest for fun despite the Institute has kept a smile onmy face.
The adventuresome Jeff Drake has changed the way I see the world. I can only hopehe knows how much his love, support and tolerance mean to me.
I appreciate all the effort my father, the one who dared me to try MIT, has put in tolearning about polymers and fibers. His love and concern, as well as that of the rest of myfamily, Mom, Katie, Mike, Tim and Pat, have been major motivating factors all along.
I would like to dedicate this work to my biggest fan, the woman who hadcommissioned hosts of angels to keep me safe and happy, my Grandma, Nell Fahey.
Additionally I would like to acknowledge The Dow Chemical Co. for providing materials andfunding for this project.
8
l.INTRODUcnON
1.1 Composite materials
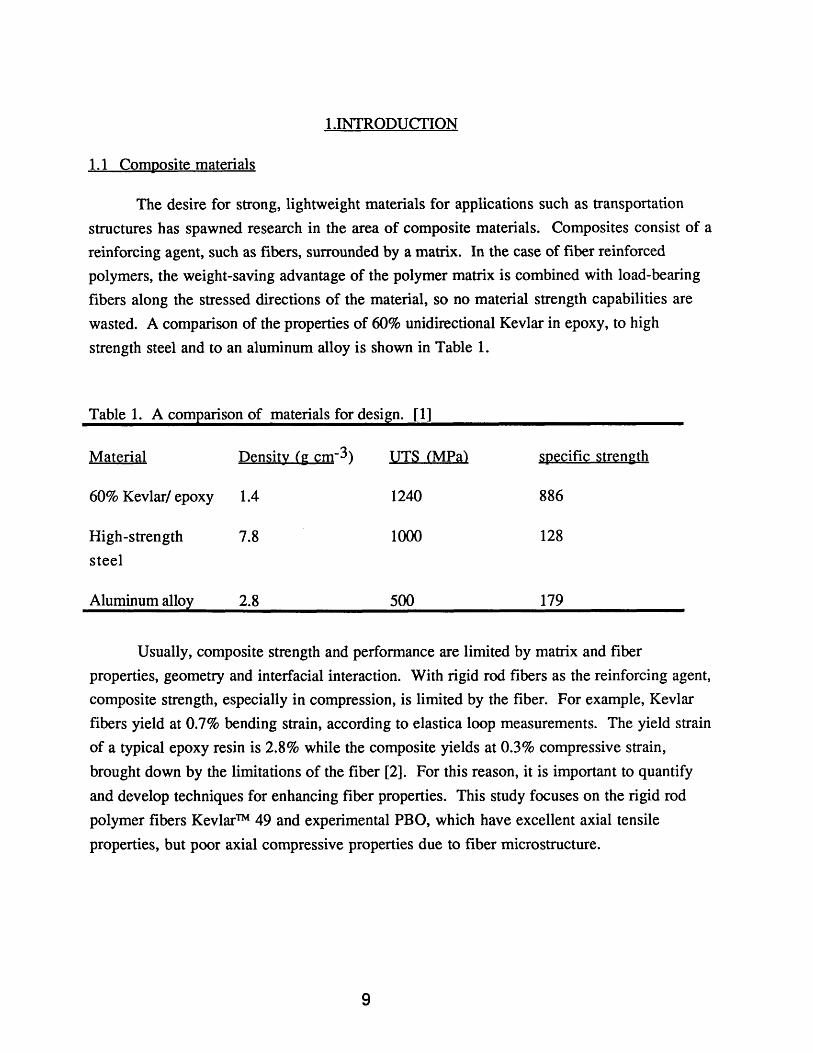
The desire for strong, lightweight materials for applications such as transportationstructures has spawned research in the area of composite materials. Composites consist of areinforcing agent, such as fibers, surrounded by a matrix. In the case of fiber reinforcedpolymers, the weight-saving advantage of the polymer matrix is combined with load-bearingfibers along the stressed directions of the material, so no material strength capabilities are
wasted. A comparison of the properties of 60% unidirectional Kevlar in epoxy, to high
strength steel and to an aluminum alloy is shown in Table 1.
Table 1. A comparison of materials for design. [1]
Material Density (g cm-3) UTS (MPa) specific strength
60% Kevlar/ epoxy 1.4 1240 886
High -strength 7.8 1000 128
steel
Aluminum alloy 2.8 500 179
Usually, composite strength and performance are limited by matrix and fiberproperties, geometry and interfacial interaction. With rigid rod fibers as the reinforcing agent,composite strength, especially in compression, is limited by the fiber. For example, Kevlarfibers yield at 0.7% bending strain, according to elastica loop measurements. The yield strainof a typical epoxy resin is 2.8% while the composite yields at 0.3% compressive strain,
brought down by the limitations of the fiber [2]. For this reason, it is important to quantify
and develop techniques for enhancing fiber properties. This study focuses on the rigid rod
polymer fibers Kevlar™ 49 and experimental PBO, which have excellent axial tensile
properties, but poor axial compressive properties due to fiber microstructure.
9
1.2 Literature Survey
A variety of tests have been developed to measure the compressive strength of fibers.Direct testing is not usually an option because a fiber's aspect ratio, length compared todiameter, is very large. Compressing a single fiber of reasonable length results in out- of-column bowing, or Euler buckling. Therefore, a number of indirect testing methods have beendeveloped. The Elastica Loop test [3] involves both tensile and compressive loads by tyinga knot in the fiber. The validity of this test is questionable because of the dual nature of thestress field [4], however, it is useful for comparing fibers [5].
The Bending Beam test is performed by vertically deflecting a bar with the fiberadhered to the compressive face and measuring the strain to first kink. Beam deflection mustbe small compared to length to assure small curvature and validate the assumption of linearbeam behavior.[2] Failure load cannot be accurately determined from this test unless thecompressive modulus is assumed equal to the tensile modulus and Hooke's law is applied[4].
Tensile Recoil testing is a bracketing technique which uses a reflected tensile wave ofknown magnitude to determine the compressive threshold of a fiber. The severity of kinking,indicated by depth and spacing, is related to the intensity of applied compression [6].Compressive modulus and strain cannot be determined from this test, but the results agreewith those determined by composite testing and with the Micro-Tensile Testing Machine atAir Force Wright Aeronautical Labs [4, 5].
Fiber modifications to improve compressive strength have been attempted. It hasbeen shown that increasing the modulus of a particular fiber does not affect its compressivestrength [7]. A change in density, however, can provide some increase. Fibers close totheir ideal crystal density, like Kevlar™ 49 and PBO, have low compressive strengths andhigh moduli [8]. Lower density, caused by entanglements and crosslinking, gives highercompressive strength by preventing microfibrillar buckling. Unfortunately, this decrease alsoyields lower tensile modulus, a product of high crystallinity [8].
The compressive strength of Kevlar 49 unidirectional/ epoxy composites has beenshown to decrease with temperature [9]. By extrapolating to zero strength, a temperaturevery close to the glass transition temperature for Kevlar is obtained, suggesting thatcompressive failure may involve buckling of the amorphous regions between Kevlar
10
crystallites [9]. The actual percent crystallinity of Kevlar has not been detennined, [10] butthis suggests that a 1()()% crystalline fiber would have a higher compressive strength. Kumarand Helminiak [7] suggest achieving compressive strength improvement by providing thesupport of primary bonds between the fibrils, inhibiting microfibrillar buckling. In contrast, thestudy reported herein seeks improvement by physically reinforcing the outer fibrils, thusincreasing the load carrying ability of the fiber before instability causes buckling.
1.3 Outline of Work
Tensile recoil testing was used in addition to standard tensile testing of single fibersto determine ultimate compressive and tensile strengths of Kevlar™ 49 and PBO fibers. Thebaseline values were then used to evaluate the improvement in properties from theapplication of a high modulus coating. Coating thickness was varied to detennine whichprovides the greatest strength increase. The primary goal was to increase fiber ultimatecompressive strength above 100 ksi without decreasing ultimate tensile strength.
1 1
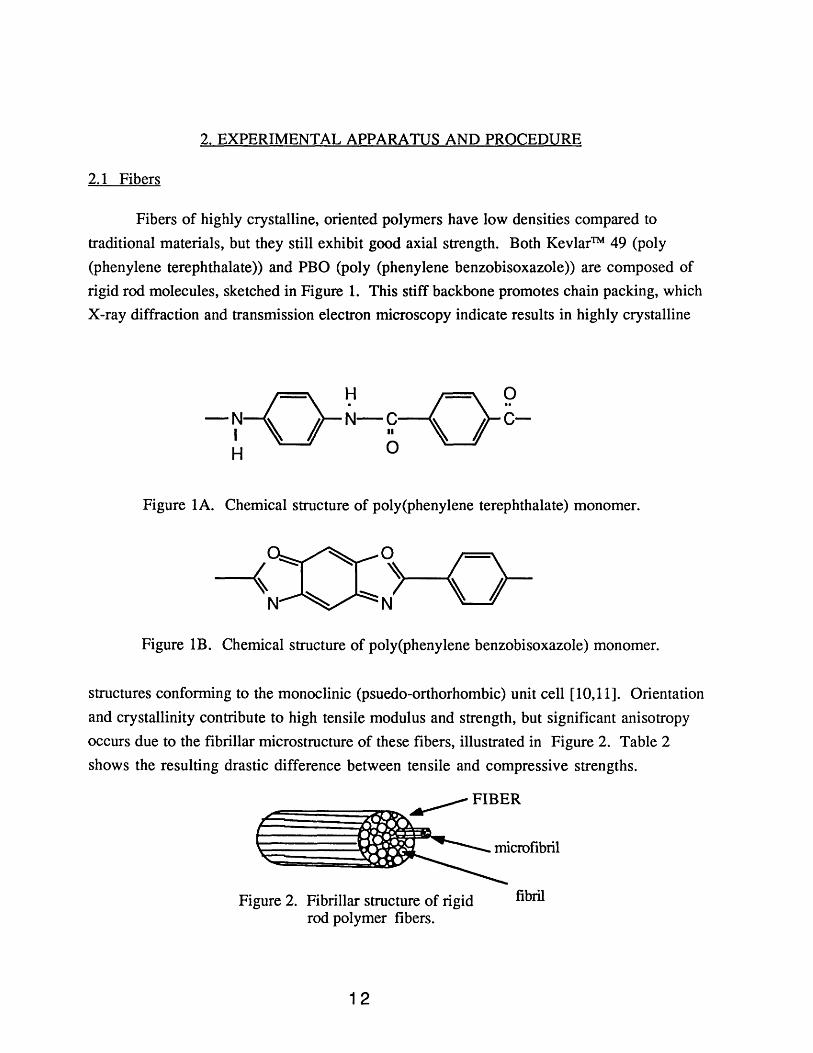
Figure 2.
2. EXPERIMENTAL APPARATUS AND PROCEDURE
2.1 Fibers
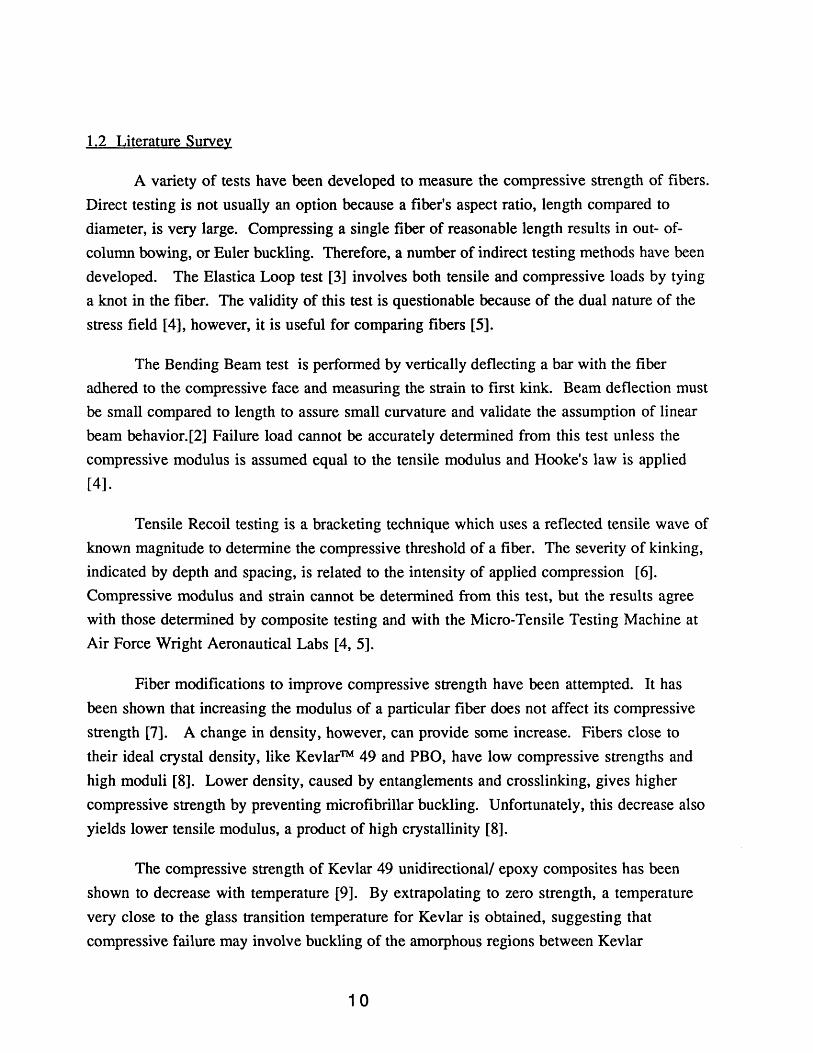
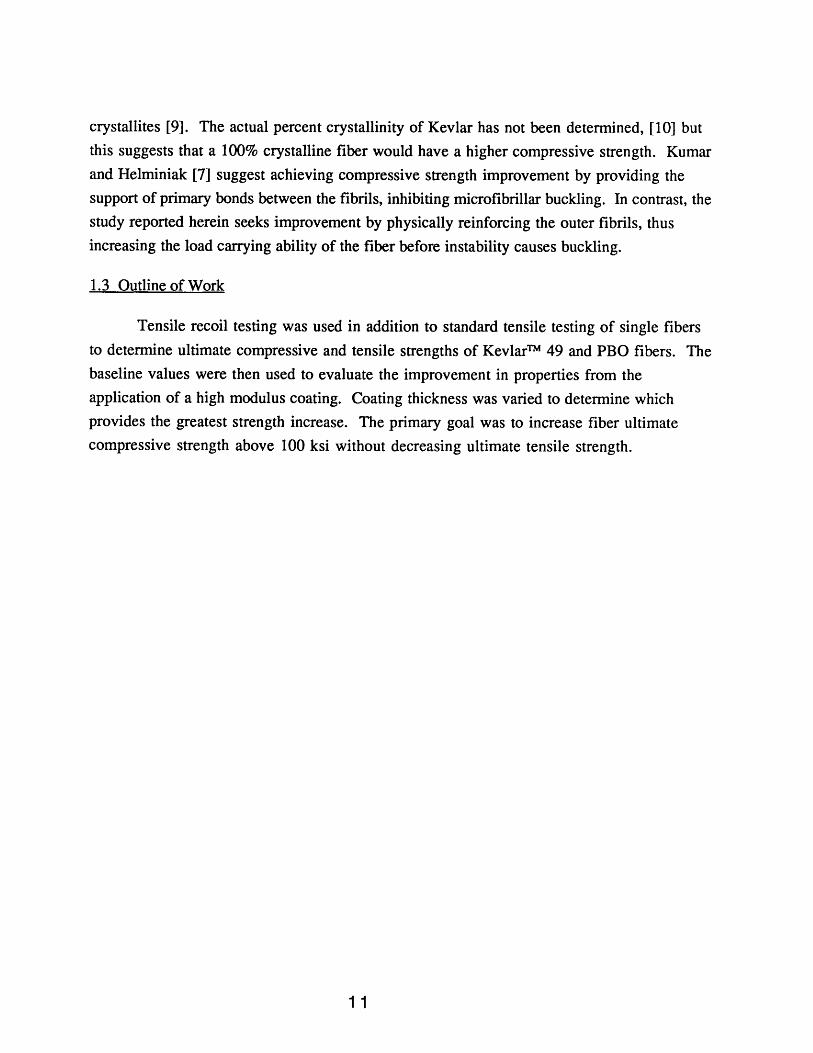
Fibers of highly crystalline, oriented polymers have low densities compared totraditional materials, but they still exhibit good axial strength. Both Kevlar™ 49 (poly(phenylene terephthalate» and PBO (poly (phenylene benzobisoxazole» are composed ofrigid rod molecules, sketched in Figure 1. This stiff backbone promotes chain packing, whichX-ray diffraction and transmission electron microscopy indicate results in highly crystalline
-oH-00-~" ! N-~ " ! c-
H 0
Figure 1A. Chemical structure of poly(phenylene terephthalate) monomer.
Figure lB. Chemical structure of poly(phenylene benzobisoxazole) monomer.
structures conforming to the monoclinic (psuedo-orthorhombic) unit cell [10,11]. Orientationand crystallinity contribute to high tensile modulus and strength, but significant anisotropyoccurs due to the fibrillar microstructure of these fibers, illustrated in Figure 2. Table 2shows the resulting drastic difference between tensile and compressive strengths.
~FIBER
(~( ~~~OUfiOOl
Fibrillar structure of rigid fibrilrod polymer fibers.
12
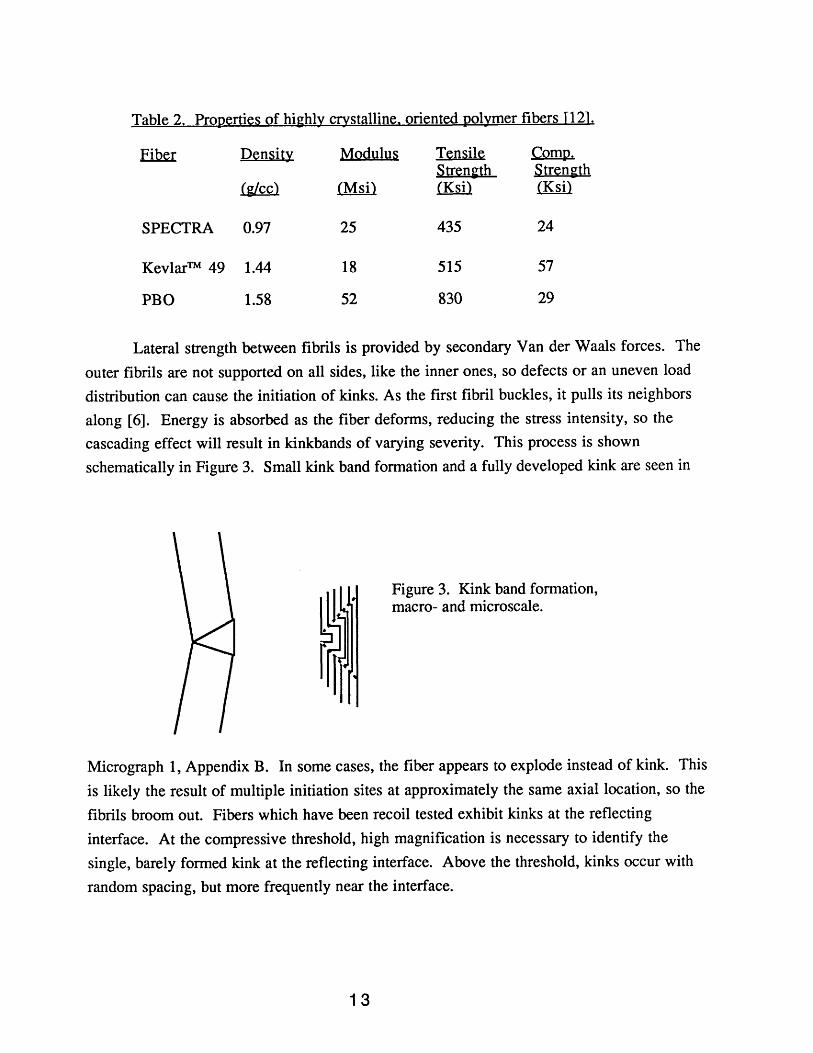
Table 2. Properties of highly crystalline. oriented polymer fibers [12l.
Fiber Density Modulus Tensile CompoStren~th Strength
~ CMsi) CKsi) CKsi)
SPECTRA 0.97 25 435 24
Kevlar™ 49 1.44 18 515 57
PBO 1.58 52 830 29
Lateral strength between fibrils is provided by secondary Van der Waals forces. The
outer fibrils are not supported on all sides, like the inner ones, so defects or an uneven loaddistribution can cause the initiation of kinks. As the first fibril buckles, it pulls its neighborsalong [6]. Energy is absorbed as the fiber deforms, reducing the stress intensity, so thecascading effect will result in kinkbands of varying severity. This process is shownschematically in Figure 3. Small kink band formation and a fully developed kink are seen in
Figure 3. Kink band formation,macro- and microscale.
Micrograph 1, Appendix B. In some cases, the fiber appears to explode instead of kink. This
is likely the result of multiple initiation sites at approximately the same axial location, so the
fibrils broom out. Fibers which have been recoil tested exhibit kinks at the reflecting
interface. At the compressive threshold, high magnification is necessary to identify thesingle, barely formed kink at the reflecting interface. Above the threshold, kinks occur with
random spacing, but more frequently near the interface.
13
2.1.1. SPECfRA
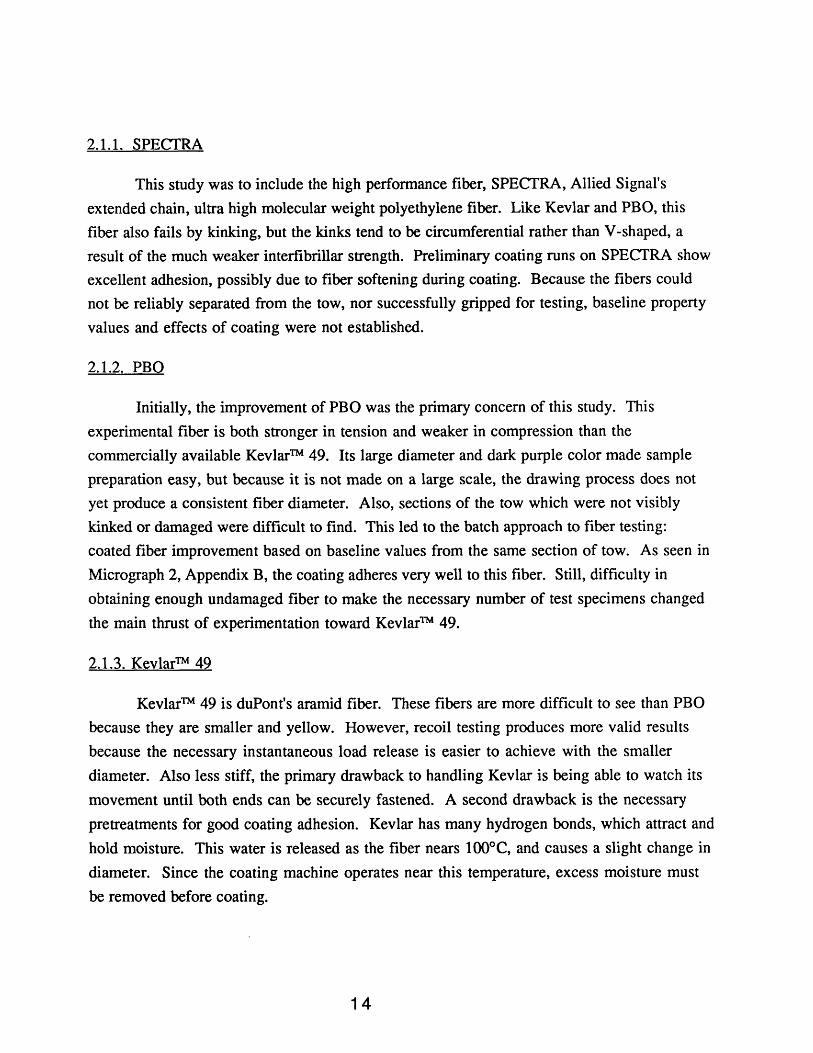
This study was to include the high perfonnance fiber, SPECfRA, Allied Signal'sextended chain, ultra high molecular weight polyethylene fiber. Like Kevlar and PBO, thisfiber also fails by kinking, but the kinks tend to be circumferential rather than V-shaped, aresult of the much weaker interfibrillar strength. Preliminary coating runs on SPECfRA showexcellent adhesion, possibly due to fiber softening during coating. Because the fibers couldnot be reliably separated from the tow, nor successfully gripped for testing, baseline propertyvalues and effects of coating were not established.
2.1.2. PBO
Initially, the improvement of PBO was the primary concern of this study. Thisexperimental fiber is both stronger in tension and weaker in compression than thecommercially available Kevlar™ 49. Its large diameter and dark purple color made samplepreparation easy, but because it is not made on a large scale, the drawing process does notyet produce a consistent fiber diameter. Also, sections of the tow which were not visiblykinked or damaged were difficult to find. This led to the batch approach to fiber testing:coated fiber improvement based on baseline values from the same section of tow. As seen inMicrograph 2, Appendix B, the coating adheres very well to this fiber. Still, difficulty inobtaining enough undamaged fiber to make the necessary number of test specimens changedthe main thrust of experimentation toward Kevlar™ 49.
2.1.3. Kevlar™ 49
Kevlar™ 49 is duPont's aramid fiber. These fibers are more difficult to see than PBObecause they are smaller and yellow. However, recoil testing produces more valid resultsbecause the necessary instantaneous load release is easier to achieve with the smallerdiameter. Also less stiff, the primary drawback to handling Kevlar is being able to watch itsmovement until both ends can be securely fastened. A second drawback is the necessarypretreatments for good coating adhesion. Kevlar has many hydrogen bonds, which attract andhold moisture. This water is released as the fiber nears 100°C, and causes a slight change indiameter. Since the coating machine operates near this temperature, excess moisture mustbe removed before coating.
14
The manufacturing process employs sulfuric acid and sodium carbonate. Thesecombine and appear in elemental analysis as sodium sulfate, 0.2% to 1.0% by weight [10].This finding is supported by XPS and neutron activation [12], which show a sodium content ofapproximately 0.85% to 1% by weight, present as sodium sulfate. Also found on the surfaceof Kevlar are textile lubricants such as stearic acid. All of these inhibit the excellent adhesivebehavior exhibited between the coating and the other fibers. Pretreatments, described later,are used to overcome these barriers to good adhesion and the resulting compressiveimprovement.
2.2 Rack Systems
Fiber coatings are applied under vacuum, which places restraints on fiber holdingdevices. Base plate size is defined by the holder in the coating chamber, the use ofmechanical feedthroughs is limited, and gear friction cannot be compensated by lubricants.Also, materials must be nonmagnetic and free of volatiles, making only very few metals andno plastics appropriate for rack construction. Coating thickness has been found to vary alongboth the length and width of the rack; differences range widely, usually between 100 and100oA, depending on the surface condition of the coating material before application. Becauserack design cannot compensate for this variation, thickness measurement locations have beenstandardized, and an average is used to describe the coating thickness of a particular run.During the period of this research the rack system used has been changed and modified anumber of times. The main rack systems used are described.
2.2.1 Alligator Clip Rack
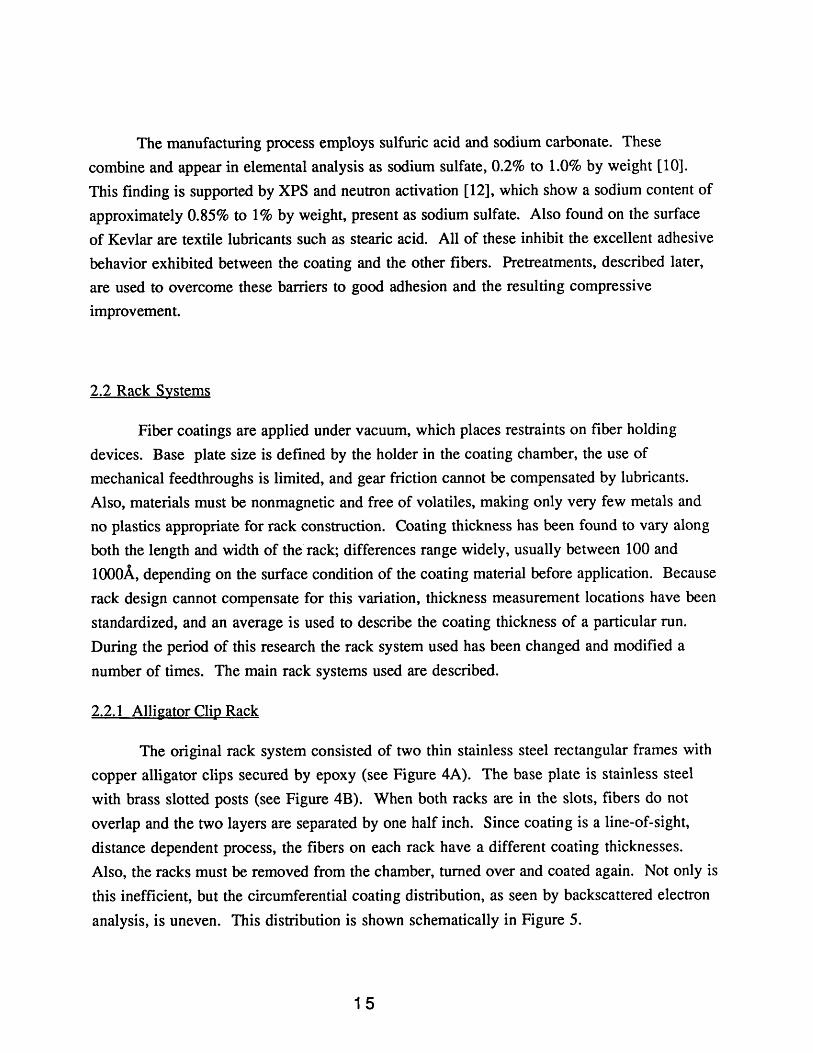
The original rack system consisted of two thin stainless steel rectangular frames withcopper alligator clips secured by epoxy (see Figure 4A). The base plate is stainless steelwith brass slotted posts (see Figure 4B). When both racks are in the slots, fibers do notoverlap and the two layers are separated by one half inch. Since coating is a line-of-sight,distance dependent process, the fibers on each rack have a different coating thicknesses.Also, the racks must be removed from the chamber, turned over and coated again. Not only isthis inefficient, but the circumferential coating distribution, as seen by backscattered electronanalysis, is uneven. This distribution is shown schematically in Figure 5.
15
(A)(8)
Figure 4A. Alligator clip rack andB. original rack system base plate.
Figure 5. Schematic of coating distribution.
2.2.2. Pron~ Rack
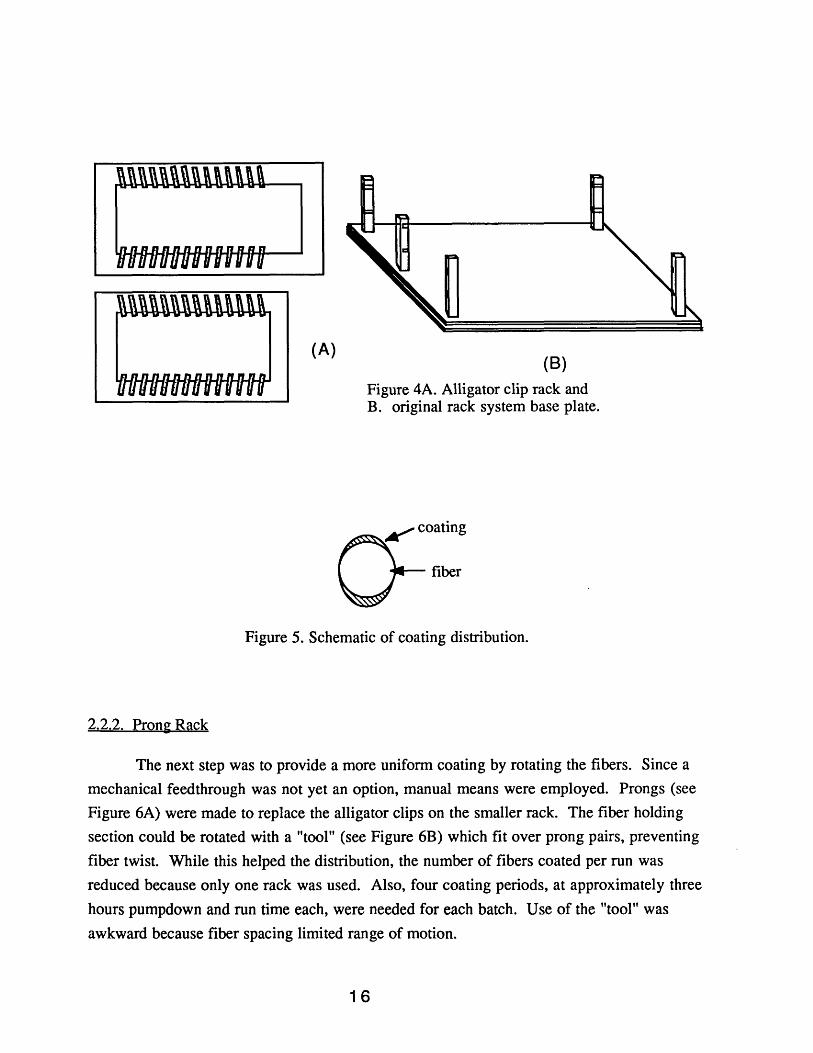
The next step was to provide a more uniform coating by rotating the fibers. Since amechanical feedthrough was not yet an option, manual means were employed. Prongs (seeFigure 6A) were made to replace the alligator clips on the smaller rack. The fiber holdingsection could be rotated with a "tool" (see Figure 6B) which fit over prong pairs, preventingfiber twist. While this helped the distribution, the number of fibers coated per run wasreduced because only one rack was used. Also, four coating periods, at approximately threehours pumpdown and run time each, were needed for each batch. Use of the "tool" wasawkward because fiber spacing limited range of motion.
16
~ attaches to rack here
.- rotating slottedsection
Figure 4. Fiber-holding prong, part ofJohn's rack system
Figure 5. "The Tool" used forrotating prongs.
The choice was made to coat, turn the rack over, coat, rotate the prongs one quarter turn,coat, turn the rack over and coat. This kept more fibers intact, but still resulted incircumferential thickness variations as well as large time and equipment costs.
2.2.3. The RJ. Rotatin~ Rack
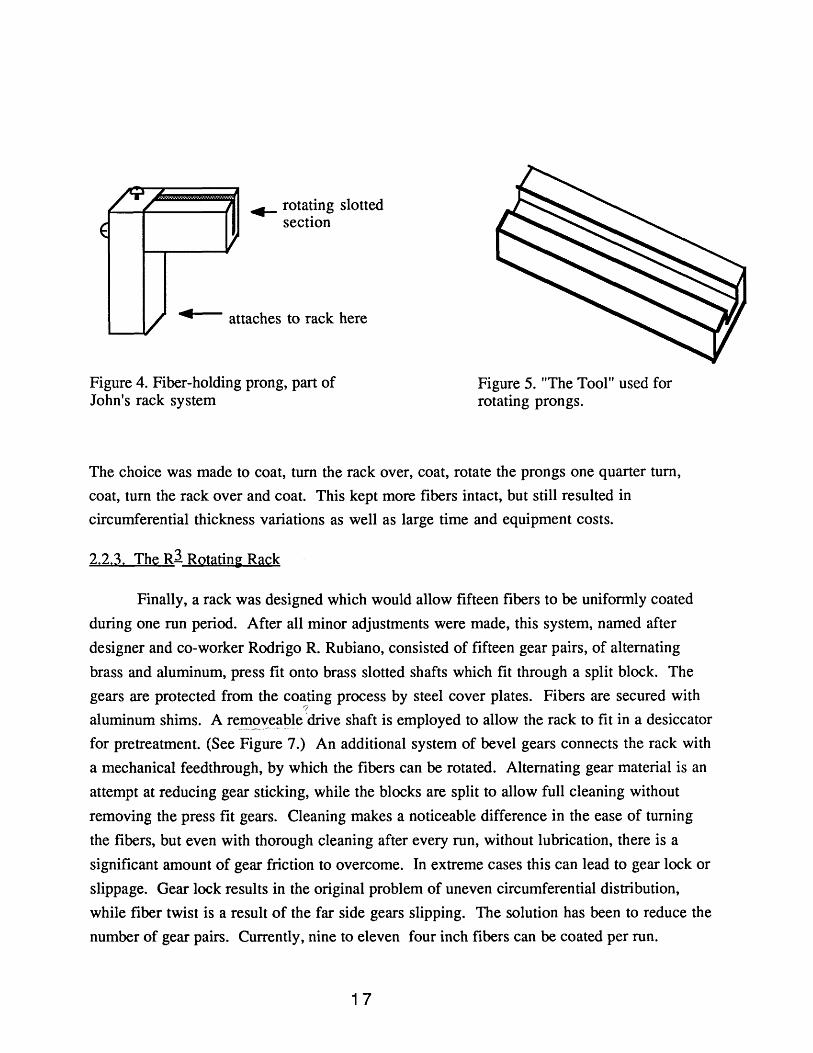
Finally, a rack was designed which would allow fifteen fibers to be uniformly coatedduring one run period. After all minor adjustments were made, this system, named afterdesigner and co-worker Rodrigo R. Rubiano, consisted of fifteen gear pairs, of alternatingbrass and aluminum, press fit onto brass slotted shafts which fit through a split block. Thegears are protected from the coating process by steel cover plates. Fibers are secured with
'7'
aluminum shims. A retp~y'e~!Jle'drive shaft is employed to allow the rack to fit in a desiccatorfor pretreatment. (See Figure 7.) An additional system of bevel gears connects the rack witha mechanical feedthrough, by which the fibers can be rotated. Alternating gear material is anattempt at reducing gear sticking, while the blocks are split to allow full cleaning withoutremoving the press fit gears. Cleaning makes a noticeable difference in the ease of turningthe fibers, but even with thorough cleaning after every run, without lubrication, there is asignificant amount of gear friction to overcome. In extreme cases this can lead to gear lock orslippage. Gear lock results in the original problem of uneven circumferential distribution,while fiber twist is a result of the far side gears slipping. The solution has been to reduce thenumber of gear pairs. Currently, nine to eleven four inch fibers can be coated per run.
17
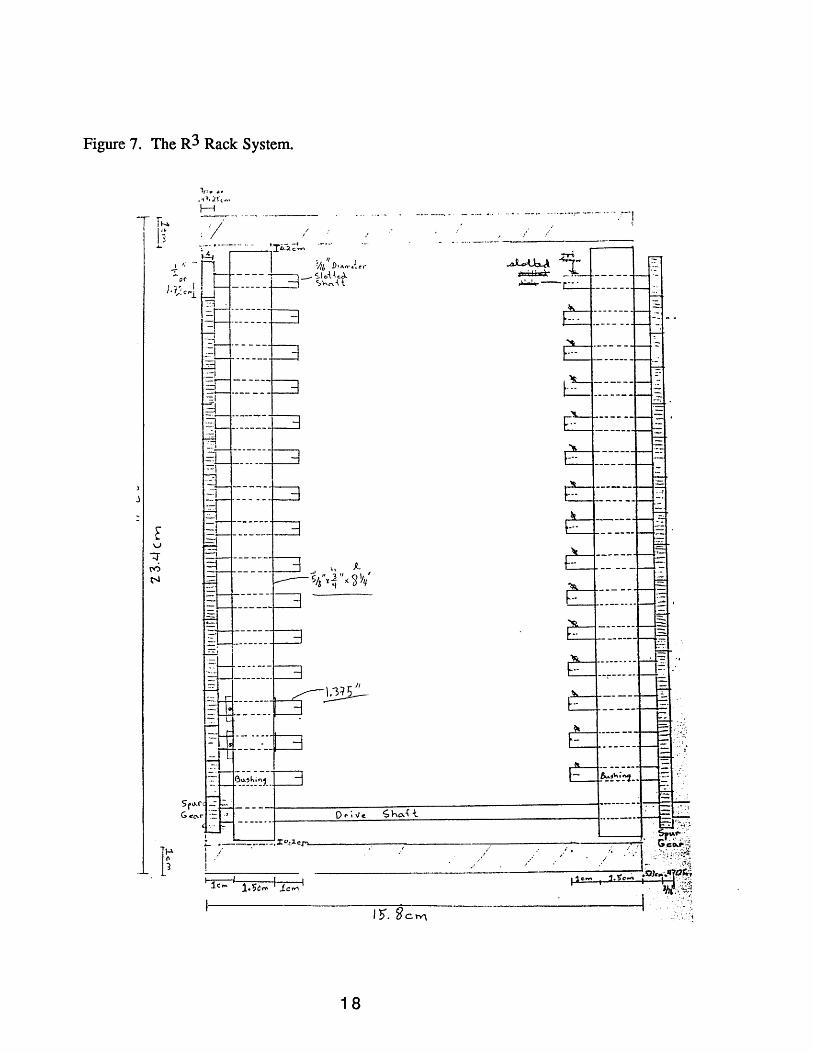
Figure 7. The R3 Rack System.
lflo .,,.. .;:J.J!.t ....,
Hl I:/ /
I
~4.:-~ ~.,.~-_ ...
l.::- -------e:.:..-
t ..:..--c----.:r.,'.,.~ -.....,._---/~----.,.-,-.-..-/~--- ..---,- .......----..-/--..-:...:..4l:~~~I 1c:", 1.~c .....I J.cm I ------1-'-"-...--,-'5-.,.... -.~Jc,".jo~1
. ' _' _c_-_i I'IJI;:~~
li------~I ._-- ---
~
J
18
2.3. Fiber Preparation
Single fibers, four inches long, are removed from the fiber tow with tweezers andsecured in the slotted shafts of the rotating rack. These fibers are then coated. Microscopyshows excellent adhesion between PBO and the coating, but coating on Kevlar is not as wellbonded. The nature of the bond between the two surfaces is still being studied. Meanwhile,pretreatments to promote adhesion between Kevlar and the coating have been tried.Mentioned earlier, two main problem sources are moisture held by hydrogen bonds andprocessing residue.
To remove the moisture, the fiber-loaded rack, without drive shaft, shields orconnecting gears, is placed in a desiccator and heated under vacuum for 1.5 to 2.5 hours. Thedesiccator is sealed, allowed to cool and taken to the coating machine. When the machine isready for loading, the rack is removed from the desiccator, fully assembled and loaded into themachine. This process allows the fibers to be exposed to a clean room atmosphere forapproximately ten minutes. Adhesion with this pretreatment has been inconsistent, butfibers with this pretreatment constitute the bulk of current results.
Adhesion may be prohibited by the presence of processing residues. First brought toour attention was sodium sulfate. According to the CRC Handbook of Chemistry andPhysics, sodium sulfate is soluble in hot water, approximately 42 g per 100 cc. So, a beakerof 200 cc of water is heated to boiling and the heat source reduced. The section of tow to beseparated and coated is added and kept at the same temperature for 30 minutes. The tow isthen removed with tweezers and placed in a second beaker of water similar to the first. Itremains for ten to fifteen minutes, is removed and dipped in acetone for one to three minutes.The resulting section of tow is less shiny and the fibers do not slide past each other as well.The change in physical appearance and handling may be a result of removing any lubricants.The CRC indicates that stearic acid is soluble in acetone, so this may have beeninadvertently removed in trying to remove sodium sulfate. Tests are still being conducted todetermine if this pretreatment reduces the sodium sulfate content and if it improves coatingadhesion.
2.4 Coating
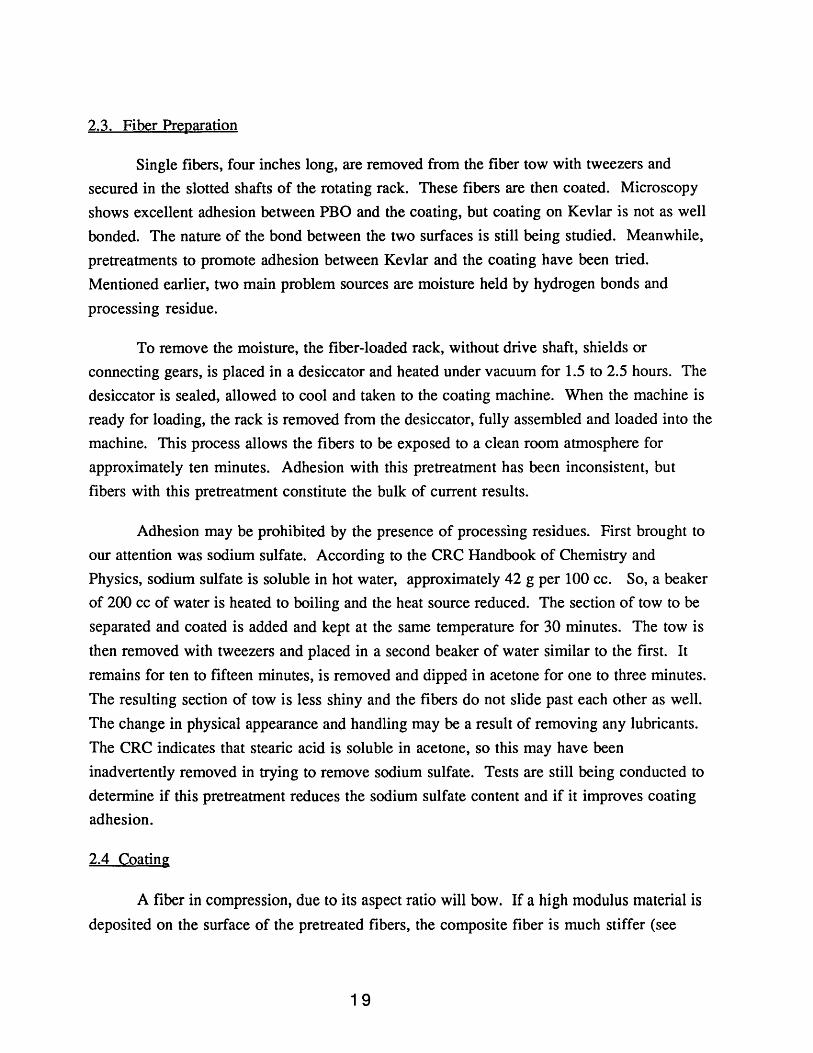
A fiber in compression, due to its aspect ratio will bow. If a high modulus material isdeposited on the surface of the pretreated fibers, the composite fiber is much stiffer (see
19
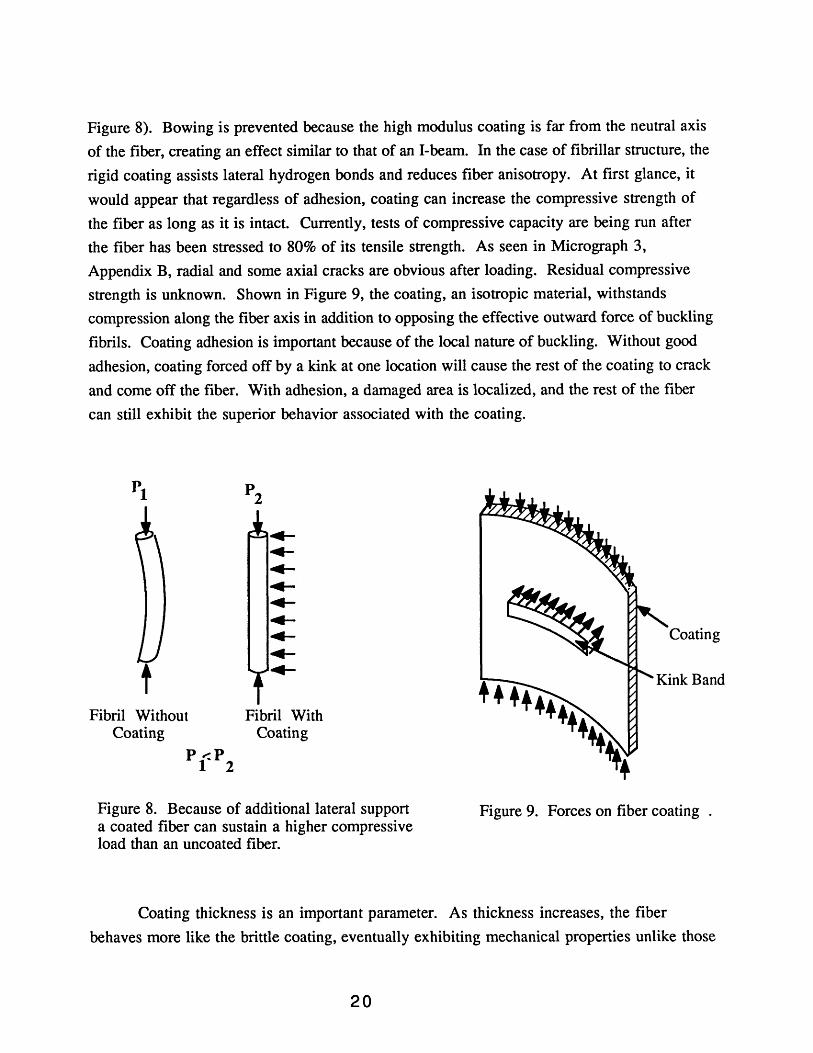
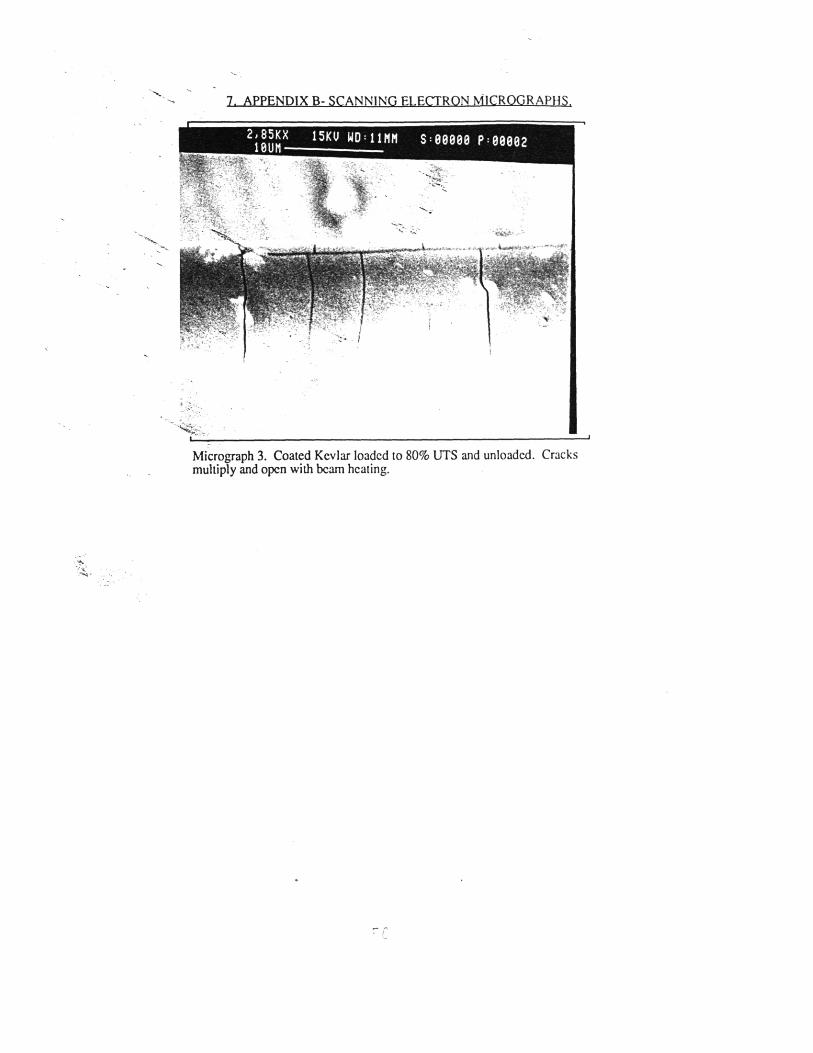
Figure 8). Bowing is prevented because the high modulus coating is far from the neutral axisof the fiber, creating an effect similar to that of an I-beam. In the case of fibrillar structure, therigid coating assists lateral hydrogen bonds and reduces fiber anisotropy. At first glance, itwould appear that regardless of adhesion, coating can increase the compressive strength ofthe fiber as long as it is intact. Currently, tests of compressive capacity are being run afterthe fiber has been stressed to 80% of its tensile strength. As seen in Micrograph 3,Appendix B, radial and some axial cracks are obvious after loading. Residual compressivestrength is unknown. Shown in Figure 9, the coating, an isotropic material, withstandscompression along the fiber axis in addition to opposing the effective outward force of bucklingfibrils. Coating adhesion is important because of the local nature of buckling. Without goodadhesion, coating forced off by a kink at one location will cause the rest of the coating to crackand come off the fiber. With adhesion, a damaged area is localized, and the rest of the fibercan still exhibit the superior behavior associated with the coating.
Coating
Fibril WithoutCoating
Fibril WithCoating
Figure 8. Because of additional lateral supporta coated fiber can sustain a higher compressiveload than an uncoated fiber.
Figure 9. Forces on fiber coating .
Coating thickness is an important parameter. As thickness increases, the fiberbehaves more like the brittle coating, eventually exhibiting mechanical properties unlike those
20
sought. Too thin of a coating will not act in a way to inhibit buckling and increasecompressive strength. A main goal of this study has been to determine the optimal coatingthickness. This value will not be absolute, because the three thickness measurements aretaken 0.5" closer to the the coating source than the fibers, near the corners of the 9.4" x 6.3"rack. The values are averaged and compared. With this in mind, actual coating thickness is
lower than reported, but how much so is determined by the fiber's position on the rack duringcoating. This could account for anomalous results when recoil testing (no failure seen wellabove the bracketed threshold) as well as the large variation in tensile strengths above thatof the uncoated fiber.
2.5 Sample Preparation
Single fibers are removed from sections of tow cut to a length of five to seven
inches. Those to be coated are pretreated if necessary and coated in four inch lengths.Coated or uncoated, fibers are placed across paper sample tabs and secured with epoxy.The gage length used for all tests is one inch. Tensile samples (Figure lOA) also requireRTV silicone rubber to reduce the stress concentration at the fiber/ epoxy interface and toinsure failure equidistant from the ends. For proper recoil, on the other hand, the fiberepoxy interface must be sharp (Figure lOB). The epoxy cannot be drawn onto the fiber, orbe present as droplets along the gage length, especially near the interface because the
epoxy
fiber
(A)
_ silicone rubber
(B)
Figure 10. (A) Tensile specimen, (B) tensile recoil specimen.
2.'
effective diameter of the fiber, which appears in the calculation of stress, is altered. These twoconditions are identified before testing by low magnification light microscopy, and invalid samples
are discarded.
2.6 Tensile Testing
Early tests were run on an Instron 1122, while recent testing has employed an Instron4505. All tests use a 2000g load cell and pneumatic grips. An axial load is applied by loweringthe crosshead at a rate of 0.125 mm/ min. The load at fracture is recorded, then the fiberdiameter is measured. Initially measurements were made using scanning electron microscopy,but satisfactory measurements are obtained with a light microscope. Ultimate tensile strengthfor the fiber is then determined according to Equation 1, the basic
(1)
equation for stress, where L is the measured failure load and r is the measured fiber radius. Sincetensile strengths always occur as a distribution, at least thirty samples are needed to reliablydescribe it [13]. This was attainable for uncoated fibers, but the limited number of coated fibers
usually kept the number of samples near five. The purpose of tensile testing is to ensure there isno drop in ultimate tensile strength when a coating is applied, so the limited tensile results fromeach batch are compared to uncoated values; average batch value for PBO, average batch and total
average for Kevlar™ 49.
2.7 Tensile Recoil Testing
Tensile recoil testing, first developed by S. Allen at duPont, makes use of a reflected stress
wave to fail the fiber in compression. The fiber is axially loaded in tension to a known value. It is
then cut halfway between the ends so that the load drops instantaneously. The tensile stress wavereleased travels away from the cut site, is reflected by the epoxy, and returns as a compressivewave. If the stress is greater than the fiber ultimate compressive strength, kinking occurs. Fiberscan be visually characterized as failed or unfailed, and the
22
compressive strength bracketed within a few kilopounds per square inch. In the appendix toAllen's paper [5], the analysis is given in full, featuring the standard wave equation (Eqn. 2)where u is displacement, t is time, x is axial location (x = 0 at the fiber ends) and a2 is theratio of modulus to density, or specific modulus. Boundary conditions are 1) fixed fiber end,
2 2a u = a2a u
at2 ax2 (2)
2) zero initial wave velocity, 3) zero stress at the fracture surface and 4) initial displacementequal to the initial tensile strain. For complete reflection, specific density must be noticeablydifferent between the fiber and reflective material. Table 3 compares modulus, density andthis specific modulus for steel, epoxy, Kevlar™ 49 and PBO. The grips have steel faces, sothis option was first explored, but the sample cannot be adequately gripped due to thepresence of the epoxy adhesive. Instead, the faces are coated with silicone rubber toincrease the reliability of holding paper specimen tabs and epoxy is used to reflect the stresswave. Specific modulus is satisfactory, and the epoxy is already incorporated into the sampleto hold the fiber in place.
Table 3. Material suitability parameters for stress wave reflection [l, 121
Material Density Modulus Sp. Mod.
Will. (Msi) W~lKevlar™ 49 1.44 18 8.62
PBO 1.58 52 22.69
Epoxy 1.2- 1.4 2.1- 5.5 1.03- 3.16
Steel 7.9 210 18.33
Tensile recoil testing is performed using essentially the same set up as for tensiletesting. The hold feature on the Instron 4505 keeps the fiber load at a pre-programmed value.FI-RE-CUT, a device designed by John MoalIi, is attached to a backplate and positioned to
23
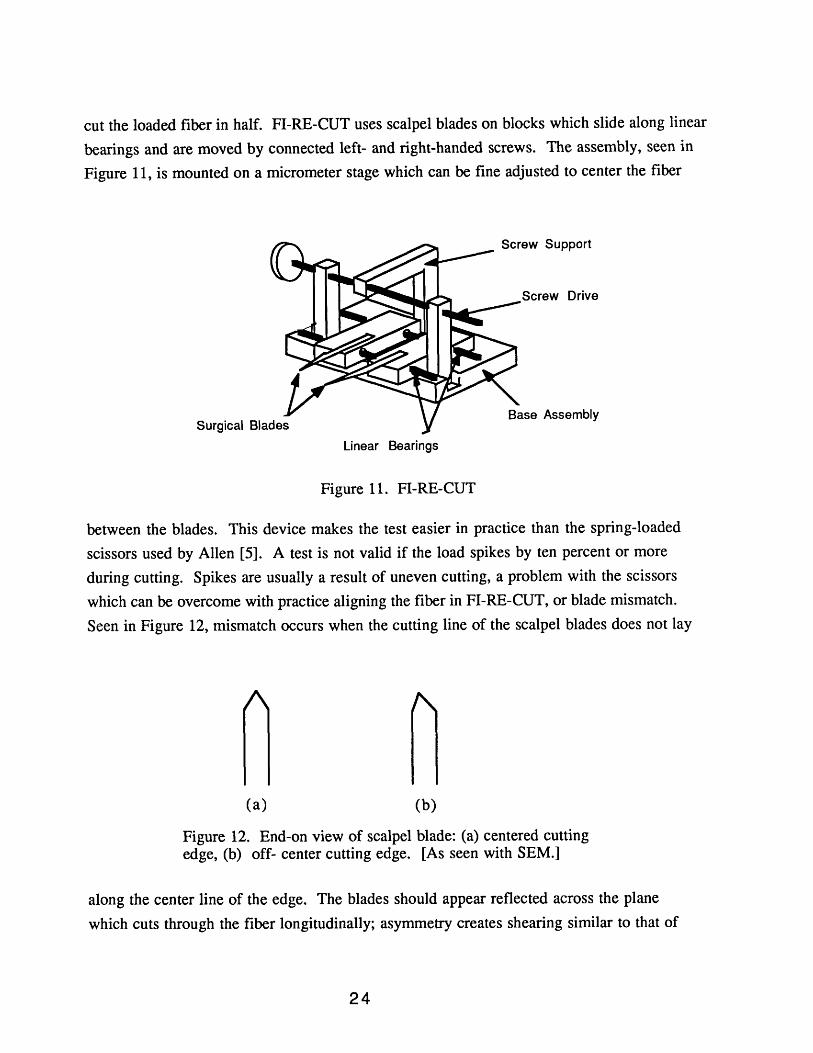
cut the loaded fiber in half. FI-RE-CUT uses scalpel blades on blocks which slide along linearbearings and are moved by connected left- and right-handed screws. The assembly, seen inFigure 11, is mounted on a micrometer stage which can be fine adjusted to center the fiber
Screw Support
Screw Drive
Linear Bearings
Figure 11. FI-RE-CUT
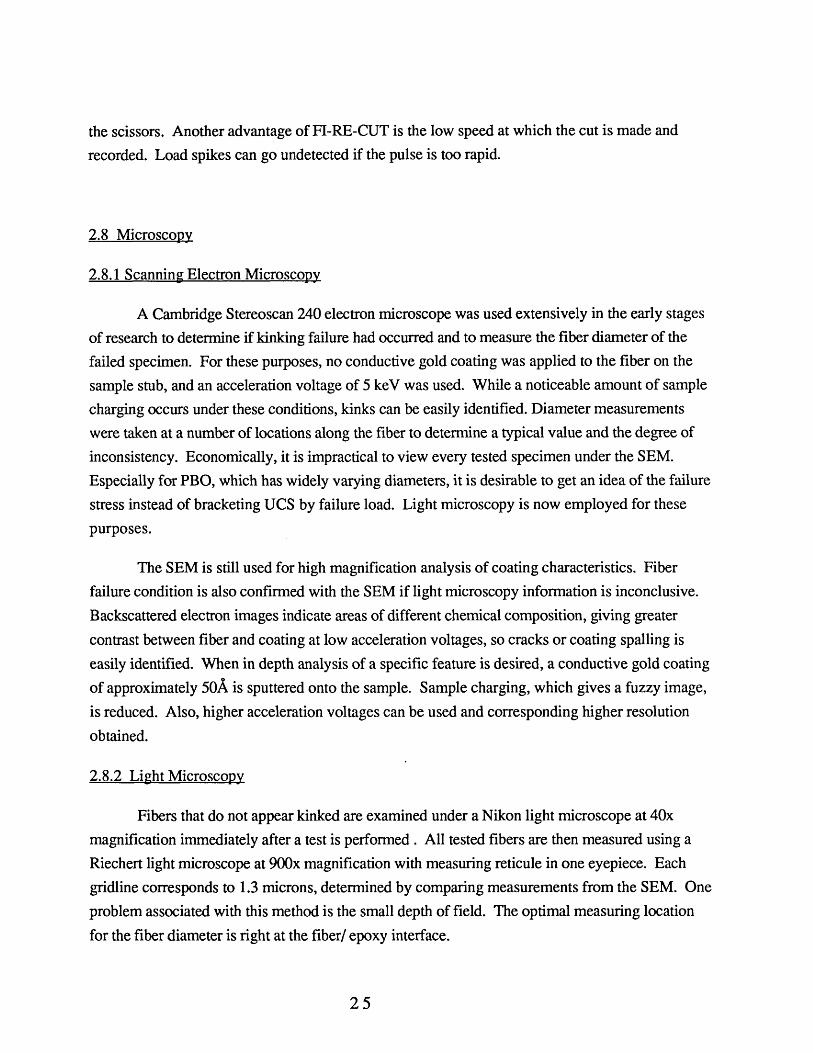
between the blades. This device makes the test easier in practice than the spring-loadedscissors used by Allen [5]. A test is not valid if the load spikes by ten percent or moreduring cutting. Spikes are usually a result of uneven cutting, a problem with the scissorswhich can be overcome with practice aligning the fiber in FI-RE-CUT, or blade mismatch.Seen in Figure 12, mismatch occurs when the cutting line of the scalpel blades does not lay
(a) (b)
Figure 12. End-on view of scalpel blade: (a) centered cuttingedge, (b) off- center cutting edge. [As seen with SEM.]
along the center line of the edge. The blades should appear reflected across the planewhich cuts through the fiber longitudinally; asymmetry creates shearing similar to that of
24
the scissors. Another advantage ofFI-RE-CUT is the low speed at which the cut is made andrecorded. Load spikes can go undetected if the pulse is too rapid.
2.8 Microscopy
2.8.1 Scanning Electron Microscopy
A Cambridge Stereoscan 240 electron microscope was used extensively in the early stagesof research to determine ifkinking failure had occurred and to measure the fiber diameter of thefailed specimen. For these purPOses, no conductive gold coating was applied to the fiber on thesample stub, and an acceleration voltage of 5 keV was used. While a noticeable amount of samplecharging occurs under these conditions, kinks can be easily identified. Diameter measurementswere taken at a number of locations along the fiber to determine a typical value and the degree ofinconsistency. Economically, it is impractical to view every tested specimen under the SEM.Especially for PBO, which has widely varying diameters, it is desirable to get an idea of the failurestress instead of bracketing DCS by failure load. Light microscopy is now employed for these
purposes.
The SEM is still used for high magnification analysis of coating characteristics. Fiberfailure condition is also confirmed with the SEM if light microscopy information is inconclusive.
Backscattered electron images indicate areas of different chemical composition, giving greater
contrast between fiber and coating at low acceleration voltages, so cracks or coating spalling iseasily identified. When in depth analysis of a specific feature is desired, a conductive gold coatingof approximately 50A is sputtered onto the sample. Sample charging, which gives a fuzzy image,
is reduced. Also, higher acceleration voltages can be used and corresponding higher resolution
obtained.
2.8.2 Light Microscopy
Fibers that do not appear kinked are examined under a Nikon light microscope at 40xmagnification immediately after a test is performed. All tested fibers are then measured using aRiechert light microscope at 900x magnification with measuring reticule in one eyepiece. Eachgfidline corresponds to 1.3 microns, determined by comparing measurements from the SEM. Oneproblem associated with this method is the small depth of field. The optimal measuring location
for the fiber diameter is right at the fiber/ epoxy interface.
25
However, the height of the epoxy droplet does not allow the lens to approach the fiber ends.If the fiber is severely kinked, locating and focussing a measurable section can be difficult.
Many times, one half of a tensile specimen will be too short to measure and stresscalculations must be based only on diameters from the other half. Fortunately, Kevlar
diameters are consistent enough that this does not make much of a difference. Most PBOmeasurements were made with the SEM, but those made with the light microscope are verysimilar. By comparing the diameter of Kevlar™ 49 fibers calculated from denier (11.9microns) to those measured (usually 11.7 to 12.0 microns), we conclude that a fiber diametercan be accurately measured with the light microscope to within 0.2 microns of the actualdiameter.
26
3. RESULTS AND DISCUSSION
Raw data for tensile and tensile recoil tests of PBO and Kevlar™ 49 are presented inAppendix A. Thickness measurements for PBO fiber sets were made across the rack fromthe drive gears and at the other end of the rack on the same side as the gears to allowaveraging of maximum thickness variation. A third measurement, from the comer diagonallyopposite the drive gears is added for the Kevlar fiber sets. Earlier data are not presentedbecause they cannot be satisfactorily incorporated into the main body of information. Thisincludes runs made with the alligator clip and prong racks, as well as sets in which the fiberswere damaged in handling, used for other tests or insufficient in number to complete the recoilbracketing sequence.
3.1 PBO
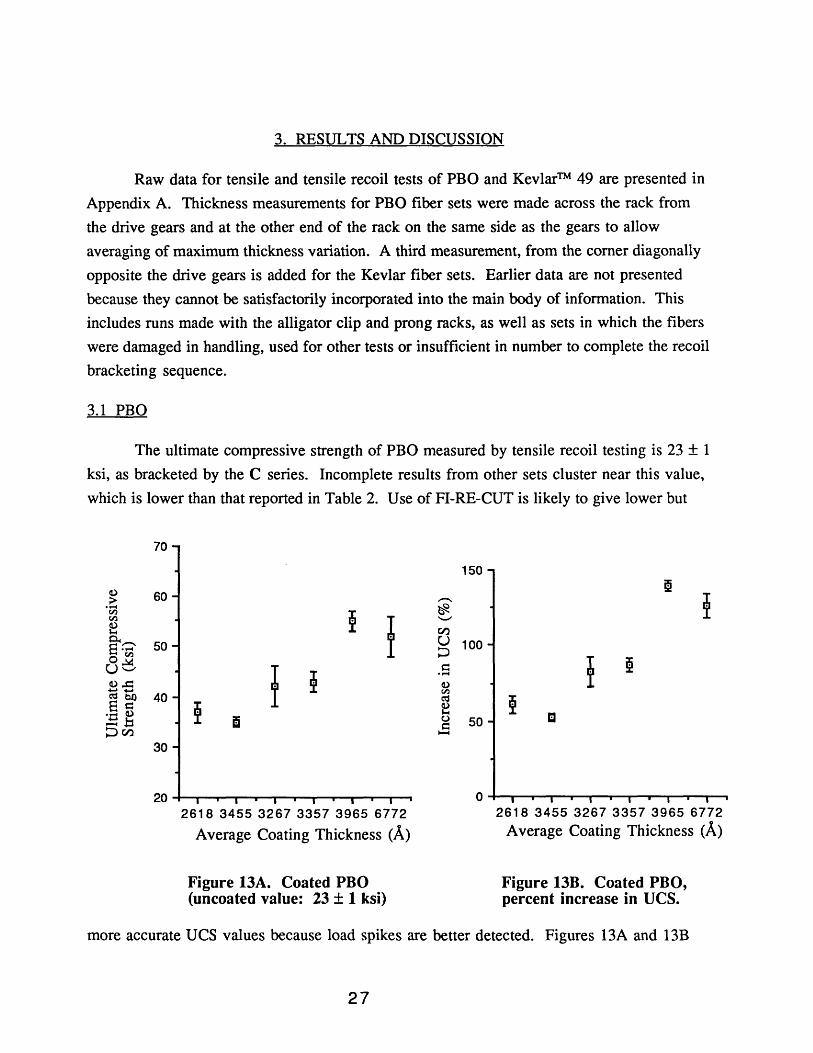
The ultimate compressive strength of PBO measured by tensile recoil testing is 23 :t 1ksi, as bracketed by the C series. Incomplete results from other sets cluster near this value,which is lower than that reported in Table 2. Use of FI-RE-CUT is likely to give lower but
70
0 60>• .-4V,)
~V,)
I~P-e_ 508 ..-4o V,)
uc I ~o..c:~ ~Cl:SbJ) 408 =
~• .-4 0Ii~b
~rn30
20 1- ..--...--
2618 3455 3267 3357 3965 6772
Average Coating Thickness (A)
Figure 13A. Coated PBO(uncoated value: 23:t 1 ksi)
150~- ~~.........
rnU 100~
~~=• .-4
0V,)
Cl:S~~ mu 50=~
2618 3455 3267 3357 3965 6772Average Coating Thickness (A)
Figure 13B. Coated PBO,percent increase in DCS.
more accurate UCS values because load spikes are better detected. Figures 13A and 13B
27
show the effect of coating thickness on compressive strength. DCS values shown are theaverage of the highest unfailed specimen and the lowest failed specimen. Because of thevariation in fiber diameter and the limited number of fibers in a set, the range can be :t 7 or 8ksi. These graphs show greatest DCS improvements near 4oooA, which is approximately 4%of the fiber radius.
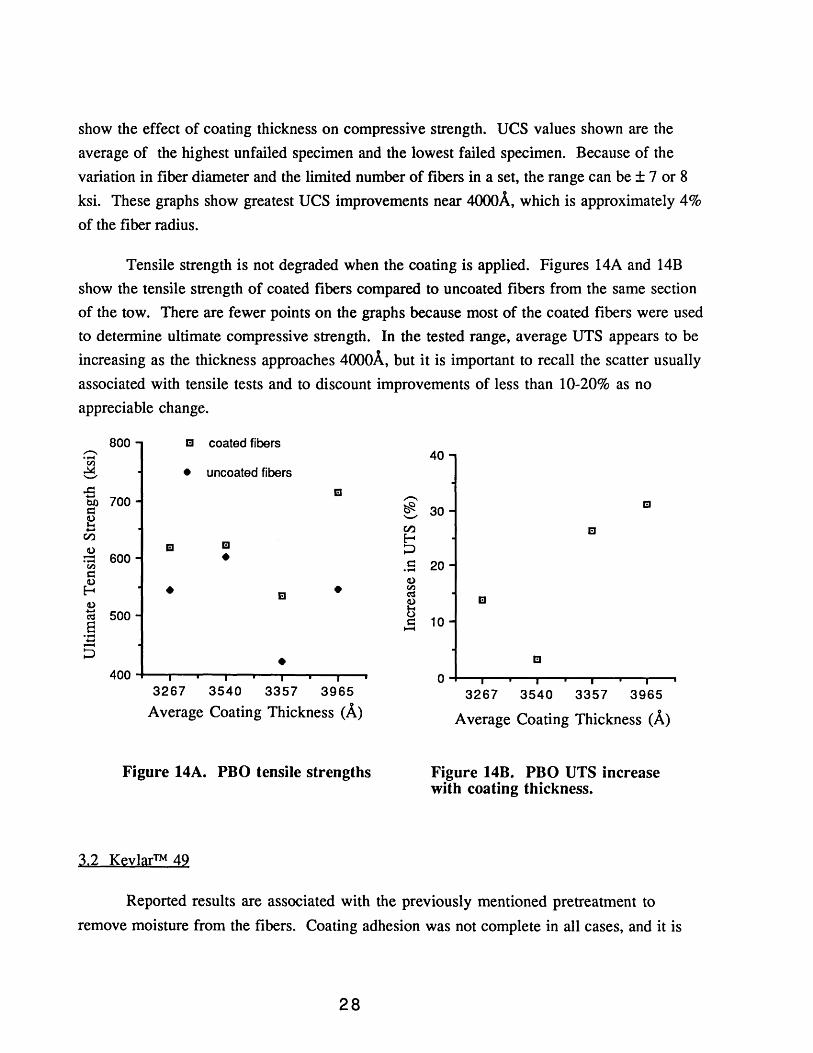
Tensile strength is not degraded when the coating is applied. Figures 14A and 14Bshow the tensile strength of coated fibers compared to uncoated fibers from the same sectionof the tow. There are fewer points on the graphs because most of the coated fibers were usedto determine ultimate compressive strength. In the tested range, average UTS appears to beincreasing as the thickness approaches 4oooA, but it is important to recall the scatter usuallyassociated with tensile tests and to discount improvements of less than 10-20% as noappreciable change.
800 a coated fibers- 40.....f/.l
~ • uncoated fibers---..c:: EI..... -bJ) 700 ~ lEIr::: 30~ ---..... Cf.) a
Cf.) ~0 lEI a ::>- 600 •..... r::: 20f/.ls:: .....0 0
~ • • f/.lEI ~
0 ~ lEI.....~ 500 u 108 r:::~..........-::> • a400 0
3267 3540 3357 3965 3267 3540 3357 3965Average Coating Thickness (A) Average Coating Thickness (A)
Figure 14A. PBO tensile strengths Figure 14B. PBO UTS increasewith coating thickness.
3.2 Kevlar™ 49
Reported results are associated with the previously mentioned pretreatment toremove moisture from the fibers. Coating adhesion was not complete in all cases, and it is
28
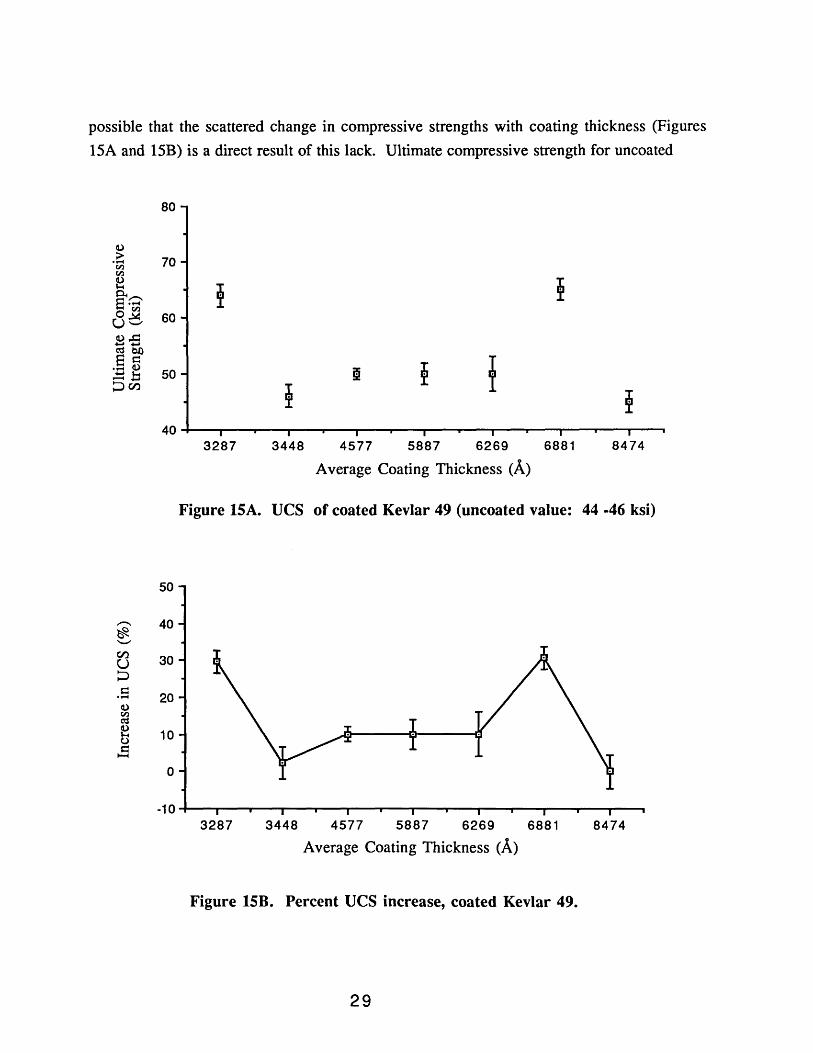
possible that the scattered change in compressive strengths with coating thickness (Figures15A and 15B) is a direct result of this lack. Ultimate compressive strength for uncoated
80
Q,):> 70• ...-4tI)tI)
~ ! ~~,-....8 ....-4otl) 60UCQ,)..d~ ~c!jbl)
8 c::~ ~
• ...-4 Q,) 50 ~~M- ~~CI)~ ~
403287 3448 4577 5887 6269 6881 8474
Average Coating Thickness (A)
Figure 15A. ues of coated Kevlar 49 (uncoated value: 44 -46 ksi)
50
,-.... 40~--CI) 30U~t= 20'.-4
Q,)tI)
c!j
~ 10t=~
0
-103287 3448 4577 5887 6269 6881 8474
Average Coating Thickness (A)
Figure 15B. Percent ues increase, coated Kevlar 49.
29
Kevlar™ 49 is bracketed between 44 and 46 ksi. As for PBO, this is lower than the valuereported in Table 2. Compressive strengths near 65 ksi occur at 3287A and 6881A,thicknesses which represent 6% and 11% of the fiber radius. At 8474A, the DCS dropsslightly below the baseline value.
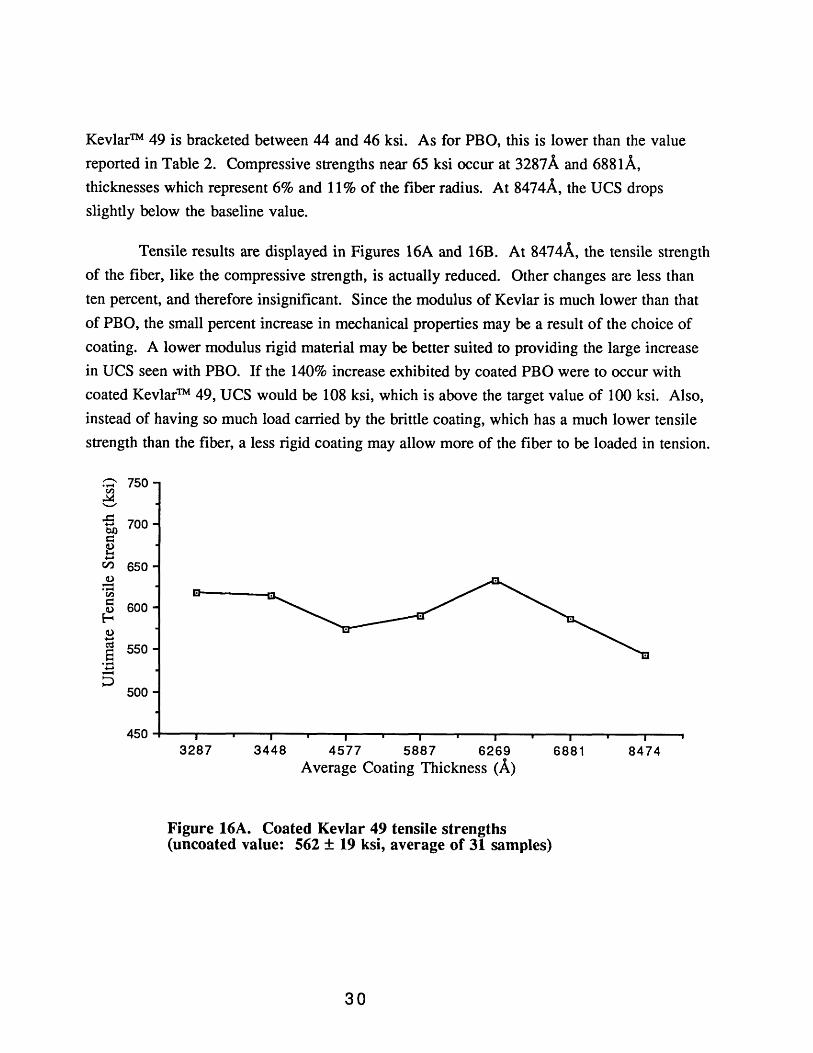
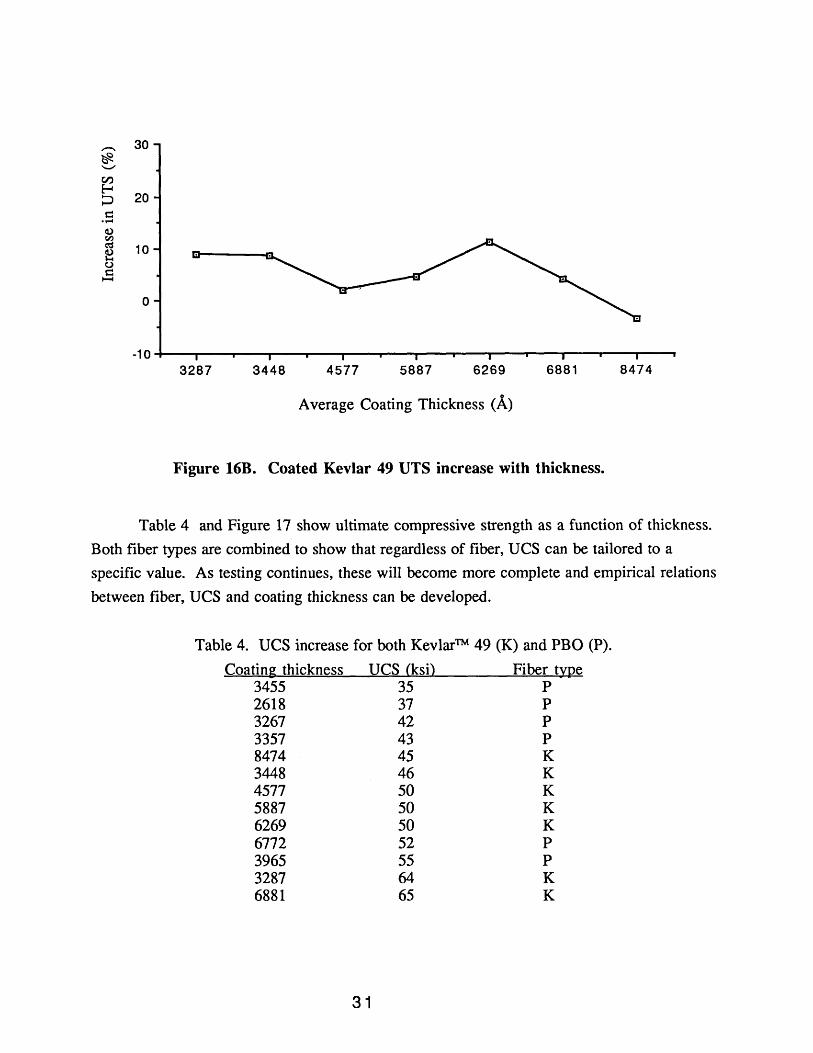
Tensile results are displayed in Figures 16A and 16B. At 8474A, the tensile strengthof the fiber, like the compressive strength, is actually reduced. Other changes are less thanten percent, and therefore insignificant. Since the modulus of Kevlar is much lower than thatof PBO, the small percent increase in mechanical properties may be a result of the choice ofcoating. A lower modulus rigid material may be better suited to providing the large increasein DCS seen with PBO. If the 140% increase exhibited by coated PBO were to occur withcoated Kevlar™ 49, DCS would be 108 ksi, which is above the target value of 100 ksi. Also,instead of having so much load carried by the brittle coating, which has a much lower tensilestrength than the fiber, a less rigid coating may allow more of the fiber to be loaded in tension.
..- 750'...-4en~'-"
-5 700bl)c::~~
r.I) 650d)-• ...-4enc:: 600
~d)~d 5508
• .-4~-~ 500
4503287 3448 4577 5887 6269
Average Coating Thickness (A)6881 8474
Figure 16A. Coated Kevlar 49 tensile strengths(uncoated value: 562:t 19 ksi, average of 31 samples)
30
..- 30~.......,.c:I)
~20:::>
c.,.-4
0v.ltd 10~c..>C~
0
-10 -+--T--,.--_r------,,........-r---r-_....- ........--,.--...,.....-ooy_--.---T-__,3287 3448 4577 5887 6269 6881 8474
Average Coating Thickness (A)
Figure 16B. Coated Kevlar 49 UTS increase with thickness.
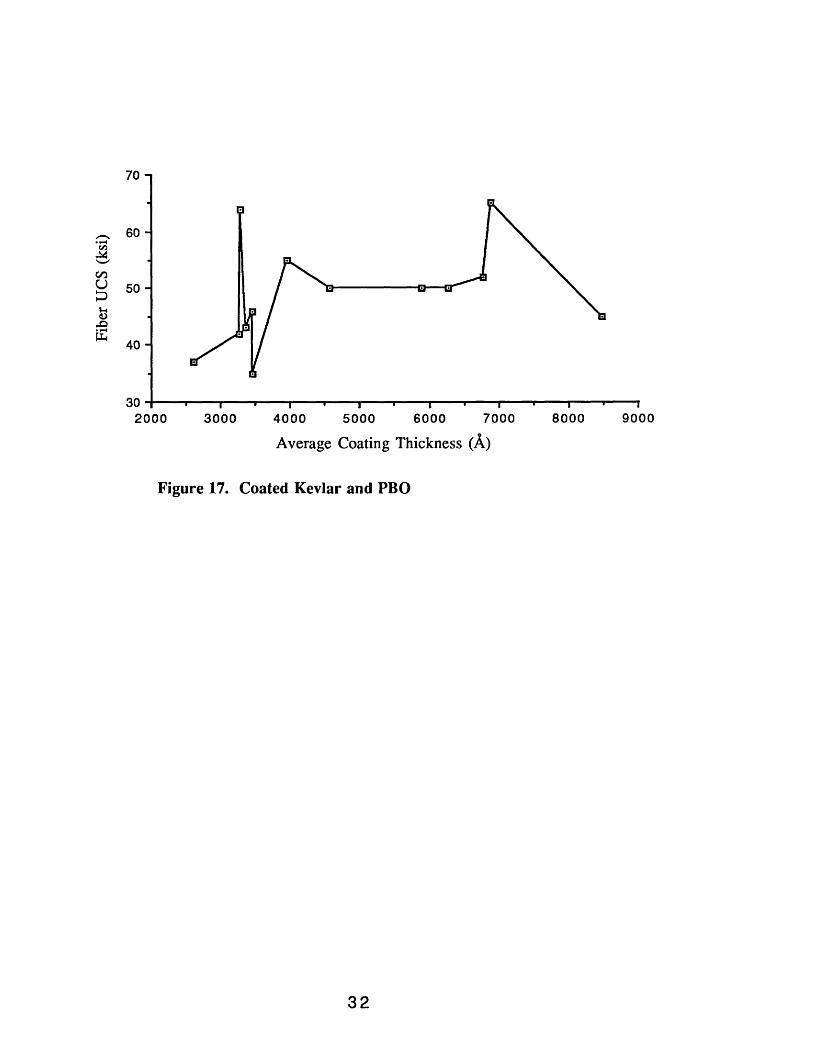
Table 4 and Figure 17 show ultimate compressive strength as a function of thickness.Both fiber types are combined to show that regardless of fiber, DCS can be tailored to aspecific value. As testing continues, these will become more complete and empirical relationsbetween fiber, DCS and coating thickness can be developed.
Table 4. DCS increase for both Kevlar™ 49 (K) and PBO (P).Coating thickness DCS (ksi) Fiber type
3455 35 P2618 37 P3267 42 P3357 43 P8474 45 K3448 46 K4577 50 K5887 50 K6269 50 K6772 52 P3965 55 P3287 64 K6881 65 K
31
900080004000 5000 6000 7000Average Coating Thickness (A)
300030+--~-~-r-----,r--~---r-.....,..---r--....,--...,...--r--~-,....---,2000
70
..- 60.~~~'-"
enU 50:::>~Q)
..0.~~ 40
Figure 17. Coated Kevlar and PBO
32
4. CONCLUSIONS
Tensile recoil testing, especially with FI-RE-CUT is an effective means fordetermining the compressive strength of high performance fibers such as Kevlar™ 49 andPBO. With a large enough sample set, ultimate compressive strength can be bracketed towithin a few thousand pounds per square inch. The results match the performance exhibitedin composites.
The application of a high modulus coating can significantly increase the ultimatecompressive strengths of Kevlar™ 49 and PBO by providing lateral support for fibrils andrestraining kink band formation. Mechanical property alteration is dependent on coatingthickness. For thin coatings, DCS improvements of up to 140% are seen with PBO, with noaccompanying loss in tensile strength. Improvements in Kevlar™ 49 are less dramatic dueto irregular coating adhesion and a greater mismatch between fiber and coating moduli.
33
5. SUGGESTIONS FOR FUTURE WORK
Current research should be continued. First, the adhesion problem with Kevlar needsto be solved, so greater DCS improvement may be obtained. Second, the range of coatingthicknesses tested on PBO should be expanded. This can only be accomplished if largequantities of undamaged PBO fiber with consistent diameters can be produced.
Other fiber types, such as SPECTRA, should be coated. A rigid coating shouldincrease the ultimate compressive strength of any fiber which fails by kink band formation.Also, fiber behavior with a variety of coatings should be explored.
Complete results for tensile and tensile recoil tests will be more easily obtained if thefiber coating process is modified. The variation of coating thickness for a single run will needto compensated. A rack with less friction is needed to allow more fibers to be coated per runthan is currently possible. Eventually, this coating process will need to be scaled up andmodified for continuous coated fiber production.
34
6. APPENDIX A- TENSILE AND TENSILE RECOIL TEST RESULTS
35
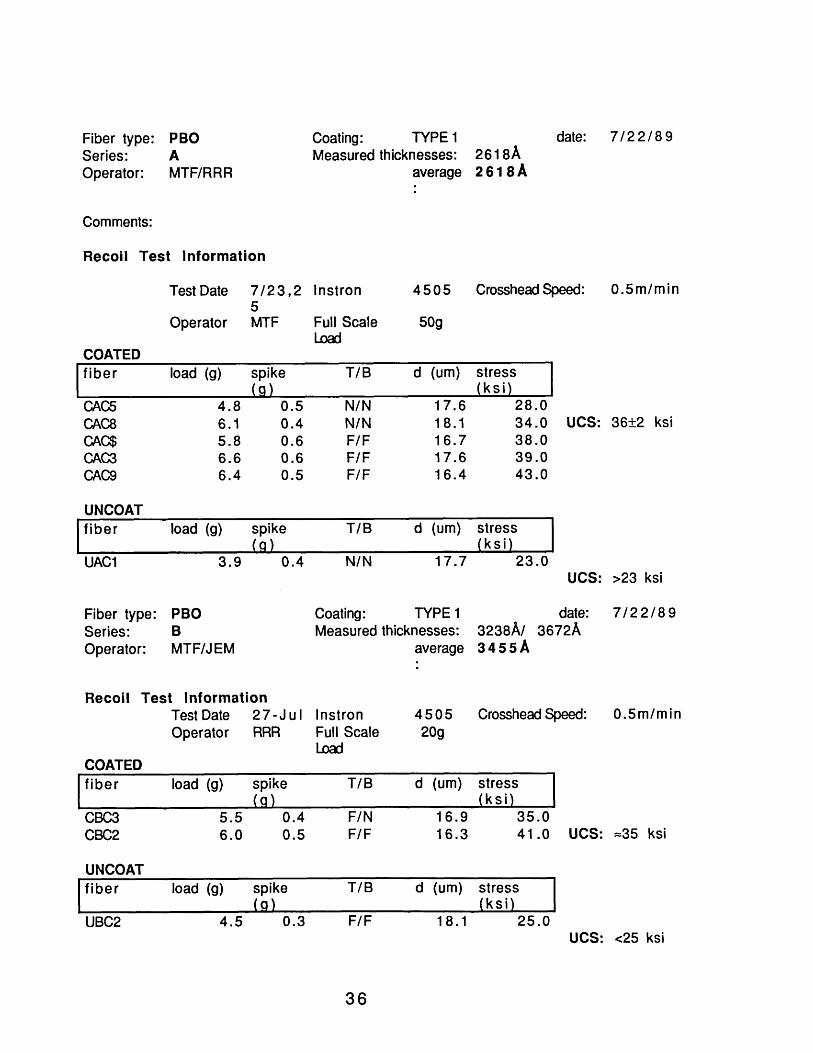
Fiber type: PBO Coating: TYPE 1 date: 7/22/89Series: A Measured thicknesses: 2618AOperator: MTF/RRR average 2618A
Comments:
Recoil Test Information
Test Date 7/23,2 Instron 4505 Crosshead Speed: 0.5m/min5
Operator MTF Full Scale 50gum
COATEDfiber load (g) spike TIS d (urn)
CACS 4.8 0.5 N/N 17.6 28.0CACB 6.1 0.4 N/N 18.1 34.0 UCS: 36:t2 ksiCAC$ 5.8 0.6 F/F 16.7 38.0CAC2 6.6 0.6 F/F 17.6 39.0CAC9 6.4 0.5 F/F 16.4 43.0
UNCOATfiber load (g) spike TIS d (urn)
UAC1 3.9 0.4 N/N 17.7 23.0UCS: >23 ksi
Fiber type: PBO Coating: TYPE 1 date: 7/22/89Series: B Measured thicknesses: 3238AI 3672AOperator: MTF/JEM average 34SsA
Recoil Test InformationTest Date 27-Jul Instron 4505 Crosshead Speed: 0.5m/minOperator RRR Full Scale 20g
umCOATEDfiber load (g) spike TIS d (urn)
CBC3 5.5 0.4 FIN 16.9 35.0CBC2 6.0 0.5 F/F 16.3 41.0 UCS: :::35 ksi
UNCOATfiber load (g) spike TIS d (urn)
USC2 4.5 0.3 F/F 18.1 25.0UCS: <25 ksi
36
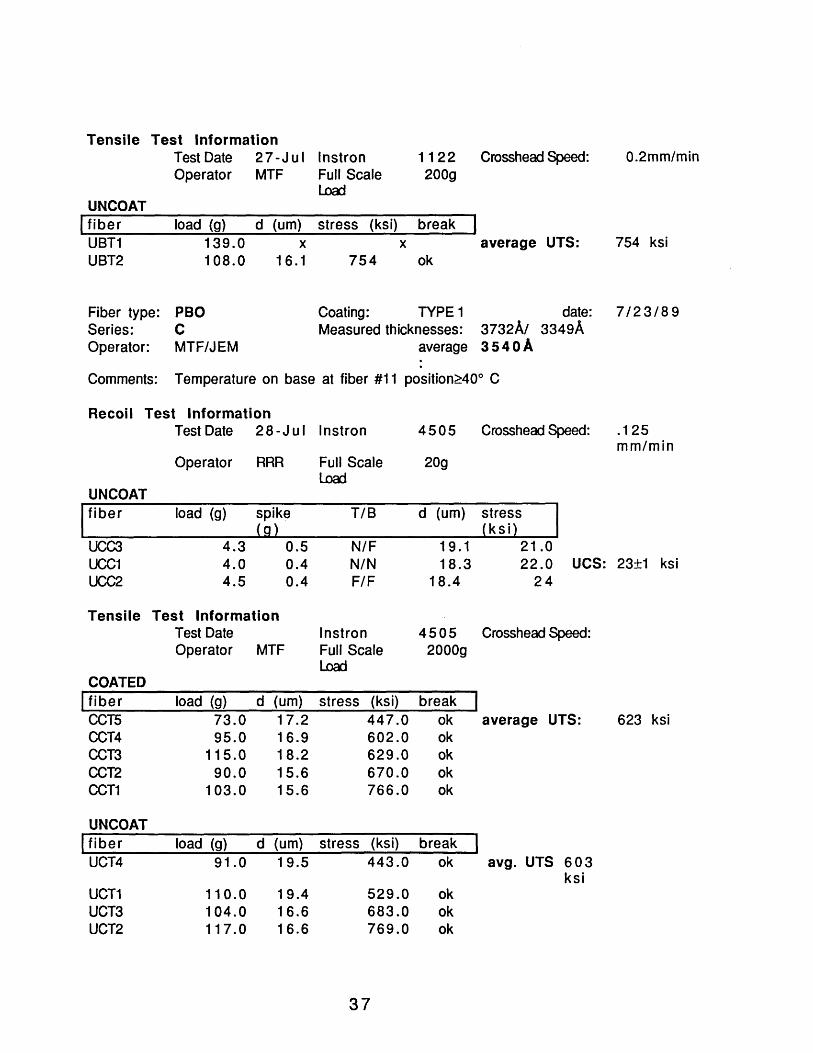
Tensile Test InformationTest Date 27-Jul Instron 1122 Crosshead Speed: 0.2mm/minOperator MTF Full Scale 200g
LoOOUNCOAT
I fiber load (g) d (urn) stress (ksi) break IUBT1 139.0 x x average UTS: 754 ksiUBT2 108.0 16.1 754 ok
Fiber type: PBO Coating: TYPE 1 date: 7/23/89Series: C Measured thicknesses: 3732AI 3349AOperator: MTF/JEM average 3540A
Comments: Temperature on base at fiber #11 position~40° C
Recoil Test InformationTest Date 28-Jul Instron 4505 Crosshead Speed: .125
mm/minOperator RRR Full Scale 20g
LoOOUNCOATfiber load (g) spike T/B d (urn)
UCC3 4.3 0.5 N/F 19.1 21.0UCC1 4.0 0.4 N/N 18.3 22.0 UCS: 23:t1 ksiUCC2 4.5 0.4 F/F 18.4 24
Tensile Test InformationTest Date Instron 4505 Crosshead Speed:Operator MTF Full Scale 2000g
LoOOCOATED
I fiber load (g) d (urn) stress (ksi) breakCCTS 73.0 17.2 447.0 ok average UTS: 623 ksiCCT4 95.0 16.9 602.0 okCCT3 115.0 18.2 629.0 okCCT2 90.0 15.6 670.0 okCCT1 103.0 15.6 766.0 ok
UNCOATI fiber load (g) d (urn) stress (ksi) break
UCT4 91.0 19.5 443.0 ok avg. UTS 603ksi
UCT1 110.0 19.4 529.0 okUCT3 104.0 16.6 683.0 okUCT2 117.0 16.6 769.0 ok
37
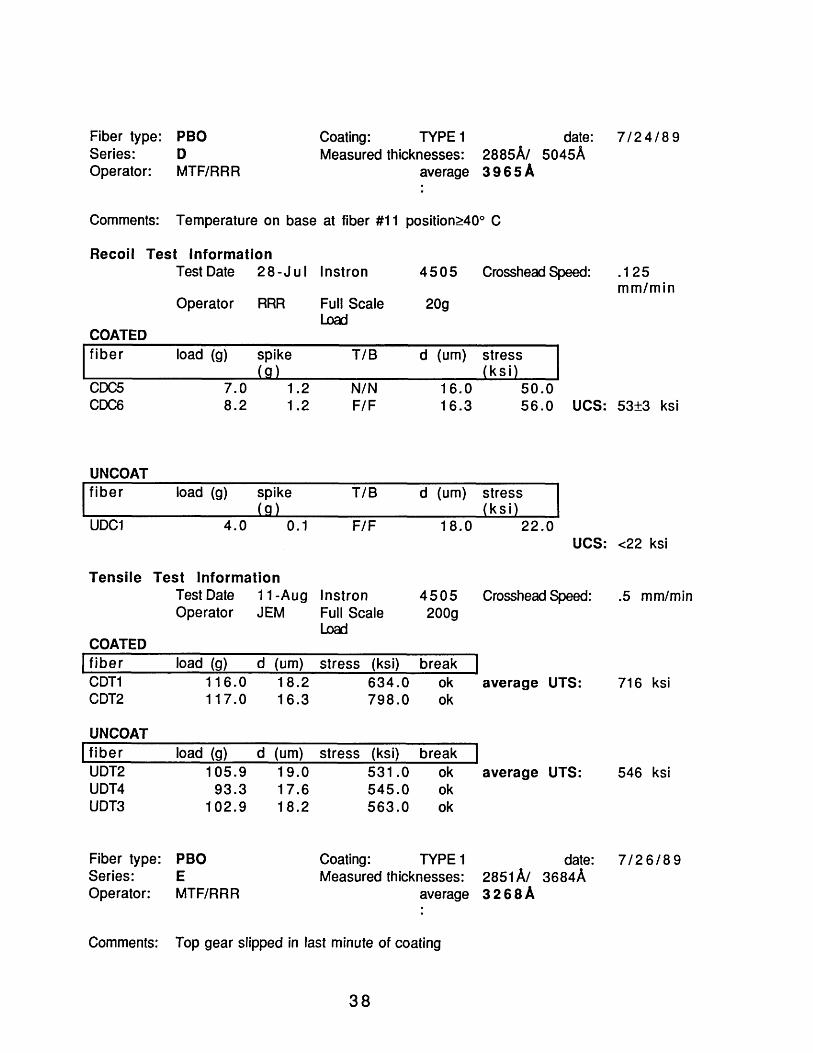
Fiber type: PBOSeries: DOperator: MTF/RRR
Coating: TYPE 1 date: 7 I 24 189Measured thicknesses: 2885AI 5045A
average 396SA
Comments: Temperature on base at fiber #11 position~40° C
Recoil Test InformationTest Date 28-Jul Instron 4505 Crosshead Speed: .125
mm/minOperator RRR Full Scale 20g
LoajCOATEDfiber load (g) spike TIS d (urn)
coes 7.0 1.2 N/N 16.0 50.0CDC6 8.2 1.2 F/F 16.3 56.0 UC5: 53:t3 ksi
UNCOATfiber load (g) spike TIS d (urn)
UDC1 4.0 0.1 F/F 18.0 22.0UC5: <22 ksi
Tensile Test InformationTest Date 11-Aug Instron 4505 Crosshead Speed: .5 mm/minOperator JEM Full Scale 200g
LoajCOATED
I fiber load (g) d (urn) stress (ksi) breakCDT1 116.0 18.2 634.0 ok average UT5: 716 ksiCDT2 117.0 16.3 798.0 ok
UNCOATI fiber load (g) d (urn) stress (ksi) break
UDT2 105.9 19.0 531.0 ok average UT5: 546 ksiUDT4 93.3 17.6 545.0 okUDT3 102.9 18.2 563.0 ok
Fiber type: PBO Coating: TYPE 1 date: 7/26/89Series: E Measured thicknesses: 2851AI 3684AOperator: MTF/RRR average 326SA
Comments: Top gear slipped in last minute of coating
38
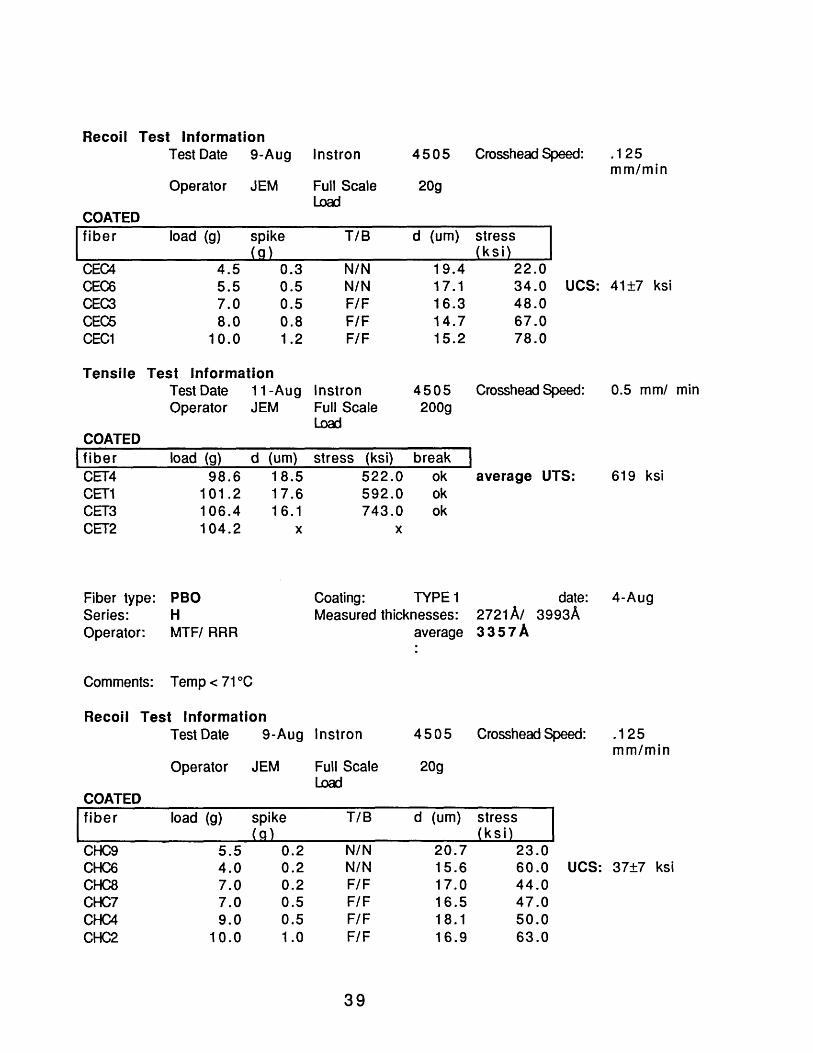
Recoil Test InformationTest Date 9-Aug Instron 4505 Crosshead Speed: .125
mm/minOperator JEM Full Scale 20g
l..oOOCOATEDfiber load (g) spike TIS d (um)
CEC4 4.5 0.3 N/N 19.4 22.0CECG 5.5 0.5 N/N 17.1 34.0 UCS: 41:t7 ksiCEC3 7.0 0.5 F/F 16.3 48.0CECS 8.0 0.8 F/F 14.7 67.0CEC1 10.0 1.2 F/F 15.2 78.0
Tensile Test InformationTest Date 11-Aug Instron 4505 Crosshead Speed: 0.5 mml minOperator JEM Full Scale 200g
l..oOOCOATED
I fiber load (g) d (um) stress (ksi) break ICET4 98.6 18.5 522.0 ok average UTS: 619 ksiCET1 101.2 17.6 592.0 okCET3 106.4 16.1 743.0 okCET2 104.2 x x
Fiber type: PBO Coating: TYPE 1 date: 4-AugSeries: H Measured thicknesses: 2721AI 3993AOperator: MTFI RRR average 3357A
Comments: Temp < 71°C
Recoil Test InformationTest Date 9-Aug Instron 4505 Crosshead Speed: .125
mm/minOperator JEM Full Scale 20g
l..oOOCOATEDfiber load (g) spike TIS d (um)
CHC9 5.5 0.2 N/N 20.7 23.0CHCG 4.0 0.2 N/N 15.6 60.0 UCS: 37i:.7 ksiCHCB 7.0 0.2 F/F 17.0 44.0CHC7 7.0 0.5 F/F 16.5 47.0CHC4 9.0 0.5 F/F 18.1 50.0CHC2 10.0 1.0 F/F 16.9 63.0
39
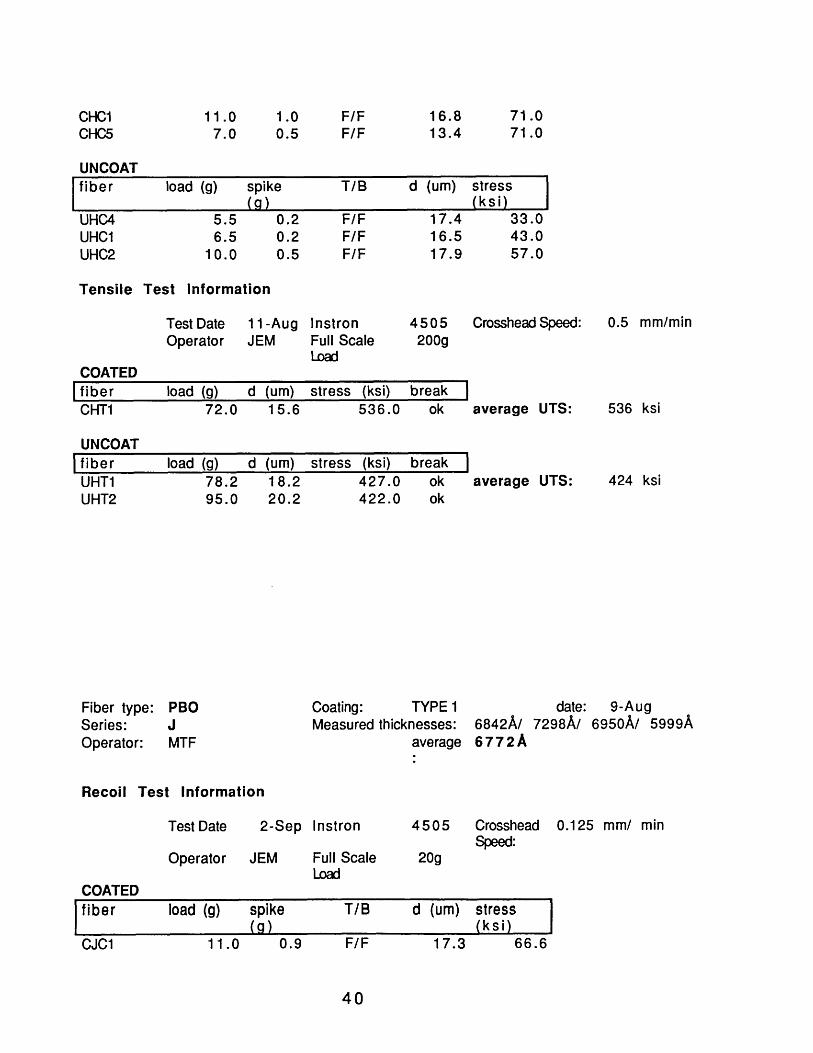
CHC1 11.0 1.0 F/F 16.8 71.0CHCS 7.0 0.5 F/F 13.4 71.0
UNCOATfiber load (g) spike T/B d (urn)
UHC4 5.5 0.2 F/F 17.4 33.0UHC1 6.5 0.2 F/F 16.5 43.0UHC2 10.0 0.5 F/F 17.9 57.0
Tensile Test Information
Test Date 11-Aug Instron 4505 Crosshead Speed: 0.5 rnrn/rninOperator JEM Full Scale 200g
LoOOCOATED
I fiber load (g) d (urn) stress (ksi) breakCHT1 72.0 15.6 536.0 ok average UTS: 536 ksi
UNCOATI fiber load (g) d (urn) stress (ksi) break
UHT1 78.2 18.2 427.0 ok average UTS: 424 ksiUHT2 95.0 20.2 422.0 ok
Fiber type: PBOSeries: JOperator: MTF
Recoil Test Information
Coating: TYPE 1 date: 9-AugMeasured thicknesses: 6842AI 7298AI 6950AI 5999A
average 6772A
Test Date 2-Sep Instron 4505 Crosshead 0.125 rnrnl rninSpeed:
Operator JEM Full Scale 20gLoOO
COATEDfiber load (g) spike TIS d (urn)
CJC1 11.0 0.9 F/F 17.3 66.6
40
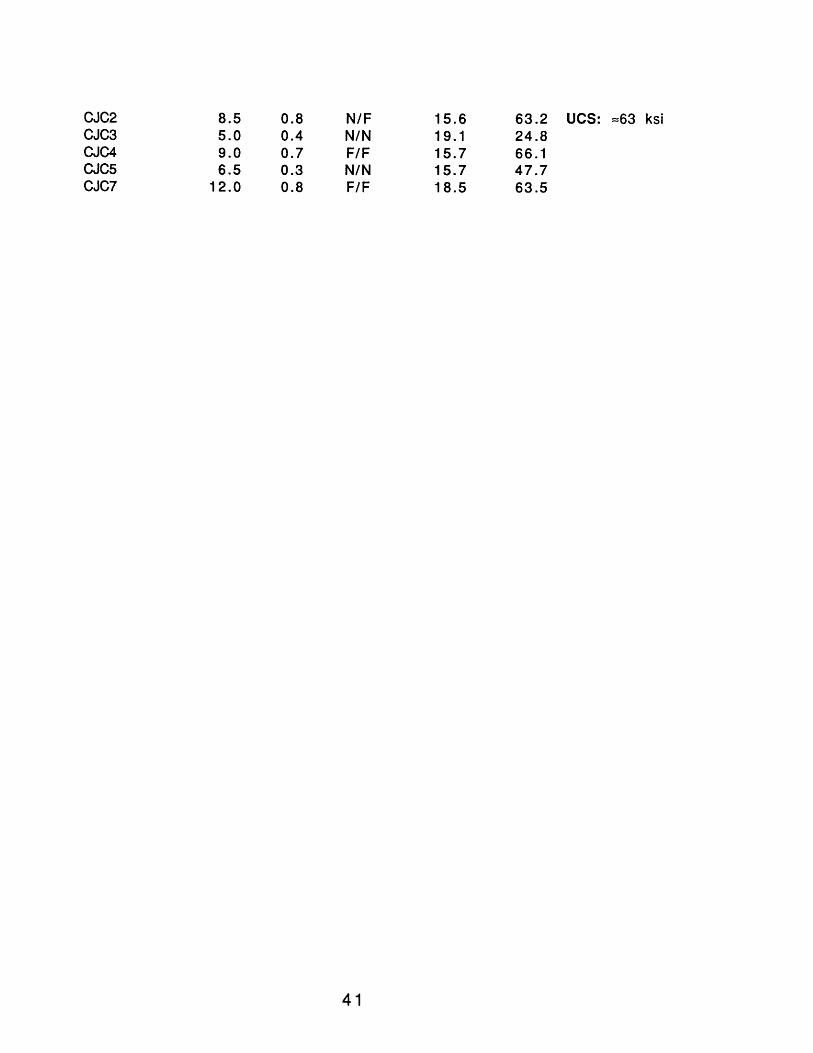
CJC2 8.5 0.8 N/F 15.6 63.2 UCS: =63 ksiCJC3 5.0 0.4 N/N 19.1 24.8CJC4 9.0 0.7 F/F 15.7 66.1CJC5 6.5 0.3 N/N 15.7 47.7CJC7 12.0 0.8 F/F 18.5 63.5
41
6. APPENDIX A- TENSILE AND TENSILE RECOILTEST RESULTS
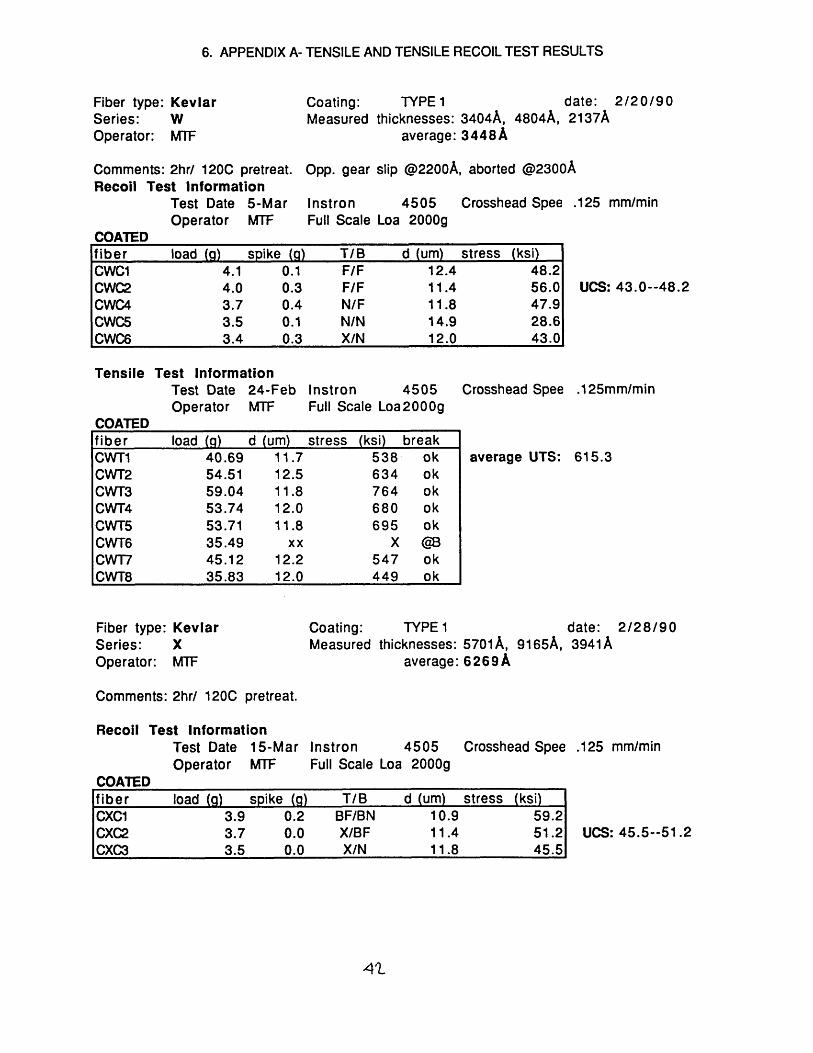
Fiber type: KevlarSeries: WOperator: M1F
Coating: TYPE 1 date: 2/20/90Measured thicknesses: 3404A, 4804A, 2137A
average: 344SA
Comments: 2hrl 120C pretreat. Opp. gear slip @2200A, aborted @2300ARecoil Test Information
Test Date 5-Mar Instron 4505 Crosshead Spee .125 mmlminOperator MTF Full Scale Loa 2000g
COATEDfiber load (0) spike (0) TIB d (urn) stress (ksi)CWC1 4.1 0.1 FIF 12.4 48.2CWC2 4.0 0.3 F/F 11.4 56.0CWC4 3.7 0.4 N/F 11.8 47.9cwes 3.5 0.1 N/N 14.9 28.6cwes 3.4 0.3 X/N 12.0 43.0
ucs: 43.0--48.2
Tensile Test InformationTest Date 24-Feb Instron 4505 Crosshead Spee .125mm/minOperator MTF Full Scale Loa2000g
COATEDfiber load (0) d (urn) stress (ksi) breakCWT1 40.69 11.7 538 okCWT2 54.51 12.5 634 okCWT3 59.04 11.8 764 okCWT4 53.74 12.0 680 okCWT5 53.71 11.8 695 okCWT6 35.49 xx X @3CWT7 45.12 12.2 547 okCWT8 35.83 12.0 449 ok
average UTS: 615.3
Fiber type: KevlarSeries: XOperator: M1F
Comments: 2hr/ 120C pretreat.
Coating: TYPE 1 date: 2/28/90Measured thicknesses: 5701 A, 9165A, 3941 A
average: 6269A
Recoil Test InformationTest Date 15-Mar Instron 4505 Crosshead Spee .125 mm/minOperator MTF Full Scale Loa 2000g
COATEDfiberCXC1CXC2CXC3
load (a) soike (a)
3.9 0.23.7 0.03.5 0.0
T/BBF/BNX/BFX/N
41.
d (urn) stress (ksi)10.9 59.211.4 51.2 UCS: 45.5--51.211.8 45.5
6. APPENDIX A- TENSILE AND TENSILE RECOILTEST RESULTS
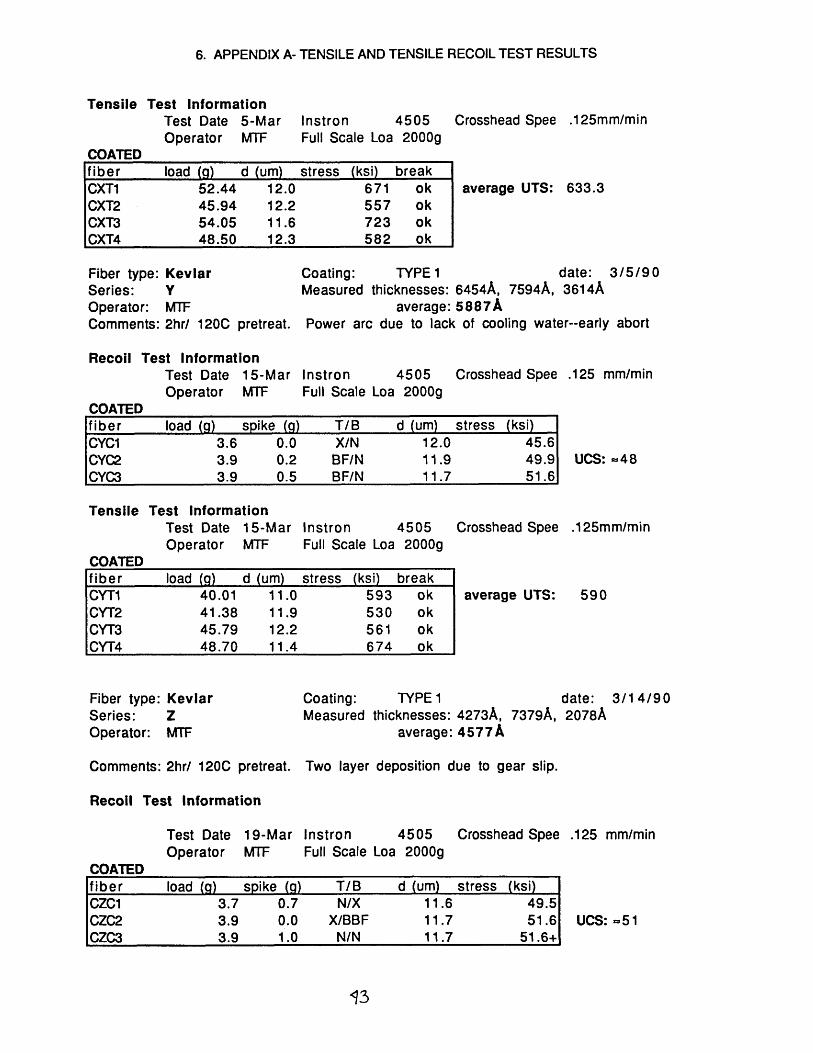
Tensile Test InformationTest Date 5-MarOperator MTF
COATEDInstron 4505 Crosshead Spee .125mm/minFull Scale Loa 2000g
fiber load (a) d (um) stress (ksi) breakCXT1 52.44 12.0 671 okCXT2 45.94 12.2 557 okCXT3 54.05 11.6 723 okCXT4 48.50 12.3 582 ok
average UTS: 633.3
Fiber type: Kevlar Coating: TYPE 1 date: 3/5/90Series: Y Measured thicknesses: 6454A, 7594A, 3614AOperator: MTF average: 5887 AComments: 2hrl 120C pretreat. Power arc due to lack of cooling water--early abort
Recoil Test InformationTest Date 15-Mar Instron 4505 Crosshead Spee .125 mm/minOperator MTF Full Scale Loa 2000g
COATEDfiberCYC1CYC2CYC3
load (a) spike (a)
3.6 0.03.9 0.23.9 0.5
T/BX/N
BF/NBF/N
d (um) stress (ksi)12.0 45.611.9 49.9 UCS: =4811.7 51.6
Tensile Test InformationTest Date 15-Mar Instron 4505 Crosshead Spee .125mm/minOperator MTF Full Scale Loa 2000g
COATEDfiber load (a) d (um) stress (ksi) breakCYT1 40.01 11.0 593 okCYT2 41.38 11.9 530 okCYT3 45.79 12.2 561 okCYT4 48.70 11.4 674 ok
average UTS: 590
Fiber type: KevlarSeries: ZOperator: MTF
Coating: TYPE 1 date: 3/1 4/90Measured thicknesses: 4273A, 7379A, 2078A
average: 4577 A
Comments: 2hr/ 120C pretreat. Two layer deposition due to gear slip.
Recoil Test Information
Test Date 19-Mar Instron 4505 Crosshead Spee .125 mm/minOperator MTF Full Scale Loa 2000g
COATEDfiber load (a) spike (a) T/B d (um) stress (ksi)CZC1 3.7 0.7 NIX 11.6 49.5CZC2 3.9 0.0 X/BBF 11.7 51.6 UCS: =51CZC3 3.9 1.0 N/N 11.7 51.6+
<13
6. APPENDIX A- TENSILE AND TENSILE RECOILTEST RESULTS
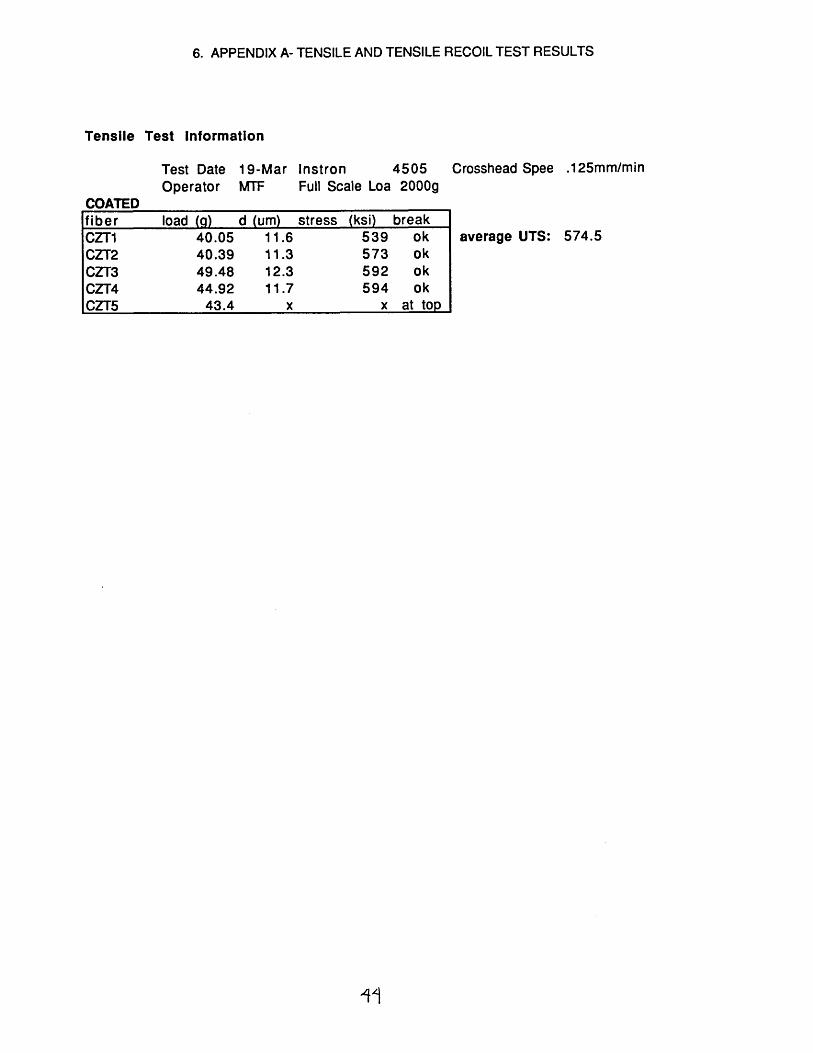
Tensile Test Information
Test Date 19-Mar Instron 4505 Crosshead Spee .125mm/minOperator MTF Full Scale Loa 2000g
COATEDfiber load (a) d (um) stress (ksi) breakCZT1 40.05 11.6 539 okCZT2 40.39 11.3 573 okCZT3 49.48 12.3 592 okCZT4 44.92 11.7 594 okCZT5 43.4 x x at top
average UTS: 574.5
14
6. APPENDIX A- TENSILE AND TENSILE RECOILTEST RESULTS
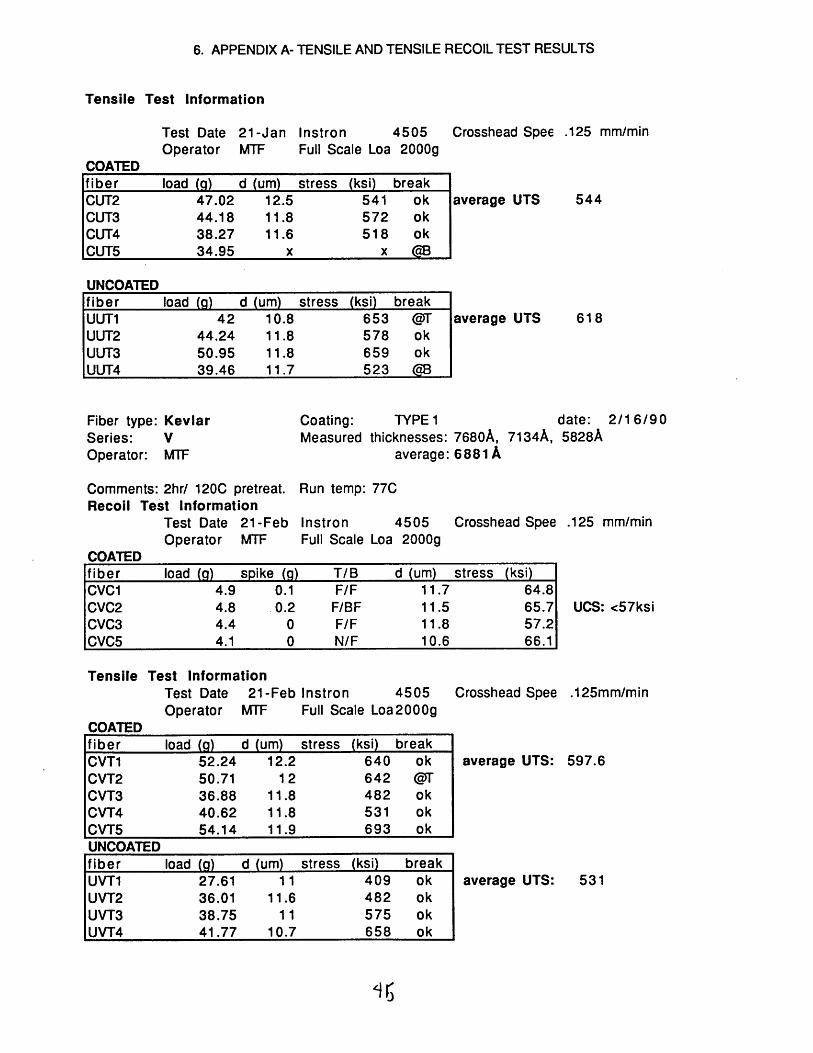
Tensile Test Information
Test Date 21-Jan Instron 4505 Crosshead Spee .125 mm/minOperator MTF Full Scale Loa 2000g
COATEDfiberCUT2CUT3CUT4CUT5
UNCOATED
load d47.0244.1838.2734.95 x
okokok
average UTS 544
fiber load (a) d (um) stress (ksi) breakUUT1 42 10.8 653 @fUUT2 44.24 11.8 578 okUUT3 50.95 11.8 659 okUUT4 39.46 11.7 523 @8
average UTS 61 8
Fiber type: KevlarSeries: VOperator: MlF
Coating: TYPE 1 date: 2/1 6/90Measured thicknesses: 7680A, 7134A, 5828A
average: 6881 A
Comments: 2hrl 120C pretreat. Run temp: 77CRecoil Test Information
Test Date 21-Feb Instron 4505 Crosshead Spee .125 mm/minOperator MTF Full Scale Loa 2000g
COATEDfiber load (0) spike (0) TIS d (um) stress (ksi)CVC1 4.9 0.1 F/F 11.7 64.8CVC2 4.8 0.2 F/BF 11.5 65.7CVC3 4.4 0 F/F 11.8 57.2CVC5 4.1 0 N/F 10.6 66.1
ucs: <57ksi
Tensile Test InformationTest Date 21-Feb Instron 4505 Crosshead Spee .125mm/minOperator MTF Full Scale Loa2000g
COATEDfiber load (0) d (um) stress (ksi) breakCVT1 52.24 12.2 640 okCVT2 50.71 12 642 @fCVT3 36.88 11.8 482 okCVT4 40.62 11.8 531 okCVT5 54.14 11.9 693 ok
average UTS: 597.6
UNCOATEDfiber load (a) d (um) stress (ksi) breakUVT1 27.61 1 1 409 okUVT2 36.01 11.6 482 okUVT3 38.75 1 1 575 okUVT4 41.77 10.7 658 ok
average UTS: 531
6. APPENDIX A- TENSILE AND TENSILE RECOILTEST RESULTS
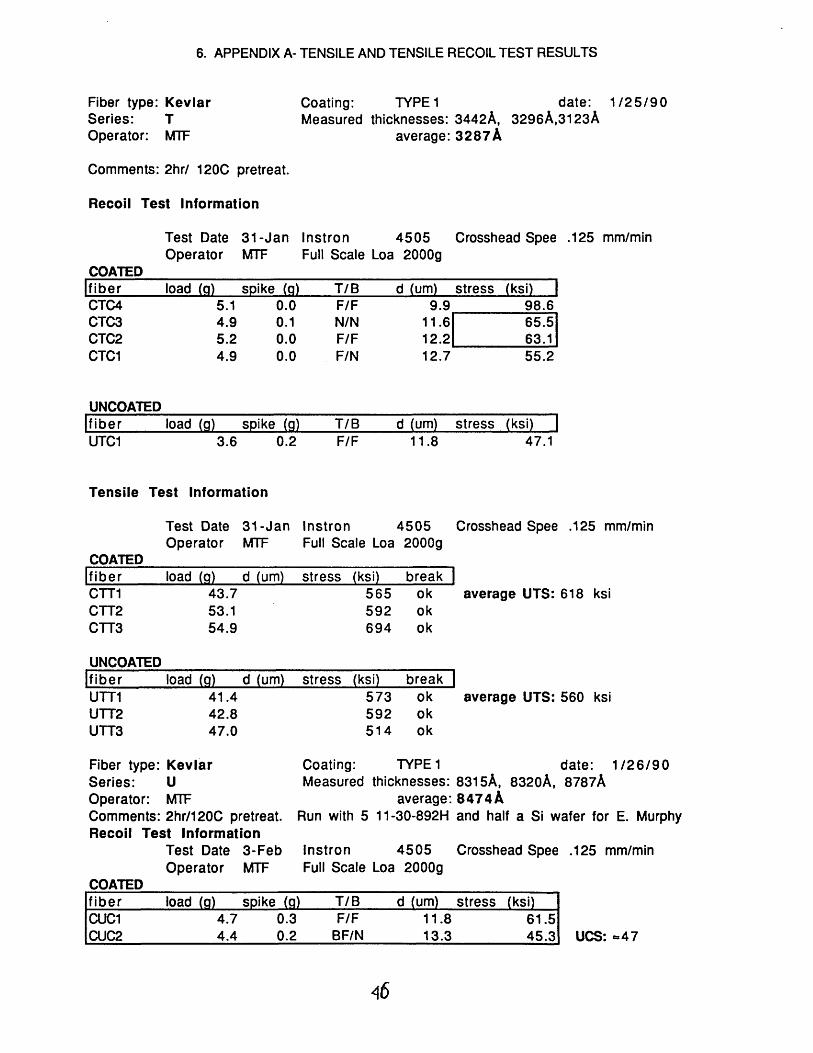
Fiber type: KevlarSeries: TOperator: MlF
Comments: 2hrl 120C pretreat.
Recoil Test Information
Coating: TYPE 1 date: 1/25/90Measured thicknesses: 3442A, 3296A,3123A
average: 3287 A
Test Date 31-Jan Instron 4505 Crosshead Spee .125 mm/minOperator MTF Full Scale Loa 2000g
COATED!fiber load (9) spike (g) TIS d (um) stress (ksi) ICTC4 5.1 0.0 F/F 9.9 98.6CTC3 4.9 0.1 N/N 11.61 65.51CTC2 5.2 0.0 F/F 12.2 63.1CTC1 4.9 0.0 FIN 12.7 55.2
UNCOATEDIfiber load (9) spike (9)UTC1 3.6 0.2
TISF/F
d (um) stress (ksi) I11.8 47.1
Tensile Test Information
Test Date 31-Jan Instron 4505 Crosshead Spee .125 mm/minOperator MTF Full Scale Loa 2000g
COATEDIfiber load (9) d (um) stress (ksi) breakCTT1 43.7 565 ok average UTS: 618 ksiCTT2 53.1 592 okCTT3 54.9 694 ok
UNCOATEDIfiber load (9) d (um) stress (ksi) break IUTT1 41.4 573 ok average UTS: 560 ksiUTT2 42.8 592 okUTT3 47.0 514 ok
Fiber type: KevlarSeries: UOperator: M1FComments: 2hr/120C pretreat.Recoil Test Information
Test Date 3-FebOperator MTF
Coating: TYPE 1 date: 1/26/90Measured thicknesses: 8315A, 8320A, 8787 A
average: 8474ARun with 5 11-30-892H and half a Si wafer for E. Murphy
Instron 4505 Crosshead Spee .125 mm/minFull Scale Loa 2000g
COATEDfiberCUC1CUC2
load (0) spike (0)4.7 0.34.4 0.2
TISF/F
SF/N
46
d (um) stress (ksi)11.8 61.513.3 45.3 UCS: =47
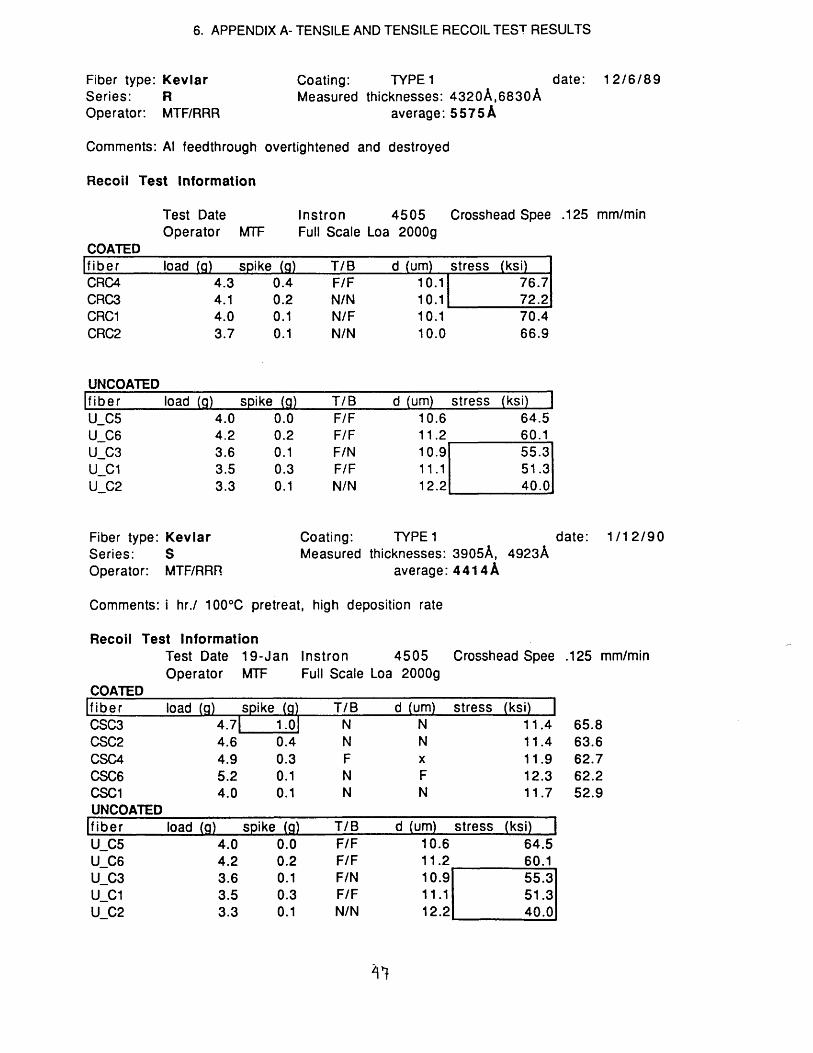
6. APPENDIXA- TENSILE AND TENSILE RECOILTEST RESULTS
Fiber type: KevlarSeries: ROperator: MTF/RRR
Coating: TYPE 1 date: 12/6/89Measured thicknesses: 4320A,6830A
average: sS7sA
Comments: AI feedthrough overtightened and destroyed
Recoil Test Information
Instron 4505 Crosshead Spee .125 mm/minFull Scale Loa 2000g
Test DateOperator MTF
COATEDfiber loadCRC4CRC3CRC1CRC2
UNCOATEDIfiber load (9) spike (g)U_C5 4.0 0.0U_C6 4.2 0.2U_C3 3.6 0.1U_C1 3.5 0.3U_C2 3.3 0.1
TIBF/FN/NN/FN/N
TIBF/FF/FFINF/FN/N
d
d (um) stress (ksi) I10.6 64.511.2r-- __ ---..;6;;..,;;0;..;...1..,10.9 55.311.1 51.312.2 40.0'--------
Fiber type: KevlarSeries: SOperator: MTF/RRR
Coating: TYPE 1 date: 1/12/90Measured thicknesses: 3905A, 4923A
average: 4414A
Comments: i hr.l 100°C pretreat, high deposition rate
Recoil Test InformationTest Date 19-Jan Instron 4505 Crosshead Spee .125 mm/minOperator MTF Full Scale Loa 2000g
COATEDfiber load TIB dCSC3 N 65.8CSC2 N 63.6CSC4 F x 62.7CSC6 N F 62.2CSC1 N N 52.9UNCOATED
lfiber load (9) spike (g) TIB d (um) stress (ksi) IU_C5 4.0 0.0 F/F 10.6 64.5U_C6 4.2 0.2 F/F 11.2 60.1U_C3 3.6 0.1 FIN 10.9 55.3U_C1 3.5 0.3 F/F 11 .1 51.3U_C2 3.3 0.1 N/N 12.2 40.0
7. APPENDIX B- SCANNING ELECTRON MICROGRAPHS
4S
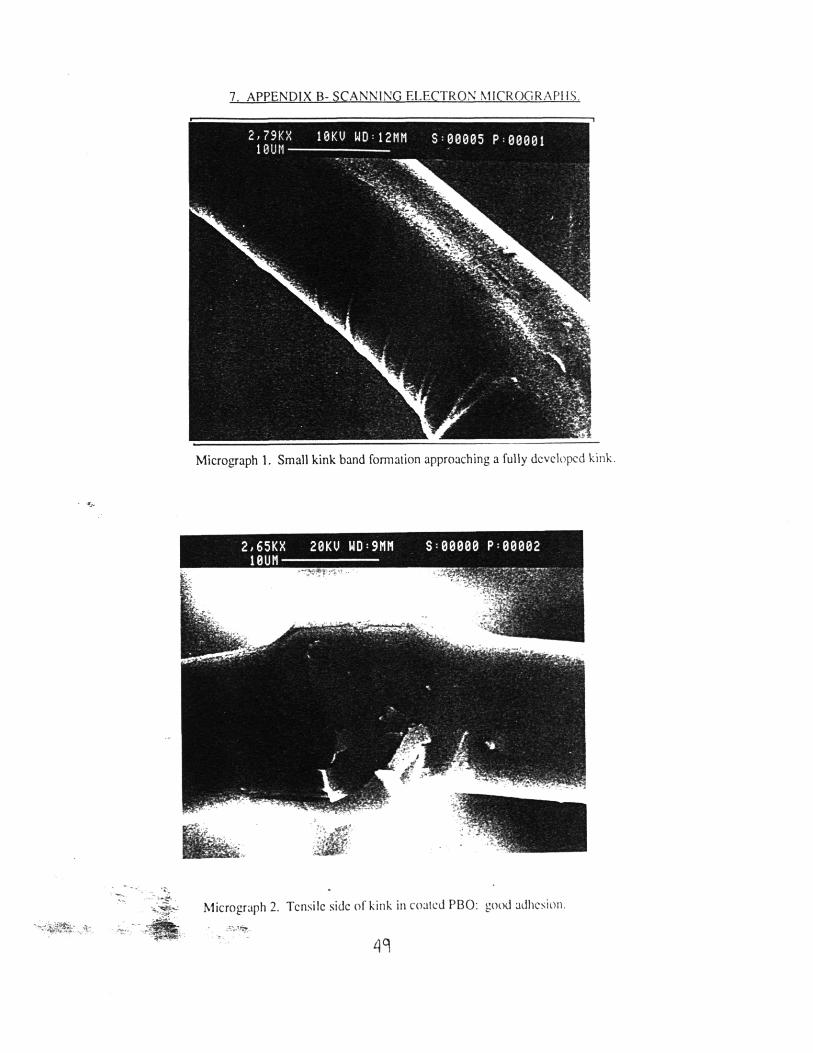
7. APPE DIX B- SCA I G ELECTRON 1ICROGRAPIIS.
Micrograph 1. Small kink band fomlation approaching a fully developed kink.
Microgr~ph 2. Tensile side of kink in coated PBO: good adhesion.
49
'0,
7. APPENDIX B- SCANNING ELECTRON MICROGRAPHS,
- ~..'~:~:~"L.- --J
Micrograph 3. Coated Kevlar loaded to 80% UTS and unloaded. Cracksmultiply and open with beam heating.
References:
1. Ashby Michael F., and Jones, David R.H. Engineering Materials 2. An Introductionto Microstructures. Processing and Design. 2nd ed. Pergamon Press, NewYork, 1988.
2. DeTeresa, S.J., Allen, S.R., Farris, R.1. and Porter, R.S. "Compressive andTorsional Behaviour of Kevlar 49 Fibre." J Mat Sci 19 (1984) 57-72.
3. Greenwood, 1.H. and Rose, P.G. "Compressive Behaviour of Kevlar 49 fibres andcomposites." J. Mat. Sci. 9 (1974) 1809-1814.
4. Fawaz, Scott A., Palazotto, Anthony N. and Wang, Chyi-Shan. CompressiveProperties of High Performance Polymeric Fibers. AFWAL-TR-88-4262.Interim report for April 1988- December 1988. Materials Laboratory, Air ForceWright Aeronautical Laboratories, Air Force Systems Command, Wright-Patterson Air Force Base, Ohio. March 1989.
5. Allen, S.R. "Tensile Recoil Measurement of Compressive Strenght for PolymericHigh Performance Fibers." J. Mat. Sci. 22 (1987) 853-859.
6. DeTeresa S.J., Farris, R.J. and Porter, R.S. "Behavior of Aramid Fiber UnderUniform Compression." Polym. Comp., April 1982, vol 3, No 2.57-58.
7. Kumar, Satish and Helminiak, T.E. "Compressive Strength of High PerformanceFibers." in The Materials Science and Engineering of Rigid-Rod Polymers,W.W. Adams, RK Eby, and D.E. McLemore, eds., Materials Research SocietySymposium Proceedings, vol. 134, Pittsburgh, PA 1989.
8. Kumar, Satish, Adams, W.W. and Helminiak, T.E. "Uniaxial Compressive Strengthof High Modulus Fibers for Composites" J Reinf. Plas. and Compo vol. 7, 1988.
9. Wilfong, R.E. and Zimmerman, 1. "Strength and Durability Characteristics of KevlarAramid Fiber." 1. Appl. Polym. Sci., Appl. Pol. Symposium 31, 1-21(1977)
10. Dobb, M.G., Johnson, D.J., and Saville, B.P. "Supramolecular Structure of a High-Modulus Polyaromatic Fiber (Kevlar 49)" 1. Polym. Sci., Polymer Physics ed.15, 2201-2211 (1977).
11. Penn, L. and Larsen, F. "Physicochemical Properties of Kevlar 49 Fiber." J. Appl.Polym. Sci. 23 59-73 (1979).
12. McGarry, FJ. 3.92 lecture notes, 1990.
13. Dally, 1., Rielly, W., and McConnell, K. Instrumentation for EngineeringMeasurements. New York: Wiley and Sons. 1984.
5 1