Embed Size (px)
Citation preview

Mechanical fatigue and fracture of Nitinol
S. W. Robertson*1, A. R. Pelton1 and R. O. Ritchie2
Nitinol, a near equiatomic intermetallic of nickel and titanium, is the most widely known and used
shape memory alloy. Owing to its capacity to undergo a thermal or stress induced martensitic
phase transformation, Nitinol displays recoverable strains that are more than an order of
magnitude greater than in traditional alloys, specifically as high as 10%. Since its discovery in the
1960s, Nitinol has been used for its shape memory properties for couplings and actuators,
although its contemporary use has been in for medical devices. For these applications, the stress
induced transformation (‘superelasticity’) has been used extensively for self-expanding
implantable devices such as endovascular stents and vena cava filters, and for tools such as
endodontic files. Most of these applications involve cyclically varying biomechanical stresses or
strains that drive the need to fully understand the fatigue and fracture resistance of this alloy. Here
we review the existing knowledge base on the fatigue of Nitinol, both in terms of their stress or
strain life (total life) and damage tolerant (crack propagation) behaviour, together with their
fracture toughness properties. We further discuss the application of such data to the fatigue
design and life prediction methodologies for Nitinol implant devices used in the medical industry.
Keywords: Nitinol, Fatigue, Fracture, Toughness, Total life, Damage tolerant, Review
Glossary of terms
Material specific termsAustenite – stable phase of Nitinol at temperaturesabove Af with a simple cubic B2 (CsCl) crystal structure.
Austenite finish temperature Af – the temperatureabove which Nitinol is fully austenitic.
Austenite start temperature As – the temperature atwhich, upon heating, martensitic Nitinol begins to phasetransform to austenite.
Martensite – stable phase of Nitinol at temperaturesbelow Mf with a monoclinic B199 crystal structure. Thisphase can be stress induced from austenite at tempera-tures between As and Md.
Martensitic deformation temperature Md – the tem-perature at which the energy to stress induce martensiteis equal to the energy to deform austenite plastically.Thus, the Md coincides with temperature at which thestress induced phase transformation is suppressed.
Martensite finish temperature Mf – the temperaturebelow which Nitinol is fully martensitic.
Martensite start temperature Ms – the temperature atwhich, upon cooling, austenitic Nitinol begins to phasetransform to martensite.
Nitinol NiXTiY – near equiatomic intermetallic ofnickel (X at-%) and titanium (Y at-%) capable ofexhibiting superelastic behaviour due to a stress induced
phase transformation, or shape memory due to atemperature induced phase transformation.
R phase – a rhombohedral phase of Nitinol that formsfrom the cubic austenite phase and is considered ano-ther martensite with a P3 crystal structure. The R phaseoften competes with the austenite–B199 martensitetransformation.
Shape memory – ability of a material to return to apretrained geometry upon the application of heat. Thisis accomplished by cooling the material below Ms, thendeforming it by detwinning of martensite, followed byraising the temperature to above Af at which point itreturns to its original undeformed geometry. Shapememory Nitinol can recover up to 10% strain.
Stress induced martensite – B199 martensite formedfrom the parent austenite phase in Nitinol through theapplication of stress energy into the material at tempera-tures above As. It is also possible to stress induce P3 Rphase.
Superelasticity (pseudoelasticity) – ability of a materialto accommodate global strains due to strain accommoda-tion via a martensitic phase transformation; see ‘stressinduced martensite’. For example, superelastic Nitinolalloys can exhibit fully reversible strains up to 10%.
Thermal martensite – martensite formed from theparent austenite phase through the application of thermalenergy (cooling) into the material.
Test method specific termsStrain amplitude ea – absolute value of the differencebetween the mean strain and either the maximum orminimum strain applied in cyclic fatigue conditions.ea5|em2emin|5|em2emax|; alternatively, the strain ampli-tude is half of the strain range5|emax2emin|/2. Since
1Nitinol Devices and Components (NDC), 47533 Westinghouse Dr.,Fremont, CA 94539, USA2Materials Sciences Division, Lawrence Berkeley National Laboratory, andDepartment of Materials Science and Engineering, University of California,Berkeley, CA 94720, USA
*Corresponding author, email [email protected]
� 2012 Institute of Materials, Minerals and Mining and ASM InternationalPublished by Maney for the Institute and ASM InternationalDOI 10.1179/1743280411Y.0000000009 International Materials Reviews 2012 VOL 57 NO 1 1

strains are second order tensors, these strain conditionsapply only to conditions in which there is only onedominant cyclic tensile strain or tensile stress and it is ina constant material direction.
Stress amplitude sa – absolute value of the differencebetween the mean stress and either the maximumor minimum stress applied in cyclic fatigue condi-tions. sa5|sm2smin|5|sm2smax|; alternatively, the stressamplitude is half of the stress range5|smax2smin|/2.Since stresses are second order tensors, these stressconditions apply only to conditions in which there isonly one dominant cyclic tensile strain or tensile stressand it is in a constant material direction.
Critical crack length acrit – dimensional length of a flawbelow which the material will not preferentially propagatea fatigue crack from that flaw. Flaws longer than acrit serveas stress concentrators in a material and act as preferentialnucleation sites for fatigue crack propagation.
Damage tolerant fatigue – measurement of fatiguecrack growth from a flaw or precrack that is intention-ally introduced into the specimen. This approachmeasures only the propagation stage of the fatigue life.
Displacement control – total life cyclic fatigue test runby fixing the displacement amplitudes regardless of forcerequired to achieve those displacements; a.k.a. straincontrol.
Fracture toughness KC – engineering parameter usedto describe the critical stress intensity factor that causesfracture when a monotonic load is applied to thematerial. The fracture toughness is often dependentupon the length of the flaw from which fractureoriginates, and usually asymptotes to a stable toughnessvalue above some flaw length. This dependence offracture toughness on the flaw size is characterised by acrack resistance curve (R curve).
Load control – total life cyclic fatigue test run byfixing the alternating loads regardless of displacementrequired to achieve those loads; a.k.a. stress control.
Load ratio (R ratio) – ratio of the minimum tomaximum loads (Pmin/Pmax), and hence for tensileloading, it is the ratio of the minimum to maximumstress intensities (Kmin/Kmax). See also ‘strain ratio (Re
ratio)’ below.
Mean strain em – average strain value between themaximum and minimum applied strain during cyclicloading conditions; em5(emaxzemin)/2.
Mean stress sm – average stress value between themaximum and minimum applied stress during cyclicloading conditions; sm5(smaxzsmin)/2.
Paris law – equation used to describe the linear portionof a fatigue crack growth curve per da/dN5CDKm, wherea is the instantaneous flaw length, N is the number offatigue cycles, C and m are scaling constants which aredependent upon the material in question and the loading/environmental conditions, e.g. the R ratio, the cyclicfrequency, the external environment, etc.
Plane strain – a boundary condition such that one ofthe three principal strain components applied to thespecimen is zero. This condition exists when onedimension is significantly large enough to effectivelyconstrain the material within that axis, thereby prevent-ing strain in that dimension.
Plane stress – a boundary condition such that one ofthe three principal stress components applied to thespecimen is zero. This condition exists in specimens with
significantly small dimensions in one axis. Moreover, thesurfaces of specimens may be considered plane stresssince the material is free to deform into open spacewithout any constraint.
R curve – the crack resistance curve, describing theresistance to fracture plotted as a function of subcriticalcrack extension Da.
Strain ratio Re – ratio of the minimum to maximumstrains (emin/emax), used similarly to the load ratio R. Inthe case of non-R521 conditions, it is appropriate to citethe mean strain and strain amplitude for clarification.
Stress intensity factor K – linear elastic field parameterused to describe the stress and displacement fields in theimmediate vicinity of a crack-like flaw in an elasticmaterial. K is proportional to the applied stress sapp,and square root of the flaw size a as per the followingexpression: K5Qsapp(pa)1/2, where Q is a geometryfactor of order unity.
Stress intensity range DK – the difference between themaximum and minimum stress intensity factorsKmax2Kmin that a specimen witnesses during a givenfatigue loading cycle.
Stress intensity threshold DKth – the stress intensityrange value below which fatigue crack propagationoccurs at vanishingly small growth rates (typically belowy10210 to 10211 m/cycle).
Stress range Ds – difference between the maximumand minimum applied stresses. Ds5(smax2smin)52sa.
Strain range De – difference between the maximumand minimum applied strains. De5(emax2emin)52ea.
Total life fatigue – measurement of fatigue crackgrowth from a specimen that has undergone treatment(e.g. polishing and heat treatment) to render the surfacecomparable with a commercially equivalent devicewithout intentional introduction of a flaw or precrack.This approach measures both the nucleation andpropagation stages of the fatigue life, where nucleationoriginates from stress concentrations native to thematerial (e.g. grain boundary and inclusion).
Introduction‘Nitinol’ (NiTi) is a nearly equiatomic intermetallic ofnickel and titanium. Its unique properties were firstrevealed in 1962 by Buehler and Wang at the NavalOrdnance Laboratory – indeed, the term ‘Nitinol’ isthe acronym for Nickel Titanium Naval OrdnanceLaboratory. The commercial importance of Nitinol isdue to its closely related properties of shape memoryand superelasticity (also referred to as pseudoelasticity).Both properties result from the phase transformationbetween an austenitic (parent) phase [with a simple cubicB2 (CsCl) structure] to a martensite (daughter) phase(with a monoclinic B199 structure)* as described inseveral references.2–4 Although some commercial successhas been derived from the shape memory applications(e.g. aircraft fuel line couplings and actuator springs),superelastic applications have garnered much greatersuccess, especially for medical devices.5,6 Therefore, thismanuscript focuses mostly upon the superelastic ratherthan shape memory phase transformations as theypertain to the fatigue and fracture resistance of Nitinol.
The mechanical properties of Nitinol depend drama-tically on the deformation temperatures. For example,
*Another martensitic phase, known as the R phase, has a rhombohedralcrystal structure and also shows shape memory and superelasticity.1,2
Robertson et al. Mechanical fatigue and fracture of Nitinol
2 International Materials Reviews 2012 VOL 57 NO 1

Fig. 1 shows the idealised relationship between theconstant force strain–temperature curve that illustratesthe shape memory effect and the uniaxial tensile stress–strain curves that result at the three specified deformationtemperatures.7 As shown in Fig. 1a, martensite is formedupon cooling from the austenite phase with a concomi-tant increase in strain. The temperature at which thistransformation begins is referred to as the martensite starttemperature Ms and the temperature at which thetransformation ends is referred to as the martensite finishtemperature Mf. The strain begins to recover uponheating this deformed martensite above the austenitestart temperature As with recovery of the strain and theaustenite phase at the austenite finish temperature Af. Atintermediate temperatures between Ms and Mf or As andAf, there is a two phase mixture of austenite andmartensite. There are a total of 24 variants of martensitethat develop by cooling from austenite.2,4 Figure 1bshows the uniaxial stress–strain curve of the fullymartensite phase (below Mf). Here the initially twinnedmartensite deforms to produce detwinned and deformed
martensite. Note that the 6% strain is not fully recoveredwhen the stress is removed; full recovery is only expectedupon heating above Af. Figure 1c illustrates the phenom-ena of stress induced martensite (superelasticity) expectedat temperatures above Af. The majority of medicaldevices are superelastic at body temperature, so thiscondition is described more fully below.
Superelasticity involves the stress induced transforma-tion, followed by strain recovery (and concomitant phasetransformation back to the parent austenite) uponremoval of the applied stress. First, the initial linear–elastic deformation is characterised by a monotonicincrease in stress over a small strain range up to thecritical transformation stress. Aftery1% strain, the curveflattens to form a plateau with only a small change instress over a much larger strain range during which theaustenite transforms to detwinned (deformed) martensite.The martensite laths nucleate and grow with the preferredmartensite variant according to the relevant Taylor factor(inverse Schmid factor) that relieves the internal stress.2,4
Increasing deformation in this range increases the volumefraction of stress induced martensite, whereby at theend of the stress plateau, the stress induced marten-sitic transformation is (nominally) complete. Recoveryof up to 10% strains is possible, which is a full order ofmagnitude greater than exhibited by, for example,stainless steel, with its elastic strain limit of y0?2%.Upon unloading the applied stress, the martensite be-comes unstable and the reverse transformation occurswith the stress stabilised martensite reverting along theprevious crystallographic path to austenite; there is acorresponding decrease in martensite volume fractionand a return to its original configuration. Although notshown in Fig. 1c, it is important to note that beyond theloading plateau, deformation of the stress inducedmartensite continues whereupon elastic followed byplastic (dislocation) yielding occurs. In contrast todeformation of thermal martensite (Fig. 1b) and super-elastic austenite (Fig. 1c), deformation at temperaturesabove Md is accommodated by traditional plasticity andthere are no martensitic transformations involved. Thecorresponding uniaxial stress–strain curve for theseconditions is shown in Fig. 1d, whereby there is an initiallinear–elastic region followed by traditional plasticallyabove y1% strain. The cyclic deformation of Nitinol isdecidedly more complex than shown for these threemonotonic conditions as will be discussed throughout theremainder of this paper.
Lifetime prediction of components that are subjectedto cyclic mechanical motion is critical for the design andoptimisation of all engineering devices manufacturedfrom Nitinol. Medical devices, many of which arepermanently implanted and experience millions tobillions of in vivo cycles, dominate the current Nitinolmarket. The safety and durability of these devices maybe measured by their fatigue and fracture resistance.Descriptions of mechanical fatigue on a microscopic,and even macroscopic, level for these Nitinol basedmedical devices are complicated and remain incompleteeven today. The source of the complications is due to theuncertain role of the transformation under cyclicallyvarying deformations and the complexity of the variousphases in Nitinol (including austenite, martensite, Rphase, oxide and carbide inclusions, as well as Ni richand Ti rich precipitates).2
1 a schematic displacement–temperature curve under
constant tensile force for Nitinol that indicates the
transformation temperatures as well as the three gen-
eral regions for which fatigue data have been gener-
ated. The monotonic stress–strain curves at test
temperatures: b below Mf (100% martensite), which is
characterised with a low stress plateau and a large
remnant strain after unloading from 6% strain; c above
Af (100% austenite), which is characterised by an
increased upper stress plateau (transformation from
austenite to deformed martensite), an unloading plateau
(transformation from martensite to austenite) and a
return to the original shape; d above Md, the tempera-
ture above which plasticity is the dominant deformation
accommodation mechanism. After Pelton et al.7
Robertson et al. Mechanical fatigue and fracture of Nitinol
International Materials Reviews 2012 VOL 57 NO 1 3

During the past 40 years, there have been manyinvestigations of both the thermal and mechanicalfatigue behaviour of Nitinol. Nevertheless, taken as awhole these studies have failed to provide a compre-hensive description and reliable constitutive relation-ships that may be universally applied for a variety ofapplications. In particular, an accurate description ofthe mechanical properties under multiaxial loadingconditions is still uncertain due to the path depen-dence of the phase transformation. This dearth ofunderstanding, however, is perhaps not unexpectedsince the ability to apply conventional stress analysis,fracture mechanics and fatigue design principles to thecomplex mechanical behaviour of Nitinol is notstraightforward. Furthermore, this situation is com-pounded by the fact that much of the current medicaldevice related fatigue investigations of Nitinol devicesare invariably tied into proprietary, unpublishedsubmissions to the Food and Drug Administrationor other notified bodies. Consequently, a comprehen-sive approach to the fatigue design of Nitinol com-ponents, with appropriate test methods, life predictionstrategies and mechanistic understanding, is simplynot yet available.
Studies on the fatigue properties of Nitinol date backto the 1960s. Such early investigations, however,suffered from several problems. First, Nitinol is difficultto melt and requires tight controls on absolute purityand the reproducibility of melt compositions. Theseearly alloys were often substandard compared withmodern practices; therefore, the results of these earlystudies have to be used with caution if they are includedto provide predictions about device fatigue. Second,many of the early investigations focused on materialsthat were tested in the fully annealed condition or withhigh temperature, long duration thermal treatments,reflecting the state-of-the-art in the 1960s through themid-1980s. Again, the results from these studies maylead to generalisations that may not pertain to moremodern thermomechanically processed materials usedin Nitinol implants. Third, there is the question of howthe fatigue properties were evaluated. There are threebasic (and somewhat complementary) approaches thatare used to evaluate the fatigue behaviour of Nitinol.These methods attempt to predict relationships amongvarious factors (e.g. applied stress, strain, temperatureand environment), or more pragmatically, solve an adhoc problem. The traditional means of assessing fatigueresistance is to monitor the total lifetime of a specimenas a function of the applied stresses; this is referred toas the stress–life or S–N approach and dates back toWohler in the nineteenth century.8 A second common,and perhaps more appropriate, approach for fatigueanalysis of fine featured Nitinol medical devices, is tocontrol the deformation (strain) per cycle; this isreferred to as the total strain or strain–life (e–N)method and was developed by Coffin and Tavernelli,9
Manson10 and subsequently Morrow,11 starting in the1950s. Both the stress–life and strain–life methodolo-gies are based on the assessment of total lifetimes,although in many instances, e.g. in the presence ofdefects, it can be important to distinguish between thenumber of cycles spent in crack initiation versus crackgrowth. To address this issue, a third, quite distinct,approach to fatigue design and assessment has been
used based on fracture mechanics. This ‘damagetolerant’ approach originated with Paris and co-work-ers in the 1960s,12 and assumes a certain distribution ofpreexisting cracks and considers the growth of a singledominant crack as a function of number of cycles andapplied stress. The resulting data are usually presentedas log–log plots of the growth rate per cycle, da/dN, asa function of the stress intensity range DK computedfrom the stress range Ds, crack length a and geometry.However, given the divergence of these various fatiguetesting approaches, it is often difficult to extrapolatefrom one test condition to the next, especially withwidely varying test specimen geometries and processinghistories.
The intent of this paper is to form a more universalunderstanding of the inherent fatigue and fractureresistance of Nitinol particularly for its application tomedical implant devices. We present here a compre-hensive review of the literature on the mechanicalcycling of binary Nitinol based on both total life anddamage tolerant approaches. We further provide anevaluation of the corresponding fracture resistance ascharacterised in terms of their fracture toughnessbehaviour. In our assessment of research on thefatigue and fracture of Nitinol that has been reportedto date, we have noted where we believe that there areobvious discrepancies in the data or other reasons forcaution. In several instances we have computed fatigueand fracture design parameters that were not calcu-lated by the original authors. Moreover, in thetabulation of these data, we have tried to documentdetails on the transformation temperatures, testtemperatures and chemical composition, when avail-able, as these factors are now known to critically affectthe mechanical, and therefore cyclic, behaviour ofNitinol. Finally, we provide a discussion of the use ofthese data, and the specific fatigue analysis strategiesof stress–life, strain–life and damage tolerance, to thefatigue design and life prediction of biomedical Nitinoldevices.
Total life fatigueThis section reviews the existing total life literature andprovides insights into the effects of S–N versus e–Nmethodologies as well as effects of test temperature,transformation temperature and applied mean stress orstrain. Since total life tests are experimentally easy toconduct, the literature is rich with examples, albeit oftenwith different starting materials, different test conditionsand therefore different outcomes. It should be noted thatthe defining experimental study to tie these critical effectstogether has not been yet conducted. Consequently, whenpossible, we will emphasise the known factors from eachstudy as well as speculate on the mechanisms based on themultitude of results.
Stress–life uniaxial fatigueZero mean stress conditions (R521)
Melton and Mercier13,14 (hereafter referred to as MM1and MM2 respectively) were early pioneers in the field ofthe mechanical fatigue of Nitinol; no investigationsbefore or since have attempted to address all threemodes of fatigue behaviour represented by the S–N, e–Nand damage tolerant approaches. As part of theirstudies, MM1 cast binary compositions with Af values
Robertson et al. Mechanical fatigue and fracture of Nitinol
4 International Materials Reviews 2012 VOL 57 NO 1

of z10uC (Ms5230uC) to z110uC (Ms570uC), basedon stress free electrical resistivity measurements{. Allmechanical tests were conducted at room temperature,so that conditions of both austenite and thermalmartensite could be tested within the range of composi-tions. Figure 2 shows the monotonic tensile stress–straincurves for the two extremes of their compositions,specifically (in at-%) Ni49?9Ti50?1 (Af5z10uC) andNi49?7Ti50?3 (Af5110uC) that were respectively super-elastic austenite and thermal martensite when tested atroom temperature. Note that, as expected, the super-elastic composition has a higher stress plateau (corre-sponding to stress induced martensite formation) thanthe thermal martensite structure (corresponding tomartensite detwinning and deformation);2,3 the elasticmodulus of the austenite is also greater than that of themartensite. Tensile strengths for the two conditions werelow (,700 MPa), due to a 1 h anneal at 950uC and thevery low degree of prior deformation (17?5 mm as castdiameter to 8 mm hot forged diameter resulting iny80% total reduction in area). Additionally, the tensilefracture strain (used here as a relative measure since themore accurate reduction in area measurements were notprovided) was extremely low (,20%) for both annealedalloys. In contrast, tensile fracture strains of .50% arecommon for modern annealed Nitinol.15 It is thereforepossible that the MM alloys contained a high impurity(oxygen and/or carbon) content or perhaps otherinhomogeneities in the melts. Furthermore, the extentof prior diametral deformation was insufficient to refinethe as cast microstructure. The importance of processingand alloy impurities on mechanical and fatigue proper-ties will be discussed in the following sections.
MM1 illustrated the change in stress–strain behaviourwith stress controlled low cycle fatigue studies. Figure 3shows examples of cyclic stress–strain curves of thermalmartensite (Af5110uC) composition that were obtainedunder constant stress cycling between a tensile stress of550 MPa and a compressive stress of 2550 MPa (well
beyond the detwinning stress plateau of y2% strain inthe first cycle). The curves illustrate that more strain isobtained on the first tension part of the cycle than in thecorresponding compression part, so that after severalcycles the hysteresis loop at zero stress is offset in thetensile direction, i.e. the specimen elongates with aresultant permanent shape change. Note also that thehysteresis loop after 17 cycles is significantly narrowerthan in the initial cycle. A similar result was obtained forcyclic tests on superelastic austenite with Af 510uC,except that measured strains were lower (Fig. 4). Whencompared with the monotonic tensile stress–strainbehaviour (Fig. 2), a stress amplitude of 550 MPa is stillon the stress induced martensite plateau, where onewould presume that only elastic and stress induced(superelastic) mechanisms are operating. However, theobservation of a dynamic hysteresis curve with increasingfatigue cycles indicates that microstructural changes haveoccurred in both thermal martensite cycling as well assuperelastic austenite cycling.
{ Through the 1980s, it was convention to characterise Nitinol with themartensite rather than austenite transformation temperatures. However, Af
has been universally used since then. Consequently, in the absence of areported value, we approximate Af as Msz40uC. Furthermore, there are avariety of methods used to characterise the transformation temperatures,each of which yields different values. Therefore, we will cite the methodwhen available.
2 Uniaxial tensile stress–strain curves at room temperature
for nominal compositions of Ni49?9Ti50?1 (Af5z10uC)
superelastic austenite and Ni49?7Ti50?2 (Af5110uC) thermal
martensite after full anneal conditions. The 107 cycles
fatigue limits from Fig. 5 are shown with the horizontal
lines on the linear elastic regions on the respective
curves. After MM113
3 Cyclic stress–strain curves for Nitinol obtained at room
temperature under constant stress (¡550 MPa) ten-
sion–compression conditions for annealed thermal mar-
tensite (Af5z110uC) composition. The numbers above
the curves refer to the cycle numbers. Note that both
the hysteresis and strain decrease with increasing
cycles. After MM113
4 Cyclic stress–strain curves obtained at room temperature
under constant stress (¡550 MPa) tension–compression
conditions for superelastic austenite (Af510uC). The num-
bers above the curves refer to the cycle numbers. Note
that both the hysteresis and strain decrease with increas-
ing cycles. After MM113
Robertson et al. Mechanical fatigue and fracture of Nitinol
International Materials Reviews 2012 VOL 57 NO 1 5

Although microstructural characterisation was notpart of the Melton and Mercier investigations, otherstudies provide some insight in the effects of fatiguedamage accumulation. For example, optical metallo-graphic images of Nitinol after progressively increasingnumbers of mechanical cycles showed stress inducedmartensite forming during the loading cycles, withevidence of residual martensite after unloading, after asfew as 10 fatigue cycles.16–18 Localised plastic deforma-tion was observed in the vicinity of the martensitic platesthat form, concomitant with increasing permanentdeformation after each cycle.19 The martensite variantsactivated in each grain were consistent with each cycleand varied only in exact spatial location with subsequentcycles. However, due to the increased localised deforma-tion, additional variants formed at each cycle, which mayexplain the cyclic strain hardening observed macroscopi-cally in the MM studies. It was also demonstrated thatalthough residual martensite plates likely alter the localstress fields that facilitate transformation, the firstmartensitic plates did not appear at the exact locationof the residual martensite.18 The influence of transforma-tion induced plasticity and microstructural rearrange-ments will be discussed in the context of strain controlledtests in the section on ‘Non-zero mean strain conditions’.
S–N curves (Fig. 5) for alloys from Figs. 2–4 understress controlled, fully reversed (R521), tension–com-pression loading clearly indicate that the 107 cyclesfatigue limit is significantly greater in the superelasticaustenite compared with thermal martensite. Fur-thermore, the fatigue limits in both conditions corre-spond to a stress amplitude in the linear elastic range aty80% of the plateau stress (see horizontal dashes on thecurves in Fig. 2). MM1 rationalised this observation of afatigue limit below the stress plateau in terms of cracknucleation behaviour. Specifically, they suggest that theinitial deformation mechanisms in the linear elasticregion for the thermally formed martensite (Af5110uC)
are elastic processes. Cyclic stresses above the plateauinvolve martensite detwinning and martensite deforma-tion as well as plasticity. In contrast, in the superelasticaustenite (Af510uC) stress induced martensitic transfor-mations involve some degree of plasticity upon theformation of the martensite, especially in these fullyannealed conditions. Close inspection of the monotonicstress–strain curves in Fig. 2 clearly illustrates thedifferences in superelastic austenite and thermal mar-tensite material fatigue conditions. For example, a stressamplitude of 400 MPa (the 107 cycles fatigue limit foraustenite) results in strains of y2% in the superelasticaustenite compared with over 9% strain in thermalmartensite. Consequently, it is not surprising that thefatigue lifetime for superelastic Nitinol is significantlygreater than that of thermal martensite. This will bediscussed in greater detail in the section on ‘Non-zeromean strain conditions’ with respect to the effects ofmean strain and strain amplitude.
There exists a narrow temperature range, between Ms
and As, where martensite and austenite coexist (at zeroapplied stress) in the material. When Nitinol is in thatstate, austenite forms stress induced martensite on initialloading which is then stable throughout the remainder ofthe test. These martensite variants will be preferentiallyformed according to the minimum Taylor factor20,21 thatprovides maximum strain accommodation and minimumdefect formation in the direction of the cyclic appliedstress; consequently, for any given stress state, there willbe many fewer martensite variants formed than withthermal martensite. As such, under stress controlledconditions, Nitinol with thermal martensite appears tohave poorer fatigue resistance compared with materialtested between Ms and As. Furthermore, superelasticNitinol would be expected to have the highest fatiguelimit because it requires much higher stresses to inducethe martensite. In addition, the stress induced martensitewill be a preferred variant that can best accommodatecyclic strains while inhibiting crack nucleation.
5 S–N curves for Nitinol showing the stress amplitude as
a function of the number of cycles to failure. Fully
reversed (R521) stress based fatigue curves out to
y107 cycles are shown for nominal compositions of
Ni49?9 Ti50?1 (Af510uC) and Ni49?7Ti50?2 (Af5110uC), i.e.
for superelastic and thermal martensite respectively.
Note that the fatigue limit for the austenite is signifi-
cantly higher than the martensite, commensurate with
the values of their respective plateau stresses (Fig. 2).
Runout conditions are noted with open symbols. After
MM113
6 Diagram of the tension–tension stress based fatigue
curves to y106 cycles for nominal compositions of
Ni50?8 Ti49?2 with an Af of 27uC. The 106 cycles fatigue
limit at 30uC is lower than that obtained at 60 or 160uC.
Runout conditions are noted with open symbols. The
corresponding critical stress levels to induce marten-
site are marked with arrows for data at 30 and 60uC.
For these conditions, the 106 fatigue limit is y67% of
the martensite plateau stress. After Miyazaki et al.22
Robertson et al. Mechanical fatigue and fracture of Nitinol
6 International Materials Reviews 2012 VOL 57 NO 1

Non-zero mean stress conditions (R50)
Miyazaki et al.22 studied stress controlled tension–tension fatigue of dogbone shaped specimens machinedfrom Ni50?8Ti49?2 sheet that was cold rolled and aged at400uC for 1 h to give an Af of 27uC. Figure 6 shows theirstress controlled fatigue data as a function of testtemperature where the cycling conditions were from zeroto maximum stress; i.e. the mean stress equals the stressamplitude. Testing at 30 and 60uC produced superelasticconditions whereas tests at 160uC were close to the Md
temperature7 so that material in this condition wasstable (non-transforming) austenite. For this latter case,plasticity is the primary accommodation mechanism atthe higher stress amplitudes, as discussed with respect toFig. 1d. Although there are only limited data in thisstudy, it is apparent that the 106 cycles fatigue limitincreased with increasing test temperature. Miyazakiet al. suggested that this was due to the correspondenceof the fatigue limit with the critical stress to form stressinduced martensite, following the well known Clausius–Clapeyron relationship{.3,24 It is also well known thatthe effective modulus increases with increasing testtemperature for a given Af temperature,24 which alsoinversely affects the strain accumulation during stresscontrolled fatigue. For the fatigue tests in Fig. 6, the106 cycles fatigue limit was y67% of the critical stressfor stress induced martensite.22 These non-zero meanstress–life fatigue results thus follow similar trends tothose shown by MM1 and MM2 for fully reversed(R521) testing.
Strain–life fatigueThe majority of Nitinol fatigue investigations in theliterature have been conducted under constant deforma-tion (strain) conditions. The preference of strain basedrather than stress based total life tests for Nitinol isobvious with a simple inspection of the monotonicstress–strain curve for fully martensitic or superelasticcompositions (see Fig. 1b and c). These curves indicatethat stress is linearly proportional to strain only in the(nominally) linear–elastic region. Consequently, theglobal strain is continuous whereas stress tends to
‘plateau’ due to the detwinning mechanism in martensiteor due to stress induced martensitic transformation insuperelastic material. Therefore, in theory, the stress isconstant over a wide range of (global) strains. Thismakes stress based test conditions less certain thanstrain based. Furthermore, from the perspective ofexperimental set-up, deformation based testing requiresless sophisticated equipment. For example, rotarybending fatigue data may be obtained by rotating bars,wires or tubes around a constant radius of curvature.These strain based tests are divided into two categories:zero mean strain (where intrinsic mechanical propertyasymmetries play a role), and non-zero mean strainconditions (where microstructural and phase effects aremore easily isolated).
Zero mean strain conditions – uniaxial fatigue
Melton and Mercier13,14,25 presented some of the earlieststrain based low cycle fatigue data using uniaxialtension–compression specimens similar to those usedfor their stress controlled fatigue tests described above.Cyclic stress–strain loops are shown in Fig. 7 for theannealed Af y70uC thermal martensite that was cycledbetween strain limits of ¡2?5% at room temperature.The material cyclically hardened, whereby the peakstress at maximum strain increased with increasingnumber of cycles. MM1 showed that cyclic hardeningin these specimens increased rapidly over the firsty10 cycles; thereafter, the stress increased less rapidly,leading to cyclic stabilisation. Moreover, the curvesdisplayed a definite anisotropy in tension versuscompression properties; i.e. the absolute value of thestress at the first cycle of z2?5% strain was clearly lowerthan that at 22?5% strain. Differences in tension–compression mechanical behaviour in engineering mate-rials are attributed to the anisotropy of the elasticconstants.26 More specifically for Nitinol, the phenom-enological theory of martensitic transformations hasbeen used effectively to model tension–compressionasymmetry and the orientation dependence of thedeformation behaviour.27–30 These analyses show thatthe martensite variants created in tension are differentfrom those created in compression, which give rise todifferences in plateau stresses, shape memory recoverystrains and critical resolved shear stresses. Furthermore,recent detailed synchrotron X-ray diffraction analysisshows a dramatic crystallographic path difference forstress induced martensite transformations in superelasticaustenite.31 Additional cycles at these strain limits alsotended to decrease the hysteresis loop; for example,compare the 1017 cycles loop to the original loop inFig. 7. Similar observations were made for cycling at¡4?5% strain. MM1 proposed that the cyclic hardeningand narrowing of the hysteresis loop was likely dueto the accumulation of dislocations, similar to theirexplanation for stress controlled fatigue conditions,discussed previously. Additional discussions of micro-structural effects will be presented in the section on‘Non-zero mean strain conditions’.
The plastic strain amplitude per cycle from the abovestrain controlled tests is plotted in Fig. 8 as a function ofthe number of cycles to failure in the low cycle regime. Allgraphs show a linear relation for Af values of 280uC(stable austenite), z10uC (superelastic austenite), z48uC(coexisting austenite and thermal martensite) and z70uC(thermal martensite). MM1 defined the ‘plastic’ strain per
{ As such, the stress controlled fatigue limit may also follow a constitutiveequation related to the Clausius–Clapeyron relationship between Ds andDT, where DT5(Af–T) is defined as the difference between Af and the testtemperature T.23
7 Cyclic stress–strain curves obtained at room tempera-
ture under constant strain (¡2?5%) tension–compres-
sion conditions for Nitinol with Af of about z70uC, i.e.
in the martensitic condition. The numbers above the
curves refer to the cycle numbers. After MM113
Robertson et al. Mechanical fatigue and fracture of Nitinol
International Materials Reviews 2012 VOL 57 NO 1 7
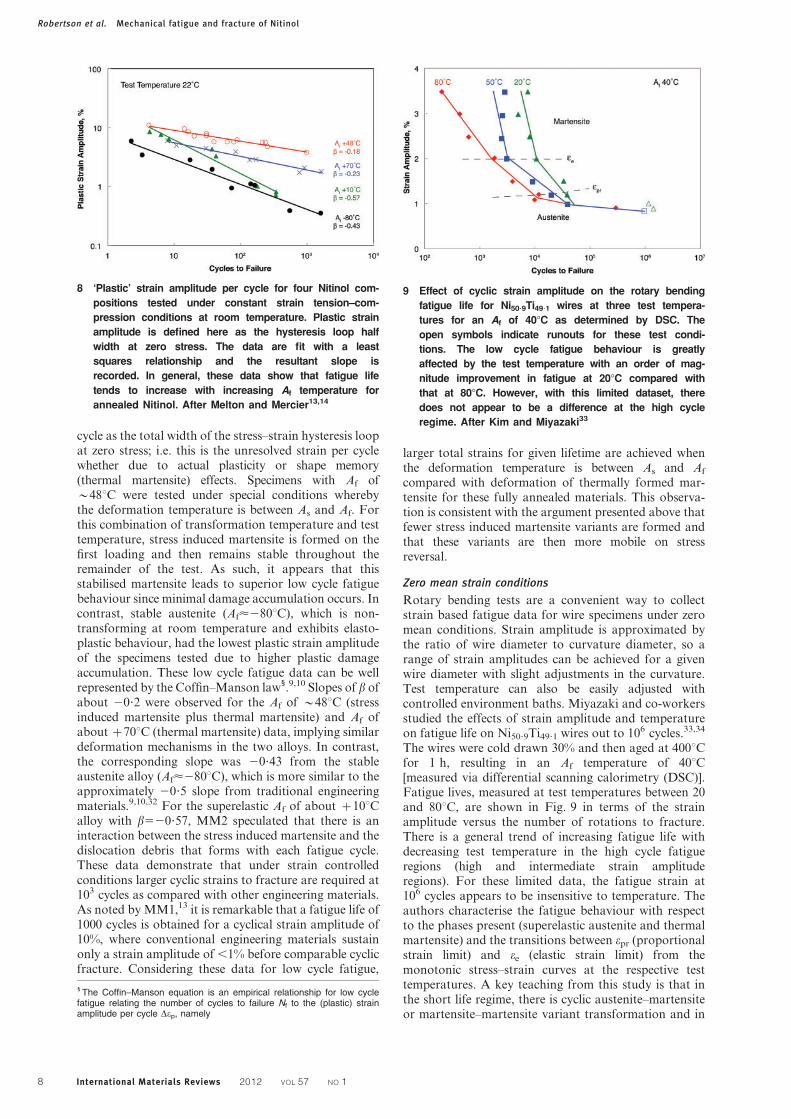
cycle as the total width of the stress–strain hysteresis loopat zero stress; i.e. this is the unresolved strain per cyclewhether due to actual plasticity or shape memory(thermal martensite) effects. Specimens with Af ofy48uC were tested under special conditions wherebythe deformation temperature is between As and Af. Forthis combination of transformation temperature and testtemperature, stress induced martensite is formed on thefirst loading and then remains stable throughout theremainder of the test. As such, it appears that thisstabilised martensite leads to superior low cycle fatiguebehaviour since minimal damage accumulation occurs. Incontrast, stable austenite (Af<280uC), which is non-transforming at room temperature and exhibits elasto-plastic behaviour, had the lowest plastic strain amplitudeof the specimens tested due to higher plastic damageaccumulation. These low cycle fatigue data can be wellrepresented by the Coffin–Manson law1.9,10 Slopes of b ofabout 20?2 were observed for the Af of y48uC (stressinduced martensite plus thermal martensite) and Af ofabout z70uC (thermal martensite) data, implying similardeformation mechanisms in the two alloys. In contrast,the corresponding slope was 20?43 from the stableaustenite alloy (Af<280uC), which is more similar to theapproximately 20?5 slope from traditional engineeringmaterials.9,10,32 For the superelastic Af of about z10uCalloy with b520?57, MM2 speculated that there is aninteraction between the stress induced martensite and thedislocation debris that forms with each fatigue cycle.These data demonstrate that under strain controlledconditions larger cyclic strains to fracture are required at103 cycles as compared with other engineering materials.As noted by MM1,13 it is remarkable that a fatigue life of1000 cycles is obtained for a cyclical strain amplitude of10%, where conventional engineering materials sustainonly a strain amplitude of ,1% before comparable cyclicfracture. Considering these data for low cycle fatigue,
larger total strains for given lifetime are achieved whenthe deformation temperature is between As and Af
compared with deformation of thermally formed mar-tensite for these fully annealed materials. This observa-tion is consistent with the argument presented above thatfewer stress induced martensite variants are formed andthat these variants are then more mobile on stressreversal.
Zero mean strain conditions
Rotary bending tests are a convenient way to collectstrain based fatigue data for wire specimens under zeromean conditions. Strain amplitude is approximated bythe ratio of wire diameter to curvature diameter, so arange of strain amplitudes can be achieved for a givenwire diameter with slight adjustments in the curvature.Test temperature can also be easily adjusted withcontrolled environment baths. Miyazaki and co-workersstudied the effects of strain amplitude and temperatureon fatigue life on Ni50?9Ti49?1 wires out to 106 cycles.33,34
The wires were cold drawn 30% and then aged at 400uCfor 1 h, resulting in an Af temperature of 40uC[measured via differential scanning calorimetry (DSC)].Fatigue lives, measured at test temperatures between 20and 80uC, are shown in Fig. 9 in terms of the strainamplitude versus the number of rotations to fracture.There is a general trend of increasing fatigue life withdecreasing test temperature in the high cycle fatigueregions (high and intermediate strain amplituderegions). For these limited data, the fatigue strain at106 cycles appears to be insensitive to temperature. Theauthors characterise the fatigue behaviour with respectto the phases present (superelastic austenite and thermalmartensite) and the transitions between epr (proportionalstrain limit) and ee (elastic strain limit) from themonotonic stress–strain curves at the respective testtemperatures. A key teaching from this study is that inthe short life regime, there is cyclic austenite–martensiteor martensite–martensite variant transformation and in
1 The Coffin–Manson equation is an empirical relationship for low cyclefatigue relating the number of cycles to failure Nf to the (plastic) strainamplitude per cycle Dep, namely
9 Effect of cyclic strain amplitude on the rotary bending
fatigue life for Ni50?9Ti49?1 wires at three test tempera-
tures for an Af of 40uC as determined by DSC. The
open symbols indicate runouts for these test condi-
tions. The low cycle fatigue behaviour is greatly
affected by the test temperature with an order of mag-
nitude improvement in fatigue at 20uC compared with
that at 80uC. However, with this limited dataset, there
does not appear to be a difference at the high cycle
regime. After Kim and Miyazaki33
8 ‘Plastic’ strain amplitude per cycle for four Nitinol com-
positions tested under constant strain tension–com-
pression conditions at room temperature. Plastic strain
amplitude is defined here as the hysteresis loop half
width at zero stress. The data are fit with a least
squares relationship and the resultant slope is
recorded. In general, these data show that fatigue life
tends to increase with increasing Af temperature for
annealed Nitinol. After Melton and Mercier13,14
Robertson et al. Mechanical fatigue and fracture of Nitinol
8 International Materials Reviews 2012 VOL 57 NO 1

the long life regime, there is a constant phase fractionwith only elastic deformations.
A comparison of rotary bending data from continu-ously thermomechanically processed wires (per modernpractice) is shown in Fig. 10 for superelastic and thermalmartensite conditions out to 107 cycles tested at roomtemperature.35–38 The four sets of superelastic data areconsistent and have shorter lives at equivalent strainamplitudes compared with the thermal martensite dataup to 4?3% strain amplitude. These observations can beexplained by examining the corresponding fully reversedstress–strain curves (see e.g. Fig. 11). For a given strainamplitude, the stress required to deform thermalmartensite is lower than those required to stress inducemartensite under superelastic conditions. Furthermore,it has been shown that the crack growth rates formartensite and superelastic materials are virtuallyidentical (see damage tolerant fatigue section); therefore,under strain controlled conditions, it appears that thecrack initiation rates are faster in the superelasticcondition than in thermal martensite.
Close inspection of Fig. 10 suggests that the super-elastic data can be divided into three distinct regions:
(i) low cycle fatigue between tension and compres-sion of stress induced martensite with a constanty1800 cycles to failure. This strain amplituderange represents cycling on the stress plateau;see, for example, Fig. 11 for an idealised uniaxialtension–compression curve for superelasticNitinol. Consequently, the cyclic deformationmechanism of superelastic Nitinol versus thermalmartensite is similar in this strain range. Note
that the thermal martensite data do not show thisconstant fatigue life in this strain range sincethere is no stress induced phase transformation
(ii) intermediate cycle fatigue between y103 and104 cycles with an increasing life with decreasingstrain amplitude. This region corresponds to thetransition between linear–elastic and superelasticbehaviour; from Fig. 11, the stress hysteresis inthis cyclic range is significantly lower than thatfor the ¡4% cyclic behaviour. This rangecorresponds to the Coffin–Manson region forfatigue behaviour of engineering materials, asdiscussed above. However, the empirical Coffin–Manson analysis9,10 is explicitly ascribed tocyclic plastic strain. As such, it is not appropriateto make direct comparisons with cyclic super-elastic data since a reverse phase transformationis part of the deformation accommodation.Nevertheless, without implying similar mechan-isms, it is interesting to characterise the slope ofthe log–log best fit curve of 20?41 for the Sheriffet al.36 data and 20?34 for the Reinoehl et al.35
data. The difference between the two datasetsmay be due to the slight difference in theexperimental set-up, where Sheriff used afixed diameter mandrel to hold the strainconstant. On the other hand, the Reinoehl wirespecimens were set to the initial curvature andthen allowed to adopt slightly different curva-tures throughout the test". In comparison, thethermal martensite data had a slope of 20?44.For this range of strain amplitudes, the defor-mation mechanism for the superelastic wiresinvolves a combination of linear–elastic andreversible stress induced martensite phase trans-formation. For the thermal martensite, themechanism involves linear elasticity and defor-mation of twinned martensite. Although thesemechanisms are different, both sets of materialswere processed with y40% cold work and
10 Comparison of rotary bending fatigue data at room
temperature from Ni50?8 Ti49?2 (superelastic with
Af<10uC)35,36,38 and Ni49?5 Ti50?5 (thermal martensite
with Af570uC)37 thermomechanically treated wires.
The thermal martensite data have greater low cycle
and high cycle lives compared with the three sets of
data for superelastic conditions. Note the three dis-
tinct regions for the superelastic data, whereby strain
amplitudes greater than 2?5% have a constant live of
y1800 cycles, corresponding to cycling on the stress
plateau. The four sets of superelastic data compare melt-
ing practice [vacuum arc remelt (VAR), extra low impur-
ity and vacuum induction melting (VIM)]35,38 as well as
surface finish (black oxide35 and electropolished36,38).
See text for additional discussion. Specimens that
reached >107 were considered as runouts, as illustrated
by the arrows
11 Schematic of fully reversed stress–strain data for
superelastic Nitinol under bending conditions illustrat-
ing the stress hysteresis within the linear–elastic
range, in the combination of linear and stress induced
martensite, and cycling on the stress plateau
" Berg39 and Wick et al.40 showed that superelastic Nitinol does not createa smooth curvature under a constant moment bend. This is due to the nonuniformity of stress induced martensite formed.
Robertson et al. Mechanical fatigue and fracture of Nitinol
International Materials Reviews 2012 VOL 57 NO 1 9

then stress relieved continuously at y500uC.7
Consequently, the starting microstructures forthe superelastic and thermal martensite contain alarge density of dislocations, fine grain size((1 mm) that help to stabilise the fatigueresistance
(iii) high cycle fatigue represents linear–elastic beha-viour, where it is assumed that fatigue mechan-ism occurs due to typical damage accumulationin this (nominally) linear–elastic region, consis-tent with Figs. 5, 6 and 9.41
The data in Fig. 10 can also be inspected to determine theeffects of melting practice and surface finish. The two setsof Reinoehl data compare the fatigue behaviour of0?267 mm diameter superelastic wires produced fromVAR versus VIM ingots.35 The VIM ingots are melted ina graphite crucible that typically adds up to y500 wppmcarbon to the composition; these materials tend tocontain both oxide inclusions (Ti4Ni2Ox) as well as TiCprecipitates. The VAR produced material generally haslower overall interstitial content (,50 wppm C), with noTiC, but may contain slightly larger oxide inclusions;both materials are consistent with composition andmicrostructure per ASTM F2063-05.42 Reinoehl et al.found that both VIM and VAR Nitinol wires hadequivalent fatigue behaviour within the strain amplitudeand range of cycles, regardless of the differences in carboncontent and inclusion size. As an additional comparison,the data from Morgan et al.38 from VARzextra lowimpurity had an oxygen content of 90 wppm, ascompared with y300 wppm for VAR and VIMzVARcompositions. Note that even with a lower oxygencontent that led to a substantially lower inclusion volumefraction, the rotary bending fatigue data are indistin-guishable from the more standard melt practices. Thissuggests that within the limits of composition of theASTM standard and for up to 107 fatigue cycles, the sizeof these inclusions is below the critical crack size forfailure (about 15–50 mm),43 thereby producing the sametotal fatigue life under these test conditions.
The effects of surface finish on the fatigue of Nitinolcan be evaluated by comparing the results of Reinoehlet al.35 for black oxide wires with those of Sheriff et al.36
for electropolished samples with similar processing condi-tions and resultant Af temperatures. Electropolishing is anelectrochemical process that removes surface oxides (andother surface contaminants, such as lubrication) andcreates a smooth and bright surface. In the low cyclefatigue regime (,105 cycles), electropolishing resulted in aslight, but statistically significant, increase in fatigue life;however, there is no statistically significant difference inthe high cycle fatigue regime.37
Non-zero mean strain conditions
Much of the early work on Nitinol fatigue was conductedat fully reversed stresses or strains, i.e. R521. However,many modern applications of Nitinol based devicespresent an entirely different deformation profile andrequire a different method to characterise the fatigueconditions. For example, in medical devices such asendovascular self-expanding stents, the Nitinol devicemay undergo a large single strain excursion (up to 10%)during constraint into a delivery system and then theopposite strain excursion during deployment into theanatomical location.44–46 Upon implantation, the Nitinoldevices are slightly oversized with respect to the
anatomical locations. This ‘interference fit’ with theanatomy produces conditions of a constant mean strainon the Nitinol device with lower strain amplitudes; thiscondition is schematically shown in Fig. 12a. Thephysiological movements from the cardiac systolic–diastolic cycle and musculoskeletal motion provide theimposed strain amplitude, as illustrated in the pulsatilefatigue cycle in Fig. 12a. Figure 12b and c shows a Cordis
12 a stress–strain data for superelastic Nitinol schemati-
cally illustrating the initial crimp stress, deployment
and subsequent in vivo cycles. b Cordis Nitinol
SMART stent being deployed from a delivery catheter;
the strain on the stent inside the catheter can be
y10%. c illustration of a 9 mm diameter Cordis Nitinol
SMART stent in a 6 mm diameter mock vessel, which
simulates a constant in vivo mean strain. Reprinted
from Pelton et al.46 with permission from Elsevier
Robertson et al. Mechanical fatigue and fracture of Nitinol
10 International Materials Reviews 2012 VOL 57 NO 1

Nitinol SMART stent with partial deployment from adelivery system and as deployed in a mock arterial vesselrespectively.46 Owing to this complex application ofstrains, biomedical applications of Nitinol are often quitecomplicated with respect to expectations of fatiguedurability; the full range of ‘duty cycles’ must thereforebe addressed in a testing and analysis programme in orderto illuminate fatigue safety. The key to understandingNitinol based medical device fatigue and durability is toestablish the Nitinol fatigue properties that are mainlymaterial and surface condition dependent and the de-vice durability properties that are design and materialdependent.
As discussed above, many of the early fatigue studieson Nitinol were conducted on fully annealed materialwith grain sizes of y100 mm and with low defect density.These studies, including the suite of seminal Melton andMercier papers, provide insight into many of thefundamental mechanisms. However, they are incompletewith respect to providing a definitive microstructuremechanics explanation that could be used to predictfatigue behaviour of modern medical devices thatexclusively use thermomechanically processed Nitinolmaterial. In an effort to understand the effects ofprocessing, mean strain and strain amplitude, andelucidate a concomitant microstructural understanding,Pelton conducted a transmission electron microscopy(TEM) investigation on fatigued superelastic Ni50?8Ti49?2
specimens.47 Tensile specimens were machined fromsuperelastic wire with a 3 mm diameter gauge. Thespecimens were either annealed at 900uC for 30 min(Af5215uC) or stress relieved at 500uC for 10 min(Af520uC). Figure 13 shows the strain controlled fatiguecurves for the annealed specimen at 1?5% mean strain and0?25% strain amplitude for 1, 10 and 100 cycles tested atroom temperature. With increasing cycles, the hysteresiswidth decreased, the modulus increased to a valuecomparable with the initial austenite modulus, with aconcomitant increase in stress range; these changes arecomparable with those discussed by MM1 for R521 testconditions. The original annealed microstructure con-sisted of equiaxed grains of approximately 50–100 mm
with low dislocation density (y108 m22); these disloca-tions are generally in proximity to grain boundaries orTi4Ni2Ox particles. In stark contrast, the TEM micro-structure after only 10 fatigue cycles consists of bandedaustenite with a high density (y1014 m22) of dislocationswith an100m/{011} slip systems interspersed with retaineddeformed martensite (Fig. 14). An increase in dislocationcontent with increasing cycles was also observed forthermally cycled annealed Nitinol.47 The observations ofdislocation bands suggest that the moving martensiteinterfaces act as crystallographic ‘snowplows’ that forcethe new and existing n100m{011} shear loops to slip (andcross-slip) and then become locked in the sessile bands at theinterface plane.47 Although no TEM investigations wereconducted during the MM studies discussed above, it islikely that similar microstructural effects were responsiblefor the observed changes in hysteresis width and peak stressafter even more severe R521 cyclic testing.
Fatigue curves that correspond to the stress relievedsuperelastic condition are shown in Fig. 15.47 Note thatthis optimised processing (typical of Nitinol medicaldevice manufacturing) results in a more stabilisedfatigue behaviour with minimal softening and a rela-tively stable cyclic modulus that is comparable with the
13 Stress–strain fatigue curves from annealed Ni50?8Ti49?2
bar under conditions of 1?5% mean strain and strain
amplitude of 0?25%. Cycles 1, 10 and 100 are shown
whereby the hysteresis width decreases, the modulus
increases, with an effective increase in the stress
range with increasing cycles. Reprinted from Pelton47
with permission from Springer
14 Transmission electron microscopy microstructure in
annealed Nitinol after 10 cycles consists of banded
austenite with a high density of dislocations
(y1014 m22) with an100m/{011} slip systems inter-
spersed with retained deformed martensite. Reprinted
from Pelton47 with permission from Springer
15 Stress–strain fatigue curves from stress relieved
superelastic Ni50?8Ti49?2 under conditions of 1?5%
mean strain and strain amplitude of 0?25%. Note that
the cyclic curves follow the R phase slope and are
more stable than those shown in Fig. 13. Reprinted
from Pelton47 with permission from Springer
Robertson et al. Mechanical fatigue and fracture of Nitinol
International Materials Reviews 2012 VOL 57 NO 1 11

initial stress induced R phase modulus. In contrast tothe annealed microstructures, the stress relieved and10 cycles fatigued microstructure has an equiaxed grainsize of y75 nm with a {111}A texture (see inset dif-fraction pattern) as shown in Fig. 16. These austeniticgrains contain dislocations and subgrains (i.e. grainswith low angle grain boundary separation) with noapparent retained martensite, similar to the non-fatiguedmicrostructures.
Based on the TEM results discussed above,47 it is clearthat processing plays a key role in the fatigue behaviourof Nitinol. Several authors emphasised the importance ofcombining cold work and aging treatments to optimisethe microstructure of Nitinol for cyclic stability.3,16,17,48
The amount of unresolved strain as a result of cycling is aquantitative measure related to shape retention; itpertains to the cyclic damage accumulation. In general,a cold work plus age treatment produces a more stabilisedmicrostructure to minimise unresolved strain than theanneal plus age treatment for cyclic applications, asdemonstrated in Figs. 13–16.
Since these treatment parameters vary from product toproduct, testing under simulated in vivo conditions usingprocess optimised Nitinol is then required to gain insightinto the device specific fatigue behaviour. Several studieshave emerged recently to address the fatigue behaviour ofthermomechanically processed Nitinol under conditionsof a constant mean strain and strain amplitude.46,49–53
The results of these investigations truly demonstrate theunique fatigue properties of Nitinol, as compared withtraditional engineering materials.
Tabanli et al.49,50 were the first to observe non-traditional constant life fatigue behaviour on super-elastic Nitinol microtubing with an Af of about 25uC.Their room temperature experiments were performed ata frequency of 20 Hz and involved cycling to failure at astrain amplitude of 0?22% with tensile mean strains from0?25 to 9?31%. Five conditions of mean strain andstrain amplitude were chosen to span the monotonicstress–strain space to include deformation of linear–elastic austenite, mixed phases of austenite and marten-site (i.e. superelastic) and linear–elastic martensite (i.e.beyond the upper plateau stress but below plasticdeformation strains), as summarised in Table 1. Withonly five test specimens, the data are not statisticallysignificant; nevertheless, these results are quite revealing.The longest lives were obtained under conditions ofcyclic deformation in linear–elastic austenite (meanstrain50?25 and 0?36%) and superelastic material thathad been loaded high enough to stabilise the stressinduced martensite (mean strain59?3%). Mixed phasecycling in the superelastic range (i.e. on the upperplateau) produced shorter lives in these specimens;again, this is consistent with the conclusions drawn byMiyazaki and Wick, discussed above. Tabanli et al.49,50
concluded that the typical Goodman and Soderbergconstructions41,54 for a constant life diagram are notvalid for Nitinol since there was no decrease in fatiguelife with increasing mean strain. Specifically, theyhypothesised that a long fatigue life requires no cyclicphase transformations and provided a mean alternatingstrain fatigue life diagram based on that assumption. Itis also interesting that the fatigue lives for these speci-mens were all well less than 106 cycles. There are twopossible explanations when comparing these results withother non-zero mean strain fatigue investigations.46,51–53
First, the test temperature for the Tabanli experimentswas y30uC greater than the Af (DT of y30uC). Asdiscussed previously for zero mean strain conditions, thefatigue life in Nitinol tends to increase as the differencebetween the test temperature and Af decreases (i.e. witha smaller DT). Second, Macherauch55 summarised thegeneral effects of deformation mode on fatigue life ofengineering materials and showed that tension–tensionconditions lead to the shortest lives compared withbending fatigue or rotary beam fatigue test conditions.The Nitinol tubes in the Tabanli investigation weretested under uniaxial fatigue conditions, whereby theentire cross-section of the tubing was exposed to thecyclic strains. Conversely, in rotary beam fatigue, eachsection of the test specimen is alternately in tension andcompression with a strain gradient across the sectiondiameter. Therefore, the differences in the data can beascribed to the test technique chosen, whereby the active
16 Transmission electron microscopy microstructure in
stress relieved Nitinol after 10 cycles consists of
equiaxed 75 nm austenite grains with a n111m orienta-
tion, which produces more stable fatigue conditions,
as shown in Fig. 15. Compare with the banded and
dislocated microstructure after cycling the annealed
structure (Fig. 14). Reprinted from Pelton47 with per-
mission from Springer
Table 1 Mean strain effects on fatigue life in Nitinol; after Tabanli et al.49
Mean strain/% Strain amplitude/% Cycles to fracture Condition
0.25 0.21 185 000 Linear–elastic austenite0.36 0.20 97 000 Linear–elastic austenite2.12 0.24 10 900 Superelastic (loading plateau)2.0* 0.22 24 340 Superelastic (unloading plateau)9.3 0.22 82 650 Deformed martensite
*Specimen was prestrained to 9?5% strain and then unloaded to 2?0% before cycling to simulate conditions involving the implantationof a Nitinol medical device.
Robertson et al. Mechanical fatigue and fracture of Nitinol
12 International Materials Reviews 2012 VOL 57 NO 1

volume and/or surface subjected to maximum principalstrains was effectively higher in the uniaxial tensilespecimens.
Tolomeo et al.51 investigated the fatigue behaviour offully processed Nitinol endovascular stent components(including laser machining, expansion and processing)under several conditions of mean strain and strainamplitude. For these experiments, subcomponents wereextracted from the stents that were cycled about meanand amplitude displacements. An image of the stentsubcomponent is inset in the graph in Fig. 17. Non-linearfinite element analysis (FEA) was used to convert theglobal displacements of the stent to local strains (see, e.g.Rebelo et al.).56,57 From a medical device perspective, theadvantage of this type of fatigue specimen is that thesubcomponents are processed exactly as the medicaldevice, unlike conventional ‘dogbone’, tube or wirespecimens that are obtained from raw materials.Consequently, these specimens reflect the actual materialconditions of the device, e.g. they contain typicallypreexisting surface defects so that both crack initiationand propagation are evaluated during the test. To avoidpossible testing artefacts (such as out of plane buckling),from physiologically relevant compression (i.e. ‘push’conditions), testing for these specimens was conductedunder tension–tension (‘pull’) conditions. As such, themaximum alternating strains were on the inside of thestent strut rather than the outside as experienced by stentssubjected to in vivo biomechanical deformations due toradial pulsatile motion. Figure 17 shows the ea–Ndiagram for the Tolomeo tests for specimens that wereinitially strained to 6% (prestrain) and then unloaded tomean strains ranging between 0?5 and 6% before beingcycled with strain amplitudes between 0?05 and 0?6%; i.e.testing was conducted with mean strain on the unloadingplateau. Note that for a given strain amplitude, thosespecimens that were subjected to 3% mean strain resultedin the longest lives in both the low cycle and high cycleregions. In contrast, application of 1 and 6% mean strainsresulted in the shortest lives for a given strain amplitude.
The mean and strain amplitudes to give a constant106 cycles life for each condition were determined fromthese runout data and are plotted on a constant lifediagram as shown in Fig. 18. The zero mean conditionwas obtained from rotary bending fatigue data fromKim and Miyazaki;33 the validity of this selection of zeromean data is questionable due to the arguments abovewith respect to deformation mode. Nevertheless, thedata in Fig. 18 clearly show that for a constant106 cycles life, the strain amplitude is y0?1% at meanstrains of 1 and 6% compared with 0?3% strainamplitude at 3% mean strain. Morgan et al.52 alsoobserved that the fatigue life of Nitinol wire (Af512uC)increased with increasing mean strain from 2 to 6% forstrain amplitudes that ranged from 0?5 to 3?0% in 38uCRinger’s solution (simulated physiological solution).Their specimens were strained to the mean strain andcycled with no initial prestrain (cycling from the upperplateau). They postulated that the advancing fatigue
17 Effects of mean strain and strain amplitude on the cycles to fracture for Nitinol stent subcomponents. The test speci-
men and affixed grip fixture are shown in the inset along with arrows to illustrate the direction of cyclic deformation.
Testing was conducted at 37uC at 25 Hz, whereby specimens were first loaded to 6% prestrain and then unloaded to
the mean strain and cycled on the unloading plateau. Regression analyses were used to determine the best fit for
the low cycle and high cycle regions. After Tolomeo et al.51
18 Effects of mean strain and strain amplitude on the
cycles to fracture for Nitinol stent subcomponents to
106 cycles. The zero mean datum is after Kim and
Miyazaki33 rotary bending of Nitinol wire at 106 cycles.
After Tolomeo et al.51
Robertson et al. Mechanical fatigue and fracture of Nitinol
International Materials Reviews 2012 VOL 57 NO 1 13
crack tip increases the stress intensity to a level wheremartensite is induced ahead of the crack tip andstabilised by residual stresses and plastic deformation.The results confirm both the importance of transforma-tion strain and phase state within the material duringfatigue loading. These investigations also substantiatethe primary conclusion from Tabanli et al.49,50 that thetypical stress based Soderberg or Goodman typeanalyses are not appropriate for fatigue of superelasticNitinol because of the stress independence from strainalong the loading and unloading plateaus.
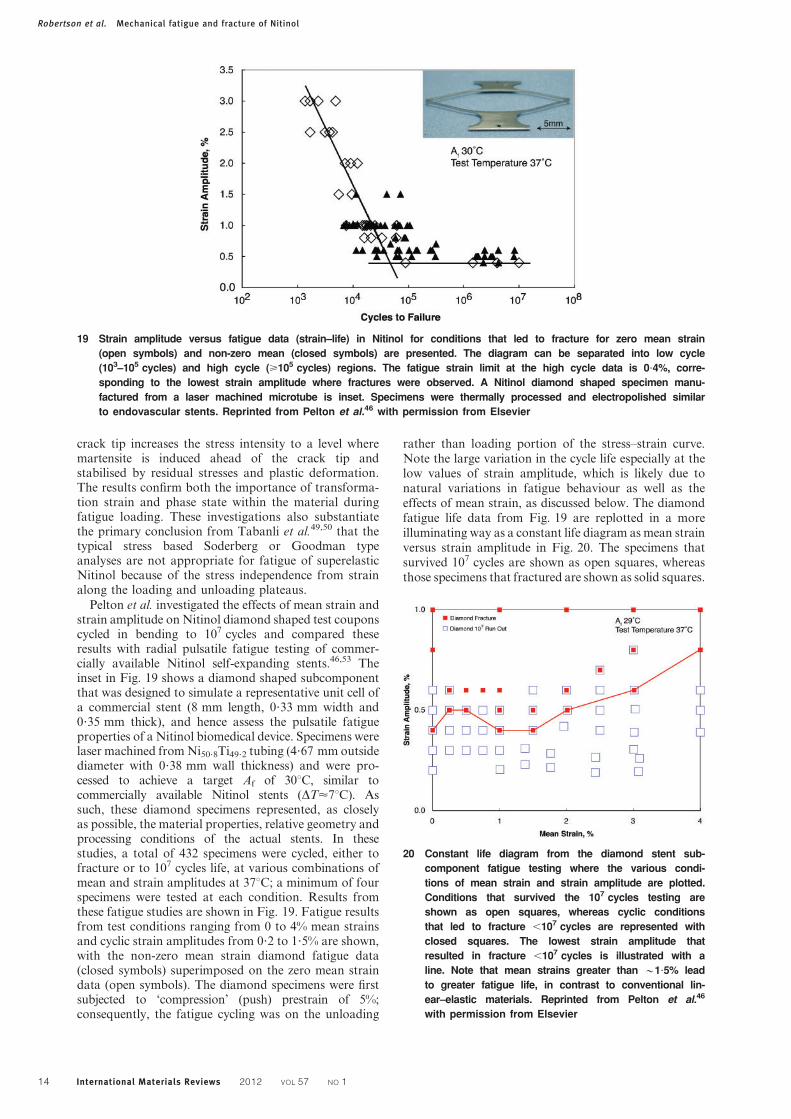
Pelton et al. investigated the effects of mean strain andstrain amplitude on Nitinol diamond shaped test couponscycled in bending to 107 cycles and compared theseresults with radial pulsatile fatigue testing of commer-cially available Nitinol self-expanding stents.46,53 Theinset in Fig. 19 shows a diamond shaped subcomponentthat was designed to simulate a representative unit cell ofa commercial stent (8 mm length, 0?33 mm width and0?35 mm thick), and hence assess the pulsatile fatigueproperties of a Nitinol biomedical device. Specimens werelaser machined from Ni50?8Ti49?2 tubing (4?67 mm outsidediameter with 0?38 mm wall thickness) and were pro-cessed to achieve a target Af of 30uC, similar tocommercially available Nitinol stents (DT<7uC). Assuch, these diamond specimens represented, as closelyas possible, the material properties, relative geometry andprocessing conditions of the actual stents. In thesestudies, a total of 432 specimens were cycled, either tofracture or to 107 cycles life, at various combinations ofmean and strain amplitudes at 37uC; a minimum of fourspecimens were tested at each condition. Results fromthese fatigue studies are shown in Fig. 19. Fatigue resultsfrom test conditions ranging from 0 to 4% mean strainsand cyclic strain amplitudes from 0?2 to 1?5% are shown,with the non-zero mean strain diamond fatigue data(closed symbols) superimposed on the zero mean straindata (open symbols). The diamond specimens were firstsubjected to ‘compression’ (push) prestrain of 5%;consequently, the fatigue cycling was on the unloading
rather than loading portion of the stress–strain curve.Note the large variation in the cycle life especially at thelow values of strain amplitude, which is likely due tonatural variations in fatigue behaviour as well as theeffects of mean strain, as discussed below. The diamondfatigue life data from Fig. 19 are replotted in a moreilluminating way as a constant life diagram as mean strainversus strain amplitude in Fig. 20. The specimens thatsurvived 107 cycles are shown as open squares, whereasthose specimens that fractured are shown as solid squares.
19 Strain amplitude versus fatigue data (strain–life) in Nitinol for conditions that led to fracture for zero mean strain
(open symbols) and non-zero mean (closed symbols) are presented. The diagram can be separated into low cycle
(103–105 cycles) and high cycle (>105 cycles) regions. The fatigue strain limit at the high cycle data is 0?4%, corre-
sponding to the lowest strain amplitude where fractures were observed. A Nitinol diamond shaped specimen manu-
factured from a laser machined microtube is inset. Specimens were thermally processed and electropolished similar
to endovascular stents. Reprinted from Pelton et al.46 with permission from Elsevier
20 Constant life diagram from the diamond stent sub-
component fatigue testing where the various condi-
tions of mean strain and strain amplitude are plotted.
Conditions that survived the 107 cycles testing are
shown as open squares, whereas cyclic conditions
that led to fracture ,107 cycles are represented with
closed squares. The lowest strain amplitude that
resulted in fracture ,107 cycles is illustrated with a
line. Note that mean strains greater than y1?5% lead
to greater fatigue life, in contrast to conventional lin-
ear–elastic materials. Reprinted from Pelton et al.46
with permission from Elsevier
Robertson et al. Mechanical fatigue and fracture of Nitinol
14 International Materials Reviews 2012 VOL 57 NO 1

The lowest strain amplitude that resulted in fracture isillustrated with a line, whereby combinations of meanstrain and strain amplitude below this line should result inlifetimes of at least 107 cycles. These data clearly showthat an increase from 1?5 to 4% mean strain (i.e. increasein volume fraction of stress induced martensite) results ina greater tolerance of strain amplitude from 0?4 to 0?8%respectively.
More recently, microdogbone specimens (6 mm gaugelength, 0?3 mm gauge width and 0?15 mm gaugethickness) were extracted from stent-like devices thatwere laser machined from thermomechanically pro-cessed Ni50?8Ti49?2 tubing and expanded per standardNitinol stent processing.47 The monotonic stress–straincurves at room temperature and 37uC from thesespecimens shown in Fig. 21 illustrate the expected trendof increased plateau stresses, greater modulus and longerstress plateau when tested at 37uC. Specifically, thelength of the stress plateau (linear elastic plus stressinduced plateau) at 37uC is y8% versus only 6?5% in theroom temperature tested samples. The microdogbonespecimens were prestrained at 37uC to 9% (beyond thestress plateau) to simulate Nitinol stent crimp strainsand then fatigued from the unloading plateau. Datafrom three specimens per mean strain condition aresuperimposed on the ‘diamond’ data and are shown inFig. 22. At 1% mean strain, the dogbone fatigue data arecomparable with those from the diamond shapedspecimens; i.e. no fractures at 0?2% strain amplitude,fracture at 0?6% strain amplitude and mixed results at0?4% strain amplitude. For mean strains between 1?5and 3%, there is an increase from 0?4 to 0?6% strainamplitude. A dotted line at 0?6% strain amplitude isdrawn between 3 and 7% mean strain to indicate thatthere are insufficient data for a complete analysis. Above7% mean strain (approximately the superelastic plateaulength at 37uC), however, the constant life data exhibit anegative slope. These observations demonstrate thatNitinol has a worst case fatigue life with a strainamplitude of 0?4% up to a mean strain of y1?5%.Above 1?5%, however, the strain amplitude increases fora given fatigue life, with the strong implication that theformation of stress induced martensite is responsible for
this enhancement in fatigue behaviour. Note also that inthe two phase region, increasing the peak maximumstrain (i.e. mean strain plus strain amplitude) does notnecessarily decrease the fatigue life. For example,consider the two conditions of fatigue strain: 2¡1%and 2?5¡0?5%; the peak strain is 3% for both cases.However, the lower mean strain conditions lead tofracture, whereas an increase in mean strain andcorresponding decrease in strain amplitude leads to107 cycles survival. The overwhelming conclusion fromthese recent studies is that fatigue life for superelasticNitinol is driven by strain amplitude rather than meanstrain or peak strain up to the end of the stress plateau.Furthermore, Nitinol fatigue should not be modelledwith traditional Goodman or Soderberg type analysestypically used with conventional engineering materials.
The utility of such data is in the prediction ofcomponent lifetimes, e.g. in the above mentioned casefor the integrity of endovascular stents. Accordingly, asvalidation of the pulsatile fatigue behaviour, radialdistension to fracture proof tests were also conducted on10 mm diameter Cordis SMART stents.46 Non-linearFEA was used to determine the resultant mean strainsand strain amplitudes under various conditions ofoversizing and pulse pressure. These experimental stentpulsatile fatigue data are overlaid on the diamondfatigue life data in Fig. 23. The stents fractured at,107 cycles at high mean and high strain amplitudeconditions, as predicted by the conservative 0?4% fatiguestrain line. The stents survived to 107 cycles at condi-tions of y1% mean strain and strain amplitudes
21 Monotonic stress–strain curves from Nitinol microdog-
bone specimens that were extracted from stent-like
devices that were processed similar to Nitinol medical
devices. Note that the plateau length at 37uC is y8%
in length. Reprinted from Pelton47 with permission
from Springer
22 Constant life diagram from the diamond stent sub-
component fatigue testing where the various condi-
tions of mean strain and strain amplitude are plotted.
Also included are data from microdogbone specimens
laser machined from Ni50?8Ti49?2 tubing with mean
strains out to 9%. Conditions that survived the
107 cycles testing for the microdogbone specimens
are shown as open triangles, whereas cyclic condi-
tions that led to fracture 107 cycles are represented
with closed circles. The microdogbone data are con-
sistent with those from diamond specimens (superim-
posed) from Fig. 20. Note that mean strain leads to
increasing fatigue life in the 1?5–7% mean strain
region, with a decrease in strain amplitude .7% mean
strain (extent of the monotonic stress plateau).
Reprinted from Pelton47 with permission from
Springer
Robertson et al. Mechanical fatigue and fracture of Nitinol
International Materials Reviews 2012 VOL 57 NO 1 15

between y0?2 and 0?45% that are closer to physiologicalconditions (approximately shown with a shaded greybox) and are consistent with the worst case 0?4% fatiguestrain limit line. The results shown in Fig. 23 demon-strate the incorporation of the diamond subcomponenttesting analysis as a useful and accurate indicatorof Nitinol stent lifetimes for radial dilation fatigueconditions.
Multiaxial or mixed mode conditions
The above examples of strain controlled fatigue for Nitinolmedical devices were carried out under conditions ofuniaxial or bending cycles. However, to better understandthe complex in vivo performance of Nitinol medicaldevices, a more complete multiaxial model must bedeveloped. Torsion of thin walled tubes provides aconvenient method to characterise the effects of shearstress and strain. A recent investigation cycled Nitinoltubing in torsion at various mean and alternating strainsand compared the results with equivalent fatigue datacollected under uniaxial tensile/bending conditions.58 Inorder to compare the torsional hysteresis and fatigue datawith previous results obtained under axial tension andbending, the shear strain values were converted toequivalent strains. The results were expressed as theequivalent true (Cauchy) stress
-
s and the equivalentreferential (Lagrangian) strain
-
e. The data were convertedby using
-
s~ s2t z3s2
s
� �1=2and
-
e~ e2t z4=3e2
s
� �1=2, where st
and et are the tensile stress and strain respectively and ss
and es are the shear stress and strain respectively. For thedeformation range of interest in that study, i.e. meanstrains ,5%, the transformation strains etr are defined asthe total strain minus the (purely) elastic strain. Replottingthe diamond and ‘strut’ fatigue data from Fig. 23 alongwith the Nitinol tube torsion data for Re values of 21, 1,
0?2 and 0?6 on a single alternating equivalent strain versusnumber of cycles, strain–life diagram displays a remark-able normalisation of superelastic Nitinol fatigue data, asshown in Fig. 24. However, the tension–tension data withhigh mean strain data do not follow the curve. Analternative and improved approach that can accommodatethe high mean strain results is to incorporate a modifiedCoffin–Manson type equation for the multiaxial fatigue ofNitinol using the number of cycles and equivalenttransformation strain amplitude. The equivalent transfor-mation strain
-
etr is defined as the total equivalent strain-
eminus the elastic equivalent strain
-
eel, where-
e~-
eelz-
etr; thetransformation strain amplitude is therefore D
-
etr=2.Applying this notion to the torsion, bending and
23 Stent pulsatile fracture data are overlaid on the dia-
mond fatigue data from Fig. 20. The open circles
represent test conditions for SMART stents that sur-
vived 107 pulsatile cycles. The closed circles are
those conditions that led to fracture of the SMART
stent at ,107 pulsatile fatigue cycles. Note that the
stent fatigue testing is consistent with the diamond
data, whereby fracture tends to occur above the worst
case 0?4% strain amplitude (dotted line) for a range of
mean strains. The shaded box represents mean and
amplitude strains for typical endovascular oversizing
and pulsatile fatigue conditions. Reprinted from Pelton
et al.46 with permission from Elsevier
24 Combined e–N diagram for the multiaxial fatigue of
superelastic Nitinol tubes plotted in terms of alternat-
ing equivalent strain as a function of the number of
cycles showing normalisation of multiple datasets of
torsion, bending (tension/compression) and tension–
tension fatigue results at multiple Re ratios. This for-
mulation does not appear to work so well for mean
strains on the order of 9% (Re<0?88–0?99). Reprinted
from Runciman et al.58 with permission from Elsevier
25 A modified Coffin–Mason relationship for the multiax-
ial fatigue (21,Re,0?99) of superelastic Nitinol invol-
ving the alternating equivalent transformation strain
D-
etr as a function of the number of cycles to failure,Nf, where D
-
etr=2~61:7N{0:5f . Note how this approach
normalises the e–N data even for the highest meanstrain results out to 9%. Reprinted from Runcimanet al.58 with permission from Elsevier
Robertson et al. Mechanical fatigue and fracture of Nitinol
16 International Materials Reviews 2012 VOL 57 NO 1

tension–tension fatigue data of superelastic Nitinol inFig. 24 over a wide range of strain ratios from Re values of21 out to 0?9 revealed a ‘universal’ fit (Fig. 25), which canbe expressed in terms of the following relationship:D-
etr=2~61:7N{0:5f . Accordingly, this phenomenological
approach provides a means to normalise fatigue conditionsfrom a number of deformation modes for thermomecha-nically processed Nitinol used to manufacture medicaldevices.
Energy considerations
Mechanistically, it is not known if the fatigue behaviourobserved in superelastic Nitinol is due to microstructuraleffects of martensite (i.e. formation of stabilised marten-site during cycling with the incorporation of plasticity) orrather to the lower moduli associated with the stressinduced transformation regime (i.e. decreased hysteresisenergy).46 In this respect, however, there is merit toconsider the details of the cyclic hysteresis loops forpredictive purposes. This approach is incorporated, forexample, in thermodynamic analyses of thermal andmechanical fatigue of Nitinol where changes in transfor-mation temperature and upper and lower transformationstresses are used to model the elastic and irreversibleenergy as a function of fatigue cycles.59–61 The change inelastic free energy relationship from these analyses was
expressed as: DEe!Ð
stije
tijdV
.V{
Ðsijzsd
ij
� �et
ijdV.
V ,
where s, sd and str are the applied stress, the internalelastic stress field due to the presence of defects and theinternal stress field associated with the transformationrespectively. For tension–tension superelastic cycling,these models are consistent with decreasing elastic energywith cycles due to the increase in internal elastic stressfield in the direction of the applied stress resultingfrom creation and rearrangement of dislocations anddeformed martensite. The area within the hysteresisloops from superelastic cycling is a measure of work andtherefore can be modelled in an analogous manner toaccount for damage accumulation due to the effects ofmean strain (stress) and strain (stress) amplitude. Smith–Watson–Topper (SWT)62 developed a phenomenologicalmethod to incorporate mean stress for the analysis offatigue data. They hypothesised a generalised stress–strain function to predict fatigue life and assumed thatthe function should be applicable to crack initiationand at least the early part of crack propagation**.This function is based on determining the stress rangeDs, strain range De and modulus of elasticity E. Oneversion of this relationship for strain controlled testscan be stated as PSWT5(smaxDeE)0?5; other forms of therelationship are applicable for stress controlled testsunder conditions of fully reversed and with applicationof mean strain (stress).62 From this simple relationship, itcan be seen that the fatigue parameter PSWT is minimisedwith minimal values of stress, strain and modulus.A modified SWT analysis was used to analyse Nitinolfatigue data thermal cycles under conditions of aconstant applied force.67 The modulus for Nitinol isextremely temperature dependent24 and changes withthe value of mean strain due to the relative amountof austenite and martensite. Nevertheless, a stabilised
modulus can be used for these analyses. For the case oftypical in vivo conditions of mean strain and strainamplitude, it was shown in Figs. 13 and 15 that the cyclicstress–strain curves adopt a modulus comparable withthe initial loading modulus (especially with low valuesof mean strain and strain amplitude); this is alsoobserved in Fig. 7 for strain controlled conditionsof thermal martensite, per MM1. We can, therefore,schematically represent these stabilised fatigue hysteresisloops with a straight line as illustrated in Fig. 26 forthe conditions of 2% mean strain and 0?25% strainamplitude with Af values of 10 and 30uC and testedat 37uC (i.e. tested in a superelastic condition). Thisfigure summarises the salient features observed inseveral investigations. First, the loading and unloadingplateau stresses decrease with increasing Af temperature(decreasing DT). Second, the cyclic modulus decreaseswith increasing Af. The modulus depends upon theextent of prestrain, mean strain (stress) and strain (stress)amplitude; a first order approximation of the moduluscan be estimated with an austenite–martensite rule ofmixtures. Furthermore, these parameters depend onthe processing conditions, as shown in Figs. 13 and 15.The stress–strain characteristics shown in Fig. 26b result
**As we will discuss in the subsequent section, Nitinol has a very lowfatigue crack threshold.43,63–66 Therefore, once a crack initiates, it takesvery little additional energy to propagate the crack. Consequently, theSWT analysis is suitable for total life fatigue of Nitinol.
26 Schematic stress–strain curves with strain controlled
fatigue conditions of 2% mean strain and 0?25% strain
amplitude for Nitinol tested at 37uC for Af values of a
10uC and b 30uC. Note that the effective modulus for
each condition is comparable with the initial loading
modulus. Therefore, although the fatigue strain condi-
tions are identical, the stress ranges are dramatically
different. The total energy per cycle, represented by
the arrow length, reduces with increasing Af (decreas-
ing DT) with a corresponding reduction in microstruc-
tural damage accumulation and increase in fatigue life
Robertson et al. Mechanical fatigue and fracture of Nitinol
International Materials Reviews 2012 VOL 57 NO 1 17

in predictions of longer fatigue lives with increasing Af,whereby a work integral or SWT function is minimisedwith reduced damage accumulation as demonstratedwith the data in Figs. 8–10. Clearly, these approachesare conceptual and require additional vetting to beused quantitatively to predict fatigue life in Nitinol. Itwill be especially important for detailed mechanical andmicrostructural analyses to be carried out in the futurefor varying conditions of mean strain (stress), strain(stress) amplitude and transformation temperature toadd additional insight into Nitinol fatigue. Examplesare shown in Figs. 13–15 to illustrate microstructuraldifferences by TEM. Moreover, it was demonstratedrecently that synchrotron micro-X-ray diffraction couldbe used to differentiate elastic and transformationalstrains in deformed Nitinol.31,68 This characterisationmethod is capable of y1 mm resolution, which couldprovide a high resolution technique to monitor mechani-cally fatigued Nitinol.
Furthermore, none of these changes in material res-ponse have yet to be incorporated in traditional FEAstress computations for Nitinol components, althoughMehta et al. addressed some of these discrepancies bydirect measurement of the transformation using in situsynchrotron X-ray diffraction analysis.68
Summary of trends with stress/strain–life data
1. Superelastic Nitinol provides longer lives andgreater fatigue limits than thermal martensite understress controlled conditions. These observations areattributed to the difference in plateau strengthbetween austenite and martensite at the testtemperature. The stress fatigue limit is y80% ofthe respective stress plateau (superelastic) ordetwinning plateau (thermal martensite). Further-more, superelastic conditions produce only a few ofthe possible 24 variants of martensite that arealigned to optimise internal strain distributions andminimise dislocation formation.
2. Repeated cycles under stress controlled conditionslead to deformational changes, i.e. an increase inpeak strain at constant stress amplitude. Themagnitude of these deformational changes dependson processing and test conditions.
3. The fatigue life of thermal martensite is superior tosuperelastic Nitinol under strain controlled condi-tions. This is attributed to the fact that for a givenstrain amplitude, the stress required to deformthermal martensite is lower than those required totransform austenite to martensite under super-elastic conditions.
4. Repeated cycles under strain controlled conditionslead to cyclic hardening, i.e. an increase in stress atconstant strain amplitude. This hardening is due tothe effects of an increase in dislocation density withincreasing cycles that tends to reduce the amount ofmaterial undergoing cyclic phase transformation.
5. Strain controlled fatigue testing of medical devicesubcomponents can be described by a non-tradi-tional constant life diagram. Fatigue life for super-elastic Nitinol is driven by strain amplitude ratherthan mean strain or peak strain. Furthermore,fatigue life is increased with increasing mean strainup to the end of the phase transformation plateau.
6. Strain–life approaches based on the alternatingequivalent strain, or better still the alternatingequivalent transformational strain incorporatedinto a modified Coffin–Manson formulation, pro-vide a means to analyse fatigue data for Nitinoltested under multiaxial or mixed mode loadingconditions.
7. Thermomechanically processed Nitinol is morestable than fully annealed conditions in whichdislocations accumulate more rapidly in the largegrained annealed material, which results in shorterlives.
Damage tolerant fatigueCompared with the total life approach to fatigue ofNitinol, relatively few studies have been conducted toevaluate the damage tolerant properties, i.e. the fatiguecrack growth and fracture toughness behaviour. Onereason for this is that currently the Nitinol industry isdominated by commercial products with geometricallysmall feature sizes where the emphasis is placed onpreventing fatigue crack nucleation rather than control-ling crack growth. Not only is it difficult to experimen-tally measure crack growth rates accurately in suchphysically small components, but once a macroscopiccrack nucleates and starts growing, failure generallyensues shortly afterwards as is shown in the body ofwork presented herein. For example, a stent with atypical strut width of y0?2 mm cycled at 1 Hz (heartrate) may require only hours or days for a crack to fullypropagate through the wall once nucleated. Indeed, inthose cases, it is important to screen, and reject, devicesfor surface flaws that are larger than the critical cracklength for such propagation, which in stents is typicallyabout 15–50 mm.43 Provided that those geometricallysmall devices do not have flaw sizes larger than thiscritical crack length, then the total life approach tofatigue evaluation is more appropriate. Furthermore,the Food and Drug Administration, which regulatesthese devices, requires testing of complete commercialdevices, rather than solely of ‘coupon specimens’, suchthat there is a direct correlation between total life ‘benchtop’ fatigue lifetimes and in service device performance.As discussed below, the damage tolerant approach tofatigue is most appropriate when the product is in astress controlled environment and its geometric size islarge enough to sustain stable crack growth for manythousands of cycles and over a long enough time periodto retain functionality of the device over its lifetimedespite the presence of a growing crack, or when devicescannot be adequately examined and rejected for surfaceflaws exceeding the critical crack length. In today’scommercial landscape, there are few Nitinol productsthat meet such a description. One such example is theconcrete reinforcing bars for rapid rebuilding using theshape memory effect following structural damage tobridges. However, damage tolerant analyses are usefulas a compliment to a total life approach. Specifically,whereas stress/strain life data should be employed toprovide the primary basis for life prediction in mostmedical devices, damage tolerant analyses can be used assecondary life prediction methodology that can addi-tionally assess, in the quantitative way, the effect of thepresence of defects in terms of reduced performance/lifetimes.69 Moreover, the commercial landscape may
Robertson et al. Mechanical fatigue and fracture of Nitinol
18 International Materials Reviews 2012 VOL 57 NO 1

change in the future, and require the implementation ofdamage tolerant techniques as the primary life predic-tion strategy. Indeed, the orthopaedics community isbeginning to adopt Nitinol for in vivo skeletal stabilisingdevices (in a stress controlled environment) that havegeometries on the order of several centimetres, where thedamage tolerant analysis is more relevant.
Phase dependent fatigue crack growthMM113 were the earliest researchers to conduct fracturemechanics based fatigue crack growth measurements onNitinol. Their material was upset forged at 800uC froman initial 50 mm diameter ingot into an 18 mm thickplate, followed by a 1 h anneal at 950uC. This treatmentresults in a distinctly different large grain structure thanis found in most modern commercial applications thatuse heavily cold worked and subsequent stress relievedNitinol (as discussed in the previous section). In thatstudy, two different Nitinol compositions were exam-ined at room temperature, namely a thermal martensitealloy (Ms547uC, with Af<87uC), and a mixed phasematerial (Ms520uC, with Af<60uC). Despite the radi-cally different microstructures, they found virtually nodifference in the crack growth behaviour of the twomaterials; Paris law{{ exponents were m<3?5, with athreshold stress intensity value of DKth<2?4 MPa m1/2{{
(Fig. 27).It was a decade later until further studies on fatigue
crack growth behaviour in Nitinol were reported;specifically two studies were presented at an MRSInternational Meeting on ‘Advanced materials’ in Japanin 1988. The first of these, by Dauskardt et al.,70 variedthe Nitinol chemical composition in order to obtainvarious microstructures at room temperature. Whereasthose authors identified the material as ‘stable austenite’,
‘irreversible transforming superelastic austenite’, ‘rever-sible transforming superelastic austenite’ and ‘stablemartensite’, evaluation of the Af and test temperaturesrevealed that the authors studied superelastic austenite,mixed phase material and thermal martensite. Allmicrostructures demonstrated similar Paris law growthexponents (2?7–3?5), but the DKth threshold values weredistinctly different. Specifically, the superelastic austeniteand thermal martensite microstructures had much larger(by a factor of y2) fatigue thresholds, and hence superiorfatigue crack growth resistance, than the mixed phasematerials (Fig. 28). Because of the confusion of themicrostructures, those authors incorrectly concluded thatsuperelastic austenite has the lowest fatigue thresholdvalue and ascribed threshold differences to a negativevolumetric change associated with the phase transforma-tion from austenite to martensite that they termed‘negative dilation’. They claimed further that, due to theconstraint of surrounding untransformed materialsremote from the growing crack, negative dilation insuperelastic austenite would effectively raise the localstress intensity immediately ahead of the propagatingcrack (negative crack tip shielding). In other words, thedecrease in volume of the transformed material immedi-ately ahead of a growing crack induces an elevated tensilestrain field in the surrounding untransformed grains dueto the required need to compensate (by tensile elasticloading) for the shrinkage of the transformed material.While this hypothesis is, indeed, a valid scientificargument, the authors mistakenly identified the super-elastic austenite as a stable austenite. Therefore, theirargument that a transforming microstructure offerspoorer threshold stress intensities is incorrect since thesuperelastic austenite material demonstrated the largestthreshold value. Instead, we opine that the cyclic fatiguein a mixed phase microstructure creates a complextransformation structure (based on the energetic compe-tition between mechanically and thermally formedmartensitic variants previously discussed) that causeseasier fatigue crack initiation and consequently lowerthreshold stress intensity values.
The second study presented at the 1988 MRS meetingwas from Miyazaki et al.71 who investigated fatigue
{ { The Paris power law provides a means to relate the fatigue crack growthrates da/dN to the stress intensity range DK. In its simplest form, it can beexpressed as: da/dN5CDKm, where C and m are experimentallydetermined scaling constants. The latter expression is most applicableto intermediate growth rate behaviour typically between y1026 and1029 m/cycle.
{ { The fatigue threshold stress intensity DKth represents the value of thestress intensity range below which (large) crack growth is essentiallydormant.
27 Fatigue crack growth da/dN data as a function of the
stress intensity range DK for stress relieved Nitinol
alloys where the stable phase was controlled by vary-
ing the chemical composition. The crack growth rates
were virtually identical between the two microstruc-
tures tested at room temperature with R,0?1; after
MM113
28 Dauskardt et al.70 fatigue crack growth threshold stress
intensity values in Nitinol plotted versus DT (defined
above). The data show that mixed phase material (those
with DT just below zero) has a lower fatigue threshold
than both the thermal martensite (DT5273uC) and the
superelastic austenite (DT5z35uC)
Robertson et al. Mechanical fatigue and fracture of Nitinol
International Materials Reviews 2012 VOL 57 NO 1 19

crack growth behaviour in Nitinol plate evaluated in theParis regime (i.e. at intermediate growth rates) as afunction of temperature, chemical composition and heattreatment. These authors noted the importance ofmodifying such variables to obtain the various micro-structural phases, but also recognised that each of thesechanges can introduce new biases into the interpretationof the data. Unfortunately, the results presented byMiyazaki et al. show Paris law exponents m that aremuch higher, and constants C that are much lower thanany other studies in the literature on the fatigue ofNitinol. Indeed, the Paris law exponents were some 3–4times higher, and Paris constants 5–10 orders ofmagnitude lower than any other values reported by therest of the Nitinol fatigue testing community. The wilddiscrepancy between these data and the rest of the bodyof Nitinol literature leads us to conclude that the valuesthat were calculated are erroneous, and accordingly weare compelled to ignore these data. Their data aretabulated for completeness later, but are excluded fromthe trend studies.
A later fatigue study, by Holtz et al.,72 involvedholding the chemical composition constant and varyingthe test temperature (from 30 to 150uC) to achievespecific phases in a binary Ti50?1Ni49?9 (at-%) alloy, heattreated for 1 h at 750uC with an Af5120uC. This workinvolved a very complete test matrix of two phases(thermal martensite and superelastic austenite) and fourload ratios of R50?1–0?9. As expected, the fatiguethreshold DKth values decreased with increasing loadratio (Fig. 29). Similar to the conclusions of Dauskardtet al.,70 they found that thermal martensite microstruc-tures required the highest stress intensities for crackpropagation, and hence were the most resistant tofatigue crack growth.
McKelvey and Ritchie63 investigated the fatigue crackgrowth rates of binary Ni50Ti50 (at-%) alloy in thesuperelastic condition in thick section (9 mm thick) roundcompact tension samples (machined from 41?3 mmdiameter round bar) tested in 37uC Hank’s balanced saltsolution at 10 Hz frequency with R50?1. They foundthat, compared with other biomedical implant materials,superelastic Nitinol had the lowest fatigue crack growthresistance in terms of the highest growth rates (at a given
DK) and the lowest threshold values (DKth<2 MPa m1/2)(see Fig. 30a). However, if one follows the approach ofOhta et al.73 and normalises the fatigue crack growthrates by the modulus of the material, thereby evaluatingthe strain intensity range (rather than the more traditionalstress intensity range), the Nitinol data from McKelveyet al. can be shown to approximately the same ascomparative biomedical metallic implant materials suchas Ti–6Al–4V and austenitic stainless steels (Fig. 30b).This trend suggests that Nitinol displays equivalentfatigue crack growth properties to other biomedicalmetallic implant materials under strain controlledboundary conditions, especially in the slow growthregions near the threshold values.
McKelvey and Ritchie later compared the relativefatigue resistance of the various different structuralphases in Nitinol for this thick section material, andfurther investigated the role of R ratio (from 0?1 to 0?7)on fatigue behaviour.64 Using temperature (rather thancomposition) to change the structural phase in a singleNi50Ti50 (at-%) alloy (with Af<30uC), they comparedthe fatigue crack propagation behaviour over a widerange of growth rates (from 10211 to 1025 m/cycle) instable austenite (at 120uC), superelastic austenite (at
29 Fatigue crack growth data for various Nitinol micro-
structures controlled by modifying the test tempera-
ture. Whereas the stable crack growth exponents were
largely equivalent, the threshold stress intensity for
the superelastic austenite was lower than the thermal
martensite; after Holtz et al.72
30 Comparison of fatigue crack growth rates for various
biomedical metallic alloys showing a distinct inferior-
ity of Nitinol when evaluated by stress intensity (after
McKelvey and Ritchie63), but b equivalency threshold
values when evaluated by strain intensity (i.e. when
data in Fig. 28a are normalised by the elastic modu-
lus) in the nominal linear–elastic range. Elastic modu-
lus for the titanium alloy (Ti–6Al–4V), austenitic
stainless steel (316SS) and Nitinol were taken as 117,
193 and 62 GPa respectively
Robertson et al. Mechanical fatigue and fracture of Nitinol
20 International Materials Reviews 2012 VOL 57 NO 1

37uC) and thermal martensite (at 265 and 2196uC). Theirobservations on the effect of load ratio, shown in Fig. 31afor superelastic austenite at 37uC, demonstrated how thefatigue thresholds decrease and growth rates increase(particularly at high and near threshold levels) with in-creasing R. The best fatigue crack growth resistance, interms of lowest growth rates and highest thresholds, wasfound in thermal martensite. Furthermore, the stableaustenite structure showed slightly better properties thansuperelastic austenite (Fig. 31b). Although these compar-isons have to be made at different temperatures, whichmay produce some degree of bias in the conclusions, theobservation that thermal martensitic has superior fatiguecrack propagation resistant compared with superelasticaustenite, is entirely consistent with the earlier studies ofHoltz et al.72 described above.
Effects of inclusionsThe specific effect of inclusions on fatigue crackpropagation in Nitinol was examined by Vaidyanathan
et al.74 who studied the role of increasing the density oftitanium carbides to 10–20 vol.-% in a superelasticaustenitic alloy. They concluded that increasing theinclusion content increased the fatigue threshold stressintensity. We opine, however, that with an inclusioncontent this high, the depletion of titanium from thebulk matrix would inherently change the material frombinary superelastic Nitinol to an alloy with a Ni richstoichiometry that cannot be compared directly withcommercially available Nitinol material. Furthermore,modern commercially produced Nitinol materials aredesigned to contain low inclusion (both oxides andcarbides) contents that would never approach the 10–20% range studied in this work. It should be noted,though, that the ‘inclusion free’ superelastic Nitinol thatthey did examine in this work had a crack growthexponent m similar to other literature values, but thatthe threshold stress intensity was 30–110% higher thanother reported values tested at R50?1.
The presence of near surface inclusions often providespreferential nucleation sites for fatigue fracture both inlaboratory experiments and in commercial devices;see the later section on ‘Fractography’ for examples.However, one should not mistakenly conclude that thepresence of these inclusions necessarily promotes poorfatigue resistance. Indeed, although inclusions certainlycause localised stress discontinuities, the size of inclu-sions in contemporary Nitinol products is typicallysmaller than the 15–50 mm critical flaw size for Nitinol43
and therefore may have limited, if any, effect on thefatigue crack growth properties. This conclusion issupported by comparing the total life rotary bendingfatigue work of Sheriff et al.36 in Nitinol manufacturedwith ASTM acceptable inclusion levels to Morganet al.’s38 extra low inclusion Nitinol and Reinoehlet al’s35 work with black oxide wire, which showstatistically similar low and high cycle fatigue behaviourunder fully reversed alternating strain conditions (seeFig. 10 for graphical comparison)11.
Role of environmentIn a temperature dependent phase transforming materialsuch as Nitinol, the experimental set-up can have just asmuch influence on the fatigue crack growth behaviour asthe chemical composition and thermomechanical pro-cessing. Indeed, even small changes in the test tempera-ture can have a profound effect on Nitinol’s mechanicalproperties (see e.g. Fig. 1), which is why it is essential tocharacterise the transformation temperatures. Despitethis sensitivity, McKelvey and Ritchie63 and laterRobertson and Ritchie66 in a follow-up study to theearlier work of Stankiewicz et al.,65 came to animportant conclusion that adiabatic heating due to thesuperelastic phase transformation had little influence onthe crack growth behaviour. These cumulative worksshowed no differences in samples tested in air (with lowthermal conductivity thereby allowing the possibility ofadiabatic heating) and a simulated body fluid (with highthermal conductivity which would limit any adiabaticheating ahead of the growing crack tip). Furthermore,
31 Variation in fatigue crack propagation rates da/dN as
a function of the stress intensity range DK in an Af of
y30uC Nitinol tested in thick section (9 mm thick
compact tension specimens) at various temperatures
at 10 Hz frequency. The results show a the effect of
load ratio (R50?1–0?7) in the superelastic austenite
microstructure at 37uC and b the relative fatigue crack
propagation resistance of the stable austenite, supere-
lastic austenite and thermal martensite microstruc-
tures; after McKelvey and Ritchie64
1 1 Whereas Sheriff’s, Reinoehl’s and Morgan’s experimental testing inphysically small specimens seems to circumstantially confirm theargument that inclusions are subcritical in dimension, there have beenno experimental research performed to directly quantify the fatiguenucleation effect of inclusions whose dimensions represent a significantportion of the total cross-sectional area. This topic is discussed further inthe small versus large crack section.
Robertson et al. Mechanical fatigue and fracture of Nitinol
International Materials Reviews 2012 VOL 57 NO 1 21

McKelvey and Ritchie,63 Filip et al.75 and Robertsonand Ritchie66 all reached the same conclusion that thetesting of Nitinol at temperatures of 37–40uC in asimulated body solution, as compared with air, does notadversely influence the crack growth behaviour ofelectropolished specimens, indicating that corrosionassisted fatigue is not of concern under those specificcircumstances. This is an important issue as mostresearchers, for the sake of expediency, employ cyclictesting frequencies well above expected in serviceconditions, which would have the potential of suppres-sing any such corrosion assisted fatigue (if it wereactive). This specific issue was resolved by Robertsonand Ritchie66 who fatigue tested identically processedsuperelastic austenite specimens at 1 Hz and at 50 Hzin 37uC simulated body fluid and found essentiallyidentical fatigue crack growth behaviour,66 therebystrengthening the conclusion that electropolishedNitinol is not susceptible to corrosion assisted fatiguein a simulated human blood solution at physiologicaltemperatures over this frequency range (Fig. 32).Although these conclusions are encouraging to research-ers who have utilised elevated frequencies for rapid datacollection, we must caution that these results may not beapplicable to all instances of Nitinol fatigue. Forexample, gastrointestinal Nitinol devices are subjectedphysiologically to strongly acidic aqueous environmentswhere corrosion may play a very important role in therate of fatigue crack growth; consequently, it isimportant to select the appropriate pH simulatedsolution and testing frequency to allow for thepossibility of corrosion assisted fatigue to occur. In theprevious section, we showed experimental evidenceshowing that the stable fatigue crack growth slopes are
independent of the load ratio. Therefore, although thesetests were conducted only at R50?5, we believe thatelectropolished Nitinol’s resistance to corrosion assistedfatigue in this simulated body fluid environment spansto all load ratios.
Texture dependent fatigue crack growthThe role of crystallographic texture on the mechanicalproperties of superelastic Nitinol is well known andmanifests as widely varying strains required to stressinduce the martensitic phase depending on the materialtexture.20,21,76 This texture develops from the castingconditions as well as from the extensive thermomecha-nical processing to the final product configuration. Notonly is texture responsible for the asymmetry inmechanical properties between tension and compression,29
but it varies significantly between different product forms77
in Nitinol. This is important to realise as the texture inNitinol is practically impossible to modify in the final form,even using aggressive annealing and/or thermomechanicaltreatments. It is, therefore, expected that the fatigue crackgrowth properties of superelastic Nitinol would also beaffected by texture. Indeed, reports in the literaturedemonstrate this dominance of the role of texture on thecrack growth path in thin walled tubing that has undergoneseveral thousands of percentage of reduction from itsoriginal as cast ingot form. Specifically, Robertson andRitchie66 showed that the preferred (i.e. lowest crystal-lographic energetic barrier) crack growth direction in thinwalled Nitinol tube used for endovascular stents was 45u tothe tube drawing direction (Fig. 33). Surprisingly, cracksgrew at 45u to the pure mode I direction in samples cut withthe prenotch oriented parallel or perpendicular to thedrawing direction, demonstrating the marked dominance oftexture on fatigue crack growth in superelastic austenite. Inanother study, Robertson et al.78 characterised the textureand strain distribution immediately ahead of a growingfatigue crack in superelastic austenite using synchrotron X-ray diffraction techniques. These authors demonstrated thatthe strain distribution and transformation did not follow theexpected peanut shaped front that is predicted from linear–elastic fracture mechanics models. Instead, grains withcertain orientations could suppress the transformation evenwhen surrounding grains had already undergone the
32 Fatigue crack growth curves for electropolished supere-
lastic austenite Nitinol tested at 37uC and R50?5 in air
and Hanks’ balanced saline solution (HBSS) at acceler-
ated frequencies (50 Hz), and in HBSS at physiologically
relevant frequency (1 Hz). The curves show no statisti-
cally significant difference, thereby suggesting that
adiabatic heating due to the phase transformation has
no effect on the crack growth rates and that corrosion
assisted fatigue is not active in Nitinol at these frequen-
cies. After Robertson and Ritchie66
33 Orientation dependent transformational strains pre-
dicted and measured experimentally by Robertson
et al. to explain the unexpected preferential fatigue
crack growth behaviour in Nitinol compact tension
specimens (inset photo); after Robertson and Ritchie66
Robertson et al. Mechanical fatigue and fracture of Nitinol
22 International Materials Reviews 2012 VOL 57 NO 1
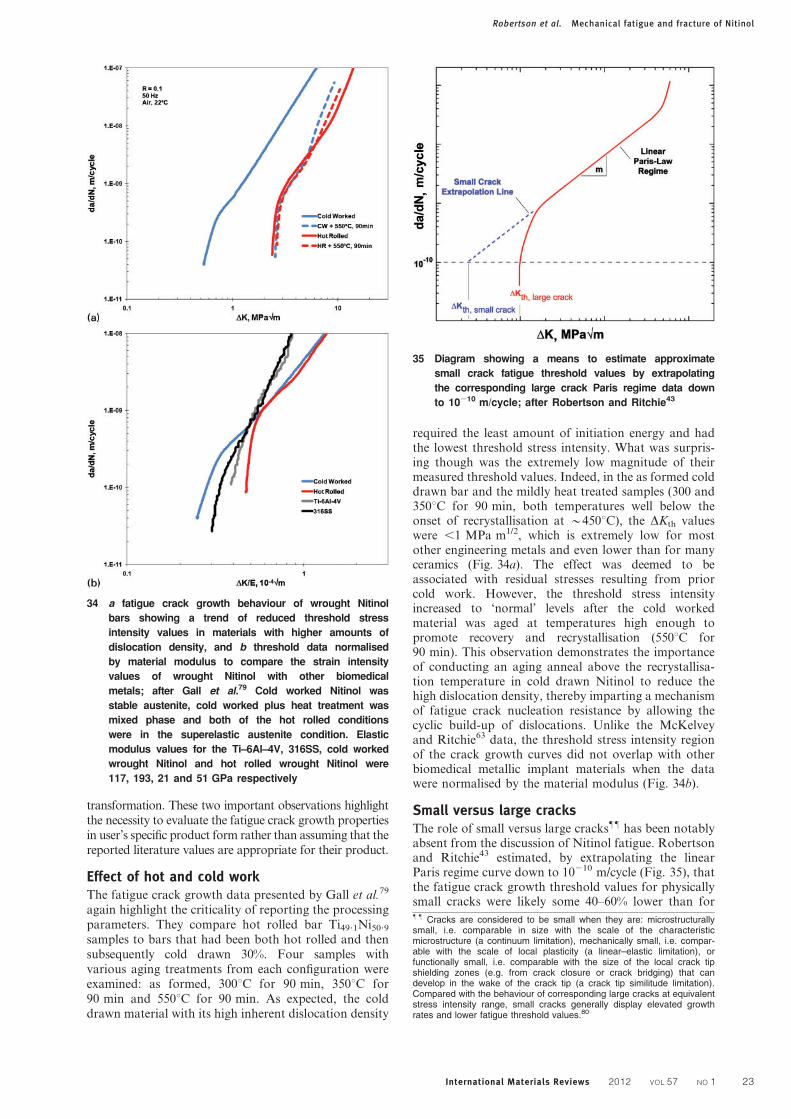
transformation. These two important observations highlightthe necessity to evaluate the fatigue crack growth propertiesin user’s specific product form rather than assuming that thereported literature values are appropriate for their product.
Effect of hot and cold workThe fatigue crack growth data presented by Gall et al.79
again highlight the criticality of reporting the processingparameters. They compare hot rolled bar Ti49?1Ni50?9
samples to bars that had been both hot rolled and thensubsequently cold drawn 30%. Four samples withvarious aging treatments from each configuration wereexamined: as formed, 300uC for 90 min, 350uC for90 min and 550uC for 90 min. As expected, the colddrawn material with its high inherent dislocation density
required the least amount of initiation energy and hadthe lowest threshold stress intensity. What was surpris-ing though was the extremely low magnitude of theirmeasured threshold values. Indeed, in the as formed colddrawn bar and the mildly heat treated samples (300 and350uC for 90 min, both temperatures well below theonset of recrystallisation at y450uC), the DKth valueswere ,1 MPa m1/2, which is extremely low for mostother engineering metals and even lower than for manyceramics (Fig. 34a). The effect was deemed to beassociated with residual stresses resulting from priorcold work. However, the threshold stress intensityincreased to ‘normal’ levels after the cold workedmaterial was aged at temperatures high enough topromote recovery and recrystallisation (550uC for90 min). This observation demonstrates the importanceof conducting an aging anneal above the recrystallisa-tion temperature in cold drawn Nitinol to reduce thehigh dislocation density, thereby imparting a mechanismof fatigue crack nucleation resistance by allowing thecyclic build-up of dislocations. Unlike the McKelveyand Ritchie63 data, the threshold stress intensity regionof the crack growth curves did not overlap with otherbiomedical metallic implant materials when the datawere normalised by the material modulus (Fig. 34b).
Small versus large cracksThe role of small versus large cracks"" has been notablyabsent from the discussion of Nitinol fatigue. Robertsonand Ritchie43 estimated, by extrapolating the linearParis regime curve down to 10210 m/cycle (Fig. 35), thatthe fatigue crack growth threshold values for physicallysmall cracks were likely some 40–60% lower than for
34 a fatigue crack growth behaviour of wrought Nitinol
bars showing a trend of reduced threshold stress
intensity values in materials with higher amounts of
dislocation density, and b threshold data normalised
by material modulus to compare the strain intensity
values of wrought Nitinol with other biomedical
metals; after Gall et al.79 Cold worked Nitinol was
stable austenite, cold worked plus heat treatment was
mixed phase and both of the hot rolled conditions
were in the superelastic austenite condition. Elastic
modulus values for the Ti–6Al–4V, 316SS, cold worked
wrought Nitinol and hot rolled wrought Nitinol were
117, 193, 21 and 51 GPa respectively
35 Diagram showing a means to estimate approximate
small crack fatigue threshold values by extrapolating
the corresponding large crack Paris regime data down
to 10210 m/cycle; after Robertson and Ritchie43
" " Cracks are considered to be small when they are: microstructurallysmall, i.e. comparable in size with the scale of the characteristicmicrostructure (a continuum limitation), mechanically small, i.e. compar-able with the scale of local plasticity (a linear–elastic limitation), orfunctionally small, i.e. comparable with the size of the local crack tipshielding zones (e.g. from crack closure or crack bridging) that candevelop in the wake of the crack tip (a crack tip similitude limitation).Compared with the behaviour of corresponding large cracks at equivalentstress intensity range, small cracks generally display elevated growthrates and lower fatigue threshold values.80
Robertson et al. Mechanical fatigue and fracture of Nitinol
International Materials Reviews 2012 VOL 57 NO 1 23

correspondingly large cracks (Table 2). However, therehave been no reported experimental tests that actuallyhave measured small crack growth and small crackthresholds in Nitinol alloys. Given the current commer-cial practice of using Nitinol for physically small devices,e.g. stents with geometries in the hundreds of micro-metres, this distinction is critical. All of the studiesreported in the current literature compute fatigue crackgrowth parameters for Nitinol from the behaviour ofcracks that are physically long (.1 mm), whereas manycommercial devices have component sections that can bean order of magnitude smaller. If damage tolerant baseddesign and life prediction strategies are to be used forsmall component medical devices, this use of large crackdata must be acknowledged as a possible limitation thatmay lead to non-conservative predictions. Not only aresmall crack thresholds lower in most metallic materials,but at comparable stress intensities, small crack growthrates are significantly faster than those of correspondinglarge cracks, especially at the lower growth rates whichdominate the life. Unfortunately, the measurement ofsmall crack growth rates can be both difficult and highlyprone to significant scatter. Therefore, we would notadvocate the use of damage tolerant analyses as theprimary life prediction methodology for small compo-nent medical devices at this time, particularly thosemanufactured from Nitinol, where the small crackexperimental database is essentially non-existent.
Summary of trends in fatigue crack growth dataMuch debate has surrounded the role of the transforma-tion on the fatigue crack growth behaviour in Nitinol.To help resolve the differences in conclusions reported inthe literature, we have combined the results of everycrack growth experiment reported in the literature (seeTable 3) and plotted the crack growth parameters m andDKth versus a number of variables. Some importanttrends emerge from this comparison***. The mostimportant trend is the role of the initial microstructural
phase in influencing the fatigue threshold stress inten-sity. Specifically, there is a significant increase in thefatigue threshold stress intensities in thermal martensitecompared with all other phases, and a decreasing trendis noticeable towards the stable austenite condition.Given that these tests were conducted under stresscontrolled conditions and that threshold conditionscorrespond to nominal linear–elastic conditions, thisobservation is consistent with those data from total lifestudies discussed above and illustrated in Fig. 30b(Fig. 36). Conversely, the stable crack growth rateexponent m is virtually unaffected by the structuralphase, R ratio, product form and specimen thickness.These trends are important for the design of fatigueresistant Nitinol devices. Indeed, they suggest thatsuperelastic Nitinol may be more fatigue resistant whenthe operating temperature is between As and Af (asopposed to above Af but below Md) since the materialwill still have superelastic properties, but will be closerin microstructure to the more fatigue crack growthresistant thermal martensite rather than stable austenitephase. Above As but below Af, the existing martensitewill be deformed upon application of stress. In addition,the existing volume fraction of austenite will transforminto stress induced martensite. As such, the microstruc-ture will become stabilised and inherit the characteristicsof the thermal martensite, as discussed by MM1 for totallife data.13
Not surprisingly, threshold stress intensities decreasesignificantly with increasing R ratio (Fig. 37). Although
Table 2 Small fatigue crack threshold stress intensity rangeestimations extrapolated from the correspondinglarge crack data for superelastic austenite Nitinol;after Robertson and Ritchie43
R
DKth/MPa m1/2
Large crack(experimentallydetermined)
Small crack(estimatedfrom extrapolation line)
0.1 2.48 1.330.5 2.02 0.810.7 1.15 0.71
36 Crack growth parameters (Paris exponent m and fati-
gue threshold DKth) for Nitinol as a function of the
structural phase. Data are presented as mean¡one
standard deviation. Exact transformation times and
temperatures are shown in Table 3
37 Crack growth parameters (Paris exponent m and fati-
gue threshold DKth) for Nitinol as a function of R
ratio. As expected, the threshold values decrease with
increasing R ratio. Data are presented as mean¡one
standard deviation
*** For the purposes of this comparison, the use of the term ‘trend’ simplyindicates an observed tendency in the data. The use of ‘significant’indicates a statistically significant (p,0?05) trend as determined by a twotailed unpaired t test.
Robertson et al. Mechanical fatigue and fracture of Nitinol
24 International Materials Reviews 2012 VOL 57 NO 1

Ta
ble
3C
om
pila
tio
no
fa
llfa
tig
ue
cra
ck
gro
wth
da
tafo
rN
itin
ol
pre
se
nte
din
the
lite
ratu
re*
Phase
Refe
rence
Tem
pera
ture
/uC
Pro
duct
Test
co
nd
itio
ns
Cra
ck
gro
wth
para
mete
rs
Co
mp
osi
tio
n/
at-
%N
i
Typ
eF
orm
Anneal
Dim
ensi
on/
mm
Mf
Ms
As
Af
Test
DT
Pla
teB
ar
Tub
eS
trip
HR
CD
Tim
e/
min
Tem
pera
ture
/uC
BX{
n/ Hz
Rm
C{
DK
th/
MP
am
1/2
Mart
64
255
227
14
31
2190
2221
49. 9
X35
500
941
10
0. 1
5. 0
1. 26
10
213
5. 0
64
255
227
14
31
265
296
49. 9
X35
500
941
10
0. 1
3. 7
5. 06
10
212
2. 9
72
70
80
100
120
30
290
49. 9
XX
60
750
13
51
20
0. 1
……
3. 4
72
70
80
100
120
30
290
49. 9
XX
60
750
13
51
20
0. 9
……
1. 3
70
22
37
79
96
22
273
…10
…50
0. 1
3. 2
7. 86
10
212
4. 5
13
…47
…87
20
267
49. 9
X60
950
10
606
90
2. 3
,0. 1
3. 5
5. 06
10
211
…72
70
80
100
120
60
260
49. 9
XX
60
750
13
51
20
0. 1
3. 6
2. 26
10
212
3. 8
72
70
80
100
120
60
260
49. 9
XX
60
750
13
51
20
0. 5
……
2. 8
72
70
80
100
120
60
260
49. 9
XX
60
750
13
51
20
0. 7
……
2. 5
72
70
80
100
120
60
260
49. 9
XX
60
750
13
51
20
0. 9
……
1. 5
71
…2
76
38
220
258
50. 8
XX
X60
400
1. 5
32
……
8. 5
1. 56
10
217
…74
35
49
66
76
20
256
49. 4
XX
60
930
10
50
15
0. 1
4. 5
9. 46
10
210
5. 8
Mix
79
……
…63
20
–43
50. 9
XX
X90
350
527
50
0. 1
3. 1
2. 46
10
210
0. 8
372
70
80
100
120
80
–40
49. 9
XX
60
750
13
51
20
0. 1
3. 1
7. 46
10
212
3. 6
72
70
80
100
120
80
240
49. 9
XX
60
750
13
51
20
0. 9
……
1. 2
13
…20
…60
20
240
49. 7
X60
950
10
606
90
2. 3
,0. 1
3. 5
4. 06
10
211
2. 4
79
……
…50
20
230
50. 9
XX
……
532
50
0. 1
3. 3
1. 36
10
211
2. 5
70
21
17
47
50
22
228
……
…10
…50
0. 1
3. 5
1. 66
10
210
2. 2
72
70
80
100
120
100
220
49. 9
XX
60
750
13
51
20
0. 1
3. 2
9. 06
10
212
2. 9
72
70
80
100
120
100
220
49. 9
XX
60
750
13
51
20
0. 9
……
1. 5
79
……
…39
20
219
50. 9
XX
90
350
532
50
0. 1
3. 7
9. 66
10
212
2. 6
71
…31
19
44
26
218
50. 6
XX
X60
400
1. 5
32
……
14
1. 26
10
222
…70
276
226
15
37
22
215
……
…10
…50
0. 1
2. 7
2. 06
10
211
1. 7
71
…2
76
38
26
212
50. 8
XX
X60
400
1. 5
32
……
4. 8
1. 56
10
212
…79
……
…30
20
210
50. 9
XX
90
300
532
50
0. 1
2. 8
3. 36
10
211
2. 4
Robertson et al. Mechanical fatigue and fracture of Nitinol
International Materials Reviews 2012 VOL 57 NO 1 25

Phase
Refe
rence
Tem
pera
ture
/uC
Pro
duct
Test
co
nd
itio
ns
Cra
ck
gro
wth
para
mete
rs
Co
mp
osi
tio
n/
at-
%N
i
Typ
eF
orm
Anneal
Dim
ensi
on/
mm
Mf
Ms
As
Af
Test
DT
Pla
teB
ar
Tub
eS
trip
HR
CD
Tim
e/
min
Tem
pera
ture
/uC
BX{
n/ Hz
Rm
C{
DK
th/
MP
am
1/2
SE
72
70
80
100
120
120
049. 9
XX
60
750
13
51
20
0. 1
3. 4
1. 26
10
211
2. 7
72
70
80
100
120
120
049. 9
XX
60
750
13
51
20
0. 5
……
2. 0
72
70
80
100
120
120
049. 9
XX
60
750
13
51
20
0. 7
……
2. 0
72
70
80
100
120
120
049. 9
XX
60
750
13
51
20
0. 9
……
1. 9
71
…2
12
26
26
26
051. 0
XX
X60
400
1. 5
32
……
3. 5
1. 96
10
210
…79
……
…20
20
050. 9
XX
X90
550
527
50
0. 1
4. 1
4. 76
10
212
2. 6
75
216
412
33
37
450. 6
X…
…0. 2
515
0. 2
3. 0
1. 56
10
210
3. 0
79
……
…15
20
550. 9
XX
90
550
532
50
0. 1
3. 5
1. 06
10
211
2. 7
63
255
227
14
31
37
649. 9
X35
500
941
10
0. 1
3. 0
1. 26
10
210
2. 0
64
255
227
14
31
37
649. 9
X35
500
941
10
0. 1
3. 0
7. 66
10
211
2. 0
64
255
227
14
31
37
649. 9
X35
500
941
10
0. 5
3. 1
1. 66
10
210
1. 1
64
255
227
14
31
37
649. 9
X35
500
941
10
0. 7
3. 0
3. 66
10
210
171
…2
76
38
45
750. 8
XX
X60
400
1. 5
32
……
3. 9
1. 86
10
211
…65
2100
247
15
28
37
950. 8
XX
Xy
10
y500
0. 4
12
50
0. 1
4. 2
1. 96
10
211
2. 5
65
2100
247
15
28
37
950. 8
XX
Xy
10
y500
0. 4
12
50
0. 5
3. 4
3. 06
10
210
1. 9
65
2100
247
15
28
37
950. 8
XX
Xy
10
y500
0. 4
12
50
0. 7
3. 7
2. 56
10
210
1. 4
66
2100
247
15
28
37
950. 8
XX
Xy
10
y500
0. 4
12
50
0. 1
4. 4
1. 96
10
211
2. 5
66
2100
247
15
28
37
950. 8
XX
Xy
10
y500
0. 4
12
50
0. 5
3. 8
1. 66
10
210
2. 0
66
2100
247
15
28
37
950. 8
XX
Xy
10
y500
0. 4
12
50
0. 7
3. 6
2. 56
10
210
1. 2
66
2100
247
15
28
37
950. 8
XX
Xy
10
y500
0. 4
12
10. 5
3. 0
2. 86
10
210
…79
……
…0
20
20
50. 9
XX
X…
…5
27
50
0. 1
2. 8
5. 76
10
210
0. 5
871
…2
76
38
60
22
50. 8
XX
X60
400
1. 5
32
……
3. 7
7. 86
10
211
…79
……
…2
520
25
50. 9
XX
X90
300
527
50
0. 1
3. 3
2. 86
10
210
0. 6
572
70
80
100
120
150
30
49. 9
XX
60
750
13
51
20
0. 9
……
1. 9
72
70
80
100
120
150
30
49. 9
XX
60
750
13
51
20
0. 1
4. 2
5. 56
10
212
2. 9
70
264
252
215
213
22
35
……
…10
…50
0. 1
2. 9
2. 46
10
212
5. 4
71
…2
76
38
100
62
50. 8
XX
X60
400
1. 5
32
……
3. 7
7. 86
10
211
…
Aust
64
255
227
14
31
120
89
49. 9
X35
500
941
10
0. 1
3. 4
4. 06
10
211
2. 5
64
255
227
14
31
120
89
49. 9
X35
500
941
10
0. 5
3. 5
7. 76
10
211
1. 6
64
255
227
14
31
120
89
49. 9
X35
500
941
10
0. 7
3. 8
8. 46
10
211
1. 5
71
…2
76
38
150
112
50. 8
XX
X60
400
1. 5
32
……
3. 7
5. 56
10
211
…
*D
ata
are
sort
ed
byD
T5
(Af–
T),
where
Tis
the
test
tem
pera
ture
.A
reas
corr
esp
ond
ing
toth
erm
al
mart
ensite
(Mart
),m
ixed
phase
(Mix
),sup
ere
lastic
auste
nite
(SE
)and
sta
ble
auste
nite
(Aust)
are
dem
arc
ate
d.
For
the
purp
oses
of
sta
tisticaltr
end
analy
sis
(Fig
s.
36–39),
the
Miy
azakiet
al.
71
data
were
exclu
ded
due
toth
eq
uestionab
lere
sults
as
dis
cussed
earlie
r.{X
isth
eg
lob
alsiz
eof
the
sp
ecim
en,
either
dia
mete
rfo
rd
isc
sp
ecim
ens,
or
sid
ele
ng
thfo
rsq
uare
sp
ecim
ens.
{Units5
m/c
ycle
/(M
Pa
m1/2
)m.
Ta
ble
3C
on
tin
ue
d
Robertson et al. Mechanical fatigue and fracture of Nitinol
26 International Materials Reviews 2012 VOL 57 NO 1
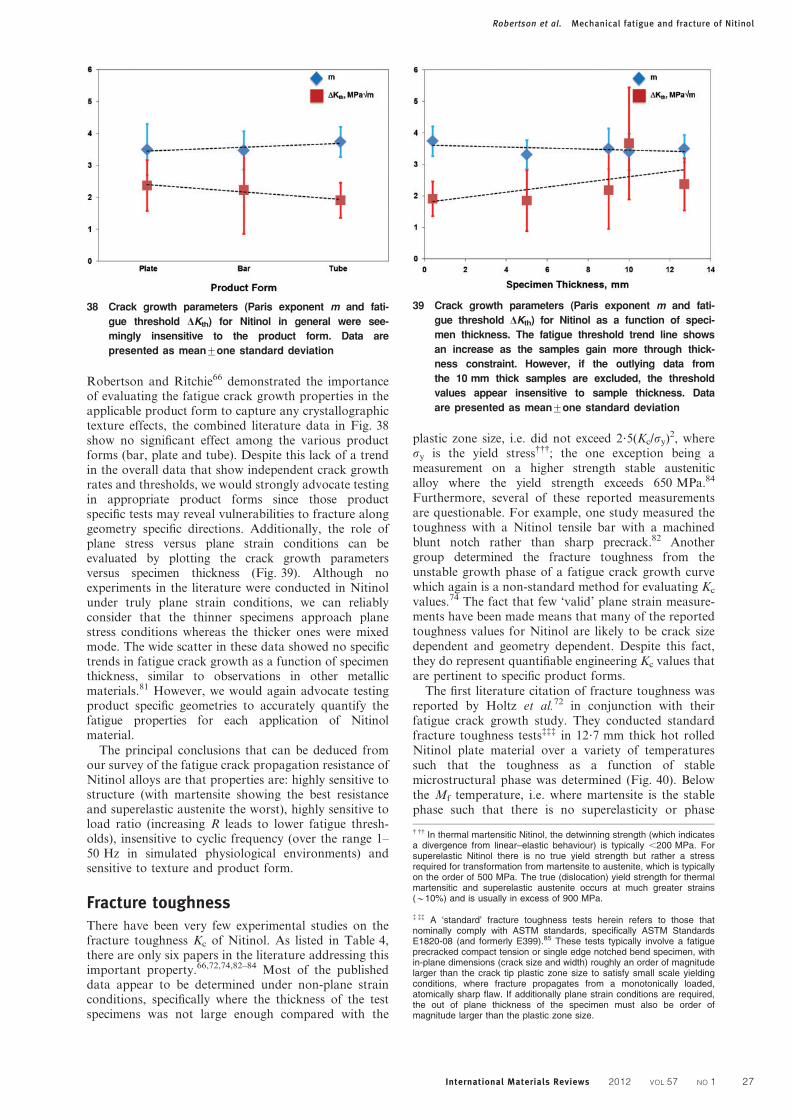
Robertson and Ritchie66 demonstrated the importanceof evaluating the fatigue crack growth properties in theapplicable product form to capture any crystallographictexture effects, the combined literature data in Fig. 38show no significant effect among the various productforms (bar, plate and tube). Despite this lack of a trendin the overall data that show independent crack growthrates and thresholds, we would strongly advocate testingin appropriate product forms since those productspecific tests may reveal vulnerabilities to fracture alonggeometry specific directions. Additionally, the role ofplane stress versus plane strain conditions can beevaluated by plotting the crack growth parametersversus specimen thickness (Fig. 39). Although noexperiments in the literature were conducted in Nitinolunder truly plane strain conditions, we can reliablyconsider that the thinner specimens approach planestress conditions whereas the thicker ones were mixedmode. The wide scatter in these data showed no specifictrends in fatigue crack growth as a function of specimenthickness, similar to observations in other metallicmaterials.81 However, we would again advocate testingproduct specific geometries to accurately quantify thefatigue properties for each application of Nitinolmaterial.
The principal conclusions that can be deduced fromour survey of the fatigue crack propagation resistance ofNitinol alloys are that properties are: highly sensitive tostructure (with martensite showing the best resistanceand superelastic austenite the worst), highly sensitive toload ratio (increasing R leads to lower fatigue thresh-olds), insensitive to cyclic frequency (over the range 1–50 Hz in simulated physiological environments) andsensitive to texture and product form.
Fracture toughnessThere have been very few experimental studies on thefracture toughness Kc of Nitinol. As listed in Table 4,there are only six papers in the literature addressing thisimportant property.66,72,74,82–84 Most of the publisheddata appear to be determined under non-plane strainconditions, specifically where the thickness of the testspecimens was not large enough compared with the
plastic zone size, i.e. did not exceed 2?5(Kc/sy)2, wheresy is the yield stress{{{; the one exception being ameasurement on a higher strength stable austeniticalloy where the yield strength exceeds 650 MPa.84
Furthermore, several of these reported measurementsare questionable. For example, one study measured thetoughness with a Nitinol tensile bar with a machinedblunt notch rather than sharp precrack.82 Anothergroup determined the fracture toughness from theunstable growth phase of a fatigue crack growth curvewhich again is a non-standard method for evaluating Kc
values.74 The fact that few ‘valid’ plane strain measure-ments have been made means that many of the reportedtoughness values for Nitinol are likely to be crack sizedependent and geometry dependent. Despite this fact,they do represent quantifiable engineering Kc values thatare pertinent to specific product forms.
The first literature citation of fracture toughness wasreported by Holtz et al.72 in conjunction with theirfatigue crack growth study. They conducted standardfracture toughness tests{{{ in 12?7 mm thick hot rolledNitinol plate material over a variety of temperaturessuch that the toughness as a function of stablemicrostructural phase was determined (Fig. 40). Belowthe Mf temperature, i.e. where martensite is the stablephase such that there is no superelasticity or phase
38 Crack growth parameters (Paris exponent m and fati-
gue threshold DKth) for Nitinol in general were see-
mingly insensitive to the product form. Data are
presented as mean¡one standard deviation
39 Crack growth parameters (Paris exponent m and fati-
gue threshold DKth) for Nitinol as a function of speci-
men thickness. The fatigue threshold trend line shows
an increase as the samples gain more through thick-
ness constraint. However, if the outlying data from
the 10 mm thick samples are excluded, the threshold
values appear insensitive to sample thickness. Data
are presented as mean¡one standard deviation
{ {{ In thermal martensitic Nitinol, the detwinning strength (which indicatesa divergence from linear–elastic behaviour) is typically ,200 MPa. Forsuperelastic Nitinol there is no true yield strength but rather a stressrequired for transformation from martensite to austenite, which is typicallyon the order of 500 MPa. The true (dislocation) yield strength for thermalmartensitic and superelastic austenite occurs at much greater strains(y10%) and is usually in excess of 900 MPa.
{ {{ A ‘standard’ fracture toughness tests herein refers to those thatnominally comply with ASTM standards, specifically ASTM StandardsE1820-08 (and formerly E399).85 These tests typically involve a fatigueprecracked compact tension or single edge notched bend specimen, within-plane dimensions (crack size and width) roughly an order of magnitudelarger than the crack tip plastic zone size to satisfy small scale yieldingconditions, where fracture propagates from a monotonically loaded,atomically sharp flaw. If additionally plane strain conditions are required,the out of plane thickness of the specimen must also be order ofmagnitude larger than the plastic zone size.
Robertson et al. Mechanical fatigue and fracture of Nitinol
International Materials Reviews 2012 VOL 57 NO 1 27

Ta
ble
4C
om
pila
tio
no
fa
llfr
ac
ture
tou
gh
ne
ss
da
tao
nN
itin
ol
allo
ys
pre
se
nte
din
the
lite
ratu
re*
Ph
ase
Refe
ren
ce
Tem
pera
ture
/uC
Pro
du
ct
Fra
ctu
reto
ug
hn
ess
Co
mp
osit
ion
/at-
%N
i
Typ
eF
orm
An
neal
Dim
en
sio
n/
mm
Mf
Ms
As
Af
Test
DT
Pla
teB
ar
Tu
be
Str
ipH
RC
DT
ime/
min
Tem
pera
ture
/uC
BX{
Kc/
MP
am
1/2
Mart
ensite
72
70
80
100
120
30
290
49. 9
X60
750
13
51
40
74
35
49
66
86
20
266
49. 4
XX
60
930
10
50
27
83
10
55
50
85
22
263
50. 3
X8
16
32
84
16
44
60
84
22
262
50. 3
X8
16
31
72
70
80
100
120
60
260
49. 9
XX
60
750
13
51
40
Mix
72
70
80
100
120
100
220
49. 9
XX
60
750
13
51
50
Sup
ere
lastic
72
70
80
100
120
120
049. 9
XX
60
750
13
51
53
82
……
,20
…20
y0
49. 9
30
150
0. 5{
3{
39
84
263
244
320
22
250. 7
X6
500
816
34
66
……
…25
37
12
50. 8
Xy
10
y500
0. 4
12
10–35
72
70
80
100
120
150
30
49. 9
XX
60
750
13
51
65
Auste
nite
84
263
244
320
150
130
50. 7
X6
500
816
53
*D
ata
are
sort
ed
byD
T5
(Af–
T).
Are
as
corr
esp
ond
ing
toth
erm
alm
art
ensite,
mix
ed
phase,
sup
ere
lastic
auste
nite
and
sta
ble
(non-t
ransfo
rmin
g)
auste
nite
are
dem
arc
ate
d.
{Bis
the
sp
ecim
en
thic
kness.
Xis
the
glo
balsiz
eof
the
sp
ecim
en,
either
dia
mete
rfo
rd
isc
sp
ecim
ens,
or
sid
ele
ng
thfo
rsq
uare
sp
ecim
ens.
{Anon-s
tand
ard
sp
ecim
en
was
used
with
gaug
ed
imensio
ns
0?56
3m
m,
and
gaug
ele
ng
thof
20
mm
.
Robertson et al. Mechanical fatigue and fracture of Nitinol
28 International Materials Reviews 2012 VOL 57 NO 1

transformation, the fracture toughness was lowest aty40 MPa m1/2. An increase in fracture toughness to53 MPa m1/2 was measured when the specimens wereraised into a mixed phase condition. A further increasein the toughness to 65 MPa m1/2 was observed when thematerial was in the superelastic austenite form (150uC,which is 30uC above Af) where the transformation tomartensite could occur in response to the stresses aheadof the crack tip.
Holtz et al.72 concluded that the increasing toughnessvalues were caused by a different mechanism of fractureat higher temperatures, citing the observation of a flatterfracture surface in the superelastic austenite sample.However, examination of their micrographs revealedfatigue striations on the superelastic Nitinol sample.Accordingly, we believe that the authors drew theirconclusions erroneously from the fatigue precrackedregion, rather than the overload fracture region, ofthe fracture surface. It is our opinion that, in actuality,the fracture mechanisms were essentially identical ineach test – martensite either preexists or is stress in-duced immediately ahead of the growing crack tip.Consequently, we would proffer an alternative explana-tion for the increase in fracture toughness with increas-ing temperature. We first note that the observedtoughness increase occurred only after the testingtemperature was raised above As (i.e. into the mixedphase region). Second, as the transformation (i.e.plateau) stress increases with increasing differentialbetween the As and test temperature, a higher appliedload would be required to initiate martensite ahead ofthe crack tip. Since the toughness is directly propor-tional to this load111, it follows that fracture toughnesswill increase as the required transformation loads riseswith increasing temperature above As. Furthermore, thetoughness values measured by Holtz et al. are allsignificantly higher than those measured in othermartensitic and superelastic Nitinol fracture studies.We are of the opinion that since the samples used in thisstudy were fully annealed (750uC, 1 h), the grain size
(most likely y100 mm) was relatively large comparedwith contemporary as thermomechanically processedmaterial (y10 mm). At these large grain sizes, therewould be very few grains in the transformation zoneahead of the growing crack tip, which could certainlydistort the toughness values measured.
He et al.82 studied the role of hydrogen embrittlementon the fatigue and fracture of Nitinol. It is unknownwhat product form of Nitinol that these researchersused, but it was clear from the text that the material wassuperelastic austenite at the test temperature (20uC).They computed a fracture toughness value of39?2¡2?8 MPa m1/2 in the virgin (non-embrittled) form.They further found that the toughness logarithmicallydecayed with increased hydrogen content as per:Kc578?8–9?8ln ct, where ct is the total hydrogenconcentration (atomic hydrogenzhydrides) measuredbetween 500 and 4200 wppm. It should be noted thatthese researchers used a highly non-standard specimengeometry for determining fracture toughness, specifi-cally, a machined notched, 20 mm gauge length tensiledogbone specimen with gauge dimensions 0?563?0 mm.Correspondingly, although the authors refer to theirmeasured values as (mode I) fracture toughnesses, amore appropriate term would be ‘notch toughness’ astheir samples did not contain a nominally atomicallysharp crack. Their toughness values are almost certainlyartificially high because the blunt notch would signifi-cantly lessen the intensity of the stress field there.Typically, the measured (apparent) fracture toughnessscales with roughly the square root of the notch rootradius.86
Using three very different product forms, respectivelybar, plate and tube ranging in thickness from 0?4 to10 mm, Vaidyanathan et al.,74 Gollerthan et al.83,84 andRobertson and Ritchie66 each measured nearly identicalfracture toughness values of y30 MPa m1/2 for super-elastic austenite. Although the fatigue crack growthbehaviour was affected significantly by the presence ofTiC inclusions, the fracture toughness values calculatedfrom the unstable growth portion of fatigue crackgrowth curves by Vaidyanathan et al.74 were similarregardless of inclusion density (0–20% inclusion volumecontent)""". Robertson and Ritchie66 presented the onlyfracture toughness values for Nitinol in the form ofrising R curve**** behaviour, which indicates the stressintensity as a function of initial crack extensionnecessary to initiate and sustain subcritical cracking(Fig. 41). Furthermore, they demonstrated a markedinfluence of the crystallographic texture on the initiationtoughness, but no crystallographic influence over steadystate growth. Specifically, toughness values at the onsetof crack extension ranged from 10 to 27 MPa m1/2, with
40 Steady state fracture toughness of Nitinol as a func-
tion of stable phase showing an upward trend from
thermal martensite to superelastic austenite; after
Holtz et al.72
" "" Although it is recognised that the unstable growth regime of a fatiguecrack growth curve is dominated by the Kmax value in the fatigue cycleapproaching the fracture toughness, determination of the fracturetoughness from such data cannot necessarily account for the role ofcyclic deformation, crack tip plasticity, crack size effects and loading rate.Therefore, Vaidyanathan et al.’s fracture toughness data should be viewedwith some caution.
**** The crack resistance or R curve provides an assessment of thefracture toughness in the presence of subcritical crack growth. It involvesmeasurements of the crack driving force, e.g. K, G or J, as a function ofcrack extension Da. The value of the driving force at DaR0 provides ameasure of the crack initiation toughness, whereas the slope or themaximum value of the R curve can be used to characterise the crackgrowth toughness.
1 11 The fracture toughness is determined from Kc5Qsapp(pa)1/2, wheresapp is the applied stress, Q is a geometric factor on the order of unity anda is the crack length (or half length).
Robertson et al. Mechanical fatigue and fracture of Nitinol
International Materials Reviews 2012 VOL 57 NO 1 29

the lowest fracture toughness occurring 45u (‘spiral’) tothe drawing direction and highest parallel (‘longitudi-nal’) to the drawing direction.
Finally, Gollerthan et al.84 examined the fracture ofNitinol using in situ synchrotron X-ray diffractionexperiments, in particular to investigate the nature ofthe structure of the transformation zone surrounding thecrack tip. Earlier researchers64 suggested that theformation of stress induced martensite could be sup-pressed ahead of a growing crack in a thick (planestrain) specimen due to constraint from the high triaxial(hydrostatic) stress field to explain trends in their fatiguecrack growth data. However, Gollerthan et al.’s diffrac-tion experiments give evidence to refute that hypothesis.Specifically, their data provided definitive crystallo-graphic evidence of fully reversible stress inducedmartensite ahead of a growing crack, which has alsobeen observed experimentally under non-plane strainconditions in thin walled flattened tube.78 Theseobservations provide some understanding why widelyvarying Nitinol product forms and microstructures (i.e.thermal martensite versus superelastic austenite) alldisplay virtually identical steady state fracture toughnessvalues of y30 MPa m1/2. Indeed, since crack growthbehaviour is most influenced by the microstructure inthe immediate vicinity of the crack tip, it is perhaps notsurprising that the fracture behaviour of a thermalmartensite specimen is nominally the same as a super-elastic austenite specimen with stress induced martensiteat the crack front. The mechanism of fracture in Nitinolchanges only when the temperatures are sufficiently high(above Md) such that the microstructure into which thecrack grows is stable austenite rather than martensite.Gollerthan et al.’s84 results show that the fracturetoughness values increase dramatically (53 MPa m1/2)for stable (non-transforming) austenite, which we wouldsuggest is associated with the increase in yield strengthconcomitant with an increase in temperature above As.
FractographyDespite its unique mechanical behaviour, the morphol-ogy of Nitinol’s fracture and fatigue surfaces is quitesimilar to conventional engineering metals. The labora-tory created fatigue specimens shown in Fig. 42 showmany important fracture characteristics for Nitinol inthe superelastic austenite condition. First, the crack
propagation path is noticeably tortuous correspondingto local variances in grain texture that either promote orsuppress the phase transformation, and consequently theyield strength and fatigue resistance of individual grains.Next, notice that stable crack growth is possible, asindicated by the presence of microcracks alongside theprimary fracture path that serve to dissipate energy andenhance fatigue life. Lastly, notice the clearly definedfatigue striations on the primary crack surface which areobserved in many low cycle or medium cycle fatiguesurfaces; these indicate the local cycle by cycle progressof the crack during fatigue crack propagation. Striationsin high cycle fatigue specimens are often absent becausethey are severely worn (or even completely obliterated)due to the long life of stable crack growth and/or spacedso fine that only high magnification microscopes arecapable of resolving them.
41 Rising R curve behaviour observed in thin walled (0?4 mm thick) superelastic austenite Nitinol tube specimens. Keq
represents the equivalent stress intensity to cause cracking. Also observed was dependence in fracture toughness
on the crack growth direction which highlights the influence of texture in this product form; after Robertson and
Ritchie66
42 Superelastic austenite Nitinol (Af525uC) laboratory
created stress controlled (R50?1) fatigue fracture in
37uC HBSS. The crack morphology is characterised
by path tortuosity corresponding to grain texture,
stable microcrack formation and striations on the pri-
mary fracture surface (see inside the crack). Striation
spacings are such that the crack was propagating at
y107 m/cycle, implying that at this location, crack
growth was occurring in the upper portion of the
Paris law regime near the Kmax dominated unstable
growth regime. Crack growth is from top left to bot-
tom right in the photograph. After Robertson and
Ritchie66
Robertson et al. Mechanical fatigue and fracture of Nitinol
30 International Materials Reviews 2012 VOL 57 NO 1

As might be expected, fatigue fractures in Nitinoloriginate in regions of local stress/strain concentration.This often coincides with surface, or near surface,inclusions. Although fatigue crack origination at inclu-sions is observable both in bench top experiments(Fig. 43) and commercial devices (Fig. 44), neither thepresence nor abundance of inclusions has been shown tohave a major deleterious effect on the fatigue life (e.g.see Fig. 10). To the contrary, as discussed earlier, whenthe volume fraction and size of inclusions conform toASTM standards for wrought Nitinol,42 they are belowthe critical flaw size for outright fracture; accordingly,fatigue lives of Nitinol alloys with normal versus extralow inclusion content are essentially the same.35,36,38
Since fatigue of both thermal martensite and super-elastic austenite material requires crack propagationthrough a martensitic phase, one would expect simila-rities between the fracture surfaces. Indeed, Figs. 45 and46 show (laboratory created) rotary bending fatiguefracture surfaces in these two phase conditions testedunder 1 and 10% alternating strain conditions. Asexpected, both phases produced a rough fracturetopography in the low cycle (high alternating strain)condition (Figs. 45b and 46b). Indeed, 10% strainconditions lead to unstable crack growth with fatiguecrack propagation through only a small percentage ofthe cross-section before complete ductile overload fail-ure (see line delimiting the regions). Conversely, underthe high cycle 1% alternating strain condition, the
thermal martensite sample (Fig. 45a) is able to sustainy50% stable crack growth over y107 cycles resulting ina relatively flat fracture through the sample before ductileoverload fracture ensued. The same 1% alternating straininput to the superelastic austenite material (Fig. 46a)resulted in medium cycle (y105) fatigue fracture.Interestingly, the superelastic austenite samples tested atboth 1 and 10% alternating strains show similar surfaceroughness typical of the fast fatigue fracture and/or finalductile overload event. Because the two samples havesignificantly different fatigue lifetimes but similar fracturesurfaces, it suggests that the majority of the fatiguelifetime in these superelastic austenitic Nitinol samples isspent in crack nucleation rather than stable crack growth.
Single event overload fractures in Nitinol are dis-tinctly different from their fatigue fractured counter-parts. Overload fracture surfaces are characterised bynecking, ductile dimpling and microvoid coalescence.This high energy fracture usually leads to rougherfracture morphologies than fatigue fractured specimens,with the exception of the near terminus area of a fatiguefractured component which is subject to the same ductileoverloading conditions as monotonically loaded speci-mens. Figures 47 and 48 respectively show that theoverload fracture surfaces in thermal martensite andsuperelastic austenite are quite similar. Figure 49 pre-sents an overload fractured commercial superelasticaustenite intravascular device that failed while in ser-vice. Notice the distinctive necking and ductile dimples
43 Stent-like diamond Nitinol fatigue specimen with laboratory created fatigue fracture showing a overview of fracture
location, b fatigue origination from a below critical flaw sized inclusion and c fatigue origin in base metal (non-inclu-
sion) region under the same fatigue loading conditions. Note the fatigue striations typical of uniaxial strain controlled
fatigue conditions; after Pelton et al.46
44 a low magnification of a commercial intravascular superelastic austenite wire based Nitinol implant that fractured in
vivo and was subsequently explanted from the patient. This relatively flat fracture surface is indicative of high cycle
bending fatigue with an origin at a near surface inclusion. b The 2 mm inclusion is well below the critical flaw size
(15–50 mm)43 for superelastic austenitic Nitinol and did not contribute to the failure, but did serve as a local stress/
strain discontinuity from which the crack nucleated. Notice the worn fatigue clamshell pattern near the fracture origin
and ductile overload at the terminus that are classical of fatigue fractures. The darkened discoloured region in the
upper right quadrant of the fracture is adherent biological material on the explanted specimen and is not part of the
native material. Images after Hull and Robertson89
Robertson et al. Mechanical fatigue and fracture of Nitinol
International Materials Reviews 2012 VOL 57 NO 1 31

that are indicative of a Nitinol overload fracture ascompared with the flatter, low energy fatigue fracture ofa different commercial device shown in Fig. 44.
Discussion and concluding remarksIt is without question that the issue of cyclic fatigueresistance is of extreme importance to the design and safeapplication of medical implant devices manufacturedfrom Nitinol alloys. Indeed, medical devices manufac-tured from any material that are expected to survivemillions of cyclic deformations over their lifetime requirescrutiny of the fatigue and fracture resistance. The phe-nomenon of fatigue is the root cause of many prematurefractures in any metallic component, and biomedicalimplants are certainly no exception. Biomedical devicesmanufactured from Nitinol (e.g. peripheral vascularstents) can experience up to 40 million loading cycleseach year. Therefore, these implants need to be designed
to survive some 108–109 fatigue cycles without failureover the lifetime of the patient. However, as noted above,by definition, such biomedical devices tend to begeometrically small with many critical components, e.g.the struts of a stent, sized well under a millimetre. Thislimitation in physical size can complicate the choice of amethodology that is most approach for their fatiguedesign and for the prediction of their safe life.
Traditionally, fatigue design and life predictionprocedures have been conducted using total life ana-lyses, either involving stress–life or strain–life data. Theutilisation of stress–life versus strain–life data requiresan understanding of the cyclic boundary conditions.Consider the cyclic loading due to the human gait onvarious places in the anatomy. A stent placed in apopliteal artery may experience cyclic bending deforma-tions of 90u in response to knee flexion and thereforerequire strain based methods. Conversely, a hip replace-ment will be subjected to cyclic loads proportional to the
45 a laboratory created low cycle rotary bending fatigue fracture of thermal martensitic Nitinol showing primarily
unstable crack growth (y25% penetration) before complete ductile overload fracture. The rough surface is compar-
able with high energy (low cycle) fatigue crack surfaces in conventional metals. Conditions: 0?6 mm diameter black
oxide wire, R521, 10% strain amplitude, room temperature, Af570uC, 1600 cycles to failure. b laboratory created high
cycle rotary bending fatigue fracture of thermal martensitic Nitinol showing stable crack growth through y50% of the
cross-section. The relatively flat fracture surface is comparable with low energy (high cycle) fatigue crack surfaces in
conventional metals. Conditions: 0?6 mm diameter black oxide wire, R521, 1% strain amplitude, room temperature,
Af570uC, y107 cycles to failure. Images after Wick et al.37 with the demarcation line separating the fatigue fracture
(below line) from the ductile overload fracture (above line)
46 a laboratory created low cycle fatigue fracture surface of superelastic austenitic Nitinol with very little (,5%) unstable
crack growth followed by high energy ductile overload (rough morphology). Conditions: 0?6 mm diameter oxide free
wire, R521, 10% strain amplitude, room temperature, Af510uC, 554 cycles to failure. b laboratory created medium
cycle fatigue fracture surface of superelastic austenitic Nitinol with limited (y10%) stable crack growth into the wire
before ductile overload fracture. Notice that the rough morphology is comparable with the low cycle fatigue specimen
a suggesting that the majority of fatigue life is spent in nucleation rather than propagation. Conditions: 0?6 mm dia-
meter oxide free wire, R521, 1% strain amplitude, room temperature, Af510uC, 11,448 cycles to failure. Images after
Wick et al.37 with the demarcation line separating the fatigue fracture (below line) from the ductile overload fracture
(above line)
Robertson et al. Mechanical fatigue and fracture of Nitinol
32 International Materials Reviews 2012 VOL 57 NO 1

weight of the patient in response to each footstep andhence require a stress based approach. In the currentcommercial landscape, nearly all biomedical implantsthat utilise Nitinol are in deformation/strain controlledenvironments. As Nitinol’s usage broadens into theorthopaedic environment or non-medical applications,
this trend may shift to include more stress controlledconditions.
Constant life diagrams based upon total life experi-ments, such as those presented in Figures 20 and 22 areessential in understanding the material characteristicsspecific to Nitinol. These plots are created using test(coupon) specimens cycled under a variety of deforma-tion conditions. This approach relies on the fatigue oflarge numbers of specimens in order to produce astatistically viable sampling to provide quantitativematerial properties. As it is generally impractical torepeat these tests for every iterative design, instead, wewould encourage the use of the appropriate literaturedata as a guideline for evaluating material design ofNitinol medical devices. Device specific testing issubsequently performed on a much smaller number ofsamples after the design has passed the ‘litmus’ test ofthe literature constant life data for Nitinol (e.g. pulsatilefatigue of stents in Fig. 23). Specifically, ‘fatigue to life’experiments using commercially manufactured compo-nents such that the thermomechanical history andsurface characteristics (e.g. presence of flaws) arerepresentative of the end product are generally requiredto demonstrate device specific resistance to fatigueloading conditions that accurately simulate the dutycycle and life of a product.
Damage tolerant approaches relying on fracturemechanics based crack growth data have been proposed
47 a laboratory created monotonic tensile overload specimen of thermal martensitic Nitinol showing classic necking with
subsequent ‘cup and cone’ fracture common in ductile metals. b higher magnification fractograph of the thermal mar-
tensitic Nitinol sample shown in Fig. 45a. Conditions: 0?6 mm diameter black oxide wire, 2?5 mm min21 strain rate,
room temperature, Af570uC
48 a laboratory created monotonic tensile overload sample of superelastic austenitic Nitinol showing a similar necked
and ‘cup and cone’ fracture surface to the thermal martensite sample shown in Fig. 45. b higher magnification fracto-
graph of the superelastic austenite Nitinol sample shown in Fig. 49a. Conditions: 0?6 mm diameter oxide free wire,
2?5 mm min21 strain rate, room temperature, Af510uC
49 Commercial superelastic austenitic Nitinol intravascu-
lar device that fractured in service due to single
event, high energy ductile overload failure. Notice the
necking of this laser cut tubular product and dimpling
on the fracture surface that is indicative of classical
ductile overload fracture
Robertson et al. Mechanical fatigue and fracture of Nitinol
International Materials Reviews 2012 VOL 57 NO 1 33

and successfully applied to larger implant devices suchas metallic and pyrolytic carbon mechanical heart valveprostheses.87,88 However, this approach has not yetfound utility in the current commercial landscape ofNitinol cardiovascular implants. As the damage tolerantmethodology is based solely on the crack propagationlife, it assumes that no time is spent in crack initiationand is thus inherently conservative in predicting safelifetimes, which can then be presented as a function ofthe size of any such preexisting flaws. This approach willbecome important in Nitinol applications where thedimensions of the devices are on the order of centimetressuch as orthopaedic implants such that the implant canwithstand stable crack growth without complete failure.For now, however, the usefulness of the damage tolerantapproach for physically small (smallest feature (1 mm)Nitinol devices is in quantifying a critical flaw size,below which fatigue crack growth can be considereddormant. This critical flaw size may be used for qualitycontrol procedures to establish inspection pass/failurecriterion for use during visual inspection of parts forsurface defects.
To appreciate the utility of these different approaches,Robertson and Ritchie constructed a useful diagram(Fig. 50) that unified the total life, damage tolerant andfracture toughness data into a single design tool fordetermination of product susceptibility to overload and/or fatigue fracture.43 This diagram plots the maxi-mum expected flaw size (which corresponds to visual
inspection acceptance criteria) versus the maximumstress intensity (corresponding to single event overloadssuch as crimping of a stent into its delivery catheter) andalternating stress intensity (corresponding to the cyclicloads experienced while in service). The diagram,however, is still somewhat limited in its usefulness sinceit is presented in terms of stress rather than strain.Indeed, superelasticity of Nitinol manifests as non-unique stress conditions when the specimen experiencesstresses/strains anywhere on the upper or lower plateau.However, its benefit is as a design tool for evaluatingsuperelastic austenite material specific designs since itcombines the data from multiple researchers into asingle diagram.
Acknowledgements
Support for SWR and ARP was provided by NitinolDevices and Components (NDC), Fremont, CA. Theinvolvement of ROR was funded by the Director, Officeof Science, Office of Basic Energy Sciences, Division ofMaterials Sciences and Engineering, of the USDepartment of Energy under contract no. DE-AC02-05CH11231.
References1. K. Otsuka: ‘Introduction to the R-phase transition’, in
‘Engineering aspects of shape memory alloys’, (ed. T. W. Duerig
et al.), 36–45; 1990, London, Butterworth-Heinemann.
2. K. Otsuka and X. Ren: ‘Physical metallurgy of Ti–Ni-based shape
memory alloys’, Prog. Mater. Sci., 2005, 50, 511–678.
3. T. W. Duerig, K. N. Melton, D. Stockel and C. M. Wayman:
‘Engineering aspects of shape memory alloys’; 1990, London,
Butterworth-Heinemann.
4. K. Bhattacharya: ‘Microstructure of martensite’, 288; 2003,
Oxford, Oxford University Press.
5. T. Duerig, A. Pelton and D. Stoeckel: ‘An overview of nitinol
medical applications’, Mater. Sci. Eng. A, 1999, A273–A275, 149–
160.
6. D. Stockel, A. R. Pelton and T. Duerig: ‘Self-expanding Nitinol
stents: material and design considerations’, Eur. Radiol., 2004, 14,
292–301.
7. A. R. Pelton, J. DiCello and S. Miyazaki: ‘Optimisation of
processing and properties of medical-grade Nitinol wire’, Min.
Invas. Ther. Allied Technol., 2000, 9, 107–118.
8. A. Wohler: ‘Uber die Festigkeitsversuche mit Eisen and Stahl’,
Zeitschrift Bauwesen, 1870, 20, 73–106.
9. L. F. Coffin, Jr and J. F. Tavernelli: ‘The cyclic straining and
fatigue of metals’, Trans. Am. Inst. Min. Eng., 1959, 215, 794–807.
10. S. S. Manson: ‘Thermal stress and low cycle fatigue’, 125–192;
1966, New York, McGraw-Hill.
11. J. D. Morrow: ‘Cyclic plastic strain energy and fatigue of metals’,
in ‘Internal friction, damping, and cyclic plasticity’, 45–87; 1965,
Philadelphia, PA, ASTM.
12. P. C. Paris and F. Eredogan: ‘A critical analysis of crack
propagation laws’, J. Bas. Eng. (Trans. ASME Ser. D), 1961, 85,
528–534.
13. K. N. Melton and O. Mercier: ‘Fatigue of NiTi thermoelastic
martensites’, Acta Metall., 1979, 27, (1), 137–144.
14. K. N. Melton and O. Mercier: ‘The effect of the martensitic phase
transformation on the low cycle fatigue behaviour of polycrystal-
line Ni–Ti and Cu–Zn–Al alloys’, Mater. Sci. Eng., 1979, 40, (1),
81–87.
15. S. Miyazaki, Y. Kohiyama, K. Otsuka and T. W. Duerig: ‘Effects
of several factors on the ductility of the Ti–Ni alloy’, Mater. Sci.
Forum, 1990, 56–58, 765–770.
16. S. Miyazaki, T. Imai, Y. Igo and K. Otsuka: ‘Effect of cyclic
deformation on the pseudoelasticity characteristics of Ti–Ni
alloys’, Metall. Trans. A, 1986, 17A, 115–120.
17. S. Miyazaki: ‘Thermal and stress cycling effects and fatigue
properties of NiTi alloys’, in ‘Engineering aspects of shape memory
alloys’, (ed. T. W. Duerig et al.), 394–413; 1990, London,
Butterworth-Heinemann.
50 Robertson et al. combined data from multiples
researchers into this diagram that unifies total life,
damage tolerant and fracture toughness of Nitinol in
the superelastic austenite condition into a single
design tool. Crack length corresponds to the maxi-
mum expected flaw in the material, which can be
equated to the minimum surface flaw detectable dur-
ing visual inspection procedures. The maximum
stress intensity specifically addresses single event
excursions in the deformation or load input to the
device such as those experienced during crimping of
a stent into a catheter. Lastly, the stress intensity
range coincides with the alternating cyclic fatigue
boundary conditions experienced by the Nitinol device
during its lifetime. Reprinted with permission from
Robertson and Ritchie43
Robertson et al. Mechanical fatigue and fracture of Nitinol
34 International Materials Reviews 2012 VOL 57 NO 1

18. L. C. Brinson, I. Schmidt and R. Lammering: ‘Stress-induced
transformation behavior of a polycrystalline NiTi shape memory
alloy: micro and macromechanical investigations via in situ optical
microscopy’, J. Mech. Phys. Solids, 2004, 52, (7), 1549–1571.
19. D. M. Norfleet, P. M. Sarosi, S. Manchiraju, M. F. X. Wagner,
M. D. Uchic, P. M. Anderson and M. J. Mills: ‘Transformation-
induced plasticity during pseudoelastic deformation in Ni–Ti
microcrystals’, Acta Mater., 2009, 57, (12), 3549–3561.
20. N. Ono and A. Sato: ‘Plastic deformation governed by the stress
induced martensitic transformation in polycrystals’, Trans. Jpn
Inst. Met., 1988, 29, 267–273.
21. N. Ono, A. Satoh and H. Ohta: ‘A discussion on the mechanical
properties of shape memory alloys based on a polycrystal model’,
Trans. Jpn Inst. Met., 1989, 30, (10), 756–764.
22. S. Miyazaki, Y. Sugaya and K. Otsuka: ‘Effects of various factors
on fatigue life of Ti–Ni alloys’, Proc. MRS Int. Meet. on ‘Advanced
materials’, Tokyo, Japan, May–June 1988, MRS, Vol. 9, 251–256.
23. A. R. Pelton, T. Duerig and D. Stockel: ‘ A guide to shape memory
and superelasticity in nitinol medical devices’, Min. Invas. Ther.
Allied Technol., 2004, 13, (4), 218–221.
24. A. R. Pelton, J. DiCello and S. Miyazaki: ‘Optimization of
processing and properties of medical-grade nitinol wire’, Proc. Int.
Conf. on ‘SMST’, Pacific Grove, CA, USA, April–May 2000,
International Organization on SMST, 361–374.
25. K. N. Melton and O. Mercier: ‘Fatigue of NiTi and CuZnAl shape
memory alloys’, Proc. 5th Int. Conf. on ‘The strength of metals and
alloys’, (ed. P. Haasen), 1243–1248; 1979, Oxford, Pergamoon
Press.
26. J. J. Lewandowski and P. Lowhaphandu: ‘Effects of hydrostatic
pressure on mechanical behaviour and deformation processing of
materials’, Int. Mater. Rev., 1998, 43, (4), 145–187.
27. T. Buchheit and J. Wert: ‘Modeling the effects of stress state and
crystal orientation on the stress-induced transformation of NiTi
single crystals’, Metall. Mater. Trans. A, 1994, 25A, (11), 2383–
2389.
28. T. Buchheit and J. Wert: ‘Predicting the orientation-dependent
stress-induced transformation and detwinning response of shape
memory alloy single crystals’, Metall. Mater. Trans. A, 1996, 27A,
(2), 269–279.
29. K. Gall and H. Sehitoglu: ‘The role of texture in tension–
compression asymmetry in polycrystalline NiTi’, Int. J. Plast.,
1999, 15, (1), 69–92.
30. K. Gall, H. Sehitoglu, Y. I. Chumlyakov and I. V. Kireeva:
‘Tension–compression asymmetry of the stress–strain response in
aged single crystal and polycrystalline NiTi’, Acta Mater., 1999, 47,
(4), 1203–1217.
31. M. Barney, D. Xu, S. W. Robertson, V. Schroeder, R. O. Ritchie,
A. R. Pelton and A. Mehta: ‘Impact of thermomechanical texture
on the superelastic response of nitinol implants’, J. Mech. Behav.
Biomed. Mater., 2011, 4, 1431–1439.
32. S. S. Manson and G. R. Halford: ‘Fatigue and durability of
structural materials’; 2006, Materials Park, OH, ASM
International.
33. Y. Kim and S. Miyazaki: ‘Fatigue life of Ti–50 at.% Ni and Ti–
40Ni–10Cu (at.%) shape memory alloy wires’, Proc. 2nd Int. Conf.
on ‘SMST’, Asilomar, CA, USA, March 1997, International
Organization on SMST, 473–478.
34. S. Miyazaki, K. Mizukoshi, T. Ueki, T. Sakuma and Y. Liu:
‘Fatigue life of Ti–50 at% Ni and Ti–40Ni–10 Cu (at.%) shape
memory alloy wires’, Mater. Sci. Eng. A, 1999, A273–A275, 658–
663.
35. M. Reinoehl, D. Bradley, R. Bouthot and J. Proft: ‘The influence
of melt practice on final fatigue properties of superelastic NiTi
wires’, Proc. Int. Conf. on ‘SMST’, Pacific Grove, CA, USA,
April–May 2000, International Organization on SMST, 397–403.
36. J. Sheriff, A. R. Pelton and L. A. Pruitt: ‘Hydrogen effects on
nitinol fatigue’, Proc. ASM Materials & Processes for Medical
Devices Conf., Minneapolis, MN, USA, August 2004, ASM
International, 38–43.
37. A. Wick, X.-Y. Gong, J. Fino, J. Sheriff and A. R. Pelton: ‘Bending
fatigue characteristics of nitinol’, Proc. ASM Materials & Processes
for Medical Devices Conf., Minneapolis, MN, USA, August 2004,
ASM International, 15–20.
38. N. Morgan, A. Wick, J. DiCello and R. Graham: ‘Carbon and
oxygen levels in nitinol alloys and the implications for medical
device manufacture and durability’, Proc. Int. Conf. on ‘SMST’,
Pacific Grove, CA, USA, May 2006, ASM International, 821–828.
39. B. T. Berg: ‘Bending of superelastic wires: Part I – experimental
aspects’, J. Appl. Mech., 1995, 62, 459–466.
40. A. Wick, O. Vohringer and A. Pelton: ‘The bending behavior of
NiTi’, J. Phys. IV, 1995, 5, 789–794.
41. S. Suresh: ‘Fatigue of materials’; 1998, Cambridge, Cambridge
University Press.
42. ‘Standard specification for wrought nickel–titanium shape memory
alloys for medical devices and surgical implants’, F2063-05, ASTM
International, West Conshohocken, PA, USA, 2005.
43. S. W. Robertson and R. O. Ritchie: ‘A fracture-mechanics-based
approach to fracture control in biomedical devices manufactured
from superelastic Nitinol tube’, J. Biomed. Mater. Res. Part B:
Appl. Biomater., 2008, 84, 26–33.
44. T. W. Duerig, D. E. Tolomeo and M. Wholey: ‘An overview of
superelastic stent design’, Min. Invas. Ther. Allied Technol., 2000, 9,
(3/4), 235–246.
45. T. W. Duerig: ‘The use of superelasticity in modern medicine’,
MRS Bull., Feb. 2002, 101–104.
46. A. R. Pelton, V. Schroeder, M. R. Mitchell, X.-Y. Gong, M.
Barney and S. W. Robertson: ‘Fatigue and durability of nitinol
stents’, J. Mech. Behav. Biomed. Mater., 2008, 1, 153–164.
47. A. R. Pelton: ‘Nitinol fatigue: a review of microstructures and
mechanisms’, J. Mater. Eng. Perform., 2010, 20, (4–5), 613–617.
48. G. R. Zadno and T. W. Duerig: ‘Linear and non-linear super-
elasticity in NiTi’, Proc. MRS Int. Meeting on ‘Advanced
materials’, Tokyo, Japan, May–June 1988, MRS, 201–206.
49. R. M. Tabanli, N. K. Simha and B. T. Berg: ‘Mean stress effects on
fatigue of NiTi’, Mater. Sci. Eng. A, 1999, A273–A275, 644–648.
50. R. M. Tabanli, N. K. Simha and B. T. Berg: ‘Mean strain effects on
the fatigue properties of superelastic NiTi’, Metall. Mater. Trans.
A, 2001, 32A, (7), 1866–1869.
51. D. Tolomeo, S. Davidson and M. Santinoranout: ‘Cyclic properties
of superelastic nitinol: design implications’, Proc. Int. Conf. on
‘SMST’, Pacific Grove, CA, USA, April–May 2000, International
Organization on SMST, 409–417.
52. N. B. Morgan, J. Painter and A. Moffat: ‘Mean strain effects and
microstructural observations during in vitro fatigue testing of NiTi’,
Proc. Int. Conf. on ‘SMST’, Pacific Grove, CA, USA, May 2003,
International Organization on SMST, 303–310.
53. A. R. Pelton, X.-Y. Gong and T. W. Duerig: ‘Fatigue testing of
diamond-shaped specimens’, Proc. Int. Conf. on ‘SMST’, Pacific
Grove, CA, USA, May 2003, International Organization on SMST,
293–302.
54. M. R. Mitchell: ‘Fundamentals of modern fatigue analysis for
design’, in ‘ASM handbook’, ‘Fatigue and fracture’, 227–262; 1996,
Materials Park, OH, ASM International.
55. E. Macherauch: ‘Praktikum in werkstoffkunde’; 2002, Wiesbaden,
Friedrich Vieweg & Sohn Verlagsgesellschaft mbH.
56. N. Rebelo and M. Perry: ‘Finite element analysis for the design of
nitinol medical devices’, Min. Invas. Ther. Allied Technol., 2000, 9,
(2), 453–462.
57. N. Rebelo, M. Hsu and H. Foadian: ‘Simulation of superelastic
alloys behavior with ABAQUS’, Proc. Int. Conf. on ‘SMST’,
Pacific Grove, CA, USA, April–May 2000, International
Organization on SMST, 457–469.
58. A. Runciman, D. Xu, A. R. Pelton and R. O. Ritchie: ‘An
equivalent strain/Coffin–Manson approach to multiaxial fatigue
and life predition in superelastic Nitinol medical devices’,
Biomaterials, 2011, 32, (22), 4987–4993.
59. E. Patoor, P. Barbe, A. Eberhardt and M. Berveiller: ‘Internal
stress effect in the shape memory behaviour’, J. Phys. IV, 1991, 5,
95–100.
60. Y. Liu and P. G. McCormick: ‘Thermodynamic analysis of the
martensitic transformation in NiTi. I. Effect of heat treatment on
transformation behaviour’, Acta Metall. Mater., 1994, 42, (7),
2401–2406.
61. P. G. McCormick and Y. Liu: ‘Thermodynamic analysis of the
martensitic transformation in NiTi. II. Effect of transformation
cycling’, Acta Metall. Mater., 1994, 42, (7), 2407–2413.
62. K. N. Smith, P. Watson and T. H. Topper: ‘A stress–strain
function for the fatigue of metals’, J. Mater. JMLSA, 1970, 5, (4),
767–778.
63. A. L. McKelvey and R. O. Ritchie: ‘Fatigue-crack propagation in
Nitinol, a shape-memory and superelastic endovascular stent
material’, J. Biomed. Mater. Res. Part A, 1999, 47A, (3), 301–308.
64. A. L. McKelvey and R. O. Ritchie: ‘Fatigue-crack growth behavior
in the superelastic and shape-memory alloy Nitinol’, Metall. Mater.
Trans. A, 2001, 32, (3), 731–743.
65. J. M. Stankiewicz, S. W. Robertson and R. O. Ritchie: ‘Fatigue-
crack growth properties of thin-walled superelastic austenitic
Nitinol tube for endovascular stents’, J. Biomed. Mater. Res.
Part A, 2007, 81A, (3), 685–691.
Robertson et al. Mechanical fatigue and fracture of Nitinol
International Materials Reviews 2012 VOL 57 NO 1 35

66. S. W. Robertson and R. O. Ritchie: ‘In vitro fatigue-crack growth
and fracture toughness behavior of thin-walled superelastic Nitinol
tube for endovascular stents: a basis for defining the effect of crack-
like defects’, Biomaterials, 2007, 28, 700–709.
67. J. L. Proft, K. N. Melton and T. W. Duerig: ‘Transformation
cycling of Ni–Ti and Ni–Ti–Cu shape memory alloys’, Proc. MRS
Int. Meet. on ‘Advanced materials’, Tokyo, Japan, May–June
1988, MRS, 159–164.
68. A. Mehta, X.-Y. Gong, V. Imbeni, A. R. Pelton and R. O. Ritchie:
‘Understanding the deformation and fracture of nitinol endovas-
cular stents using in situ synchrotron X-ray micro-diffraction’, Adv.
Mater., May 2007, 19, 1183–1186.
69. R. V. Marrey, R. Burgermeister, R. B. Grishaber and R. O.
Ritchie: ‘Fatigue and life prediction for cobalt-chromium stents: a
fracture mechanics analysis’, Biomaterials, 2006, 27, (9), 1988–
2000.
70. R. H. Dauskardt, T. W. Duerig and R. O. Ritchie: ‘Effects of in situ
phase transformation on fatigue-crack propagation in titanium–
nickel shape-memory alloys’, Proc. MRS Int. Meet. on ‘Advanced
materials’, Tokyo, Japan, May–June 1988, MRS, Vol. 9, 243–249.
71. S. Miyazaki, M. Suizu, K. Otsuka and T. Takashima: ‘Effect of
various factors on fatigue crack propagation rate in Ti–Ni alloys’,
Proc. MRS Int. Meet. on ‘Advanced materials’, Tokyo, Japan,
May–June 1988, Vol. 9, 263–268.
72. R. L. Holtz, K. Sadananda and M. A. Imam: ‘Fatigue thresholds
of Ni–Ti alloy near the shape memory transition temperature’, Int.
J. Fatigue, 1999, 21, S137–S145.
73. A. Ohta, N. Suzuki and T. Mawari: ‘Effect of Young’s modulus on
basic crack propagation properties near the fatigue threshold’, Int.
J. Fatigue, 1992, 14, (4), 224–226.
74. R. Vaidyanathan, D. C. Dunand and U. Ramamurty: ‘Fatigue
crack-growth in shape-memory NiTi and NiTi–TiC composites’,
Mater. Sci. Eng. A, 2000, A289, (1–2), 208–216.
75. P. Filip, M. Paliwal and K. Mazanec: ‘Fatigue crack propagation
in pseudoelastic TiNi smart microcomponents’, Zeitschrift Metall.,
2004, 95, 356–361.
76. S. Gao and S. Yi: ‘Experimental study on the anisotropic behavior
of textured NiTi pseudoelastic shape memory alloys’, Mater. Sci.
Eng. A, 2003, A362, (1–2), 107–111.
77. S. W. Robertson, X. Y. Gong and R. O. Ritchie: ‘Effect of product
form and heat treatment on the crystallographic texture of
austenitic Nitinol’, J. Mater. Sci., 2006, 41, (3), 621–630.
78. S. W. Robertson, A. Mehta, A. R. Pelton and R. O. Ritchie:
‘Evolution of crack-tip transformation zones in superelastic Nitinol
subjected to in situ fatigue: A fracture mechanics and synchrotron
X-ray microdiffraction analysis’, Acta Mater., 2007, 55, (18), 6198–
6207.
79. K. Gall, J. Tyber, G. Wilkesanders, S. W. Robertson, R. O. Ritchie
and H. J. Maier: ‘Effect of microstructure on the fatigue of hot-
rolled and cold-drawn NiTi shape memory alloys’, Mater. Sci. Eng.
A, 2008, A486, (1–2), 389–403.
80. R. O. Ritchie and J. Lankford: ‘Small fatigue cracks: a statement of
the problem and potential solutions’, Mater. Sci. Eng., 1986, 84,
11–17.
81. R. O. Ritchie, R. F. Smith and J. F. Knott: ‘Effects of thickness on
fibrous fracture from a notch and on fatigue-crack propagation in
low-strength steel’, Met. Sci. 1975, 9, (11), 485–492.
82. J. Y. He, K. W. Gao, Y. J. Su, L. J. Qiao and W. Y. Chu: ‘The role
of hydride, martensite and atomic hydrogen in hydrogen-induced
delayed fracture of TiNi alloy’, Mater. Sci. Eng. A, 2004, A364, (1–
2), 333–338.
83. S. Gollerthan, D. Herberg, A. Baruj and G. Eggeler: ‘Compact
tension testing of martensitic/pseudoplastic NiTi shape memory
alloys’, Mater. Sci. Eng. A, 2008, A481–A482, 156–159.
84. S. Gollerthan, M. L. Young, A. Baruj, J. Frenzel, W. W. Schmahl
and G. Eggeler: ‘Fracture mechanics and microstructure in NiTi
shape memory alloys’, Acta Mater., 2009, 57, (4), 1015–1025.
85. ‘Standard test method for measurement of fracture toughness’,
E1820-08, ASTM International, West Conshohocken, PA, USA,
2008.
86. R. O. Ritchie, B. Francis and W. L. Server: ‘Evaluation of
touchness in AISI 4340 alloy steel austenitized at low and high
temperatures’, Metall. Trans. A, 1976, 7A, (6), 831–837.
87. R. O. Ritchie and P. Lubock: ‘Fatigue life estimation procedures
for the endurance of a cardiac valve prosthesis: stress/life and
damage-tolerant analyses’, J. Biomech. Eng. Trans. ASME, 1986,
108, 153–160.
88. R. O. Ritchie: ‘Fatigue and fracture of pyrolytic carbon: a damage-
tolerant approach to structural integrity and life prediction in
‘ceramic’ heart-valve prostheses’, J. Heart Valve Dis., 1996, 5,
(Suppl. 1), S9–S22.
89. J. E. Hull and S. W. Robertson: ‘Bard recovery filter: evaluation
and management of vena cava limb perforation, fracture, and
migration’, J. Vasc. Interv. Radiol., 2009, 20, (1), 52–60.
Robertson et al. Mechanical fatigue and fracture of Nitinol
36 International Materials Reviews 2012 VOL 57 NO 1