Embed Size (px)
Citation preview

Mechanical and metallurgical properties of dissimilar metal joints using novel joining techniques
ASHCROFT, Emma Jane
Available from Sheffield Hallam University Research Archive (SHURA) at:
http://shura.shu.ac.uk/17350/
This document is the author deposited version. You are advised to consult the publisher's version if you wish to cite from it.
Published version
ASHCROFT, Emma Jane (2008). Mechanical and metallurgical properties of dissimilar metal joints using novel joining techniques. Doctoral, Sheffield Hallam University.
Copyright and re-use policy
See http://shura.shu.ac.uk/information.html
Sheffield Hallam University Research Archivehttp://shura.shu.ac.uk

Sheffield HaHsm University Learning a n d IT Services
A d s e tts Centre City Campus
Sheffield S1 1WB
REFERENCE

M echanical and M etallurgical Properties o f
D issim ilar M etal Joints U sing N ovel Joining
Techniques
Emma Jane Ashcroft
A thesis submitted in partial fulfilment o f the requirements o f Sheffield
Hallam University for the degree o f Doctor o f Philosophy
October 2008
Collaborating Organisations:
The Engineering and Physical Sciences Research Council
Outokumpu Stainless Research Foundation

Abstract
In recent years there have been significant new developments in welding processes for
jo in ing stainless steel and dissim ilar metals. This is associated with the rise in interest o f using stainless steel in the automotive industry from both car manufacturers and stainless steel producers. The main reason for using stainless steel within the automotive industry is the combination o f formability and high strength but also the improved corrosion resistance when compared to zinc coated mild steel.
This research explores the mechanical and metallurgical properties o f dissim ilar metal jo in ing and determines a relationship between the fatigue properties and weld geometry. The research focuses on the relatively unexplored join ing techniques o f Laser Hybrid W elding and Cold Metal Transfer applied to jo in ing stainless steel grades Hy-Tens
1000 and LDX 2101 to Dogal 260RP-X mild steel. The joints are assessed in terms o f
tensile, fatigue and metallurgical properties.
Experimental results and analysis show that the fatigue properties o f both laser hybrid w elding and cold metal transfer join ts are a linear relationship with a negative gradient to value o f the root angle on the mild steel side of the joints, as the angle at the root decreases the fatigue life increases.
It was found that when join ing the material combinations outlined in this research with Laser Hybrid W elding the resulting solidified weld pool was chem ically inhomogeneous. However, welds produced using Cold Metal Transfer resulted in a chemically hom ogenous weld pool and consistent microhardness.
Comparisons with laser welding show that laser hybrid welding and cold metal transfer can produce joints with mechanical properties comparable to welding methods currently being used in the automotive industry, for example, laser welding.
2

Acknowledgements
The author would like to express thanks to the follow ing people who without their help
and guidance this work would never have been completed. To m y supervisor Professor
Alan Smith for continually providing support and encouragement and to Professor
Staffan Hertzman, Hans Nordberg and David Dulieu for their expertise.
A special thanks to all the technical support I have received throughout m y research
with particular thanks going to, Johan Tolling and Pal Dyberg o f ESAB Process and
Development Centre, Ingemar Aslieng, Marcus Andersson and all staff at the Avesta
Research Centre for all the help and support I received and w elcom ing me to Avesta. To
all the technical support staff at Sheffield Hallam University with a special thanks going
John Bradshaw, Steve M agowen, Tim O ’Hara and John Vickers.
I would like to express gratitude to the fellow members o f the Outokumpu research
group at SHU for entertainment and thought provoking conversation throughout: Andy
Clifton, Jamie M oschin i and Frank Burgin.
I would also like to thank the Outukumpu Research Foundation and EPSRC for
financial support throughout the research.
Finally a huge thank you to my fam ily and friends for their support and a special thanks
to Shaun who has put up with me throughout the research and encouraged me to get it
done!
3

List of Contents
1 Introduction ......................................................................................................................21
1.1 Objectives.................................................................................................................23
2 Literature R ev iew.....................................................................................
2.1 Laser W eld ing..........................................................................................................24
2.1.1 M echanism o f Laser W eld ing........................................................................25
2.1.2 Advantages and Limitations o f Laser W elding............................................27
2.1.3 Applications o f Laser W eld ing......................................................................28
2.2 Gas Metal Arc W elding (G M AW )........................................................................30
2.2.1 M echanism o f Gas Metal Arc W eld in g....................................................... 31
2.2.2 Shielding Gases used in Gas Metal Arc W eld ing........................................33
2.2.3 Advantages and Limitations o f Gas Metal Arc Welding (G M A W ) 34
2.3 N ovel Joining Techniques........................................................................................35
2.3.1 Laser Hybrid W elding.....................................................................................35
2.3.1.1 Advantages o f Laser Hybrid W elding..................................................... 38
2.3.1.2 Applications o f Laser Hybrid W elding Process.....................................39
2.3.2 Cold Metal Transfer.........................................................................................40
2.3.2.1 Applications o f Cold Metal Transfer...................................................... 42
2.3.2.2 Advantages and Limitations o f Cold Metal Transfer..............................43
2.4 Materials.....................................................................................................................44
2.4.1 Stainless S tee l..................................................................................................44
2.4.1.1 Austenitic Stainless Steels...........................................................................44
2.4.1.2 Duplex Stainless S tee ls...............................................................................45
2.4.2 Zinc Coated M ild S tee l...................................................................................46
2.5 Effect o f the Zinc Coating During W elding o f D issim ilar M etals.....................48
2.6 Dissim ilar Metal Joining o f Stainless Steel to Zinc Coated M ild S tee l 50
2.7 Fatigue........................................................................................................................53
2.7.1 Stress R a tio.......................................................................................................54
2.7.2 Stress C ycle.......................................................................................................55
2.7.3 Staircase Fatigue T esting................................................................................57
2.7.4 Fatigue Failure M echanism.............................................................................59
2.7.5 Factors A ffecting Fatigue Properties............................................................61
2.7.5.1 Geometrical Factors.....................................................................................61
2 .1 .5 2 Environmental Factors................................................................................62
4

2 .1 .5 3 Rotation.........................................................................................................63
2.7.6 Fatigue Testing o f D issim ilar Laser Hybrid W elded Joints....................65
2.7.7 Fatigue Testing o f D issim ilar Cold Metal Transfer Joints......................65
2.8 Effect o f W eld Geometry on Fatigue Properties..................................................66
2.9 Summary o f Literature R ev iew.............................................................................68
3 Experimental Procedure..................................................................................................69
3.1 Introduction ...............................................................................................................69
3.2 W eld Sample Geom etry...........................................................................................69
3.3 Laser Hybrid W elding..............................................................................................70
3.3.1 Joint Geom etry.................................................................................................71
3.3.2 W eld Optimisation for Laser Hybrid W elded Butt Joints..........................72
3.3.3 W eld Optimisation o f Laser Hybrid W elded Lap Joints............................74
3.4 Cold Metal Transfer.................................................................................................76
3.4.1 W eld Optimisation for Cold Metal Transfer Butt Joints...........................77
3.5 Sample Identification...............................................................................................78
3.5.1 Laser Hybrid W elded Butt Joint Sam ples.................................................... 78
3.5.2 Laser Hybrid W elded Lap Joint Sam p les.................................................... 79
3.5.3 Cold Metal Transfer Butt Joints.....................................................................79
3.6 Mechanical T esting..................................................................................................80
3.6.1 Tensile T esting.................................................................................................80
3.6.1.1 Tensile specim ens.......................................................................................80
3.6.1.2 Tensile Testing Equipm ent........................................................................81
3.6.2 Fatigue Testing.................................................................................................82
3.6.2.1 Staircase Fatigue m ethod...........................................................................84
3.7 Metallographic Examination...................................................................................87
3.7.1 E tch ing.............................................................................................................87
3.7.2 Hardness Testing.............................................................................................89
3.7.3 Grain Size A nalysis.........................................................................................91
3.7.4 Optical Light M icroscopy..............................................................................92
3.7.4.1 Fatigue Failure A n a lys is............................................................................92
3.7.4.2 Heat A ffected Zone (HAZ) M easurements...............................................92
3.7.4.3 Penetration Angle M easurem ents.............................................................93
3.7.5 Infinite Focus M icroscopy.............................................................................94
3.7.6 SEM Exam ination...........................................................................................95
3.7.6.1 W eld Bead Chemical C om positions............................... 95
5

3.7.6.2 Elemental M apping......................................................................................96
4 R esu lts...............................................................................................................................97
4.1 Material Characterisation.......................................................................................97
4.1.1 Parent M aterials................................................................................................98
4.1.1.1 Chemical Com position................................................................................98
4.1.1.2 M echanical Properties.................................................................................99
4.1.1.3 Zinc Coating..............................................................................................100
4.1.1.4 M etallurgy...................................................................................................101
4.1.2 Filler W ires.....................................................................................................103
4.1.3 Schaeffler-Delong Diagrams for Material Combinations..........................104
4.2 Laser Hybrid W elded Butt Joints.....................................................................107
4.2.1 Tensile Testing Results for Laser Hybrid Butt Joints................................109
4.2.2 Fatigue Results o f Laser Hybrid W elded Butt Joints.................................112
4.2.2.1 Fatigue Results o f LHW Butt Joints with LDX 2 1 0 1...........................115
4.2.2.2 Fatigue Results o f LHW Butt Joints with HyTens 1 0 0 0.....................124
4.2.3 Fatigue Failure Analysis for Laser Hybrid W elded Butt Joints...............133
4.2.3.1 Fatigue Failure Analysis o f D issim ilar Thickness LHW Butt Joints 133
4.2.3.2 Fatigue Failure Analysis o f Similar Thickness LHW Butt Joints.......135
4.2.3.3 Root Angle Measurements for Similar Thickness LHW Butt Joints 137
4.2.4 Results o f Non-Destructive X-Ray Testing o f Series F3 and F 5.............141
4.2.5 Microhardness Results for Laser Hybrid W elded Butt Joints..................142
4.2.5.1 Microhardness Results for LHW Butt Joints of LD X 2101 W elded to
Zinc Coated M ild S tee l.............................................................................................142
4.2.5.2 Microhardness Results for LHW Butt Joints of HyTens 1000 W elded
to Zinc Coated M ild S tee l........................................................................................148
4.2.6 Elemental Mapping o f the W eld Pool for the Laser Hybrid Butt Joints
153
4.2.7 W eld Pool Composition and Constitution Results for Laser Hybrid
W elded Butt Joints.........................................................................................................157
4.2.8 Grain Size Analysis Results for Laser Hybrid W elded Butt Jo in ts........162
4.2.9 Metallography for Laser Hybrid W elded Butt Joints................................163
4.3 Laser Hybrid W elded Lap Jo in ts.......................................................167
4.4 Cold Metal Transfer W elded Butt Jo in ts................................................174
4.4.1.1 Tensile Properties o f Cold Metal Transfer Butt Joints.........................176
4.4.1.2 Fatigue Results o f CMT Butt Joints with LDX 2 1 0 1..........................177

4.4.1.3 Fatigue Failure Analysis for Cold Metal Transfer Butt Joints............180
4.4.1.3.1 Root Angle Measurements for Similar Thickness CMT Butt Joints
181
4.4.1.4 Microhardness Results for Cold Metal Transfer Butt Joints...............183
4.4.1.5 Metallography o f Cold Metal Transfer Butt Joints..............................185
4.4.1.6 Elemental Mapping o f the W eld Pool for the Laser Hybrid Butt Joints
187
4.5 Infinite Focus M icroscopy....................................................................................190
4.6 Comparison o f W elding Techniques...................................................................203
4.6.1 Comparison o f Tensile Properties o f Different W elding Techniques... 203
4.7 Comparison o f Fatigue Properties for Various W elding M ethods..................205
5 D iscussion.......................................................................................................................207
5.1 Material Characterisation.....................................................................................207
5.2 Laser Hybrid W elded Butt Joints........................................................................208
5.3 Laser Hybrid W elded Lap Jo in ts........................................................................215
5.4 Cold Metal Transfer Similar Thickness Butt Joints..........................................217
5.5 Infinite Focus M icroscopy ..................................................................................220
5.6 Comparison o f W elding Techniques...................................................................224
5.7 Summary o f D iscu ssion........................................................................................225
6 Conclusions.....................................................................................................................227
7 Further W ork ...................................................................................................................229
8 R eferences.......................................................................................................................231
9 Appendix A - Additional Microhardness M aps........................................................239
10 Appendix B - Additional IFM 3D Images and Surface Profiles..............................249
7

List of Figures
Figure 1. Distribution o f cost for typical structures within the transport industry2...22
Figure 2. Schematic Diagram o f Gas Metal Arc W elding P rocess...............................31
Figure 3. Schematic diagram o f the laser hybrid w eld ing..............................................35
Figure 4. Effect o f filler wire in the laser hybrid w elding process when com pared......
to that o f laser welding21..................................................................................38
Figure 5. The CMT Process - demonstration o f the oscillating w ire26.........................40
Figure 6. Schematic picture o f the current and voltage in relation to time d u r in g........
the CMT process26.............................................................................................41
Figure 7. The Schaeffler-Delong Diagram30...................................................................51
Figure 8. Typical S-N C urve..............................................................................................54
Figure 9. Diagram outlining term inology and form o f a fatigue stress cyc le.............55
Figure 10. Crack Initiation M echanism..............................................................................59
Figure 11. Schematic diagram o f a typical fatigue fracture surface................................60
Figure 12. Deformation o f lap join t during loading63.......................................................63
Figure 13. Schematic diagram o f weld geometry parameters70.......................................66
Figure 14. The effect o f flank angle (0) on the FCI life o f tested specim ens70 67
Figure 15. Butt Joint Configuration for W elds produced.................................................69
Figure 16. Laser Hybrid W elding Equipment at ESAB Process a n d................................
Development Centre, Gothenburg, Sweden, April 2006...............................70
Figure 17. Lap Joint Configuration....................................................................................71
Figure 18. Butt Joint Configuration....................................................................................71
Figure 19. Schematic Diagram o f Laser and GM AW setup for the L a se r......................
Hybrid W elding process.....................................................................................73
Figure 20. Schematic diagram for laser tilt angle for Laser Hybrid W elded lap ............
jo in ts .....................................................................................................................75
Figure 21. Schematic diagram to show where the gap was introduced between ............
the plates during the Laser Hybrid W elding optimisation o f lap jo in ts 75
Figure 22. CMT W elding Equipment at Sheffield Hallam University ..........................76
Figure 23. Tensile testing specimen for parent materials ................................................80
Figure 24. Tensile testing specim en for welded jo ints.................................................... 81
Figure 25. Schematic diagram showing dimensions and setup for ..................................
dissimilar thickness fatigue tests.......................................................................82

Figure 26. Schematic diagram showing dim ensions and setup for s im ila r ...................
thickness fatigue tes t......................................................................................83
Figure 27. Example o f Staircase fatigue test table for data collection and ..................
the outlines the values needed for the relevant calcu lations.....................85
Figure 28. Microhardness Profiles (traverse and vertical) across a...............................
dissim ilar thickness Laser Hybrid Butt W e ld ............................................89
Figure 29. Microhardness Profiles (traverse and vertical) across a sim ila r.................
thickness Laser Hybrid Butt W eld...............................................................90
Figure 30. Microhardness Map (0.5mm) across a dissimilar thickness Laser ............
Hybrid Butt W eld ...........................................................................................90
Figure 31. Microhardness Map (0.5mm) across a similar thickness L a se r.................
Hybrid Butt W eld ...........................................................................................90
Figure 32. Diagram showing measured angle 0 ’ for root angle penetration..............93
Figure 33. Enlarged area o f figure 21 showing desired angle 0.................................93
Figure 34. M ild steel as received microstructure etched 2% nita l............................101
Figure 35. Hy-Tens 1000 stainless steel as received microstructure e tc h e d ..............
60% nitric a c id ..............................................................................................101
Figure 36. 301LN Stainless steel as received microstructure etched 60% nitric .......
ac id.................................................................................................................102
Figure 37. LDX 2101 stainless steel as received microstructure u s in g .......................
electrolytic etch 20% sodium hydroxide...................................................102
Figure 38. Schaeffler-Delong Diagram for Stainless LDX 2101 and Z in c.................
Coated M ild Steel using 308L-Si filler w ire.............................................104
Figure 39. Schaeffler-Delong Diagram for Stainless LDX 2101 and Z in c.................
Coated M ild Steel using 309L-Si filler w ire.............................................105
Figure 40. Schaeffler-Delong Diagram for Stainless Hy-Tens 1000 and Z in c.............
Coated M ild Steel using 308L-Si filler w ire.............................................105
Figure 41. Schaeffler-Delong Diagram for Stainless Hy-Tens 1000 and Zinc ............
Coated M ild Steel using 309L-Si filler w ire.............................................106
Figure 42. The results o f tensile testing (UTS and Rpo.2) o f LHW d iss im ila r ..............
metalbutt joints using LDX 2101 and zinc coated mild s te e l.................109
Figure 43. The results o f tensile testing (UTS and Rpo.2) o f LHW dissim ilar .............
metal butt joints using HyTens 1000 and zinc coated m ild s tee l 110
9

.113
.113
.114
,114
,116
117
118
119
120
121
122
123
125
126
127
128
Instron 8516 and Instron console 8500+ with software Cyclic ....
version 17.7 at Outokumpu Avesta Research Centre, Avesta, .......
Sweden....................................................................................................
Instron 8502 and Instron console 8500+ with software Cyclic .....
version 17.7 at Outokumpu Avesta Research Centre, Avesta, ......
Sweden....................................................................................................
Dartec M 1000/RK and Instron console 8500+ with software .......
Cyclic version 17.7 at Outokumpu A vesta Research C en tre ,.........
Avesta, Sw eden......................................................................................
ESH servo hydraulic mechanical testing machine with Rubicon ...
digital controller, at Sheffield Hallam University .............................
Staircase fatigue results for FI - LDX 2101 0.75m m to Dogal ......
260RP-X 1.5mm with 308L-Si filler w ire.........................................
Graph to show fatigue load range for series FI - LDX 2101 ..........
0.75m m to Dogal 260RP-X 1.5mm laser hybrid welded butt join t
Staircase fatigue results for F2 - LDX 2101 1.5mm to Dogal ........
260RP-X 1.5mm with 308L-Si filler w ir e.........................................
Graph to show fatigue load range for series F2 - LDX 2101 ..........
1.5mm to Dogal 260RP-X 1.5mm laser hybrid welded butt jo in t ..
Staircase fatigue results for F5 - LDX 2101 0.75mm to Dogal ......
260RP-X 1.5mm with 309L-Si filler w ir e.........................................
Graph to show fatigue load range for series F5 - LDX 2101 ..........
0.75m m to Dogal 260RP-X 1.5mm laser hybrid welded butt join t
Staircase fatigue results for F6 - LDX 2101 1.5mm to Dogal ........
260RP-X 1.5mm with 309L-Si filler w ir e..........................................
Graph to show fatigue load range for series F6 - LDX 2101 ..........
1.5mm to Dogal 260RP-X 1.5mm laser hybrid welded butt jo in t ..
Staircase fatigue results for F3 - HyTens 1000 0.75m m to D ogal ..
260RP-X 1.5mm with 308L-Si filler w ir e..........................................
Graph to show fatigue load range for series F3 - HyTens 1000 .... .
0.75mm to Dogal 260RP-X 1.5mm laser hybrid welded butt jo in t .,
Staircase fatigue results for F4 - HyTens 1000 1.5mm to D o g a l....
260RP-X 1.5mm with 308L-Si filler w ir e..........................................
Graph to show fatigue load range for series F4 - HyTens 1000 .....
1.5mm to Dogal 260RP-X 1.5mm laser hybrid welded butt jo in t ....
10

Figure 60. Staircase fatigue results for F7 - HyTens 1000 0.75m m to D o g a l.............
260RP-X 1.5mm with 309L-Si f i l le r.........................................................129
Figure 61. Graph to show fatigue load range for series F7 - HyTens 1000 ................
0.75m m to Dogal 260RP-X 1.5mm laser hybrid welded butt jo in t .......130
Figure 62. Staircase fatigue results for F8 - HyTens 1000 1.5mm to D o g a l.................
260RP-X 1.5mm with 309L-Si f i l le r.........................................................131
Figure 63. Graph to show fatigue load range for series F8 - HyTens 1000 ..................
1.5mm to Dogal 260RP-X 1.5mm laser hybrid welded butt jo in t .........132
Figure 64. An example o f a Laser Hybrid W elded Butt join ts sh o w in g.......................
the w eld bead and the joint fit up 1.5mm welded to 0.75m m plates......133
Figure 65. A series o f still photos from the video capture o f the fatigue te s t................
F7.8.6 showing the location, initiation and propagation o f t h e ...................
fatigue crack..................................................................................................134
Figure 66. Photo showing fatigue failure for a LHW butt join t o f .................................
dissimilar thickness, the failures occurs on the thinner s ta in less...............
steel side o f the jo in t.....................................................................................134
Figure 67. Example o f the joint fit o f similar thickness LHW butt jo in ts ................135
Figure 68. Photo showing fatigue failure for a LHW butt joint o f s im ila r ...................
thickness, the failure occurs on the weaker mild steel side o f the .............
jo in t .................................................................................................................135
Figure 69. SEM image showing the underside o f the weld bead o f sa m p les...............
F 2 .6 .6.............................................................................................................136
Figure 70. SEM image showing the underside o f the weld bead illustrating t h e........
crack propagation on the edge o f the weld on the mild steel side..........136
Figure 71. Image showing an example o f how the root angle was m easu red..............
for the fatigue tests in series F2, F4, F6 and F8. The sample in t h e...........
image is F2.5.3 which completed 2 m illion cycles at a load o f ..................
15.4kN............................................................................................................137
Figure 72. Graph showing the relationship o f root angle and fa t ig u e...........................
cycles completed ( to fracture or runout) for series F2 - L D X ....................
2101 1.5mm to Dogal 260RP-X 1.5mm with 308L-Si filler w ire.......138
Figure 73. Graph showing the relationship o f root angle at and fatigue ......................
cycles completed ( to fracture or runout) for series F4 -HyTens ..............
1000 1.5mm to Dogal 260RP-X 1.5mm with 308L-Si...filler w ire .......138
11

.139
.139
.140
.143
.143
.144
.144
,145
145
146
146
147
148
149
149
Graph showing the relationship o f root angle and fat ig u e.............
cycles completed for series F6 - LDX 2101 1.5mm to Dogal .......
260RP-X 1.5mm with 309L-Si filler w ire.........................................
Graph showing the relationship o f root angle and fat ig u e.............
cycles completed for series F4 -HyTens 1000 1.5mm to D ogal ....
260RP-X 1.5mm with 309L-Si filler w ire.........................................
Results o f T-Test carried out in Minitab to confirm relationship ...
between root angle and fatigue life......................................................
Graph showing microhardness profile o f laser hybrid butt jo in t o f
LDX 2101 to zinc coated mild steel using 308L-Si and 309L -Si ...
filler w ires ..............................................................................................
Series 1 microhardness map o f fatigue sample 1.3.1, the sample ...
failed the fatigue test at 9.0kN after 252752 cycles...........................
Series 1 microhardness map o f fatigue sample 1.7.2, the sample ...
survived the fatigue test at 9.5kN completing 2 m illion cyc les.......
Series 2 microhardness map o f fatigue sample 2.5.4, the sample ...
survived the fatigue test at 15.8kN completing 2 m illion cyc les.....
Series 2 microhardness map o f fatigue sample2.6.6, the sample ....
failed the fatigue test at 15.8kN after 457113 cycles.........................
Series 5 microhardness map o f fatigue sample 5.1.6, the sample ...
failed the fatigue test at 8.5kN after 1311423 cycles.........................
Series 5 microhardness map o f fatigue sample 5.4.2, the sample ...
survived the fatigue test at 8.5kN completing 2 m illion cycles.......
Series 6 microhardness map o f fatigue sample 6.1.2, the sample ...
survived the fatigue test at 15.0kN completing 2 m illion cyc les.....
Series 6 microhardness map o f fatigue sample 6.2.1, the sample ...
failed the fatigue test at 15.0kN after 644544 cycles.........................
Graph showing microhardness profile o f laser hybrid b u t t .............
joint o f HyTens 1000 to zinc coated m ild steel using 308L -Si and
309L-Si filler w ires.................................................................................
Series 3 microhardness map o f fatigue sample 3.4.6, the sample ....
failed the fatigue test at 9.0kN after 521920 cycles............................
Series 3 microhardness map o f fatigue sample 3.5.2, the sample ....
survived the fatigue test at 9.0LN completing 2 m illion cyc les........
12

Figure 89. Series 4 microhardness map o f fatigue sample 4.6.6, the sa m p le...............
survived the fatigue test at 16.0kN completing 2 m illion cycles............150
Figure 90. Series 4 microhardness map o f fatigue sample 4.7.5, the sa m p le...............
failed the fatigue test at 13.5kN after 170401 cycles...............................150
Figure 91. Series 7 microhardness map o f fatigue sample 7.3.3, the sa m p le...............
survived the fatigue test at 8.0kN completing 2 m illion cyc les..............151
Figure 92. Series 7 microhardness map o f fatigue sample 7.8.6, the sa m p le...............
failed the fatigue test at 8.0kN after 843525 cycles.................................151
Figure 93. Series 8 microhardness map o f fatigue sample 8.6.1, the sa m p le...............
survived the fatigue test at 14.0kN completing 2 m illion cyc les............152
Figure 94. Series 8 microhardness map o f fatigue sample 8.6.4, the sa m p le...............
failed the fatigue test at 14.8kN after 465001 cycles...............................152
Figure 95. Elemental Mapping o f Sample F I .3 .1....................................................... 153
Figure 96. Elemental Mapping o f Sample F 2 .5 .2......................................................154
Figure 97. Elemental Mapping o f Sample F 3 .2 .6.......................................................154
Figure 98. Elemental Mapping o f Sample F 5 .4 .2.......................................................155
Figure 99. Elemental Mapping o f Sample F 6 .1 .2....................................................... 155
Figure 100. Elemental Mapping o f Sample F 7 .3 .3.......................................................156
Figure 101. Schaeffler Diagram plotted from ED A X analysis for series FI - .............
LDX 2101 0.75mm to Dogal 260RP-X 1.5mm and series F2 - .................
LDX 2101 1.5mm to Dogal 260RP-X 1.5mm with a 308L -Si F iller ........
W ire ................................................................................................................158
Figure 102. Schaeffler Diagram plotted from ED A X analysis for series F3 - ............
HyTens 1000 0.75m m to HyTens 1000 1.5mm and series F4 - ..............
HyTens 1000 1.5mm to Dogal 260RP-X 1.5mm with a 3 0 8L -S i ..............
Filler W ire ......................................................................................................158
Figure 103. Schaeffler Diagram plotted from ED A X analysis for series F5 - ............
LDX 2101 0.75mm to Dogal 260RP-X 1.5mm and series F6 - .................
LDX 2101 1.5mm to Dogal 260RP-X 1.5mm with a 309L -Si Filler ........
W ire ................................................................................................................159
Figure 104. Schaeffler Diagram plotted from ED A X analysis for series F7 - ............
HyTens 1000 0.75mm to HyTens 1000 1.5mm and series F8 - ...............
LD X 2101 1.5mm to Dogal 260RP-X 1.5mm with a 309L-Si Filler ........
W ire ................................................................................................................159
13

Figure 105. Schaeffler Diagram for series 6 o f LDX 2101 1.5mm with Zinc ..............
coated mild 1.5mm steel with 309L-Si, spot analysis was taken a t...........
three different points, the top(T), the middle (M) and the bottom (B )........
o f the weld pool as shown in the insert.....................................................160
Figure 106. Schaeffler Diagram for series 8 o f HyTens 1.5mm with Z in c ..................
coated mild 1.5mm steel with 308L-Si, spot analysis was taken f r o m......
two different fatigue samples, F8.4.3 and F8.7.5 both sam p les..................
y ielded different results................................................................................161
Figure 107. Graph showing average grain size (pm) in the parent m ater ia ls.................
and the Heat A ffected Zone (H A Z )...........................................................162
Figure 108. M ild steel microstructure etched in 2% n ita l .............................................163
Figure 109. M ild steel HAZ microstructure etched in 2% n ita l .....................................164
Figure 110. LDX 2101 microstructure etched in 10% oxalic acid, show ing ..............
the typical as rolled microstructure o f the austenite and fe r r ite ..................
phases presen t...............................................................................................164
Figure 111. LDX 2101 Interface with w eld etched in 10% oxalic acid sh o w in g..........
the marked change in the austenite to ferrite ratio in the HAZ o f t h e ........
LDX 2 1 0 1.....................................................................................................165
Figure 112. Hy-tens 1000 and W eld Metal Interface etched in 10% oxalic ..................
acid martensite in the HAZ and the weld material...................................165
Figure 113. Solidification cracking observed in a lap joint o f LDX 2101 la se r............
hybrid welded to zinc coated mild stee l.................................................... 168
Figure 114. Depth o f penetration for laser hybrid welded lap join t for LDX ...............
2101 to zinc coated m ild steel.....................................................................169
Figure 115. Depth o f penetration for laser hybrid welded lap join t for H y -T en s...........
1000 to zinc coated mild steel.....................................................................169
Figure 116. Photo showing surface breaking pores with cracking on a lap jo in t o f .....
Hy-Tens 1000 to Dogal 260R P-X with 309L-Si filler.............................170
Figure 117. Photo showing surface breaking pores on a lap joint o f LDX 2 1 0 1...........
to Dogal 260RP-X with 309L-Si filler......................................................170
Figure 118. Photo showing transverse cracking on the underside o f the Hy-Tens .......
1000 in a lap join t o f Dogal 260RP-X with 309L-Si fi l le r .....................171
Figure 119. Graph showing that as the gap between the two plates and t h e..................
welding angle increases the amount o f observed cracking is .....................
greatly reduced..............................................................................................171
14
Figure 120.
Figure 121.
Figure 122.
Figure 123.
Figure 124.
Figure 125.
Figure 126.
Figure 127.
Figure 128.
Figure 129.
Figure 130.
Figure 131.
Figure 132.
Figure 133.
Figure 134.
Macro Image o f Underside Cracking Observed in Lap Joints u s in g..........
the HyTens 1000 Stainless ( the crack has been opened top reveal...........
the fracture surface)......................................................................................172
SEM Images o f the fracture surface o f an lap joint using HyTens ............
1000 Stainless S te e l.....................................................................................173
Macro Image o f a Longitudinal Section Through an Lap Joint .................
using HyTens 1000 Stainless, Cracks are Shown to go through t h e ..........
Full Thickness o f the W eld and often Coincide with Porosity...............173
Diagram showing effect o f critical parameters on resulting w eld .............
bead for Cold Metal Transfer jo in ing .........................................................174
Graph showing Load vs Extension for the results o f tensile te s ts..............
carried out for Cold Metal Transfer Butt Joints, th e average U T S............
was 422.6M Pa...............................................................................................176
Staircase fatigue results for C l - LD X 2101 1.5mm to D o g a l....................
260RP-X 1.5mm with 308L-Si filler w ir e................................................178
Graph to show fatigue load range for series C l - LDX 2101 ..........1.5mm
to Dogal 260RP-X 1.5mm Cold Metal transfer welded butt jo in t .......179
Showing point o f failure for C MT similar thickness fatigue tests........180
Typical fracture surface o f CMT similar thickness fatigue specim en .. 180
Example o f root angle measurement on CMT similar thickness b u t t........
jo in t ................................................................................................................181
Graph showing relationship between root angle and fatigue life f o r .........
CMT similar thickness butt joints (series C l )..........................................182
Series C l microhardness map o f fatigue sample C 1.14.4, t h e...................
sample survived the fatigue test at 8.6kN completing 2 m il l io n .................
cycles..............................................................................................................183
Series C l microhardness map o f fatigue sample C l .3.3, t h e.....................
sample failed the fatigue test at 9.0kN after 1150208 cyc les..................184
Typical Microstructure o f Dogal 260RP-X HAZ in a C M T .......................
Dissim ilar w e ld .............................................................................................185
Typical Microstructure o f W eld Material in a CMT D i ss im ila r .................
W eld using 308L-Si Filler Wire, etched in 25m l HC1, 75ml H2O a n d ......
0.7g sodium metabisulphite, show ing austenite (light) a n d ........................
ferrite (dark) phases.....................................................................................186
15

Figure 135. Typical Microstructure o f LDX 2101 HAZ in a CMT D issim ila r .............
W eld, etched in 25m l HC1, 75ml H2O and 0.7g so d iu m.............................
metabisulphite, show ing growth o f the austenite (lighter) phase 186
Figure 136. Elemental mapping o f sample C l .3 .3........................................................187
Figure 137. Elemental Mapping o f sample C l.7 .1........................................................188
Figure 138. Elemental mapping o f sample C l .9 .3........................................................188
Figure 139. Elemental mapping o f sample C l . 1 4 .4......................................................189
Figure 140. IFM 3D surface im age and surface profiles for the front o f the w e ld........
bead o f sample C l .5 .2..................................................................................191
Figure 141. IFM 3D image and surface profiles for the underside o f sam p le...............
C l .5.2, including the penetration root angle measurements for th e...........
sample.............................................................................................................192
Figure 142. IFM 3D surface image and surface profiles for the front o f the w e ld........
bead o f sample F 2 .7 .5..................................................................................193
Figure 143. IFM 3D image and surface profiles for the underside o f sa m p le...............
F2.7.5, including the penetration root angle measurements for t h e...........
sample.............................................................................................................194
Figure 144. IFM 3D surface image and surface profiles for the front o f the w e ld........
bead o f sample F 4 .8 .1..................................................................................195
Figure 145. IFM 3D image and surface profiles for the underside o f sam p le...............
F4.8.1 including the penetration root angle measurements for t h e............
sample.............................................................................................................196
Figure 146. IFM 3D surface image and surface profiles for the front o f the w e ld........
bead o f sample F 6 .5 .1..................................................................................197
Figure 147. IFM 3D image and surface profiles for the underside o f sa m p le...............
F4.8.1 including the penetration root angle measurements for t h e............
sample.............................................................................................................198
Figure 148. IFM 3D surface image and surface profiles for the front o f the w e ld........
bead o f sample F 8 .5 .6..................................................................................199
Figure 149. IFM 3D image and surface profiles for the underside o f sa m p le................
F8.5.6 including the penetration root angle measurements for t h e............
sample............................................................................................................200
Figure 150. Graph showing the relationship between the penetration root a n g le.........
and fatigue life, for similar thickness Laser Hybrid W e ld s....................201
16

Figure 151. Graph showing the relationship between the penetration root a n g le.........
and fatigue life, for similar thickness Cold Metal Transfer W elds 201
Figure 152. Graph showing hardness o f Heat A ffected Zone (HAZ) o f the m i ld .........
steel from bottom to the top o f the fatigue specim ens...........................202
Figure 153. Comparison o f UTS (MPa) D issim ilar Metal W e ld ed.................................
Samples o f Austenitic Stainless Steel and Zinc Coated M i ld .....................
Steel U sing Laser W elding and Laser Hybrid W elding..........................204
Figure 154. Comparison o f UTS (MPa) Dissim ilar Metal W elded Samples o f............
Duplex Stainless Steel and Zinc Coated M ild Steel Using L a se r..............
W elding, Laser Hybrid W elding and Cold Metal Transfer....................204
Figure 155. The staircase results represented as Mean Fatigue Line L o a d....................
Range (MFLLR), at 2m illion cycles for LHW dissimilar metal butt ........
joints using LDX 2101, Hy-Tens 1000 and zinc coated mild steel ...........
with two filler w ires. The comparative laser welded results a r e................
included for reference..................................................................................205
17

List of Tables
Table 1. Energy consumption and efficiency o f various welding techniques..............26
Table 1. Series ID for Laser Hybrid W elded dissimilar butt jo in ts ...............................78
Table 2. Hy-Tens 1000 Chemical Composition (Mass % )............................................98
Table 3. LDX 2101 Chemical Composition (M ass).......................................................98
Table 4. Hot-Dip Galvanised M ild Steel Chemical Composition (M ass % )...............98
Table 5. M echanical properties o f HyTens 100 stainless steel, 0.75m m a n d..............
1 .5m m..................................................................................................................99
Table 6. M echanical properties o f LDX 2101, 0.75mm and 1.5m m............................99
Table 7. M echanical properties o f hot dip galvanised m ild steel..................................99
Table 8. Zinc coating specification thickness and mass for the mild s te e l................100
Table 9. Zinc coating measurements using a thickness gauge.....................................100
Table 10. Chemical compositions o f filler w ires.............................................................103
Table 11. Typical mechanical properties o f filler wires..................................................103
Table 12. Butt Joint Configurations o f LDX 2101 Joined to 1.5mm G alvan ised.........
M ild Steel (SSA B) using 1mm 308 Filler and 98%Ar + 2%Co2
Shielding G as....................................................................................................108
Table 13. Butt Joint Configurations o f HyTens 1000 Joined to 1.5mm .........................
Galvanised M ild Steel (SSA B) using 1mm 309L Filler a n d...........................
98%Ar + 2 %Co2 Shielding G as......................................................................108
Table 14. Tensile test results for laser hybrid welded butt jo in ts..................................I l l
Table 15. Outline o f fatigue machines used during testing program m e......................112
Table 16. Outline o f X-Ray testing criteria for series F3 and F5 fatigue sam ples.... 141
Table 17. Samples with defects detected by X -Ray testing, samples were not ...............
fatigue tested as part o f the staircase..............................................................141
Table 18. Dilution (%) and predicted weld bead microstructure as determ ined............
using the chemical analysis results from the sem i-quantitative ......................
Energy D ispersive X-Ray (EDX) analysis with the Scann ing........................
Electron M icroscope (SEM ) and a Cobalt standard with t h e...........................
Schaeffler Diagram for each series. Equivalent Laser w e ld in g ......................
results are shown for comparison...................................................................160
Table 19. W elding parameters for initial lap samples using the Laser H yb r id...............
P rocess..............................................................................................................168
Table 20. Optimum parameters for CMT process for a butt join t configuration 175
18

Table 21. The results o f staircase fatigue tests o f LHW dissimilar m e ta l .......................
butt join ts using LDX 2101, Hy-Tens 1000 and zinc coated m ild s t e e l........
w ith two filler wires, see Table 13 for details o f weld jo in t ...........................
configuration and filler wire used...................................................................206
Table 22. Comparison o f Fatigue, tensile and hardness properties.............................
o f w eld combinations tested in the research............................................225
19

List of Equations
Equation 1. Stress Ratio, R, equation...............................................................................54
Equation 2. Rotation Angle Calculation..........................................................................64
Equation 3. To calculate t for joints with dissim ilar thickness base materials...........64
Equation 4. Equation for Mean Fatigue Strength...........................................................85
Equation 5. Equation for Convergence Factor...............................................................85
Equation 6. Equation for Standard D eviation..................................................................86
Equation 7. Equation for Standard Error o f the M ean Fatigue Strength.....................86
Equation 8. Mean Linear Intercept...................................................................................91
Equation 9. Equation to calculate angle 0 from measured angle 0 ’ .............................93
Equation 10. Dilution equation for calculating carbon values for ea ch............................
join t com bination ...........................................................................................95
Equation 11. Chromium equivalent equation....................................................................96
Equation 12. N ickel equivalent equation...........................................................................96
Equation 13. Relationship between angle at weld root and fatigue life for L H W ....221
Equation 14. Relationship between angle at weld root and fatigue life for L H W ....222
20

l Introduction
B y definition welding is the jo in ing o f materials together using a heat source. W elding
has been used for many thousands o f years, with the first recorded welding being
carried out by the Egyptians. The first patent for electric welding was filed in the early
nineteenth century and the process has been developed continuously ever since. Today
there are a large number o f jo in ing and welding techniques available and design
engineers are often faced with the task o f choosing the optimum technique in terms o f
efficiency, costs and weldability for the materials to be jo ined1.
In recent years there have been significant new developments in welding processes for
jo in ing stainless steel and dissimilar metals. This is associated w ith the recent rise in
interest o f using stainless steel in the automotive industry from both car manufacturers
and stainless steel producers.
The main reason for using stainless steel within the automotive industry is the
combination o f formability and high strength, and improved corrosion resistance when
compared to zinc coated mild steel.
In current car manufacture one o f the main materials used is m ild steel (often w ith a
zinc coating to provide corrosion protection). Incorporation o f stainless steel into
automotive manufacture would be facilitated through the use o f existing design and
production techniques. Therefore in order to achieve this, appropriate jo in ing processes
for join ing stainless steel to zinc coated mild steel need to be investigated.
The join ing o f dissimilar metals provides many challenges, with the major problem
being the formation o f intermetallic phases. Generally these phases are characterised by
their high hardness and therefore brittleness, which can lim it the applications o f a
welded join t with these phases present. In order to overcome this problem the diffusion
process needs to be controlled in order to avoid these detrimental intermetallic phases2.
However, intermetallic phases are rarely observed in 304 and 316 grade stain less steels
i f welded using recommended practice. The problem is more evident in high M o, high
Cr and high W grades used in sea water and other aggressive environments.
21

A ny w eld ing techn iques h igh ligh ted fo r use w ith in the au tom otive industry m ust have
the ab ility to p roduce m echan ically sound d issim ilar m etal jo in ts. T h is a llow s areas that
are safety critical to be p roduced w ith a m ateria l for exam ple, sta in less steel that
exh ib its superio r p roperties in term s o f strength and im pact energy absorp tion w hen
com pared to m ild steel. N ew techn iques m ust also have the po ten tia l to be easily
incorpora ted in to p roduction lines and m ust com bine w eld ing speed w ith rep roduc ib ility ,
re liab ility and cost effectiveness . The m ajo r facto r w hen considering the app lication o f
new techno log ies is cost, especia lly i f a m ateria l substitu tion is tak ing p lace. F o r a
typ ica l structure in a transport system , such as a car fabricated from steel, a lum in ium ,
titan ium or m agnesium the estim ated cost o f m anufactu ring is 25% as show n in figure 1
be low .
Tooling 25% Material 25%
Manufacturing 25% Other 25%
F igure 1. D istr ibution o f cost fo r typ ica l structures within the transport industry2
Tw o notab le and sign ifican t innovations in w e ld ing p rocesses for use in the au tom otive
industry in recen t years are L aser H ybrid W eld ing (L H W ) and C old M eta l T ransfe r
(C M T). This report ou tlines an investigation in to these novel jo in in g p rocesses for
jo in in g high strength stain less steel grades to z inc coated m ild steel w h ich can be easily
transferred and in tegrated cost effective ly in to curren t au tom otive m anufactu re.
The overall aim o f th is research is to investigate novel jo in in g techn iques iden tif ied fo r
successfu l jo in in g o f stain less steel grades LD X 2101 and H yTens 1000 to au tom o tive
grade zinc coated m ild steel (D ogo l 260R P-X ).
22

l . i O b jec tives
The objectives for achieving the overall aim o f this research are:
• To find an acceptable process w indow for each o f the material combination and
jo in ing techniques, the initial assessment w ill be visual in terms o f bead quality
and penetration.
• To optim ise the mechanical properties o f the joints produced by each technique
in terms o f tensile and fatigue properties. The criteria for the tensile test are for
the jo in t to be as good as the weakest parent material, e.g. the m ild steel.
• To identify and characterise potential failure modes associated with the novel
jo in ing techniques.
• Finally propose a model for predicting fatigue properties o f dissim ilar metal
joints.
23

2 Literature Review
An extensive study o f the literature has been carried out on topics o f interest to this
research. This includes the more established join ing techniques o f laser welding and
Gas Metal Arc W elding (GM AW ) and the less w idely reported techniques o f Laser
Hybrid W elding (LHW ) and Cold Metal Transfer (CMT). A lso discussed in the sections
below are the materials that have been used in this research and the mechanical testing
carried out.
2.1 L a se r W eld ing
Laser welding is a w ell established welding technique that can jo in a variety o f
materials and thicknesses. The coherent nature o f the laser beam allows it to be focussed
to a small spot, leading to high energy densities and spot sizes that can range from as
small as 0.2mm up to 13mm11. Until the 1970’s laser welding was restricted to pulsed
power and for jo in ing relatively thin materials at low speeds due to a lim ited availability
o f continuous power. Developm ent has been carried out on the use o f lasers to produce
continuous power or continuous waveform (CW) lasers in order to enable higher
welding speed and deeper penetration4.
Lasers most commonly used, particularly within the automotive industry, are Carbon
D ioxide (CO2) gas laser and a solid state Neodym ium-doped Yttrium A lum inium
Garnet (Nd:YAG) or more commonly known as Y A G lasers.
24

The principle o f Laser (Light Amplification by Stim ulated Emission o f Radiation) is the
use o f this stimulated energy to produce a beam o f coherent monochromatic light.
Lasers operate at a wavelength in the visib le and infra-red region. Focussing the laser
beam into a small spot creates sufficient energy for welding, cutting and piercing
operations on metals as w ell as other materials5.
During welding, the high power density in the focal point evaporates the materials and
causes a narrow deep entry hole which m oves through the work piece as the laser beam
is manipulated6. This mechanism produces a keyhole and can be used to w eld a variety
o f materials o f various thicknesses.
CO2 lasers are most commonly used for high power welding emitting light with a
wavelength o f 10.6pm. The gas mixture used in this type o f laser is m ain ly helium,
carbon dioxide and nitrogen. The helium is present to ensure the removal o f generated
heat, the CO2 is the laser active medium, in order to create the necessary energy for
excitation to take place a gas discharge needs to occur and this is w hy the nitrogen is
present. NdiYAG lasers have a wavelength ten times shorter than CO2 lasers,
neodymium is the laser-active medium and is located in a rod shaped yttrium-
aluminium-gamet solid crystal. Optical excitation in pulsed lasers usually occurs by
means o f krypton flash-lamps, whereas krypton arc lamps are used in high powered
continuous waveform lasers6.
CO2 lasers are cost effective for high speed w elding and are used in thin w alled
structures such as car bodies. The drawbacks o f CO2 gas lasers are the com plex delivery
systems o f the laser beam to the work piece and sometimes beam quality is lost due to
the transfer o f the laser beam via mirrors. A lternatively, the light from N d:YAG lasers
can be transmitted via optical fibres and can be more easily integrated into a variety o f
automated system s6.
The primary factor in establishing the potential for laser welding is that the power
density generated is 106W /cm2 (6 xlO 6 W /in2), compared to 5 x l0 2-104W /cm 2 (3 x l0 3-
6 x l0 4 W /in2) for arc welding. Lasers also permits precision welded joints rivalled only
by those produced using an electron beam. Table 1 below shows comparisons o f the
energy consumption and efficiency o f different w elding processes4.
25
2.1.1 M e c h a n ism o f L a s e r W e ld in g

W eld ing P rocess
In tensity o f energy
source
Join ing
effic iency
m m 2/kJFusion zone profile
W /cm 2 W /in .3
Oxyacetylene
(OAW )
10^-10J 6x10Z-
6 x l0 3
0 .2 - 0 .5 Shallow for single
pass
Arc W elding 5 x 10²-
104
3 x l0 3-
6 x l0 4
0 . 8 - 2 (a)
2 - 3 (b)
4 - 1 0 ( c )
Shallow for single
pass
Plasma Arc (PAW ) 103-106 6 x l0 3-
6 x l0 6
5 - 1 0 Shallow at low -
energy end, deep
penetration at high
energy end
Laser Beam 10s-107 6x10s-
6 x l0 7
1 5 - 2 5 Deep penetration at
high-energy density
range
Electron Beam 105-108 6x10s-
6 x l0 8
2 0 - 3 0 Deep penetration
(a)Gas-Tungsten Arc W elding (GTAW). (b) Gas-Metal Arc W elding (GM AW ).
(c) Submerged Arc W elding (SAW )
Tab le 1. E n e rg y consum p tion a n d e ff ic ien cy o f va r iou s w e ld in g techn iques
A s can been seen in Table 1 laser beam welding has the highest effic iency with the
exception o f electron beam welding making it a highly desirable process for industry to
utilise.
26

Laser welding has many advantages and can be favourably compared to other w ell
established welding and join ing techniques such as brazing, soldering, arc welding,
electron beam and the technique most commonly used in the automotive industry
resistance spot welding. Advantages o f laser welding include:
• The focused laser light provides high energy density.
• H igh processing speeds can be achieved.
• Narrow w eld seams and narrow Heat A ffected Zone (HAZ) are produced.
• Laser welding can take place without the need for a vacuum.
• N o electrode or filler materials are required.
• Variety o f depths o f penetration can be achieved including deep penetration.
• Precision welding can be carried out using robots.
However, as w ith all processes there are some limitations to laser w eld ing which
include:
• Edge preparation and accurate joint fit up is critical in laser w eld ing due to the
autogenous nature o f the process.
• The narrow profile and low overall heat input in laser welds results in rapid
cooling, which can subsequently lead to the formation o f hard
martensitic/bainitic microstructures corresponding w ith low toughness, in steels7.
• Initial equipment setup costs are expensive almost 10 times that o f an arc
process.
• The cost o f accurate joint fit up during production is more expensive that other
processes such as Resistance Spot W elding and Arc Welding.
2.1.2 A d v a n ta g e s a n d L im ita t io n s o f L a s e r W e ld in g
27

2.1.3 A p p l ic a t io n s o f L a se r W e ld in g
Laser welding can be applied to many different industries and applications, including
the automotive industry, shipbuilding industry, land pipeline applications, thermoplastic
welding and the micro plastic industry.
In the late 1990's the automotive industry began to re-evaluate manufacturing systems
in the body shop after new laser technology became available for commercial use and
the push towards econom ically fabricating vehicle structures whilst not losing quality
led to laser welding being used in spot welding form8. Keywords often relating to
automotive manufacture include quality, flexib ility , high productivity and cost
effectiveness. Laser w elding appears to meet these high requirements and testament to
this is the vast numbers o f laser welders already in operation in a variety o f companies6.
On average a speed o f 5m/m in is used as this was the prerequisite speed needed in order
to ensure the cost effectiveness o f the introduction o f laser welding into the industry.
Laser welding can be used for seam welding as w ell as laser spot welding.
One common use o f laser welding within the automotive industry is for the w elding o f
tailored blanks. The production o f tailored blanks requires high processing speeds and
consistent weld quality. Many o f the large automotive manufacturers introduced laser
welding during the 1990’s and these included, V olvo, Ford, BMW , Audi, Volkswagen
and Renault9. A popular use for laser welding, within the manufacture o f a car, is roo f
welding. V olvo began using laser welding for the construction o f the roo f o f the 850
m odel in 1991, due to the nature o f the design and the strength requirements o f the part
laser welding or adhesive bonding were the only options. After careful consideration o f
the product requirement, reliability and the environmental impact in terms o f production,
laser welding emerged as the most favourable methods o f jo in ing6.
BM W launched the use o f laser welding to jo in the 5 series model with 11 metres o f
laser weld on each car body. This extended further than the roof section and included
the rear cross member, boot and the front closure panel. Ford also utilise laser w eld ing
for the roof section, the use o f a continuous join t enhances the stiffness and seal
tightness o f the car and reduces the noise generation and the use o f sealant operations.
Audi and Volkswagen also use laser welding for the roof and other areas inside the cars
demonstrating the versatility o f the process. Audi also began to use Laser W elding on
28
the C-pillar o f the car and began to use stitch welding with the laser in order to avoid
distortion in the car body. Volkswagen m oved away from a lap jo in t on the roof, as
welding galvanised mild steel in the lap position led to spatter and unstable welding
conditions. Instead the w eld is positioned at the edge o f the panels reducing the
occurrence o f the process issues and increasing the welding speed. The process was
also extensively introduced in the production o f the Renault Laguna, this included stitch
welding o f the windscreen opening and the A-pillar6.
Laser welding is not only lim ited to the automotive industry it is w idely used in other
industries including the micro-processing and plastics industries. Laser spot w elding is
an accepted technology within the electronics industry, every Cathode Ray Tube (CRT)
Televisions (TV) and CRT computer screen manufacturers use laser weld ing for the
assembly o f the electron gun. Additionally, laser welding can be utilised in the plastics
industry for a variety o f thermoplastic components6.
29

Gas Metal Arc W elding (GM AW ) is classed as an arc welding process. The principle o f
gas metal arc welding is to jo in two metals together by heating them with an electric arc
that is established between a consumable electrode and the workpiece10. A suitable gas
shroud or shielding gas is fed through the welding torch to protect the arc and the
molten weld pool from the surrounding environment.
The basic concept o f Gas Metal Arc W elding (GM AW ) was first invented in the 1920’s
it was not until 1948 that it became commercially available. Originally GM AW was a
high current-density, bare metal electrode process, however, over the years it has been
extensively developed and now has many operational parameters including low current
densities, pulsed and continuous current, a variety o f shielding gasses, w eld consumable
wires and welding parameters such as voltage, welding speed, wire feed speed, current,
and m odes o f metal transfer10.
The primary application o f Gas Metal Arc W elding (GM AW ) was for w eld ing o f
carbon steels, the process has been extensively developed to successfu lly jo in different
metals such as high strength low alloyed steels, stainless steels, copper and nickel alloys.
Initially an inert gas was used for shielding which led to the common nomenclature o f
Metal Inert Gas (MIG) welding, as developments were made both inert and reactive
gases have been used and the process is now referred to as Gas Metal Arc W elding.
2.2 Gas M e ta l A r c W eld ing ( GMA W)
30

G M A W is an arc w eld ing p rocess that uses an arc struck betw een a con tinuously fed
fil le r w ire, w h ich acts as the e lectrode, and the weld pool. This process is invariab ly
carried out w ith a sh ield ing gas and w ithou t the app lication o f p ressu re12. The p rocess o f
G M A W is illustra ted in figure 2 below .
2.2.1 M ech a n ism o f G as M eta l A rc W e ld in g
F igure 2. Schem atic D iagram o f Gas M eta l A rc W elding P rocess
The heat o f the arc m elts the surface o f the base meta l/m etals and the tip o f the e lec trode,
the m elted m eta l from the e lectrode, is transferred across the arc to the w eld p o o l1'. The
w eld process param eters need to be con tro lled in o rder fo r a h igh qua lity w e ld to be
p roduced.
A fter in itia l setup by the operato r the e lectrica l characteristics o f the arc are
au tom atica lly se lf regu lated, p rov id ing a sem i-au tom atic p rocess. The on ly con tro ls
requ ired to be set by the operato r are the w eld ing speed, d irection and gun position . The
arc length and current are au tom atica lly m a in ta in ed12.
There are three basic m odes for m etal transfer between the e lectrode and the w o rkp iece
during G M A W , short c ircu iting transfer, g lobu lar transfe r o r spray arc transfer. The
m ost com m on types are short c ircu it transfer and spray transfer.
31

Short circuit transfer is more com monly used for thin section welding due to this type o f
transfer producing a small, fast freezing w eld poo l10.The metal is only transferred when
the electrode comes into contact with the workpiece. The molten metal droplet begins to
form on the tip o f the electrode, as the electrode is fed towards the workpiece and
touches the weld pool the current increases causing the droplet to be pinched off, this
initiates the arc causing short circuit. W hile the arc is initiated the tip o f the w ire melts
and is fed forward for the next short circuit. Short circuit can occur from 20 to over 200
times a second.
Spray transfer uses an increased current in the GM AW process when compared with
other metal transfer modes. A s the current increases the rate at which the molten droplet
is projected across the arc increases, the size o f the droplet decreases and the transfer
that is occurring appears like a fine spray5. Spray transfer has a rate o f several hundred
droplets per second and argon or an argon rich shielding gas is required to protect the
arc and promote arc stability. Due to the increase in current and high energy output o f
spray transfer, this mode is better suited to thick sheet section and w elding in the down
hand position. U sing spray transfer in thin sheets tends to cut through the base materials
and due to the high deposition rates spray transfer can produce large w eld pools that
lack surface tension in the vertical or overhead position.
Globular transfer is the final mode o f transfer and takes place when the current is
relatively low and generally using a CO2 rich shielding gas particularly for m ild steel.
The molten droplets at the tip o f the filler wire are transferred across the arc in globules
propelled by the arc forces. The droplet size o f globular transfer is always larger than
that o f the electrode diameter.
32

2.2.2 S h ie ld in g G a se s u se d in G a s M e ta l A r c W e ld in g
The role o f the shielding gas in most welding processes is to provide the molten metal
protection from the surrounding environment. In GM A W the shielding gas also plays an
additional role in having an effect on the arc characteristics, the mode o f metal transfer,
the depth o f penetration, the profile o f the w eld bead, the welding speed and the
cleaning action.
The inert gases o f argon and helium are commonly used along with active gases such as
carbon dioxide and oxygen. Mixtures o f inert and active gases may be em ployed for
specific applications. Further information on the use and efficiency o f shielding gases
used in GM AW is given by H olliday10.
33

2.2.3 A d v a n ta g e s a n d L im ita t io n s o f G a s M e ta l A r c We ld in g (G M A W )
Gas Metal Arc W elding (GM AW ) has numerous advantages over other welding process
and often the advantages are application dependant. Advantages o f GM AW include:
• It is the only consumable electrode process that can be used to weld all19
commercial metals and alloys .
• The continuous wire feed enables long welds to be produced continuously
without breaks.
• The welding speeds are often greater than other processes such as Shielded
Metal Arc W elding (SM AW ).
• Material deposition rates are significantly greater than Shielded Metal Arc
W elding (SM AW ).
• Lack o f post w eld slag m inim ises the post w eld cleaning required.
• GMAW is a versatile process and can be executed in all positions.
The advantages o f GM AW lean towards high production and automated welding
operations and the process is often the first choice for applications which require
continuous automated welding. The process does have certain lim itations, which
include:
• W elding equipment can be more costly than SMAW.
• Any air drafts that may be present in the work area need to be blocked as this
could disperse the shielding gas away from the w eld pool causing contamination.
• Operators have to withstand the high levels o f radiated heat and arc intensity.
• GM AW requires compressed gas to operate, when w elding manually the welder
needs to be in close proximity to the source o f compressed gas.
34

2.3 N ove l J o in in g T echn iques
The term 'N ovel Jo in ing T echn iques' re la tes to m ethods o f w eld ing /jo in ing p rocesses
that have been developed in recen t years bu t have yet to becom e fu lly in tegrated and
used to the ir full po tentia l w ith in an industria l setting. The 'novel' techn iques
h igh ligh ted in th is research are those o f p rim ary in terest to the au tom otive industry ,
L aser H ybrid W eld ing and C o ld M etal transfer. A literatu re survey o f bo th these
p rocesses has been carried out in o rder to assess and develop these p rocesses fo r use in
jo in in g h igh strength stain less steel to z inc coated m ild steel.
2.3.1 Laser Hybrid W elding
L aser hybrid w eld ing is defined as 'the coup ling o f la ser beam w e ld in g w ith a
conven tio na l w eld ing p rocess', w ith the arc and the laser operating in a sing le elongated
process zone. C onventional w eld ing p rocesses w h ich can be used in th is hyb rid system
are G as M etal A rc W eld ing (G M A W ), G as T ungsten A rc W eld ing (G T A W ) or p lasm a
arc w eld ing. C urren tly the m ost com m on w eld ing p rocesses to be com b ined w ith L aser
is G M A W and G TA W and is o ften referred to in d ifferen t w ays such as hyb rid laser-
M IG w eld ing , L aser M IG /M A G w eld ing , L aser-arc w eld ing and various com binations
o f the above. For the purpose o f th is research G M A W w eld ing w as used and the p rocess
w ill be referred to as L aser H ybrid W eld ing (LH W ). F igure 3 be low show s the
schem atic d iagram o f the laser hyb rid system using G M A W .
F igure 3. Schem atic d iagram o f the laser hybrid w eld ing m od ified from so u rce13
35

The concept o f laser hybrid welding was first introduced in the 1970’s by E boo a n d
S teen14, who used a 2kW continuous wave CO2 laser together with a GTAW welding
set to w eld samples o f 0.2mm tin sheet. It was established that the electric arc w ill
preferentially root into the hot spot generated by the laser welding, this allowed greater
welding speeds to be achieved as the additional energy o f the electric arc was allowing
full penetration to occur at speeds when a laser welding process would only penetrate a
fraction o f the required thickness. This research established that laser hybrid systems
could produce higher processing speeds than any other fusion process at this time.
Work by A lexan de r a n d S teen15, looked into the effect that the speed and the arc
characteristics were having on the weld bead and penetration, they welded mild steel in
two different thicknesses, 12mm and 2mm, the outcome was that 100 amps o f arc
current could be added to the laser process with no significant detrimental effects on the
weld bead. The processing speed was double that o f laser welding or a 20% increase in
penetration could be observed at a given welding speed.
Since the early innovation o f laser hybrid welding improvements have been made to the
process and a variety o f research projects have been undertaken, mainly using GTAW
welding with materials such as steel and aluminium being investigated. However, as
Walduck a n d B iff in16 explained in 1994 there had been no commercial application or
adoption o f the technique to that date, due to the instability o f the process during
welding. Research throughout the 1990's mainly in Germany and Japan allowed the
process to become more established and thus it began to be utilised within industry17.
Laser Hybrid W elding was originally developed using a CO2 type laser, developments
over the years have enabled Nd:YAG lasers to be used with studies being carried out
on both setups. It has been found that LHW using a Nd:YAG has been studied w idely
for thin sheet applications mainly for use in the automotive industry. W here higher
power is required, for example in the welding o f thick sheets LHW with a CO2 laser is
one o f the most promising solutions in terms o f optimum power to cost ratio, having a
significant advantage over using a Nd:YAG laser for the same application18.
Work by Tan i e t a /79investigated the effect o f shielding gas in the laser hybrid process.
They carried out experiments on 304 stainless steel billets (15 x 10 x 120mm) in a butt
jo in t configuration with poor quality edge preparation and the investigation looked at
36

three different shielding gases, 30% He + 67% Ar + 3% O 2 , 40% He + 57% Ar + 3%
O2 and 50% He + 47% Ar + 3% O2 . The work concluded that the shielding gas with the
minimum helium content o f 30% is required in order to lim it the plasma formation and
consequent low laser power absorption. Between 30% and 40% helium content w ill
allow the GM AW synergic line to be followed with good process feasibility. The
synergic line is a relationship between the current and voltage for a particular wire and
gas combination as defined by the manufacturer o f the equipment. A helium content
above 40% leads to unstable arc conditions and it was found that for a cost effective
w elding environment the shielding gas flow rate could be between 10 and 30L /m in19.
M odelling o f the prediction o f the w eld pool shape in plasma augmented laser welding7(1
was carried out by V itek e t aI from 1997, until that point there was no commercial use
for laser hybrid processes. The worked looked at combining laser w elding with that o f
plasma arc welding, join ing 1.5mm thick cold rolled carbon steel sheet. Autogenous
welds were produced, the weld geometry was then assessed and neural network analysis
carried out, this enabled V itek et al to form a viable model to predict the w eld pool
shape. The model indicated that the weld pool penetration is a sensitive function o f the
laser power (this was confirmed with experimental data). The critical laser power
increases with increasing welding speed and that the depth o f penetration is insensitive7(\
to the current o f the arc process .
Work carried out by W ou ters21 confirmed that the joint penetration was dependent on
the laser power during laser hybrid welding and that the hybrid process is insensitive to
gaps below 3mm as long as the MIG parameters are set to bridge the gap. The research
also assessed the influence o f join t gap on the strength o f the w elds, the w elds were
partial penetration butt joints it was concluded that gaps less than 0.5mm or greater than
2mm should be avoided in partial penetration welds because they introduce stress
concentration into the weld geometry consequently affecting the overall strength o f the
joints. The work by W ou ters21 was carried out on carbon steel sheets.
37
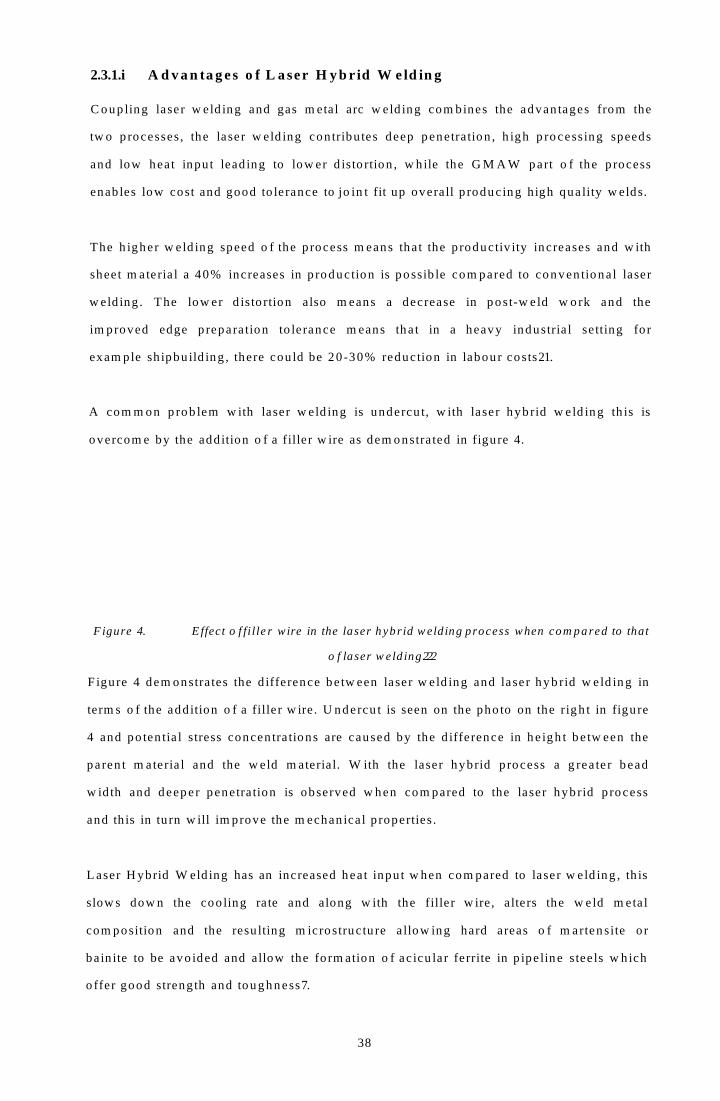
C oup ling laser w eld ing and gas m etal arc w eld ing com bines the advantages from the
tw o p rocesses, the laser w eld ing contribu tes deep penetration , h igh p rocessing speeds
and low heat input lead ing to low er d isto rtion , w h ile the G M A W part o f the p rocess
enab les low cost and good to lerance to jo in t fit up overall p roduc ing high qua lity w elds.
The h igher w eld ing speed o f the process m eans that the p roductiv ity increases and w ith
sheet m ateria l a 40% increases in p roduction is possib le com pared to conven tional laser
w eld ing . The low er d isto rtion also m eans a decrease in post-w eld w o rk and the
im proved edge p reparation to lerance m eans that in a heavy industria l setting for
exam ple sh ipbu ild ing , there cou ld be 20-30% reduction in labour costs21.
A com m on p rob lem w ith laser w eld ing is undercu t, w ith laser hyb rid w e ld ing th is is
overcom e by the add ition o f a f il ler w ire as dem onstrated in figure 4.
2.3.1.i A d v a n ta g es o f L aser H yb r id W e ld in g
F igure 4. E ffect o f f i l le r w ire in the laser hybr id w eld ing process when com pared to that
o f laser w eld ing222
F igure 4 dem onstrates the d ifference betw een laser w e ld ing and laser hyb rid w e ld ing in
term s o f the add ition o f a fil le r w ire. U ndercu t is seen on the pho to on the r igh t in figure
4 and po ten tia l stress concentrations are caused by the d ifference in he igh t be tw een the
paren t m ateria l and the w eld m ateria l. W ith the laser hybrid process a g rea ter bead
w id th and deeper penetration is observed w hen com pared to the laser hyb rid p rocess
and th is in tu rn w ill im prove the m echan ical p roperties.
L aser H ybrid W eld ing has an increased heat input w hen com pared to laser w e ld ing , th is
slow s dow n the coo ling rate and along w ith the f iller w ire, a lters the w eld m eta l
com position and the resu lting m icrostructu re a llow ing hard areas o f m artensite or
bain ite to be avo ided and allow the form ation o f acicu lar ferrite in p ipe line stee ls w h ich
o ffer good strength and toughness7.
38

Laser Hybrid W elding has a growing number o f industrial applications due to both the
technological and econom ic advantages LHW has over other welding processes. The
majority o f the applications currently in use concentrate on laser hybrid welding o f
2mm to 10mm thick sheets21.
Laser Hybrid welding has already been introduced into the automotive industry, both
Audi and Volkswagen have been using this process. Volkswagen22,23 has been using the
laser hybrid process for the aluminium doors o f the VW Phaeton. They have also
introduced it in the manufacture o f the tailgate o f the VW Bora and this includes laser
hybrid welding galvanised steel.
Audi are also using this process in the production o f the aluminium lateral roof area o f
the Audi A8 and have used it for welding the galvanised steel C-Pillar o f the Audi TT.
U ses o f this process in the shipbuilding, land pipeline and aerospace industries are also
on the increase, with a recent introduction o f a portable laser hybrid kit for the
shipbuilding industry24.
Laser Hybrid W elding is fu lly automated and requires a robot to operate successfu lly.
2.3.1.2 A p p l ic a t io n s o f L a s e r H y b r id W e ld in g P r o c e ss
39

2 .3.2 Cold M etal T ransfer
C old M etal transfer is a re la tive ly recen t innovation. It becam e com m erc ia lly availab le
in the au tum n o f 2004, and w as developed by TPS- F ron ius25. O rig ina lly m arketed to
the au tom otive industry to jo in a lum in ium to steel in o rder to benefit from the strength
o f steel and the w eigh t sav ing o f alum in ium " , it is a lso look ing p rom ising fo r w eld ing
sta in less steel and zinc coated m ild steel.
C o ld M etal T ransfer (C M T ) is essentia lly a gas m etal arc w eld ing p rocess w ith a
s ign ifican tly low er heat input w hen com pared w ith conven tional d ip arc p rocesses.
“C o ld ” is a re la tive term in th is p rocess and its based on con tro lling the dip transfer o f
the arc.
C M T d ifferen tia tes from the m ore com m on dip transfer p rocesses because the w ire
m otion is incorpora ted in to the p rocess contro l, therm al inpu t is d im in ished and finally
the transfe r o f the m etal takes p lace w ithou t causing any spatter27.
In the C M T p rocess the w ire is no t only fed tow ards, bu t a lso w ithdraw n, from the w ork
p iece g iv ing an oscilla ting w ire, at an average frequency o f 70H z. T he w ire is fed
tow ards the w ork p iece until short c ircu it occurs; as th is happens the w ire d irec tion is
reversed and the w ire retracted. W hen the short c ircu it opens again the w ire speed is
reversed again and the w ire fed tow ards the w ork p iece28. F igure 5 be low show s the
p rinc ip le o f the C M T process w ith the oscilla ting wire feed28.
F igure 5. The C M T Process - dem onstration o f the oscil la ting w ire28
The therm al input during the C M T process is low ; this is due to the a lm ost cu rren t free
m etal transfer. In standard d ip arc process a h igh short c ircu it cu rren t is observed ,
w hereas in the C M T process the current is no t responsib le fo r the open ing o f the short
c ircu it. The m ovem ent created from the w ithd raw ing o f the w ire supports the m eta l
transfer because o f the surface tension o f the m o lten m ateria l. This leads to the cu rren t
ms 1 = 4.59 ms I * 6,21 m s ( = 7.56 m s I = 11,34 ms 1= 13,23 m s 1 = 13,77 m s t = 14.31 m s
40

being kept very low and consequently the heat input is kept at a minimum. Figure 6
shows a schematic picture o f the current and voltage during the CMT process28.
F igu re 6. S chem a tic p ic tu r e o f the cu r ren t a n d vo lta g e in re la t io n to t im e d u r in g the CM T
28p ro c e ss
Due to the controlled motion o f the wire and the controlled short circuit, virtually
spatter free welding is possible when the CMT process is used.
Limited work has been carried out on CMT as a process, and even less has been carried
out on the materials highlighted within this research. The majority o f research carried
out to date for the CMT process has been with aluminium. CMT is show ing prom ising
results for aluminium when compared to laser welding and laser hybrid weld ing. P in to
e t a l investigated the effects o f microstructure and residual stress in aluminium w elds
using the CMT process, MIG and Laser Hybrid W elding (LHW ), It was found that the
microstructure o f all three welds was very similar, the shape o f the w eld bead were quite
different dependent on the process, notably CMT had a more prominent and larger w eld
bead than the other two process with quite a circular shape with the Laser Hybrid W eld
41

having an asymmetrical w eld bead. It was found that the CMT and LHW w elds had a
smaller Heat A ffected Zone (HAZ) than the GM AW welds and finally the residual
stresses were lower in the CMT w elds than the GMAW welds which can be attributed
to a lower heat input29.
2.3.2.1 A pplications o f Cold M etal T ransfer
CMT welding is reportedly being used at Volkswagen Sachsen, Germany30, for the C-
Pillar in the Bentley Continental and the VW Phaeton as o f January 2006, this is an
important part o f construction and requires the welding o f three different thicknesses o f
material. The process is being used because o f the spatter free advantage thus
minim ising any post w eld work. The CMT process is still being researched for
extensive use within the automotive industry but has been used to successfu lly jo in thin
sheets o f aluminium to m ild steel.
Other applications o f the CMT process could include the aerospace industry along with
structural and shipbuilding applications although these industries have yet to report
successful use o f CMT. Currently successful jo in ing o f zinc coated m ild steel to
stainless steel within an industrial or commercial setting has not been reported.
Although some preliminary research has been carried out w ith promising results31.
42

2.3.2.2 A d v a n ta g e s a n d L im ita t io n s o f C o ld M e ta l T ra n s fe r
Advantages o f the CMT process include spatter free welding thus elim inating localised
hard spots, when welding carbon manganese steels, due to the occurrence o f phase
transformation when molten spatter comes into contact with the cold parent material.
An elim ination or reduction in spatter m inim ises the need for post w eld work. Cold
M etal Transfer has a reduced heat input when compared to other arc w elding processes
due to the controlling o f the dip transfer and good gap bridgeability when compared to
autogenous processes due to the addition o f a filler wire. These advantages make the
process ideal for use within the automotive industry.
W hilst initial equipment setup costs are on a par with most arc w elding processes and
favourably cheaper than that o f hybrid welding, laser welding and electron beam
welding, lim itations o f cold metal transfer are that the process cannot be carried out
manually due to the controlling o f the dip transfer, and there is a need for a robot to
operate, this then increases the setup costs depending on the cost o f the robot.
43
2.4 M a te r ia ls
Three materials were chosen for this research project; two grades o f high strength
stainless steel and one grade o f zinc coated mild steel.
2.4.1 Stain less Steel
Stainless steel is a generic term for many grades of steel with a range o f compositions
and material properties. Stainless steels are classified in six categories according to their
microstructure at room temperature which in turn corresponds to their alloy composition.
The six classes are ferritic, martensitic, austenitic, martensitic-austenitic, ferritic-
austenitic (duplex) and precipitation hardening. The first five are named after the
dominant components o f the microstructure and the sixth category, precipitation
hardening is named because these steels are hardened by a mechanism involving the
formation o f precipitates within the microstructure32’33.
2.4.1.1 A ustenitic Stain less Steels
Austenitic stainless steels are the most com m only used type o f stainless steel and are
characterised by excellent corrosion resistance, very good toughness, good weldability
and good ductility. Austenitic stainless steels have lower melting points, higher
electrical resistance, lower coefficients o f thermal conductivity and higher coefficients
o f thermal expansion than carbon steels34
This group o f stainless steel have a face centred cubic microstructure and this is retained
at room temperature by suitable alloying, the most common being nickel. Austenitic
stainless steels are also highly alloyed with chromium to offer good corrosion resistance.
They can be used in many applications including, piping systems, heat exchangers,
tanks, in high temperature applications and in any application where a non magnetic
material is required32.
44

2.4.1.2 D uplex Stain less Steels
Duplex stainless steels contain both ferritic and austenitic microstructures in
approximately equal proportions. Duplex stainless steel is produced by balancing
austenite forming elements such as N i, Mn, C and N with ferrite forming elements such
as Cr, M o, Ti, Nb, Si and A l35. Duplex steels are characterised by high strength, good
toughness, and good corrosion resistance with excellent stress corrosion cracking and
corrosion fatigue resistance . Duplex structures are also resistant to solidification
cracking which can occur in stainless steels during welding35.
Applications for duplex stainless steels is on the increase, particularly with the
development o f LDX 2101, because not only does it have higher strength than
com m only used grades o f austenitic stainless steel, it has a significantly lower nickel
content, making the material less sensitive to price variation36. Applications for duplex
stainless steels include hot water tanks in breweries, various applications o f chem ical
tanks, heat exchangers and vessels. They are also used in the offshore industry, super
duplex steels with higher contents o f Cr and M o are used in environments where there'X')
are high chloride concentrations, for example, sea water .
45

2.4.2 Zinc Coated M ild Steel
The term mild steel usually means a carbon content up to about 0.3%. Many grades o f
mild steel are used within the automotive industry. The grade identified for use in this
work is rephosphorised steel with increased ultimate tensile strength between 380 and
420 MPa and a y ield strength o f 190 to 270 MPa, commercially it is known as Dogal
260RP-X37.
The steels gain their strength from the addition o f phosphorous usually about 0.1%, to
an aluminium killed based steel. The phosphorous additions give the increased strength
by means o f solid solution strengthening and exhibit yields strengths o f up to 30% more
than normal carbon steels.
The mild steel is received in the hot-dip galvanised condition in order to achieve
adequate corrosion protection. The hot-dip galvanising process places a layer o f zinc on
the surface o f the steel providing protection against corrosion on any exposed surfaces.
The hot-dip galvanising process involves 4 stages:
• Surface Preparation
• Galvanizing
• Quenching
• Inspection
Before the steel is galvanised surface preparation needs to take place. This occurs in 3
sub-stages, caustic cleaning first removes any dirt, paint, o il or grease. The second stage
is acid pickling to remove any scale and dust then finally fluxing is carried out to
prevent any oxides from forming prior to galvanising.
The next stage o f the process is galvanising. The steel is completely immersed in a bath
o f molten zinc at a temperature o f 440°C, the zinc is then metallurgically bonded to the
steel by the formation o f an iron-zinc layer. The excess zinc is then drained or vibrated
o ff on removal from the bath.
46

The steel is then quenched in dilute chromate solution allow ing immediate handling and
inspection to take place. Finally the coating is inspected in order to assess the coating
th ickness, adherence and appearance .
Various coating thickness are available and in accordance with BS EN 10142:200039,
with thickness from 7pm on both sides o f the steel sheets.
47

2.5 E f fe c t o f th e Z in c C oa tin g D u r in g W eld ing o f D iss imila r
M eta ls
Liquid Metal Embrittlement (LME) is the brittle fai lure o f a normally ductile material
when it comes into contact with a liquid metal when subjected to an internal or external
tensile stress.
Zinc has a melting point o f 419°C and w ill begin to diffuse into and penetrate primarily
along the grain boundaries o f unstressed austenitic stainless steel above 450°C, this is
known as type I embrittlement. Above temperatures of 750°C stressed austenitic
stainless steel exposed to molten zinc w ill exhibit rapid crack propagation perpendicular
to the applied stress, and this is type II embrittlement which is w idely known as LME.
During the welding o f stainless steel i f zinc is present close to the w eld then cracking
can occur and have a detrimental effect on the mechanical properties. In order to
completely eliminate such cracking zinc coatings should be completely removed for the
areas o f material undergoing welding40, this is not always practical particularly in an
industrial environment.
During welding the zinc is vaporised (900°C) and this can have an adverse effect on the
resulting weld bead, when zinc vapour is present during welding blowholes and zinc
induced cracking to the surface can be present. The risk o f LME is present during both
Laser Hybrid W elding and CMT, however, there are ways o f reducing the effect o f the
zinc by controlling the process parameters31,41,42.
Zinc coated steel sheets are w idely used in the automotive industry and are more often
than not jo ined using arc welded processes or laser welding, the w elding speed is
restricted to 1.2m/min because o f problems with spatter and pits. Experimental work
carried out by Pan a n d R ich a rd son 43 assessed laser w elding for lap jo in ing o f zinc
coated steel sheets, it looked at the problems and common solutions for issues
associated with zinc vapour during welding. The most popular technique to reduce the
damage o f the zinc vapour is to employ an air gap between the sheets to be welded,
usually about 0.1mm to provide a venting channel for the zinc, allow ing a better quality
weld to be produced. However, this is not a practical and cost effective solution for
manufacturers. Therefore Pan a n d R icha rdson developed a clamping system which
48

allowed an air gap to be present below the two sheets in the hope o f allow ing enough air
circulation around the join t to m inim ise the effect o f the zinc. It was concluded that the
air gap did have a significant influence on the process, however, some surface defects
were still evident.
Research has been carried out for welding o f zinc coated mild steel using the Laser
Hybrid process41. The advantages o f Laser Hybrid W elding when compared with
GM AW were found to be, a w ider range o f applicable welding current, arc voltage and
higher welding speeds (1.2m /m in when compared with 2m/m in), a reduction in spatter
and a reduction in the number o f pits.
Problems associated with zinc vapour could not be completely elim inated using the
Laser Hybrid process. The research showed that there is potential to improve LHW in
order for defect free welds to be consistently produced.
Other work carried out concludes that laser hybrid welding suppresses the formation o f
blowholes when compared to laser welding42. It is thought that due to the GM AW torch
follow ing the laser welding in the hybrid process the molten metal solid ifies at a slower
rate than that during laser welding, this gives sufficient time for the zinc vapour to
escape from the molten weld pool leaving the w eld bead relatively free from porosity.
Work carried out on zinc coated ultra high strength steel 1.5mm thick in an lap join t
configuration using Laser Hybrid W elding concluded that the process is less stable for
zinc coated sheets than uncoated sheets o f the same material. Therefore the w indow for
welding coated steel sheets is much narrower than the process w indow for uncoated
sheets44.
49

2.6 D iss im ila r M e ta l J o in in g o f S ta in less S te e l to Z in c C oa ted
M ild S te e l
Research has been carried out for many years into welding and join ing processes for the
successful jo in ing o f dissim ilar metals. Dissim ilar metals means that the two materials
to be jo ined vary in chemical composition, microstructure and material properties for
example different grades. The aim o f this research is to investigate the join ing o f
stainless steel to zinc coated mild steel using recently developed w elding processes with
particular focus on the automotive industry. D issimilar metal jo in ing is notoriously
difficult and is more challenging than similar metal jo in ing because o f the differences in
physical, mechanical and metallurgical properties of the two parent materials to be
jo ined45.
When welding metals it is important that the correct filler wire and shielding gases are
used. The manufacturers o f the materials usually have recommendations for particular
material combinations, and these have been tested so that welds with desirable
mechanical and corrosion properties can be obtained. W elding stainless steel to zinc
coated mild steel is more difficult and therefore the filler wire selection requires a
compromise between the two dissimilar metals45. In this situation the Schaeffler-Delong
diagram is used in order to predict the microstructure o f the weld, so enabling the
correct filler wire to be chosen.
50

u ■+ „
3u' - pox
4 # i
•
*
r /
M l
f K
j m
• AA.A
• i U H ■
*
• 5 3 A M9
•
. ••
: ' *•
•
•
f
9 -
■ 4 W/ '
• ' M 1 1 Q
C rcq = % C r + 1 ,5x% S i + % M o
F igure 7. The Schaeffler-D elong D iagram 32
Figure 7 show s the S chaeffler-D elong D iagram it summ arises the effect o f a lloy ing
add itions on the structure o f stain less steel, in order to p red ic t the m icro struc tu re o f a
stain less steel the C hrom ium and N ickel equ ivalen ts need to be ca lcu la ted as ou tlined
below .
C hrom ium equ iva len t = % C r + 1.5x% Si + % M o
N ickel equ iva len t = % N i + 30x(% C + % N ) + 0 .5x(% M n + % C u + % C o)
The d iagram can be used to p red ic t the m icrostruc ture o f a w eld , by ca lcu la ting the
chrom ium and nickel equ ivalents fo r both paren t m ateria ls and the f il ler w ire and tak ing
in to consideration the d ilu tion during the w eld ing p rocess. This w as carried ou t fo r the
m ateria l com binations in th is research and the results are show n in section 4.
A s outlined in C hapter 1, challenges are faced w hen try ing to w eld d issim ila r m eta ls
w ith the m ajo r challenge being the form ation o f brittle in term eta llic phases tha t can
have detrim enta l effects on the m echan ical p roperties o f a jo in t2.
51

Limited work has been carried out using Laser Hybrid W elding and Cold Metal
Transfer, but the results to date indicate that dissim ilar metal jo in ing using these
processes w ill be successful.
D issim ilar metal join ing has been investigated using Laser beam welding. Work carried
out by M atsunaw a e t a ? 6 looked at the effect o f w eld profile, porosity in the w eld zone
and LME in lap joints o f austenitic stainless steels joined to zinc coated carbon steel.
The work investigated different shielding gasses and process parameters to try and
optim ise the process for this application o f dissimilar jo ining. It was concluded that in
order to produce high quality lap welds (austenitic stainless steel to zinc coated mild
steel) that were free from porosity and LME, the zinc coating needed to be com pletely
removed before welding.
A small amount o f work has been carried out using the laser hybrid process for jo in ing
Hy-Tens stainless steel to Dogal 220 RP (zinc coated mild steel), in a lap joint
configuration47. It was suggested that the welding spot should be focussed on the H y
Tens material in order to m inim ise the zinc vaporisation, this enabled smooth w eld bead
transition and deep penetration to be achieved, and no internal or surface breaking
defects were observed.
Recent work carried out by Westin e t a l investigated laser hybrid w elding for the
jo in ing o f LDX 2101 to Dogal 220 RP Z 100 (m ild steel with a 7pm zinc coating) in a
lap joint configuration, with the mild steel on the top. It was concluded that the join t
showed sufficient strength and that the LDX was resistant to Liquid M etal
Embrittlement (LME) or zinc attributed cracking, un like austenitic stainless steels,
making LD X 2101 highly suitable for automotive applications where, the jo in ing o f
stainless steel and zinc coated mild steel is required.
Research has been carried out for dissimilar metal jo in ing in a lap join t configuration-5 1
for using the CMT process . The work joined Hy-Tens stainless to zinc coated Dogal
DP 600. The aim o f the research was to find a w indow within the CMT process where
Liquid Metal Embrittlement (LME) does not occur. It was concluded that CMT is
capable o f producing spatter free and aesthetically pleasing w eld seams. H owever, a lot
more work is needed in order to understand and evaluate the process for this application.
52

2.7 F a tig u e
Engineering components very rarely fail due to a single application o f load and often the
design engineers work w ell within the boundaries o f the 'safe' static load it can
withstand. Engineering materials w ill experience a w ide variety o f operating conditions.
The majority o f components in motor vehicles and other applications w ill undergo
variable loading conditions throughout service life. The loading conditions can be a
result o f changes in vibration, power, load and temperature to name a few .48
M any failures occur due to repeated cyclic loading lower than that o f the components
static strength, this mechanism is referred to as fatigue. G enera l P r in c ip le s f o r F a tig u e
Testin g o f M e ta ls (1964 ) 49 states that the term fatigue 'applies to changes in properties
which can occur in a metallic material due to the repeated application o f stresses or
strains, although usually this term applies specially to those changes which lead to
cracking or failure.'
In industry, there is a need to understand the mechanisms o f fatigue for different
materials and components because it is estimated that over 75% o f structural and
mechanical failures are caused by some form o f fatigue50. Fatigue failure in service can
often be catastrophic, in order to prevent this, laboratory fatigue testing is carried out
and is often an important part o f a material or component validation procedure for in
service applications.
August Wohler was the first person to propose a relationship between fatigue lim it and
applied stress. Wohler was a German railway engineer whose studies involved fatigue
tests on full scale railway axles for the Prussian Railway Service between 1852 and
187051. From the results o f his tests W ohler plotted the nominal stress (S),against the
number o f cycles to failure (N ), to produce what is now commonly known as the S-N
curve.
S-N curves are produced within a laboratory environment by testing a series o f identical
specim ens to establish the relationship between the nominal stress and the number o f
cycles to failure for any type o f loading regime. S-N curves are the m ost readily
available form o f fatigue data and can be used to predict the expected fatigue endurance
for components subject to a particular cyclic stress48.
53

S-N curves are usually plotted w ith the nominal stress, S on the y-axis and the number
o f cycles to failure, N on the x-axis. N is almost always plotted using a log scale w ith S
on a linear scale. Figure 8 below shows a typical S-N curve51,52,53.
F igu re 8. T yp ica l S -N C u rve
There are different approaches for fatigue testing o f materials or joints, and often
planning o f fatigue tests is specific and dependant on the material, the specim en shape
and the information that is required from the testing.
To carry out a fatigue test the loading conditions need to be decided and this w ill vary
depending on the situation to be tested. The two main parameters to be considered
when planning a fatigue test are the stress ratio and the stress cycle.
2.7.1 Stress Ratio
The stress ratio, R, is the ratio between the minimum stress component and the
maximum stress component in one cycle o f a fatigue test52. Equation 1 below outlines
the calculation for the stress ratio value.
j . S tressM„
S tre ss<™
E qu a tio n 1. S tr e ss R a tio , R , eq u a t io n
54

2.7.2 Stress Cycle
The stress cycle o f a fatigue test is defined as the smallest segment o f the stress-time
function which is repeated periodically and identically, it is defined by the stress
component, shape and the frequency .
Usually the fluctuating stress is represented as a series o f peaks and troughs connected
by a sine wave, as shown in figure 9 below.
F igu re 9. D ia g ram ou tlin in g te rm in o lo g y a n d fo rm o f a f a t ig u e s tr e ss c y c le
The test is carried out at this constant amplitude with each cycle having the same
maximum and minimum stress values . This cyclic testing can be described w ith the
follow ing parameters:
M aximum stress limit, S max
Minimum stress limit, S mjn
Mean stress, Sm 0.5(Smax Smin)
Stress range, Sr= S max- Smin
It is often necessary for positive and negative values o f minimum and maxim um stress
and mean stress to be considered for design purposes.
55

During a fatigue test each stress cycle contributes to the initiation and growth o f the
fatigue crack, with the number o f cycles needed to cause a failure depending on the type
o f loading. A s a general rule, it is tensile stresses which produce fatigue damage, any
stress cycle which involves a compressive period w ill have a less damaging effect than a
stress cycle which is w holly tensile. A fu lly tensile stress cycle w ill increase in damage
as the mean stress component increases. Fatigue behaviour o f 'as-welded' join ts can
sometimes differ from this rule, due to the residual stresses sometime imposed during
w elding53.
56

Staircase fatigue testing also known as the 'up and down' method is a statistical method
o f determining mean fatigue strength o f a sample at a pre determined cycle life. The
method was first introduced in 1943 at the Explosives Research Laboratory, Bruceton,
Pennsylvania54.
Staircase fatigue testing is a w ell established method and is increasingly being used
within the automotive industry to predict the fatigue behaviour o f components. In a
m ove to shorten the cycle o f design to production the automotive industry relies heavily
on finite element analysis in order to analyse the stresses in components. Characterising
fatigue strength is difficult due to the length o f the tests and the variation in results.
Staircase fatigue tests are the solution because they allow the fatigue tests to concentrate
at the fatigue life or level o f stress the designer is interested in. Another advantage is
that the method is simple in its execution and the calculated outputs (mean strength and
standard deviation), giving a statistically determined minimum (the mean minus 3
standard deviations) for the specification o f components55.
This method is often also used on welded joints because a length o f join t can vary in
quality and by using the staircase method anomalous samples can be identified and thus
not give a false indication o f fatigue strength, whether positive or negative.
The test specim ens are tested sequentially with only one specimen tested at a time. The
first specimen is tested at a stress level equal to the estimated mean fatigue strength o f
the sample at the pre-determined number o f cycles. The first level is often a guess but
can also be based on experience o f previous testing. I f the specim en fails before
reaching the pre-determine number o f cycles, then the next specimen is tested at a lower
level, i f the specim en reaches the pre-determined number o f cycles then the next
specimen is tested at a higher load level.
The stress level increments are set by the experimenter and it is important that the
increment is chosen correctly. Ideally the majority o f the test should be made at 3 stress
levels, with about 50% surviving at the middle level, 70% surviving at the lower level
and approximately 30% surviving at the higher load level. In order to chose the correct
load increment efficiently previous test data for similar materials or specim ens should
be used. However, i f none is available preliminary tests w ill need to be carried out in
57
2.7.3 S ta ir c a se F a t ig u e T e s t in g

order to best determine the increment for the main staircase test. The stress level
increment is usually comparable to the standard deviation o f the results52,54,56.
The primary advantage o f this method o f testing is that the tests are automatically
concentrated on the mean fatigue strength o f the samples and the statistical analysis is
quite simple when compared to other statistical methods o f fatigue testing. One
disadvantage o f this method is that each test has to be carried out separately as the stress
level o f the next test depends on the preceding test, this means that testing can take a
long time depending on the pre-determined cycle and the frequency o f test54,56.
To ensure the accuracy o f the results and to reduce the number o f unnecessary test then
usually between 20 and 50 specim ens are required for a single staircase test for a given
material combination57.
58

T here are th ree stages o f fatigue failure, c rack in itia tion , crack p ropagation and total
fa tigue fa ilure. Fatigue fa ilu re occurs at the atomic level o f the m ateria l and the effect o f
the cyclic load ing w ill beg in from the first stress cycle.
R epeated cyclic load ing on a m ateria l resu lts in slip o f the atom s w ith in the g ra ins as
they m oved against each other, resu lting in the irreversib le shear d is locations w h ich are
then m oved tow ards the surface o f the m ateria l as load ing continues. A s the fatigue
cycling continues, d is locations beg in to p ile up and form a structure know n as P ersisten t
Slip B ands (PSB ). The constan t m ovem ent o f the P S B ’s at the surface causes the
m ateria l to be pushed out, th is is know n as ‘ro ughen ing ’. R oughen ing resu lts in the
p roduction o f m icroscop ic w aves at the m ateria l surface often re ferred to as ‘ex tru s io n ’
(the peaks o f the w aves) and ‘in trus ion ’ (the trough o f the w aves), the in trusions then
act as m icro notches (f igure 10). A cting as stress concentrations these m icro no tches
cause add itional slip even tua lly lead ing to fatigue crack nuc leation48,51.
2.7.4 F a tig u e F a ilu re M ech a n ism
■ Surface
/ —
Slip Pane
/■ - -------
Figure 10.
O nce a crack has nuc leated there is a substantia l discon tinu ity th rough the m ateria l
lead ing to an increase o f local stress at the crack tip. A s the m ateria l con tinues to
undergo cyclic load ing, the m ateria l a long the crack is stre tched and on the repeated
open ing and c losing o f the crack p ropagation occurs.
C rack In itia tion M echan ism 58
59

A s the crack propagates through the material the fractured surfaces rub together creating
a smooth area o f the fracture face which also shows ‘beach’ marks or concentric rings to
indicate the point o f origin o f the crack. Finally, the remaining section o f the intact
material becom es too small to support the cyclic loading causing the rate o f propagation
to increase leading to complete fracture59,60,61. Figure 11 below shows a schematic
image o f a typical fatigue fracture surface.
F igu re 11. S chem a tic d ia g ram o f a ty p ic a l f a t ig u e fr a c tu r e su r fa ce
The rate o f fatigue crack initiation and propagation through the material depends on a
number o f factors. Surface defects including machine markings or w elds w ill act as
immediate stress concentrations and the materials may have internal defects such as
inclusions both w ill affect the rate o f initiation and propagation o f a fatigue crack.
60

2.7.5 F a c to r s A f fe c t in g F a t ig u e P r o p e r t ie s
There are many potential factors that can affect the fatigue properties o f engineering
components. Fatigue failures generally occurs due to effects o f the surface or sub
surface o f the material, or through the occurrence o f stress concentrations in the material
causing the local stress to be raised higher than the average stress o f the component
during test. Factors that can affect the fatigue properties o f welded joints are
geometrical, environmental and rotational.
2.7.5.1 G eom etrical Factors
A change in the geometry o f a component is one o f the most common effects o f fatigue
and can be caused by cracks, notches or severe changes in cross section. Often the
discontinuities are as a result o f a design requirement or specification, the change in
geometry w ill then cause uneven loading at the discontinuity o f an otherwise evenly
loaded component. The increase in stress concentration at the change in geometry w ill
then allow a crack to nucleate and propagate through the component at the point o f
increased stress concentration51.
Many engineering components are welded; an immediate change in geometry through
the section o f a component is evident i f a weld is present. This change in geometry can
have an effect on the performance o f a component due to the added stress concentration
at particular points particularly i f the welded par t is subjected to fatigue loading during
the components life cycle.
For welds i f the transition between the w eld toe and the parent material is smooth then
the stress concentration is likely to be low , however, in most cases o f w eld ing there is
an abrupt change between the two components and therefore the stress concentration is
likely to be high53.
61

The conditions in which a fatigue test is carried out can often have an effect on the
outcome. Work carried out by Gough a n d S o pw i th 62 demonstrated that oxygen
containing media and moist and aqueous environments w ill generally have a negative
effect on fatigue life. Many fatigue tests are carried out in air to provide reference data
for particular materials and components. During service many components can be
exposed to other mediums, such as corrosive, elevated or low temperature environments.
Components may be subject to a corrosive environment whilst undergoing fatigue
loading, the environment may produce negligib le general corrosion o f the structure, i f
there are cracks or crevices present then intensive localised attack can occur. Both
fatigue loading and a corrosive environment can often cause more damage than i f the
two effects were imposed separately ’ .
I f a component or welded structure is subject to elevated temperatures then as a general
rule the fatigue strength tends to decrease with an increase in temperature. I f a
component or welded structure is subjected to low temperature then the fatigue strength
can increase. This is because at temperatures below ambient the rate o f propagation o f a
fatigue crack is reduced thus increasing the fatigue strength. Alternatively, i f the
materials fracture toughness is reduced, to a point where the component can fail by
brittle fracture from a fatigue crack early on in t he test then the fatigue w ill be
negatively effected .
2.1.52 E n v ir o n m e n ta l F a c to r s
62

Previously, work using laser hybrid welding has been carried out on butt, lap and fillet
jo in t configurations 1 4 ,1 5 ,2 2 ,63 ’ 64. Butt joints are more commonly used within the
automotive industry especially for the manufacture o f laser welded tailored blanks and
both lap and butt join ts were considered in previous work carried out at SHU. Therefore,
lap and butt join ts w ill be the main jo in t configurations considered in this study.
The lap join t configuration w ill cause the join t to be eccentrically loaded during
mechanical testing, causing rotation o f the joint. The mechanism o f the rotation o f the
joint is outlined in Figure 12.
2.7.5.3 R o ta t io n
L o w load level Plastic H inges
M axim um stress concentration Fracture
F igu re 12. D e fo rm a tion o f la p j o in t du r in g lo ad in g65
Figure 12 shows that from the moment o f loading the lap joint w ill align itse lf so that
the load w ill run through the centre o f both plates.
63

Nordberg and McCann developed an analytical model to predict join t rotation using
beam-bending theory65. The equation is shown below.
e = ^ - pE - t 2
E q u a tio n 2. R o ta t io n A n g le C a lc u la t io n
Where,
p = Line Load (N/m m)
a = "free" ha lf length o f the specim ens or sheets (mm)
t = sheet thickness (mm)
0 = rotation in radians
E = Elastic Modulus (MPa)
However, in welds where dissim ilar thickness base materials are used the average
thickness needs to be calculated so:
2
E qu a tio n 3. To c a lc u la te t f o r j o in t s w ith d is s im i la r th ic k n ess b a se m a te r ia ls
D insley66 considered this model during work regarding the fatigue life properties o f
dissimilar metal laser welded lap joints and concluded that the fatigue properties o f the
dissim ilar lap joints were controlled by the severity o f the stress concentration at the
internal lap face and the early crack growth rate. It was also concluded that the severity
o f the stress concentration is directly linked to the applied load and rotation angle.
64

2.7.6 Fatigue Testing o f D issim ilar L aser H ybrid W elded Joints
There is no current literature o f fatigue properties o f dissimilar laser hybrid welded
joints, particularly stainless steel sheets joined to zinc coated mild steel. However, there
has been research to determine the statistically valid mean fatigue properties o f laser
welds conducted by D insley66 and resistance spots welds conducted by Marples67 and
Wray68. The results from these studies have also been reported in work by Nordberg69
where adhesive bonding and clinched joints were also reviewed.
The results o f the fatigue properties o f the different jo in ing techniques are presented in
terms o f line load. This is the applied load per unit length allow ing comparisons o f
join ts with different thicknesses on a line load bearing basis.
2.7.7 Fatigue Testing o f D issim ilar Cold M etal T ransfer Join ts
Currently there is very little literature involving the Cold Metal Transfer process and
even less, i f at all, for the fatigue properties o f the welds produced using the materials in
this research.
65

2.8 E f fe c t o f W eld G eom etry on F a tig u e P rope r ties
Geometry is one o f the main factors for causing fatigue failure as discussed previously
in section 2.7.5.1. W hen welded samples are fatigue tested any stress concentrations
present w ill affect the outcome and more often than not the stress concentrations present
in a welded samples are as a result o f w eld geometry . Within the literature there have
been many studies carried out predicting the relationship between w eld geometry and
fatigue life, often using Finite Element Analysis to assist in the modelling70,71.
Teng e t a l proposed a mathematical model to predict the effect o f butt weld
geometrical parameters and residual stresses on the Fatigue Crack Initiation (FCI) life o f
butt welded joints. The w eld geometry parameters considered were; w eld toe radius,
w eld bead flank angle, preparation angle and plate thickness. Figure 13 below shows a
schematic diagram o f the critical w eld parameters.
100 mm
Where,
r = w eld toe radius o f a butt welded joint
t = plate thickness
0 = w eld bead flank angle with surface
o = w eld preparation angle
F igu re 13. S chem a tic d ia g ram o f w e ld g eom e try p a r ame te r s72
The critical location for the weld and the initiation o f fatigue failure is the w eld toe,77
variations in this geometry w ill vary the stress concentrations accordingly. Teng e t a l
used Finite Element Analysis (FEA) to obtain local stress and residual stress
distribution. Figure 14 below shows the effect o f flank angle (0) on the Fatigue Crack
Initiation (FCI) life o f the tested samples. The graph shows that the FCI increases as the
value o f flank angle decreases. This occurs because the stress concentration becom es
more obvious with increasing flank angle therefore decreasing the fatigue strength o f
the specimen.
66

Fatigue crack initiation life (Cycles)
F igu re 14. The e ffec t o f f la n k an g le (6) on th e F C I life o f te s te d sp ec im en s722
The fatigue life o f a specimen can be controlled i f the geometry and, in this case, the
flank angle can be controlled. The main conclusions from this study were, that localised
heating and rapid cooling during welding can cause tensile residual stresses at the w eld
toe o f the butt joint. B y controlling the weld geometry parameters the FCI can be
improved and this can be done by increasing the w eld toe radius, decreasing the flank
angle or by carrying post-weld work for example grinding. Finally the more effective
geometric change for increasing the FCI is to reduce the flank angle (0) 722
7?Nguuyen a n d W ahab carried out a theoretical study o f the effect o f different parameters
• 7?(the same as used in Teng e t a l ) o f weld geometry on the fatigue life, the work used
FEA and Linear Elastic Fracture M echanics (LEFM) and the main conclusions drawn
from this work were, the fatigue life and strength o f butt joints can be improved by
adapting one o f the weld geometry parameters as follows; increase the radius o f the
weld toe (r), decrease the value o f flank angle (0 ), (it was also found that the best results
were when the angle was below 2 0 °), decrease the plate thickness (t), decrease the edge
preparation angle (0 ) or by eliminating weld toe undercut. The weld geometry o f butt
welds only affects the early stages o f crack growth including crack initiation, it has little
or no effect on the fatigue crack propagation.
67

2.9 Sum m a ry o f L ite ra tu re R ev iew
A s outlined in previous sections lim ited research has been carried out on LHW and
CMT as join ing processes and work has been carried out on dissim ilar metal join ing
using other welding and join ing techniques. Very little research has been carried out on
LHW and CMT processes for dissim ilar metal jo in ing particularly high strength
stainless steel to zinc coated m ild steel.
Extensive research on the fatigue properties o f welded join ts has been taking place for
many years, often resulting in the conclusion that the fatigue properties o f a welded
structure are directly related to the geometry o f the resultant joint.
This research w ill assess the mechanical and metallurgical properties o f dissim ilar metal
jo in ing and determine a relationship between the fatigue properties and w eld geometry.
The research focuses on the relatively unexplored join ing techniques o f Laser Hybrid
W elding and Cold Metal Transfer applied to join ing high strength stainless steel to zinc
coated mild steel. The joints are assessed in terms o f tensile, fatigue and metallurgical
properties.
68

3 Experimental Procedure
3.1 In trodu c tio n
Two experimental welding setups were used to produce the samples; one for the Laser
Hybrid W elding and one for the Cold Metal Transfer process. The majority o f the LHW
work carried out in this research used the Laser Hybrid W elding equipment located at
ESAB's Research and Developm ent Laboratory, Gothenburg, Sweden. This was used
for dissim ilar join ing for both butt and lap join t configurations.
The Cold Metal Transfer equipment was used for dissim ilar join ing in a butt joint
configuration only. The specifics o f the equipment can be found in sections 3.1.1 and
3.1.2 respectively.
Once w eld optimisation had taken place for each technique samples were produced and
mechanical and metallurgical tests were performed. The specifics o f the testing and
methodology used are outlined in the follow ing sections.
3.2 W eld S am p le G eom etry
Figure 15 details the geometry o f the welds produced using both LHW and CMT
equipment.
120mm W eld Seam
400mm
F igu re 15. B u tt J o in t C on figu ra tion f o r W elds p r o d uc e d
69

3.3 L ase r H yb r id W eld ing
ESA B R esearch and D evelopm ent L aboratory , G othenburg , Sw eden prov ided the
equ ipm ent used fo r the L aser H ybrid W eld ing. The hybrid system uses a laser w e lder
and a G M A W w elder s im u ltaneously . The laser w e lder used w as a T ru m p f H L Y 006D
4kW industria l lam ped pum ped Nd: Y A G laser. The G M AW used in the set up w as an
A ristoM IG 500W . T he system w as fu lly au tom ated and con tro lled using a K U K A IR
761 robot, figure 16 below show s the equ ipm ent setup.
F igure 16. Laser H ybr id W elding Equipm ent a t ESAB Process and D evelopm ent Centre,
Gothenburg, Sweden, A p r il 2006.
70

Both butt and lap join t configurations were produced with the Laser Hybrid join ing
technique. Figures 17 and 18 show the join t setup.
n
3.3.1 J o in t G e o m e tr y
I I ►
Overlap
Length
F igu re 1 7. L ap J o in t C on figu ra tion
F ig u re 18. B u tt J o in t C on figu ra tion
Varying overlap lengths o f 10mm, 20mm and 30mm were considered for lap joints for
both LHW and CMT and for each material combination. After initial trials and previous
work66, it was decided that a 2 0 mm overlap length would be the main focus for lap
join ts because this would allow comparisons to be made with previous work at SH U66.
71

3.3.2 W e ld O p t im isa t io n fo r L a s e r H y b r id W e ld e d B u tt J o in ts
Initial welding trials were carried out in order to find the optimum process w indow with
regard to the production o f dissim ilar metal butt join ts. The materials used in the initial
w eld optimisation were:
• HyTens 1000 (austenitic stainless steel) 1.5mm
• LDX 2101 (duplex stainless steels) 1.5mm
• Dogal 260RP-X (zinc coated mild steel) 1.5mm
The weld consumables used in the initial welding trials were:
• 308L-Si filler wire 1mm diameter
• 309L-Si filler wire 1mm diameter
The process parameters controlled during the w eld optimisation stage were:
• W elding speed
• Wire feed speed
• Voltage
The focal length o f the laser, which is distance from the focussing mirror to the work
piece, was kept constant at 200mm , with a laser spot diameter o f 0.6mm. The focus
point for the laser was the middle o f the join ing line o f the two materials.
For all samples the Laser led the GM AW torch in the position as outlined in the
schematic diagram in figure 19 below , The inter distance, that's the distance between
the laser point to the electrode tip was 2 mm, with an electrode stick out o f 16mm.
The shielding gas used was 98% Ar with 2% CO2 , which was fed through the GM AW
torch at a flow rate o f 241/min.
72

F igu re 19. S chem a tic D ia g ram o fL a s e r a n d GMA W se tup f o r the L a se r H y b r id W eld ing
p r o c e ss
For the materials listed above the laser power was kept constant at 1.6kW. Initial
optimisation for LHW produced good atheistically pleasing joints for the above
combinations. These parameters were then transferred to the material below to optimise:
• HyTens 1000 (austenitic stainless steel) 0.75mm
• LDX 2101 (duplex stainless steels) 0.75mm
• Dogal 260RP-X (zinc coated mild steel) 1.5mm
The weld consumables used in the initial welding trials were:
• 308L-Si filler wire 1mm diameter
• 309L-Si Filler wire 1mm diameter
A ll the parameters were kept the same as above except for the laser power which was
reduced to 1.5kW due to the thinner stainless material.
73

3.3.3 W e ld O p t im isa t io n o f L a s e r H y b r id W e ld e d L a p J o in ts
W elding trials were carried out in order to find the optimum process w indow with
regard to the production o f dissim ilar metal lap joints. The materials used in the initial
w eld optimisation were:
• HyTens 1000 (austenitic stainless steel) 1.5mm
• LDX 2101 (duplex stainless steel) 1.5mm
• Dogal 260RP-X (zinc coated mild steel) 1.5mm
The weld consumable used in the initial welding trials was:
• 308L-Si filler wire 1mm diameter
The material combinations initially tried included the zinc coated m ild steel being used
as the top sheet o f the lap joint and as the bottom sheet, more success was found with
the zinc coated mild steel being on the top o f the lap join t with the relevant stainless
grade as the bottom sheet. It remained this way throughout the remainder o f the
optimisation process.
The process parameters controlled during the weld optimisation stage were:
• W elding speed
• Wire feed speed
• Voltage
• Laser tilt angle
• Joint gap
The focal length, focal spot, laser diameter, equipment setup, electrode stick out, inter
distance and shielding gas remained identical to the butt joint optimisation as described
in section 3.3.2.
74

The major difference in the optim isation process for lap joints was the laser tilt angle,
this is shown in figure 2 0 below , the angle was varied from the vertical position through
1 0 ° to 60° in 1 0 ° increments to try and improve the stability o f the process.
Vertical Position
Laser Tilt Angle
\ "
\\
\\
\\
\Laser
(Zinc coated mild
Stainless steel
F igu re 20 . S chem a tic d ia g ram f o r la se r t i l t a n g le fo r L a se r H y b r id W e lded la p jo in ts
The zinc coating present during welding caused some initial problems with spatter and
zinc related cracking, therefore during the optimisation stage a gap (see figure 2 1 ) o f
varying distance was introduced between the plates to try and eliminate this problem.
The gap sizes attempted were 0.1mm, 0.2mm, 0.3mm, 0.4mm, 0.5mm and 1mm.
(Zinc coated m ild steel
Stainless steel
Gap introduced using shims
F igu re 21. S chem a tic d ia g ram to sh ow w h ere the g a p w a s in tro du ced be tw een th e p la te s
du r in g the L a se r H yb r id W e ld in g op tim isa tio n o f lap jo in ts
75

3.4 Co ld M e ta l T ransfer
C old M eta l T ransfe r equ ipm ent used in th is research was located at S heffie ld H allam
U niversity . T he C M T equ ipm ent consisted o f a F ron ius T ransP u lsS ynerg ic 4000 C M T
un it w h ich w as con tro lled using a F ron ius R C U 500i con tro l unit. The C M T equ ipm ent
w as then m ounted onto a tro lley and track robo t system to a llow the p rocess to be sem i -
au tom ated (f igure 22).
F igure 22. C M T W elding Equipm ent at Sheffie ld H allam University.
76

3.4.1 W e ld O p t im isa t io n fo r C o ld M e ta l T r a n s fe r B u tt J o in ts
Initial welding trials were carried out in order to find the optimum process w indow with
regard to the production o f dissim ilar metal butt join ts using the CMT process. The
criterion for the process was to produce joints w ith minimum spatter without surface
breaking porosity and cracks. The materials used in the initial w eld optimisation were:
• LDX 2101 (duplex stainless steels) 1.5mm
• Dogal 260RP-X (zinc coated mild steel) 1.5mm
The weld consumables used in the initial welding trials were:
• 308L filler wire 0.8mm diameter
• 308L-Si filler wire 1.0mm diameter
The process parameters controlled during the w eld optimisation stage were:
• W elding speed
• Wire feed speed
• Arc Length Correction (ALC)
• Joint gap
• Shielding gas
Each parameter was varied accordingly in order to optim ise the process for the jo in t
configuration. The welding speed was varied from 0.508m /m in to L524m /m in, at
increments o f 0.250m/m in. The wire feed speed was changed from 6.5m /m in to
12.0m/min, at increments o f 0.5m/m in. The Arc Length Correction (ALC) value was
varied between -30% and +30% at 5% increments and the plate gap was varied from
0.0mm to 0.7mm, at increments o f 0.1mm.
Three different shielding gases were also tested, 100% Argon, 2.5% Carbon D ioxide
with 97.5% Argon and 3% Oxygen with 97% Argon.
The effect o f filler wire, shielding gas and ALC were considered in a separate study74.
77

3.5 Sam p le Iden tif ica tio n
For both the Laser Hybrid W elding (LHW ) and Cold Me tal Transfer (CMT), w eld runs
were produced and given relevant identification the follow ing section outlines the
nomenclature given to each type o f series. A ll jo ints produced were marked with the
relevant identification and the process parameters.
3.5.1 L aser H ybrid W elded B utt Jo in t Sam ples
Table 2 below outlines the join t combination and series identification for butt joints
produced with the laser hybrid process.
Series
ID
M ateria l
1
M ateria l 1
th ickness
(m m )
M ateria l
2
M ateria l 2
th ickness
(m m )
F iller
W ire
1 LDX 2101 0.75Zinc Coated M ild
Steel1.50 308L-Si
2 LDX 2101 1.50Zinc Coated M ild
Steel1.50 308L-Si
3Hy-Tens
1 0 0 0
0.75Zinc Coated M ild
Steel1.50 308L-Si
4Hy-Tens
1 0 0 0
1.50Zinc Coated M ild
Steel1.50 308L -Si
5 LDX 2101 0.75Zinc Coated M ild
Steel1.50 309L -Si
6 LDX 2101 1.50Zinc Coated M ild
Steel1.50 309L -Si
7Hy-Tens
1 0 0 0
0.75Zinc Coated M ild
Steel1.50 309L -Si
8
Hy-Tens
1 0 0 0
1.50Zinc Coated M ild
Steel1.50 309L -Si
Tab le 1. S e r ies ID f o r L a se r H y b r id W e lded d iss im i la r bu tt jo in ts
78

Each series had 8 w eld runs, each w eld run was number 1.1 - 1.8 etc, then 6 fatigue
samples were taken from each run and number 1.1.1-1.1.8. Therefore the position o f
each sample was known by the number given to it.
A ll results for Laser Hybrid butt joints are denoted in relation to the series ID, e.g., T1
are the tensile properties for series 1, F2 are the Fatigue results for series 2 and H5 are
the Hardness results for series 5 etc.
3.5.2 Laser H ybrid W elded Lap Join t Sam ples
A full matrix o f test pieces were not produced for lap joints, due to the instability o f the
process, however, the samples produced during optimisation were all g iven a number
denoted as TL1 - TL64, where TL is Test Lap.
3.5.3 Cold M etal T ransfer Butt Joints
During the process optimisation stage samples were numbered 1-95. Only 1
combination o f joints was tested for the CMT method using the optim ised parameters o f
sample 94, twelve joints was produced for mechanical testing, and identified as C 1.1 to
C l .12.
Three tensile samples from each run were denoted as CT 1.1.1 to CT1.1.3 and four
fatigue samples were produced from each w eld run were denoted are CF 1.1.1 to
CF1.1.4. Therefore the position o f each sample was known by the identification given
to it.
79

3.6 M ech an ica l T estin g
The welded join ts were assessed in terms o f Tensile and Fatigue properties in order to
determine the suitability o f the join ts for applications within the automotive industry.
Both tensile and fatigue specim ens were water jet cut from welds produced as shown in
figure 15, 50mm from each end o f the welds was discarded therefore no start and finish
point o f the weld was included in a sample. The water jet diameter was 1mm with
tolerances o f ±0.2mm. Water jet cutting was chosen because o f the zinc coating on the
mild steel, any cutting process involving heat for example laser cutting, could have
resulted in the zinc layer being removed. Methods for testing are outlined in the section
below
3.6.1 Tensile Testing
Tensile testing was carried out on the parent materials to determine the ultimate tensile
strength (UTS), 0.2% yield strength and percentage elongation to BS EN 10002-
1 :2 0 0 1 75 for tensile testing o f metallic materials at ambient temperature.
3.6.1.i Tensile specim ens
Parent material tensile specimens were machined to figure 23 below.
4 6 0 hr , 6 0 IN T _^ w20 4 R E F * 20
<|>
A 2 5 R£
180¥
Z H O L E S
DIA 8.5
F igu re 23. Tensile tes t in g spec im en f o r p a r e n t m a ter ia ls
Tensile testing was also carried out on welded specim ens to determine the 0.2% yield
strength, UTS and percentage elongation to BS EN 895:199576 for destructive tests on
welds in metallic materials - transverse tensile test. The welded tensile specim ens were
water jet cut to figure 24.
80

185mm4------------------------------------- ►
65mm <---------------—*
V y‘12mm
y , r
R25mm
F igu re 24 . Tensile tes t in g spec im en f o r w e ld e d jo in ts
3.6.1.2 Tensile Testing Equipm ent
Tensile testing for this project was carried out using an Instron 4206 uniaxial tensile
machine fitted with a 150kN load cell. The Instron is connected to a dedicated PC,
which records the test data, and all specimens were tested with a strain rate o f
lOmm.min'1.
For each test, load against extension was recorded until failure occurred. The data was
then plotted and the UTS, yield strength and percentage elongation determined for each
test.
For the welded sample failure could occur in three possible locations on the specim en,
in either o f the parent materials, through the welded join t or in the HAZ.
The results o f the tensile tests w ill be used to calculate the joint efficiency o f the welded
join ts produced by the novel techniques. The criteria set out for the tensile test is for the
joint to be as strong as the weakest parent material.
81
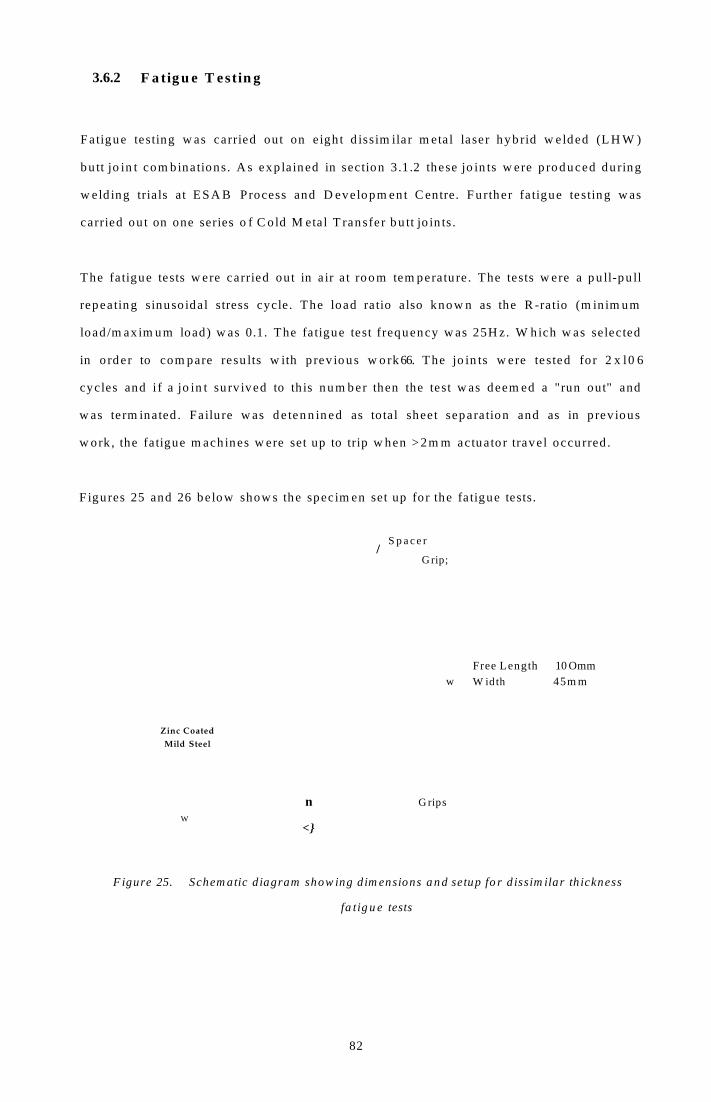
3.6.2 F a tig u e T est in g
Fatigue testing w as carried out on e igh t d issim ilar metal laser hyb rid w e lded (L H W )
bu tt jo in t com binations. A s exp la ined in section 3.1.2 these jo in ts w ere p roduced during
w eld ing tria ls at ESA B Process and D evelopm ent C entre. Further fatigue testing w as
carried out on one series o f C o ld M etal T ransfer butt jo in ts.
The fatigue tests w ere carried out in a ir at room tem peratu re. The tests w ere a pu ll-pu ll
repeating sinuso idal stress cycle. The load ratio also know n as the R -ratio (m in im um
load /m ax im um load) w as 0.1. The fatigue test frequency w as 25H z. W hich w as selected
in o rder to com pare resu lts w ith p rev ious w o rk66. The jo in ts w ere tested fo r 2 x l0 6
cycles and i f a jo in t surv ived to th is num ber then the test w as deem ed a "run out" and
w as term inated. Failu re w as de tenn ined as total sheet separation and as in prev ious
w ork , the fatigue m ach ines w ere set up to trip w hen >2m m actuato r travel occurred.
F igures 25 and 26 be low show s the specim en set up for the fatigue tests.
Zinc Coated
Mild Steel
W
n
<}
/S p a c e r
Grip;
w
G rips
Free Length 10 OmmW idth 45m m
F igure 25. Schem atic d iagram show ing d im ensions and setup fo r d issim ilar th ickness
fa t ig u e tests
82

F igure 26.
Stainless
Steel
Zinc C oated
M ild Steel
W
Schem atic d iagram show ing dim ensions and setup fo r sim ilar th ickness fa t ig u e
test
83

3.6.2.1 S ta ir c a se F a t ig u e m e th o d
The staircase fatigue method o f testing was used to determine the statistically valid
mean fatigue strength at 2 x l06 cycles. Staircase fatigue testing is a method o f testing by
which the next test level for the next trial or group o f trials depends on the results o f the
preceding trial or group o f trials. Only one test is carried out at once and a starting level
is usually around where 50% o f the results are expected, therefore the test load is m oved
up an increment i f a specim en survives the testing or m oved down an increment i f the
specim en fails77.
In order to carry out the staircase test, preliminary setup tests were conducted to g ive an
indication o f the first load level, the range o f load and the step divide. For the initial
tests load increments o f l.OkN was used. A load predicted by the operator (usually
around the estimated fatigue load) was used for the first test, i f the test failed then the
load was reduced by l.OkN, i f the test survived then the load was increased by l.OkN.
This continued until upper and lower load lim its were determined.
Once the upper and lower lim its o f the fatigue tests were determined, the load
increments was reduced to 0.5kN and in later series the standard deviation calculated
from the earlier tests o f similar material combination were used. The tests were then
carried out until each series had 25 tested samples.
Figure 27 below outlines an example o f the table that the fatigue tests fo llow in order to
carry out the relevant calculations. From the results the mean fatigue load, standard
deviation, convergence factor and standard error for the mean fatigue strength were
calculated as outlined below. The convergence factor determines whether the fatigue
results are statistically valid.
84

Load
Range
(kN )
Step
N o.
(0
Test Specim en N um ber N um ber o f U sin g LFE as N
1 2 3 4 5 6 7 8 Failures (f) Runouts
( 0
iN i2N
P3 3 X 1 0 0 0
P2 2 0 X X 2 1 2 4
Pi 1 X 0 X 2 1 1 1
Po 0 O 0 1 0 0
Z f Zr Z iN Z i2N
5 3 3 5
X denotes a failure, O denotes a runout
F igu re 27 . E xam p le o f S ta irca se fa t ig u e te s t ta b le f o r d a ta co llec t io n a n d the ou tlin es the
va lu es n e e d e d fo r the re le va n t ca lcu la tio n s
Calculated M ean Fatigue Strength:
x = PQ+ d f - + -U 2 ,
W hen N = failure + — , when N = runout2 2
E qu a tio n 4. E q u a tio n f o r M ean F a t ig u e S tren g th
Convergence Factor:
( N * B ) - A
N 2
2 A=> 0 3 o r < 1.2 for statistical validity
E qu a tio n 5. E q u a tio n f o r C o n ve rg en c e F a c to r
85

Standard Deviation:
s = 1 .6 2 Q * dN
+ 0.029
E qu a tio n 6. E q u a tio n f o r S ta n d a r d D e v ia t io n
Where,
x = M ean Fatigue Strength
s = standard deviation
P0 = Total Stress (kN) for step 0
N = Total number o f Least Frequent Event (LFE) - failure or runout
d = step divide/load interval
A = * N ,
B = Y Ji 2 * N i
i = Step number
Ni = Number o f failures in a step
Standard Error for the Mean Fatigue Strength
E qu a tio n 7. E qu a tio n f o r S ta n d a r d E r r o r o f th e M ean F a t ig u e S tren g th
Where,
s = Standard deviation
n = Total number o f Least Frequent Event (LFE) - failure or runout
g = 1.1557
86

3.7 M eta l lo g raph ic E xam in a tio n
Various metallographic techniques were carried out in order to characterise both the
parent materials and dissim ilar metal butt and lap join ts. The metallographic techniques
allowed the follow ing to be determined:
• Microstructure
• Grain size analysis
For all the techniques the samples were prepared in conducting Bakelite, this allowed
optical analysis, including microhardness, as w ell as Scanning Electron M icroscope
(SEM ) examination to be carried out in characterising the samples.
3.7.1 Etching
A number o f different etchants were used to aid visual examination o f the parent
materials and the welded samples. The etchants used for the stainless steels were more
aggressive than those used for the zinc-coated mild steels, this was due to the
requirement to remove the passive layer which naturally occurs on stainless steel and
dissolves the corrosion resistant bulk material. Therefore, the etchants used for the
stainless often over etched the mild steel. For the dissimilar metal welded samples two
etchants were used, one to etch the zinc-coated m ild steel then a second one to etch the
stainless steel and the weld material.
Etchants used on the stainless steel varied depending on the grade. Electrolytic etches
using 10% oxalic acid and 20% sodium hydroxide (NaOH) was used for the duplex
grade 2 1 0 1 to highlight the different phases o f the material.
The austenitic grades o f Hy-Tens 1000 and 301LN samples were electrolytically etched
in 60% nitric acid (HNO 3) to reveal the grain boundaries.
2% Nital (a solution o f nitric acid and alcohol) is the most common etchant for m ild
steel and was used to etch the grain boundaries and general microstructure o f the
material.
87

For the welded samples several different etchants were used, lim ited success was had
due to the mild steel preferentially etching over the stainless steel similar to a sacrificial
anode. Masking the less noble metal w ith petroleum je lly did help to facilitate some
etching o f the w eld pool and stainless steel. One etchant o f this kind was 15ml HCL,
10ml acetic acid, 5ml HNO3 , 15ml H2O and 2 drops o f glycerol. A successful etchant
for the Cold Metal Transfer joints was metasulphate, which contains HCL.
88

3.7.2 H a r d n e ss T e s t in g
Hardness values are a useful tool in determining material properties. V ickers hardness
testing was carried out on the parent materials and microhardness examination was
carried out on welded samples.
The Vickers hardness values were determined using a V ickers Armstrong Diamond
Indent Machine with an applied load o f 20kg.
Microhardness readings were taken across the welded joint on a sectioned sample. This
was done using the Buehler M icromet® 2100 series microhardness machine. A load o f
500g was used. Indentations were taken with increments o f 0.50mm through the welded
samples. Microhardness profiles through the centre o f the sectioned welds in the vertical
and traverse directions were carried out as shown in figures 28 and 29.
F igu re 28 . M ic roh a rdn ess P ro f i le s ( tra ve rse a n d ve rt ica l) a c ro ss a d iss im i la r th ickness
♦
I
L a se r H y b r id B u tt W e ld
89

F igu re 29. M ic ro h a rdn ess P ro f i le s ( tra ve rse a n d ve rt ica l) a c ro ss a s im i la r th ickness L a se r
H yb r id B u tt W e ld
Microhardness maps were plotted in order to show any changes in microhardness across
the w eld pool and HAZ's, a grid o f indentations were taken across the welded samples
spaced 0.5mm apart. An example o f the grid can be found in figures 30 and 31.
0.5m m#4--- - - - - »
0.5mrrf
F igu re 30. M ic roh a rdn ess M ap (0 .5mm ) a c ro ss a d iss im i la r th ickness L a se r H y b r id B u tt
W e ld
0.5m m•4----- »•
0.5m m J♦ *
♦ *
F igu re 31. M ic roh a rdn ess M ap (0 .5mm ) a c ro ss a s im i la r th ickness L a se r H y b r id B u tt
W e ld
90

3.7.3 G r a in S iz e A n a ly s is
Grain size is represented by a number referred to as a ASTM Grain Size Number and
originates from ASTM E l 12 - Standard test methods for determining Average grain
Size.
There are different methods o f determining the average grain size o f steels, the Mean
Linear Intercept M ethod (m .l.i) is also w idely used.
The m .l.i is measured by counting the number o f grain boundaries or grains that
intercept a traverse line on a metallographic sample. The m .l.i is given by:
d = —
N
E qu a tio n 8. M ean L in e a r I n te r c e p t
Where,
L =the length o f line (mm)
N = the number o f grain boundaries or grains
d in mm then relates to an ASTM grain size number from 00 - 12 as per table in BS
EN ISO 643:2003.
Grain size analysis was carried out on the parent materials and within the heat affected
zone (HAZ) o f the welded specim ens to assess the effect, i f any, that the w eld ing
processes were having on the microstructure.
91

3.7.4 O p t ic a l L ig h t M ic r o s c o p y
Optical L ight M icroscopy was carried out to examine and characterise the
microstructure o f both the parent materials and welded joints, in addition to examination
o f the fracture surfaces o f fatigue samples, root penetration angle measurements and
heat affected zone grain measurements.
Equipment used includes a Carl Zeiss Photomicroscope and an Olympus Stereoscope
with a H ighlight 2000 Olympus light source. Both could be used with a Spot Insight
Colour, D iagnostic Instrument digital camera to allow images to be taken by image
analysis software through an attached PC.
3.7.4.1 Fatigue Failure A nalysis
The fracture surfaces were examined and fatigue initiation sites identified using optical
light m icroscopy, SEM analysis and video recording o f fatigue tests for dissim ilar
thickness Laser Hybrid W elded join ts using a webcam and laptop.
3.7.4.2 H eat A ffected Zone (HAZ) M easurem ents
The width o f the Heat A ffected Zone was measured and the different joint combinations
and processes were compared to each other. The samples were sectioned, polished and
etched then view ed on an optical m icroscope with camera and PC attached and using
image analysis software the width o f the HAZ and grain size were measured.
92

3.7.4.3 P e n e tr a t io n A n g le M e a s u r e m e n ts
As discussed in section 2.7.5.1 geometry is a critical factor in the fatigue performance
o f welded samples. Any change in geometry can influence early crack initiation on the
weaker side o f the weld. Therefore the angle (0') between the bead root penetration and
the mild steel were measured as shown in figure 32, this value was then subtracted from
180° as shown in equation 9 to give the true angle (0) as demonstrated in figure 33.
Angle 0 was then compared to the fatigue result o f each sample.
Stainless W eld Metal M ild Steel
0 ’
F igu re 32 . D ia g ram sh ow in g m ea su red an g le 6 ’ f o r ro o t an g le p en e tra t io n
F ig u re 33. E n la rg ed a rea o f f ig u r e 21 sh ow in g d e s ire d a n g le 6
0 = 1 8 0 -0 '
E qu a tio n 9. E q u a tio n to c a lc u la te a n g le 6 f r o m m e a su r e d a n g le 6 ’
93

An A licona Imaging Infinite Focus M icroscope (IFM) at Sheffield Hallam University
was employed to look more closely at the root penetration angle. An IFM m icroscope is
an optical 3D measuring device which operates on varying focus combining the small
depth o f focus with an optical system with vertical scanning. A light source illuminates
the samples on a motorised stage, the distance between the lens and the sample is varied
and as this happens images are continuously captured to build up a 3D image o f the
78specim en .
The IFM was used to produce 3D images o f the weld profile both the front side
(reinforcement) and the back side (root) o f the weld, then surface profiles were carried
out across the surface o f the welds, looking at the shape o f the weld bead and the angle
at the root reinforcement. A selection o f samples were chosen from each series o f
fatigue tests with varying number o f cycles to failure and analysed in order to determine
whether a relationship exists between the w eld geometry and fatigue life. From each
sample 3 surface profiles were taken, the root angle measured and then the average
calculated per sample.
3.7.5 I n f in i te F o c u s M ic r o s c o p y
94

3.7.6 S E M E x a m in a t io n
SEM examination was carried out on a Philips XL40 Scanning Electron M icroscope,
which incorporates Energy D ispersive X-ray (EDX) Analysis for quantitative and
qualitative chemical analysis. Both secondary and backscattered electron-imaging
modes were use to record images o f the samples and fracture surfaces.
3.7.6.1 W eld Bead C hem ical C om positions
For each series o f joints tested the weld bead chemical compositions were semi-
quantitatively analysed in order to plot the Schaeffler diagrams for each material
combination. The weld bead was imaged in its entirety using secondary electron-
imaging an area in the upper region o f the weld pool was highlighted and magnified and
3 spot analysis were carried out using EDX analysis to identify the elements present in
weld bead, the area was then scanned to give the percentage o f each element present.
The elements scanned for were Fe, Cr, N i, Mn and Si and an average o f the 3 readings
was taken. The process was repeated for an area in the middle part o f the w eld bead and
the lower region.
This method o f chemical analysis does not give values for C and N for each sample.
Therefore values for C and N were calculated using the dilution equation outlined below .
D ( C w - C p )
C f - C p
Therefore,
C w = C p + D { C f - C p )
Where;
D = Dilution
Cw = Composition o f weld
C f = Composition o f filler material
Cp = Composition o f parent material
E qu a tio n 10. D i lu t io n e q u a t io n f o r c a lc u la t in g c a rbo n v a lu e s f o r e a ch j o i n t c om b in a t io n
95

The results were used to calculate the N ickel and Chromium (equations 11 and 12
below) equivalents to enable w eld bead constitution to be assessed from the Schaeffler
diagram.
Chromium equivalent = %Cr +1.5x% Si + %Mo
E qu a tio n 11 . C h rom ium e q u iv a le n t eq u a t io n
N ickel equivalent = %Ni + 30x(%C + %N) + 0.5x(% Mn + %Cu + %Co)
E qu a tio n 12 . N ic k e l e q u iv a le n t e q u a t io n
3.7.6.2 E lem ental M apping
Elemental mapping was carried out using the ED AX analysis on the Philips XL 40
SEM in order to assess the chemical composition o f the weld and the distribution o f
elements throughout weld pool. This was to assess the chemical hom ogeneity o f the
weld pool during welding for the two different techniques.
96

4 Results
The follow ing section outlines the results and analysis o f experimental work for the
research.
4.1 M a te r ia l C ha rac te r isa tion
Two grades o f high strength stainless steel, an austenitic grade and a duplex grade were
jo ined to zinc coated mild steel. Grades and thickness o f the materials used were:
Austenitic Stainless Steels
• HyTens 1000 ( EN 1.4310, BS 301S21), with a thickness o f 0.75m m and 1.5mm
Duplex Stainless Steel
• LDX 2101 (EN 1.4162), with a thickness o f 0.75mm and 1.5mm, with a 2D
finish
Zinc Coated M ild Steel
• SSAB Z100 Hot Dip Galvanised M ild Steel (Dogal 260RP-X), w ith a thickness
o f 1.5mm
Two 1mm diameter welding wires were used for join ing the parent materials
• 309L-Si
• 308L-Si
97

4.1.1 P a r e n t M a te r ia ls
The chemical and mechanical properties o f the parent materials used are outline in
tables 3 to 10 below.
4.1.1.l C hem ical Com position
This section outlines the specified chemical compositions for the grades as w ell as the
measured chemical composition for all the parent materials tested. Chemical analysis
was carried out using the Spark Em ission process.
Austenitic HyTens 1000 Stainless Steel
E lem ent C Si Mn P S Cr Ni M o N
Specification (%) 0.10 - - - - 17 7 - -
M easured (%)
Thickness 0.75mm0.093 0.87 1.24 0.023 0.008 17.20 7.22 0.24 -
M easured (%)
Thickness 1.50mm0.095 0.99 1.22 0.027 0.008 17.18 7.28 0.26 -
Tab le 2. H y-T ens 1000 C h em ica l C om posit io n (M ass % )
Duplex LDX 2101 Stainless Steel
E lement C Si Mn P S Cr Ni M o N
Specification (%) 0.03 - 5 - - 21.5 1.5 0.3 0.22
M easured (%)
Thickness 0.80mm0.045 0.68 5.41 0.024 0.008 21.2 1.52 0.23
2100
ppm
M easured (%)
Thickness 1.50mm0.046 0.70 5.38 0.024 0.008 20.9 1.51 0.24
2210
ppm
Tab le 3. L D X 2101 C h em ica l C om posit ion (M ass)
Zinc Coated M ild Steel
E lem ent C Si Mn P S Cr Ni M o
Specification (%) 0.04 0.01 0.30 0.06 0.01 - - -
M easured (% )
Thicknessl.50m m0.02 <0.2 0.21 0.068 0.009 0.07 0.06 0.02
Tab le 4. H o t-D ip G a lva n ised M i ld S tee l C h em ica l C ompos it io n (M ass % )
98

4.1.1.2 M e c h a n ic a l P r o p e r t ie s
This section outlines the mechanical properties o f the parent materials in terms o f
tensile properties and hardness.
Austenitic Hy-Tens 1000 Stainless Steel
UTS (MPa)0.2% Proof Stress
(M Pa)% Elongation
Hardness (Hv)
Load 1kg
Specification 1000 750 30 -
M easured
Thickness 0.75mm1111 735 32 345
M easured
Thickness 1.5mm1149 850 32 381
Tab le 5. M ech an ica l p r o p e r t ie s o fH yT en s 100 s ta in less s tee l, 0 .75mm a n d
1 .5 mm
Duplex LDX 2101 Stainless Steel
UTS (M Pa)0.2% Proof Stress
(M Pa)% Elongation
H ardness (Hv)
Load 1kg
Specification 700 480 38 -
Measured
Thickness 0.75mm810.9 565.8 31.4 242
Measured
Thickness 1.5mm785.7 548.4 32.8 261
Tab le 6. M ech an ica l p r o p e r t ie s o f L D X 2101 , 0 .75mm a n d 1.5mm
Zinc Coated Mild Steel
UTS (MPa)0.2% Proof
Stress (M Pa)% E longation
H ardness (Hv)
Load 1kg
Specification 380-460 260-320 28 -
M easured
Thickness 1.5mm402 280 30 144
Tab le 7. M ech an ica l p r o p e r t ie s o f h o t d ip g a lv a n ised m i ld s te e l
99
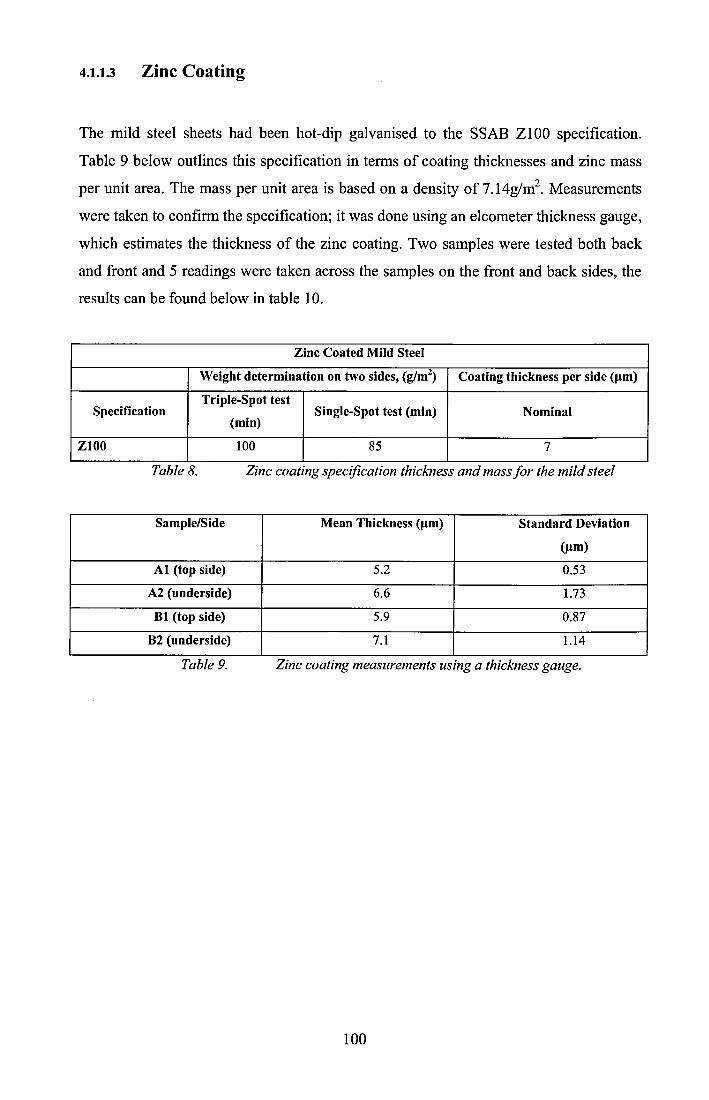
4.1 .13 Z in c C o a t in g
The mild steel sheets had been hot-dip galvanised to the SSAB Z100 specification.
Table 9 below outlines this specification in terms o f coating thicknesses and zinc mass
per unit area. The mass per unit area is based on a density o f 7.14g/m 2. Measurements
were taken to confirm the specification; it was done using an elcometer thickness gauge,
which estimates the thickness o f the zinc coating. Two samples were tested both back
and front and 5 readings were taken across the samples on the front and back sides, the
results can be found below in table 1 0 .
Zinc Coated M ild Steel
W eight determ ination on two sides, (g/m 2) Coating thickness per side (pm)
SpecificationTrip le-Spot test
(min)Single-Spot test (m in) Nom inal
Z100 100 85 7
Tab le 8. Z in c co a tin g spec if ica tio n th ickness a n d mass f o r the m i ld s te e l
Sam ple/Side Mean Thickness (pm) Standard Deviation
(pm )
A l (top side) 5.2 0.53
A2 (underside) 6.6 1.73
B1 (top side) 5.9 0.87
B2 (underside) 7.1 1.14
Tab le 9. Z in c co a tin g m easu rem en ts u s in g a th ickness gau ge .
100

4.1.1.4 M e ta llu rg y
The paren t m ateria ls w ere etched in o rder to reveal the as received m icrostruc tu res
w h ich can be seen in figures 34 to 37.
F igure 34. M ild stee l as received m icrostructure etched 2% n ita l
F igure 35. H y-Tens 1000 sta in less stee l as received m icrostructure e tched 60% nitric
ac id
101

F igure 37. L D X 2101 sta in less steel as received m icro structure using e lectro ly tic etch
20% sodium hydroxide
102

4.1.2 F i l le r W ir e s
The welding filler wires used for this project were 308L-Si and 309L-Si the chemical
composition and mechanical properties o f each wire are outlined in tables 1 1 and 1 2 .
W ire C (% ) Si (% ) Mn (%) Cr (%) N i (%)
308L-Si 0.02 0.85 1.8 20.0 10.5
309L-Si 0.02 0.80 1.8 23.5 13.5
Tab le 10. C h em ica l com pos it io n s o f f i l le r w ire s
W ire0.2% P roof Stress
(M Pa)UTS (M Pa) Elongation (%)
Hardness (Hv)
Load 1kg
308L-Si 420 600 36 208
309L-Si 400 600 32 208
Tab le 11. T yp ica l m ech an ica l p r o p e r t ie s o f f i l e r w ire s
103

4.1.3 Schaeffler-D elong D iagram s for M aterial Com binations
Outlined below are Schaeffler-Delong diagrams for the material combinations used in
this research. From previous research and general literature values o f dilution, (where
dilution is the percentage o f parent metal melted,) is approximately 30%-40% for a
standard butt join t w ith filler wire66.
For the purposes o f the Schaeffler diagrams (figures 38-41) 35% dilution has been
assumed which is made up o f the two base materials which w ill represent 50% each
(denoted as filled in circle on diagram) o f the 35%. The red diamond on the Schaeffler
diagram is where the predicated w eld microstructure should be for all material
combinations in this work. The Schaeffler diagrams apply to both Laser Hybrid
W elding and Cold Metal Transfer.
0 5
Cr Equivalent = %Cr+ %Mo + 1.5%Si + 0.5%Nb
F igu re 38 . S chae ff le r -D e long D ia g ram f o r S ta in less L D X 2101 a n d Z in c C o a te d M i ld S te e l
u s in g 308L -S i f d le r w ire
104

0 5
Cr Equivalent = %Cr + %Mo + 1.5%Si + 0.5%Nb
F igure 39. Schaeffler-D elong D iagram fo r Sta in less L D X 2101 and Z inc C oated M ild Steel
using 309L-Si f i l le r w ire
0 5
Cr Equivalent = %Cr + %Mo + 1.5%Si + 0.5%Nb
F igure 40. Schaeffler-D elong D iagram fo r Sta in less H y-Tens 1000 and Z inc C oated M ild
Steel using 308L-Si f i l le r w ire
105

Ni Equivalent = %Ni + 20%C + 0.5%Mn
0 5
Cr Equivalent = %Cr + %Mo + 1.5%Si + 0.5%Nb
F igu re 41. S chae ff le r -D e long D ia g ram f o r S ta in less H y-T en s 1000 a n d Z in c C o a te d M i ld
S tee l u s in g 3 09L -S i f i l l e r w ire
106

4.2 L a se r H y b r id W elded B u tt J o in ts
In order to optim ise the process parameters initial butt joint trials took place at ESAB
Process and Developm ent Centre in Gothenburg, 16 welds were produced using the Hy-
tens 1000 material and LDX 2101 to zinc coated m ild steel jo ined with filler wires
308L-si and 309L-si.
Tables 13 and 14 below show the parameters for each combination o f material and filler
wires.
The welds were then tested in terms o f tensile, fatigue, microhardness and the w eld
metallurgy and the results are outlined in the follow ing sections.
107

Measured
Values
(u iu i/f^) jnduj
Jboh DIIV CNOo
CNOd
CNOd
CNOd
CNOd
CNOd
CNOo
CNoo
(s)
ouij i Ond
OnSO
Ond
Ond
00so
00d
CN CN
(uiui)
OOUBJSja PPA\ oCOCOOCOCO
oCOco
oCOCOoCOCO
oCOco
oVOCOoVOCO
(A) oSbj j oa
15
.44
15
.44
15
.40
15
.40
15
.44
15
.44
15
.41
15
.41
(Y) juojjn3
94
.92
94
.92
95
.77
95
.77
95
.15
95
.15
96
.21
96
.21
(AVOJ)
j o.uo j joscq r- r*- On Onq
r*-q q q
(uiui/ui)
poods 3uipi0yV\
©CO
©CO
qCO
qCO
oCO
qcd
ocd
ocd
(A) oSbj j oa ooco
00CO
OOCO
COid
00cd
00id
00cd
00id
(uiui/ui)
poods P33d ®J!M VON"*
qN-’
qN"*
q qd
qN-’
q q
(AV4) j ouo j josuqco lO q q q q q q
(uiui) ssouofoiqx ooo©
o00o
oCO oqCOd
ior-o
oq oq
pruojEjv
LDX
21
01
LDX
21
01
LDX
21
01
LDX
21
01
Hy-
Tcn
s 1
00
0
Hy-
Tcn
s 1
00
0
Hy-
Tcn
s 1
00
0
Hy-
Tcn
s 1
00
0
joquirifNl ojduiBS H H HnH
roH
COH
TfH H
3<3
► Si
oo''o
§
Co
Co3
"CS• 2s13
£<3
•n
s;
■ §
<N
Q
'o'cns:•21
S'6
§
&§•2
<N
<3£<N+s*.N£ooOn
oq
<N
-CS
( u u u /r a )
j n d u j
I E O H D I I A I
0.0
2
0.0
2 CNo
d 0.0
2 CNO
o 0.0
2 COo
d 0.0
2
( s ) CN CO CO r-* CO r -
r -- r - r - r - r - r - r - r -
3 U > ! 1
V)o3 ( u i u i ) o o o o o o o o
VO r - o o 0 0 r - 0 0 0 0
> 0 0 U B ) S I ( J P P A \
ets
§0 0 r - (N © CN N - r - o o
( a ) 3 § b j i o a i d i d c d c d c d i d i d i d
CO r - r - CO r - CO CO
( v ) J U 0 J J I 1 3 c d d d r - ’On OS o s On On On O s ON
( A O |) 00 o s o v o CN CON - q q TT i n q q
J O A I O J J 0 S B X
( u i u i/u i )O q © q q q q q
p o o d s § U ! P I 3 M
OO 00 00 00 00 o o 00 00
( a ) a S B ^ O A i n i n i n i n i n i n i n i n
( u i u i/u i )VO s o s o s o s o vO s o s o
N - N " N * N - N " N - 'O’
p o o d s P 3 3 d 3 J ! A \
CO i n VO VO i n i n s o s o
( A M ) J O . u o j j o s b i
O o O O i n i n O O
( u i u i ) s s o u o j o i q x00d
o o
d
q q t***
d
r -*
d
q q
I B I J O J B J V T oo
oo
Oo
OO
o o o o
o o O O
CN CN CN CNGo
G c GO
X X X X (7 H H h ;
n a o o > > >N
u u X X X X
ITi m VO vo r** r-* 0 0 0 0
a i s o u o s H H H H H H H H
Table 13.
Butt Joint Configurations of HyTens 1000 Joined to 1.5mm Galvanised Mild Steel (SSAB) using 1mm 309L Filler and 98%Ar
+
2%C
o2 Shielding Gas

4.2.1 T en sile T est in g R esu lts fo r L a se r H y b r id B u tt J o in ts
A ll laser hyb rid bu tt jo in ts sam ples w ere tensile tested using an Instron tensile testing
m ach ine, figures 42 and 43 a long w ith tab le 15 outline the resu lts below .
JM i M
IT S (M pa)
lR p 0 .2 (M P a)
□ R p0.2 (M pa)
■ T S (M pa)
0P a re n t
M a te r ia ls
WW e ld e d
S a m p le s
L a s e r W e ld in g
F igure 42. The results o f tensile testing (U TS a n d Rpo.2) o fL H W dissim ilar m eta l butt
jo in ts using L D X 2101 and zinc coated m ild steel
See tab le 15 fo r details o f w e ld jo in t con figu ra tion and fil ler w ire used in figure 42. The
U TS and Rpo.2 fo r bo th paren t m ateria ls are also show n a long w ith equ iva len t laser
w elds fo r reference.
109

H y -T e n s 1 0 0 0 M ild S te e l 1 .5 m m T 3 T 4 T 7 T 8
F igure 43. The results o f tensile testing (U TS a n d Rp0.2) o f L H W dissim ilar m eta l butt jo in ts
using H yTens 1000 and zinc coated m ild steel
See table 14 for details o f w e ld jo in t con figuration and fil le r w ire used in figure 43. The
U TS and R po.2 fo r both paren t m ateria ls are also show n a long w ith equ iva len t laser
w elds for reference.

Sample
IDM aterial 1 M aterial 2
Filler
W ire
M ax
Load
(KN)
CSA
(m m 2)
Elongation
(%)
UTS
(M Pa)
0.2%
Proof
Stress
(M Pa)
T1LDX2101
0.8mm
Mild Steel
1.5mm
308
1mm7.0 15.0 19.5 385.7 276.5
T2LDX2101
1.5mm
Mild Steel
1.5mm
308
1mm7.0 18.0 16.3 388.8 275.6
T3
Hy-Tens
1000
0.75mm
Mild Steel
1.5mm
308
1mm7.0 18.1 16.8 389.5 276.2
T4
Hy-Tens
1000
1.5mm
Mild Steel
1.5mm
308
1mm7.1 18.1 18.0 391.9 279.5
T5LDX2101
0.8mm
Mild Steel
1.5mm
309L
1mm7.0 18.0 20.1 387.9 280.5
T6LDX2101
1.5mm
Mild Steel
1.5mm
309L
1mm7.0 18.1 16.2 387.0 277.4
T7
Hy-Tens
1000
0.75mm
Mild Steel
1.5mm
309L
1mm7.0 15.0 17.9 391.2 279.6
T8
Hy-Tens
1000
1.5mm
Mild Steel
1.5mm
309L
1mm7.0 15.0 16.2 387.7 276.3
T ab le 14. Tensile te s t resu lts f o r la se r h y b r id w e ld e d butt jo in ts
111

Fatigue tests were carried out using the staircase method as described in chapter 3.6.2.
A staircase was carried out for each o f the 8 series o f welds produced using the Laser
Hybrid process. The results have been spilt into LHW using the LDX 2101 stainless
steel, so series 1, 2, 5 and 6, and those produced using the HyTens 1000 material, series
3, 4, 7 and 8.
The fatigue tests were carried out on 4 fatigue machines, Table 15 below outlines the
model o f the testing machine, the location and the software operating system. Figures
44 to 47 below show each machine setup with a test running.
4.2.2 Fatigue R esults o f Laser H ybrid W elded Butt Joints
M achine SoftwareLoad
Capacity
Load
RangeLocation
Series
Tested
ESH Servo with
Rubicon ControllerRubicon 250kN 25kN Sheffield Hallam University
F1,F6, F7
and C l
Instron 8516 and
controller 8500+
Cyclic
version 17.7lOOkN 25kN
Outokumpu
Avesta Research CentreF4, F3
Instron 8502 and
controller 8500+
Cyclic
version 17.7lOOkN 25kN
Outokumpu
Avesta Research CentreF2
Dartec M1000/RK
with Inston
controller 8500+
Cyclic
version 17.7lOOkN 25kN
Outokumpu
Avesta Research CentreF 5,F 8
T ab le 15. O u tl in e o f f a t ig u e m ach in es u sed du r in g tes tin g p ro g ram m e
112

F igure 44.
F igure 45.
Instron 8516 a n d Instron console 8500+ with softw are Cyclic version 17.7 a t
O utokum pu A vesta Research Centre, Avesta, Sweden.
Instron 8502 and Instron console 8500+ with softw are Cyclic version 17.7 at
O utokum pu Avesta Research Centre, Avesta, Sweden.
113

F igure 46. D artec M 1000/R K and Instron console 8500+ with softw are Cyclic version
17.7 a t O utokum pu A vesta Research Centre, Avesta, Sweden
F igure 47. E S H servo hydraulic m echanical testing m achine with Rub icon d ig ita l
controller, at Sheffie ld H allam University
114

4.2.2.1 Fatigue Results o f LH W Butt Join ts w ith LD X 2101
The results o f the staircase fatigue tests for Laser Hybrid W elded butt join ts w ith LDX
2101 and zinc coated mild steel using filler wires 308L-Si and 309L-Si are outlined
below. The results are given in figures 48 to 55 which show the actual staircase fatigue
results and values for mean fatigue strength (kN), standard deviation (kN), convergence
factor and the standard error for mean fatigue strength in accordance with the procedure
outlined in section 3. A graph o f fatigue load (kN) verses cycles completed is also
given, showing the results o f the 25 individual tests carried out for each staircase fatigue
test. Finally, the mean fatigue strength (kN) has been converted to a 'line load' which is
a value o f load per unit length measured in N/m m. This w ill allow these results to be
compared to other jo in ing processes o f similar material and joint configuration.
115

Se
ries
F
I
Usi
ng
LFE
as
N Z r-< N
< N m 0Z
w
42
z O n VO m 0 Zw
00
Nu
mb
er
of
Ru
no
uts
(r) - Tt- m < N
u-w
Fa
ilure
s (f
)
cn m m ( N O u -w =
Tes
t S
pe
cim
en
N
um
be
r
«n< N O
24 O
m< N X
22 O
f N O
20 X
ON O
00 O
X
NO X
*n X
0
X
( N 0
O
O O
O n X
OO X
r- 0
NO O
in O
X
ro O
<N X
- X
n. • ^O O .O55 Z w
<n < N - 0
Lo
ad
Ra
ng
e
(kN
)
10.5
00
1 9.5
9.0 in
00
CoI
OoorO•s£
I'o<N
§>OQ©
£
<N
vo
£©a•£P•*«*
©§£
I
°ot-
.Bok.

Step divide: 0.5kN
Least Frequent Event: Failures
Calculated Mean Fatigue Strength:
x = 9 + 0.5
x = 9.568kN
'18 _ P
,11 2 ,
Convergence Factor:
/ (1 1 * 4 2 ) -1 8 2
l l 2= 1.140
Standard Deviation:
(s = 1 .620*0 .50
(11* 42) — 18 :
l l 2
A+ 0.029
s = 0.947k N
Standard Error for Mean Fatigue Strength:
0.947
’ v n
S x = 0 3 2 8 k N
Line Load: 213N/mm
1 0 0 .0 0
u1 0 . 0 0
1 . 0 0
1 0 0 0 0
. I ...I I X
f i :
F1 MFS -
♦ ♦ ftl r<► ♦ 4 ft
.x1C)6 c■ yce'
— V— ................V
1 0 0 0 0 0 1 0 0 0 0 0 0 10000000
C y c le s
F ig u re 49. G raph to sh ow fa t ig u e lo a d ran ge f o r se r ie s F I - L D X 2 101 0 .75mm to D o g a l
2 6 0R P -X 1.5mm la se r h y b r id w e ld e d bu tt j o in t
117

Ser
ies
F2

Step divide: 0.4kN
Least Frequent Event: Failures
Calculated Mean Fatigue Strength:
x = 15 + 0.425 1
11 2
x = \5 J 0 9 k N
Convergence Factor:
^(11*69) - 2 5 2
l l 2= 1.107
Standard Deviation:
5 = 1 .620*0 .40(11 * 69) — 2 5 :
l l 2+ 0.029
y
s = 0 .1 36 kN
Standard Error for Mean Fatigue Strength:
5 = 0 ™ . 1.15' v n
S x = 0 .2 5 5kN
Line Load: 349N/mm
1 0 0 .0 0
9 1 0 . 0 0
1.00
10000 1 0 0 0 0 0 1000000
I I IIF2
_
2x10⁶ cycles
« ♦ ♦ * 1* ► ♦ ♦ (*
10000000
Cycles
F igu re 51. G raph to sh ow f a t ig u e lo a d ran ge f o r se rie s F 2 - L D X 2 1 0 1 1 .5mm to D o g a l
2 6 0R P -X 1.5mm la se r h y b r id w e ld e d bu tt j o in t
119

Se
ries
F
5
Usi
ng
LFE
as
N Z o 00
20 cs o
Z
w
40
z o 'O o <N o Zw
00
Nu
mb
er
of
Ru
no
uts
(r) o (S ir> «S r"N i-i
wCN
Fai
lure
s (f
)
<N r^t O If
Tes
t S
pe
cim
en
N
um
be
r
25 O
24 X
23 o
22 X
CN X
20
X
0\ o
00 X
o
vo X
woo
o
mo
CN X
X
O X
Os X
OO o
r-* o
VO o
X
■ *t X
ro X
fS o
- o
0« A3 £ 3 a> ^
Tj- <N - o
Lo
ad
Ra
ng
e
(kN
)
9.5
9.0
8.5
0'8
7.5
CoIOn<o>-s:
V .
‘o
INO<N
I
&
<o><N%
S
-£2aS?£
oCN
.bp
■ s .
§a
I
<N•O
.Bo£

Step divide: 0.5kN
Least Frequent Event: Survivals
Calculated M ean Fatigue Strength:
jc = 7.5 + 0 .5 f— +V l2 2y
x = S.5kN
Convergence Factor:
^( 1 2 * 4 0 ) - 1 8 2 A
122= 1.083
Standard Deviation:
5 = 1 .620*0 .50(1 2 * 4 0 ) - 18:
122+ 0.029
s = 0 .9 0 lk N
Standard Error for Mean Fatigue Strength:
0.901
L ine Load: 189N/mm
1 0 0 . 0 0
■ oS 1 0 . 0 0
1 .0 0
1 0 0 0 0
s = 1.15a/12
S = 0 . 2 9 9 k N
* i I T i
♦ F5
- □ F 5 M F S -
♦ ------ w 7
2xr
106 cyDies
— " ► ’ L# - i—
—
1 0 0 0 0 0 1 0 0 0 0 0 0 10000000
Cycles
F igu re 53 . G raph to sh ow fa t ig u e lo a d ra n ge f o r se rie s F 5 - L D X 2101 0 .75mm to D o g a l
2 6 0R P -X 1.5mm la se r h y b r id w e ld e d bu tt j o in t
121

Se
ries
F
6
Usi
ng
LF
E
as
NZ 00 'O ■ i- o
Z
w
00
Z VO 00 •<t o z
w
00
Nu
mb
er
of
Ru
no
uts
(r) o r<l • 'i- •*1- <N
uW
Fa
ilure
s
(f) CN t i- <N O
V -W
fN
Tes
t S
pe
cim
en
N
um
be
r
25
o
24 X
m<N O
22
o
<N X
20 X
Oso
00o
r- X
SOo
o
X
o
<N X
X
Oo
Os o
00 X
r- o
SO O
*ri X
o
ro X
<N X
- X
o . • ^_o O .om Z ^
t+1 <N - o
Lo
ad
Ra
ng
e
(kN
)
16
.4
15
.7
15
.0
14
.3
13
.6
coiOn<o>
£Ss’--HH
'o<N
§>©Qo
*o
<N*
it*.
y>
SP2!a•SP>«»
<u§
I
<N(N
t-*o21a.c>o

Step divide: 0.7kN
Least Frequent Event: Failures
Calculated Mean Fatigue Strength:
x = 14.3 + 0.7
x = 15.000£AT
12 2
Convergence Factor:
^ (1 2 * 3 8 ) -1 8 2A
122= 0.917
Standard Deviation:
r5 = 1 .620*0 .70
(12 * 38) — 18 :
122
A+ 0.029
5 = 1 t i l l k N
Standard Error for Mean Fatigue Strength:
1 - J n
Line Load: 333N/mm
S = 0 .3 5 6 * #
1 0 0 . 0 0
3 1 0 . 0 0
1 . 0 0
1 0 0 0 0
♦ F6
EJF6MFS
.2x10 cycles
1 0 0 0 0 0 1 0 0 0 0 0 0 1 0 0 0 0 0 0 0
Cycles
F ig u re 55. G raph to sh ow fa t ig u e lo a d ra n ge f o r se r ie s F 6 - L D X 2 1 0 1 1 .5mm to D o g a l
2 6 0R P -X 1 .5mm la se r h y b r id w e ld e d bu tt j o in t
123

4.2.2.2 Fatigue Results o f LH W B utt Joints w ith H yTens 1000
The results o f the staircase fatigue tests for Laser Hybrid W elded butt joints with
HyTens 1000 and zinc coated m ild steel using filler wires 308L-Si and 309L-Si are
outlined below . The results are outlined in figures 56 to 63 which show the actual
staircase fatigue results and values for mean fatigue strength (kN), standard deviation
(kN), convergence factor and the standard error for the mean fatigue strength in
accordance with the procedure outlined in section 3. In addition a graph o f each
staircase fatigue tests, 25 for each series, as fatigue load (kN) verses cycles completed.
Finally the mean fatigue strength (kN) has been converted to a 'line load1 which is a
value o f load per unit length measured in N /m m this w ill allow these results to be
compared to other join ing processes o f similar material and join t configuration.
124

Se
ries
F
3
Usi
ng
LFE
as
N Z Ov <N r-~ oZ
w
28
z m VO r-~ o Zw
VO
Nu
mb
er
of
Ru
no
uts
(r) o - m t-~ <N w
m
Fai
lure
s (f
)
- m r-~ - Ou-w
CN
Tes
t S
pe
cim
en
N
um
be
r
25 X
24 O
23 X
22 X
CN o
20 O
Ov O
00 X
r-X
VO o
nX
Tt o
mX
CNX
X
oo
Ov o
oo X
r- o
VO o
n X
o
m X
CN o
- O
O" x ^2 g 3 m <N - o
Lo
ad
Ra
ng
e
(kN
)
10
.5
00
1 9.5
06 in
00
CoIOoC2><0•«
*o
Svo<N
IQo
£Q>OCO*''t&aR
£
unC4
5s<
i<3
SP2!$2.Sp
8£s
Co
Volo
I.So

Step divide: 0.5kN
Least Frequent Event: Failures
Calculated Mean Fatigue Strength:
x = 9.0 + 0.5
x = 9 A l l k N
r1 6 _ P
,12 2 j
Convergence Factor:
( (12 * 2 8 ) - 1 6
122
2 A
y= 0.556
Standard Deviation:
( = 1 .620*0 .50
(12 * 28) —16:
122+ 0.029
s = 0.473&V
Standard Error for Mean Fatigue Strength:
S = ^ . 1 . 1 5 ' V l2
S x = 0 .1 5 7 M
Line Load: 209N/mm
100.00
1 0 . 0 0
1.00
1 0 0 0 0
i I M i . .
♦ F3
O F3M FS -
— ♦ ► — ♦ ♦ <1 -------------1
2xf
106cy:les
>
1 0 0 0 0 0 1000000 10000000
Cycles
F ig u re 57. G raph to sh ow fa t ig u e lo a d ra n ge f o r se r ie s F 3 - H yT en s 1 000 0 .75mm
D o g a l 2 6 0R P -X 1 .5 mm la se r h y b r id w e ld e d bu tt j o in t
126

Se
rie
s F
4
Usi
ng
LFE
as
N Z O
00
1 00 64
49
72 0 0 Os ’O" - 0
z
w 38
0
Z O 0 Ov 00 r- CN 0 0 CO CN - 0 z
wCNm
Nu
mb
er
of
Ru
no
uts
(r) O - - - - CN 0 0 - - - - w
0
Fa
ilure
s (f
)
0 tt-iw
CO
Tes
t S
pe
cim
en
N
um
be
r
CN
24
COCN 0
22 O
CN O
20 X
Os X
00 X
r-X
VO 0
woX
Tj-X
COX
CN X
- X
0X
Os X
00 X
O
VO O
wo O
O
co 0
CN X
0
O o .0 55 Z w -
0 as 00 r-- vo >n CO <N - 0
Lo
ad
Ra
ng
e
(kN
)
16
.5
16
.0
15
.5
15
.0
14
.5
14
.0
13
.5
13
.0
12
.5
12
.0
11
.5
11
.0
oo•oft)S*.
.So

Step divide: 0.5kN
Least Frequent Event: Survivals
Calculated Mean Fatigue Strength:
x = 11.0 + 0.5
x = 13.850&/V
'5 2 P
vlO + 2 j
Convergence Factor:
(10 * 5 2 ) - 3 8 0
102= -1 4 3 8 .8 ,
The value of the convergence factor is not larger than 0.3 therefore the standard deviation
cannot be calculated.
j = -1165.4JUV
Line Load: 308N/mm
—♦
= tF4
106 cyDies
♦ ♦ ♦ ♦
« ♦<► ♦ «
1
' 2>
1 0 0 0 0 1 0 0 0 0 0 1 0 0 0 0 0 0 1 0 0 0 0 0 0 0
Cy cles
F ig u re 59. G raph to sh ow fa t ig u e lo a d ra n ge f o r se r ie s F 4 - H yT en s 1 000 1 .5mm to D o g a l
2 6 0R P -X 1.5mm la se r h y b r id w e ld e d bu tt j o in t
128

Ser
ies
F7
Usi
ng
LFE
as
N Z O ON oi vs OZ
w
26
z O m VO vs o Zw
Nu
mb
er
of
Ru
no
uts
(r) o - m vs <N w =
Fa
ilure
s (f
)
<N •vt VO <N O(*_w
Tes
t S
pe
cim
en
N
um
be
r
to(N X
24 o
m<N X
22 o
(N O
20 X
ON X
00 X
o
VO X
o
o
m X
<N o
O
O X
ON X
0O X
r- o
VO o
wo X
TT X
r*"> X
(N o
- X
c . • _ o o o£5 Z w
<N - o
Lo
ad
Ra
ng
e
(kN
)
9.0
8.5 p
oo 7.5
7.0
ft)
S3I
Os<o>Oft■ SI
•o
*o<N**»>•*
IQo
tQ0 5
0505O1>5c
05<N
Jo
SP2ift)
.§)t«w>
ft)§.gSCo
0 550
•SPf c ,
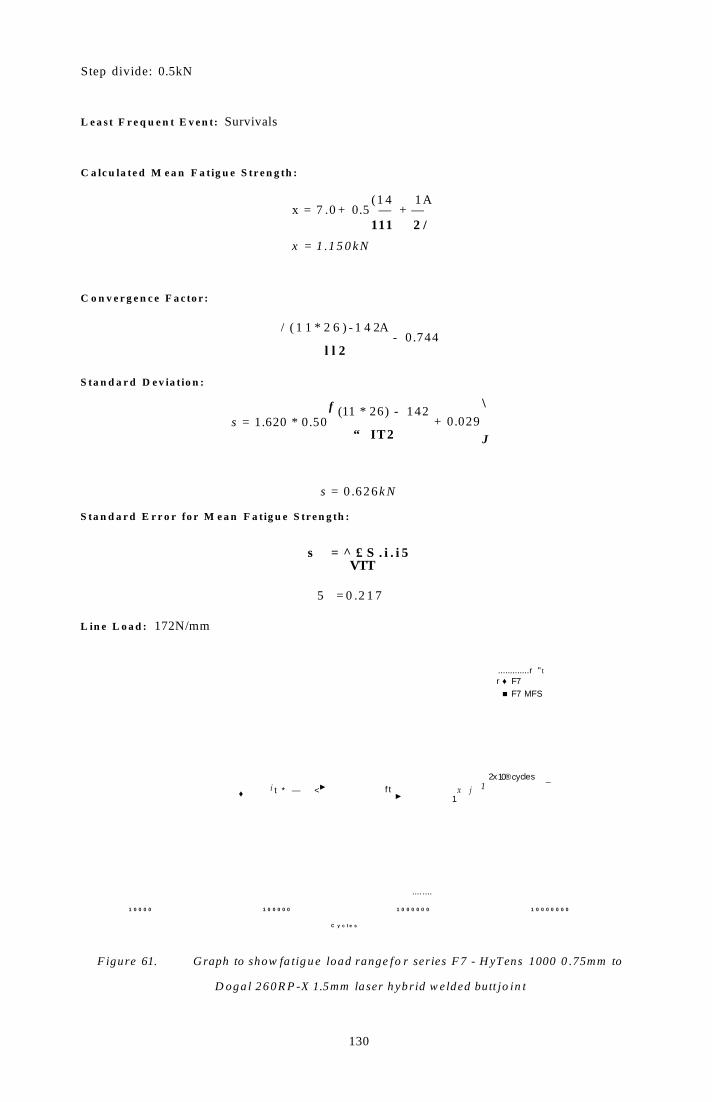
Step divide: 0.5kN
L e a s t F r e q u e n t E v en t: Survivals
C a lc u la te d M e a n F a t ig u e S tr e n g th :
(1 4 1Ax = 7 .0 + 0.5 — + —
111 2 /
x = 1 .1 5 0 kN
C o n v e r g e n c e F a c to r :
/ ( 1 1 * 2 6 ) - 1 4 2A
l l 2- 0 .744
S ta n d a r d D e v ia t io n :
fs = 1.620 * 0.50
(11 * 26) - 142
“ IT2
\+ 0.029
J
s = 0 .626k N
S ta n d a r d E r r o r fo r M e a n F a t ig u e S tren g th :
s = ^ £ S . i . i 5 VTT
5 = 0 .2 1 7
L in e L o a d : 172N/mm
.............r " t
r ♦ F7
■ F7 MFS
i t * — <► f t x j
2x1
10®cycles _
♦ ► 1
........
1 0 0 0 0 1 0 0 0 0 0 1 0 0 0 0 0 0 1 0 0 0 0 0 0 0
C y c l e s
F igure 61. Graph to show fa tig u e load range fo r series F7 - H yTens 1000 0 .75mm to
D oga l 260R P -X 1.5 mm laser hybr id w elded butt jo in t
130

Ser
ies
F8
Usi
ng
LFE
as
N Z O C\ T f r*1 oZ
wVO
z O <N m o Zw
00
Nu
mb
er
of
Ru
no
uts
(r) o - - m <N o o w r~-
Fa
ilure
s (f
)
- - ro <N - - -t * -
wo
Tes
t S
pe
cim
en
N
um
be
r
25
24
23
22
<N
20
On
00
r- X
VO X
to X
X
ro X
<N O
- X
O
o \
00 o
r- o
o O
lO X
T f O
r o o
(N X
- o
Q . • ._o o
£ 5 Z wCO < N - o
Lo
ad
Ra
ng
e
(kN
)
15
.4
15
.2 00
14
.4
14
.0
13
.6
13
.2

Step divide: 0.4kN
Least Frequent Event: Survivals
Calculated M ean Fatigue Strength:
x = 14.0+ 0.4 - + - \ 7 2.
x = 14.520&V
Convergence Factor:
(7 * 1 6 ) - 8 2 A
y= 0.980
Standard Deviation:
5 = 1 .620*0 .40( 7 * 1 6 ) - 8 :
7 2+ 0.029
s = 0 .6 5 4kN
Standard Error for Mean Fatigue Strength:
^ = 0 4 2 1 .1 . 1 5
x - J i
S = 0 2 % 4 k N
Line Load: 322.67N/mm
1 0 0 . 0 0
5 1 0 . 0 0
1 . 0 0
1 1 .i.i.l . ♦ F8
-DF8M FS -
? y 106cy:les
♦♦ *
<>i— ^
'
—
1 0 0 0 0 1 0 0 0 0 0 1 0 0 0 0 0 0 1 0 0 0 0 0 0 0
Cycles
F igu re 63. G raph to sh ow fa t ig u e lo a d ra n ge f o r se rie s F 8 - H yT en s 1 0 0 0 1 .5mm to D o g a l
2 6 0R P -X 1.5mm la se r h y b r id w e ld e d bu tt j o in t
132

The sam ples that fa iled during the fatigue tests w ere analysed to estab lish the orig in o f
fa ilu re and to look fo r any factors that m ay have affected the fatigue life. T w o types o f
jo in t geom etry w ere considered in the fatigue testing , those o f d issim ila r th ickness
paren t m ateria ls, series F I , F3, F5 and F7 and those w h ich had paren t m ateria ls o f
s im ilar th ickness, series F2, F4, F6 and F8.
4.2.3.i Fatigue Failure A nalysis o f D issim ilar Thickness LH W Butt
Joints
Fatigue fa ilures are invariab ly con tro lled by the geom etry o f a sam ple and w elds are no
exception . The jo in ts fo r series F I , F3, F5 and F7 used 0 .75m m th ick sta in less steel
(L D X 2101 or H y-T ens 1000) to 1.5m m zinc coated m ild steel (D ogal 260R P-X ),
a llow ing the m echan ical p roperties o f the tw o parent m ateria ls to be ba lanced out.
F igure 64 show s the w eld bead and a section th rough the w eld , ind ica ting jo in t fit up fo r
the d issim ilar th ickness w elds. F o r d issim ilar th ickness jo in t fatigue tests (series F I , F3,
F5 and F7) a typ ical fa ilu re is illustra ted in figure 66.
Fatigue tests for series F7 (H yT ens 1000 0 .75m m th ick to D ogal 260R P -X 1.5m m ) w ere
film ed using a w eb cam era and v ideo cap tu ring software. The foo tage w as u sed to
record how the fa ilu res o f the fa tigue tests w ere occurring. F igure 65 show s still pho tos
taken from fatigue test F7.8 .6 and the in itia tion of the crack and g row th th rough the
sam ple.
4.2.3 F a tigu e F a ilu re A n a ly s is fo r L a se r H y b r id W e ld ed B u tt J o in ts
Figure 64. A n exam ple o f a Laser H ybrid W elded B u tt jo in ts show ing the w e ld bead
and the jo in t f i t up 1.5mm w elded to 0 .75mm p la tes
133

F igure 65. A series o f s til l pho tos fro m the video capture o f the fa t ig u e test F 7 .8.6 show ing
the location, in itiation and p ropagation o f the fa tig u e crack.
F igure 66. Photo show ing fa tig u e fa i lu re fo r a L H W butt jo in t o f d issim ilar th ickness, the
fa ilu res occurs on the th inner sta in less stee l side o f the jo in t.
134

The jo in ts fo r series F2, F4, F6 and F8 used 1.5m m th ick stain less steel (L D X 2101 or
H y-T ens 1000) to 1.5m m zinc coated m ild steel (D ogal 260R P-X ). F igu re 67 show s the
w eld bead and a section th rough the w eld , ind icating jo in t fit up fo r the sim ila r
th ickness w elds.
F igure 68 below show s the com m on failure o f the s imilar th ickness bu tt jo in ts , w ith the
crack in itia ting at the roo t o f w e ld and on the side o f the m ild steel.
4.2.3.2 F a tig u e F a ilu re A n a ly s is o f S im ila r T h ick n ess L H W B u tt J o in ts
F igure 67. Exam ple o f the jo in t f i t o f s im ila r thickness L H W butt jo in ts .
F igure 68. Photo show ing fa tig u e j'a ilure fo r a L H W butt jo in t o f sim ilar thickness, the
fa ilu re occurs on the weaker m ild steel side o f the jo in t.
135

F ig u re 69. SE M im age sh ow in g the u n ders ide o f the w e ld b e a d o f sam p le s F 2 .6 .6
Stainless \ Mild
Steel
i
Steel
Weld Crack
Metal Opening / *4
; \
> *■
Ann.V Spot Dot W!) |- -- - - - - - - - -
20,0 kV 5.0 SE 12.0 H266----------1 1 mm
F igu re 70. SE M im age sh ow in g the u n ders ide o f the we ld b e a d i l lu s tra t in g the c ra c k
p ro p a g a tio n on the ed ge o f the w e ld on the m ild s tee l s ide .

4.2.3.3 Root A ngle M easurem ents for Sim ilar Thickness LH W Butt
Joints
Failu re analysis o f the fa tigue sam ples led to an in depth look at the geom etry o f the
jo in ts . The roo t angle o f the sam ples w ere m easured and statistica lly analysed to
determ ine w hether there w as a re la tionsh ip be tw een the root angle o f a sam ple and
fatigue life.
The p rocedure fo r m easuring the ang le is ou tlined in Section 3.7 .4 .3. A n exam ple o f the
im age taken to m easure the angle is show n in F igure 71. F igures 72 to 75 be low outline
the resu lts o f the m easurem ents taken from each fatigue sam ple fo r series F2, F4, F6
and F8 and are rep resen ted as graphs o f m easured angle against fatigue life in cycles,
F igure 71. Im age show ing an exam ple o f how the root angle was m ea su red fo r the fa t ig u e
tests in series F2, F4, F 6 and F8. The sam ple in the im age is F2.5.3 which com p leted 2
m illion cycles a t a load o f 15.4kN.
137

60
50
40
£o>c<■ a® 30 iS3_o
reO20
10
00 500000 1000000 1500000 2000000 2500000
Cycles
F ig u re 72. G raph sh ow in g the re la t io n sh ip o f ro o t an g le a n d fa t ig u e c y c le s c om p le te d ( to
f r a c tu r e o r runou t) f o r se r ie s F 2 - L D X 2 1 0 1 1.5mm to D o g a l 2 6 0R P -X 1 .5mm w ith 308L -S i
f i l l e r w ire .
60
50
40
£a>c<TJ£ 30 £3_o
«O20
10
00 500000 1000000 1500000 2000000 2500000
Cycles
F igu re 73. G raph sh ow in g the re la t io n sh ip o f r o o t an g le a t a n d fa t ig u e c y c le s c om p le te d
( to f r a c tu r e o r runou t) f o r se r ie s F 4 -H yTens 1000 1 .5mm to D o g a l 2 6 0R P -X 1 .5mm w ith
308L -S i f i l l e r w ire .
138

60
50 -
40oO)c<■ oO 30 w3OraO
20
10
♦♦
:
0 500000 1000000 1500000 2000000 2500000
Cycles
F ig u re 74. G raph sh ow in g the re la t io n sh ip o f r o o t an g le a n d fa t ig u e c y c le s c om p le te d fo r
se r ie s F 6 - L D X 2 1 0 1 1.5mm to D o g a l 2 6 0R P -X 1 .5mm w ith 309L -S i f i l l e r w ire .
60
50
40
♦
♦
♦
«3 30 ---------------------------- ♦ -
20
10
0 500000 1000000 1500000 2000000 2500000
Cycles
F igu re 75. G raph sh ow in g the re la t io n sh ip o f ro o t an g le a n d fa t ig u e c y c le s c om p le te d fo r
se r ie s F 4 -H yTens 1000 1.5mm to D o g a l 2 6 0R P -X 1 .5mm w ith 3 0 9 L -S i f i l le r w ire .
139

In order to confirm that there is a relationship between root angle and fatigue life a
statistical T-Test was carried out. A T-Test assesses whether the means o f two groups o f
data are statistically different from each other. The root angle data was split into two
groups, those that failed under 500,000 cycles and those who survived to 2,000,000
cycles. The results o f the test indicated that the two groups o f data were significantly
statistically different. The results o f the T-Test are shown below in figure 76.
Number o f Samples
Mean StandardDeviation
Group 1<500,000cycles
23 26.22 7.34
Group 2Completed 2x l06 cycles
23 38.04 13.40
T-Test to determine whether they are statistically different groups.
T-Test o f mean difference = 0 (vs not = 0):
95% Cl for mean difference between: (-17.88, -5.77)
T-Value = -4.05
P-Value = 0.001F ig u re 76. R esu lts o f T -T est c a r r ie d ou t in M in itab to con firm re la t io n sh ip b e tw een ro o t
an g le a n d fa t ig u e life.
140

Prior to fatigue testing two series o f samples were sent for non-destructive evaluation
using X-Ray to determine whether the samples had any detectable defects that could
potentially have a negative effect on the fatigue properties.
Table 16 below outlines the criteria for the test, only defects larger than 0.1m m were
detected using this method o f non destructive testing. A total o f 70 samples were tested
(35 for each series), out o f these only 3 samples were detected as having defects and
details can be found in table 17 below. The samples identified as having defects present
were not included in the fatigue testing o f the relevant series.
4.2.4 Results o f N on-D estructive X -R ay Testing o f Series F3 and F5
Test A cce p t L im itImage
Q ua lityX-Ray
Equ ipm entRated
Vo ltageFocusSize
SS EN 1435
Class BSS EN 12517
Level 1 0.1mm Philips 300kV 1.2mm
T a b le 16. O u tl in e o f X -R a y tes tin g c r i te r ia f o r se r ie s F 3 a n d F 5 f a t ig u e sam p les .
Sample IDDensity
AcceptedDefect
DetectedCategory o f Defect
Degree o f Defect
F5.3.2 Yes Yes D - Incomplete Penetration
F5.3.3 Yes Yes D - Incomplete Penetration
F3.6.1 Yes Yes D - Incomplete Penetration 2
Tab le 17. Sam p les w ith de fec ts d e te c te d b y X -R a y testin g, sam p le s w e re n o t
f a t ig u e te s te d a s p a r t o f the s ta irca se .
141

Microhardness tests were carried out on sections o f the butt welded samples in order to
create a profile o f hardness through the centre o f the w eld and a hardness map across the
w hole area o f weld. Each combination o f material and joint configuration was
examined for Laser Hybrid W elded butt join ts and results are outlined in the follow ing
sections.
4.2.5.1 M i c r o h a r d n e s s R e s u l t s f o r L H W B u t t J o i n t s of L D X 2101
W e l d e d t o Z i n c C o a t e d M i l d S t e e l
Figure 77 below outlines the microhardness profiles for laser hybrid welded butt joints
from series 1, 2, 5 and 6. These are the series with LD X 2101 welded to zinc coated
mild steel using filler wires 308L-Si and 309L-Si.
Microhardness maps were carried out on 4 samples o f each join t combination to show
the variation in hardness, i f any, across the weld pool, heat affected zones and parent
materials o f the joints. For each series samples were taken at around the mean fatigue
load level from both failed and survived fatigue tests. Figures 78 to 85 show
microhardness maps from a failed and survived fatigue test. The remainder o f the maps
can be found in Appendix A.
4.2.5 M icrohardness R esults for Laser H ybrid W elded Butt Joints
142

(AH
S
O)
ss
au
pjE
H
4 5 0
400
350
300
250
200
150
100
50
/ / } 1m 1
I d x 2101 + * » # + + rJ1 r
- H1
- H2- H5
- H6
11P o s i t i o n ( m m )
F igure 77. Graph show ing m icrohardness p ro file o f laser hybr id butt jo in t o f L D X 2101 to
zinc coated m ild steel using 308L-Si and 309L-Si f il le r w ires
H a r d n e s s ( 0 . 5 H v )
□ 300-400
□ 200-300
□ 100-200
1 0 - 1 0 0
0 .5 m m
In c re m e n ts
0 .5 m m In c re m e n ts '
F igure 78. Series 1 m icrohardness m ap o ffa tig u e sample 1.3.1, the sam ple fa i le d
the fa tig u e test at 9 .0kN after 252752 cycles.
143

H a r d n e s s ( 0 . 5 H v )
■ 400-500
□ 300-400
□ 200-300
E 100-200
■ 0-100
1 2 3 0 .5 m m In c r e m e n ts 5 6 7 8
F igure 79. Series 1 m icrohardness m ap o f fa tigue sam ple 1.7.2, the sam ple
surv ived the fa tig u e test a t 9 .5kN com pleting 2 m illion cycles.
H a r d n e s s ( 0 . 5 H v )
■ 400-500
□ 300-400
□ 200-300
□ 100-200
■ 0-100
1 2 3 O .f jm m I n c r e m e n t l 6 7 8
Figure 80. Series 2 m icrohardness m ap o f fa tigue sam ple 2.5.4, the sam ple
surv ived the fa t ig u e test a t 15.8kN com pleting 2 m illion cycles.
144

H a rd n e ss
(0.5H v)
□ 300-400
□ 200-300
□ 100-200
1 0 -1 0 0
0 .5 m m
In c re m e n ts
F igure 81. Series 2 m icrohardness map o f fa tigue sample2.6.6, the sam ple fa i le d
the fa t ig u e test a t 15.8kN after 457113 cycles.
H a r d n e s s
( 0 . 5 H v )
■ 400-500
□ 300-400
□ 200-300
100-200
1 0 -1 0 0
0 .5 m m
In c re m e n ts
F igure 82. Series 5 m icrohardness m ap o f fa tigue sam ple 5.1.6, the sam ple fa i le d the
fa t ig u e test a t 8 .5kN after 1311423 cycles.
145

H a rd n e ss
(0 .5H v)
□ 300-400
□ 200-300
100-200
0-100
0 .5 m m
In c re m e n ts
F igure 83. Series 5 m icrohardness map o f fa tigue sam ple 5.4.2, the sam ple su rv ived the
fa t ig u e test a t 8 .5kN com pleting 2 m illion cycles.
H a r d n e s s
( 0 . 5 H v )
□ 400-500
□ 300-400
□ 200-300
□ 100-200
■ 0-100
1 2 3 0 .9 m m In c re m e n ts 6 7 8
F igure 84. Series 6 m icrohardness map o f fa tigue sam ple 6.1.2, the sam ple su rv ived the
fa tigue test a t 15. OkN com pleting 2 m illion cycles.
146

Hard n e ss
(0.5H v)
□ 300-400
□ 200-300
100-200
1 0 - 1 0 0
0 .5 m m
In c re m e n ts
F igure 85. Series 6 m icrohardness map o f fa tigue sam ple 6.2.1, the sam ple fa i le d the
fa t ig u e test at 15. OkN a fter 644544 cycles.
147

4.2.5.2 M icrohardness Results for LH W Butt Joints of H yTens 1000
W elded to Z inc Coated M ild Steel
F igure 86 below outlines the m icrohardness pro files fo r laser hyb rid w elded bu tt jo in ts
series 3, 4, 7 and 8. T hese are the series w ith H yTens 1000 stain less steel w e lded to z inc
coated m ild steel using f iller w ires 308L -S i and 309L-SL
M icrohardness m aps w ere carried out on 4 sam ples o f each jo in t com bination to show
the varia tion in hardness, i f any, across the w eld pool, heat affected zones and paren t
m ateria ls o f the jo in ts . F o r each series, sam ples were taken at around the m ean fa tigue
load level from bo th fa iled and surv ived fatigue tests. F igures 87 to 94 show
m icrohardness m aps from a fa iled and surv ived fatigue test. The rem ainder o f the m aps
can be found in A ppend ix A.
P o s i t i o n ( m m )
F igure 86. Graph show ing m icrohardness p ro file o f laser hybr id butt jo in t o f H yTens
1000 to z inc coated m ild steel using 308L-Si and 3 09L-Si f i l le r w ires
148

□ 300-400
Hard ness
(0 .5Hv)
□ 200-300
100-200
1 0 - 1 0 0
0 .5 m m
In c re m e n ts
o i m m In c r e m e n t !
F igure 87. Series 3 m icrohardness map o ffa tig u e sample 3.4.6, the sam ple fa i le d the
fa t ig u e test a t 9 .0kN after 521920 cycles.
H a r d n e s s
0 .5 m m In c r e m e n ts
F igure 88. Series 3 m icrohardness map o f fa tigue sam ple 3.5.2, the sam ple su rv ived the
fa t ig u e test a t 9 .0kN com pleting 2 m illion cycles.
149

Ha rd n e ss
(0 .5H v)
□ 300-400
□ 200-300
1 0 0 -2 0 0
1 0 - 1 0 0
/ / S')
I s \s
/ \/
/I1
0 .5 m m In c re m e n ts
0 .5 m m
In c re m e n ts
F igure 89. Series 4 m icrohardness m ap o f fa tigue sam ple 4.6.6, the sam ple su rv ived the
fa tig u e test a t 16.0kN com pleting 2 m illion cycles.
H a r d n e s s
( 0 . 5 H v )
1400-500
□ 300-400
□ 200-300
□ 100-200
0-1000 .5 m m In c re m e n ts
F igure 90. Series 4 m icrohardness m ap o f fa tigue sam ple 4.7.5, the sam ple fa i le d the
fa tigue test a t 13.5kN a fter 170401 cycles.
150

Hardness (0.5Hv) a
□ 300-400
□ 200-300
□ 100-200
■ 0-100
F igure 91. Series 7 m icrohardness m ap o f fa tigue sam ple 7.3.3, the sam ple su rv ived the
fa t ig u e test a t 8 .0kN com pleting 2 m illion cycles.
H a r d n e s s ( 0 . 5 H v )
□ 300-400
□ 200-300
□ 1 0 0 -20 0
■ 0 -1 0 0
0 .5 m m In c r e m e n ts
F igure 92. Series 7 m icrohardness m ap o f fa tigue sam ple 7.8.6, the sam ple fa i le d the
fa tig u e test a t 8 .0kN a fter 843525 cycles.
151

H a rd n e ss
(0 .5H v)
0 .5 m m In c re m e n ts
F igure 93. Series 8 m icrohardness m ap o f fa tigue sam ple 8.6.1, the sam ple su rv ived the
fa t ig u e test a t 14 .0kN com pleting 2 m illion cycles.
H a r d n e s s
( 0 . 5 H v )
■ 0-100 2 3 4 5 6 7 8
0 .5 m m In c re m e n ts
F igure 94. Series 8 m icrohardness m ap o f fa tigue sam ple 8.6.4, the sam ple fa i le d the
fa tig u e test at 14 .8kN a fter 465001 cycles.
152

E lem enta l m app ing w as carried out on sam ples from each series o f L aser H ybrid butt
w elds. This w as done using the SEM and sem i-quantitative E nergy D ispersive X -R ay
(E D X ) analysis. E lem ents scanned fo r w ere the m ain a lloy ing e lem ents o f the
p red icated w eld poo l Fe, C r and N i.
E lem enta l d istribu tion m aps for each series fo r each e lem ent scanned fo r in add ition to a
secondary e lec tron im age o f the sam ples can be found in figures 95 to 100 below .
A dd itional m aps fo r o ther sam ples can be found in Append ix B.
4.2.6 E lem en ta l M a p p in g o f th e W e ld P oo l fo r th e L aser H y b r id B u tt
J o in ts
F igure 95. E lem enta l M app ing o f Sam ple F I . 3.1
153

F igure 96. E lem enta l M apping o f Sam ple F2.5.2
F igure 97. E lem enta l M apping o f Sam ple F 3 .2 .6
154

F igure 98. E lem enta l M apping o f Sam ple F5.4.2
F igure 99. E lem enta l M apping o f Sam ple F6.1.2
155

F igure 100. E lem enta l M apping o f Sam ple F7.3.3

In order to assess the w eld pool chemical composition and constitution, Semi-
quantitative Energy D ispersive X -Ray (EDX) analysis with the Scanning Electron
M icroscope (SEM) and a Cobalt standard was carried out on the w eld pool o f each o f
the joint combinations. The samples used for this analysis were samples that completed
2 m illion cycles at the mean fatigue strength o f the series. From the chemical
composition profiles established, Schaeffler diagrams were plotted for each weld
combination to determine the dilution in the welds. The Schaeffler diagrams for each
series o f join ts are shown in figures 101 to 104
Table 19 outlines the dilution o f the welded joints, where dilution is the percentage o f
parent metal melted. D ilution is based on the principal elements Fe, Cr, N i, Mn, M o and
Si taken from the spot analysis. Table 19 also shows the predicted microstructure o f the
welds as a result o f plotting a Schaeffler diagram for each series, the Schaeffler diagram
relates the chemical composition o f a w eld pool to the phase constitution (or
microstructure) (figures 101 to 104). These calculations assume that, in dissim ilar metal
joints, an equal proportion o f each parent metal is melted.
Further analysis was carried out to determine the chemical composition in different
areas o f the weld pool, the top, the middle and the bottom weld area to establish any
changes in chemical composition that may be present within a sample (figure 105) and
between samples o f the same series (figure 106).
4.2.7 W eld Pool C om position and Constitu tion R esults for Laser
H ybrid W elded B utt Joints
157

Cr Equivalent = %Cr+ %Mo + 1.5%Si + 0.5%Nb
F ig u re 101. S chae ff le r D ia g ram p lo t te d f r o m E D A X an a lys is f o r se r ie s F I - L D X 2101
0 .75mm to D o g a l 2 6 0R P -X 1.5mm a n d se r ie s F 2 - L D X 21 0 1 1.5mm to D o g a l 2 6 0R P -X
1.5mm w ith a 308L -S i F i l le r W ire.
Cr Equivalent = %Cr + %Mo + 1.5%Si + 0.5%Nb
F igu re 102. S chae ff le r D ia g ram p lo t te d f r o m E D A X an a ly s is f o r se r ie s F 3 — H yT en s 1 0 0 0
0 .75mm to H yT ens 1000 1.5mm a n d se r ie s F 4 - L D X 2101 1.5mm to D o g a l 2 6 0R P -X
1.5mm w ith a 308L -S i F i l le r W ire.
158

Cr Equivalent = %Cr + %Mo + 1.5%Si + 0.5%Nb
F ig u re 103. S chae ff le r D ia g ram p lo t te d f r o m E D A X an a ly s is f o r se r ie s F 5 - L D X 2101
0 .75mm to D o g a l 2 6 0R P -X 1.5mm a n d se r ie s F 6 - L D X 2 10 1 1.5mm to D o g a l 2 6 0R P -X
1.5mm w ith a 309L -S i F i l le r W ire
F ig u re 104. S chae ff le r D ia g ram p lo t te d f r o m E D A X an a lys is f o r se r ie s F 7 - H yT en s 1 0 0 0
0 .75mm to H yT en s 1 000 1.5mm a n d se r ie s F 8 - L D X 2101 1.5mm to D o g a l 2 6 0 R P -X
1.5mm w ith a 309L -S i F i l le r W ire.
159

Series ID % D ilu tion P red ic ted W eld bead M ic rostruc tu re
1 55 A usten ite , M artensite and F errite
2 51 A usten ite , M artensite and F errite
3 54 A usten ite , M artensite and F errite
4 58 A usten ite , M artensite and F errite
5 46 A usten ite , M artensite and Ferrite
6 89 M artensite
7 58 A usten ite , M artensite and Ferrite
8 79 M artensite
L aser on ly
w e ld in g 6679 M artensite
Table 18. D ilu tion (%) a n d p red ic ted w eld bead m icrostructure as determ ined
using the chem ica l analysis results fro m the sem i-quantita tive E nergy D ispersive X -
R ay (EDX) analysis w ith the Scanning E lectron M icroscope (SEM ) and a C obalt
standard with the Schaeffler D iagram fo r each series. Equiva lent L aser w eld ing
results are show n fo r comparison.
C r E q u i v a l e n t = % C r + % M o + 1 . 5 % S i + 0 . 5 % N b
F igure 105. Schaejfler D iagram fo r series 6 o f L D X 2101 1.5mm with Z inc coa ted m ild
1.5mm steel w ith 309L-Si, spo t analysis was taken at three d ifferent po in ts, the top(T), the
m iddle (M) a n d the bottom (B) o f the w eld p o o l as shown in the insert.
160

Ni Equivalents %Ni + 30%(C + N) + 0.5%Mn + 0.5%(Cu + Co)
Cr Equivalent = %Cr + %Mo + 1.5%Si + 0.5%Nb
F ig u re 106. S chae ff le r D ia g ram f o r se r ie s 8 o f H yT en s 1 .5mm w ith Z in c c o a te d m ild
1 .5 mm s te e l w ith 308L -S i, s p o t a n a lys is w a s taken f r om tw o d if fe ren t fa t ig u e sam p les,
F 8 .4 .3 a n d F 8 .7.5 bo th sam p les y ie ld e d d if fe ren t resu lts.
161
Ferrite
%

G rain size analysis w as carried out using the m ean linear in tercep t m ethod,
m easurem ents w ere taken fo r the paren t m ateria ls and the H eat A ffec ted Z one (H A Z ) in
the d issim ilar w elded laser hybrid bu tt jo in ts . The resu lts can be seen in F igure 107
below .
4.2.8 G ra in S ize A n a ly s is R esu lts fo r L a ser H yb r id W e ld ed B u tt
J o in ts
H y - te n s 1 0 0 0 H y - te n s 1 0 0 0 L D X 2 1 0 1 0 .8 m m L D X 2 1 0 1 1 .5 m m V 1 4 3 7 1 .5 m m
0 .7 5 m m 1 .5 m m
F igure 107. G raph show ing average gra in size (pm) in the p a ren t m ateria ls a n d the H eat
A ffec ted Zone (HAZ)
162

4.2.9 M e ta l lo g ra p h y fo r L a se r H y b r id W e ld ed B u tt J oin ts
A s p rev iously ou tlined, due to the d issim ilar m etals in the jo in ts a sing le cannot be used
to reveal the surface structure o f the w ho le w elded jo in t, therefo re several d ifferen t
e tchants w ere used.
The m ild steel w as etched in 2% N ita l to reveal the g ra in boundaries in o rder to analyse
the g ra in size and any possib le d ifferences that m ay have occurred due to the heat inpu t
from the w eld ing p rocess. The general structure observed w as equ i-axed g ra ins as seen
in figure 108 and is typ ica l o f all the sam ples. The m icrostruc tu re nearer to the w eld
m etal, f igure 109, has larger ferrite gra ins and inhom ogeneous g ra in size ind ica ting that
g ra in g row th has occurred during the heating /coo ling w eld cycle.
A S ' ./■ ' ■ - A A 7 - V i & .A A n■ x - ' >. - f r ■ ' ■ -
■ - ■ -■ ?, A 1z r y .R -? c ^ ^ 1 ■ ■ -mi
, - t _ . . . '*»;->1 J . /£ ' . • . .1, - -
/ K rr/V 1 f . : <> - t. &€T j 4a >\ a a . '-a - ■ A r
. * ,b*'; X .-a - • ' V •,
•;r r* ; ' ' , ~ 7 j a a f
; A / . , 0 ^; - A : ^ . ../
S > > > j ty .
V . A L - iV -- ^ ‘ ■ . V ‘ > ^ ^ ”- Vi - -O .... . ’ . X . Vi ” ‘ u • ' *
1 0 0 Mm • :
• * < , . . . . . . . -
F igure 108. M ild steel m icrostructure e tched in 2% nita l
163
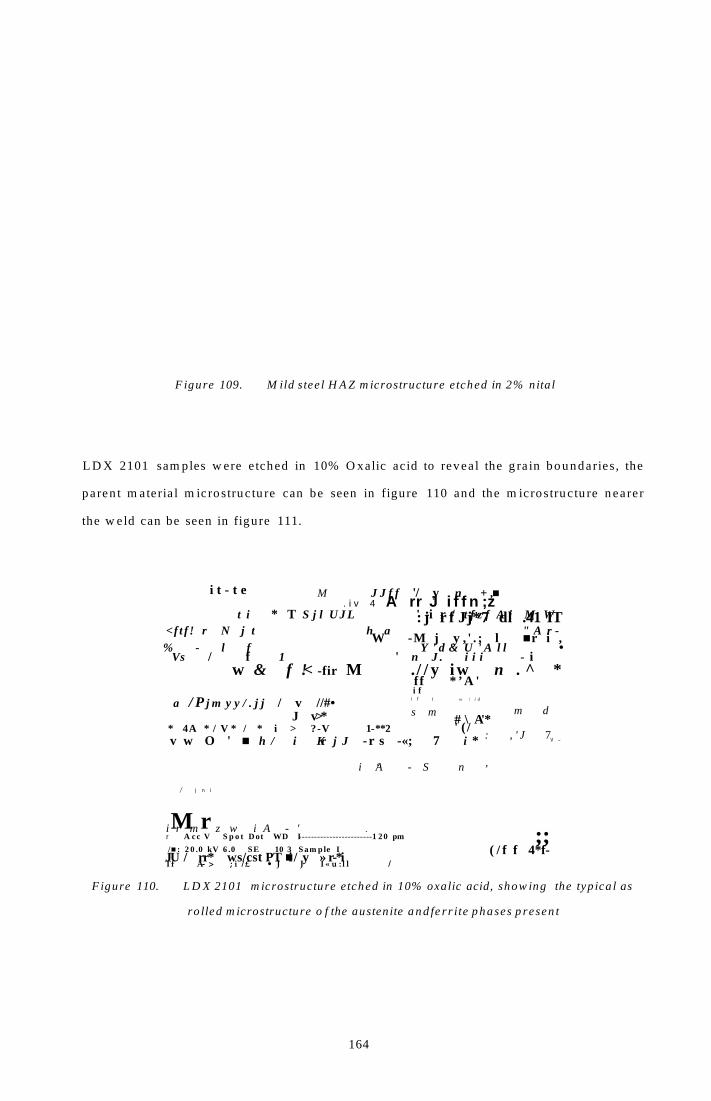
F igure 109. M ild stee l H A Z m icrostructure etched in 2% n ita l
L D X 2101 sam ples w ere etched in 10% O xalic acid to reveal the g ra in boundaries, the
paren t m ateria l m icrostruc tu re can be seen in figure 110 and the m icrostruc tu re nearer
the w eld can be seen in figure 111.
i t - t e M J J f f '/ y n + ,■. i v 4 A rr J i f f n ;z
t i * T S j l U J L ' -i r / t f z f A i M W<f t f ! r N j t h a " A r -
% - l f Y ' d & U ' A l l •Vs / f 1 ' n J . i i i - i
w & f !< -fir M . / / y iw n . ^ *
: j r f Jj*7 dl .41 IT W -M j y , ' . ; l ■ r i ,
a / P j m y y / . j j / v //#•J v>*
* 4 A * / V * / * i > ? - V 1-**2
f f * ’A 'i f
i f I w \ i d
s m# \ A'*' ( /
v w O ' ■ h / i Kr j J - r s -«; 7 i *
i ‘A - S n ’
m d
: , ' J 7V ~
/ j n i
M ri r m z w i A - ' .r A cc V S p o t Dot WD I------------------------1 20 pm
/■ : 2 0 .0 kV 6 .0 SE 10 3 S am p le IJU / rr* ws/cst PT ■ i / y » r-*i Tf A- > ; i /£ • J J I « u : l l /
;;( / f f 4*f-
F igure 110. L D X 2101 m icrostructure etched in 10% oxalic acid, show ing the typ ica l as
ro lled m icrostructure o f the austenite and fe r r ite phases p resen t
164
F igure 111. L D X 2101 In terface with w eld etched in 10% oxalic ac id show ing the m arked
change in the austenite to fe r r ite ratio in the H A Z o f the L D X 2101
F igure 112. H y-tens 1000 a nd W eld M eta l In terface etched in 10% oxalic ac id m artensite in
the H A Z and the w eld material.
165

Figure 111 show s the interface betw een the w eld and L D X 2101 parent material. The
M icrostructure in the H A Z show s a marked change in the austenite ferrite ratio due to
the transformation that has occurred.
Figure 112 show s the in terface o f a H y-T ens 1000 butt w eld . It illustrates that the H A Z
consists o f a fine grain structure o f m artensite due to the transformation from austenite
to m artensite during the heating and coo ling cyc le o f the w eld process. The w eld m etal
also has a martensitic structure.
166

4.3 L a se r H y b r id W elded L a p J o in ts
Lap jo in t configuration trials have been carried out on various occasions throughout this
research at E SA B process and developm ent centre for jo in in g o f H y-T ens 1000 to z inc
coated m ild steel and L D X 2101 to the z inc coated mild steel using the laser hybrid
process
Problem s w ere encountered w ith laser hybrid w eld ing o f the lap jo in ts, this included
excessive spatter, surface breaking porosity and solid ification cracking. Out o f several
in itial sam ples that w ere w elded in the first trials, sam ples 7 and 19 w ere the best w elds
produced in terms o f aesthetic appearance, the details o f the jo in ts and the parameters
used are outlined in table 20 below .
Initial sam ples w ere sectioned and exam ined, and solid ification cracks w ere found in
the sam ples o f L D X 2101 and zinc coated m ild steel, as show n in figure 113 below .
The depth o f penetration o f the in itial laser hybrid lap jo in ts w as also m easured as
concerns were raised during trials that the penetration w as com ing through the
underside o f the bottom plate. Figures 114 and 115 show these results.
Optim isation o f laser hybrid w elded lap jo in ts continued for the fo llow ing com binations
using the 309L -Si:
• H y-Tens 1000 1.5m m to D oga l 260R P X 1.5mm
• L D X 2 1 0 1 1 .5m m to D oga l 260R P X 1.5m m
H ow ever, further problem s arose due to the presence o f the zinc coating, includ ing
porosity and cracking as demonstrated in figures 116 to 118. A fter in itial trials w ere
com pleted an effect o f plate gap and torch angle on the frequency o f underside cracking
w as observed and can be seen in figure 119.
Cracking observed in sam ples using the H yT ens 1000 material w as exam ined b y using
the SEM . The Results are show n in F igures 120 to 122.
167

Figure 120 show s the open crack and the b lue/b row n area ind icates that the cracks
occurred at h igh tem perature. F igure 122 show s the SEM im ages o f the crack and at the
h igher m agn if ica tion crack ing is observed in the sam ples fo llow ing the grains o f the
m ateria l, as w ou ld be expected o f liqu id m eta l em brittlem ent.
P aram eter L ap S am p le 7 L ap S am p le 19
B a se M a te r ia l L D Z 2 1 0 1 1.5m m H y-T ens 1000 1.5m m
T op M a te r ia lZ inc coated m ild steel
1.5m m
Z inc coated m ild steel
1.5m m
L ap L en g th (m m ) 10.0 10.0
F ille r W ire 309L -S i 309L -S i
D ia m eter o f W ire (m m ) 1.0 1.0
M IG S h ie ld in g G as A r + 30% H e + 1 % 0 2 A r + 30% H e + 1 % 0 2
W eld in g S p eed (m /m in ) 4.5 4.5
W ire F eed S p eed (m /m in ) 12.0 12.0
V o lta g e (V ) 30.5 30.5
M ea su red
V a lu es
C u r ren t (A ) 203.9 203.0
V o lta g e (V ) 30.1 29.8
M IG P o w er (k W ) 6.23 6.18
Table 19. W elding param eters fo r in itia l lap sam ples using the Laser H yb r id
Process
F igure 113. Solid ification cracking observed in a lap jo in t o f L D X 2101 laser hyb r id w elded
to z inc coa ted m ild steel

F igure 114. D epth o fpenetra tion fo r laser hybrid w elded lap jo in t fo r L D X 2101 to z inc
coated m ild steel.
F igure 115. D epth o fpenetra tion fo r laser hybr id w elded lap jo in t fo r H y-Tens 1000 to zinc
coa ted m ild steel
169

F igure 116. Photo show ing surface breaking po res with cracking on a lap jo in t o f H y-Tens
1000 to D oga l 260R P -X with 309L-Si f i l le r
F igure 117. Photo show ing surface breaking po res on a lap jo in t o f L D X 2101 to D oga l
260R P -X with 309L-Si f i l le r
170

Fre
qu
ency
of
cra
cks
2 mm
F igure 118.
2 5
20
15 -
10
5
0 J- 0
F igure 119.
Photo show ing transverse cracking on the underside o f the H y-Tens 1000 in a
lap jo in t o f D oga l 260R P -X with 3 09L-Si f i l le r
♦ 0 d e g re e to rc h a n g le
■ 3 0 d e g re e to rc h a n g le
0.1 0 .2 0 .3 0 .4 0 .5 0 .6
Gap d is ta n ce (m m )
Graph show ing that as the gap between the two p la tes and the w eld ing ang le
increases the am ount o f observed cracking is grea tly reduced
♦
■
♦
171

F igure 120. M acro Im age o f U nderside C racking O bserved in Lap Jo in ts using the H yTens
1000 Sta in less ( the crack has been opened top reveal the fra c tu re surface).
172

F igu r e 121. SE M Im ages o f th e f r a c tu r e su r fa ce o f an la p j o in t u s in g H yT en s 1000 S ta in less
S te e l
W eld M aterial
HyTens 1000
" T "
$
i
F ig u re 122. M acro Im age o f a L o n g itu d in a l S ec tio n Throu gh an L a p J o in t u sin g H yT en s
1000 S ta inless, C ra ck s a re S h ow n to g o th rough th e F u ll T h ickn ess o f th e W e ld a n d often
C o in c id e w ith P o ro s ity.
173

4.4 C o ld M e ta l T ra n sfe r W e ld ed B u tt J o in ts
Butt jo in ts w ere produced using the CM T process for L D X 2101 1.5m m th ick to D oga l
260R P -X 1.5m m w ith the 308L -S i F iller w ire, 1.0m m diameter. This series o f jo in ts is
denoted as C l.
The fo llow ing section outlines the results o f the testing programme for C old M etal
Transfer Butt jo in ts.
O ptim isation took p lace to find the optim um process parameters for the material
com bination. F igure 123 b e low show s the effect that altering each parameter had on the
quality o f the jo in t produced. Optim um parameters for the m aterial and jo in t
com bination can be found in table 21 below .
Effect
Too m uch penetration, therefore flatter profile
Profile angle steeper and lack o f penetration
Lack o f penetration - no profile change
Too m uch penetration - no profile change
Arc unstable, blowholes, no significant profile change
Profile angle steqaer
Too m uch penetration - weld profile flattens due to penetration
Ho penetration - increase profile angle
F ig u re 123. D ia g ram sh ow in g e ffec t o f c r i t ic a l p a ram e te rs on resu lt in g w e ld b e a d f o r C o ld
M e ta l T ransfer jo in in g
Critical Parameters
Wire Feed Speed
W elding Speed
Arc Length Correction
Gap between plates
'i
'i
'i
174

S am p le ID 94
M a ter ia l 1 L D X 2101,
1.5m m
M ater ia l 2 D ogal 260 R P-X ,
1.5m m
F ille r W ire 308L -S i
F ille r W ire D iam eter
(m m )
1.00
G ap b etw een p la tes (m m ) 0.50
M od e CM T
W eld in g S p eed (m /m in ) 1.27
W ire F eed S p eed (m /m in ) 8.00
A rc L en g th C orrection
(% )
20
S h ie ld in g G as 2 .5% C 02 +A r
S h ie ld in g G as F low R a te
(L /m in )
10
Tab le 20. O ptim um p a ra m e te rs f o r C M T p r o c e s s f o r a b u tt j o in t co n f ig u ra tio n
175

F igu re 124 below show s the resu lts fo r the tensile tests carried out on C M T w e lded B utt
Jo in ts o f L D X 2101 (1 .5m m th ickness) to D ogal 260R P-X (1 .5m m th ickness) w ith
308L -S i f il le r w ire (1m m d iam eter). The tests w ere carried out on each w eld run
p roduced fo r th is series.
4.4.1.i T en sile P ro p er t ies o f C o ld M eta l T ra n sfe r Bu tt J o in ts
C 1 .1 A
C 1 .2 B
C 1 .3 C
— C 1 .4 A
C 1 .5 A
C 1 .6 B
C 1 .7 C
C 1 .8 C
- C 1 . 9 A
C 1 .1 0 A
C 1 .1 1 B
C 1 .1 2 A
C 1 .1 3 A
C 1 .1 4 B
E x t e n s i o n ( m m )
F igure 124. G raph show ing L oad vs Extension fo r the results o f tensile tests ca rr ied out fo r
C old M eta l Transfer Butt Joints, the average UTS was 422.6M Pa
176

The results o f the staircase fatigue tests for C old M etal Transfer butt jo in ts w ith L D X
2101 and zinc coated m ild steel using filler w ire 308L -S i (series C l) are outlined below .
The results are outlined in figures 125 and 126 w h ich show the actual staircase fatigue
results along w ith calcu lated values for m ean fatigue strength (kN ), standard deviation
(kN ) convergence factor and the standard error for the m ean fatigue strength in
accordance w ith the procedure outlined in section 3.
A graph o f fatigue load (kN ) verses cyc les com pleted is also g iven , show ing the results
o f the 25 individual tests carried out for each staircase fatigue test. F inally the m ean
fatigue strength (kN ) has been converted to a 'line load' w h ich is a value o f load per
unit length m easured in N /m m and w ill a llow these results to be com pared to other
jo in in g processes o f sim ilar material and jo in t configuration.
4.4.1.2 Fatigue R esults o f CM T Butt Join ts w ith LD X 2101
177

Se
rie
s C
l
Usi
ng
LF
E
as
NZ O oi io ■ *3- ©
z
wONCN
z o m oo "3- © £w
VO
Nu
mb
er
of
Ru
no
uts
(r) o - ■ r ■ 't m w
<N
Fa
ilure
s
(f) - in m © wm
Tes
t S
pe
cim
en
N
um
be
r
to(N O
24 X
m(N X
22 O
CN X
20 O
On O
00 X
r- O
VO X
»o X
o
m X
CN X
- o
O X
Ov X
00 o
r-~ o
vo o
VO X
X
CO o
<N X
- o
t) O .o w Z w <n <N - ©
Lo
ad
Ra
ng
e
(kN
)
9.8
9.4
9.0
8.6
8.2
5s .
Ioo<25
■ s£
’--i
<2>VO<N'■ ""ok
IQ©
S■ o
<N
oSs.
sr>
JoS!
.§D>s»
<558£
I
*0<N'-i
I.Bp
oo

Step divide: 0.4kN
Least Frequent Event: Runouts
Calculated M ean Fatigue Strength:
x = >.2 + 0.4| — - i 1 12 2 ,
x = 8.5 k N
Convergence Factor:
Standard Deviation:
(12 * 2 9 ) -1 5
122= 0.854
5 = 1.620*0.40f (12 * 29) — 15 :
122+ 0.029
s = 0.572&7V
Standard Error for M ean Fatigue Strength:
5 = ° # Z . U 5 * - J u
S = 0 . m k N
Line Load: 189N/mm
1
♦ C 1
n M F L L R C 1
f 2 x 1 0 ® c y c l e s
♦ ► ►i♦
I /
!
10000 100000 1000000 10000000
Cycles
F igu r e 126. G raph to sh ow fa t ig ue lo a d ra n g e f o r se r ie s C l - L D X 2101 1 .5mm to D o g a l
2 6 0R P -X 1.5mm C o ld Me ta l tra n sfe r w e ld e d b u tt j o in t
179

F or the fatigue test spec im ens that fa iled before the 2000000 cycle runou t criteria,
fa ilu re analysis w as carried out to determ ine the position o f the fatigue fa ilu re and to
assess w hether the po in t o f fa ilu re w as consisten t fo r all fa iled sam ples.
F igure 127 be low show s an exam ple o f the com m on po in t o f fa ilu re and figure 128
show s a typ ical fractu re surface fo r the fa iled fatigue specim ens for the C l series.
4.4.1.3 F a t ig u e F a ilu re A n a ly s is fo r C o ld M eta l T ra n sfe r B utt J o in ts
F igure 127. Show ing p o in t o ffa ilu re fo r C M T sim ilar thickness fa t ig u e tests.
T op o f w e ld bead
F igure 128. Typ ical fra c tu re surface o f C M T sim ila r th ickness fa t ig u e specim en.
180

The po in t o f fa ilu re fo r the fatigues tests w as identif ied as the root o f the w eld on the
m ild steel side o f the jo in t, th is w as th is sam e m ode o f fa ilure as the sim ila r th ickness
LH W butt jo in ts.
4 .4 .1 .3 .1 R o o t A n g le M e a su re m e n ts f o r S im ila r T h ick n ess C M T B u tt J o in ts
Failu re analysis o f the fa tigue sam ples led to an exam ination o f the geom etry o f the
jo in ts . T he R oot ang le o f the sam ples w ere m easured to determ ine w hether there w as a
re la tionsh ip betw een the roo t angle o f a sam ple and fatigue life.
The procedure fo r m easuring the angle is ou tlined in Section 3.7.4.3. The roo t ang le w as
m easured fo r each fatigue test fo r the C l series, an exam ple o f the im age taken to
m easure the angle is show n in figure 129. F igure 130 show s the resu lts o f the ang le
m easurem ents represen ted as a graph o f m easured angle verses cycles to fa ilure.
F igure 129. Exam ple o f root angle m easurem ent on C MT sim ila r th ickness butt jo in t
181

Cal
culated
Angle
60
50
40
30
20
10
0 4.
♦ ♦ ♦ ♦
♦
♦
♦
. 1
♦
♦
0 500000 1000000 1500000 2000000 2500000
Cycles
F igu r e 130. G raph sh ow in g re la t io n sh ip be tw een ro o t an g le a n d fa t ig u e life f o r CM T
s im ila r th ickness bu tt jo in ts (se r ies C l )
182

M ic rohardness m easurem ents w ere taken for a selection o f sam ples fo r co ld m etal
transfer jo in ts series C l (L D X 2101 jo in ed to D ogal 260R P-X using 308L -S i fil le r w ire).
The m easurem ents w ere taken on a g rid across the w eld poo l surface to allow
m icrohardness m aps to be p lo tted. T he m aps w ere carried out on 4 sam ples fo r the C M T
jo in t com bination to show the varia tion in hardness, i f any, across the w eld pool, heat
a ffected zones and paren t m ateria ls o f the jo in ts . For each series sam ples w ere taken at
around the m ean fatigue load level from bo th fa iled and surv ival fa tigue tests. F igures
131 and 132 show m icrohardness m aps from a fa iled and surv ived fatigue test w ith the
rem ainder o f the m aps located in A ppend ix A.
4.4.1.4 M ic ro h a rd n ess R esu lts fo r C o ld M eta l T ra n sfe r B u tt J o in ts
Hardness (0.5Hv)
□ 200 .0-
300.0
1 1 0 0 .0 -
200.0
■ 0 . 0- 100.0
2 3 4 5 6 7 8 9 10 11 12 13 14 15
0.5mm Increments
F igure 131. Series C l m icrohardness m ap o f fa tigue sam ple C 1.14.4, the sam ple su rv ived
the fa t ig u e test a t 8 .6kN com pleting 2 m illion cycles.
183

H ardness (0.5Hv)
□ 200.0-
300.0
1 1 0 0 . 0 -
200.0
■ 0 .0- 100.0
0.5mm
Increments
9 10 11 12 13 14 15
0.5mm Increments
F igure 132. Series C l m icrohardness m ap o f fa tigue sam ple C l .3.3, the sam ple fa i led the
fa t ig u e test a t 9 .0kN a fter 1150208 cycles
184

4.4.1.5 M e ta llo g ra p h y o f C o ld M eta l T ra n sfe r B u tt Jo in ts
The op tim um w eld param eters w ere exam ined to reveal the m icrostructu re o f the paren t
m ateria ls and the w eld pool. The sam ple w as etched in 2% N ita l to reveal the
m icrostruc tu re o f the zinc coated m ild steel (f igure 133), the sam ple w as subsequently
e tched in 25m l HC1, 75m l H 20 and 0 .7g sod ium m etab isu lph ite to reveal the w eld
m icrostruc tu re (f igure 134) o f austen ite and m artensite and L D X 2101 stain less steel
(figure 135) exh ib iting the dup lex structu re o f austen ite and ferrite.
F igure 133. Typical M icrostn icture o f D oga l 260R P -X H A Z in a C M T D issim ila r w e ld
185

F igure 134. Typical M icrostructure o f W eld M ateria l in a C M T D issim ilar W eld using
308L-Si F iller Wire, etched in 25m l HCl, 75ml H 20 and 0 .7g sodium m etabisulphite,
show ing austenite (light) a n d ferr ite (dark) phases
F igure 134 above show s the fine gra in dendritic structure in the w eld m ateria l. F igure
135 below show s the typ ical co ld ro lled m icrostructu re o f dup lex stain less steel, w h ich
leads into the H A Z w here the austen ite has transform ed. In both figures the austen ite is
represen ted by the ligh ter phase and ferrite by the darker phase.
F igure 135. Typical M icrostructure o f L D X 2101 H A Z in a C M T D issim ilar Weld, e tched in
25m l HCl, 75ml H 20 and 0 .7g sodium m etabisulphite, show ing grow th o f the austen ite
(lighter) phase.
186

E lem ental m app ing w as carried out on sam ples from the series o f C o ld M etal T ransfer
bu tt w elds. This w as done using the SEM and sem i-quantitative E nergy D ispersive X-
R ay (E D X ) analysis. E lem ents scanned for w ere the main a lloy ing elem ents o f the
p red icated w eld pool Fe, C r and N i.
E lem enta l d istribu tion m aps fo r each e lem ent in addition to a secondary e lectron im age
o f the sam ples can be found in figures 136 to 139 below .
4.4.1.6 E lem en ta l M a p p in g o f th e W eld P oo l fo r the L a se r Hy b r id B u tt
J o in ts
F igure 136. E lem enta l m apping o f sam ple C l. 3.3
187

F igure 137. E lem enta l M apping o f sam ple C l. 7.1
C r M ap N i M ap
Wmmlmmt s3 ■ :-;-
sSe s®w tS k ff i fc
F igure 138. E lem enta l m apping o f sam ple C l .9.3
188

F igure 139. E lem enta l m apping o f sam ple C l. 14.4
189

4.5 I n f in it e F o cu s M ic ro sco p y
The Infin ite Focus M icroscope w as used to analyse the surface profile o f the w elds
produced using Laser Hybrid W eld ing and those produced by C old M etal Transfer.
Several sam ples from each series o f sim ilar th ickness jo in ts were analysed to assess the
w eld shape profile and the penetration root angle, this w as to assess the consistency in
the w eld ing process and the effect o f root angle on fatigue life.
3D im ages o f the sam ples w ere attained along w ith profiles for 3 positions on the top
and underside o f the w eld . One exam ple for each o f the series analysed (F2, F4, F6, F8
and C l) can be found in the figures 140 to 149 below . The remainder o f the IFM
analysis can be found in A ppend ix B .
Figures 150 and 151 show s the graphs representing the m easured root angle against
cyc les to failure for the IFM m easurem ents and figure 152 show s the H A Z hardness
results for the m ild steel side o f both CM T and LH W sim ilar th ickness butt jo in ts.
190

Position 1
F igure 140. IF M 3D surface im age and surface p ro files fo r the fr o n t o f the w eld bead o f
sam ple C l .5.2
Position 2
S ta in less S teel
191

M ean 9 = 33
F igure 141. IF M 3D im age and surface p ro files fo r the underside o f sam ple C l.5 .2 ,
including the penetra tion root angle m easurem ents fo r the sample.
192

P osition 1
Position 2
M ild S tee l - S ta in less S teel-----
/ \
/Jjf l __ I
P osition 3
i
F igure 142. IF M 3D surface im age and surface p ro files fo r the f r o n t o f the w e ld bead o f
sam ple F 2 .7.5
193

Position 1
\
/si --
f \
P osition 2
M ild S teel L J l j S ta in less S teel
I l \
r f-r4~4fl y i j
Position 3
M ild S tce1
/
S ta in less S teel
\ 0 - 3 7
0 - 3 2
0 - 2 7
M ean 0 = 32
F igure 143. IF M 3D im age a n d surface p ro files fo r the underside o f sam ple F 2 .7.5,
inc luding the penetra tion root angle m easurem ents fo r the sample.
194

Position 1
M ild S tee l S ta in less S tee l
L u gr a n
Position 2
/Tsrv
M ild S teel >JP i S ta in less S tee l
■ /1-----L-----i-----J
Position 3
M ild S tee l . S ta in less S tee l
/ \
’-W1
F igure 144. IF M 3D surface im age a n d surface p ro files fo r the fr o n t o f the w e ld bead o f
sam ple F 4 .8.1
195

M ean 0 = 1 6
F igure 145. IF M 3D im age a n d surface p ro files fo r the underside o f sam ple F 4 .8.1
including the penetra tion root angle m easurem ents fo r the sample.
196

Sta in less S tee l
P osition 2
M ild S teel S ta in less S tee l
Position 3
S ta in less S teel
F igure 146. IF M 3D surface im age a n d surface p ro files fo r the f r o n t o f the w eld bead o f
sam ple F6.5.1

M ean 0 = 29
0 = 36
0 = 25
0 = 26
P osition 1
Position 2
F igure 147. IF M 3D im age and surface p ro fd es fo r the underside o f sam ple F 4 .8 .1
including the penetra tion root angle m easurem ents fo r the sample.
Position 3
M ild S teel S ta in less S teel
198

F igure 148. IF M 3D surface im age a n d surface p ro files fo r the fr o n t o f the w e ld bead o f
sam ple F 8.5 .6
Position 2
S ta in less S tee l
TsT
— 1— f -
Position 3
P osition 1
M ild S tee lS ta in less S tee l
199
. %

M ean 0 = 43
0 - 4 1
0 - 4 6
0 = 42
Position 1
Position 2
Position 3
F igure 149. IF M 3D im age and surface p ro files fo r the underside o f sam ple F 8 .5.6
including the penetra tion root ang le m easurem ents fo r the sample.
S ta in less S teel
2 0 0

An
gle
C y c l e s
F igure 150. G raph show ing the rela tionship between the penetra tion root angle and fa tig u e
life, fo r s im ila r th ickness Laser H ybr id Welds
C y c l e s
F igure 151. Graph show ing the rela tionship between the penetra tion roo t ang le a n d fa tig u e
life, fo r sim ilar th ickness C o ld M eta l Transfer Welds
2 0 1

Ha
rdn
ess
(0
.5H
v)
3 5 0 .0
F igure 152.
B o tto m o f the HAZ
M S
W e ld
S S
Top o f th e HAZ
2
P o s itio n
C1
- F 2
- F 4
Graph show ing hardness o f H eat A ffec ted Zone (HAZ) o f the m ild steel fro m
bottom to the top o f the fa t ig u e specim ens
2 0 2

4.6 Com pa r ison o f We ld in g T ech n iqu es
M any different w eld ing techniques are used in a variety o f industries for m any different
uses and applications, there is lim ited literature available reporting the m echanical
properties o f d issim ilar jo in ts, particular h igh strength stain less steel to z inc coated m ild
steel in thin sections. The fo llow in g section show s com parisons o f m echanical
properties betw een the novel jo in in g techniques and processes already estab lished
particularly in the autom otive industry.
4.6.1 Com parison o f Tensile Properties o f D ifferen t W eld ing
Techniques
Research w as carried out at Sheffie ld H allam U niversity in to fatigue properties o f
dissim ilar m etal laser w elded jo in ts66. This research included tensile properties o f the
laser w elded jo in ts and the tensile results o f d issim ilar m etal butt jo in ts for laser
w eld ing and laser hybrid w eld ing are show n in figures 153 and 154.
203

UTS
&
Yie
ld
Str
en
gth
(M
Pa
)
UTS
& Yield
Strength (M
Pa)
5 0 0
L a s e r W e ld in g L a s e r H y b r id W e ld in g
4 5 0 -j
V 1 4 3 7 1 .2 m m - 3 0 4 1 .0 m m D oga l 2 6 0 R P -X 1 .5m m -H y -T e n s 1 0 0 0 1 .5m m D o g a l 2 6 0 R P -X 1 .5m m -H y -T e n s 1 0 0 0 1 .5m m
3 0 8 3 09
'igure 153. Com parison o f UTS (M Pa) D issim ila r M etal W elded Sam ples o f Austen itic
Stain less S teel and Z inc C oated M ild Steel Using Laser W elding and Laser H yb r id W elding
L a s e r W e l d i n g L a s e r H y b r i d W e l d i n g C o l d M e t a l T r a n s f e r
V 1 4 3 7 1 .2 m m - 2 2 0 5 1 .0m m D o g a l 2 6 0 R P -X 1 .5m m -
LD X 21 0 1 1 .5m m 3 0 8
D og a l 2 6 0 R P -X 1 .5 m m -
LD X 21 0 1 1 .5 m m 3 0 9
D o g a l 2 6 0 R P -X 1 .5 m m -
LD X 21 0 1 1 .5 m m 3 0 8
Figure 154. Com parison o f UTS (M Pa) D issim ila r M etal W elded Sam ples o f D up lex
Stainless Steel and Z inc C oated M ild Steel Using Laser Welding, Laser H yb r id W elding a n d
C old M eta l Transfer
204

4.7 Com par ison o f F a tig ue P ro p e r ties f o r V ar ious W eld ing
M eth o d s
F igu re 155 below show s a g raph o f the M ean Fatigue Line L oad (m easured in N /m m )
fo r each series o f L H W jo in ts as a resu lt o f staircase fatigue testing , and the resu lts fo r a
jo in t o f the sam e m ateria l com b ination using L aser W eld ing. The exact jo in t
con figu ra tion used in the L aser W eld ing is g iven in T ab le 21 a long w ith all the
ca lcu la ted resu lts fo r the fatigue test.
4 0 0
3 5 0
3 0 0
•250
-0200o
1150
100
5 0
F1 F 2
* •1
F3 F 5 F 6 F 7 F 8 C M T L a s e r
W e ld in g
^ LD X & 3 0 8 L -S i F W
H y -T e n s & 3 0 8 L -S i F W
^ L D X & 3 0 9 L - S i F W
g H y -T e n s & 3 0 9 L -S i F W
J^ LD X w i th o u t F W
C M T
F W - F il le r W ir e
F igure 155. The sta ircase results represented as M ean Fatigue L ine L o a d Range (M FLLR),
at 2m illion cycles fo r L H W dissim ilar m eta l butt join ts using L D X 2101, H y-Tens 1000 and
zinc coated m ild stee l w ith two f i l le r wires. The com parative laser w elded resid ts are
in c lu d ed fo r reference.
205

S er ies ID
C a lcu la ted
M ean F a tigu e
S tren g th (kN )
S tan d a rd
D ev ia t ion (kN )
C o n vergen ce F acto r
(> 03 o r < 1 .2 fo r test
va lid ity )
S tan d a rd E r ro r fo r th e
M ean F a tigu e S tren g th
(kN )
M ean F a tigu e L ine
L oad (N /m m )
FI 9.57 0.95 1.14 0.33 213
F2 15.70 0.74 1.11 0.26 349
F3 9.42 0.47 0.56 0.16 209
F5 8.44 0.90 1.08 0.30 188
F6 15.00 1.07 0.92 0.36 333
F7 7.75 0.63 0.74 0.22 172
F8 14.52 0.65 0.98 0.28 323
C l* 8.5 0.57 0.85 0.28 189
Laser on ly
w eld ing**12.5 0.32 0.96 0.19 278
*LD X 2101 1.5m m jo ined to D oga l 260R P -X 1.5m m thick using C old M etal Transfer
** LDX 2101 1.0m m thick jo ined to D oga l 260R P -X 1.2m m thick using laser w eld ing
Tab le 21. The resu lts o f s ta i r c a se fa t ig u e tes ts o f L H W d iss im ila r m e ta l b u tt jo in ts
u s in g L D X 2101 , H y-Ten s 1000 a n d z in c c o a te d m ild s te e l w ith tw o f i l l e r w ires, se e
T ab le IS f o r d e ta i ls o f w e ld jo in t con f ig u ra tio n a n df i l le r w ir e used.
206
5 D iscussion
5.1 M a te r ia l C h a ra c te r isa tio n
R esults o f the material characterisation o f the parent materials confirm ed m echanical
and m etallurgical properties o f the supplied material to relevant specifications.
The results o f the characterisation show ed that the H y-T ens 1000 stain less material is
the superior parent material in terms o f tensile strength and hardness, 1150M Pa and
381H v respectively, com pared to 800M Pa and 260 H v for L D X 2101 w ith the zinc
coated m ild having the low est tensile strength o f 400M Pa and low est hardness o f 144Hv.
207
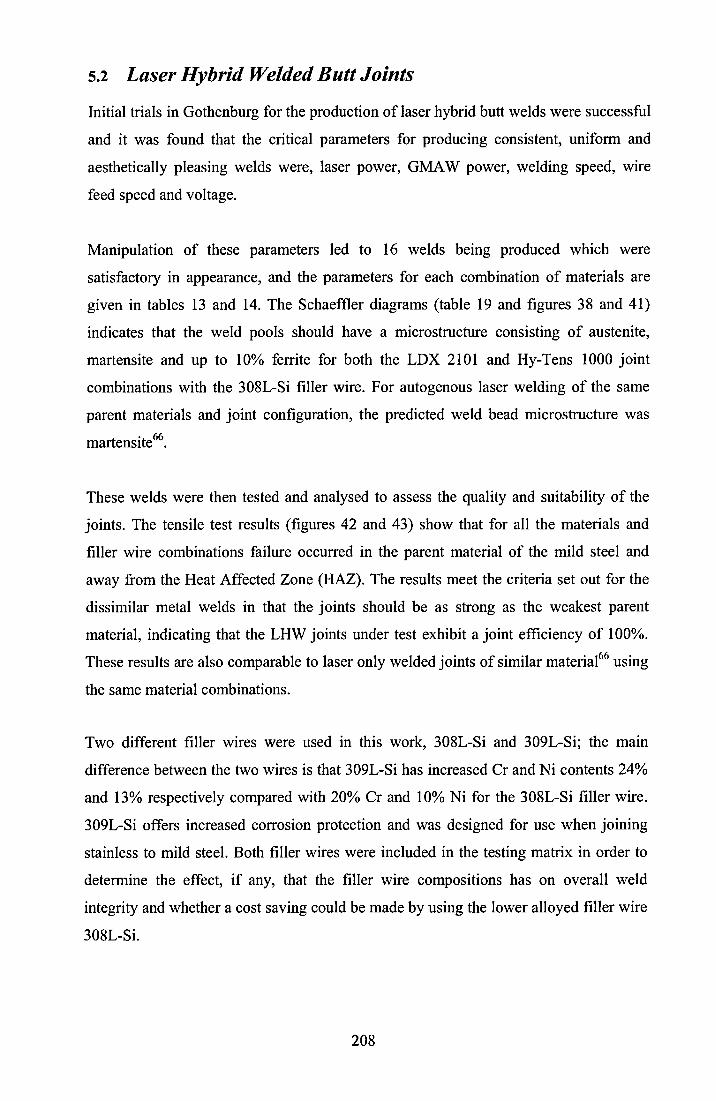
Initial trials in Gothenburg for the production o f laser hybrid butt w elds w ere successfu l
and it w as found that the critical parameters for producing consistent, un iform and
aesthetically p leasing w elds w ere, laser pow er, G M AW power, w eld ing speed, w ire
feed speed and voltage.
M anipulation o f these parameters led to 16 w elds being produced w h ich were
satisfactory in appearance, and the parameters for each com bination o f m aterials are
g iven in tables 13 and 14. The Schaeffler diagrams (table 19 and figures 38 and 41)
ind icates that the w eld poo ls should have a m icrostructure consisting o f austenite,
martensite and up to 10% ferrite for both the L D X 2101 and H y-T ens 1000 jo in t
com binations w ith the 308L -S i filler w ire. For autogenous laser w eld ing o f the sam e
parent m aterials and jo in t configuration, the predicted w eld bead m icrostructure w as
m artensite66.
These w elds w ere then tested and analysed to assess the quality and suitability o f the
jo in ts. The tensile test results (figures 42 and 43) show that for all the m aterials and
filler w ire com binations failure occurred in the parent material o f the m ild steel and
aw ay from the Heat A ffected Zone (H A Z). The results m eet the criteria set out for the
dissim ilar m etal w elds in that the jo in ts should be as strong as the w eakest parent
material, indicating that the LH W jo in ts under test exh ib it a jo in t e ff ic ien cy o f 100%.
T hese results are also comparable to laser on ly w elded jo in ts o f sim ilar m aterial66 using
the sam e material com binations.
T w o d ifferent filler w ires were used in th is work, 308L -S i and 309L -S i; the m ain
difference betw een the tw o w ires is that 309L -S i has increased Cr and N i contents 24%
and 13% respectively com pared w ith 20% Cr and 10% Ni for the 308L -S i filler w ire.
309L -S i offers increased corrosion protection and was designed for use w hen jo in in g
stain less to m ild steel. Both filler w ires w ere included in the testing m atrix in order to
determ ine the effect, i f any, that the filler w ire com positions has on overall w eld
integrity and whether a cost saving cou ld be m ade by using the low er a lloyed filler w ire
308L -S i.
5.2 L a se r H y b r id W elded B u tt J o in ts
208
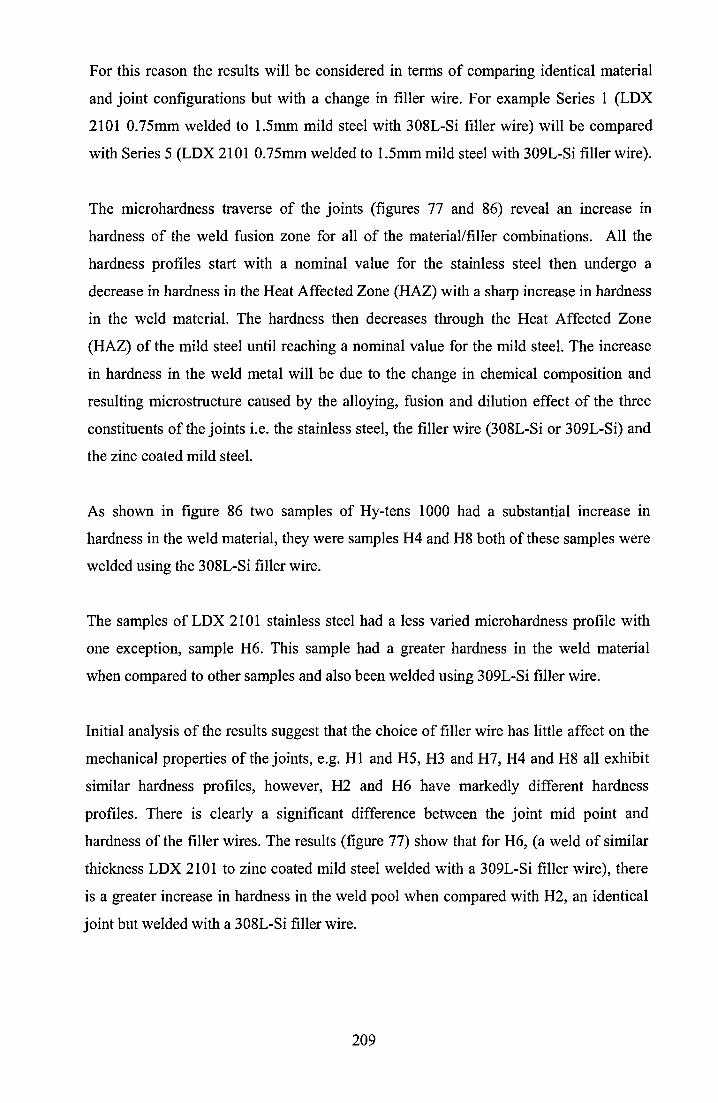
For this reason the results w ill be considered in terms o f com paring identical material
and jo in t configurations but w ith a change in filler w ire. For exam ple Series 1 (L D X
2101 0 .75m m w eld ed to 1.5m m m ild steel w ith 308L -S i filler w ire) w il l be com pared
w ith Series 5 (L D X 2101 0.75m m w elded to 1.5m m m ild steel w ith 309L -S i filler w ire).
The m icrohardness traverse o f the jo in ts (figures 77 and 86) reveal an increase in
hardness o f the w e ld fusion zone for all o f the m aterial/filler com binations. A ll the
hardness profiles start w ith a nom inal value for the stain less steel then undergo a
decrease in hardness in the Heat A ffected Zone (H A Z) w ith a sharp increase in hardness
in the w eld material. The hardness then decreases through the Heat A ffected Z one
(H A Z) o f the m ild steel until reaching a nom inal value for the m ild steel. The increase
in hardness in the w eld m etal w ill be due to the change in chem ical com position and
resulting m icrostructure caused by the a lloy ing, fusion and d ilu tion effect o f the three
constituents o f the jo in ts i.e. the stain less steel, the filler w ire (308L -S i or 309L -S i) and
the zinc coated m ild steel.
A s show n in figure 86 tw o sam ples o f H y-tens 1000 had a substantial increase in
hardness in the w eld material, they w ere sam ples H 4 and H8 both o f these sam ples w ere
w elded using the 308L -S i filler w ire.
The sam ples o f L D X 2101 stain less steel had a less varied m icrohardness p rofile w ith
one exception, sam ple H6. This sam ple had a greater hardness in the w eld m aterial
w hen com pared to other sam ples and also been w elded using 309L -S i filler w ire.
Initial analysis o f the results suggest that the cho ice o f filler w ire has little a ffect on the
m echanical properties o f the jo in ts, e.g. H I and H 5, H3 and H 7, H 4 and H8 all exh ib it
sim ilar hardness p rofiles, how ever, H2 and H 6 have m arkedly d ifferent hardness
profiles. There is clearly a sign ificant d ifference betw een the jo in t m id poin t and
hardness o f the filler w ires. The results (figure 77) show that for H 6, (a w eld o f sim ilar
th ickness L D X 2101 to zinc coated m ild steel w elded w ith a 309L -S i filler w ire), there
is a greater increase in hardness in the w eld poo l w hen com pared w ith H 2, an identical
jo in t but w elded w ith a 308L -S i filler w ire.
209

To exam ine the d ifference in hardness betw een H2 and H6 the chem ical com positions
from the as received parent materials and the w eld p oo ls as determ ined using the E D X
spot analysis on the Scanning E lectron M icroscope (SEM ) w ere plotted on a Schaeffler
diagram (see table 19 and figures 101 and 108) to determ ine the constituents o f the w eld
p oo l and estim ate the % d ilution.
The results indicate that for series 2 (figure 101) the w eld poo l w ill be a m ixture o f
austenite, m artensite and ferrite w ith a calcu lated d ilu tion o f 51%. The in itial result for
series 6 ind icates a resulting m icrostructure o f m artensite and 89% dilu tion (figure 103).
T hese results show ed that there w as a change in w eld chem ical constitu tion betw een
series 2 and series 6.
It is in teresting to note that the w eld com position o f sam ple H 6 is sim ilar to that o f
grade EN 1.4313 m artensitic stain less steel. This particular grade has an as received
tensile strength o f 850M pa and 0.2% y ie ld strength o f 700M pa79. The hardness ranges
from 230-335H v79. This exceeds the strength o f the strongest parent material L D X
2101; therefore, it w ou ld expect the jo in ts to provide 100% jo in t e ff ic ien cy w ith the
failure occurring in the m ild steel as the w eakest constituent w hich w as true for the
tensile results T6.
In order to explore the increased hardness in the weld fusion zone o f series 6 additional
E D X spot analysis w as carried out at three d ifferent positions o f the w eld (top, m idd le
and bottom as show n in figure 105). The results w ere then p lotted onto the Schaeffler
diagram (figure 105), w h ich indicated a variation in chem ical com position in d ifferent
areas o f the w eld pool. The top o f the w eld indicated an austenitic structure w ith
approxim ately 20% ferrite and an approxim ate d ilu tion o f 40% , w h ile the m idd le and
bottom o f the w eld poo l indicated m artensitic structure and 85% and 89% d ilu tion
respectively.
F inally, a hardness map o f series 6 w as carried out (figure 84) clearly ind icating a
change in m icrohardness across the w eld poo l. This correlated to the change in loca l
chem istry from the spot analysis. The results have h igh lighted that the w e ld p oo l
produced by LH W is inhom ogeneous as a result o f the effect o f the laser and the
G M A W process.
210

The bottom o f the p oo l is predom inately controlled by the h igh ly penetrating laser
g iv ing a m artensitic structure m ain ly consisting o f the tw o parent materials and g iv ing a
sim ilar d ilu tion as laser w elded jo in ts66. The top part o f the w eld is in fluenced m ore by
the addition o f the filler w ire, exh ib iting a chem ical com position closer to that o f the
G M A W filler w ire.
There w as also a d ifference in d ilu tion for series 4, 58% (H y-T ens 1000 1.5m m to m ild
steel 1.5m m w ith 308L -S i fil ler w ire) and series 8, 79% identical jo in t configurations
but w ith 309L -S i filler w ire. This is also as a result o f the chem ical inhom ogen iety o f
the w eld pool.
Further m icrohardness m easurem ents w ere taken from a selection o f fatigue sam ples for
each series in order to assess the change in hardness through the w eld bead. The tests
w ere also carried out to determ ine whether the change in m icrohardness observed in
series 6 (figure 84) w as representative o f jo in ts of this type. Four fatigue sam ples from
each series were assessed , tw o that had survived the fatigue tests and tw o that fa iled
before the 2 m illion cyc le runout. These are outlined in figures 78 to 85 for jo in ts w ith
L D X 2101 and figures 87 to 94, the remainder o f the m aps can be seen in A ppend ix A .
There w as a variation in hardness observed across the sam ples w ith som e sam ples
show ing very h igh hardness in particular areas, towards the low er part o f the w eld ,
confirm ing that in som e sam ples an inhom ogeneous w eld p oo l w as being produced.
The results for the fatigue tests are g iven for each series in figures 48 -63 , the results are
represented in terms o f the actual staircase results, the calculations and w ork ing for each
series and a graph o f load against number o f cyc les com pleted. Table 21 and figure 155
g ive an overall summary o f the fatigue results and show that jo in ts produced using the
309L -S i filler w ire g ives sligh tly low er m ean fatigue strength than identical jo in t and
material configurations but w elded w ith the 308L -S i filler w ire.
Series FI (L D X 2101 0.75m m w elded to m ild steel 1.5m m w ith a 308L -S i f iller w ire)
has a m ean fatigue strength o f 9 .57kN com pared w ith series F5 w ith a m ean fatigue
strength o f 8.44kN . Series F2 (L D X 2101 1.5m m w elded to m ild steel 1.5m m w ith a
308L -S i filler w ire) has a m ean fatigue strength o f 15.70kN com pared w ith 15 .00kN for
series F6 w hich has the sam e jo in t configuration but w elded w ith 309L -S i filler.
211

The H y-T ens 1000 sam ples, F3 (H y-T ens 1000 to z inc coated m ild steel w elded w ith a
308L -S i filler w ire) has a m ean fatigue strength o f 9 .42kN com pared w ith F7 w h ich
exhib its a low er m ean fatigue strength o f 7 .75kN . Fatigue tests for series F4 (sim ilar
th ickness H y-T ens 1000 to z inc coated m ild steel w ith 308L -S i filler) and series F8
identical jo in t and material configuration but w ith the 309L -S i filler w ire w ere carried
out, the results show ed a h igh spread o f load levels. For series F4 this resulted in the
calcu lated value for the convergence factor being outside the boundaries necessary for
producing a set o f valid va lues for m ean fatigue strength and standard deviation. Series
F8 did, how ever, fall w ith in the calcu lation boundaries for the convergence factor and
standard deviation; on ly 17 sam ples w ere tested compared to 25 sam ples for the other
fatigue series. This w as due to a lack o f suitable sam ples available for test due to a large
variance in w eld quality and d ifficu lties faced w ith in the setup tests. It is thought that
had m ore sam ples been available the test w ou ld have becom e invalid due to the
variation in w eld quality. Therefore the results o f series F8 are to be treated w ith caution
and ideally in the future the tests w ou ld be repeated to confirm the results.
There is a sign ificant d ifference in m ean fatigue strength betw een the 1.5m m stain less
(F2 and F6) sam ples and the 0.75m m stain less (F I , F3, F5 and F7). It w ou ld be
expected that the m ean fatigue strength should be sim ilar for both th icknesses, how ever,
the sign ificant change in geom etry from the w eld bead to the 0.75m m sta in less (as
illustrated in figure 64) is causing a stress concentration at the w eld toe resulting in the
low er fatigue strength. A ll the sam ples in the F I , F3, F5 and F7 series fa iled through the
Heat A ffected Zone on the stain less steel side o f the w eld at this stress concentration, as
show n in figure 66.
The results obtained from the staircase fatigue tests indicate that the standard deviation,
w hich represents the variation in fatigue strength betw een jo in ts m ade to the sam e
configuration, for each jo in t configuration is notably h igher than that seen in sim ilar
jo in in g p rocesses, such as laser on ly w eld ing. There is an additional p rocess and a filler
w ire invo lved in LH W w hen com pared to Laser on ly w eld ing increasing the p rocess
variability and therefore a higher than anticipated standard deviation w as obtained.
The results o f the fatigue testing are represented by line loads in figure 155, the m ean
fatigue strengths have been converted into a Tine load ’ value, m easured in N ew to n ’s per

unit length, this a llow s for the results to be com pared to d iscontinuous w eld ing
processes, such as resistance spot w eld ing. Figure 155 show s that for L D X 2101 a laser
hybrid w elded jo in t can w ithstand a greater load over a unit length than a laser on ly
w elded jo in t o f sim ilar parent material. The results are ind icating that laser hybrid
w eld ing can produce jo in ts w ith increased fatigue strength w hen com pared to laser on ly
w eld ing. The standard error for m ean fatigue strength w as also calculated, this a llow ed
an error for the tests to be g iven on the overall fatigue graph (figure 155). For all the
series the error w as consistent w ith the value for the error calcu lated betw een 0 .16kN
and 0 .3 6kN for the w eld ing techn iques evaluated and com pared in this study.
For the sim ilar th ickness LH W jo in ts (series F2, F4, F6 and F8) figure 68 show s the
typ ical position o f failure for the fatigue specim ens. The failures appear to begin at the
root o f the w eld bead on the m ild steel side o f the jo in t. Established fatigue literature
suggests that the fatigue properties o f w elded jo ints are dependant on the geom etry o f
the jo in t. The root o f the w eld bead potentia lly w ill act as a stress raiser, therefore the
angle w as m easured using optical m icroscopy and an im age analysis package. The
greater the root angle the greater the potential stress concentration therefore lim iting the
fatigue life o f the sam ple. Figures 72 to 75 show the root angle m easurem ents for series
F2, F4, F6 and F8 against the fatigue life o f the sam ples.
The general trend observed is that the greater the root angle the shorter the fatigue life.
In order to confirm that there is a relationship betw een angle and fatigue life a statistical
T-Test w as carried out.
A T -Test assesses whether the m eans o f tw o groups of data are statistically d ifferent
from each other. The root angle data w as split into tw o groups, those that fa iled under
500 ,000 cyc les and those w ho survived to 2 ,000 ,000 cycles.
The 95% con fidence interval for the m ean d ifference o f the test w as -17 .88 and -5 .77 ,
the T -V alue w as calculated to -4 .05 w hich w ere outside the con fidence lim its o f the data
and a P-V alue w as calculated to 0 .001 , therefore the test indicated that the tw o groups
o f data w ere sign ificantly statistically different. This m eans that the tw o groups o f data
are not from the sam e data set thus confirm ing that the angle at the root o f the w eld
could determ ine w hether or not it w ou ld survive a fatigue test. The results o f th is test
gave an in itial ind ication as to whether or not a relationship betw een the fatigue
213

property and geom etry o f a w eld ex isted w ith in the scope o f this project. Further
analysis w as carried out and is exp lained in section 5.5.
214

Problem s w ere encountered w hen w eld ing trials for the lap jo in t configurations w ere
carried out. In order to assess the process for lap jo in ts several in itial sam ples w ere
w elded. T w o sam ples w h ich appeared the best w ere selected , Sam ple 7 (L D X 2101
1.5m m to z inc coated m ild steel w ith a 10m m overlap) and Sam ple 19 (H y-T ens 1000
1.5m m to z inc coated m ild steel w ith a 10m m overlap). These sam ples w ere m ounted
polished, etched and subjected to a m icrostructural exam ination.
There w ere concerns that the leve l o f penetration was too great therefore the depth w as
m easured and figures 114 and 115 show that both samples had a penetration o f
approxim ately 0 .9m m through the 1.5m m thick bottom plate. From an aesthetic
v iew poin t penetration through the bottom plate is undesirable, how ever, m icroscop ic
exam ination illustrated that there is no through penetration o f the sam ples exam ined and
the depth o f penetration w as no longer a concern.
Solid ification cracks w ere also observed in sam ple 7 (figure 113), E SA B process and
developm ent centre carried out a m etallurgical investigation80 and concluded that the
cracking w as like ly to be from stress developed during coo ling i.e. so lid ifica tion
cracking, w hich w as caused by the d ifferences in thermal expansion b etw een the
regions present in the jo in t. The recom m endation from the report to elim inate such
cracking w as to speed up the solid ification rate o f the w eld and this cou ld be done by
increasing the overall w eld ing speed.
D uring further optim isation o f lap jo in ts it w as fo und that the process w as very unstable,
producing large amounts o f spatter, and surface breaking porosity in both m aterial
com binations (figures 116 and 117). In addition to these defects transverse cracking w as
observed on the underside o f the H y-Tens 1000 w eld sam ples (figure 118). D ifferen t
w eld ing speeds, torch angles and inter p late gaps using shim s w ere tested how ever,
optim um process parameters cou ld not be found, w h ich elim inated further w ork in to lap
jo in ts w ith in the scope o f this project.
Surface breaking porosity probably caused by the z inc vapour w ith up to 20 v is ib le
pores in a 300m m length o f w eld w as observed. In order to attempt to elim inate this
problem w eld ing speeds from 1.3m /m in to 8 .5m /m in w ere attempted, w ith no success.
One option to elim inate this problem w ou ld be to decrease the w eld ing speed further
215
5.3 L a se r H y b r id W elded L a p J o in ts

b elow 1.3m /m in. I f the w eld ing speed w as reduced then the laser hybrid w ou ld no
longer exh ib it the advantage o f h igher p rocessing speeds w hen com pared w ith the
normal G M A W process.
The relationship betw een the torch angle, interplate gap and the number o f cracks
appearing on a sam ple w ith the H y-T ens 1000 (figure 119) show ed that as the gap
betw een the tw o p lates and the w eld ing angle increases the amount o f observed
cracking is greatly reduced.
H ow ever, introducing a gap betw een the plates in an industrial and m anufacturing
setting w ill have a negative effect on productivity. In addition the introduction o f a gap
betw een tw o sheets o f material w ill have a detrimental effect on the fatigue, the larger
the gap the more detrimental the effect w ill be on the fatigue life properties o f the
jo in ts66. This w ill not appeal to the manufacturers and this m ay affect their decision to
use the Laser Hybrid process for lap w eld ing.
The cracking on the underside o f the w elds produced (figure 120) on ly appeared on
sam ples using the H yTens 1000 material. The b lue and brown areas present on the
surface o f the crack suggest that the crack took p lace at h igh temperature. The surface o f
the crack w as exam ined and im aged (figure 121) using E D X analysis and a h igh
concentration o f Zn w as present in som e areas o f the fracture surface. Figure 122 show s
a longitudinal cross section through the w eld and show s that the pores and cracks
appear sim ultaneously. This suggests that the cracking had been caused by L iquid
M etal Embrittlement (LM E) due to the z inc coating from the m ild steel and the vo la tile
nature o f the z inc during laser hybrid w eld ing. H yTens 1000 stain less steel is an
austenitic grade and h igh ly susceptib le to LM E.
LM E w as not observed in sam ples contain ing L D X 2101 stain less steel, this is a dup lex
stain less steel contain ing phases o f ferrite and austenite. Research and literature
suggests that L D X 2101 is not at risk from LM E attack81,82.
O ccasionally throughout the trials a section o f a we ld w ou ld exh ib it the desirable w e ld
appearance. H ow ever, w hen the parameters w ere kept constant and the w e ld repeated it
w as found that the consistency and reliab ility o f the w eld ing process for a lap jo in t w as
poor.
216

The co ld m etal transfer p rocess w as optim ised for the jo in in g o f L D X 2101 1.5mm
th ick to D oga l 260R P-X 1.5m m th ick using a 308L -S i filler w ire.
308L -S i filler w ire w as chosen because Laser Hybrid W elded sam ples o f sim ilar
m aterial com bination the jo in ts using 308L -S i filler w ire gave the h igher fatigue life and
m ore consistent results. The results for series C l w ill be d irectly com parable to series
F2 (L D X 2101 1.5m m th ick to D oga l 260R P -X 1.5m m th ick w ith 308L -S i filler w ire)
o f the LH W join ts.
The critical parameters during the optim isation w ere found to be w ire feed speed,
w eld ing speed, arc length correction and the plate gap. The effects o f varying these
parameters on the resulting w eld bead can be found in figure 123. It w as found that the
penetration o f the w eld ing p rocess cou ld be controlled by find ing the correct w ire feed
speed in balance w ith the optim um w eld ing speed. A s the w ire feed speed increases too
m uch penetration occurred w hereas as the w eld ing speed increases the penetration
decreased.
The Arc Length Correction (A LC ) value controlled the stability o f the arc and the
spread o f the w eld reinforcem ent during deposition as the A LC w as increased the arc
becam e unstable producing spatter, how ever, i f it was reduced too m uch the w eld bead
profile becam e a lot steeper. Variation in p late gap caused the penetration to becom e too
m uch or too little so the correct balance needed to be found in conjunction w ith the
correct w eld ing and w ire feed speed.
A n observation m ade during the optim isation process, w as that the w eld bead deposited
(reinforcem ent) w as substantially m ore prom inent than the w eld bead produced using
the laser hybrid p rocess.
Table 21 outlines the optim um parameters for the material com bination used in this
research for the C old M etal Transfer p rocess, a number o f identical w elds (14 in total)
were produced w ith these parameters and denoted as series C l . The w elds w ere then
tested and analysed to assess the quality and suitab ility o f the jo in ts as outline in section
4.4.
5.4 C o ld M e ta l T ra n sfe r S im ila r T h ickn ess B u tt J o in ts
217

For each o f the 14 identical w elds produce for series C l , 1 tensile test w as carried out,
the results are show n in figure 124. The results show that for all the tests carried out
failure occurred in the parent material o f the m ild steel and aw ay from the Heat
A ffected Z one (H A Z). Theses results m eet the criteria set out for the dissim ilar m etal
w elds in that the jo in ts should be as strong as the w eakest parent material, indicating
that the CM T jo in ts under test also exh ib it a jo in t e ff ic ien cy o f 100%. These results are
also com parable to laser on ly w elded jo in ts66 and laser hybrid w elded jo in ts produced
w ith sim ilar material com binations (figure 134).
M icrohardness m easurem ents w ere taken from a selection o f fatigue sam ples in order to
assess the change in hardness through the w eld bead and determ ine an effect i f any the
microhardness had on the fatigue properties. Four fatigue sam ples w ere assessed tw o
that had survived the fatigue tests (figure 132 and A ppend ix A figure 18) and tw o that
fa iled before the 2 m illion cyc le runout (figure 131 and A ppend ix A figure 17). The
m icrohardness maps show that there are no sign ificant changes in m icrohardness from
the stain less steel to the w eld pool. The change observed betw een the w eld poo l and the
m ild steel is one to be expected. The m icrohardness is consisten t across all four sam ples
and exh ib its no h igh hard spots or changes in m icrohardness through the w eld as
previously seen on the laser hybrid w elded jo in ts of com parable material com bination.
E lem ental m apping w as carried out on the jo in ts produced using the C old M etal
Transfer process. E lem ents m apped for w ere the m ain a lloy ing elem ents o f the m aterials,
iron, chrom e and n ickel. The results o f the m apping can be seen in figures 103 to 106,
the results show that the elem ents w ith in the w eld p oo l are distributed even ly suggesting
that the w eld poo l is m ix ing equally and producing a hom ogenous w eld poo l, as is
desirable in w eld ing. The hardness results also confirm that a hom ogenous w eld p oo l is
being consisten tly produced using the CM T process un like sim ilar w eld s produced
using the laser hybrid process.
The results for the staircase fatigue tests carried out for series C l are outlined in figures
125 and 126. The calculated m ean fatigue strength is 8 .5kN w ith a standard deviation
value o f 0.57kN . The convergence factor w as calculated to be 0.85 m ean ing that the
results o f the fatigue tests are statistically valid. W hen com pared to the laser hybrid
w eld series F2 w hich had a m ean fatigue strength o f 15.70kN alm ost double that o f the
CM T join ts.
218

Fatigue failure analysis o f the fatigue specim ens indicated that the fatigue failure
occurred through the H A Z o f the m ild steel w ith the poin t o f origin at the root o f the
w eld , figures 127 and 128 demonstrate this. The origin and cause o f the fatigue failure
is sim ilar to that o f the Laser Hybrid fatigue specim ens.
A s w ith any form o f w eld ing there is an im m ediate effect o f change in geom etry from
the parent m aterials, the change in geom etry w ill alw ays affect the fatigue properties as
outlined in section 2 .7 . A t the root o f the w eld bead there is a stress concentration as
there is a change in geom etry, this then causes loca lised stresses to increase and cause
failure through the w eaker o f the tw o parent materials. The crack has initiated at the
stress concentration then propagated through the H AZ o f the m ild steel.
In order to evaluate the effect, i f any, the stress concentration at the root o f the w eld w as
having on the fatigue properties o f the jo in t, the angle betw een the m ild steel and the
penetration o f the w eld w as measured. The angle for each fatigue sam ples w as
measured as show n in figure 129 and then plotted in figure 130 as angle against fatigue
life. The graph show s a trend betw een the angle at the root o f the w eld and the fatigue
life , as the angle get sm aller the fatigue life increases. Thus in reality the sm aller angle
the less dramatic the change in geom etry is betw een the w eld poo l and therefore a
reduction in loca l stress. The effect o f root angle on the fatigue properties o f the w elded
jo in ts w ill be d iscussed in further in the next section (section 5.5).
219

5.5 In f in it e F o cu s M ic ro sco p y
A relationship between the penetration root angle and fatigue life appeared to exist for
both Cold Metal Transfer joints and Laser Hybrid W elded joints. In order to assess and
determine this relationship the Infinite Focus M icroscope (IFM) was employed. 3D
im ages were produced using the Infinite Focus M icroscope for the similar thickness
fatigue series for LHW and CMT, F2, F4, F6, F8 and C l. The fatigue samples were
categorised into three groups, samples which failed below 500,000 cycles, samples
which failed between 1000,000 to 1500,000 cycles and ones which survived to
2,000,000 cycles. For each series one sample was randomly selected from each group.
Each sample was imaged on both the top o f the weld and the underside o f the welds
creating 3D images.
The 3D images for the tops o f the welds show the consistency o f the w elding profile,
samples from the C l series (figure 140) , those produced using CMT, show a much
more consistent weld bead profile than LHW welds (figure 142,144,146 and 148). The
weld bead on the C l series samples are almost perfect circles when compared to those
o f LHW, however, the weld bead on the CMT samples is much more prominent with
much more reinforcement than the LHW samples. This excess reinforcement may also
explain the reduced fatigue life when compared to similar LHW fatigue results as the
weld is much bigger and would therefore produce a bigger stress concentration at the
weld/parent material interface.
The top side surface profiles for series F2 (figure 142) and F6 (figure 144) are
consistent along the length o f the weld. However, they do vary in shape slightly, F6 is
has a more acute weld profile than F2 and the only difference between these two sets o f
samples are the filler wires. Both samples are LDX 2101 1.5mm thick jo ined to Dogal
260RP-X 1.5mm thick, F2 with 308L-Si filler wire and F6 with 309L-Si filler wire. F4
and F8 are joints produced using Hy-Tens 1000 stainless steel where as the other 3
series are joints produced using LDX 2101.
The top side profiles for series F4 (figure 146) and series F8 (figure 148) don ’t appear
to be as consistent as the other series along the area o f weld examined, w ith a variation
in profile occurring. This isn ’t such a surprise because F4 and F8 had inconclusive
fatigue results due to the spread o f load levels being too wide. This suggests that the
220

process o f LHW for joints produced using Hy-Tens 1000 stainless steel was not w holly
optim ised and the join ts produced were not consistent.
The profiles measured on the underside o f the welds for all four series show that the
penetration does vary between processes (figures 141, 143, 145, 147 and 149). CMT
tends to have a wider bead o f penetration than those samples produced using LHW.
The consistency across the w eld sample for series Cl, F2 and F6 is very good, however,
there is some variation observed in the profiles for the penetration on series F4 and F8,
and this is probably because o f the less than optimised process for these samples.
The angle between the mild steel and the weld bead penetration was measured for all
five series o f fatigue testing using the IFM. For each o f the 3 surface profiles analysed
the angle was measured for each sample. The results were then averaged for each
sample and plotted against the fatigue life o f the sample, the results are shown in figures
150 and 151.
Figure 150 shows the results o f the analysis carried out on LHW samples, the graph
indicates a relationship between root angle at the point o f failure and fatigue life. A s the
angle at the root o f the weld decreases the fatigue life increases. A best fit line was
plotted and the relationship between angle and fatigue life for LHW joints can be
defined as:
0 = - 0 .9 *10~5;c + 48.88
Where,
0 = angle at root penetration (°)
x = fatigue life in cycles
E qu a tio n 13. R e la t io n sh ip b e tw een a n g le a t w e ld r o o t a n d f a t ig u e l i fe f o r L H W
Therefore i f the angle at the root o f the weld was measured prior to testing, equation 13
above could be used to estimate the fatigue life, or i f the sample had previously been
tested the root angle could be predicted from the result o f the fatigue life. For example
for a laser hybrid welded sample to survive to 2 m illion cycles the maximum angle o f
the root penetration is 30.88° and can be calculated as shown below:
0 = -0 .9 * 10-5 * 2000000 + 48.88
# = -1 8 + 48.88
<9 = 30.88°
221

Fatigue samples produced using the CMT process also showed a similar relationship, as
the angle at the root decreases the fatigue life increases (figure 151), w ith the
relationship defined as:
0 = - 1 .3 * 1 0 _5x + 41.98
Where,
0 = angle at root penetration (°)
x = fatigue life in cycles
E qu a tio n 14 . Re la t io n s h ip b e tw e e n a n g le a t w e ld r o o t a n d f a t ig u e li fe f o r L H W
Therefore to predict the root angle required for a sample to complete 2 m illion cycles o f
a fatigue test the maximum angle would be 15.98° and can be calculated as shown
below.
0 = -1 .3 * lO ~ 5 *2000000 + 41.98
0 = - 2 6 + 41.98
0 = 15.98
The relationship between the angle at the root and the fatigue life suggests that the
fatigue properties o f welded joints are heavily dependent on the geometry o f the joint.
Any change in geometry w ill in turn effect the stress concentration at the point o f
fatigue crack initiation.
The model presented for the fatigue life and the angle at the root o f the w eld shows a
linear relationship with a negative gradient. The validity o f this model is only relevant
within the bounds o f the testing carried out in this research. I f the relationship was
extrapolated beyond the bounds there would be a value o f angle when the number o f
cycles to failure is 0. In theory this is un true as a fatigue test is carried out below the
materials value o f UTS, therefore the test would always produce x number o f cycles
before failure even i f the stress o f the root angle was high. It is expected that i f the tests
carried out in this study were expanded beyond the linear model, then the model would
in fact become a non-linear model, when the angle becom es small enough to produce
infinite fatigue life.
However, results o f the two processes show different values o f angle for the same
cycles to failure yet the fatigue properties are dependant on the geometry. Overall the
2 2 2

joints produced with the CMT process require a smaller angle to initiate and cause
fatigue failure than the LHW joints. A number o f factors could contribute to this, the
stress concentration in the CMT joints is higher than that o f the LHW joints. This is
because CMT joints have a larger weld bead, the reinforcement. Secondly when a stress
concentration is evident crack initiation and propagation occurs at a faster rate in the
CMT joints than the LHW. This is probably due to the difference in hardness observed
at the fatigue initiation site.
Figure 152 shows the hardness o f the 5 series o f fatigue samples in the HAZ on the mild
steel side o f the joints adjacent to the bottom o f the weld, this is the point o f failure for
the failed samples, up to the HAZ adjacent to the upper part o f the weld. The hardness
in the HAZ closest to the bottom o f the weld is consistently higher in the LHW joints
than the CMT joints.
As described previously in section 5.2 the LHW process produces an inhomogeneous
weld pool with a predominately martensitic structure in the lower ha lf o f the w eld pool,
which also means the HAZ o f the LHW is predominately martensitic. The UTS
properties o f martensite are greater than those o f the mild steel, therefore for the LHW
welds, the angle for a surviving fatigue sample is greater than that o f join ts produced
using the CMT process because the material properties in the HAZ differ. Hardness is
proportional to ultimate tensile stress which is proportional to fatigue life, therefore i f
the hardness is greater in the HAZ for LHW joints then the fatigue life is going to be
increased when compared to CMT joints.
The angle at the root o f the weld bead represents the stress concentration, as the angle
decreases the relative stress concentration would also decrease and the fatigue life o f the
specim en would increase. Therefore the relationship between root angle and fatigue life
is a linear relationship with a negative gradient.
CMT joints overall produced poorer fatigue results than similar joints using the LHW
process. However, the consistency o f the CMT joints is much improved and more
predictable than the consistency o f jo ints produced using the laser hybrid process. In
reality i f the geometry o f the welds produced can be controlled with either processes
then the fatigue properties can be controlled and possib ly improved.
223

The overall aim o f this research was to assess these novel join ing techniques in terms o f
their ability to produce joints similar in tensile, fatigue properties and appearance to
techniques already w idely used within the automotive industry. One w idely used
application in industry is laser welding and to date the results for the tensile tests o f the
butt joints can be compared favourably to laser welded butt join ts as shown in figures
153 and 154.
Figure 153 shows current results for austenitic stainless steels and zinc coated mild steel.
A s seen on figure 153 the results are very similar and the joints failed within the mild
steel away from the HAZ. The results for the LDX 2101 to mild steel materials are also
similar as shown in figure 154 with UTS o f around 400M Pa. This is representative o f
the tensile strength o f zinc coated mild steel with values expected o f 380-400M Pa.
The results o f the fatigue testing (figure 155) indicate that Laser Hybrid W elding
compares favourably to the results o f Laser W elding in terms o f mean fatigue strength.
Currently both processes are used in the automotive industry, however, laser w elding is
more w idely used than Laser Hybrid W elding. With comparable fatigue properties there
is potential for LHW to be used for more application in particular dissim ilar metal
join ing. Cold Metal Transfer jo ints were also tested and showed much lower mean
fatigue strength when compared to similar joints with the laser hybrid process and the
laser only welding, as explained in section 5 this is most likely due to the geometrical
factors involved in this process.
The results obtained from the staircase fatigue tests indicate that the standard deviation,
which represents the variation in fatigue strength between joints made to the same
configuration, for each joint configuration is notably higher for Laser Hybrid W elding
than that seen in similar join ing processes, such as laser only w elding and Cold Metal
Transfer. There is an additional process and a filler wire involved in LHW when
compared to Laser only welding increasing the process variability and therefore a higher
than anticipated standard deviation was obtained. CMT has an additional filler wire but
showed that the reproducibility in weld quality and consistency in joint geometry was
much better than LHW.
5.6 C om pa r ison o f Weld in g T ech n iqu es
224

5.7 Sum m a ry o f D iscu ss io n
Table 22 below shows a summary o f the results o f this research, this can be used to
assess whether the objectives at the beginning o f the research were met.
S er ies
ID
S ta in less
G rad e and
T h ick n ess
(m m )
F ille r W ireC a lcu la ted
M ean F a tigue
S tren g th (kN )
U lt im a te T en sile
S tren g th (M P a)
A v era g e H ard n ess o f
W eld (H v)
1L D X 2101
0.75
308L -S i9.57 385 .7 305 .0
2L D X 2101
1.5
308L -S i15.70 388 .8 284.1
3H y-Tcns 1000
0 .75
308L -S i9.42 389.5 312 .0
4H y-Tcns 1000
1.5
308L -S iN o t valid 391 .9 2 88 .6
5L D X 2101
0.75
309L -S i8 .44 387 .9 2 6 7 .6
6L D X 2101
1.5
309L -S i15.00 387 .0 2 68 .6
7H y-Tcns 1000
0.75
309L -S i7.75 391 .2 284 .3
8H y-Tcns 1000
1.5
309L -S i14.52 387 .7 249 .9
C lLD X 2101
1.5
308L -S i8.5 422 .6 225.1
Tab le 22. C om pa r ison o f F a tigue , ten s i le a n d h a rd n ess p r o p e r t ie s o f w e ld
co m b in a tio n s te s te d in th e resea rch
Acceptable process w indows were found for Laser Hybrid W elding o f LDX2101 to zinc
coated mild steel for the combinations tested in the work (F I, F2, F5 and F6). After
initial visual assessment o f Laser hybrid welded samples using Hy-Tens 1000 stainless
steel it was decided that the parameters were acceptable, unfortunately the consistency
o f the weld quality was poor and series F4 and F8 had unacceptable fatigue results. For
welds produced using CMT with LDX 2101, an acceptable process w indow was
achieved, however in the future controlling o f the weld reinforcement could improve the
fatigue properties.
M echanical properties for all joint combinations were assessed in terms o f tensile and
fatigue properties. A ll nine joint combinations passed the acceptance criteria that the
jo in t was to exhibit similar properties as the weakest parent material, e.g. the m ild steel.
The fatigue properties varied throughout the series and it was found that the geometry
o f the joint controlled the fatigue properties. The point o f failure for all series was the
225

underside at the root o f the weld. For similar thickness joints this occurred on the mild
steel side o f the joints and a relationship between root angle and fatigue life has been
proposed.
It was found that series F2 and F6 produced overall the best fatigue results, it is thought
that with further optimisation series F4 and F8 could produced similar fatigue results.
Series C l was identical in material combination to series F2, however the fatigue
properties were almost ha lf the value o f F2. It is thought that this is due to the excess
reinforcement o f welds produced using the CMT process, work in to the effect o f the
reinforcement needs to be assessed.
In terms o f hardness properties, series produced using LHW could have areas o f hard
spots and produce a inhomogeneous w eld pool, within the research this was found not
to have a negative effect on the fatigue properties as this was controlled predominately
by the geometry o f the welds produced. Joints produced using CMT had a more
consistent hardness across the weld pool and exhibited a lower average w eld pool
hardness when compared to laser hybrid joints.
226

6 Conclusions
The research detailed in this report has investigated the properties o f dissim ilar metal
join ts produced by two novel join ing techniques. After assessment o f the current
literature surrounding this subject, the experimental results and analysis the follow ing
conclusions can be made. The conclusions have been sub divided into, mechanical
properties, metallurgical properties and novel joining techniques.
• For similar and dissim ilar thickness fatigue samples the fatigue results indicate
that they are influenced more by geometry than the metallurgy o f the welded
samples.
• Fatigue properties o f similar thickness laser hybrid welded joints and cold metal
transfer welded joints are linearly related with a negative gradient to the value o f
the root angle on the mild steel side o f the join ts, as the angle at the root
decreases the fatigue life increases.
• The fatigue properties o f the series o f welded joints with dissim ilar thickness
parent materials are affected by the joint geometry, displaying lower mean
fatigue line load range than the similar thickness joints. This is due to the
increase in stress concentration on the stainless steel side o f the joint.
• The uni-axial tensile strength o f the laser hybrid welded and the Cold Metal
Transfer joints tested in this study meet the established criteria indicating that
they exhibit 100% joint efficiency.
• Fatigue properties o f similar thickness laser hybrid welded join ts can be
described by the equation 0 — - 0 .9 * 10 5x + 4 8 .8 8 , under the conditions o f test
described in this research.
• When join ing the material combinations outlined in this research with Laser
Hybrid W elding the resulting solid ified weld pool will be chem ically
inhomogeneous. The chemical inhomogeneity leads to a change in constitution
with a commensurate change in hardness through the thickness o f the w eld pool.
227

• It was difficult to optim ise the laser hybrid welding process for joints containing
Hy-Tens 1000 due to the presence o f zinc and the high strength o f the material.
• LHW lap joints o f all material combinations are greatly affected by the presence
o f zinc vapour during the welding process, causing porosity and cracking.
• The position o f the laser and GMAW torch during welding is critical and greatly
affects the LHW process for joints o f all material and join t combinations.
• The poor consistency observed with the fatigue samples welded with Hy-tens
1000 material is caused by the less than optimum welding process.
• Fatigue properties o f similar thickness cold metal transfer welded joints can be
described by the equation# = -1 .3 * 10~5x + 4 1 .9 8 , under the conditions o f test
outlined in this research.
• W elds produced using CMT resulted in a chem ically hom ogenous w eld pool and
consistent microhardness and constitution
• Samples produced using Cold Metal Transfer were considerably more consistent
in terms o f process stability and w eld geometry than those produced with LHW.
LHW welds outperformed CMT in terms o f fatigue performance, this was due to
the large reinforcement the CMT welds possessed.
• Overall, joints produced with the LDX 2101 stainless material produced more
consistent and reproducible joints than identical join ts using the Hy-Tens 1000
stainless grade. The results o f the research suggest that under identical
conditions o f testing LDX 2101 possesses greater weldability than Hy-Tens
1000.
• Laser hybrid welding and cold metal transfer can produce joints w ith mechanical
properties comparable with laser only welding currently being used in the
automotive industry.
228

7 Fu r th e r W ork
After assessment o f the work carried out during this research project the follow ing
suggestions for further work can be made:
• It was found under the scope o f this project that Hy-Tens 1000 and LD X 2101
behave differently during w elding with respect to the presence o f zinc. Therefore
an investigation into the metallurgical differences between LD X 2101 and H y
Tens 1000 should be carried out, w ith particular attention on the effect o f the
zinc vapour which is present during laser hybrid welding.
• Using initial parameters (samples 7 and 19) described in this research, design
and carry out a D esign o f Experiments (DOE) to determine optimum parameters
for lap welding using LHW. A ssess and evaluate the DOE in terms o f surface
cracking and porosity.
• Investigate potential ways o f rem oving the zinc coating prior to welding. A ssess
the implications o f cost this would have on the manufacturer looking at
implementing LHW or CMT into production.
• Assessm ent o f the suitability o f CMT for other material combinations including
Hy-Tens 1000 for both butt and lap joint configurations. This would allow a full
comparison o f both LHW and CMT for the materials focussed on in the current
research.
• In order to further the work using the CMT equipm ent at Sheffield Hallam
University it is recommended that consideration is giving to purchasing a robot.
The current trolley system relies a great deal on human reaction to line up the
specim en and to begin the process. A 5 axis robot would allow a greater
accuracy in production and reproducibility o f samples. It would also mirror what
is more likely to be used in an industrial setting.
229

• Work including Finite Element Analysis in order to quantify the effect the root
angle has on the fatigue life by determining the stress concentration as the angle
changes. This would enable further development o f the model between the two
factors to take place.
• Carry out a feasib ility study to determine the practicality o f controlling the weld
geometry to ensure suitable fatigue properties are achieved.
• Carry out a cost analysis o f both CMT and LHW for an industrial application to
assess i f there are economical benefits o f using one process over the other.
230

8 References
[1] Richards, K.G. W eldability o f Steel. The W elding Institute. Fourth Reprint, 1980.
[2] Schubert, E. et al. L ight-weight structures produced by laser beam join ing for future
applications in automobile and aerospace industry. Journal o f Materials Processing
Technology, 115, pp 2-8, 2001.
[3] Gourd, L.M. Principles o f W elding Technology. Third Edition, 1995, ISBN 0 340
61399 8.
[4] Mazumder, J. Laser-Beam W elding, ASM Handbook 1, pages 262-269.
[5] Davies, A .C . The science and practice o f welding volume: The practice o f welding.
Tenth Edition, 1993. ISBN 0 521 43566 8
[6] Larsson, J.K. Laser welding a mature process technology with various application
fields. Svetsaren, Volum e 54, N o 1-2, pp 43-50, 1999.
[7 ] Moore, P.L. Wallach, E.R & H owse, D .S. Development o f Laser and Laser/Arc
Hybrid W elding for Land Pipeline Applications. W eld ing and Cutting, N o3, pp 186-191.
2004.
[8 ] Yang, Y .S, Lee, S.H. A study on the join ing strength o f laser spot w elding for
automotive applications. Journal o f Materials Processing Technology, 94 pages 151-156,
1999.
[9 ] Lozach, G. The Future o f Galvanised Steel Sheets as a Material for the Autom otive
Body-In-W hite. Galvanised Steel Sheet Forum - Automotive, IOM3, 15-16 M ay 2000.
[10] Holliday, D .B . Gas-Metal Arc W elding. A SM Handbook 1, pages 180-185.
[11] Cary,H.B. Helzer, S.C. M odem W elding Technology. Sixth Edition 2005. ISBN 0
13 113029 3.
231

[12] A m e r ic a n W e ld in g S oc ie ty . W e ld in g H an d b o o k - W eld in g P ro cesses. V o lu m e 2,
C h ap te r 4 , p ag es 1 1 0 -1 5 5 .E ig h th E d itio n .1 9 9 1 IS B N 0 87171 354 3.
[13] h ttp ://w w w .b e lasn e t.b e /n l/N ieu w s /H y las .ip g
[14] E b o o , M ., S teen , W .M .& C la rk e , J. M ay 1978, A rc A u g m en ted L ase r W e ld in g ,
p a p e r 17, A d v an ces in W e ld in g P ro cesses 4 th In te rn atio n a l C o n fe ren ce , H a rro g a te , U K .
[15] A lex an d e r, J. & S teen , W .M . A p ril 1981, A rc A ug m en ted L ase r W e ld in g - P rocess
V ariab les , S tru c tu re and P ro p e rties, T he Jo in in g o f M eta ls : P rac tice an d P erfo rm an c e ,
C o v en try , U K .
[1 6 ] W a ld u ck , R .P . B if f in , J. P lasm a A rc A u g m en ted L ase r W e ld in g , W e ld in g an d
M e ta l F ab r ica tio n , V o lu m e 62, N o 4, A p ril 1994.
[1 7 ] B ag g er, C . F lem m in g , O . R ev iew o f L ase r H y b rid W eld in g , Jo u rn a l o f L a se r
A p p lic a tio n s , V o l 17, N o 1, F eb ru ary 2005 .
[18] C am p an a , G e t al. T h e in f lu en ce o f arc tra n s fer m o d e in h y b r id lase r-m ig w e ld in g ,
Jo u rn a l o f M a te r ia ls P ro cess in g T ec h n o lo g y , V o l 191, pp 111-113 , 2007 .
[19 ] T an i, G et al. T he in f lu en ce o f S h ie ld in g G as in H y b r id L ase r-M ig W e ld in g .
[20 ] V itek , J.M . et al. W e ld P oo l S hape P red ic t io n in P lasm a A u g m en ted L a se r W e ld ed
S tee l. S c ien ce and T e c h n o lo g y o f W e ld in g an d Jo in ing , V o lu m e 6, N o 5, p p 305 - 314 ,
2 0 0 1 .
[ 2 1 ] W o u te rs, M . H y b rid L aser-M IG w e ld in g - A n in v e stiga tio n o f g eo m e tr ic a l
co n s id e ra tio n s. L icen tia te T h esis, L u lea U n iv e rs ity o f T ech n o lo g y , 2005 .
[22] G ra f, T. S tau fe r, H . L aser H y b rid p ro cess a t Vo lk sw ag en , w w w .fro n iu s .co m , 2 0 0 5 .
232

[ 23 ] S tau fe r, H et al. L a se r H y b r id W e ld in g an d L a ser B raz in g : S ta te o f the A rt in
T ec h n o lo g y an d P rac tice b y the E x am p les o f A u d i A 8 an d V W P h ae to n ,
w w w .fron ius.com, 2005 .
[24] T h e W e ld in g In s titu te In fo rm atio n .
[25] w w w .tp s -f ro n iu s .co .u k
[ 2 6 ] G lo v e r, M . G rif f i th s , J. P ro b lem P artn ers , A u to m o tiv e E n g in ee r, pp 34 -3 5 ,
N o v em b er, 2005 .
[27] T h e n ew rev o lu t io n in d ig ita l G M A w e ld in g , F ron iu s In te rn a tio n a l G m b H , 2005 .
[26] H im m e lb au e r, K . T h e C M T P ro cess - A R e v o lu tio n in W e ld in g T ec h n o lo g y ,
F ro n iu s In te rn a tio n a l G m b H , 2005 .
[29] P in to , H . e t al. A co m p ara tiv e s tudy o f m ic ro stru c tu re an d re s id u a l s tresses o f C M T
- M I G and L a se r-H y b r id W elds. M ate r ia ls S c ien ce F o rum , V o lu m e 5 3 4 -5 2 5 , p p 627-
6 3 2 ,2 0 0 6 .
[30] S o c ie ty o f M an u fac tu r in g E n g in ee rs N ew s A rch ive Jan u a ry 2006
w w w .sm e .o rg /c g i-b in /g e t-p re ss .p l? & & 2 0 0 6 1021 & & 'A 100 0 t& S M E & .
[31] K u ll, JE . W e ld in g o f g a lv an ize d ca rb o n s tee l to H y T en s w ith the n ew M IG /M A G
C M T te ch n iq u e . M a s te r o f S c ien ce T h es is , K T H In d u s tr ia l E n g in ee r in g an d
M an ag em en t, S to ck h o lm 2006 .
[32 ] L e ff le r , B . S ta in less - S ta in less s tee ls an d th e ir p ro p e rties , 2 n d re v ise d ed itio n ,
A v es ta S h e ff ie ld A B , 1998.
[33] L u la , R .A . S ta in less S tee l, A m eric an S o c ie ty fo r M eta ls , 3 rd P r in tin g , 1989.
[34] C astn e r, H .R . W h at y o u sh o u ld k n o w a b o u t au s ten it ic s ta in less s tee ls , 8 th .A n n u a l
N o rth A m eric an W e ld in g R esearch C o n fe ren c e , C o lu m b us, O h io , O c to b e r 1992.

[35] H on ey co m b e , R .W .K . B h ad esh ia , H .K .D .H , S tee ls - M ic ros tru c tu re an d P ro p erties,
M e ta llu rg y an d M a te r ia ls S c ien ce , 2 n d E d itio n , B u tte rw o rth -H e in em an n . 2000 .
[36] W estin , E .M . e t al. L ase r W e ld in g o f a L ean D up lex S ta in less S tee l. P a p e r 609.
A v es ta R esea rc h C en tre , O u to k u m p u , 2007 .
[37] M a te r ia l D a ta S h ee t fo r D o g a l 2 6 0 R P -X fro m w ww .ssab d ire c t.co m
[38] w w w .a z te c g a lv a n iz in g .c o m /P ro c e ss .h tm .
[39] B S E N 1 0 1 42 :2000 - C o n tin u o u s ly h o t-d ip z in c co a ted lo w c a rb o n stee ls s tr ip and
sh ee t fo r co ld fo rm in g . T ec h n ica l d e liv e ry co n d ition s.
[40] H S E . Z in c E m b ritt lem e n t o f au s ten itic s ta in less steel. G u id an ce n o tes P M 13 fro m
th e H ea lth an d S a fe ty E x ecu tiv e , D ecem b er 1997.
[41] N ak a ta , K et al. H yb rid L ase r-M A G W e ld in g o f Ga lv an ized S tee l S h eets. I IW D oc.
X I I - 1820-04.
[4 2 ] M o riak i, O e t al. D e v e lo p m en t o f L ase r-a rc H y br id W e ld in g , N K K te ch n ica l
R ev iew , N o 8, 2002 .
[43] P an , Y . R ich a rd so n , I.M . S tu d y o f L a se r W e ld ing o f Z in c C o a ted S tee l S h ee ts in
O v erlap C o n f ig u ra tio n . N e th e r lan d s In s titu te fo r M eta l R esearch , D e lf t, N e th e r lan d s .
[4 4 ] W ik lu n d , G . N ilsso n ,T . K ap lan , A .F .H . L a se r H yb r id W e ld in g o f Z in c C o a te d
U ltra H ig h S tren g th S tee l. L u lea U n iv e rs ity o f T e c hn o lo g y an d S S A T u n n p la t, B o lan g e ,
S w eden . 2007 .
[45] B am h o u se , E .J. L ippo ld , J.C . M ic ro s tru c tu re /P ro p e rty R e la tio n sh ip s in D iss im ila r
W e ld s b e tw een D u p lex S ta in less S tee ls an d C a rb o n S tee ls. W e ld in g Jo u rn a l, V o lu m e 77,
Issu e 12, pp 4 7 7 -4 8 7 , D ecem b er 1998.
234

[46] Matsunawa, A . El-Batahgy, A-M . Zaghloul. Laser Beam W elding o f Lap Joints o f
Dissim ilar Materials. Joining and W elding Research Institute. Osaka University,
Volum e 27, Issue 2, 1998.
[47] Andersson, J. NdrYAG Laser- M IG/M AG hybrid wel ding. A process optimisation
for coated C-Mn high strength steel, and a parameter investigation o f C-M n high
strength steel, stainless steel and aluminum alloys. K iM AB. April 2005.
[48] Mann, J.Y. Fatigue o f Materials - An introductory text. Melbourne University
Press, 1967.
[4 9 ] International Organization for Standardization , General Principles for Fatigue
Testing o f Metals, I.S.O, R373 (Geneva 1964).
[50] Clifton, A.J. A Statistical Analysis o f the Fatigue Behaviour o f Single and Multi-
Spot W elded Joints. PhD Thesis, Sheffield Hallam University, 2007.
[51 ] Suresh, S. Fatigue o f Materials. Cambridge University Press, 2nd Edition. 2004.
[52] Committee E-9 on Fatigue. A guide for fatigue testing and the statistical analysis o f
fatigue data. American Society for Testing and Materials Special Publication N o 91-A.
2nd Edition, 1963.
[53] Maddox, S.J. Fatigue Strength o f W elded Structures. Abington Publishing. 2nd
Edition. 1991.
[54] D ixon, W.J. M ood, A.M . A Method for Obtaining and Analyzing Sensitivity Data.
American Statistical Association.
[55 ] Song, J., Mourelatos, Z.P., Gu, R.J., 2005. Sensitivity Study o f Staircase Fatigue
Tests
Using Monte Carlo Simulation. SAE 2005-01-0803.
235

[56] W eibull. W. Fatigue testing and the Analysis of Results. Pergamon Press, Oxford.
1961
[ 57 ]Hans Nordeberg. Om Utvarderingsmetoder V id Utmattning. (On Evaluation
M ethods for Fatigue). Institute o f metals Research. Stockholm. 1973.
[58] N D T Resource Centre. Available from:
w w w .nd ted .org /E ducationR esources/C om m un ityC ollege/Mater ia ls/S tructu re/fa tigue.h tm
(A ccessed March 2008)
[59] Smith, W.F. Principles o f Materials Science and Engineering. M cGraw-Hill, Inc.
3rd Edition. 1996. Page 311-315.
[60 ] Smallman, R.E. M odem Physical Mettalurg. Butterworths. 4th Edition. 1985.
Pages 470-473.
[61] H iggins, R.A. Properties o f Engineering Materials. Hodder and Stoughton. 1985.
Pages 348-349.
[62] Gough, H.J. Sopwith, D.G. Atmospheric action as a factor in fatigue o f metals.
Journal o f the Institute o f Metals, 49 pg 92-122. 1932
[63] Steen, B: Eboo, M. Arc augmented laser welding - A low power arc and a laser in
synergy offer high quality welds at high speed with reduced undercut, Metal
Construction, V I 1 N o7 July 1979.
[60] Ono,M et al. W elding Properties o f Thin Steel Sheets by Laser-Arc Hybrid
W elding - Laser focused arc welding, 1st International Symposium on H igh Power
Laser Macro processing V4831 M ay 2002.
[65] Nordberg, H. McCann, S. Rotation o f Overlap Joints Under Load, AvestaPolarit
Research Foundation, 2004.
[66] D insley, C. Fatigue Properties o f Dissim ilar Metal Laser W elded Lap Joints, Ph.D
Thesis, Sheffield Hallam University, 2004.
236

[67] Marples, M. Incomplete Ph.D work at Sheffield Hallam University.
[6 8 ] Wray, T. Resistance Spot W elding o f Duplex Stainless Steel, Ph.D Thesis,
Sheffield Hallam University, 2004.
[ 6 9 ] Nordberg, H. Fatigue Properties o f Stainless Steel Lap Joints. Outokumpu
Research Foundation and Sheffield Hallam University, 2005.
[70 ] Taylor, D. Barret, N . Lucano,G. Some new methods for predicting fatigue in
w elded joint. International Journal o f Fatigue, Volum e 24, pp509-518, 2002.
[71] Li, X .Y . et al. Finite element analysis o f the effect o f weld geometry and load
condition on fatigue strength o f lap joint. International Journal o f Pressure V essels and
Piping, Volum e 78, pp 591-597, 2001.
[72 ] Teng,T-L. Fung, C-P. Chang, P-H. Effect o f w eld geometry and residual stresses
on fatigue in butt-welded joints. International Journal o f Pressure V essels and Piping,
Volum e 79, pp 467-482 ,2002 .
[73] Nguyen, T.N. Wahab, M .A. Theoretical study o f the effect o f w eld geometry
parameters on fatigue crack propagation life. Engineering Fracture M echanics, Volum e
5. N o l . pp 1-18, 1995.
[74] CASPER FINAL YEAR PROJECT, Sheffield Hallam University, 2007-2008
[75] BS EN 10002-1:2001 - M etallic Material - Tensile Testing - Part 1: M ethod o f test
at ambient temperature.
[76] BS EN 895:1995 -Destructive tests on welds in metallic materials - Transverse
tensile test.
237

[77] A G u id e fo r F a tig u e T es tin g an d the S ta tis tica l A n aly s is o f F a tig u e D ata . A S T M
S T P 9 1 -A , 1963
[78] A lic o n a In f in ite F o cu s® .O p e ra tin g m a n u a l an d web s ite ,
w w w .in f in ite fo c u s .in fo /te c h n iq u e .
[7 9 ] O u to k u m p u S ta in less. S te e l G rades, P ro p e r t ie s a n d G lo b a l S ta n d a rd s . A v es ta
R esearch C en tre , O u to k u m p u w eb s ite 2007 .
[80] A rc in i, H . In v e s tig a tio n o f a L a s e r H y b r id D iss im i la r B a se M e ta ls J o in t - M i ld
S te e l /L D X 2 1 0 ,E S A B A B M e ta l lo g rap h ic L ab o ra to ry , R ep o rt N o - T E C M -0 6 0 2 1,
F eb ru a ry 2006 .
[8 1 ] P r iv a te co m m u n ica tio n b e tw e e n E m m a A sh c ro ft and R esea rc h s ta f f a t A v es ta
R esea rc h C en tre
[8 2 ] B u rg in , F. L iq u id M e ta l E m b r it t le m e n t In T he A rc B ra z in g o f S ta in le ss S tee l.
O n g o in g P hD research a t S h e ff ie ld H a llam U n iv e rs ity, 2 002 o n w ard s
238

9 A ppen d ix A -
A dd ition a l M icrohardness M aps f o r L a ser
H yb r id W elded (LHW) Jo in ts a n d C o ld M eta l
Transfer (CM T) Jo in ts
239

Series 1
H a r d n e s s ( 0 . 5 H v )
■ 400-500
□ 300-400
□ 200-300
□ 1 0 0 -2 0 0
■ 0-100
0 .5 m m In c r e m e n ts
F igure 1. Series 1 m icrohardness m ap o f fa tigue sample 1.5.3, the sam ple fa i le d the
fa tigue test at 10.5kN a fter 1330564 cycles.
A dd it io n a l M ic roh a rdness M a p s f o r L H W B u tt J o in ts w ith L D X
2101
H a r d n e s s ( 0 . 5 H v )
□ 300.0-400.0
□ 200.0-300.0
1 0 0. 0 - 2 0 0 .0
1 0 . 0 - 1 0 0 . 0
0 .5 m m
I n c r e m e n ts
355.7
0 .5 m m In c r e m e n ts
F igure 2. Series 1 m icrohardness m ap o f fa tigue sample 1.8.5, the sam ple su rv ived the
fa tig u e test a t lO.OkN com pleting 2 m illion cycles.
240

Series 2
H a r d n e s s
( 0 . 5 H v )
1400-500
□ 300-400
□ 200-300
100-200
1 0 -1 0 0
F igure 3.
0 .5 m m
In c re m e n ts
Series 2 m icrohardness m ap o f fa tigue sam ple 2 .4 .6 the sam ple su rv ived the
fa t ig u e test at 15.8kN com pleting 2 m illion cycles.
H a r d n e s s
( 0 . 5 H v )
□ 300-400
□ 200-300
100-200
1 0 - 1 0 0
F igure 4.
0 .5 m m
In c re m e n ts
Series 2 m icrohardness map o ffa tig u e sam ple 2.5.2, the sam ple fa i le d the
fa t ig u e test at 15.8kN after 503410 cycles.
241

Series 5
H a r d n e s s
( 0 . 5 H v )
■ 400-500
□ 300-400
□ 200-300
100-200
1 0 -1 0 0
0 .5 m m
In c re m e n ts
F igure 5. Series 5 m icrohardness m ap o f fa tigue sample 5.2.1 the sam ple su rv ived the
fa t ig u e test a t 8.0/cN com pleting 2 m illion cycles.
H a r d n e s s
( 0 . 5 H v )
□ 200-300
100-200
1 0 - 1 0 0
F igure 6.
0 .5 m m
In c re m e n ts
Series 5 m icrohardness map o f fa tigue sam ple 5.3.5, the sam ple fa i le d the
fa t ig u e test a t 8 .0 kN a fte r 645880 cycles.
242

Series 6
H a r d n e s s
( 0 . 5 H v )
□ 200-300
100-200
1 0 - 1 0 0
F igure 7.
0 .5 m m
In c re m e n ts
Series 6 m icrohardness m ap o f fa tigue sam ple 6.0.2, the sam ple fa i le d the
fa tig u e test a t 15.0kN after232584 cycles.
H a r d n e s s ( 0 . 5 H v |
□ 300-400
□ 200-300
100-200
1 0 -1 0 0
F igure 8.
0 .5 m m
In c re m e n ts
Series 6 m icrohardness m ap o f fa tig u e sam ple 6.4.3 the sam ple su rv ived the
fa tig u e test a t 15.0kN com pleting 2 m illion cycles
243

A dd it io n a l M ic roh a rdne ss M a p s f o r L H W B u tt J o in ts w ith
H y T en s 1000
Series 3
H a r d n e s s
0 .5 m m In c re m e n ts
F igure 9. Series 3 m icrohardness m ap o ffa tig u e sample3.1.4, the sam ple fa i le d the
fa t ig u e test at 9 .5kN after567546 cycles.
H a r d n e s s
■ 0-100 2 3 4 5 6 7
0 .5 m m In c re m e n ts
F igure 10. Series 3 m icrohardness m ap o f fa tigue sam ple 3 .2 .6 the sam ple su rv ived the
fa t ig u e test a t 15. OkN com pleting 2 m illion cycles.
244

Series 4
O ^ m m In c r e m ^ i ts
F igure 11. Series 4 m icrohardness m ap o f fa t ig u e sam ple 4.7.6, the sam ple fa i le d the
fa tig u e test a t 13.0kN after 683158 cycles.
Hardness(0.5Hv)
1400-500
□ 300-400
□ 200-300
1 0 0 -200 f
1 0 -1 0 0
0 .5 m m In c re m e n ts
0 .5 m m
In c re m e n ts
F igure 12. Series 4 m icrohardness m ap o f fa tigue sam ple 4.8.1 the sam ple su rv ived the
fa tig u e test a t 12.5kN com pleting 2 m illion cycles.
245

Series 7
H a r d n e s s
0 .5 m m In c re m e n ts
F igure 13. Series 7 m icrohardness m ap o f fa tigue sam ple 7.4.1, the sam ple fa i le d the
fa tig u e test a t 7.5kN a fter 675616 cycles.
H a r d n e s s
( 0 . 5 H v )
■ 0-1002 3 4 5 6 7 8
0 .5 m m In c re m e n ts
0 .5 m m
In c re m e n ts
F igure 14. Series 7 m icrohardness m ap o f fa tigue sam ple 7.7.4 the sam ple su rv ived the
fa tigue test a t 7.5kN com pleting 2 m illion cycles.
246

Series 8
H a r d n e s s
(0 .5 H v )
■ 0-100 2 3 4 5 6 7
0 .5 m m In c re m e n ts
F igure 15. Series 8 m icrohardness m ap o f fa t ig u e sam ple 8.7.4, the sam ple su rv ived the
fa t ig u e test a t 15.2kN com pleting 2 m illion cycles.
H a r d n e s s
( 0 . 5 H v )
1400-500
□ 300-400
□ 200-300
□ 100-200
10-100
0 .5 m m
0 .5 m m In c re m e n ts
F igure 16. Series 8 m icrohardness m ap o ffa tig u e sample 8.7.5 the sam ple fa i le d the
fa t ig u e test a t 15.6kN after 714085cycles.
247

LDX 2101
Series C l
A dditional M icrohardness M aps for CM T Butt Joints w ith
Hardness (0.5Hv)
□ 200-300
□ 100-200
■ 0 -1 0 0
T—- ~——V 7V \
____ V /1
- /
/
0.5mm
Increments
2 3 4 5 6 7 8 9 10 11 12 13 14 15 16
0.5mm Increments
F igure 17. Series C 1 m icrohardness m ap o ffa tig u e sam ple 1.9.3, the sam ple fa i le d the
fa tig u e test at 8 .6kN after 959104 cycles.
H a r d n e s s ( 0 . 5 H v )
□ 200-300
100-200
1 0 - 1 0 0
0 .5 m m
In c re m e n ts
9 10 11 12 13 14 15 16
0 .5 m m In c re m e n ts
F igure 18. Series C l m icrohardness m ap o f fa tigue sam ple 1 .7 .1, the sam ple su rv ived the
fa tig u e test a t 9 .0kN com pleting 2 m illion cycles.
248

10 A ppen d ix B -
A dd ition a l IF M 3D Im ages a n d Surface
P ro files f o r L a ser H yb r id W elded (LHW ) Jo in ts
a n d C o ld M eta l T ransfer (CM T) Jo in ts
249

A dd it io n a l I F M 3D Im a g es a n d S u r fa ce P ro f i les f o r L H W B u tt
J o in ts w ith L D X 2101
Series 2
P os i t io n 1
S ta in less S tee lM ild S tcc1 [ j T ]
&<*** /
P o s i t io n 2
M ild S tee l — S ta in less S tee l
I
P o s it io n 3
M ild S tee l S ta in less S tee l
F ig u r e 1. IF M 3D surface im age a n d surface p ro files fo r the fr o n t o f the w eld bead o f
sam ple F2.5.1
S ta in less S tee l
250
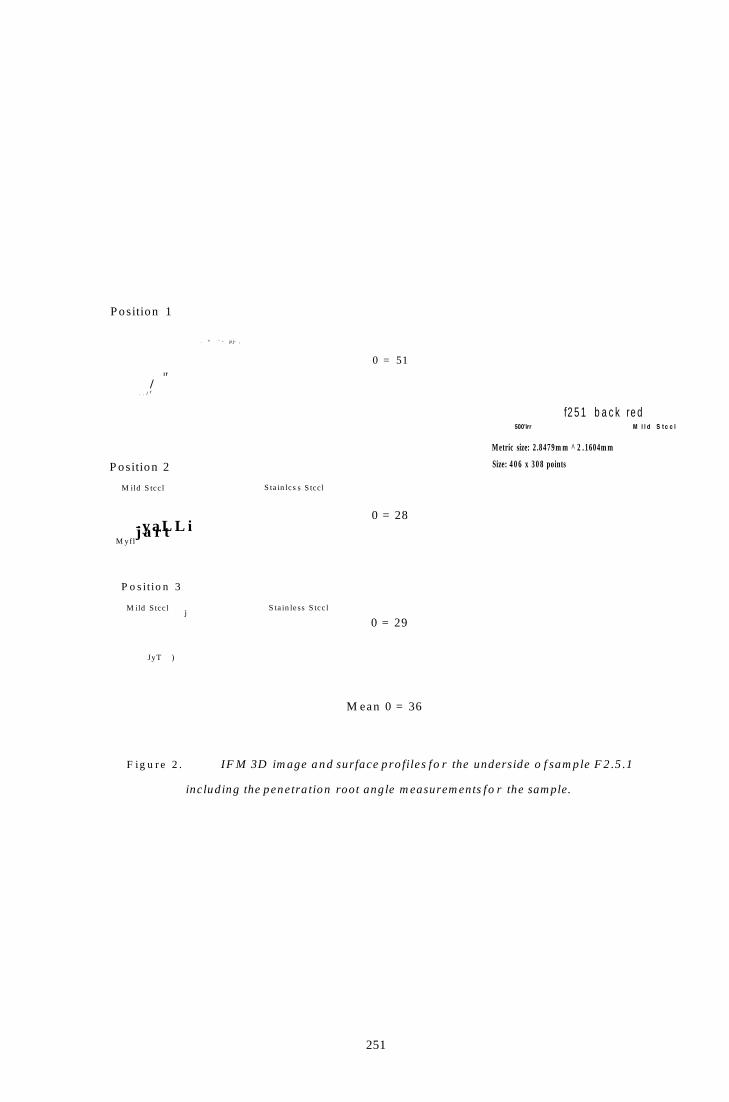
P osition 1
f2 5 1 b a c k re d500'irr M l l d S t c c l
Metric size: 2 .8479m m ^ 2 . 1604m m
Size: 4 0 6 x 3 0 8 points
. ^ ' - p j - ,
. . /
/r
I f
0 = 51
P osition 2
M ild S tcc l S ta in lcss S tccl
-yaL L iM yfl
j a r t0 = 28
P o s it io n 3
M ild Stcclj
S ta in less S tcc l
JyT )
0 = 29
M ean 0 = 36
F ig u r e 2 . IF M 3D im age and surface p ro files fo r the underside o f sam ple F 2 .5 .1
including the penetra tion root angle m easurem ents fo r the sam ple.
251

F ig u r e 3 . IF M 3D surface im age a n d surface p ro files fo r the fr o n t o f the w eld bead o f
sam ple F2.8.1
252

0 = 81
P osition 1
lild S teel S ta in less S teel
P osition 2
M ild S teel S ta in less Steel
----------. — B
Position 3
M ild S tee l S ta in less S teel
Off"*-__ j __
0 = 38
0 = 25
M ean 0 = 48
F ig u r e 4 . IF M 3D im age and surface p ro files fo r the underside o f sam ple F 2 .8.1
including the penetra tion root angle m easurem ents fo r the sam ple.
253

Series 6
Sta in less S tee l
F ig u r e 5. IF M 3D surface im age and surface p ro files fo r the fr o n t o f the w e ld bead o f
sam ple F 6 .0.3
254

P os i t io n 1
0 = 37
P o s i t io n 2
S ta in less S teel
0 = 30
P o s it io n 3
M ild S teel S ta in less S teel
_ •' V . m
0 = 4 9
M e a n 0 = 3 9
F ig u r e 6 . IF M 3D im age and surface p ro files fo r the underside o f sam ple F6.0.3
including the penetra tion root angle m easurem ents fo r the sam ple.
255

9*7
Position 2M ild S tce S ta in less S teel
J r 1 * I/
f
P o s i t io n 3
M ild S teel £.1'— S ta in less S teel
... is.. J_1 > J
jT
■ 4 ^ 7 . r11,11,1" #...■ >f ■ X'H-ijpn ■ HUM.
F ig u r e 7 . IF M 3D surface im age a n d surface p ro fd es fo r the f ro n t o f the w eld bead o f
sam ple F 6 .4.6
P o s i t io n 1
S ta in less S teel
M i ld Steel
St'
S ta in less S tee l
256
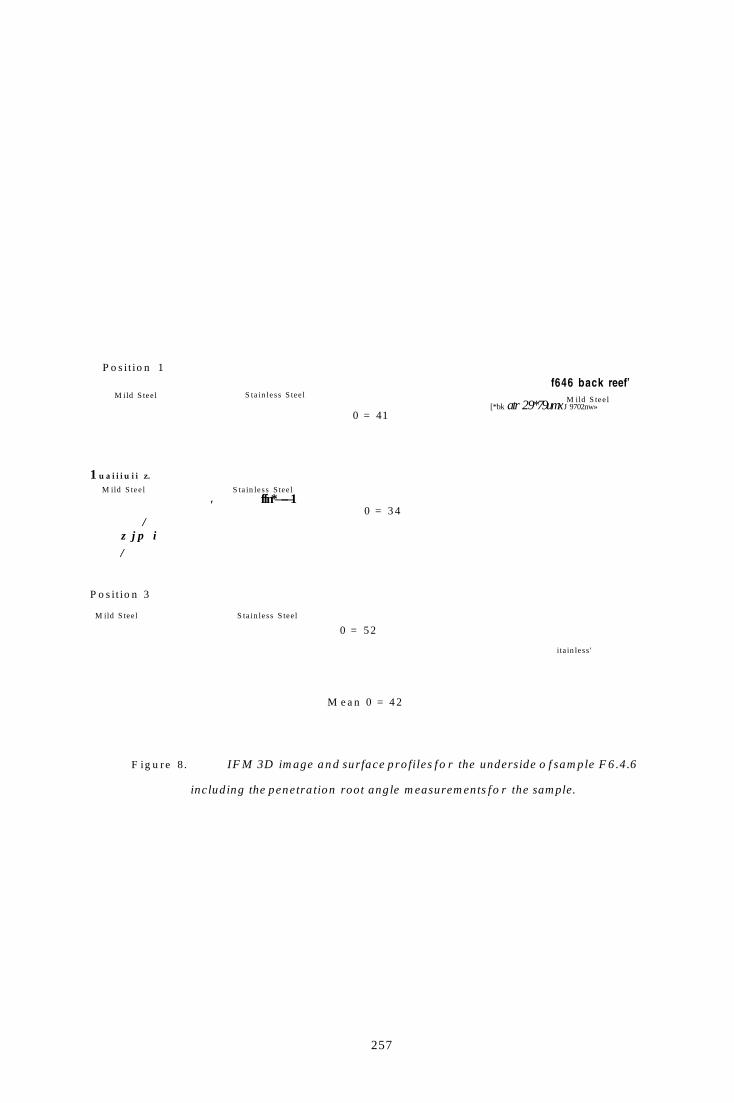
P os i t io n 1
M ild S teel S ta in less S teel
1 u a i i i u i i z.
M ild S tee l S ta in less S teel
' ffn*——1
/z j p i
/
P o s i t io n 3
M ild S tee l S ta in less S tee l
0 = 52
0 = 41
0 = 3 4
f646 back reef’
M ild S tee l [*bk atr 29*79umx J 9702nw»
ita in less '
M e a n 0 = 4 2
F ig u re 8. IF M 3D im age and surface p ro files fo r the underside o f sam ple F 6 .4.6
including the penetra tion root angle m easurem ents fo r the sam ple.
257

Series 4
A dd it io n a l 3D Im a g es a n d S u r fa ce P ro f i les f o r L H W B u tt
J o in ts w ith H yT en s 1000
P os it io n 1
P o s i t io n 2
M ild S tccl
P o s i t io n 3
M ild S tccl
y f
S ta in less S tccl
S ta in less S tccl
F ig u r e 9 . IF M 3D surface image a n d surface p ro files fo r the fr o n t o f the w e ld bead o f
sam ple F4.4.3
258

M ean 0 = 40
0 = 42
0 = 42
0 = 36
Position 2
M ild S tcc l . S ta in less S tcc l
Position 3
S ta in less S tccl
S ta in less S tccl
-9 623 9.6J
6.635
P osition 1
F ig u r e 10. IF M 3D im age and surface p ro files fo r the underside o f sam ple F4.4.3
including the penetra tion root angle m easurem ents fo r the sample.
259

P os i t i o n 1
Position 3
M ild Stcc■1 S ta in less S tcc l
___I ■ J k - i -U - 4 — F 7 1 “1 f \ [ \ S 4
F ig u r e 11. IF M 3D surface im age a n d surface p ro fd es fo r the f ro n t o f the w eld bead o f
sam ple F4.8.3

9.63
-9:4?
•9W.?IA
9.46
9.63-
-949
"I-9 71 j
a?;
P o s i t io n 1
M ild Jsteel S ta in less S tee l
/
/jf
P o s i t io n 2
M ild S teel S ta in less S teel
y
Position 3
M ilH Sltor*! ^stpr*!
/
AS
2 S ta in less S tee l ^
0 = 38
M e a n 0 = 50
F ig u r e 12 . IF M 3D image and surface p ro files fo r the underside o f sam ple F4.8 .3
including the penetra tion root ang le m easurem ents fo r the sample.
261

Series 8
Sta in less S tee l
F ig u r e 13. IF M 3D surface im age a n d surface p ro files fo r the fr o n t o f the w eld bead o f
sam ple F 8 .7.6
262

M e a n 0 = 4 9
0 = 6 4
0 = 39
0 = 4 4
P o s i t io n 2M ild S tee l S ta in less S teel
P o s it io n 3
M ild S tee l S ta in less S tee l
S ta in less S teel
P o s i t io n 1
S ta in less S tee l
F ig u r e 14 . IF M 3D im age and surface p ro fd es fo r the underside o f sam ple F 8 .7.6
including the penetra tion root angle m easurem ents fo r the sam ple.
263

Series C l
Additional IFM 3D Images and Surface Profiles for CMT
Butt Joints with LDX 2101
Position 1
S ta in less S teelM ild S tcc l f
P osition 2j c . .
S tee lM l IQ SlCCl
Y \
Position 3
M ild S teel . . . . . . . S ta in less S tee l
|T \J
r / A
F ig u r e 15. IF M 3D surface im age a n d surface p ro files fo r the fr o n t o f the w eld bead o f
sam ple C l .2.4
S ta in less S tee l
264

P os i t io n 1
M ild S tee l S ta in less S teel
0 = 1 1
P o s it io n 2
0 = 12
Position 3
S ta in less S teelM ild S teel1
D U
0 = 17
M e a n 0 = 1 3
F ig u r e 16. IF M 3D im age a n d surface p ro fdes fo r the underside o f sam ple C l. 2.4
including the penetra tion root angle m easurem ents fo r the sam ple.
S ta in less
265

-*44
F ig u r e 17. IF M 3D surface im age and surface p ro files fo r the fr o n t o f the w eld bead o f
sam ple C l .6.1
P o s i t io n 1
S ta in less S tee l
P o s it io n 3
P o s i t io n 2
266

= 30
P o s i t io n 2
M ild S tee l S ta in less Stc;cl
P o s it io n 3
M ild S tee l S ta in less S teel
0 = 23
0 = 30
M e a n 0 = 28
F ig u r e 18. IF M 3D image a n d surface p ro files fo r the underside o f sam ple C l. 6.1
including the penetra tion root angle m easurem ents fo r the sample.
P o s i t io n 1
267

NZ
M i ld S teel
P osition 1
P o s i t io n 2
M ild S teel
v
P o s it io n 3
M ild S teel
S ta in less S tee l
S ta in less S tee l
\
S ta in less S teel
c -v * 1' 0
f1' **
t r m
W'
. • - - i*. Tl ■ ~
F ig u r e 19. IF M 3D surface im age a n d surface p ro files fo r the fr o n t o f the w eld bead o f
sam ple C l. 6.3
268

P os i t io n 1
M ild Stccl Stainless Stccl
hr 0 = 20
P o s i t io n 2
M ild S tccl S ta in less S tcc lj T
4
P o s i t io n 3
M ild S tcc Stainless Steel
□r
--- - €
0 = 2 9
0 = 25
M e a n 0 = 25
F ig u r e 2 0 . IF M 3D im age a n d surface p ro files fo r the underside o f sam ple C l. 6.1
including the penetra tion root ang le m easurem ents fo r the sample.
S ta in less S tcc l
269

P os i t io n 3
M ild S teel r ^ sS ta in less S teel
A:
•i -- /P--- 1——JT—^
P o s i t io n 1
S ta in less S tee l
P o s i t io n 2
S ta in less S teel
F ig u r e 2 1 . IF M 3D surface im age a n d surface p ro files fo r the fr o n t o f the w e ld bead o f
sam ple C l. 7.2
270

P os i t io n 1
N/lild S teel S ta in less St<:c l
S ta in less S teel
Position 3
M ild Slecl Stainless Steel
r z ns?
ir [NL I
\
l —g i
P o s i t io n 2
M ild S teel
0 = 27
0 = 21
0 = 25
M e a n 0 = 2 4
F ig u r e 2 2 . IF M 3D im age a n d surface p ro files fo r the underside o f sam ple C l. 7.2
including the penetra tion root angle m easurem ents fo r the sample.
271

Position 1
S ta in less S tee l
0 = 37
P osition 2
M ild S teel
t 7
S ta in less S teel
j j§L /
0 = 39
P osition 3
\ / f 11H Q tr » r» l Q t c n n 1 r » e c
M ean 0 = 38
0 = 37
F ig u r e 2 3 . IF M 3D image a n d surface p ro fd es fo r the underside o f sam ple C l. 5.3
including the penetra tion root angle m easurem ents fo r the sample.
272