Embed Size (px)
Citation preview

Measuring Wealth Effects Using U.S. State Data
Xia Zhou1 Christopher Carroll2
1Fannie Mae
2Johns Hopkins University
March 18, 2011
X.Zhou, C.Carroll (FNMA, JHU) Measuring wealth effects using regional data March 18, 2011 1 / 16
motivation
Motivation
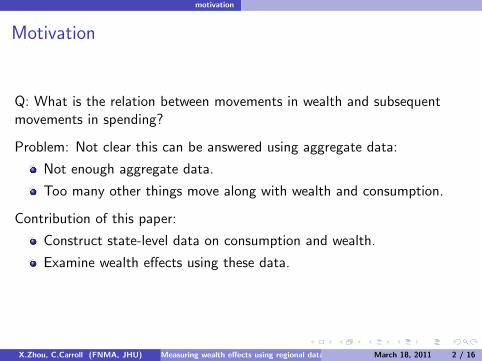
Q: What is the relation between movements in wealth and subsequentmovements in spending?
Problem: Not clear this can be answered using aggregate data:
Not enough aggregate data.
Too many other things move along with wealth and consumption.
Contribution of this paper:
Construct state-level data on consumption and wealth.
Examine wealth effects using these data.
X.Zhou, C.Carroll (FNMA, JHU) Measuring wealth effects using regional data March 18, 2011 2 / 16

motivation
Further motivation: Distinguish housing vs. financialwealth effects
Financial and housing wealth effects could be different:
Changes in one type of wealth might be viewed as more permanentthan the other.
Tax treatment of capital gains on the two types of wealth may bedifferent.
Stockholders might behave differently from homeowners.
Current literature finds mixed results, varying with data employed.
X.Zhou, C.Carroll (FNMA, JHU) Measuring wealth effects using regional data March 18, 2011 3 / 16

motivation
Data
Previous literature has used aggregate and household-level data
Aggregate data: aggregation problems, simultaneity problems.
household-level data: poor measurement of important variables.
Advantages of regional data
All states share the same monetary and federal system.
Because of heterogeneity across states, regional data should have lesssimultaneity problems than aggregate data.
Contribution: Construct the regional data needed to conduct the wealtheffect study.
X.Zhou, C.Carroll (FNMA, JHU) Measuring wealth effects using regional data March 18, 2011 4 / 16

motivation
Some regional data exists, but has issues
The state-level financial wealth data used in Case, Quigley and Shiller(2002): 1982:1-1999:4
There is no state-level financialassets data ⇒ use mutualfunds data; assume constantproportion of mutual funds outof financial assets.
Mutual funds data is onlyavailable for 5 nonconsecutiveyears ⇒ assume constant assetdistribution across states foryears without real data; loseregional variations.
Proportion of mutual funds oftotal stock market wealth
0.0
0.1
0.2
0.3
Sh
are
of
mu
tua
l fu
nd
s o
ut
of
tota
l sto
ck w
ea
lth
1975q1 1983q1 1991q1 1999q1 2006q1
Date
Source: FFA
X.Zhou, C.Carroll (FNMA, JHU) Measuring wealth effects using regional data March 18, 2011 5 / 16

motivation
Limitations with currently available state-levelconsumption data
No state-level consumption data exists.
I Solution: use state-level retail sales data.
Several sets of retail sales measures are available for U.S. states.I No systematic research comparing their quality.
Description of existing state-level consumption dataData sources Works using data Time range States
CHS Monthly Retail Trade - Hess and Shin (1998) 1978M1-1996M12 19Survey Del Negro (1998)
CSMM Sales & Marketing - Asdrubali, Sorensen, and Yosha (1996) 1963-1998 51Management Del Negro (1998) & 2000-present
Luengo-Prado and Sorensen (2006)
CCQS Regional Financial Associates Case, Quigley and Shiller (2002) 1977Q3-2006Q4 51
CGHO State Government - Garrett, Hernandez-Murillo,Sales Tax Collections and Owyang (2004) 1970Q1-present 45
CZHOU CGHO + taxable retail sales Ravina (2005)gross retail sales Zhou (2010) 1970Q1-present 45
X.Zhou, C.Carroll (FNMA, JHU) Measuring wealth effects using regional data March 18, 2011 6 / 16

motivation
Limitations with currently available state-levelconsumption data
No state-level consumption data exists.I Solution: use state-level retail sales data.
Several sets of retail sales measures are available for U.S. states.
I No systematic research comparing their quality.
Description of existing state-level consumption dataData sources Works using data Time range States
CHS Monthly Retail Trade - Hess and Shin (1998) 1978M1-1996M12 19Survey Del Negro (1998)
CSMM Sales & Marketing - Asdrubali, Sorensen, and Yosha (1996) 1963-1998 51Management Del Negro (1998) & 2000-present
Luengo-Prado and Sorensen (2006)
CCQS Regional Financial Associates Case, Quigley and Shiller (2002) 1977Q3-2006Q4 51
CGHO State Government - Garrett, Hernandez-Murillo,Sales Tax Collections and Owyang (2004) 1970Q1-present 45
CZHOU CGHO + taxable retail sales Ravina (2005)gross retail sales Zhou (2010) 1970Q1-present 45
X.Zhou, C.Carroll (FNMA, JHU) Measuring wealth effects using regional data March 18, 2011 6 / 16

motivation
Limitations with currently available state-levelconsumption data
No state-level consumption data exists.I Solution: use state-level retail sales data.
Several sets of retail sales measures are available for U.S. states.I No systematic research comparing their quality.
Description of existing state-level consumption dataData sources Works using data Time range States
CHS Monthly Retail Trade - Hess and Shin (1998) 1978M1-1996M12 19Survey Del Negro (1998)
CSMM Sales & Marketing - Asdrubali, Sorensen, and Yosha (1996) 1963-1998 51Management Del Negro (1998) & 2000-present
Luengo-Prado and Sorensen (2006)
CCQS Regional Financial Associates Case, Quigley and Shiller (2002) 1977Q3-2006Q4 51
CGHO State Government - Garrett, Hernandez-Murillo,Sales Tax Collections and Owyang (2004) 1970Q1-present 45
CZHOU CGHO + taxable retail sales Ravina (2005)gross retail sales Zhou (2010) 1970Q1-present 45
X.Zhou, C.Carroll (FNMA, JHU) Measuring wealth effects using regional data March 18, 2011 6 / 16

Contributions of this study
Contributions of this study
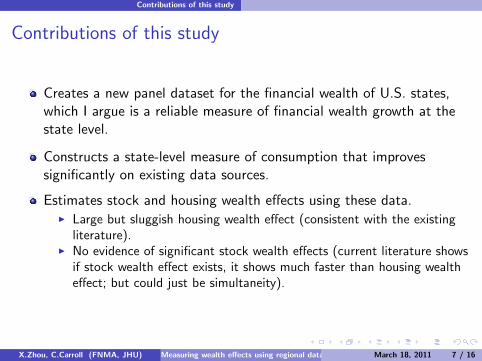
Creates a new panel dataset for the financial wealth of U.S. states,which I argue is a reliable measure of financial wealth growth at thestate level.
Constructs a state-level measure of consumption that improvessignificantly on existing data sources.
Estimates stock and housing wealth effects using these data.I Large but sluggish housing wealth effect (consistent with the existing
literature).I No evidence of significant stock wealth effects (current literature shows
if stock wealth effect exists, it shows much faster than housing wealtheffect; but could just be simultaneity).
X.Zhou, C.Carroll (FNMA, JHU) Measuring wealth effects using regional data March 18, 2011 7 / 16

Contributions of this study
Contributions of this study
Creates a new panel dataset for the financial wealth of U.S. states,which I argue is a reliable measure of financial wealth growth at thestate level.
Constructs a state-level measure of consumption that improvessignificantly on existing data sources.
Estimates stock and housing wealth effects using these data.I Large but sluggish housing wealth effect (consistent with the existing
literature).I No evidence of significant stock wealth effects (current literature shows
if stock wealth effect exists, it shows much faster than housing wealtheffect; but could just be simultaneity).
X.Zhou, C.Carroll (FNMA, JHU) Measuring wealth effects using regional data March 18, 2011 7 / 16
Contributions of this study
Contributions of this study
Creates a new panel dataset for the financial wealth of U.S. states,which I argue is a reliable measure of financial wealth growth at thestate level.
Constructs a state-level measure of consumption that improvessignificantly on existing data sources.
Estimates stock and housing wealth effects using these data.I Large but sluggish housing wealth effect (consistent with the existing
literature).I No evidence of significant stock wealth effects (current literature shows
if stock wealth effect exists, it shows much faster than housing wealtheffect; but could just be simultaneity).
X.Zhou, C.Carroll (FNMA, JHU) Measuring wealth effects using regional data March 18, 2011 7 / 16

Contributions of this study
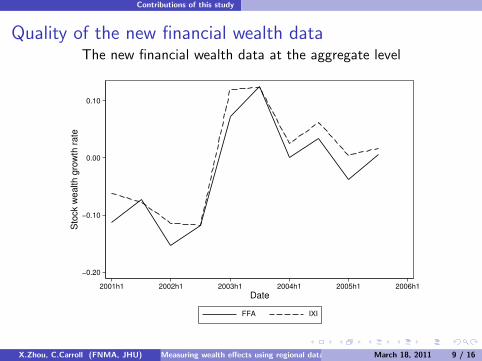
Quality of the new financial wealth data
Data source: a private company has all data for each and everyindividual account from more than 85 financial institutions.
I Among them, there are 15 of the top 20 banks, and all the top 15annuity issuers.
There are tens of millions of records for each time period.I Covers about 40% of total U.S. financial assets.
X.Zhou, C.Carroll (FNMA, JHU) Measuring wealth effects using regional data March 18, 2011 8 / 16
Contributions of this study
Quality of the new financial wealth dataThe new financial wealth data at the aggregate level
−0.20
−0.10
0.00
0.10
Sto
ck w
ea
lth
gro
wth
ra
te
2001h1 2002h1 2003h1 2004h1 2005h1 2006h1
Date
FFA IXI
X.Zhou, C.Carroll (FNMA, JHU) Measuring wealth effects using regional data March 18, 2011 9 / 16

Contributions of this study
Quality of the new financial wealth data
The new financial wealth data at the state level
−0.2
−0.1
0.0
0.1
0.2
Sto
ck w
ealth g
row
th r
ate
2001h1 2002h1 2003h1 2004h1 2005h1
Date
Arizona Florida Other states
−0.10
−0.05
0.00
0.05
0.10
Idio
syncra
tic s
tock w
ealth g
row
th r
ate
2001h1 2002h1 2003h1 2004h1 2005h1
Date
Arizona Florida
Note: Idisyncratic growth is defined as the difference in growth rates between AZ and FL, and other states
X.Zhou, C.Carroll (FNMA, JHU) Measuring wealth effects using regional data March 18, 2011 10 / 16
Contributions of this study
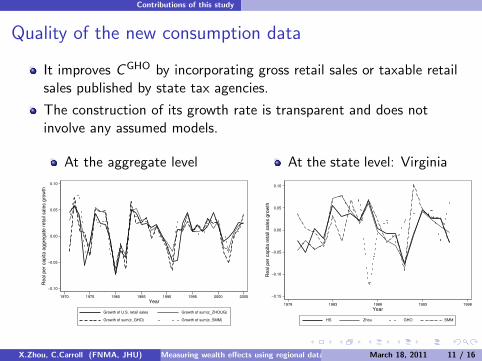
Quality of the new consumption data
It improves CGHO by incorporating gross retail sales or taxable retailsales published by state tax agencies.
The construction of its growth rate is transparent and does notinvolve any assumed models.
At the aggregate level
−0.10
−0.05
0.00
0.05
0.10
Real per
capita a
ggre
gate
reta
il sale
s g
row
th
1970 1975 1980 1985 1990 1995 2000 2005
Year
Growth of U.S. retail sales Growth of sum(c_ZHOUG)
Growth of sum(c_GHO) Growth of sum(c_SMM)
At the state level: Virginia
−0.15
−0.10
−0.05
0.00
0.05
0.10
Real per
capita r
eta
il sale
s g
row
th
1978 1983 1988 1993 1998
Year
HS Zhou GHO SMM
X.Zhou, C.Carroll (FNMA, JHU) Measuring wealth effects using regional data March 18, 2011 11 / 16
Contributions of this study
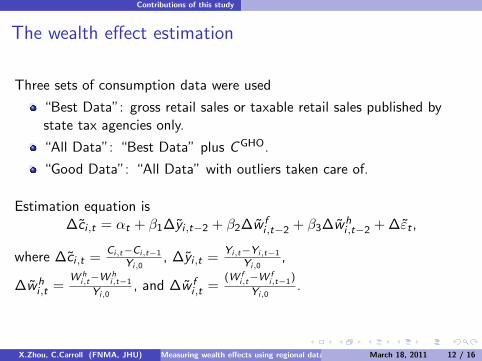
The wealth effect estimation
Three sets of consumption data were used
“Best Data”: gross retail sales or taxable retail sales published bystate tax agencies only.
“All Data”: “Best Data” plus CGHO.
“Good Data”: “All Data” with outliers taken care of.
Estimation equation is∆ci ,t = αt + β1∆yi ,t−2 + β2∆w f
i ,t−2 + β3∆whi ,t−2 + ∆εt ,
where ∆ci ,t =Ci,t−Ci,t−1
Yi,0, ∆yi ,t =
Yi,t−Yi,t−1
Yi,0,
∆whi ,t =
W hi,t−W h
i,t−1
Yi,0, and ∆w f
i ,t =(W f
i,t−W fi,t−1)
Yi,0.
X.Zhou, C.Carroll (FNMA, JHU) Measuring wealth effects using regional data March 18, 2011 12 / 16

Contributions of this study
The wealth effect estimation
Impact on consumption of a one dollar change in housing wealth thattook place two years prior: about 5 cents.
The stock wealth effect: insignificant and economically small.
Large standard errors indicate statistically insignificant differencesbetween housing and stock wealth effects.
Regression resultsBest Data All Data Good Data
∆yi,t−2 0.578 0.962∗∗ 0.775∗∗∗(0.533) (0.382) (0.297)
∆w fi,t−2 -.028 -.002 0.002
(0.033) (0.031) (0.022)
∆whi,t−2 0.046 0.051∗ 0.042∗∗
(0.041) (0.026) (0.019)
β2 = β3 2.478 2.37 2.466(Accepted) (Accepted) (Accepted)
OBS 24 90 90R2 0.206 0.051 0.116Partial R2 -.004 0.06 0.11
X.Zhou, C.Carroll (FNMA, JHU) Measuring wealth effects using regional data March 18, 2011 13 / 16

Post 2005
Housing wealth and consumption during the recessionQ: What fraction of the consumption declines after 2006 can be associated withthe concurrent housing wealth changes.
Actual vs. predicted consumption growth: 6 states with the highest/lowest housing wealthgrowth
Actl−−Top
Pred−−Top
Actl−−Bot
Pred−−Bot
.9
.95
1
1.05
1.1
2000 2002 2004 2006 2008 2010year
avg cumu. consumption g. of 6 states /w highest housing wealth g. btw 01−06
avg cumu. consumption g. of 6 states /w lowest housing wealth g. btw 01−06
predicted consumption growth from regressing on labor income and housing wealth
predicted consumption growth from regressing on labor income and housing wealth
Note: Indexed to 2000h1X.Zhou, C.Carroll (FNMA, JHU) Measuring wealth effects using regional data March 18, 2011 14 / 16

Post 2005
For the top 6 states, almost 50 percent of the consumption drop in 2007 canbe associated with the housing wealth decline in the same year.
This possible association, however, declines over time to 23 percent in 2008,and finally about 11 percent in 2009.
There is no evidence for strong association between consumption changeand housing wealth change for states with bottom housing wealth growth.
Year Index of Index of actl. ∆ci,t pred. ∆ci,t %∆ci,t associatedactl. c pred. c with ∆wh
i,t
Top States 2006 1.0940 1.09402007 1.0912 1.0927 −0.26% −0.12% 47.43%2008 1.0188 1.0760 −6.64% −1.53% 23.04%2009 0.9204 1.0643 −9.65% −1.08% 11.23%
Bot States 2006 0.9841 0.98412007 0.9859 0.9824 0.19% −0.17% −92.34%2008 0.9859 0.9784 −0.01% −0.41% 4856.95%2009 0.9373 0.9763 −4.92% −0.22% 4.43%
X.Zhou, C.Carroll (FNMA, JHU) Measuring wealth effects using regional data March 18, 2011 15 / 16

Post 2005
Conclusion
Contributions:
Creates a new panel dataset for the financial wealth of U.S. states.
Constructs a state-level measure of consumption.
Estimates stock and housing wealth effects using these data; help usunderstand consumption changes during the recession.
THANK YOU!
X.Zhou, C.Carroll (FNMA, JHU) Measuring wealth effects using regional data March 18, 2011 16 / 16