Embed Size (px)
Citation preview
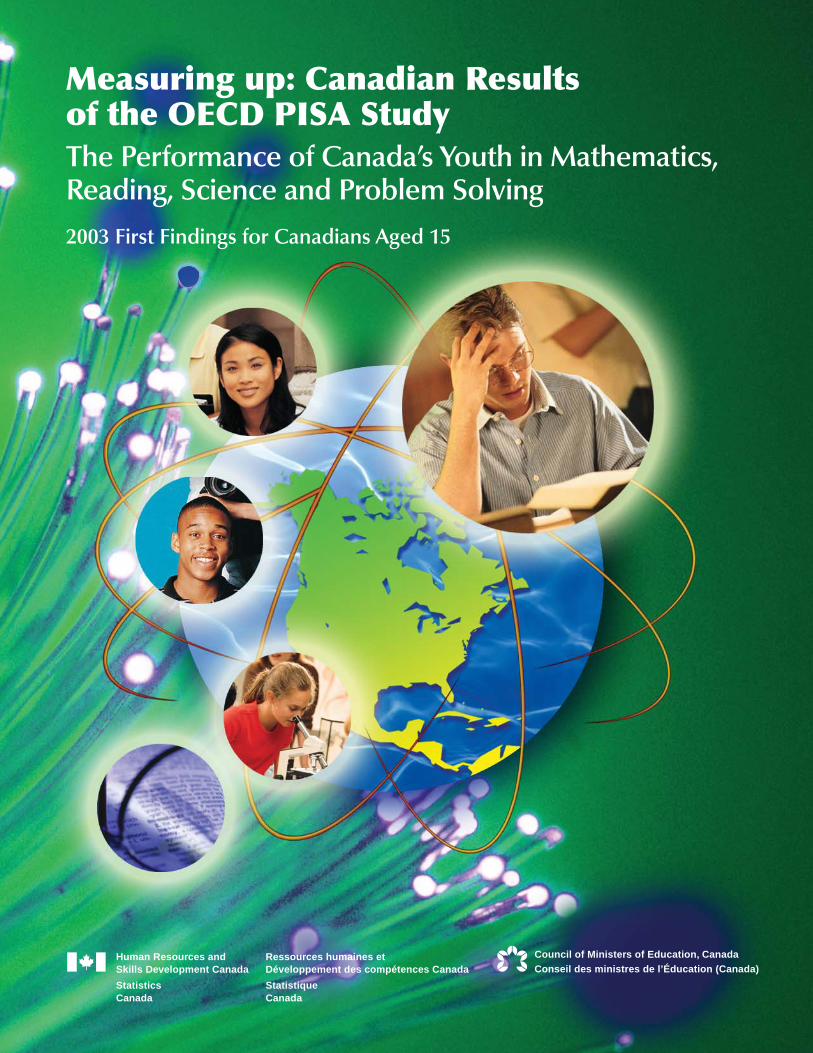
Measuring up: Canadian Resultsof the OECD PISA StudyThe Performance of Canada’s Youth in Mathematics,Reading, Science and Problem Solving
2003 First Findings for Canadians Aged 15
Council of Ministers of Education, CanadaConseil des ministres de l’Éducation (Canada)
Statistics StatistiqueCanada Canada
Human Resources and Ressources humaines etSkills Development Canada Développement des compétences Canada
How to obtain more information
Specific inquiries about this product and related statistics or services should be directedto: Client Services, Culture, Tourism and the Centre for Education Statistics, StatisticsCanada, Ottawa, Ontario, K1A 0T6 (telephone: (613) 951-7608; toll free at 1 800 307-3382;by fax at (613) 951-9040; or e-mail: [email protected]).
For information on the wide range of data available from Statistics Canada, you can contactus by calling one of our toll-free numbers. You can also contact us by e-mail or by visitingour Web site.
National inquiries line 1 800 263-1136National telecommunications device for the hearing impaired 1 800 363-7629Depository Services Program inquiries 1 800 700-1033Fax line for Depository Services Program 1 800 889-9734E-mail inquiries [email protected] site www.statcan.ca
Ordering and subscription information
This product, Catalogue no. 81-590-XPE, is published irregularly as a standard printedpublication at a price of CDN $11.00 per issue. The following additional shipping chargesapply for delivery outside Canada:
Single issue
United States CDN $6.00
Other countries CDN $11.00
All prices exclude sales taxes.
This publication is available electronically without charge through the internet at:
• www.pisa.gc.ca• www.statcan.ca• www.cmec.ca• www.hrsdc.gc.ca
This product can be ordered by
• Phone (Canada and the United States) 1 800 267-6677• Fax (Canada and the United States) 1 877 287-4369• E-mail [email protected]• Mail Statistics Canada
Dissemination DivisionCirculation Management120 Parkdale AvenueOttawa, Ontario K1A 0T6
• And in person at the Statistics Canada Reference Centre nearest you.
The paper used in this publication meets the minimum requirements of American National Standardfor Information Sciences - Permanence of Paper for Printed Library Materials, ANSI Z39.48 - 1984.
∞

Measuring up: Canadian Resultsof the OECD PISA StudyThe Performance of Canada’s Youthin Mathematics, Reading, Scienceand Problem Solving2003 First Findings for Canadians Aged 15
Authors
Patrick Bussière, Human Resources and Skills Development CanadaFernando Cartwright, Statistics CanadaTamara Knighton, Statistics Canada
Special Contributor
Todd Rogers, University of Alberta
Published by authority of the Minister responsible for Statistics Canada
© Minister of Industry, 2004
All rights reserved. No part of this publication may be reproduced, stored in a retrieval system or transmitted in any form or by any means,electronic, mechanical, photocopying, recording or otherwise, without prior written permission from License Services, Marketing Division,Statistics Canada, Ottawa, Ontario, Canada K1A 0T6.
December 2004
Catalogue no. 81-590-XPE — No. 2
ISBN 0-660-19397-3
ISSN 1712-5464
Catalogue no. 81-590-XIE — No. 2
ISBN 0-662-38806-2
ISSN 1712-5472
Également offert en français sous le titre : À la hauteur : Résultats canadiens de l ’étude PISA de l ’OCDE — La performance des jeunes du Canada enmathématiques, en lecture, en sciences et en résolution de problèmes — Premiers résultats de 2003 pour les Canadiens de 15 ans
Frequency: Occasional
Ottawa
Human Resources and Skills Development Canada, Council of Ministers of Education, Canada and Statistics Canada
The data interpretations presented in this report are those of the authors and do not necessarily reflect those of the granting agencies or reviewers.
National Library of Canada Canadian Cataloguing in Publication Data
Bussière , Patrick The performance of Canada’s youth in mathematics, reading, science and problem solving :2003 first findings for Canadians aged 15
(Measuring up : Canadian results of the OECD PISA study ; no. 2)Issued also in French under title: La performance des jeunes duCanada en mathématiques, en lecture, en sciences et en résolution de problèmes : premiers résultats de 2003pour les canadiens de 15 ans.Available also on the Internet.ISBN 0-660-19397-3 (paper)ISBN 0-662-38806-2 (Internet)CS81-590-XPECS81-590-XIE
1. High school students – Rating of – Canada.2. Academic achievement – Canada – Statistics.3. High school students – Rating of – Canada – Statistics.4. High school students – Rating of – OECD countries – Statistics.5. Educational evaluation – Canada – Statistics.6. Programme for International Student Assessment.I. Bussière, Patrick. II. Cartwright, Fernando – III. Knighton, Tamara – IV. Rogers, W. Todd –V. Statistics Canada. II. Canada. Human Resources and Skills Development Canada. –VI. Council of Ministers of Education (Canada) – VII. Series.
LB3054.C3 B87 2004 373.126’2’0971C2004-988006-3
3
Measuring up: Canadian Results of the OECD PISA Study
Acknowledgements
We would like to thank the students, parents, teachersand principals who gave of their time to participate inthe 2003 OECD PISA study and the Youth inTransition Survey. The support for this Federal-Provincial collaborative project provided by membersof the PISA-YITS Steering Committee and by thecoordinators in each participating Ministry orDepartment of Education during all steps of the studyis gratefully acknowledged. The dedication of the surveydevelopment, implementation, processing andmethodology teams was essential to the project’s successand is appreciated.
This publication was prepared jointly by StatisticsCanada, Human Resources and Skills DevelopmentCanada and the Council of Ministers of Education,Canada and was supported financially by HumanResources and Skills Development Canada.
The report has benefited from the input andcomments of reviewers in provincial Ministries andDepartments of Education; the Council of Ministersof Education, Canada; Human Resources and SkillsDevelopment Canada and Statistics Canada. A veryspecial thank you is extended to Danielle Baum for herindispensable help in preparing the manuscript forpublication. The contribution of editorial, com-munications, translation and dissemination services staffof Statistics Canada, Human Resources and SkillsDevelopment Canada and the Council of Ministers ofEducation, Canada was essential to the project’s successand is appreciated.
Note of Appreciation
Canada owes the success of its statistical system to along-standing partnership between Statistics Canada,the citizens of Canada, its businesses, governments andother institutions. Accurate and timely statisticalinformation could not be produced without theircontinued cooperation and goodwill.

© SchoolNet, Industry Canada
© SchoolNet, Industry Canada

5
Measuring up: Canadian Results of the OECD PISA Study
Acknowledgements 3
Introduction 9The Programme for International Student Assessment 9Why do PISA? 10Why did Canada participate? 10What is PISA 2003? 11Objectives and organization of the report 12
Chapter 1
The performance of Canadian students in mathematics in an international context 13Defining mathematics 13Canadian students performed well in mathematics 15Provincial results 21Mathematics skill levels 22Provincial variation in mathematics performance 27How does the performance of boys and girls compare? 28Achievement of Canadian students by language of the school system 29Comparison of mathematics performance in PISA 2003 and PISA 2000 30Summary 31
Chapter 2
The performance of Canadian students in reading, science and problemsolving in an international context 33
Defining reading, science and problem solving 33Canadian students performed well in reading, science and problem solving 34Provincial results 38How does the performance of boys and girls compare? 38Achievement of Canadian students by language of the school system 39Comparison of reading and science performance in PISA 2003 and 2000 40Summary 41
Chapter 3
The relationship between student engagement, student learning,and mathematics performance 43
Engagement in mathematics 43Mathematics learning strategies and preferences for learning 48Summary 52
Table of contents
6
Table of contents
Chapter 4
The relationship between family characteristics, home environment,and mathematics performance 53
Parental education, occupation, and student performance 53Socio-economic status and student performance 59Summary 62
Conclusion 63
Appendix A: PISA sampling procedures and response rates 67
Table A1 PISA 2003 school and student response rates 68
Appendix B: Tables 69
Chapter 1Table B1.1 Estimated average scores and confidence intervals for
provinces and countries: COMBINED MATHEMATICS 70Table B1.2 Estimated average scores and confidence intervals for
provinces and countries: MATHEMATICS SPACE AND SHAPE 70Table B1.3 Estimated average scores and confidence intervals for provinces and
countries: MATHEMATICS CHANGE AND RELATIONSHIPS 71Table B1.4 Estimated average scores and confidence intervals for
provinces and countries: MATHEMATICS QUANTITY 71Table B1.5 Estimated average scores and confidence intervals for
provinces and countries: MATHEMATICS UNCERTAINTY 72Table B1.6 Variation in combined mathematics performance, Canada and the provinces 72Table B1.7 Percent of students at each level for provinces and countries:
COMBINED MATHEMATICS 73Table B1.8 Gender differences by country and province:
COMBINED MATHEMATICS 74Table B1.9 Gender differences by country and province:
MATHEMATICS SPACE AND SHAPE 75Table B1.10 Gender differences by country and province:
MATHEMATICS CHANGE AND RELATIONSHIPS 76Table B1.11 Gender differences by country and province:
MATHEMATICS QUANTITY 77Table B1.12 Gender differences by country and province;
MATHEMATICS UNCERTAINTY 78
Chapter 2Table B2.1 Estimated average scores and confidence
intervals for provinces and countries: READING 79Table B2.2 Estimated average scores and confidence
intervals for provinces and countries: SCIENCE 79Table B2.3 Estimated average scores and confidence intervals
for provinces and countries: PROBLEM SOLVING 80Table B2.4 Gender differences by country and province: READING 81Table B2.5 Gender differences by country and province: SCIENCE 82Table B2.6 Gender differences by country and province: PROBLEM SOLVING 83
Table of contents
7
Measuring up: Canadian Results of the OECD PISA Study
Chapter 3
Table B3.1 Average score for indices of studentengagement in mathematics: Canada and the provinces 84
Table B3.2 Difference in mathematics performance between studentswith high mathematics engagement compared to studentswith low mathematics engagement, Canada and the provinces 85
Table B3.3 Student engagement regression coefficients for females relative tomales controlling for mathematics ability, Canada and the provinces 87
Table B3.4 Average scores on indices of learning strategies and preferencesfor learning situations in mathematics, Canada and the provinces 88
Table B3.5 Difference in mathematics performance between students withhigh levels of mathematics learning strategies and preferencesfor learning compared to students with low levels, Canada and the provinces 90
Table B3.6 Average score for learning strategies and preferences forlearning: low achievers versus high achievers, Canada and the provinces 91
Chapter 4Table B4.1 Parental educational attainment, Canada and the provinces 93Table B4.2 Parental education and student performance in mathematics, Canada and the provinces 93Table B4.3 Distribution of parental education for Canadian students with high and low overall
mathematics performance 94Table B4.4 Parental educational attainment and occupation, Canada 94Table B4.5 Parental occupation and student mathematics performance,
Canada and the provinces 95Table B4.6 School SES and student performance in mathematics in Canada 96
Table of contents

© SchoolNet, Industry Canada
© SchoolNet, Industry Canada

9
Measuring up: Canadian Results of the OECD PISA Study
Introduction
The Programme for InternationalStudent Assessment
The Programme for International Student Assessment(PISA) is a collaborative effort among member countriesof the Organisation for Economic Co-operation andDevelopment (OECD). PISA is designed to providepolicy-oriented international indicators of the skills andknowledge of 15-year-old students1 and sheds light ona range of factors that contribute to successful students,schools, and education systems. PISA measures skillsthat are generally recognized as key outcomes of theeducational process. They are not, however, the onlyexpected outcomes nor are they solely acquired througheducation. The assessment focuses on young people’sability to use their knowledge and skills to meet real lifechallenges. These skills are believed to be prerequisitesto efficient learning in adulthood and for fullparticipation in society.
PISA has brought significant public andeducational attention to international assessment andstudies by generating data to enhance the ability ofpolicy makers to make decisions based on evidence. InCanada, PISA is carried out through a partnershipconsisting of Human Resources and Skills DevelopmentCanada, the Council of Ministers of Education Canada,and Statistics Canada.
PISA began in 2000 and focuses on 15-year-olds’capabilities as they near the end of compulsoryeducation. PISA reports on reading literacy,mathematical literacy, and scientific literacy every threeyears and provides a more detailed look at each domain
in the years when it is the major focus. For example,mathematics was the major domain of PISA in 2003and as such focused on both overall mathematical literacyand four mathematics sub-domains (space and shape,change and relationships, quantity, and uncertainty).Additionally, problem-solving skills were evaluated inPISA 2003. As minor domains in PISA 2003, onlysingle measures of reading and science were available.On the other hand, more detailed information wasavailable on reading and reading sub-domains in 2000and more information will be available on science andscience sub-domains in 2006.
The PISA Assessment Domains
PISA measures three domains: mathematical literacy,reading literacy, and scientific literacy. In addition, PISA2003 measured problem-solving skills. The domainswere defined as follows by international experts whoagreed that the emphasis should be placed onfunctional knowledge and skills that allow activeparticipation in society.
Mathematical literacy (hereafter referred to asmathematics):
An individual’s capacity to identify and understand therole that mathematics plays in the world, to make well-founded judgements and to use and engage withmathematics in ways that meet the needs of thatindividual’s life as a constructive, concerned andreflective citizen.
Reading literacy (hereafter referred to as reading):
An individual’s capacity to understand, use and reflecton written texts, in order to achieve one’s goals, todevelop one’s knowledge and potential and toparticipate in society.

10
Introduction
Scientific literacy (hereafter referred to as science):
An individual’s capacity to use scientific knowledge, toidentify questions and to draw evidence-basedconclusions in order to understand and help makedecisions about the natural world and the changesmade to it through human activity.
Problem-solving skills (hereafter referred to asproblem solving):
An individual’s capacity to use cognitive processes toconfront and resolve real, cross-disciplinary situationswhere the solution path is not immediately obviousand where the literacy domains or curricular areas thatmight be applicable are not within a single domain ofmathematics, science or reading. Education systemsplay a key role in generating the new supply of skills tomeet this demand. The skills acquired by the end ofcompulsory schooling provide the essential foundationupon which we will develop the human capital neededto meet the economic and social challenges of thefuture. For more information please refer to the PISA2003 assessment framework.
Why do PISA?
The skills and knowledge that individuals bring to theirjobs, to further studies, and to our society, play animportant role in determining our economic success andour overall quality of life. The importance of skills andknowledge is expected to continue to grow. The shiftfrom manufacturing to knowledge and informationintensive service industries, advances in communicationand production technologies, the wide diffusion ofinformation technologies, falling trade barriers, and theglobalization of financial markets and markets forproducts and services have precipitated changes in theskills the present and future economy requires. Theseinclude a rising demand for a strong set of foundationskills upon which further learning builds.
Elementary and secondary education systems playa central role in laying a solid base upon whichsubsequent knowledge and skills can be developed.Students leaving secondary education without a strongfoundation may experience difficulty accessing thepostsecondary education system and the labour marketand they may benefit less when learning opportunitiesare presented later in life. Without the tools needed tobe effective learners throughout their lives, theseindividuals, with limited skills, risk economic and socialmarginalization.
Governments in industrialized countries havedevoted large portions of their budgets to provide highquality universal elementary and secondary schooling.
Despite these investments, there is concern among thesegovernments about the relative effectiveness of theireducation systems. To address these issues, membergovernments of the Organisation for Economic Co-operation and Development (OECD) developed acommon tool to improve their understanding of whatmakes young people—and education systems as awhole—successful. This tool is the Programme forInternational Student Assessment (PISA).
Information gathered through PISA enables athorough comparative analysis of the skill level ofstudents near the end of their compulsory education.PISA also permits exploration of the ways that skillsvary across different social and economic groups andthe factors that influence the level and distribution ofskills within and among countries.
Why did Canada participate?
Canada’s participation in the PISA study stems frommany of the same concerns as have been expressed byother participating countries. Canada invests significantpublic resources in the provision of elementary andsecondary education. Canadians are concerned about thequality of education provided to their youth byelementary and secondary schools. How canexpenditures be directed to achieve higher levels of skillsupon which lifelong learning is founded, and topotentially reduce social inequality in life outcomes?
Canada’s economy is also evolving rapidly. For thepast two decades, the growth rate of knowledge-intensiveoccupations has been twice that of other occupations.22
Even employees in traditional occupations areexpected to upgrade their skills to meet the risingdemands of new organisational structures andproduction technologies. Elementary and secondaryeducation systems play a key role in generating the newsupply of skills to meet this demand. The skills acquiredby the end of compulsory schooling provide individualswith the essential foundation necessary to further develophuman capital.
Questions about educational effectiveness can bepartly answered with data on the average performanceof Canada’s youth. However, two other questions canonly be answered by examining the distribution of skills:Who are the students at the lowest levels? Do certaingroups or regions appear to be at greater risk? These areimportant questions because, among other things, skillacquisition during compulsory schooling influences

11
Measuring up: Canadian Results of the OECD PISA Study
access to postsecondary education, eventual success inthe labour market, and the effectiveness of continuous,lifelong learning.
What is PISA 2003?
Forty-one countries participated in PISA 2003,including all 30 OECD countries3. Between 5,000 and10,000 students aged 15 from at least 150 schools weretypically tested in each country. In Canada,approximately 28,000 15-year-olds from about 1,000schools participated across the ten provinces4. The largeCanadian sample was required to produce reliableestimates representative of each province, and for bothFrench and English language school systems in NovaScotia, New Brunswick, Quebec, Ontario, andManitoba.
The 2003 PISA assessment was administered inschools, during regular school hours in April and May2003. This assessment was a paper-and-pencil testlasting a total of two hours. Students also completed a20-minute student background questionnaire providinginformation about themselves and their home and a 10-minute questionnaire on information technology andcommunications, while school principals were asked tocomplete a 20-minute questionnaire about their schools.As part of PISA, national options could also beimplemented. Canada chose to add a 20-minute studentquestionnaire from the Youth in Transition Survey inorder to collect more information on 15-year-olds’ schoolexperiences, work activities and relationships with others.Additionally, a 30-minute interview was conducted withparents.
International Canada
Participating countries/provinces • 41 countries • 10 provinces
Population • Youth aged 15 • Same; youth born in 1987
Number of participating • Between 5,000 and 10,000 per country with some • Approximately 28,000 studentsstudents exceptions for a total of close to 272,000 students
Domains • Major: mathematics • Same• Minor: reading, science and problem solving
Amount of testing time • 390 minutes of testing material organized into different • Samedevoted to domains combinations of test booklets 120 minutes in length
• 210 minutes devoted to mathematics• 60 minutes each devoted to reading, science
and problem solving
Languages in which the • 32 languages • English and Frenchtest was administered
International assessment • Two hours of direct skills assessment through • Samemathematics, reading and science, and problem-solving
• Twenty minute contextual questionnaire administeredto youth
• A school questionnaire administered to school principals
International options • Ten-minute optional questionnaire on information • Ten-minute optional questionnaire ontechnology and communications administered to students information technology administered to
• Ten-minute optional questionnaire on educational students administered to studentscareer administered to students
National options • Grade-based assessment • Twenty-minute questionnaire on schoolexperiences, work activities and relation-ships with others administered to students
• Other options were undertaken in a limited • Thirty-minute interview with parents tonumber of countries collect detailed information on youths’
school experiences, parental education andoccupation, labour market participation andhousehold income
Box 1
Overview of PISA 2003

12
Introduction
Objectives and organizationof the reportThis report provides the first pan-Canadian results ofthe 2003 PISA assessment of mathematics, reading,science, and problem solving. The information ispresented at the national and provincial levels in orderto complement the information presented in “Learningfor Tomorrow’s World – First Results from PISA2003”5. Wherever possible, an attempt has been madeto put results into context through comparisons tostudent peers, internationally and within Canada.
Chapter 1 provides information on the relativeperformance of Canadian 15-year-old students on the2003 PISA assessment in mathematics. It looks at theaverage level of performance on the overall mathematicsscale as well as the four mathematics sub-domains, thedistribution of achievement scores and proficiency levelsin mathematics, gender differences, the differencesbetween English-language and French-language schoolsystems, and comparisons with PISA 2000. Chapter 2presents information on the mean performance ofCanadian students in reading, science and problemsolving. Chapters 3 and 4 use PISA 2003 data to exploretwo themes related to mathematics performance. InChapter 3, the relationship between student engagementin mathematics, student learning and mathematicsperformance is explored. Chapter 4 examines the impactof student socio-economic background on mathematicsperformance. Finally, the major findings andopportunities for further study are discussed in theconclusion.
Notes1. OECD (1999), Measuring Student Knowledge and Skills: A New
Framework for Assessment, Paris.2. Lavoie, Marie and Richard, Roy ( June 1998). Employment in the
Knowledge-Based Economy: A Growth Accounting Exercise forCanada, Ottawa: HRDC Applied Research Branch ResearchPapers Series R-98-8E.
3. OECD countries include Australia, Austria, Belgium, Canada,Czech Republic, Denmark, Finland, France, Germany, Greece,Hungary, Iceland, Ireland, Italy, Japan, Korea, Luxembourg,Mexico, Netherlands, New Zealand, Norway, Poland, Portugal,Slovak Republic, Spain, Sweden, Switzerland, Turkey, UnitedKingdom, United States. Partner countries include Brazil, HongKong-China, Indonesia, Latvia, Liechtenstein, Macao-China,Russian Federation, Serbia and Montenegro (Ser.), Thailand,Tunisia, Uruguay. Although the United Kingdom participated inPISA 2003, technical problems with its sample prevent its resultsfrom being discussed here.
4. No data were collected in the three territories and on IndianReserves.
5 . OECD (2004), Learning for Tomorrow’s World – First resultsfrom PISA 2003, Paris.
13
Measuring up: Canadian Results of the OECD PISA Study
Chapter 1
The performance of Canadianstudents in mathematics in aninternational context
This chapter compares the Canadian results of the PISA2003 assessment in terms of average scores andproficiency levels. First, the performance of Canadian15-year-old students is compared to the performance of15-year-old students from countries that participated inPISA 2003. Second, the results of students’ performancein the ten Canadian provinces are analyzed. Thisinformation is followed by a comparison between theperformance of boys and the performance of girls inCanada and the provinces. Fourth, the performance ofstudents enrolled in English-language and French-language school systems are compared for the fiveprovinces in which the two groups were sampledseparately. Finally, the results of PISA 2003 are comparedwith those of PISA 2000.
Defining mathematics
Mathematics performance as measured by PISA involvesmore than the ability to perform arithmeticcomputations. The assessment items also emphasizedmathematical knowledge put to functional use in a varietyof situations and contexts. This emphasis is reflected inthe PISA definition of mathematics:
An individual’s capacity to identify and understandthe role that mathematics plays in the world, to makewell-founded judgements and to use and engage withmathematics in ways that meet the needs of thatindividual’s life as a constructive, concerned andreflective citizen.
Mathematics results are presented not only in termsof students’ overall mathematics performance but alsofor four mathematics sub-domains. These sub-domainsare defined in terms of four content areas that cover therange of mathematics 15-year-old students need as afoundation for life. The OECD defined the four contentareas for mathematics as follows:
• Space and shape relates to spatial and geometricphenomena and relationships, drawing on thediscipline of geometry. It requires looking forsimilarities and differences when analysing thecomponents of shapes, recognising shapes indifferent representations and different dimensionsas well as understanding the properties of objectsand their relative positions.
• Change and relationships involves mathematicalmanifestations of change as well as functionalrelationships and dependency among variables. Itrelates most closely to algebra. Mathematicalrelationships often take the shape of equations orinequalities, but relationships of a more generalnature (e.g., equivalence, divisibility, inclusion) arerelevant as well. Relationships are given a varietyof different representations, including symbolic,algebraic, graphical, tabular, and geometricalrepresentations. Since different representations mayserve different purposes and have differentproperties, translation between representations isoften of key importance in dealing with situationsand tasks.
• Quantity involves numeric phenomena as well asquantitative relationships and patterns. It relatesto the understanding of relative size, the recognitionof numerical patterns, and the use of numbers to

14
Chapter 1 / The performance of Canadian students in mathematics in an international context
represent quantities and quantifiable attributes ofreal-world objects (counts and measures).Furthermore, quantity deals with the processingand understanding of numbers that are representedin various ways. An important aspect of dealingwith quantity is also quantitative reasoning, whichinvolves number sense, representing numbers,understanding the meaning of operations, mentalarithmetic, and estimating. The most commoncurricular branch of mathematics with which it isassociated is arithmetic.
• Uncertainty involves probabilistic and statisticalphenomena and relationships that becomeincreasingly relevant in the information society.These phenomena are the subject of mathematicalstudy in statistics and probability.
The mathematics scores are expressed on a scalewith an average of 500 points for the OECD countries6
and about two-thirds of the students scoring between400 and 600 (i.e. a standard deviation of 100).
While PISA is not a test of curriculum, the pointson the mathematics scale can be interpreted in the contextof the school environment. For example, 26 of the 30OECD countries that participated in PISA 2003 had asizable number of 15-year-olds in the sample who wereenrolled in at least two different, but consecutive grades.For these 26 countries, the OECD analyses revealed thatone additional school year corresponds to an increase of41 score points on the PISA combined mathematicsscale7. For Canada, the OECD analyses revealed thatone additional school year corresponds to an increase of53 score points on the combined mathematics scale.
One way to summarize student performance andto compare the relative standing of countries is byexamining their average test scores. However, simplyranking countries based on their average scores can bemisleading because there is a margin of error associatedwith each score. This margin of error should be takeninto account in order to identify whether differences inaverage scores exist. See text box ‘A note on statisticalcomparisons’.
A note on statistical comparisons
The averages were computed from the scores of randomsamples of students from each country and not fromthe population of students in each country.Consequently it cannot be said with certainty that asample average has the same value as a populationaverage that would have been obtained had all 15-year-old students been assessed. Additionally, a degreeof error is associated with the scores describing studentskills as these scores are estimated based on studentresponses to test items. We use a statistic, called thestandard error, to express the degree of uncertaintyassociated with sampling error and measurement error.The standard error can be used to construct aconfidence interval, which provides a means of makinginferences about the population means and proportionsin a manner that reflects the uncertainty associatedwith sample estimates. A 95% confidence interval isused in this report and represents a range of plus orminus about two standard errors around the sampleaverage. Using this confidence interval it can beinferred that the population mean or proportion wouldlie within the confidence interval in 95 out of 100replications of the measurement, using differentsamples randomly drawn from the same population.
When comparing scores among countries,provinces, or population subgroups the degree of errorin each average should be considered in order todetermine if averages are different from each other.Standard errors and confidence intervals may be usedas the basis for performing these comparative statisticaltests. Such tests can identify, with a known probability,whether there are actual differences in the populationsbeing compared.
For example, when an observed difference issignificant at the 0.05 level, it implies that theprobability is less than 0.05 that the observed differencecould have occurred because of sampling andmeasurement error. When comparing countries andprovinces, extensive use is made of this type of test toreduce the likelihood that differences due to samplingand measurement errors will be interpreted as real.
Only statistically significant differences at the0.05 level are noted in this report, unless otherwisestated. This means that the 95% confidence intervalsfor the averages being compared do not overlap. Dueto rounding error, some non-overlapping confidenceintervals share an upper or lower limit. All statisticaldifferences are based on un-rounded data.
15
Measuring up: Canadian Results of the OECD PISA Study
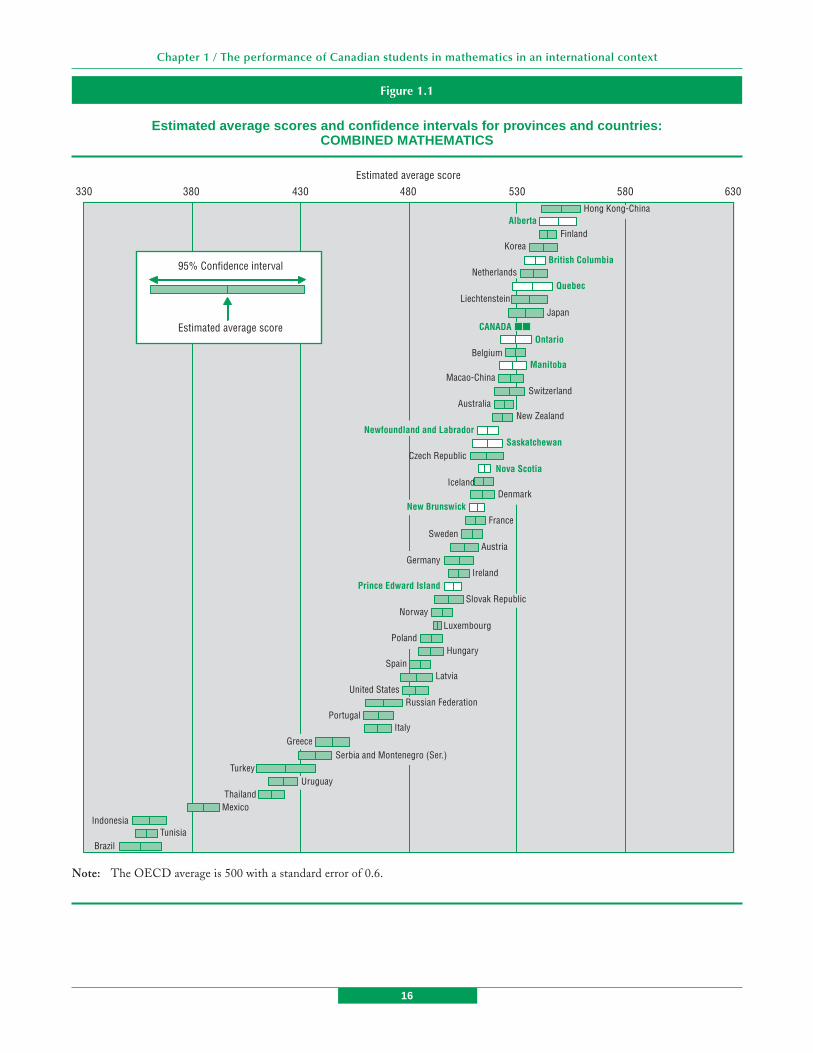
Canadian students performed wellin mathematics
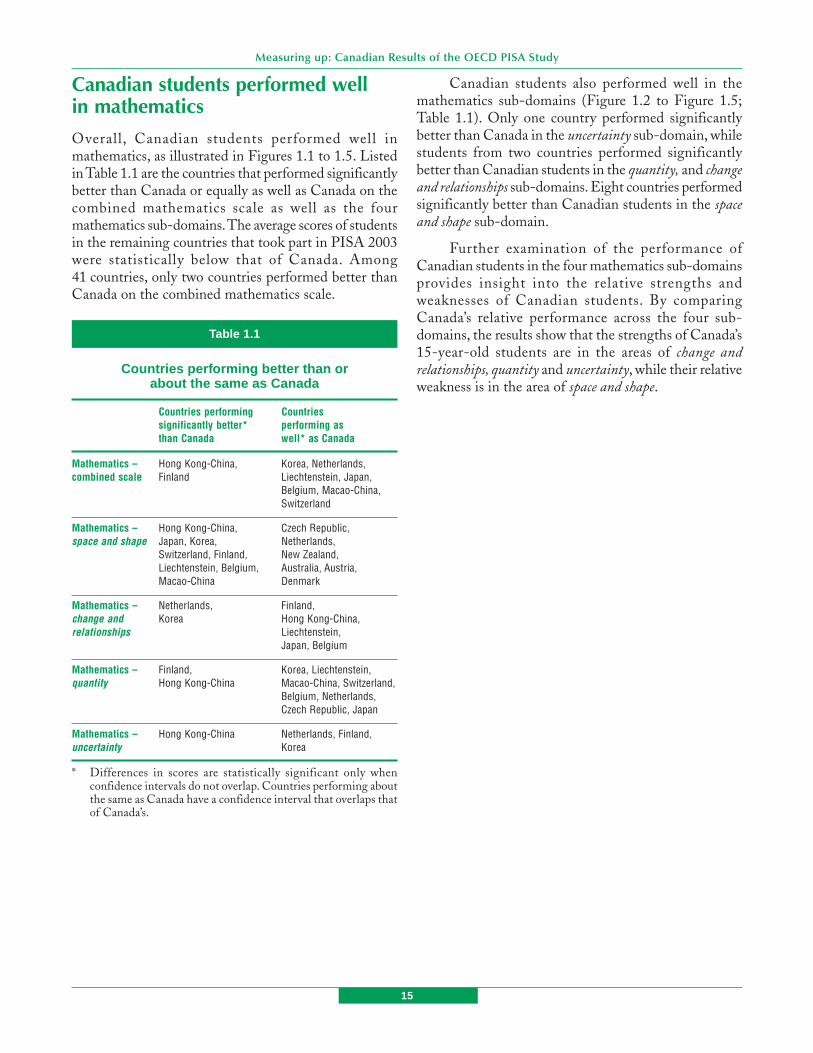
Overall, Canadian students performed well inmathematics, as illustrated in Figures 1.1 to 1.5. Listedin Table 1.1 are the countries that performed significantlybetter than Canada or equally as well as Canada on thecombined mathematics scale as well as the fourmathematics sub-domains. The average scores of studentsin the remaining countries that took part in PISA 2003were statistically below that of Canada. Among41 countries, only two countries performed better thanCanada on the combined mathematics scale.
Table 1.1
Countries performing better than orabout the same as Canada
Countries performing Countriessignificantly better* performing asthan Canada well* as Canada
Mathematics – Hong Kong-China, Korea, Netherlands,combined scale Finland Liechtenstein, Japan,
Belgium, Macao-China,Switzerland
Mathematics – Hong Kong-China, Czech Republic,space and shape Japan, Korea, Netherlands,
Switzerland, Finland, New Zealand,Liechtenstein, Belgium, Australia, Austria,Macao-China Denmark
Mathematics – Netherlands, Finland,change and Korea Hong Kong-China,relationships Liechtenstein,
Japan, Belgium
Mathematics – Finland, Korea, Liechtenstein,quantity Hong Kong-China Macao-China, Switzerland,
Belgium, Netherlands,Czech Republic, Japan
Mathematics – Hong Kong-China Netherlands, Finland,uncertainty Korea
* Differences in scores are statistically significant only whenconfidence intervals do not overlap. Countries performing aboutthe same as Canada have a confidence interval that overlaps thatof Canada’s.
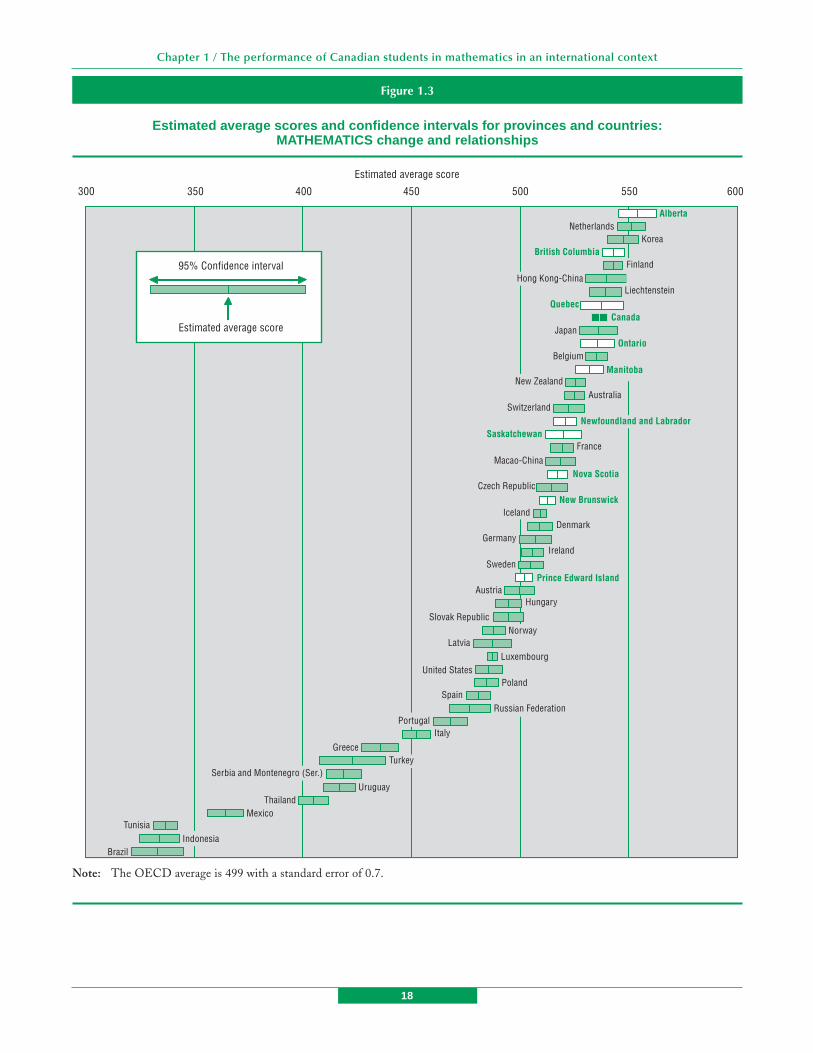
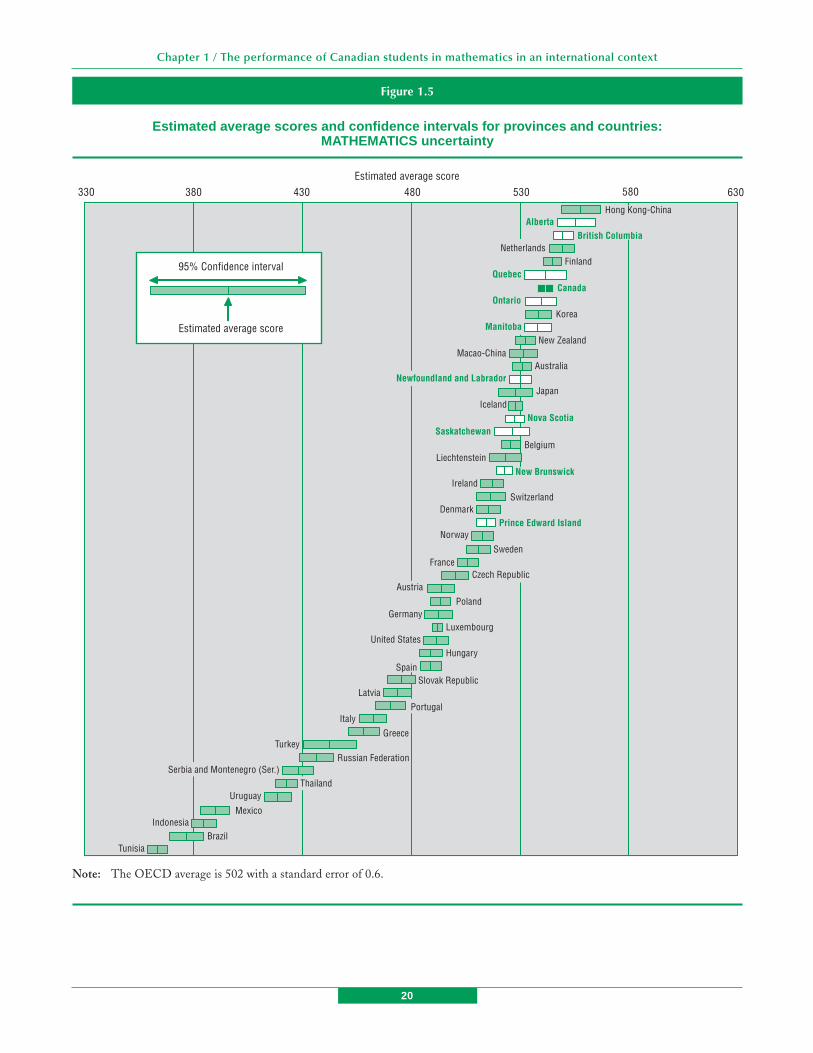
Canadian students also performed well in themathematics sub-domains (Figure 1.2 to Figure 1.5;Table 1.1). Only one country performed significantlybetter than Canada in the uncertainty sub-domain, whilestudents from two countries performed significantlybetter than Canadian students in the quantity, and changeand relationships sub-domains. Eight countries performedsignificantly better than Canadian students in the spaceand shape sub-domain.
Further examination of the performance ofCanadian students in the four mathematics sub-domainsprovides insight into the relative strengths andweaknesses of Canadian students. By comparingCanada’s relative performance across the four sub-domains, the results show that the strengths of Canada’s15-year-old students are in the areas of change andrelationships, quantity and uncertainty, while their relativeweakness is in the area of space and shape.
16
Chapter 1 / The performance of Canadian students in mathematics in an international context
Figure 1.1
Estimated average scores and confidence intervals for provinces and countries:COMBINED MATHEMATICS
Estimated average score630
Note: The OECD average is 500 with a standard error of 0.6.
330 480 530430380 580
Finland
Quebec
CANADA
Belgium
Switzerland
LiechtensteinJapan
Ontario
Manitoba
British Columbia
Macao-China
Australia
Hong Kong-China
Nova Scotia
France
Denmark
Saskatchewan
New Zealand
Iceland
Newfoundland and Labrador
Czech Republic
Alberta
Korea
Netherlands
New Brunswick
95% Confidence interval
Estimated average score
Brazil
Indonesia
Ireland
Austria
Tunisia
Luxembourg
Hungary
Latvia
Turkey
ThailandMexico
Sweden
United States
Portugal
Slovak Republic
Germany
Spain
Poland
Norway
Prince Edward Island
Russian Federation
Italy
Serbia and Montenegro (Ser.)Greece
Uruguay

17
Measuring up: Canadian Results of the OECD PISA Study
Figure 1.2
Estimated average scores and confidence intervals for provinces and countries:MATHEMATICS space and shape
630
Note: The OECD average is 496 with a standard error of 0.7.
Estimated average score330 480 530430380 580
JapanHong Kong-China
BrazilTunisia
Finland
Quebec
CANADA
Belgium
Liechtenstein
Ontario
Manitoba
British Columbia
Macao-China
France
Denmark
New Zealand
Iceland
Czech Republic
Alberta
Korea
Netherlands
Indonesia
Ireland
Austria
Luxembourg
Hungary
Latvia
TurkeyThailand
Mexico
United States
Portugal
Germany
Spain
NorwayPrince Edward Island
Italy
Greece
Uruguay
95% Confidence interval
Estimated average score
Newfoundland and Labrador
Switzerland
Slovak Republic
Poland
Australia
Nova Scotia
Sweden
Saskatchewan
Russian Federation
New Brunswick
Serbia and Montenegro (Ser.)
18
Chapter 1 / The performance of Canadian students in mathematics in an international context
Figure 1.3
Estimated average scores and confidence intervals for provinces and countries:MATHEMATICS change and relationships
300 600450 500400350 550
95% Confidence interval
Estimated average score
Note: The OECD average is 499 with a standard error of 0.7.
Quebec
Belgium
Japan
British Columbia
Macao-China
Australia
Nova Scotia
France
Denmark
Saskatchewan
Iceland
Czech Republic
Alberta
KoreaNetherlands
New Brunswick
Ireland
Austria
Sweden
Slovak Republic
Germany
Prince Edward Island
Brazil
Tunisia
Hungary
Latvia
Turkey
ThailandMexico
United States
Spain
ItalyGreece
Uruguay
Switzerland
Hong Kong-ChinaLiechtenstein
Finland
Canada
Ontario
Manitoba
Newfoundland and Labrador
New Zealand
Portugal
Serbia and Montenegro (Ser.)
Indonesia
Norway
Luxembourg
Poland
Russian Federation
Estimated average score

19
Measuring up: Canadian Results of the OECD PISA Study
Figure 1.4
Estimated average scores and confidence intervals for provinces and countries:MATHEMATICS quantity
330 480 530430380 580
Finland
Quebec
CANADA
Belgium
Switzerland
Liechtenstein
JapanOntario
Manitoba
British ColumbiaMacao-China
Australia
Hong Kong-China
Nova ScotiaFrance
Saskatchewan
Iceland
Czech Republic
AlbertaKorea
Netherlands
95% Confidence interval
Estimated average score
Note: The OECD average is 501 with a standard error of 0.6.
Brazil
Ireland
Hungary
Latvia
Thailand
Sweden
United States
Portugal
Slovak Republic
Germany
SpainPoland
NorwayPrince Edward Island
Russian FederationItaly
Uruguay
Luxembourg
Newfoundland and Labrador
Denmark
Austria
New Zealand
New Brunswick
Indonesia
TunisiaMexico
Turkey
GreeceSerbia and Montenegro (Ser.)
Estimated average score
20
Chapter 1 / The performance of Canadian students in mathematics in an international context
Figure 1.5
Estimated average scores and confidence intervals for provinces and countries:MATHEMATICS uncertainty
330 480 530430380 630
Finland
Canada
BelgiumLiechtenstein
Japan
British Columbia
Macao-ChinaAustralia
Hong Kong-China
Nova Scotia
France
Denmark
Saskatchewan
New Zealand
Iceland
Newfoundland and Labrador
Czech Republic
Alberta
Korea
Netherlands
New Brunswick
95% Confidence interval
Estimated average score
Note: The OECD average is 502 with a standard error of 0.6.
BrazilIndonesia
Ireland
Tunisia
Luxembourg
Hungary
Latvia
Turkey
Mexico
Sweden
Slovak RepublicSpain
Poland
NorwayPrince Edward Island
Russian Federation
ItalyGreece
Uruguay
580
Quebec
Ontario
Manitoba
Switzerland
Austria
United States
Germany
Portugal
Serbia and Montenegro (Ser.)Thailand
Estimated average score
21
Measuring up: Canadian Results of the OECD PISA Study
Provincial results
Most provinces performed well in mathematics (Figures 1.1 to 1.5). All provinces performed ator above the OECD mean in the combined mathematics scale and mathematics sub-scale withone exception: Prince Edward Island performed below the OECD mean in the space and shapesub-domain. Several provinces performed as well as the top-ranked countries. For example, onthe combined mathematics scale the performance of students in Alberta, Quebec and BritishColumbia compared favourably with the performance of students in Hong Kong-China.
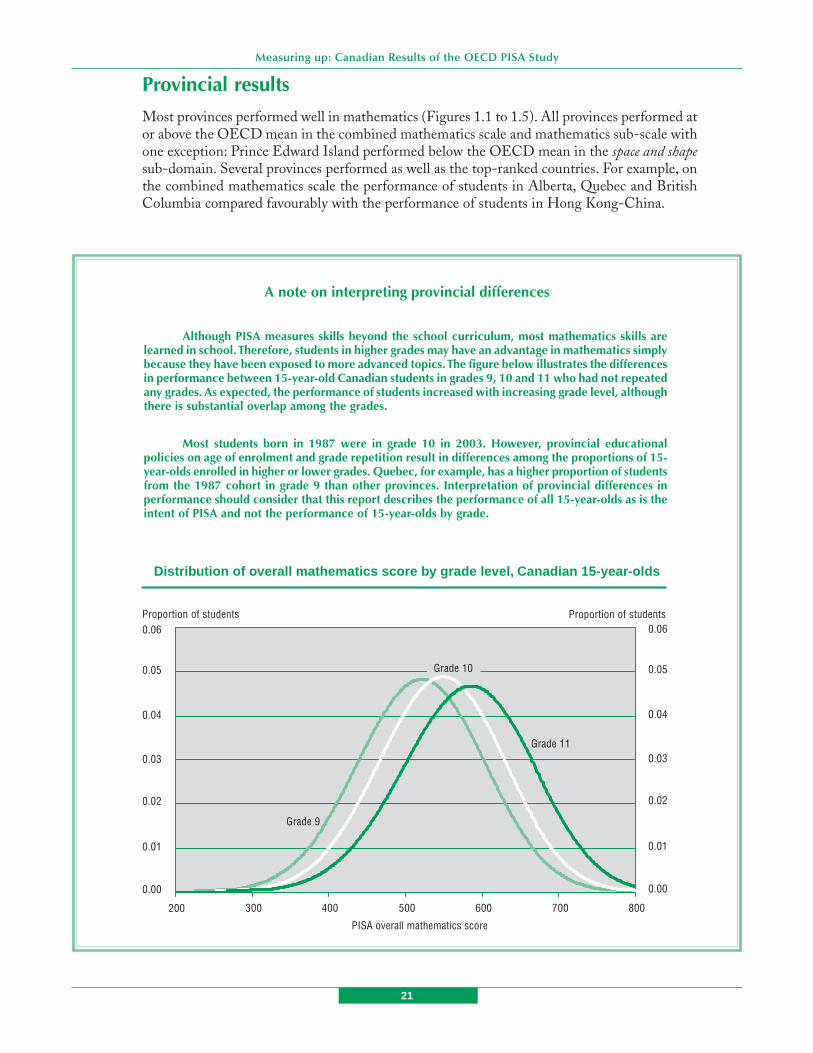
A note on interpreting provincial differences
Although PISA measures skills beyond the school curriculum, most mathematics skills arelearned in school. Therefore, students in higher grades may have an advantage in mathematics simplybecause they have been exposed to more advanced topics. The figure below illustrates the differencesin performance between 15-year-old Canadian students in grades 9, 10 and 11 who had not repeatedany grades. As expected, the performance of students increased with increasing grade level, althoughthere is substantial overlap among the grades.
Most students born in 1987 were in grade 10 in 2003. However, provincial educationalpolicies on age of enrolment and grade repetition result in differences among the proportions of 15-year-olds enrolled in higher or lower grades. Quebec, for example, has a higher proportion of studentsfrom the 1987 cohort in grade 9 than other provinces. Interpretation of provincial differences inperformance should consider that this report describes the performance of all 15-year-olds as is theintent of PISA and not the performance of 15-year-olds by grade.
Distribution of overall mathematics score by grade level, Canadian 15-year-olds
0.00
0.03
0.02
0.01
0.00
200 300 400 500 600 700 800
PISA overall mathematics score
0.03
0.02
0.01
Grade 9
0.06 0.06
0.05
0.04
Proportion of students Proportion of students
0.05
0.04
Grade 10
Grade 11

22
Chapter 1 / The performance of Canadian students in mathematics in an international context
Provinces generally fall into one of three groupswhen compared to the Canadian averages (Table 1.2).The average performance of students in Alberta wassignificantly above the Canadian average for combinedmathematics and the four mathematics sub-domains.Students in British Columbia, Manitoba, Quebec, andOntario performed about the same as the Canadian
average with one exception: students in British Columbiaperformed above the Canadian average in uncertainty.
Students in Newfoundland and Labrador,Saskatchewan, Nova Scotia, New Brunswick and PrinceEdward Island performed significantly lower than theCanadian average across all mathematics scales.
Table 1.2
Provincial results in mathematics in relation to the Canadian average
Provinces performing Provinces performing Provinces performingsignificantly better* than as well* as the significantly lower* thanthe Canadian average Canadian average the Canadian average
Mathematics – combined scale Alberta Quebec, Ontario, Manitoba, Newfoundland and Labrador,British Columbia Prince Edward Island,
Nova Scotia, New Brunswick,Saskatchewan
Mathematics – space and shape Alberta Quebec, Ontario, Manitoba, Newfoundland and Labrador,British Columbia Prince Edward Island,
Nova Scotia, New Brunswick,Saskatchewan
Mathematics – change and relationships Alberta Quebec, Ontario, Manitoba, Newfoundland and Labrador,British Columbia Prince Edward Island,
Nova Scotia, New Brunswick,Saskatchewan
Mathematics – quantity Alberta Quebec, Ontario, Manitoba, Newfoundland and Labrador,British Columbia Prince Edward Island,
Nova Scotia, New Brunswick,Saskatchewan
Mathematics –uncertainty Alberta, Quebec, Ontario, Manitoba Newfoundland and Labrador,British Columbia Prince Edward Island,
Nova Scotia, New Brunswick,Saskatchewan
* Differences in scores are statistically significant only when confidence intervals do not overlap. Provinces performing about the same asCanada have a confidence interval that overlaps with that of Canada’s. Provinces within each cell are ordered from east to west.
Mathematics skill levels
The average scores reported in the previous sectionprovide a useful but limited way of comparingperformance of different groups of students. Another wayto look at performance is to examine the proportions ofstudents who can accomplish tasks at various proficiencyor skill levels. This kind of analysis allows a furtherbreakdown of average scores and an examination ofgroups of students who show similar abilities. In PISA,mathematics skill is a continuum – that is, mathematicsskill is not something a student has or does not have, but
rather every 15-year-old shows a certain level ofmathematics skill. The mathematics skill or proficiencylevels used in PISA 2003 are described in the text box‘Mathematics Proficiency levels’.
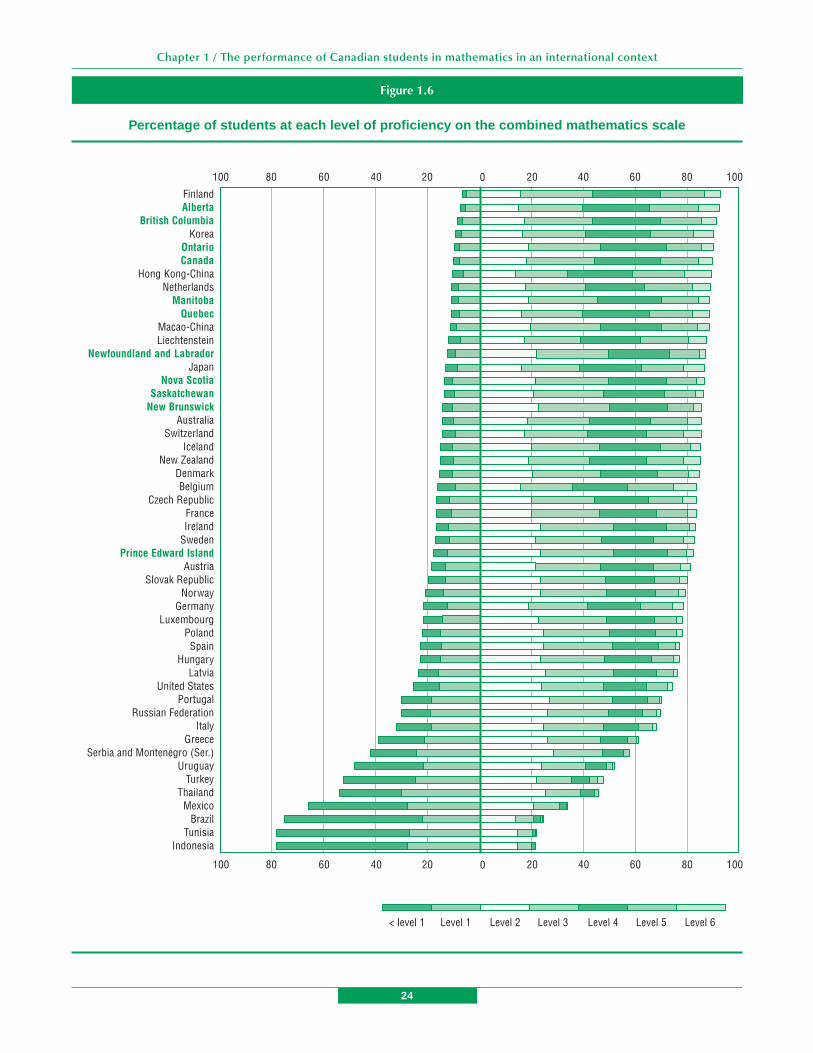
Figure 1.6 (based on data from Table B1.7) showsthe distribution of students by skill level by country, andincludes the Canadian provinces. Results for countriesand provinces are presented in descending orderaccording to the proportion of the 15-year-olds whoperformed at level 2 or higher.
23
Measuring up: Canadian Results of the OECD PISA Study
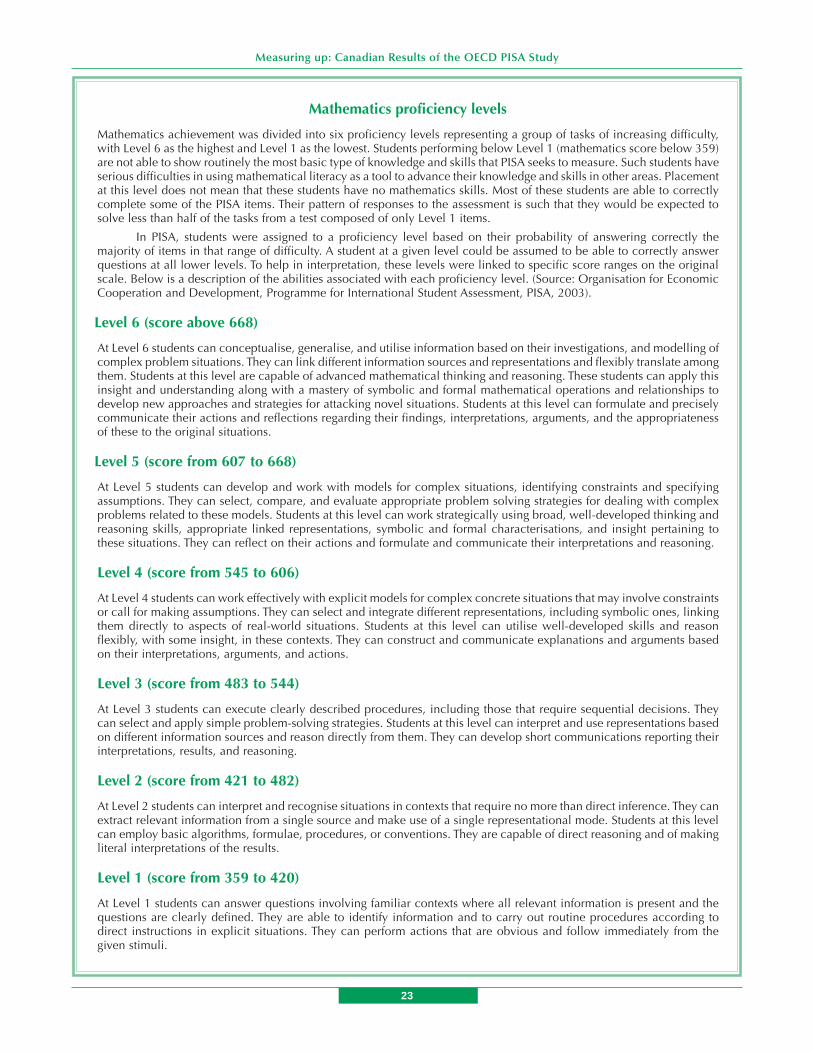
Mathematics proficiency levels
Mathematics achievement was divided into six proficiency levels representing a group of tasks of increasing difficulty,with Level 6 as the highest and Level 1 as the lowest. Students performing below Level 1 (mathematics score below 359)are not able to show routinely the most basic type of knowledge and skills that PISA seeks to measure. Such students haveserious difficulties in using mathematical literacy as a tool to advance their knowledge and skills in other areas. Placementat this level does not mean that these students have no mathematics skills. Most of these students are able to correctlycomplete some of the PISA items. Their pattern of responses to the assessment is such that they would be expected tosolve less than half of the tasks from a test composed of only Level 1 items.
In PISA, students were assigned to a proficiency level based on their probability of answering correctly themajority of items in that range of difficulty. A student at a given level could be assumed to be able to correctly answerquestions at all lower levels. To help in interpretation, these levels were linked to specific score ranges on the originalscale. Below is a description of the abilities associated with each proficiency level. (Source: Organisation for EconomicCooperation and Development, Programme for International Student Assessment, PISA, 2003).
Level 6 (score above 668)
At Level 6 students can conceptualise, generalise, and utilise information based on their investigations, and modelling ofcomplex problem situations. They can link different information sources and representations and flexibly translate amongthem. Students at this level are capable of advanced mathematical thinking and reasoning. These students can apply thisinsight and understanding along with a mastery of symbolic and formal mathematical operations and relationships todevelop new approaches and strategies for attacking novel situations. Students at this level can formulate and preciselycommunicate their actions and reflections regarding their findings, interpretations, arguments, and the appropriatenessof these to the original situations.
Level 5 (score from 607 to 668)
At Level 5 students can develop and work with models for complex situations, identifying constraints and specifyingassumptions. They can select, compare, and evaluate appropriate problem solving strategies for dealing with complexproblems related to these models. Students at this level can work strategically using broad, well-developed thinking andreasoning skills, appropriate linked representations, symbolic and formal characterisations, and insight pertaining tothese situations. They can reflect on their actions and formulate and communicate their interpretations and reasoning.
Level 4 (score from 545 to 606)
At Level 4 students can work effectively with explicit models for complex concrete situations that may involve constraintsor call for making assumptions. They can select and integrate different representations, including symbolic ones, linkingthem directly to aspects of real-world situations. Students at this level can utilise well-developed skills and reasonflexibly, with some insight, in these contexts. They can construct and communicate explanations and arguments basedon their interpretations, arguments, and actions.
Level 3 (score from 483 to 544)
At Level 3 students can execute clearly described procedures, including those that require sequential decisions. Theycan select and apply simple problem-solving strategies. Students at this level can interpret and use representations basedon different information sources and reason directly from them. They can develop short communications reporting theirinterpretations, results, and reasoning.
Level 2 (score from 421 to 482)
At Level 2 students can interpret and recognise situations in contexts that require no more than direct inference. They canextract relevant information from a single source and make use of a single representational mode. Students at this levelcan employ basic algorithms, formulae, procedures, or conventions. They are capable of direct reasoning and of makingliteral interpretations of the results.
Level 1 (score from 359 to 420)
At Level 1 students can answer questions involving familiar contexts where all relevant information is present and thequestions are clearly defined. They are able to identify information and to carry out routine procedures according todirect instructions in explicit situations. They can perform actions that are obvious and follow immediately from thegiven stimuli.
24
Chapter 1 / The performance of Canadian students in mathematics in an international context
Figure 1.6
Percentage of students at each level of proficiency on the combined mathematics scale
FinlandAlberta
British ColumbiaKorea
OntarioCanada
Hong Kong-ChinaNetherlands
ManitobaQuebec
Macao-ChinaLiechtenstein
Newfoundland and LabradorJapan
Nova ScotiaSaskatchewan
New BrunswickAustralia
SwitzerlandIceland
New ZealandDenmarkBelgium
Czech RepublicFranceIreland
SwedenPrince Edward Island
AustriaSlovak Republic
NorwayGermany
LuxembourgPoland
SpainHungary
LatviaUnited States
PortugalRussian Federation
ItalyGreece
Serbia and Montenegro (Ser.)Uruguay
TurkeyThailand
MexicoBrazil
TunisiaIndonesia
400 20 60 80 10020406080100
400 20 60 80 10020406080100
Level 1< level 1 Level 2 Level 3 Level 4 Level 5 Level 6

25
Measuring up: Canadian Results of the OECD PISA Study
Using these proficiency levels, students with veryhigh and very low levels of proficiency can be identified.Listed in Table 1.3 are the percentages of students whoperformed at Level 1 or below and the percentages ofstudents who performed at Level 5 or above for eachcountry and the ten provinces.
The lower group includes students who would havegreat difficulty continuing studies in mathematics andin daily life activities involving the application ofmathematics skills. In contrast, the students in the uppergroup are likely to be well qualified to do so.
Compared to the OECD average, a significantlysmaller proportion of Canadian students performed atLevel 1 or below in mathematics. The Canadianproportion at Level 1 or below was approximately halfthe proportion of the OECD average (10% versus 21%respectively). Only Finland had a significantly smallerproportion of students at Level 1 or below than Canada.
In contrast, a significantly higher proportion ofCanadian students performed at Level 5 or above inmathematics. The OECD average was approximately15%, five percentage points lower than the average forCanada. Four countries (Hong Kong-China, Belgium,Liechtenstein and the Netherlands) had significantlygreater percentages of students with higher skills thanCanada.
Turning to the provinces, the percentages ofstudents who performed at Level 1 or below on thecombined mathematics scale were, with the exceptionof New Brunswick and Prince Edward Island, similar tothe percentage for Canada. The percentages of studentsin New Brunswick performing at Level 1 or below (14%)were significantly higher than the Canadian percentageperforming at Level 1 or below but lower than thepercentage observed for the OECD average. Thepercentages of students in Prince Edward Islandperforming at Level 1 or below (18%) were significantlyhigher than the Canadian percentage performing at Level1 or below and statistically the same as the percentageobserved for the OECD average.
The proportion of students in Alberta at Level 5or above (27%) was significantly greater than theCanadian percentage (20%). The proportion of studentsin Quebec, British Columbia, Manitoba, and Ontariowho performed at Levels 5 or higher were comparableto the proportion for Canada.
Lower percentages of students in Newfoundlandand Labrador, Prince Edward Island, Nova Scotia, NewBrunswick and Saskatchewan performed at Level 5 orabove compared to the Canadian percentage (Table 1.3).However, with the exception of Prince Edward Island,the provincial percentages were statistically the same asthe OECD average.

26
Chapter 1 / The performance of Canadian students in mathematics in an international context
Table 1.3
Percentage of students with high level skills in mathematics and low levelskills in mathematics, by country and province
Percentage of students with low level skills (Level 1 or below) Percentage of students with high level skills (Level 5 or above)
Country and province % Country and province %
Finland 7Alberta 7British Columbia 9Korea 10Ontario 10Canada 10Hong Kong-China 10Manitoba 11Quebec 11Netherlands 11Macao-China 11Liechtenstein 12Newfoundland and Labrador 13Japan 13Nova Scotia 14Saskatchewan 14Australia 14New Brunswick 14Switzerland 15Iceland 15New Zealand 15Denmark 15Belgium 16Czech Republic 17France 17Ireland 17Sweden 17Prince Edward Island 18Austria 19Slovak Republic 20OECD average 21Norway 21Germany 22Luxembourg 22Poland 22Spain 23Hungary 23Latvia 24United States 26Portugal 30Russian Federation 30Italy 32Greece 39Serbia and Montenegro (Ser.) 42Uruguay 48Turkey 52Thailand 54Mexico 66Brazil 75Tunisia 78Indonesia 78
Hong Kong-China 31Alberta 27Belgium 26Liechtenstein 26Netherlands 26Korea 25Japan 24Quebec 24Finland 23British Columbia 22Switzerland 21New Zealand 21Canada 20Australia 20Manitoba 19Macao-China 19Czech Republic 18Ontario 18Germany 16Denmark 16Sweden 16OECD average 15Iceland 15France 15Saskatchewan 15Nova Scotia 14Austria 14Newfoundland and Labrador 14New Brunswick 14Slovak Republic 13Norway 11Ireland 11Luxembourg 11Hungary 11Prince Edward Island 10United States 10Poland 10Latvia 8Spain 8Russian Federation 7Italy 7Turkey 5Portugal 5Greece 4Uruguay 3Serbia and Montenegro (Ser.) 2Thailand 2Brazil 1Mexico 0Indonesia 0Tunisia 0
Percentage significantly higherthan the Canadian percentage
Percentage significantly lowerthan the Canadian percentage
Percentage not significantly differentfrom the Canadian percentage

27
Measuring up: Canadian Results of the OECD PISA Study
Provincial variation in mathematicsperformance
The performance of Canada and the provinces thatparticipated in PISA 2003 was first described in termsof the average performance. This is a measure of centraltendency around which the majority of students score.However, as just seen with the proficiency levels, thereis variability among the students, and the amount ofvariability differed by province. The amount of variabilitycan be assessed more directly by examining the varianceof the scores. The concept of variance is described inmore detail in text box ‘A note on variation’. What isimportant to note here is that the greater the variance,the more variable the performance of the students. Whenthe variance has a small value, there is small variation inperformance and the scores of the students are similar.Conversely, when the variance has a large value, there ismore variation in performance and the scores of thestudents differ more widely.
A note on variation
When looking at a group of students on acharacteristic such as mathematics performance, it isobvious that not all students have the same test score.In fact, very few people have the same scores.Furthermore, the differences among scores are greaterin some populations than in other populations. Onestatistic used to summarize and describe thedifferences between members of a population is calledvariance.
The statistical estimate of variance describesthe average squared difference between each person’sscore and the average score. A small estimate ofvariance indicates that members of the populationtend to be similar, while a large estimate of varianceindicates that members of populations tend to bedifferent from each other. Sometimes the termstandard deviation is also used to describe differencebetween people in a population. The standarddeviation is the square root of the variance.
Figure 1.7 shows how much variance there was instudent performance in each province relative to thevariance in performance for Canada as a whole. Theprovinces can be divided into three groups based onwhether they have more, the same, or less variation instudent performance than Canada as a whole.
The first group contains just Quebec, which hadthe greatest variance among the students’ combinedmathematics score. The second group contains theprovinces with variance similar in value to the variancefor Canada: Manitoba, Alberta, Saskatchewan, NewBrunswick and Prince Edward Island. The third groupcontains the provinces in which the variance of thestudents’ scores was less than the variance for Canada:British Columbia, Nova Scotia, Ontario, andNewfoundland and Labrador.
There was not a clear relationship between the rankof provinces based on average performance on thecombined mathematics and in the variance of the scores.For example, the performance of students in Alberta andQuebec was above average. However, while the varianceamong the student scores in Quebec was above thevariance for Canada, the variance among student scoresin Alberta was the same as the variance for Canada.While British Columbia also had above averageperformance in mathematics, the variance among thescores was below the variance for Canada.
Figure 1.7
Variance in mathematics performance:combined mathematics scale
Percent Less Variable thanCanada Overall
Percent More Variable thanCanada Overall
Quebec
Manitoba
Alberta
Saskatchewan
New Brunswick
Prince Edward Island
British Columbia
Nova Scotia
Ontario
Newfoundland and Labrador
15 1510 105 50%
28
Chapter 1 / The performance of Canadian students in mathematics in an international context
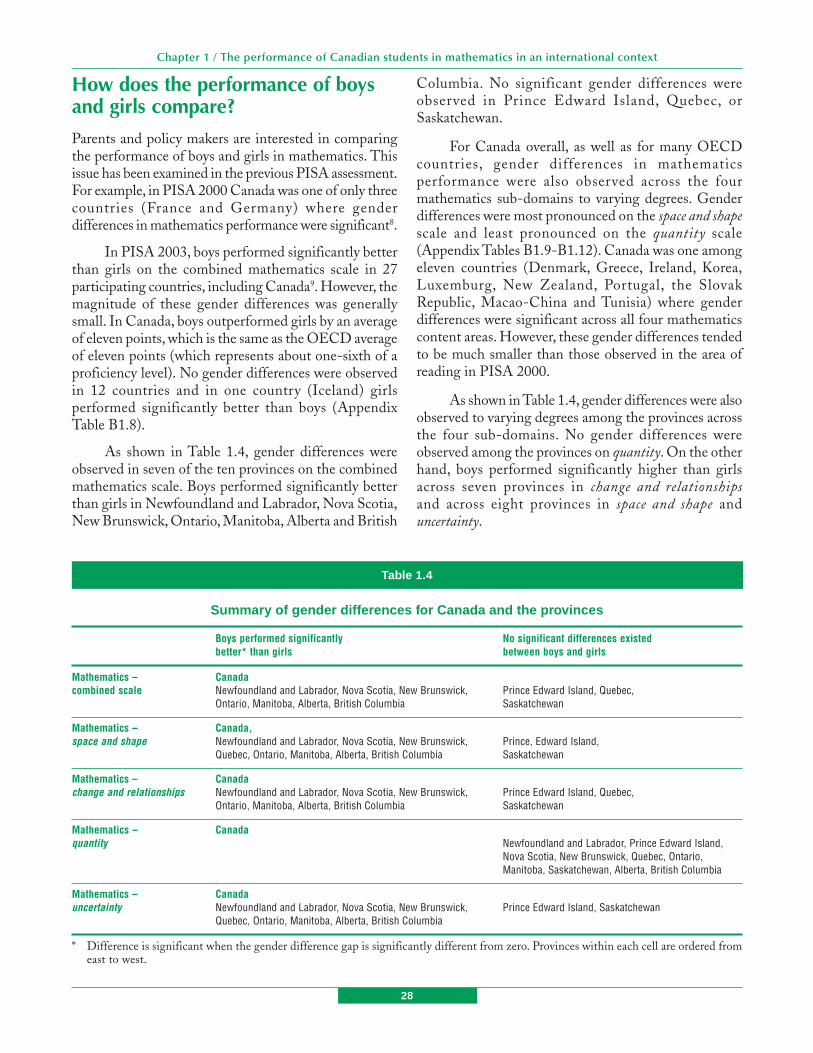
How does the performance of boysand girls compare?
Parents and policy makers are interested in comparingthe performance of boys and girls in mathematics. Thisissue has been examined in the previous PISA assessment.For example, in PISA 2000 Canada was one of only threecountries (France and Germany) where genderdifferences in mathematics performance were significant8.
In PISA 2003, boys performed significantly betterthan girls on the combined mathematics scale in 27participating countries, including Canada9. However, themagnitude of these gender differences was generallysmall. In Canada, boys outperformed girls by an averageof eleven points, which is the same as the OECD averageof eleven points (which represents about one-sixth of aproficiency level). No gender differences were observedin 12 countries and in one country (Iceland) girlsperformed significantly better than boys (AppendixTable B1.8).
As shown in Table 1.4, gender differences wereobserved in seven of the ten provinces on the combinedmathematics scale. Boys performed significantly betterthan girls in Newfoundland and Labrador, Nova Scotia,New Brunswick, Ontario, Manitoba, Alberta and British
Columbia. No significant gender differences wereobserved in Prince Edward Island, Quebec, orSaskatchewan.
For Canada overall, as well as for many OECDcountries, gender differences in mathematicsperformance were also observed across the fourmathematics sub-domains to varying degrees. Genderdifferences were most pronounced on the space and shapescale and least pronounced on the quantity scale(Appendix Tables B1.9-B1.12). Canada was one amongeleven countries (Denmark, Greece, Ireland, Korea,Luxemburg, New Zealand, Portugal, the SlovakRepublic, Macao-China and Tunisia) where genderdifferences were significant across all four mathematicscontent areas. However, these gender differences tendedto be much smaller than those observed in the area ofreading in PISA 2000.
As shown in Table 1.4, gender differences were alsoobserved to varying degrees among the provinces acrossthe four sub-domains. No gender differences wereobserved among the provinces on quantity. On the otherhand, boys performed significantly higher than girlsacross seven provinces in change and relationshipsand across eight provinces in space and shape anduncertainty.
Table 1.4
Summary of gender differences for Canada and the provinces
Boys performed significantly No significant differences existedbetter* than girls between boys and girls
Mathematics – Canadacombined scale Newfoundland and Labrador, Nova Scotia, New Brunswick, Prince Edward Island, Quebec,
Ontario, Manitoba, Alberta, British Columbia Saskatchewan
Mathematics – Canada,space and shape Newfoundland and Labrador, Nova Scotia, New Brunswick, Prince, Edward Island,
Quebec, Ontario, Manitoba, Alberta, British Columbia Saskatchewan
Mathematics – Canadachange and relationships Newfoundland and Labrador, Nova Scotia, New Brunswick, Prince Edward Island, Quebec,
Ontario, Manitoba, Alberta, British Columbia Saskatchewan
Mathematics – Canadaquantity Newfoundland and Labrador, Prince Edward Island,
Nova Scotia, New Brunswick, Quebec, Ontario,Manitoba, Saskatchewan, Alberta, British Columbia
Mathematics – Canadauncertainty Newfoundland and Labrador, Nova Scotia, New Brunswick, Prince Edward Island, Saskatchewan
Quebec, Ontario, Manitoba, Alberta, British Columbia
* Difference is significant when the gender difference gap is significantly different from zero. Provinces within each cell are ordered fromeast to west.

29
Measuring up: Canadian Results of the OECD PISA Study
Achievement of Canadian students bylanguage of the school system
This section examines the mathematics performance ofstudents in the French-language and English-languageschool systems for the five Canadian provinces in whichthese populations were separately sampled. The focus ison the performance of the minority group (students inFrench-language school systems in Nova Scotia, NewBrunswick, Ontario, and Manitoba, and on students inthe English-language school system in Quebec) relativeto the majority group.
Results from PISA 2000 found that, formathematics, only Ontario had significant differencesbetween the two school systems, with results favouringthe English-language school system. The PISA 2003
data confirm this finding (Table 1.5). Students in theEnglish-language school system in Ontariooutperformed students in the French-language schoolsystem by 26 points on the combined scale. No significantdifferences in combined mathematics performance wereobserved between the two school systems in Nova Scotia,New Brunswick, Quebec, and Manitoba.
With respect to mathematics performance in thefour mathematics sub-domains, significant differencesfavouring the English-language school system wereobserved in Ontario across all mathematics sub-domains.Significant differences favouring the English-languageschool system were also observed in the change andrelationships sub-domain in Nova Scotia and NewBrunswick and in the uncertainty sub-domain in NewBrunswick.
Table 1.5
Estimated average mathematics scores by province and language of the school system
English-language school system French-language school system
Estimated 95% Estimated 95%average score confidence interval average score confidence interval
Mathematics – combinedNova Scotia 515 511-519 500 486-514New Brunswick 514 511-517 505 499-511Quebec 541 531-551 536 526-546Ontario 531 524-538 505 496-514Manitoba 528 522-534 522 511-533
Mathematics – space and shapeNova Scotia 498 493-503 485 468-502New Brunswick 498 494-502 495 489-501Quebec 526 516-536 528 519-537Ontario 513 506-520 491 481-501Manitoba 513 506-520 509 495-523
Mathematics – change and relationshipsNova Scotia 518 513-523 497 482-512New Brunswick 516 513-519 505 499-511Quebec 543 532-554 536 526-546Ontario 537 529-545 505 496-514Manitoba 532 526-538 522 510-534
Mathematics – quantityNova Scotia 511 506-516 495 479-511New Brunswick 509 505-513 500 494-506Quebec 535 524-546 530 520-540Ontario 527 519-535 500 491-509Manitoba 523 517-529 516 504-528
Mathematics – uncertaintyNova Scotia 528 524-532 514 500-528New Brunswick 527 524-530 514 508-520Quebec 547 537-557 541 531-551Ontario 541 534-548 512 504-520Manitoba 538 532-544 531 520-542
Note: Statistically significant differences are in bold.
30
Chapter 1 / The performance of Canadian students in mathematics in an international context
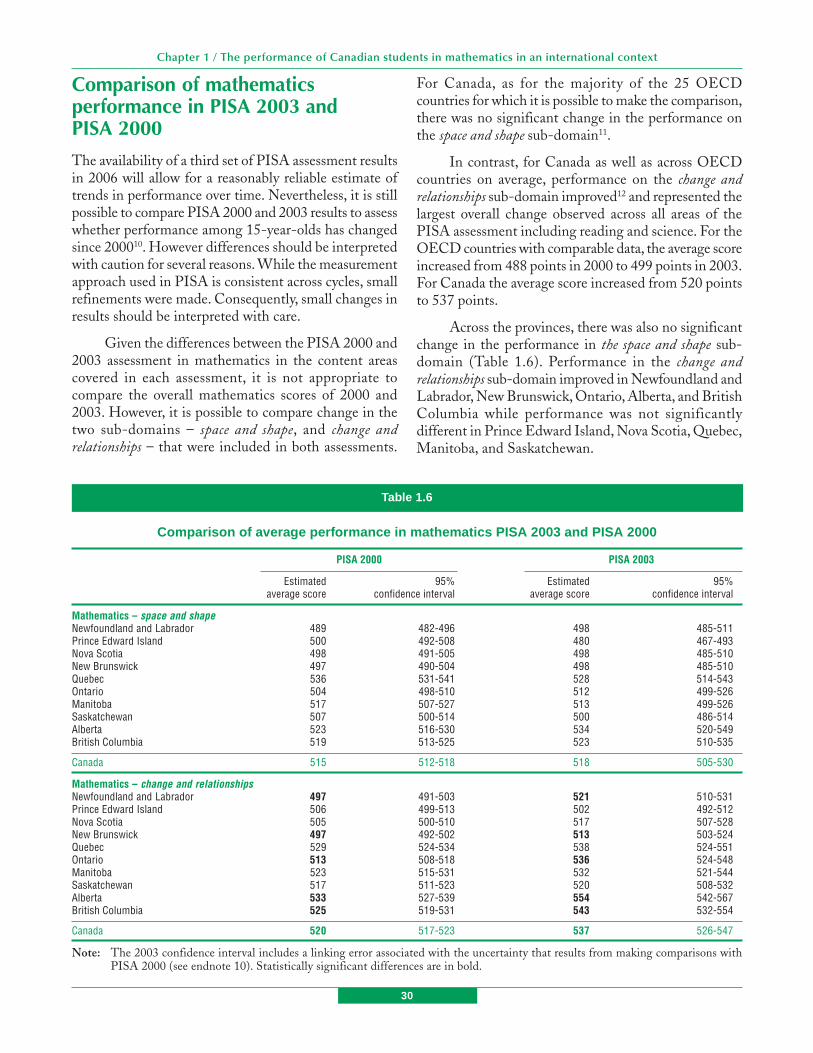
Comparison of mathematicsperformance in PISA 2003 andPISA 2000
The availability of a third set of PISA assessment resultsin 2006 will allow for a reasonably reliable estimate oftrends in performance over time. Nevertheless, it is stillpossible to compare PISA 2000 and 2003 results to assesswhether performance among 15-year-olds has changedsince 200010. However differences should be interpretedwith caution for several reasons. While the measurementapproach used in PISA is consistent across cycles, smallrefinements were made. Consequently, small changes inresults should be interpreted with care.
Given the differences between the PISA 2000 and2003 assessment in mathematics in the content areascovered in each assessment, it is not appropriate tocompare the overall mathematics scores of 2000 and2003. However, it is possible to compare change in thetwo sub-domains – space and shape, and change andrelationships – that were included in both assessments.
For Canada, as for the majority of the 25 OECDcountries for which it is possible to make the comparison,there was no significant change in the performance onthe space and shape sub-domain11.
In contrast, for Canada as well as across OECDcountries on average, performance on the change andrelationships sub-domain improved12 and represented thelargest overall change observed across all areas of thePISA assessment including reading and science. For theOECD countries with comparable data, the average scoreincreased from 488 points in 2000 to 499 points in 2003.For Canada the average score increased from 520 pointsto 537 points.
Across the provinces, there was also no significantchange in the performance in the space and shape sub-domain (Table 1.6). Performance in the change andrelationships sub-domain improved in Newfoundland andLabrador, New Brunswick, Ontario, Alberta, and BritishColumbia while performance was not significantlydifferent in Prince Edward Island, Nova Scotia, Quebec,Manitoba, and Saskatchewan.
Table 1.6
Comparison of average performance in mathematics PISA 2003 and PISA 2000
PISA 2000 PISA 2003
Estimated 95% Estimated 95%average score confidence interval average score confidence interval
Mathematics – space and shapeNewfoundland and Labrador 489 482-496 498 485-511Prince Edward Island 500 492-508 480 467-493Nova Scotia 498 491-505 498 485-510New Brunswick 497 490-504 498 485-510Quebec 536 531-541 528 514-543Ontario 504 498-510 512 499-526Manitoba 517 507-527 513 499-526Saskatchewan 507 500-514 500 486-514Alberta 523 516-530 534 520-549British Columbia 519 513-525 523 510-535
Canada 515 512-518 518 505-530
Mathematics – change and relationshipsNewfoundland and Labrador 497 491-503 521 510-531Prince Edward Island 506 499-513 502 492-512Nova Scotia 505 500-510 517 507-528New Brunswick 497 492-502 513 503-524Quebec 529 524-534 538 524-551Ontario 513 508-518 536 524-548Manitoba 523 515-531 532 521-544Saskatchewan 517 511-523 520 508-532Alberta 533 527-539 554 542-567British Columbia 525 519-531 543 532-554
Canada 520 517-523 537 526-547
Note: The 2003 confidence interval includes a linking error associated with the uncertainty that results from making comparisons withPISA 2000 (see endnote 10). Statistically significant differences are in bold.
31
Measuring up: Canadian Results of the OECD PISA Study
Summary
In an increasingly technical world, mathematics is keyto many areas of activity both inside and outside of school.Canada’s performance in PISA 2003 suggests that, onthe whole, Canadian 15-year-olds will have the skillsand knowledge to participate in today’s knowledge-basedeconomy and will have a strong foundation upon whichto continue with learning throughout life. However, whileCanada’s performance in PISA overall was good, theexistence of disparities among provinces, and disparitiesamong some students within some provinces warrantsfurther analysis.
While the comparative approach taken in thischapter does not lend itself to developing explanationsfor these disparities, the PISA dataset along with otherdata available will allow an in-depth exploration of howresources, schools and classroom conditions, as well asindividual and family circumstances, affect variation inachievement.
Factors that influence mathematics performanceare complex and varied and these detailed relationshipsshould be the focus of future research using the PISAdata. However, two themes related to mathematicsperformance will be explored in Chapter 3 and 4 of thisreport.
Notes6. The OECD average for the combined mathematics score was
established with the data weighted so that each OECD countrycontributed equally. As the anchoring of the scale was done forthe combination of the four sub-domain scales, the averagemean and standard deviation for the sub-domain scales differfrom 500 and 100 score points.
7. OECD (2004), Learning for Tomorrow’s World – First resultsfrom PISA 2003, Paris.
8. It should be noted, however, that only two mathematics contentareas were included in the 2000 assessment. The fact that genderdifferences were not observable does not mean that they donot exist in other countries but rather that the PISA 2000 designmay not have been sensitive enough to detect them reliably.
9. OECD (2004), Learning for Tomorrow’s World – First resultsfrom PISA 2003, Paris.
10. Please refer to Annex A8 of the OECD (2004) Learning forTomorrow’s World – First results from PISA 2003 for anexplanation of the methods used to establish the link betweenthe PISA 2000 and 2003 assessment.
11. OECD (2004), Learning for Tomorrow’s World – First resultsfrom PISA 2003, Paris.
12. OECD (2004), Learning for Tomorrow’s World – First resultsfrom PISA 2003, Paris.

© SchoolNet, Industry Canada
© SchoolNet, Industry Canada
33
Measuring up: Canadian Results of the OECD PISA Study
This chapter presents the overall results of the PISA 2003assessments in the minor domains of reading, scienceand problem solving. Assessment in these minor domainswas not as detailed as the mathematics assessment, whichwas the major focus of PISA 2003. Consequently, thischapter focuses on providing an update on overallperformance in these three domains. First, the averageperformance of Canadian 15-year-old students iscompared to the performance of 15-year-old studentsfrom countries that participated in PISA 2003. Second,students’ performance in the ten Canadian provinces arepresented and discussed. Third, this is followed by acomparison between the performance of boys and girlsin Canada and the provinces. Fourth, the performanceof students enrolled in English-language and French-language school systems are compared for the fiveprovinces in which the two groups were separatelysampled. Lastly, the results of PISA 2003 are comparedwith those of PISA 2000 for reading and science. Asimilar comparison is not possible for problem solvingsince this area was assessed for the first time in 2003.
Defining reading, science andproblem solving
Both reading and science were minor domains in PISA2003. On the other hand, reading was the major domainof PISA 2000 while science will be the major domain in
PISA 2006. Additionally, problem solving, a new minorassessment domain in PISA 2003, was introduced tocomplement the assessment of the more academicdomains. Reading, science and problem solving weredefined as follows by international experts who agreedthat the emphasis should be placed on functionalknowledge and skills that allow active participation insociety.
Reading literacy (hereafter referred to as reading):
An individual’s capacity to understand, use and reflecton written texts in order to achieve one’s goals, todevelop one’s knowledge and potential, and toparticipate in society;
Scientific literacy (hereafter referred to as science):
An individual’s capacity to use scientific knowledge,to identify questions, and to draw evidence-basedconclusions in order to understand and help makedecisions about the natural world and the changesmade to it through human activity;
Problem-solving skills (hereafter referred to as problemsolving):
An individual’s capacity to use cognitive processesto confront and resolve real, cross-disciplinarysituations where the solution path is not immediatelyobvious and where the literacy domains or curricular
Chapter 2
The performance of Canadianstudents in reading, scienceand problem solving in aninternational context
34
Chapter 2 / The performance of Canadian students in reading, science and problem solving in an international context
areas that might be applicable are not within a singledomain of mathematics, science, or reading.
For PISA, the scores for reading13, science, andproblem solving are expressed on a scale with an averageor mean of 500 points and a standard deviation of 100.Approximately two-thirds of the students scored between400 and 600 (i.e. within one standard deviation of theaverage) for the OECD countries.
Canadian students performed well inreading, science and problem solving
One way to summarize student performance, and tocompare the relative standing of countries is by examiningtheir average test scores. However, simply ranking
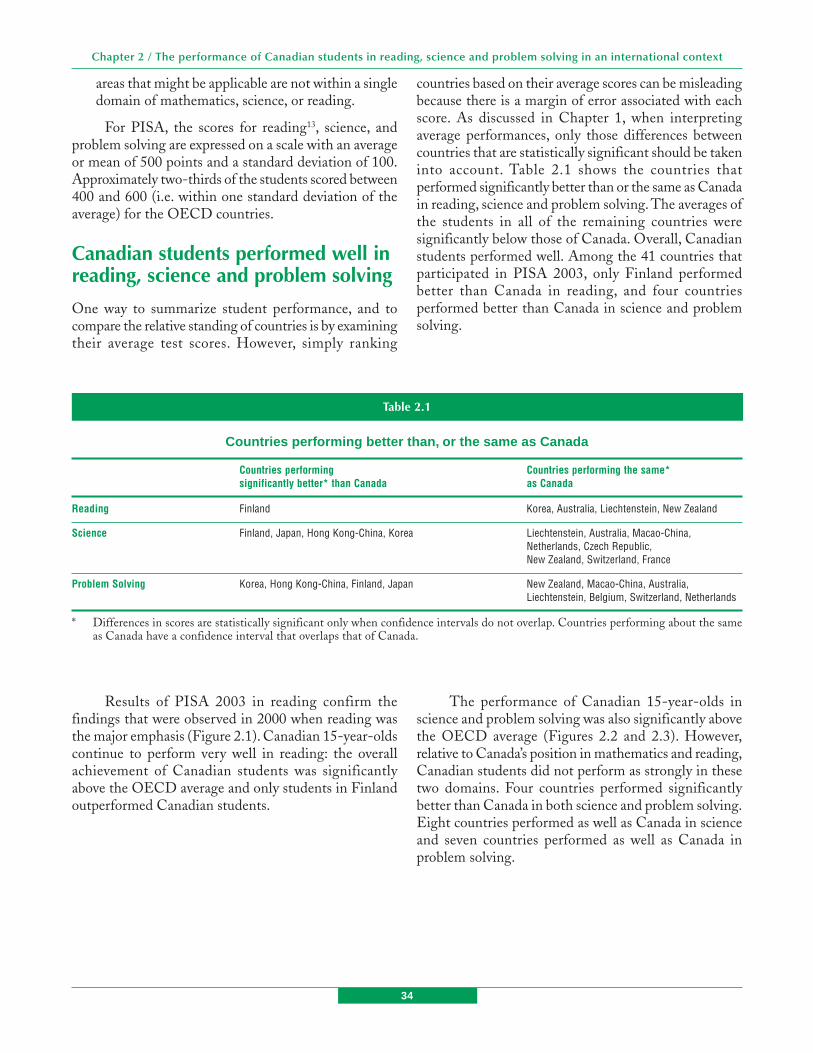
countries based on their average scores can be misleadingbecause there is a margin of error associated with eachscore. As discussed in Chapter 1, when interpretingaverage performances, only those differences betweencountries that are statistically significant should be takeninto account. Table 2.1 shows the countries thatperformed significantly better than or the same as Canadain reading, science and problem solving. The averages ofthe students in all of the remaining countries weresignificantly below those of Canada. Overall, Canadianstudents performed well. Among the 41 countries thatparticipated in PISA 2003, only Finland performedbetter than Canada in reading, and four countriesperformed better than Canada in science and problemsolving.
Table 2.1
Countries performing better than, or the same as Canada
Countries performing Countries performing the same*significantly better* than Canada as Canada
Reading Finland Korea, Australia, Liechtenstein, New Zealand
Science Finland, Japan, Hong Kong-China, Korea Liechtenstein, Australia, Macao-China,Netherlands, Czech Republic,New Zealand, Switzerland, France
Problem Solving Korea, Hong Kong-China, Finland, Japan New Zealand, Macao-China, Australia,Liechtenstein, Belgium, Switzerland, Netherlands
* Differences in scores are statistically significant only when confidence intervals do not overlap. Countries performing about the sameas Canada have a confidence interval that overlaps that of Canada.
Results of PISA 2003 in reading confirm thefindings that were observed in 2000 when reading wasthe major emphasis (Figure 2.1). Canadian 15-year-oldscontinue to perform very well in reading: the overallachievement of Canadian students was significantlyabove the OECD average and only students in Finlandoutperformed Canadian students.
The performance of Canadian 15-year-olds inscience and problem solving was also significantly abovethe OECD average (Figures 2.2 and 2.3). However,relative to Canada’s position in mathematics and reading,Canadian students did not perform as strongly in thesetwo domains. Four countries performed significantlybetter than Canada in both science and problem solving.Eight countries performed as well as Canada in scienceand seven countries performed as well as Canada inproblem solving.

35
Measuring up: Canadian Results of the OECD PISA Study
Figure 2.1
Estimated average scores and confidence intervals for provincesand countries: READING
Estimated average score
Note: The reading results for 2003 are based on the reading literacy proficiency scale that was developed for PISA 2000 which had a meanof 500 for the 27 countries that participated in PISA 2000. However, because three additional OECD countries are included in thePISA 2003 reading test, the overall OECD mean for PISA 2003 is 494 with a standard error of 0.6.
360 510 560460410 610
Hong Kong-China
Brazil
Tunisia
Finland
QuebecCANADA
Belgium
Liechtenstein
Ontario
Macao-China
France
Iceland
Alberta
Korea
Netherlands
New Brunswick
Indonesia
Ireland
Austria
Luxembourg
Hungary
Thailand
Mexico
Portugal
Spain
Russian Federation
Italy
Serbia and Montenegro (Ser.)
Greece
Uruguay
95% Confidence interval
Estimated average score
Switzerland
Slovak Republic
Nova Scotia
Sweden
Saskatchewan
Czech Republic
Japan
Norway
Poland
United States
Denmark
Latvia
Germany
British Columbia
Newfoundland and Labrador
Australia
New Zealand
Manitoba
Prince Edward Island
Turkey

36
Chapter 2 / The performance of Canadian students in reading, science and problem solving in an international context
Figure 2.2
Estimated average scores and confidence intervals for provincesand countries: SCIENCE
Note: The OECD mean is 500 with a standard error of 0.6.
360 410
95% Confidence interval
Estimated average score
BrazilTunisia
Iceland
Indonesia
Austria
Luxembourg
Hungary
TurkeyThailand
Mexico
Portugal
SpainPrince Edward Island
Russian Federation
Italy
Serbia and Montenegro (Ser.)
Greece
Uruguay
Slovak Republic
Czech Republic
Latvia
Germany
Estimated average score
510 560460 610
Quebec
Liechtenstein
Ontario
AlbertaKorea
Ireland
SwedenSaskatchewan
Newfoundland and Labrador
Australia
New Zealand
Manitoba
Hong Kong-China
Belgium
Macao-China
France
Netherlands
New Brunswick
Switzerland
Nova Scotia
Japan
Norway
Poland
United States
Denmark
British Columbia
CANADA
Finland
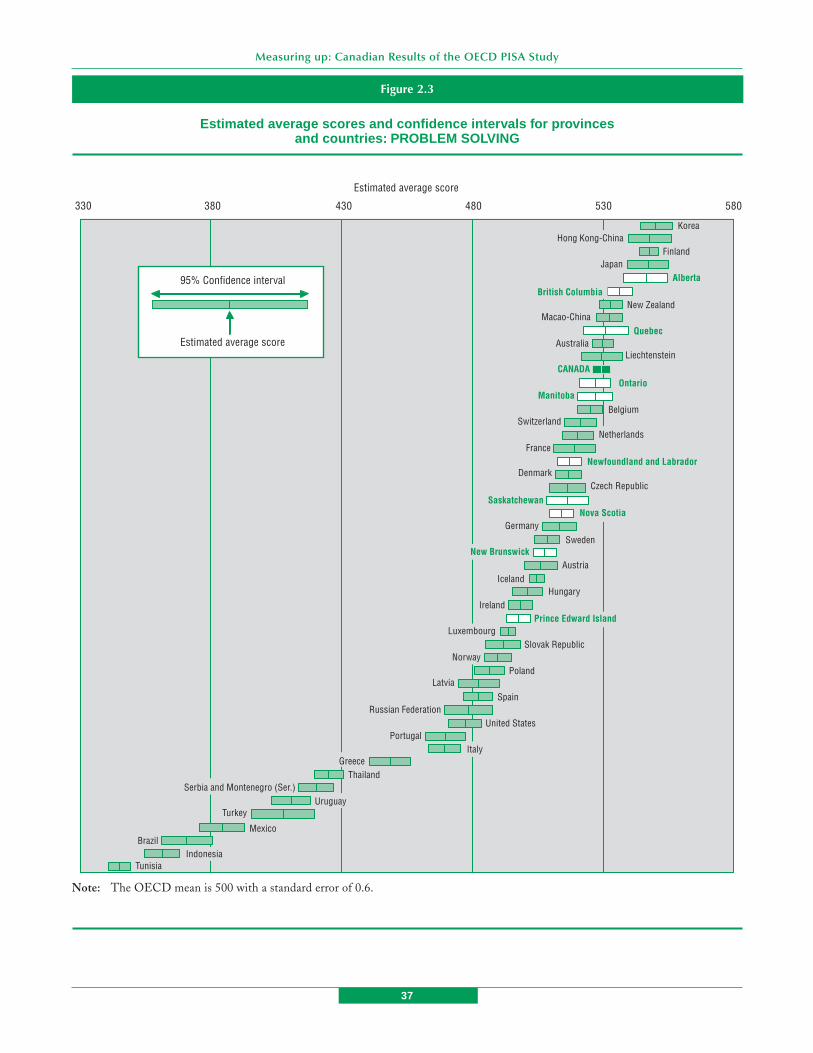
37
Measuring up: Canadian Results of the OECD PISA Study
Figure 2.3
Estimated average scores and confidence intervals for provincesand countries: PROBLEM SOLVING
Note: The OECD mean is 500 with a standard error of 0.6.
330 380
95% Confidence interval
Estimated average score
Brazil
Tunisia
IcelandAustria
Hungary
Turkey
Thailand
Mexico
Portugal
SpainRussian Federation
Serbia and Montenegro (Ser.)
Greece
Slovak Republic
Latvia
Estimated average score
480 530430 580
Quebec
Liechtenstein
Ontario
Alberta
Korea
Ireland
Sweden
Australia
New Zealand
Manitoba
Hong Kong-China
Belgium
Macao-China
Netherlands
New Brunswick
Nova Scotia
Japan
NorwayPoland
United States
British Columbia
CANADA
Finland
Luxembourg
Newfoundland and Labrador
Saskatchewan
France
Switzerland
Denmark
Germany
Uruguay
Italy
Indonesia
Czech Republic
Prince Edward Island

38
Chapter 2 / The performance of Canadian students in reading, science and problem solving in an international context
Provincial results
Across the three minor domains of PISA 2003 theperformance of students in all provinces was, with a fewexceptions, above the OECD average. Students in NewBrunswick, Nova Scotia and Saskatchewan performedat the OECD average in science while students in PrinceEdward Island performed at the OECD average inreading and problem solving and below the OECDaverage in science.
As shown in Table 2.2, students in Albertaperformed above the Canadian average in all the minordomains while students in Quebec, Ontario, Manitobaand British Columbia performed at the Canadian averagein all the minor domains. Students in Newfoundlandand Labrador performed at the Canadian average inreading and science, but below the average in problemsolving. Students in Prince Edward Island, NewBrunswick, Nova Scotia and Saskatchewan performedbelow the Canadian average in all minor domains.
Table 2.2
Provincial results in reading, science and problem solving in relation to the Canadian average
Provinces performing Provinces performing Provinces performingsignificantly better* than the same* as the significantly lower* thanthe Canadian average Canadian average the Canadian average
Reading Alberta Newfoundland and Labrador, Prince Edward Island,Quebec, Ontario, Manitoba, Nova Scotia, New Brunswick,British Columbia Saskatchewan
Science Alberta Newfoundland and Labrador, Prince Edward Island,Quebec, Ontario, Manitoba, Nova Scotia, New Brunswick,British Columbia Saskatchewan
Problem Solving Alberta Quebec, Ontario, Manitoba, Newfoundland and Labrador,British Columbia Prince Edward Island,
Nova Scotia, New Brunswick,Saskatchewan
* Differences in scores are statistically significant only when confidence intervals do not overlap. Provinces performing about the same asCanada as a whole have a confidence interval that overlaps that of Canada. Provinces within each cell are ordered east to west.
How does the performance of boysand girls compare?
Table 2.3 summarizes the gender differences for PISA2003 in reading, science, and problem solving. As wasthe case in PISA 2000, in PISA 2003 girls performedsignificantly better than boys on the reading test in allbut one country14 and in all provinces (Appendix tablesB2.4-B2.6). The gap between girls and boys in readingwas much larger than the gap between boys and girls inmathematics. In Canada, while boys outperformed girlsby eleven points in mathematics, girls outperformed boysby 32 points in reading.
In PISA 2000, no significant gender differenceswere observed between boys and girls in any country orany province on the science test. In PISA 2003, in Canadaas well as eleven other countries, boys performedsignificantly better than girls on the science test15.However, as with mathematics, the gap was small at sixpoints in Canada and six points at the OECD average.At the provincial level, boys outperformed girls inManitoba, Nova Scotia, and Ontario16.
For problem solving, girls outperformed boys insix countries. No significant gender differences wereobserved in Canada. At the provincial level, girlsoutperformed boys in Prince Edward Island andSaskatchewan17.

39
Measuring up: Canadian Results of the OECD PISA Study
Achievement of Canadian students bylanguage of the school system
This section examines the performance of students inthe English-language and French-language schoolsystems for the five Canadian provinces that sampledthese population groups separately. The focus is on theperformance of the minority group (students in French-language school systems in Nova Scotia, New Brunswick,Ontario and Manitoba and students in the English-language school system in Quebec) relative to themajority.
A comparison of PISA results within each of thesefive provinces is given in Table 2.4. As was the case inPISA 2000, students enrolled in the French-languageschool systems in Nova Scotia, New Brunswick, Ontarioand Manitoba performed significantly lower in bothreading and science than did students in the English-language system in the same provinces. In Quebec,student performance in reading, and science did not differbetween the English-language and French-languageschool systems.
For problem solving, there were significantdifferences favouring the English-language system inNova Scotia, New Brunswick, and Ontario, while nosignificant differences were observed in Quebec andManitoba.
Table 2.3
Summary of gender differences for Canada and the provinces
Girls performed Boys performedsignificantly higher* significantly higher* No significant differencesthan boys than girls between boys and girls
Reading Canada, All provinces
Science Canada, Nova Scotia, Newfoundland and Labrador,Ontario, Manitoba Prince Edward Island,
New Brunswick,Quebec, Saskatchewan,Alberta, British Columbia
Problem Solving Prince Edward Island, Canada,Saskatchewan Newfoundland and Labrador,
Nova Scotia, New Brunswick,Quebec, Ontario, Manitoba,Alberta, British Columbia
* Difference is significant when the gender difference gap is significantly different from zero. Provinces within each cell are ordered fromeast to west.
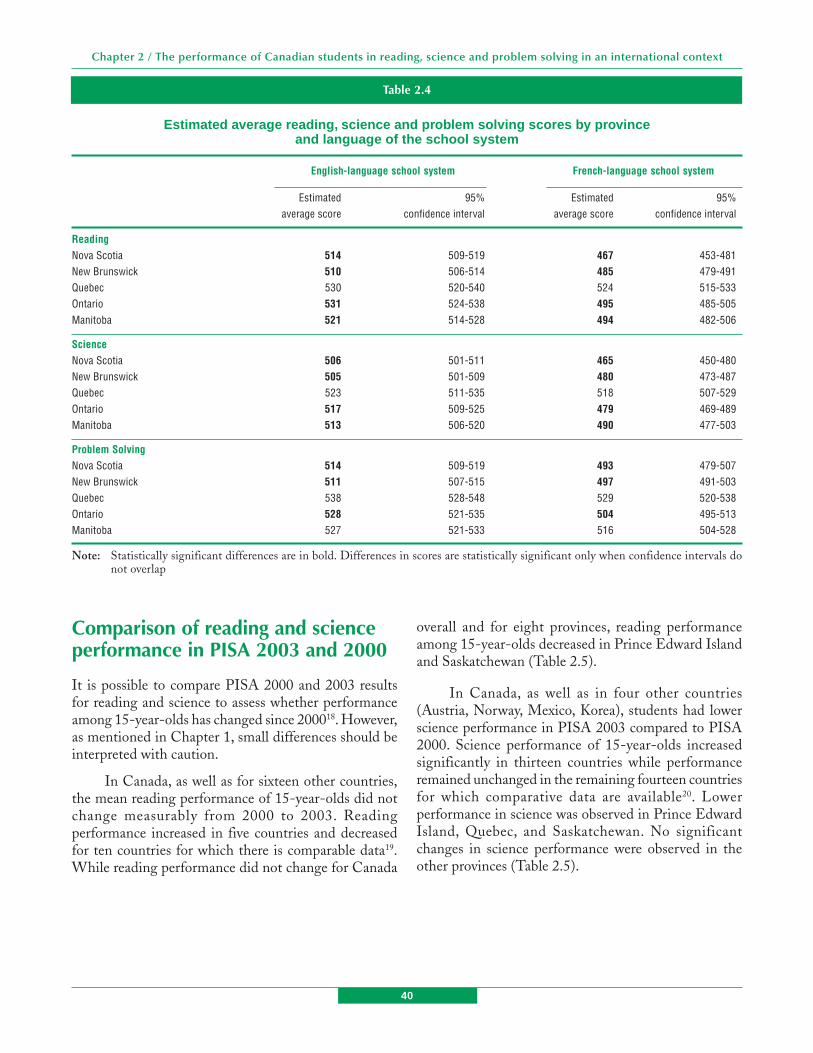
40
Chapter 2 / The performance of Canadian students in reading, science and problem solving in an international context
Table 2.4
Estimated average reading, science and problem solving scores by provinceand language of the school system
English-language school system French-language school system
Estimated 95% Estimated 95%average score confidence interval average score confidence interval
ReadingNova Scotia 514 509-519 467 453-481New Brunswick 510 506-514 485 479-491Quebec 530 520-540 524 515-533Ontario 531 524-538 495 485-505Manitoba 521 514-528 494 482-506
ScienceNova Scotia 506 501-511 465 450-480New Brunswick 505 501-509 480 473-487Quebec 523 511-535 518 507-529Ontario 517 509-525 479 469-489Manitoba 513 506-520 490 477-503
Problem SolvingNova Scotia 514 509-519 493 479-507New Brunswick 511 507-515 497 491-503Quebec 538 528-548 529 520-538Ontario 528 521-535 504 495-513Manitoba 527 521-533 516 504-528
Note: Statistically significant differences are in bold. Differences in scores are statistically significant only when confidence intervals donot overlap
Comparison of reading and scienceperformance in PISA 2003 and 2000
It is possible to compare PISA 2000 and 2003 resultsfor reading and science to assess whether performanceamong 15-year-olds has changed since 200018. However,as mentioned in Chapter 1, small differences should beinterpreted with caution.
In Canada, as well as for sixteen other countries,the mean reading performance of 15-year-olds did notchange measurably from 2000 to 2003. Readingperformance increased in five countries and decreasedfor ten countries for which there is comparable data19.While reading performance did not change for Canada
overall and for eight provinces, reading performanceamong 15-year-olds decreased in Prince Edward Islandand Saskatchewan (Table 2.5).
In Canada, as well as in four other countries(Austria, Norway, Mexico, Korea), students had lowerscience performance in PISA 2003 compared to PISA2000. Science performance of 15-year-olds increasedsignificantly in thirteen countries while performanceremained unchanged in the remaining fourteen countriesfor which comparative data are available20. Lowerperformance in science was observed in Prince EdwardIsland, Quebec, and Saskatchewan. No significantchanges in science performance were observed in theother provinces (Table 2.5).

41
Measuring up: Canadian Results of the OECD PISA Study
Summary
Because reading, science and problem solving wereconsidered to be minor domains in PISA 2003, a smallerproportion of students were assessed in those domainscompared to the mathematics assessment, which was themajor focus of the 2003 assessment. Additionally, asmaller number of items were included in each of theseassessments than were included in the mathematicsassessment. Consequently, this chapter focuses onproviding an update on overall performance in each ofthese domains.
PISA 2003 results confirmed the PISA 2000findings with respect to the performance of Canadianstudents in reading. Canadian 15-year-olds continue toperform very well in reading, being outperformed by
students in only Finland among a total of 41 countries.Canada also performed well in science and problemsolving, with four countries outperforming Canadianstudents in each of these two domains.
Although performing well overall in all skilldomains, the existence of disparities among provincesacross the domains warrants further analysis. Canada’srelative performance in science also warrants furtherinvestigation. Compared to Canada’s relative position inmathematics and reading, Canadian students fare lesswell in science. Additionally, Canada was only one offive countries that had lower science performance in 2003than in 2000. The next PISA assessment in 2006,focusing on science, will provide a more definitive profileof Canada’s performance in this domain.
Table 2.5
Comparison of estimated average performance in reading andscience PISA 2003 and PISA 2000
PISA 2000 PISA 2003
Estimated 95% Estimated 95%average score confidence interval average score confidence interval
ReadingNewfoundland and Labrador 517 512-522 521 511-531Prince Edward Island 517 512-522 495 486-503Nova Scotia 521 516-526 513 504-521New Brunswick 501 497-505 503 494-511Quebec 536 530-542 525 514-536Ontario 533 527-539 530 520-540Manitoba 529 522-536 520 511-530Saskatchewan 529 524-534 512 501-523Alberta 550 544-556 543 532-554British Columbia 538 532-544 535 526-544
Canada 534 531-537 528 520-536
ScienceNewfoundland and Labrador 516 509-523 514 506-522Prince Edward Island 508 503-513 489 481-497Nova Scotia 516 510-522 505 498-513New Brunswick 497 492-502 498 491-505Quebec 541 534-548 520 508-532Ontario 522 515-529 515 506-525Manitoba 527 520-534 512 503-522Saskatchewan 522 516-528 506 495-516Alberta 546 539-553 539 527-552British Columbia 533 527-539 527 519-535
Canada 529 526-532 519 512-526
Note: The 2003 confidence interval includes a linking error associated with the uncertainty that results from making comparisons withPISA 2000 (see endnote 18). Statistically significant differences are in bold. Due to rounding error, non-overlapping confidenceintervals in Science for Saskatchewan and Canada share an upper or lower limit.
42
Chapter 2 / The performance of Canadian students in reading, science and problem solving in an international context
Notes13. The reading results for 2003 are based on the reading scale
that was developed for PISA 2000 which had a mean averageof 500 and a standard deviation of 100 for the 27 OECDcountries that participated in PISA 2000. However, becausethree additional OECD countries are included in the PISA2003 reading test, the overall OECD average for reading forPISA 2003 is 494.
14. OECD (2004), Learning for Tomorrow’s World – First resultsfrom PISA 2003, Paris.
15. OECD (2004), Learning for Tomorrow’s World – First resultsfrom PISA 2003, Paris.
16. The fact that gender differences were not observable does notmean that they do not exist in other countries but rather thatthe PISA 2000 design was not sensitive enough to detect themreliably.
17. See footnote above.18. Please refer to Annex A8 of the OECD (2004) Learning for
Tomorrow’s World – First results from PISA 2003 for anexplanation of the methods used to establish the link betweenthe PISA 2000 and 2003 assessment.
19. OECD (2004), Learning for Tomorrow’s World – First resultsfrom PISA 2003, Paris.
20. OECD (2004), Learning for Tomorrow’s World – First resultsfrom PISA 2003, Paris.

43
MeasurMeasurMeasurMeasurMeasuring up:ing up:ing up:ing up:ing up: Canadian R Canadian R Canadian R Canadian R Canadian Results of the OECD PISA Studyesults of the OECD PISA Studyesults of the OECD PISA Studyesults of the OECD PISA Studyesults of the OECD PISA Study
The level of student engagement in mathematics isimportant for acquiring skills and knowledge inmathematics. Students who are engaged in the learningprocess will tend to learn more and be more receptive tothe pursuit of knowledge. Furthermore, studentengagement in mathematics has an impact upon courseselection, educational pathways, and career choices.Likewise, the learning strategies that students employmay also have an impact on both their ability to succeedin school and in their ability to pursue lifelong learning.For example, students who leave school with the abilityto set their own learning objectives are well equipped tocontinue the learning process throughout their lives.Consequently, students’ engagement with learning andthe learning strategies they employ constitute animportant outcome of education.
In this chapter, the relationships between studentengagement, learning strategies, preferences for learning,and mathematics achievement are explored. To begin,student engagement as measured by motivation to learn,confidence in learning, and anxiety associated withlearning mathematics is described for both Canadianstudents in comparison with OECD students as a wholeand for students across the provinces in relationship tothe Canadian average. Next, the impact of theseengagement measures on mathematics performance isdescribed. This is followed by an examination of genderdifferences in mathematics engagement.
The second part of this chapter examines thevarious learning strategies used and the type of learningsituations preferred by Canadian students in relation toother OECD students and students across the provincescompared to the Canadian average. Next, the relationshipbetween learning strategies and preferences for learningsituations and mathematics achievement is explored.Lastly, a comparison is made between high and lowachievers in mathematics vis-à-vis their learningstrategies and preferences for learning situations.
Engagement in mathematics
PISA collected information on a variety of dimensionsof student engagement to explore the extent to whichstudents believe that they can succeed in mathematics,why they want to learn mathematics, and what they feelabout learning mathematics. Student engagement inmathematics refers to students’ motivation to learnmathematics, their confidence in their ability to succeedin mathematics, and their emotional feelings aboutmathematics. Based on student responses to a series ofquestions, PISA constructed five indices related to thesevariables:
Motivation
Interest and enjoyment in mathematics measures anindividual’s interest and enjoyment in mathematics.
Chapter 3
The relationship betweenstudent engagement, studentlearning, and mathematicsperformance
44
Chapter 3 / The relationship between student engagement, student learning and mathematics performance
Instrumental motivation to learn mathematics reflectsan individual’s belief that mathematics will be usefulfor future employment or education. Students wereasked to what extent they are encouraged to learn byexternal rewards such as good job prospects.Instrumental motivation is also referred to as beliefin the usefulness of mathematics.
Confidence
Mathematics self-efficacy measures students’ feelingsof confidence about being able to solve specificmathematical problems. Mathematics self-efficacyis also referred to as mathematics confidence.
Mathematics self-concept measures an individual’sperception of their ability to learn mathematics.Mathematics self-concept is also referred to asperceived ability in mathematics.
Anxiety
Mathematics anxiety is concerned with feelings ofhelplessness and emotional stress when dealing withmathematics.
Each index was constructed so that the average scoreacross the OECD countries is 0 and two-thirds of the scoresare between -1.0 and 1.0 (i.e. a standard deviation of 1).
Comparing Canada with the OECDand provinces with Canada
In this chapter, scores for Canada are compared withthe OECD average. The OECD average can be used tosee how a country compares on a given indicator witha typical OECD country. The OECD average does nottake into account the absolute size of the studentpopulation in each country, i.e., each countrycontributes equally to the average.
Significant differences are calculated byconstructing a 95% confidence interval around theaverage (for more information on confidence intervals,please refer to chapter 1 – A note on statisticalcomparisons). In comparing Canada with the OECDaverage for a given indicator, scores not significantlydifferent from zero indicate average levels of theattribute measured by a given index. Scoressignificantly above 0 represent above-average levelsand scores significantly below 0 represent below-average levels of the attribute measured by a givencharacteristic. For example, a positive value forCanada on the index of instrumental motivation tolearn mathematics, with a corresponding 95%confidence interval whose lower bound is above zero(i.e. average=0.23, 95% confidence interval=0.20-0.26), means that the average score for Canadian15-year-olds on this index is above-average comparedto the OECD average of zero.
When comparisons are made between Canadaand the provinces, provincial averages are considereddifferent from the Canadian average if theirconfidence intervals do not overlap with theconfidence interval for Canada. All confidenceintervals for Canada and the provinces are presentedin the appendix tables.
Canadian students believe strongly in theusefulness of mathematics to their futureeducation and employment
Motivation to learn is a driving force behind learningand Canadian 15-year-old students appear to be wellmotivated to learn mathematics. While Canadianstudents were just as interested in mathematics andenjoyed it as much as students in OECD countries as awhole, they believed more strongly in its usefulness totheir future employment and education.
Motivation to learn can be activated through aninterest in and enjoyment of mathematics. Compared tothe OECD average, Canadian 15-year-old studentsreported similar levels of interest in and enjoyment ofmathematics. While there was variation in the provincialaverages, the average scores of all provinces were notdifferent from the Canadian average with the exceptionof British Columbia where students reported levels ofinterest and enjoyment in mathematics that were belowthe Canadian average (Table 3.1).
Motivation to learn mathematics may also be drivenby the belief that mathematics will be useful to one’sfuture job or further studies. Compared to the OECDaverage, Canadian 15-year-olds held an above-averagebelief that mathematics would be useful for their futureemployment and education (Appendix Table B3.1). Theaverages for all provinces were also above the OECDaverage. However, there were differences across theprovinces. Students in Nova Scotia and Quebec possessedthe strongest belief, above the Canadian average. Theaverage scores for students in Newfoundland andLabrador, Prince Edward Island, Manitoba, Alberta, andSaskatchewan were not significantly different from theCanadian average. Lastly, the average scores for studentsin New Brunswick, Ontario, and British Columbia werebelow the Canadian average, suggesting that they werenot as positive about the usefulness of mathematics totheir future jobs and education.
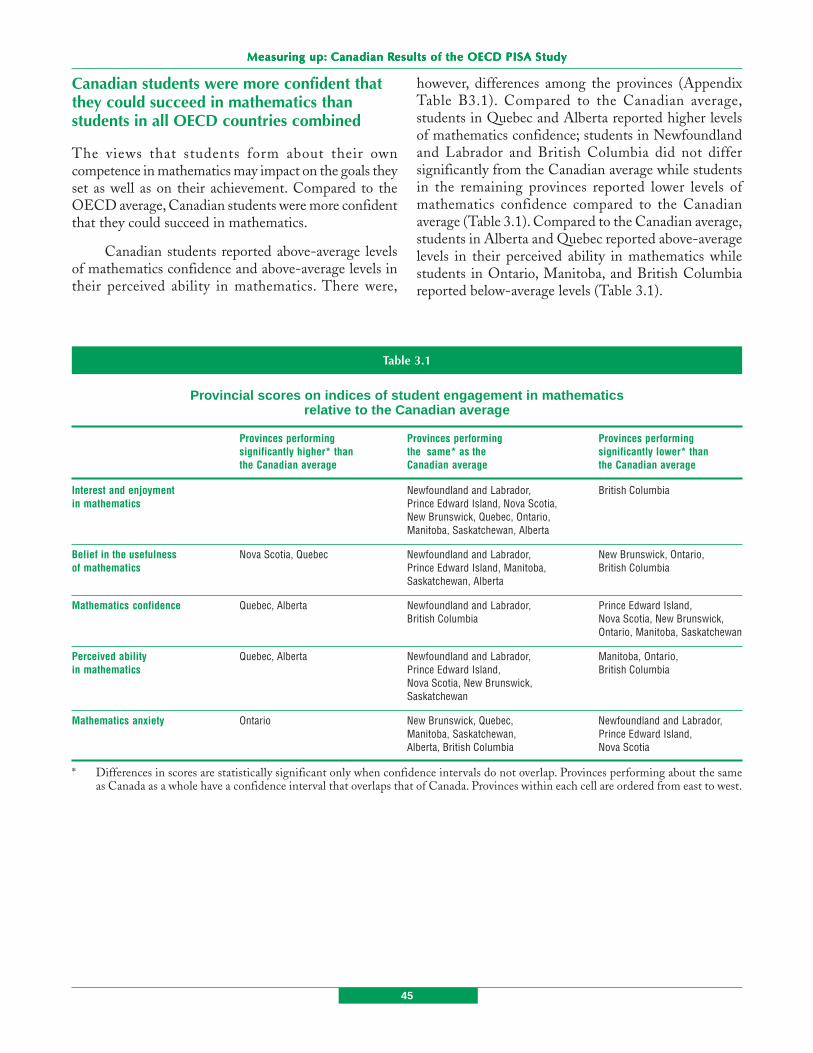
45
MeasurMeasurMeasurMeasurMeasuring up:ing up:ing up:ing up:ing up: Canadian R Canadian R Canadian R Canadian R Canadian Results of the OECD PISA Studyesults of the OECD PISA Studyesults of the OECD PISA Studyesults of the OECD PISA Studyesults of the OECD PISA Study
Canadian students were more confident thatthey could succeed in mathematics thanstudents in all OECD countries combined
The views that students form about their owncompetence in mathematics may impact on the goals theyset as well as on their achievement. Compared to theOECD average, Canadian students were more confidentthat they could succeed in mathematics.
Canadian students reported above-average levelsof mathematics confidence and above-average levels intheir perceived ability in mathematics. There were,
however, differences among the provinces (AppendixTable B3.1). Compared to the Canadian average,students in Quebec and Alberta reported higher levelsof mathematics confidence; students in Newfoundlandand Labrador and British Columbia did not differsignificantly from the Canadian average while studentsin the remaining provinces reported lower levels ofmathematics confidence compared to the Canadianaverage (Table 3.1). Compared to the Canadian average,students in Alberta and Quebec reported above-averagelevels in their perceived ability in mathematics whilestudents in Ontario, Manitoba, and British Columbiareported below-average levels (Table 3.1).
Table 3.1
Provincial scores on indices of student engagement in mathematicsrelative to the Canadian average
Provinces performing Provinces performing Provinces performingsignificantly higher* than the same* as the significantly lower* thanthe Canadian average Canadian average the Canadian average
Interest and enjoyment Newfoundland and Labrador, British Columbiain mathematics Prince Edward Island, Nova Scotia,
New Brunswick, Quebec, Ontario,Manitoba, Saskatchewan, Alberta
Belief in the usefulness Nova Scotia, Quebec Newfoundland and Labrador, New Brunswick, Ontario,of mathematics Prince Edward Island, Manitoba, British Columbia
Saskatchewan, Alberta
Mathematics confidence Quebec, Alberta Newfoundland and Labrador, Prince Edward Island,British Columbia Nova Scotia, New Brunswick,
Ontario, Manitoba, Saskatchewan
Perceived ability Quebec, Alberta Newfoundland and Labrador, Manitoba, Ontario,in mathematics Prince Edward Island, British Columbia
Nova Scotia, New Brunswick,Saskatchewan
Mathematics anxiety Ontario New Brunswick, Quebec, Newfoundland and Labrador,Manitoba, Saskatchewan, Prince Edward Island,Alberta, British Columbia Nova Scotia
* Differences in scores are statistically significant only when confidence intervals do not overlap. Provinces performing about the sameas Canada as a whole have a confidence interval that overlaps that of Canada. Provinces within each cell are ordered from east to west.
46
Chapter 3 / The relationship between student engagement, student learning and mathematics performance
Canadian students are slightly less anxious indealing with mathematics than students in allOECD countries combined
Emotional stress in learning mathematics may lead toavoidance of mathematics and impede learning.Compared to the OECD average, fifteen-year-oldstudents in Canada reported slightly lower levels ofanxiety in dealing with mathematics (see AppendixTable B3.1). Students in Newfoundland and Labrador,Prince Edward Island, and Nova Scotia reported levelsof mathematics anxiety below the Canadian average.Students in Ontario reported levels of anxiety above theCanadian average. The level of anxiety reported bystudents in other provinces was not significantly differentfrom the Canadian average (Table 3.1).
Canadian students with high levelsof engagement in mathematics have highermathematics performance
There is a complex and often circular relationshipbetween student engagement in mathematics and actualperformance. For example, the more students succeed inmathematics the more likely they are to believe they cansucceed. The more students believe they can succeed themore engaged they will become with learningmathematics. The relationship between mathematicsachievement and the various measures of engagement inmathematics is strong. Canadian students reporting highlevels (one standard deviation above the average) of
mathematics confidence scored 133 points higher on thecombined mathematics scale than did students reportinglow levels (one standard deviation below the average,Figure 3.1).This represents a difference of twomathematics proficiency levels in mathematics.
The average combined mathematics score ofstudents with high levels of perceived ability inmathematics was 111 points higher than the averagecombined mathematics score of students with low levelsof perceived ability in mathematics. Similarly, thedifference in the average combined mathematics scorebetween students with high and low interest andenjoyment in mathematics and students with high andlow levels of belief in the usefulness of mathematics were70 and 62 points respectively (Figure 3.1). Mathematicsanxiety had a strong negative relationship withmathematics performance: the average performance ofstudents with high levels of mathematics anxiety was 71points lower than the average performance of studentswith low levels of mathematics anxiety.
The patterns of the effects of student motivation(belief in the usefulness of mathematics and interest andenjoyment in mathematics), mathematics confidence, andmathematics anxiety on mathematics performance acrossthe provinces mirror those for Canada. In all provinces,students with high levels of student motivation andmathematics confidence and low levels of mathematicsanxiety outperformed students with low levels of studentmotivation and mathematics confidence and high levelsof mathematics anxiety (Appendix Table B3.2).

47
MeasurMeasurMeasurMeasurMeasuring up:ing up:ing up:ing up:ing up: Canadian R Canadian R Canadian R Canadian R Canadian Results of the OECD PISA Studyesults of the OECD PISA Studyesults of the OECD PISA Studyesults of the OECD PISA Studyesults of the OECD PISA Study
Canadian girls and boys are not equallyengaged in mathematics
Students’ mathematics confidence, their perceivedabilities in mathematics, and their beliefs in the value ofmathematics for future work and education may have animportant impact on their course selections, educationalpathways and career choices. Differences exist betweenthe mathematics engagement of Canadian boys and girls(Table 3.2). For example, after controlling formathematics performance, girls reported lower levels ofconfidence in their ability to solve specific mathematicalproblems, lower levels of their perceived ability to learnmathematics and higher levels of anxiety in dealing withmathematics. Girls were also less likely to believe that
mathematics will be useful for their future employmentand education and were more likely to report lower levelsof interest and enjoyment in mathematics.
The same pattern was observed across provinceswith the following exceptions: in Newfoundland andLabrador boys and girls with the same level of abilitydid not differ in their level of interest and enjoyment inmathematics; girls in Prince Edward Island, Nova Scotia,Manitoba, and Saskatchewan had higher levels of interestand enjoyment in mathematics than males; and inNewfoundland and Labrador, both boys and girls withthe same level of ability reported similar levels of beliefin the usefulness of mathematics (Table 3.2, AppendixTable B3.3).
Figure 3.1
Combined mathematics score for students with high mathematics engagementcompared to students with low mathematics engagement
350
400
450
500
550
650Average combined mathematics score
350
400
450
500
550
Average combined mathematics score650
600 600
Mathematicsanxiety
Mathematicsconfidence
Perceived ability inmathematics
Interest andenjoyment inmathematics
Belief in theusefulness ofmathematics
Students who are low* on the index Students who are high* on the index
* Students low on a given index are defined as those falling one standard deviation below the average, students high on a given index aredefined as those falling one standard deviation above the average.
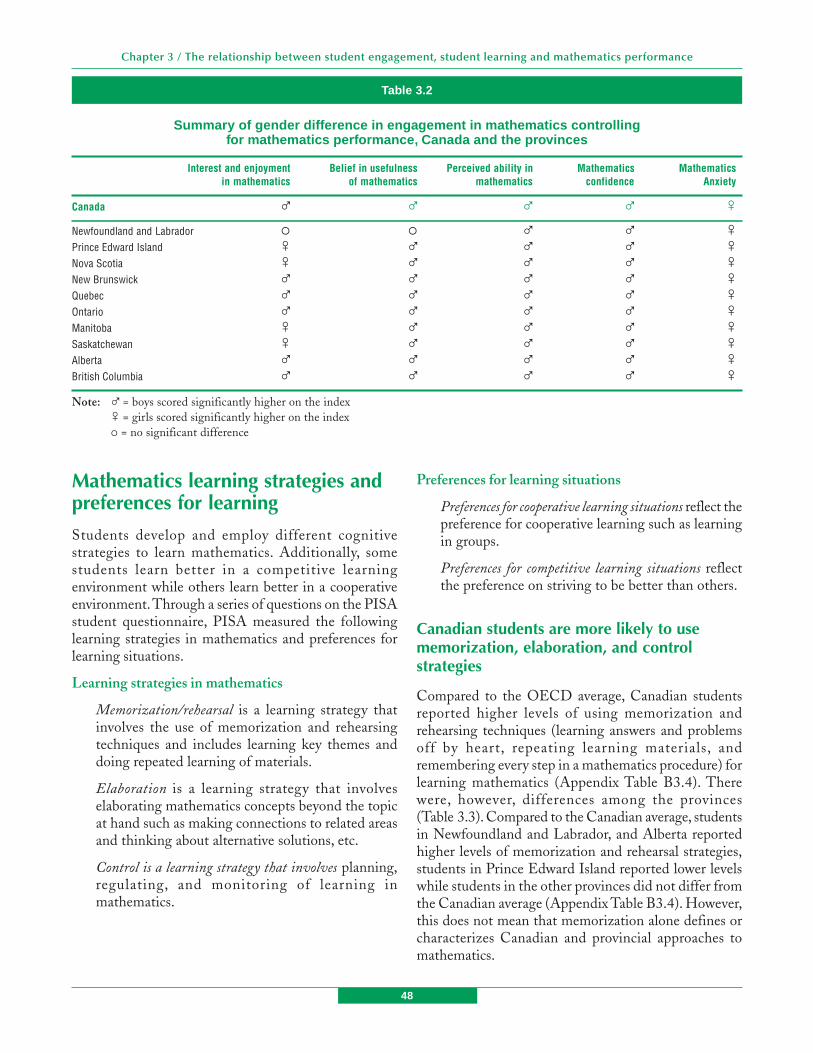
48
Chapter 3 / The relationship between student engagement, student learning and mathematics performance
Table 3.2
Summary of gender difference in engagement in mathematics controllingfor mathematics performance, Canada and the provinces
Interest and enjoyment Belief in usefulness Perceived ability in Mathematics Mathematicsin mathematics of mathematics mathematics confidence Anxiety
Canada
Newfoundland and LabradorPrince Edward IslandNova ScotiaNew BrunswickQuebecOntarioManitobaSaskatchewanAlbertaBritish Columbia
Note: % = boys scored significantly higher on the index& = girls scored significantly higher on the index� = no significant difference
% % % % &
� � % % &
& % % % &
& % % % &
% % % % &
% % % % &
% % % % &
& % % % &
& % % % &
% % % % &
% % % % &
Mathematics learning strategies andpreferences for learning
Students develop and employ different cognitivestrategies to learn mathematics. Additionally, somestudents learn better in a competitive learningenvironment while others learn better in a cooperativeenvironment. Through a series of questions on the PISAstudent questionnaire, PISA measured the followinglearning strategies in mathematics and preferences forlearning situations.
Learning strategies in mathematics
Memorization/rehearsal is a learning strategy thatinvolves the use of memorization and rehearsingtechniques and includes learning key themes anddoing repeated learning of materials.
Elaboration is a learning strategy that involveselaborating mathematics concepts beyond the topicat hand such as making connections to related areasand thinking about alternative solutions, etc.
Control is a learning strategy that involves planning,regulating, and monitoring of learning inmathematics.
Preferences for learning situations
Preferences for cooperative learning situations reflect thepreference for cooperative learning such as learningin groups.
Preferences for competitive learning situations reflectthe preference on striving to be better than others.
Canadian students are more likely to usememorization, elaboration, and controlstrategies
Compared to the OECD average, Canadian studentsreported higher levels of using memorization andrehearsing techniques (learning answers and problemsoff by heart, repeating learning materials, andremembering every step in a mathematics procedure) forlearning mathematics (Appendix Table B3.4). Therewere, however, differences among the provinces(Table 3.3). Compared to the Canadian average, studentsin Newfoundland and Labrador, and Alberta reportedhigher levels of memorization and rehearsal strategies,students in Prince Edward Island reported lower levelswhile students in the other provinces did not differ fromthe Canadian average (Appendix Table B3.4). However,this does not mean that memorization alone defines orcharacterizes Canadian and provincial approaches tomathematics.

49
MeasurMeasurMeasurMeasurMeasuring up:ing up:ing up:ing up:ing up: Canadian R Canadian R Canadian R Canadian R Canadian Results of the OECD PISA Studyesults of the OECD PISA Studyesults of the OECD PISA Studyesults of the OECD PISA Studyesults of the OECD PISA Study
Compared to the OECD average, Canadianstudents also reported slightly higher levels of elaboratingmathematics concepts beyond the topic at hand such asmaking connections to related areas and thinking aboutalternative solutions. At the provincial level, only studentsin British Columbia differed from the Canadian averageby reporting lower levels of elaboration strategies(Appendix Table B3.4).
PISA also explored the extent to which studentstake control over their learning of mathematics byinvolving themselves in the planning, regulating andmonitoring of their learning in mathematics. However,it should be noted that there might be notable differencesin how students from different countries perceive controlstrategies. For example, the degree to which studentsreport that they are involved in their learning may dependon differences in the culturally-driven expectations ofthe learning process among different countries.
Compared to the OECD average, Canadianstudents were more likely to make use of these types ofcontrol strategies. There was a great deal of provincialvariation in the level of control strategies reported bystudents (Table 3.3). Compared to the Canadian average,students in Prince Edward Island, Nova Scotia, NewBrunswick, Ontario, Manitoba, Saskatchewan, Alberta,and British Columbia reported below-average use of
control strategies. Students in Newfoundland andLabrador and Quebec reported levels above the Canadianaverage (Appendix Table B3.4).
Canadian students are more likely to preferboth cooperative and competitive learningsituations
Learning behaviour can also be influenced by students’preferences for different kinds of learning situations.Compared to the OECD average, Canadian students asa whole were more likely to express preferences for bothcooperative learning such as learning in groups andcompetitive learning such as striving to be better thanothers. It should be noted that preferences for cooperativeand competitive learning are not mutually exclusive ofeach other. Provincial averages did not differ from theCanadian average with the following exceptions: studentsin Newfoundland and Labrador and New Brunswickreported higher levels of preferences for cooperativelearning situations; students in Alberta reported higherlevels of preferences for competitive learning situations;students in Quebec reported lower levels of preferencesfor cooperative learning; and students in Prince EdwardIsland and Manitoba reported lower levels of preferencesfor competitive learning situations (AppendixTable B3.4).
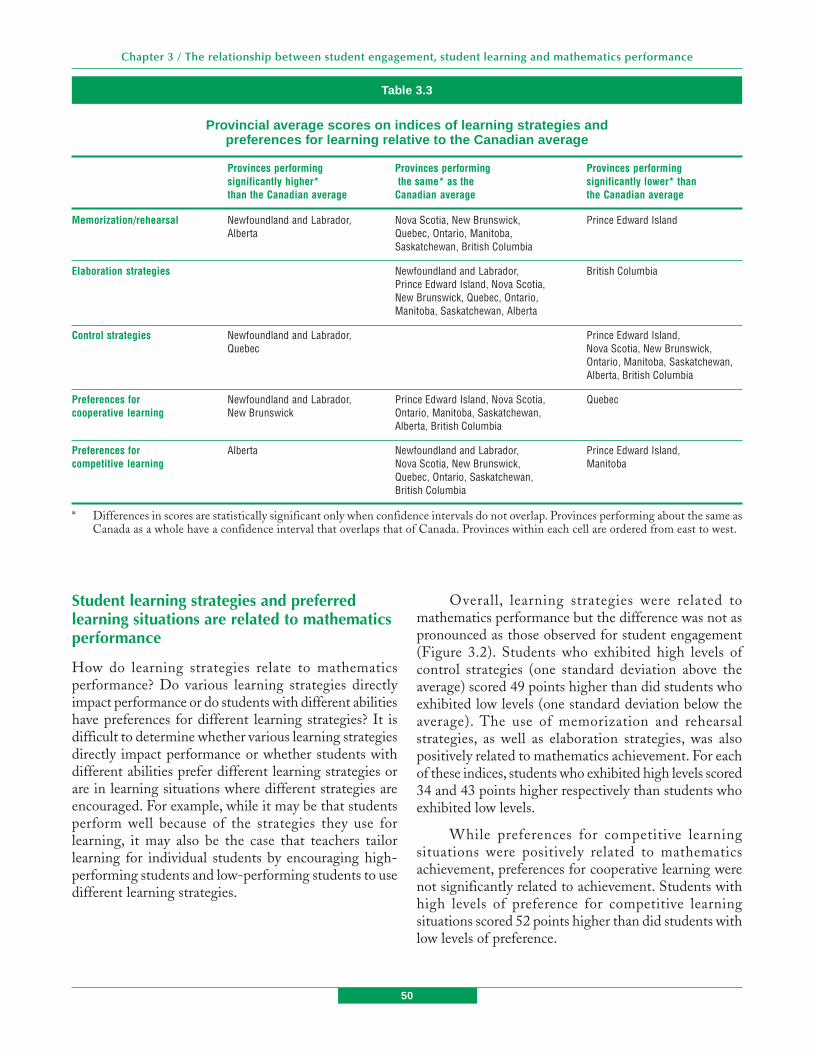
50
Chapter 3 / The relationship between student engagement, student learning and mathematics performance
Table 3.3
Provincial average scores on indices of learning strategies andpreferences for learning relative to the Canadian average
Provinces performing Provinces performing Provinces performingsignificantly higher* the same* as the significantly lower* thanthan the Canadian average Canadian average the Canadian average
Memorization/rehearsal Newfoundland and Labrador, Nova Scotia, New Brunswick, Prince Edward IslandAlberta Quebec, Ontario, Manitoba,
Saskatchewan, British Columbia
Elaboration strategies Newfoundland and Labrador, British ColumbiaPrince Edward Island, Nova Scotia,New Brunswick, Quebec, Ontario,Manitoba, Saskatchewan, Alberta
Control strategies Newfoundland and Labrador, Prince Edward Island,Quebec Nova Scotia, New Brunswick,
Ontario, Manitoba, Saskatchewan,Alberta, British Columbia
Preferences for Newfoundland and Labrador, Prince Edward Island, Nova Scotia, Quebeccooperative learning New Brunswick Ontario, Manitoba, Saskatchewan,
Alberta, British Columbia
Preferences for Alberta Newfoundland and Labrador, Prince Edward Island,competitive learning Nova Scotia, New Brunswick, Manitoba
Quebec, Ontario, Saskatchewan,British Columbia
* Differences in scores are statistically significant only when confidence intervals do not overlap. Provinces performing about the same asCanada as a whole have a confidence interval that overlaps that of Canada. Provinces within each cell are ordered from east to west.
Student learning strategies and preferredlearning situations are related to mathematicsperformance
How do learning strategies relate to mathematicsperformance? Do various learning strategies directlyimpact performance or do students with different abilitieshave preferences for different learning strategies? It isdifficult to determine whether various learning strategiesdirectly impact performance or whether students withdifferent abilities prefer different learning strategies orare in learning situations where different strategies areencouraged. For example, while it may be that studentsperform well because of the strategies they use forlearning, it may also be the case that teachers tailorlearning for individual students by encouraging high-performing students and low-performing students to usedifferent learning strategies.
Overall, learning strategies were related tomathematics performance but the difference was not aspronounced as those observed for student engagement(Figure 3.2). Students who exhibited high levels ofcontrol strategies (one standard deviation above theaverage) scored 49 points higher than did students whoexhibited low levels (one standard deviation below theaverage). The use of memorization and rehearsalstrategies, as well as elaboration strategies, was alsopositively related to mathematics achievement. For eachof these indices, students who exhibited high levels scored34 and 43 points higher respectively than students whoexhibited low levels.
While preferences for competitive learningsituations were positively related to mathematicsachievement, preferences for cooperative learning werenot significantly related to achievement. Students withhigh levels of preference for competitive learningsituations scored 52 points higher than did students withlow levels of preference.
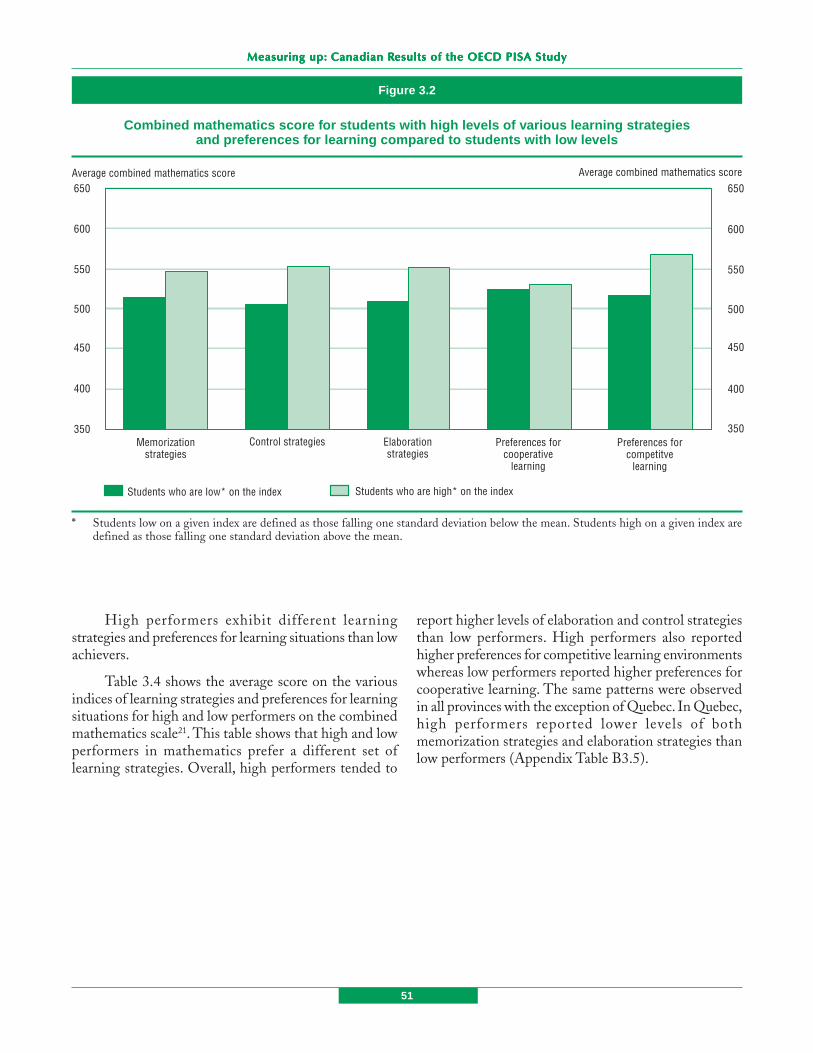
51
MeasurMeasurMeasurMeasurMeasuring up:ing up:ing up:ing up:ing up: Canadian R Canadian R Canadian R Canadian R Canadian Results of the OECD PISA Studyesults of the OECD PISA Studyesults of the OECD PISA Studyesults of the OECD PISA Studyesults of the OECD PISA Study
High performers exhibit different learningstrategies and preferences for learning situations than lowachievers.
Table 3.4 shows the average score on the variousindices of learning strategies and preferences for learningsituations for high and low performers on the combinedmathematics scale21. This table shows that high and lowperformers in mathematics prefer a different set oflearning strategies. Overall, high performers tended to
Figure 3.2
Combined mathematics score for students with high levels of various learning strategiesand preferences for learning compared to students with low levels
350
400
450
500
550
650Average combined mathematics score
350
400
450
500
550
Average combined mathematics score650
600 600
Preferences forcompetitve
learning
Preferences forcooperative
learning
Elaborationstrategies
Control strategiesMemorizationstrategies
Students who are low* on the index Students who are high* on the index
* Students low on a given index are defined as those falling one standard deviation below the mean. Students high on a given index aredefined as those falling one standard deviation above the mean.
report higher levels of elaboration and control strategiesthan low performers. High performers also reportedhigher preferences for competitive learning environmentswhereas low performers reported higher preferences forcooperative learning. The same patterns were observedin all provinces with the exception of Quebec. In Quebec,high performers reported lower levels of bothmemorization strategies and elaboration strategies thanlow performers (Appendix Table B3.5).
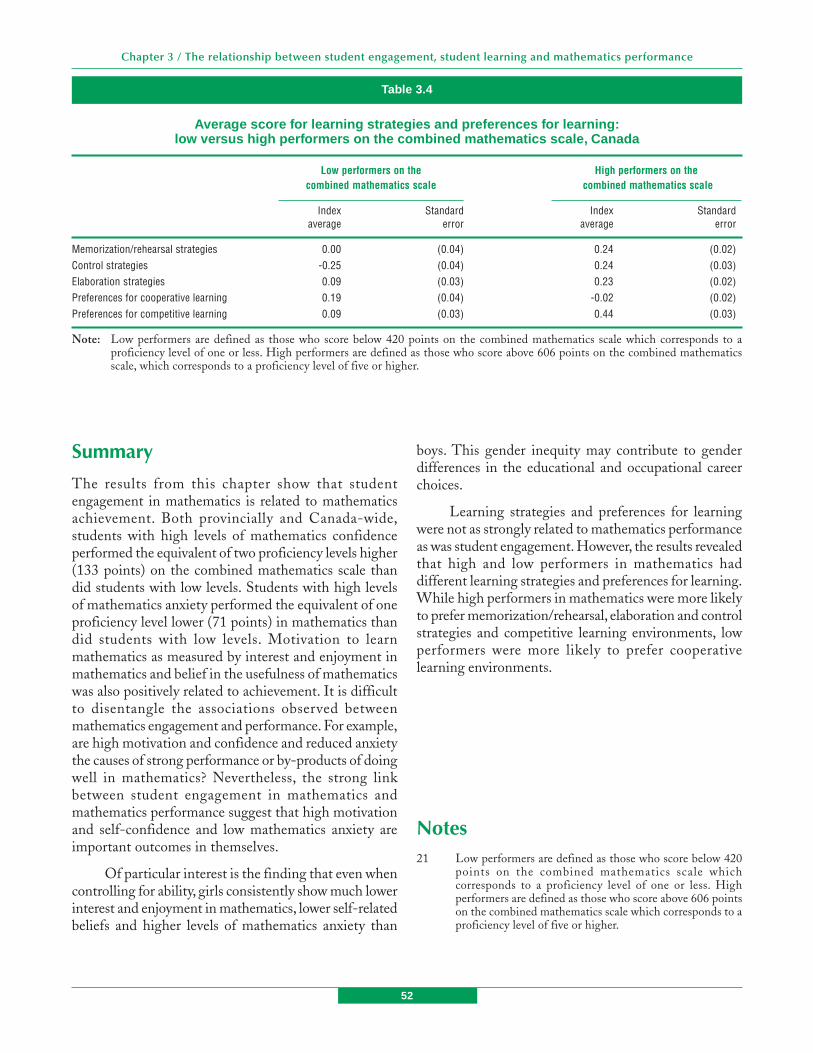
52
Chapter 3 / The relationship between student engagement, student learning and mathematics performance
Summary
The results from this chapter show that studentengagement in mathematics is related to mathematicsachievement. Both provincially and Canada-wide,students with high levels of mathematics confidenceperformed the equivalent of two proficiency levels higher(133 points) on the combined mathematics scale thandid students with low levels. Students with high levelsof mathematics anxiety performed the equivalent of oneproficiency level lower (71 points) in mathematics thandid students with low levels. Motivation to learnmathematics as measured by interest and enjoyment inmathematics and belief in the usefulness of mathematicswas also positively related to achievement. It is difficultto disentangle the associations observed betweenmathematics engagement and performance. For example,are high motivation and confidence and reduced anxietythe causes of strong performance or by-products of doingwell in mathematics? Nevertheless, the strong linkbetween student engagement in mathematics andmathematics performance suggest that high motivationand self-confidence and low mathematics anxiety areimportant outcomes in themselves.
Of particular interest is the finding that even whencontrolling for ability, girls consistently show much lowerinterest and enjoyment in mathematics, lower self-relatedbeliefs and higher levels of mathematics anxiety than
Table 3.4
Average score for learning strategies and preferences for learning:low versus high performers on the combined mathematics scale, Canada
Low performers on the High performers on thecombined mathematics scale combined mathematics scale
Index Standard Index Standardaverage error average error
Memorization/rehearsal strategies 0.00 (0.04) 0.24 (0.02)Control strategies -0.25 (0.04) 0.24 (0.03)Elaboration strategies 0.09 (0.03) 0.23 (0.02)Preferences for cooperative learning 0.19 (0.04) -0.02 (0.02)Preferences for competitive learning 0.09 (0.03) 0.44 (0.03)
Note: Low performers are defined as those who score below 420 points on the combined mathematics scale which corresponds to aproficiency level of one or less. High performers are defined as those who score above 606 points on the combined mathematicsscale, which corresponds to a proficiency level of five or higher.
boys. This gender inequity may contribute to genderdifferences in the educational and occupational careerchoices.
Learning strategies and preferences for learningwere not as strongly related to mathematics performanceas was student engagement. However, the results revealedthat high and low performers in mathematics haddifferent learning strategies and preferences for learning.While high performers in mathematics were more likelyto prefer memorization/rehearsal, elaboration and controlstrategies and competitive learning environments, lowperformers were more likely to prefer cooperativelearning environments.
Notes21 Low performers are defined as those who score below 420
points on the combined mathematics scale whichcorresponds to a proficiency level of one or less. Highperformers are defined as those who score above 606 pointson the combined mathematics scale which corresponds to aproficiency level of five or higher.
53
Measuring up: Canadian Results of the OECD PISA Study
Parental education, occupation,and student performanceAs shown in Chapter 1, the mathematics performanceof students differed considerably across countries andacross provinces. The previous chapter discussed howthese differences may be related to attitudes andperceptions of students. This chapter examines twoimportant family characteristics – parental education andoccupation – and how they relate to overall mathematicsperformance.
Parents play an important role in how studentslearn. Aside from being actively involved in theirchildrens’ education, parents also provide a homeenvironment that can impact learning. Parents serve as amodel for learning, determine the educational resourcesavailable in the home, and hold particular attitudes andvalues towards education. Although it is difficult toexamine the home environment of each student, theeducational attainment and occupation of parents reflectthe values and resources with which parents create thisenvironment.
Parental education and occupation are two majorcomponents of the socio-economic status (SES) of astudent. The association between student SES and test
performance describes the relative advantage ordisadvantage that can be explained by familycircumstances. Just as each student can be described byhis or her home environment, so can a school be describedby the family background of its students (school socio-economic background).
This chapter begins with an examination of therelationships of parental education and occupation tooverall mathematics performance. The next section looksto see if the relationship between socio-economicbackground and mathematics performance differs acrossprovinces. The chapter ends with a discussion of howschools and school systems may moderate the effects ofindividual socio-economic background.
High parental education is associated withhigher mathematics performance
In PISA 2003, students were asked to indicate the highestlevel of education attained by each of their parents/guardians. The categories were: No education,Elementary school, Junior high or middle school, Highschool, College, and University. In Canada, very fewparents were reported to have less than high schooleducation. Therefore, the lowest four categories weregrouped together as High school or less. The highest
Chapter 4
The relationship betweenfamily characteristics, homeenvironment, and mathematicsperformance
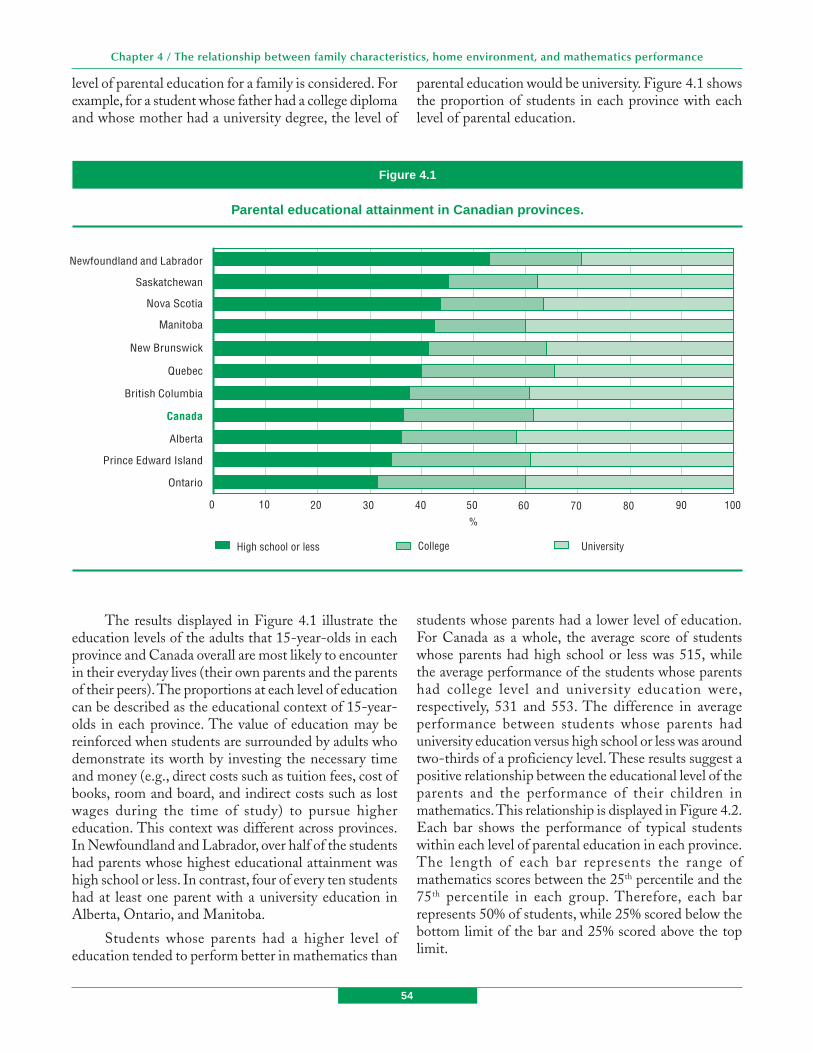
54
Chapter 4 / The relationship between family characteristics, home environment, and mathematics performance
level of parental education for a family is considered. Forexample, for a student whose father had a college diplomaand whose mother had a university degree, the level of
parental education would be university. Figure 4.1 showsthe proportion of students in each province with eachlevel of parental education.
Figure 4.1
Parental educational attainment in Canadian provinces.
Newfoundland and Labrador
Saskatchewan
Nova Scotia
Manitoba
New Brunswick
Quebec
British Columbia
Canada
Alberta
Prince Edward Island
Ontario
1009080706050403020100
%
High school or less College University
The results displayed in Figure 4.1 illustrate theeducation levels of the adults that 15-year-olds in eachprovince and Canada overall are most likely to encounterin their everyday lives (their own parents and the parentsof their peers). The proportions at each level of educationcan be described as the educational context of 15-year-olds in each province. The value of education may bereinforced when students are surrounded by adults whodemonstrate its worth by investing the necessary timeand money (e.g., direct costs such as tuition fees, cost ofbooks, room and board, and indirect costs such as lostwages during the time of study) to pursue highereducation. This context was different across provinces.In Newfoundland and Labrador, over half of the studentshad parents whose highest educational attainment washigh school or less. In contrast, four of every ten studentshad at least one parent with a university education inAlberta, Ontario, and Manitoba.
Students whose parents had a higher level ofeducation tended to perform better in mathematics than
students whose parents had a lower level of education.For Canada as a whole, the average score of studentswhose parents had high school or less was 515, whilethe average performance of the students whose parentshad college level and university education were,respectively, 531 and 553. The difference in averageperformance between students whose parents haduniversity education versus high school or less was aroundtwo-thirds of a proficiency level. These results suggest apositive relationship between the educational level of theparents and the performance of their children inmathematics. This relationship is displayed in Figure 4.2.Each bar shows the performance of typical studentswithin each level of parental education in each province.The length of each bar represents the range ofmathematics scores between the 25th percentile and the75th percentile in each group. Therefore, each barrepresents 50% of students, while 25% scored below thebottom limit of the bar and 25% scored above the toplimit.

55
Measuring up: Canadian Results of the OECD PISA Study
Figure 4.2 reveals that, while higher parentaleducation tended to be associated with highermathematics performance, there was substantial overlapof performance between the different levels of parentaleducation. Many students whose parents had high schooleducation or less outperformed students whose parentshad university education. Given the wide range of studentperformance within each group, it is clear that the successof many students appears to be dependent on factors
other than their parents’ level of education. For example,as shown in Figure 4.3, although most of the studentswhose performance was in the top 15% of students hadat least one parent with a university education, one infour of these highest performing students had parentswith only high school or less. Further, one in four of thestudents whose performance was in the bottom 15% alsohad at least one parent with a university degree.
Figure 4.2
Parental education and student performance in mathematics in Canadian provinces
Canada
Newfoundland and Labrador
Prince Edward Island
Nova Scotia
New Brunswick
Quebec
Ontario
Manitoba
Saskatchewan
Alberta
British Columbia
650600550500450400
Figure 4.3
Parental education of high and low performing students in Canada
Highest 15% inmathematics
1009080706050403020100%
Lowest 15% inmathematics
1009080706050403020100%
High school or less College University
High school or less College University

56
Chapter 4 / The relationship between family characteristics, home environment, and mathematics performance
Parental occupation is related to theskills used by parents
In PISA 2003, students were asked to report theoccupations held by both their mother and father. Theseoccupations have been grouped into six categoriesaccording to the types of skills that are associated witheach occupation (see text box ‘Describing ParentalOccupation with the International StandardClassification of Occupation (ISCO)’). Some examplesof the occupations that characterise each category areprovided as follows:
• Higher service: lawyers, scientists, executive officersof large corporations and divisional managers
• Lower service: laboratory technicians, midwives,computer programmers, insurance salespersons,real estate brokers, managers of small businesses
• Routine clerical/sales: administrative assistants,client information clerks, cashiers, sales assistants
• Skilled manual: carpenters, welders, jewellerymakers, upholsterers, engine machinists
• Semi-unskilled manual: manufacturing machineoperators, taxi drivers, building cleaners
• Farmers/ farm managers: supervisory farmworkers, self-employed farmers
Describing Parental Occupation with the InternationalStandard Classification of Occupation (ISCO)
PISA 2003 asked students if their parents were working, and if so, what type of work they did. The responses were thenassigned to specific categories in a classification system called the International Standard Classification of Occupation(ISCO). ISCO uses a four-digit code to describe different occupations, where each digit represents a particular group ofoccupations within a broader group. The first digit in ISCO distinguishes ten major groups:
1000 Legislators, Senior Officials and Managers
2000 Professionals
3000 Technicians and Associate Professionals
4000 Clerks
5000 Service Workers and Shop and Market Sales Workers
6000 Skilled Agricultural and Fishery Workers
7000 Craft and Related Trades Workers
8000 Plant and Machine Operators and Assemblers
9000 Elementary Occupations
0000 Armed Forces Personnel
Within these groups, there are 28 sub-major groups, 116 minor groups and 390 unit groups. Each of the groupsand units are defined by the specific skills associated with the occupations rather than industry or income. This frameworkallows ISCO to describe the activities of each person’s occupation. The level of description may be very specific,depending on the number of ISCO digits used. For example, the specific occupation Computer systems designers,analysts and programmers has a four-digit ISCO code of 2131; it falls within the three-digit minor group of Computingprofessionals (2130) and also within the sub-major group of occupations Physical, mathematical and engineering scienceprofessionals (2100).
Using the detailed information provided by ISCO, several methods have been developed to translate the ISCOcategories into categories that can be used to further group or order individuals according to the social status, prestige,or skill level associated with their occupations. This chapter uses two of the methods described in Ganzeboom andTreiman (1996)1. The first, referred to as the EGP classification, first identifies workers according to whether theiroccupations are manual or non-manual. Within these two broad groups, workers can have varying skill levels or be self-employed or not. Only six of the 11 EGP categories (1, 2, 3, 8, 9, 11) are used in this report. These groups accounted forthe parental occupations of 97% of Canadian 15-year-olds. The second method, referred to as the International Socio-economic Index (ISEI), adapts the ISCO framework to describe the status associated with each occupation. Socialstatus has been defined as the degree to which each occupation converts education into earnings. For example,occupations which tend to reward higher-educated individuals are associated with higher status. Conversely, occupationswhere earnings are not strongly related to education have lower status. For students with more than one workingparent, highest occupational status was used to assign a single parental occupation. This measure has been used withother indicators to create the overall index of socio-economic status associated with each student’s home environment.
1. Ganzeboom, H.B.G. & D.J. Treiman. 1996. “Internationally comparable measures of occupational status for the 1988International Standard Classification of Occupations.” Social Science Research. 25:201-239
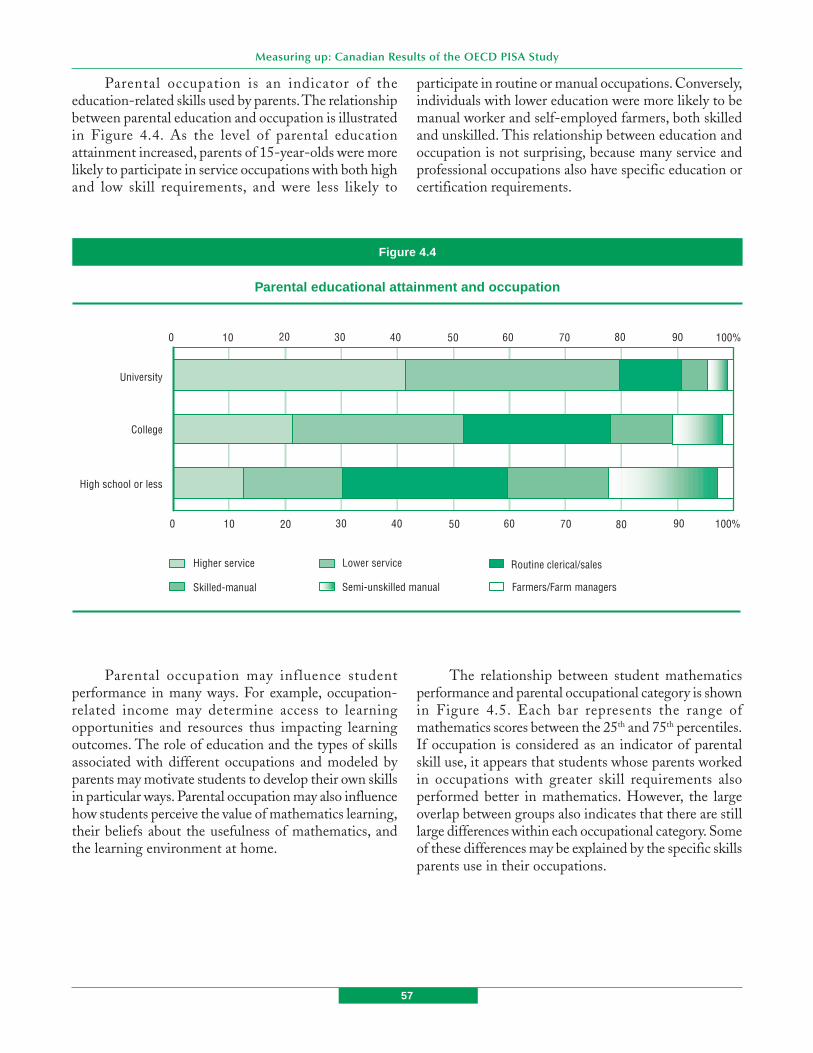
57
Measuring up: Canadian Results of the OECD PISA Study
Parental occupation is an indicator of theeducation-related skills used by parents. The relationshipbetween parental education and occupation is illustratedin Figure 4.4. As the level of parental educationattainment increased, parents of 15-year-olds were morelikely to participate in service occupations with both highand low skill requirements, and were less likely to
participate in routine or manual occupations. Conversely,individuals with lower education were more likely to bemanual worker and self-employed farmers, both skilledand unskilled. This relationship between education andoccupation is not surprising, because many service andprofessional occupations also have specific education orcertification requirements.
Figure 4.4
Parental educational attainment and occupation
20100
Higher service
Skilled-manual
Routine clerical/sales
University
College
High school or less
504030 7060
Semi-unskilled manual
100%9080
Lower service
Farmers/Farm managers
20100 504030 7060 100%9080
Parental occupation may influence studentperformance in many ways. For example, occupation-related income may determine access to learningopportunities and resources thus impacting learningoutcomes. The role of education and the types of skillsassociated with different occupations and modeled byparents may motivate students to develop their own skillsin particular ways. Parental occupation may also influencehow students perceive the value of mathematics learning,their beliefs about the usefulness of mathematics, andthe learning environment at home.
The relationship between student mathematicsperformance and parental occupational category is shownin Figure 4.5. Each bar represents the range ofmathematics scores between the 25th and 75th percentiles.If occupation is considered as an indicator of parentalskill use, it appears that students whose parents workedin occupations with greater skill requirements alsoperformed better in mathematics. However, the largeoverlap between groups also indicates that there are stilllarge differences within each occupational category. Someof these differences may be explained by the specific skillsparents use in their occupations.
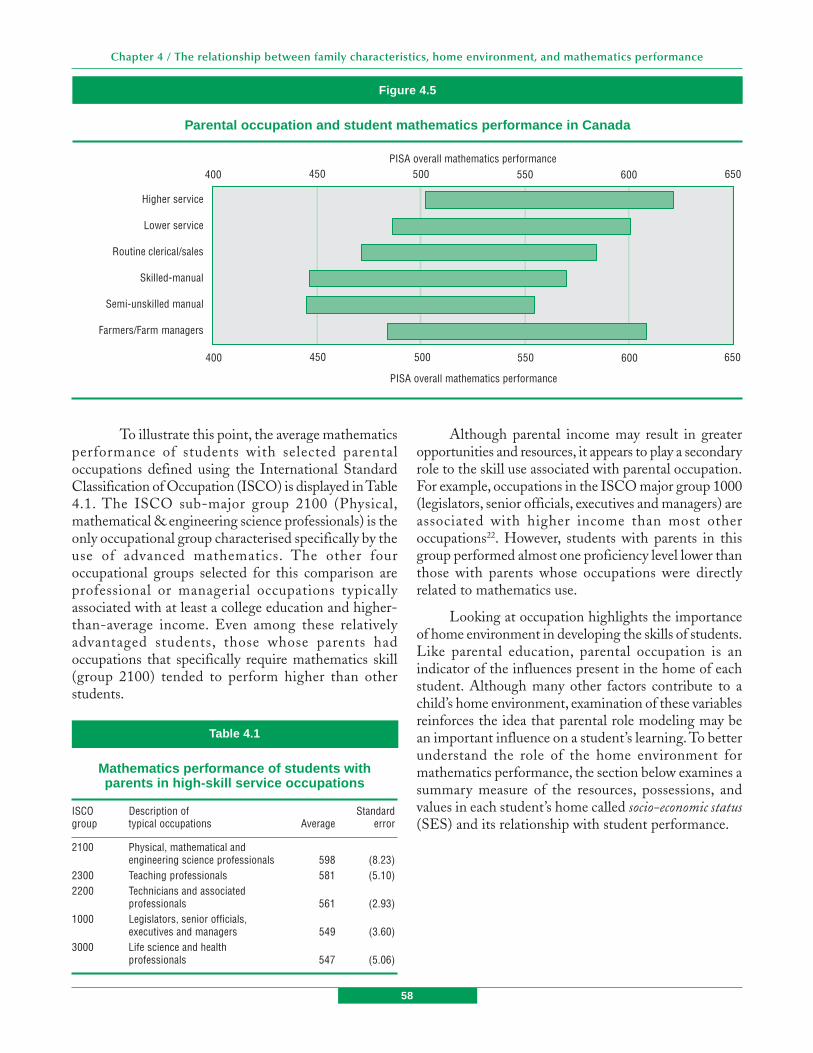
58
Chapter 4 / The relationship between family characteristics, home environment, and mathematics performance
To illustrate this point, the average mathematicsperformance of students with selected parentaloccupations defined using the International StandardClassification of Occupation (ISCO) is displayed in Table4.1. The ISCO sub-major group 2100 (Physical,mathematical & engineering science professionals) is theonly occupational group characterised specifically by theuse of advanced mathematics. The other fouroccupational groups selected for this comparison areprofessional or managerial occupations typicallyassociated with at least a college education and higher-than-average income. Even among these relativelyadvantaged students, those whose parents hadoccupations that specifically require mathematics skill(group 2100) tended to perform higher than otherstudents.
Table 4.1
Mathematics performance of students withparents in high-skill service occupations
ISCO Description of Standardgroup typical occupations Average error
2100 Physical, mathematical andengineering science professionals 598 (8.23)
2300 Teaching professionals 581 (5.10)2200 Technicians and associated
professionals 561 (2.93)1000 Legislators, senior officials,
executives and managers 549 (3.60)3000 Life science and health
professionals 547 (5.06)
Although parental income may result in greateropportunities and resources, it appears to play a secondaryrole to the skill use associated with parental occupation.For example, occupations in the ISCO major group 1000(legislators, senior officials, executives and managers) areassociated with higher income than most otheroccupations22. However, students with parents in thisgroup performed almost one proficiency level lower thanthose with parents whose occupations were directlyrelated to mathematics use.
Looking at occupation highlights the importanceof home environment in developing the skills of students.Like parental education, parental occupation is anindicator of the influences present in the home of eachstudent. Although many other factors contribute to achild’s home environment, examination of these variablesreinforces the idea that parental role modeling may bean important influence on a student’s learning. To betterunderstand the role of the home environment formathematics performance, the section below examines asummary measure of the resources, possessions, andvalues in each student’s home called socio-economic status(SES) and its relationship with student performance.
Figure 4.5
Parental occupation and student mathematics performance in Canada
Higher service
Lower service
Routine clerical/sales
Skilled-manual
Semi-unskilled manual
Farmers/Farm managers
650600550500450400
PISA overall mathematics performance
PISA overall mathematics performance650600550500450400

59
Measuring up: Canadian Results of the OECD PISA Study
Socio-economic status and studentperformance
Socio-economic status (SES) is a term used to summarisea variety of factors, including parental education andoccupation, which influence student performance. InPISA 2003, SES is measured by an index that includesinformation describing family structure, parentaleducation and occupation, parental labour marketparticipation, and whether a student’s family has specificeducational and cultural possessions at home. This indexis standardized to have an average of 0 and standarddeviation of 1 across all OECD countries.
The averages of SES for Canada and the provincesare reported in Table 4.2. The average student in Canadahad a relative socio-economic advantage compared to15-year-olds in all OECD countries combined. Therewere substantial differences in the distributions of SESbetween provinces. As shown in Table 4.2, the provincescan be divided into three groups in terms of SES. Alberta,British Columbia, and Ontario comprise one group,characterised by average SES higher than the Canadianaverage. The second group includes the wide range ofaverage SES in Manitoba, Saskatchewan, Nova Scotia,Prince Edward Island, and Quebec that was slightly lowerthan Canada overall. The last group contains NewBrunswick and Newfoundland and Labrador withaverage SES much lower than Canada. Althoughstudents in all provinces tend to be more advantaged than15-year-olds in all OECD countries combined, thedifferences across provinces suggest that all students inCanada may not have access to the same resources oropportunities.
Table 4.2
Socio-economic status in Canadian provinces
Index Standard Standardaverage error deviation
Canada 0.45 (0.02) 0.82
Alberta 0.58 (0.05) 0.81British Columbia 0.52 (0.03) 0.80Ontario 0.52 (0.03) 0.74
Manitoba 0.37 (0.03) 0.82Saskatchewan 0.35 (0.03) 0.80Nova Scotia 0.34 (0.02) 0.83Prince Edward Island 0.31 (0.02) 0.84Quebec 0.30 (0.03) 0.83
New Brunswick 0.25 (0.01) 0.85Newfoundland and Labrador 0.25 (0.02) 0.89
Socio-economic gradients show that someprovincial differences in performance can beexplained by differences in socio-economicconditions
Students with higher SES tended to perform better inmathematics than students with lower SES, but therewere also large differences in performance amongstudents with similar SES. This relationship is illustratedin Figure 4.6. The pattern of dots, or the scatter plot, isillustrated using the socio-economic backgrounds andmathematics scores of 500 randomly selected Canadianstudents. The relationship between SES and performancein mathematics for students in Canada is represented bythe solid line passing through the centre of this scatterplot. This line predicts the mathematics performance ofstudents based on their level of SES. The endpoints ofthe line are the 25th and 75th percentiles of SES.Therefore, the line represents the relationship anddistribution of SES and mathematics performance of atypical range of students. The dashed line illustrates therelationship for students in all OECD countriescombined.
These lines are referred to as socio-economicgradients, because they summarise the impact of socio-economic status on student performance. The OECDgradient is longer because Canadian students are muchmore similar to each other in terms of SES than are otherstudents in the OECD. The slope of the OECD gradientis greater than that of the Canadian gradient becausethe differences in performance of students with differentlevels of SES are greater in the OECD than in Canada.The strength of the relationship between SES andperformance, given in parentheses, is measured on a scalefrom 0 to 1. The value of 0.10 for Canada indicates that10% of the variance in student performance in Canadacan be explained by SES. If SES were a perfect predictorof performance in Canada, the strength of the gradientwould be 1 and all points would lie on the gradient.However, at every level of SES in Canada, there is stillsubstantial variability in student performance. In theOECD, 22% of the differences in performance ofstudents in OECD countries are explained by SES,indicating a much stronger gradient. The shorter line,shallower slope and lower strength of the Canadiangradient indicate that students in Canada tend to have amore equitable distribution of resources and thatdifferences in the level of these resources do not matteras much to performance in Canada as in OECDcountries overall.
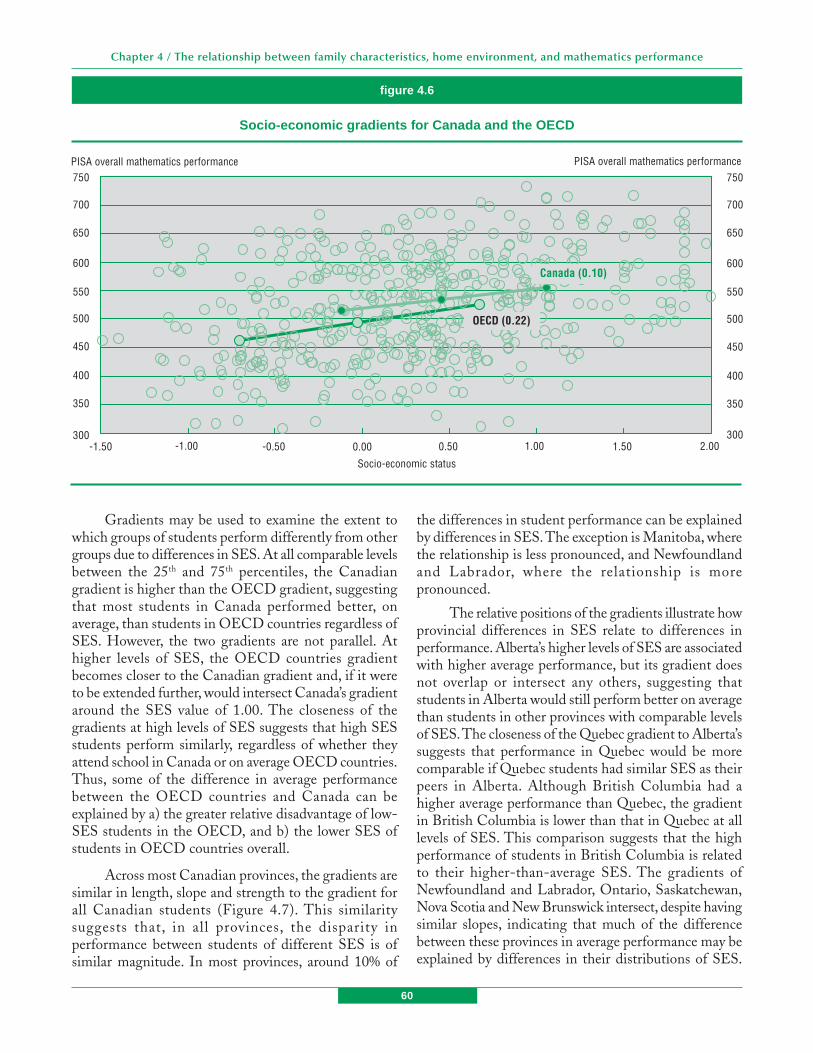
60
Chapter 4 / The relationship between family characteristics, home environment, and mathematics performance
Gradients may be used to examine the extent towhich groups of students perform differently from othergroups due to differences in SES. At all comparable levelsbetween the 25th and 75th percentiles, the Canadiangradient is higher than the OECD gradient, suggestingthat most students in Canada performed better, onaverage, than students in OECD countries regardless ofSES. However, the two gradients are not parallel. Athigher levels of SES, the OECD countries gradientbecomes closer to the Canadian gradient and, if it wereto be extended further, would intersect Canada’s gradientaround the SES value of 1.00. The closeness of thegradients at high levels of SES suggests that high SESstudents perform similarly, regardless of whether theyattend school in Canada or on average OECD countries.Thus, some of the difference in average performancebetween the OECD countries and Canada can beexplained by a) the greater relative disadvantage of low-SES students in the OECD, and b) the lower SES ofstudents in OECD countries overall.
Across most Canadian provinces, the gradients aresimilar in length, slope and strength to the gradient forall Canadian students (Figure 4.7). This similaritysuggests that, in all provinces, the disparity inperformance between students of different SES is ofsimilar magnitude. In most provinces, around 10% of
the differences in student performance can be explainedby differences in SES. The exception is Manitoba, wherethe relationship is less pronounced, and Newfoundlandand Labrador, where the relationship is morepronounced.
The relative positions of the gradients illustrate howprovincial differences in SES relate to differences inperformance. Alberta’s higher levels of SES are associatedwith higher average performance, but its gradient doesnot overlap or intersect any others, suggesting thatstudents in Alberta would still perform better on averagethan students in other provinces with comparable levelsof SES. The closeness of the Quebec gradient to Alberta’ssuggests that performance in Quebec would be morecomparable if Quebec students had similar SES as theirpeers in Alberta. Although British Columbia had ahigher average performance than Quebec, the gradientin British Columbia is lower than that in Quebec at alllevels of SES. This comparison suggests that the highperformance of students in British Columbia is relatedto their higher-than-average SES. The gradients ofNewfoundland and Labrador, Ontario, Saskatchewan,Nova Scotia and New Brunswick intersect, despite havingsimilar slopes, indicating that much of the differencebetween these provinces in average performance may beexplained by differences in their distributions of SES.
figure 4.6
Socio-economic gradients for Canada and the OECD
300
350
400
450
750PISA overall mathematics performance
Socio-economic status
300
350
400
450
PISA overall mathematics performance750
500
550
600
650
700
500
550
600
650
700
2.000.00-0.50-1.00-1.50 1.501.000.50
OECD (0.22)
Canada (0.10)

61
Measuring up: Canadian Results of the OECD PISA Study
The low position of the gradient in Prince Edward Islandindicates that students in Prince Edward Island tend toperform lower than students in other provinces regardlessof their level of SES.
The socio-economic composition of schoolscan help or hinder student learning bycompounding the effect of individual SES
Both theory and empirical evidence suggest that students’knowledge and behaviour, including academic outcomes,are influenced by the characteristics of the schools theyattend. Schools can be characterized by the socio-economic composition of their student population.Schools may have higher or lower average SES,
depending on whether their students are predominantlyfrom low or high SES families. Schools may also differin how they mix students from different backgrounds.Schools are more segregated if most of the students tendto have the same level of SES or more inclusive if studentscome from a variety of backgrounds. To some extent,the socio-economic background of the school populationmay reflect the socio-economic conditions of thecommunity where the school is located and thus be acommunity characteristic as well as a schoolcharacteristic. In other jurisdictions, however, it may alsobe the result of administrative decisions affecting studentintake, either through the definition of school catchmentareas or the degree to which students and families areable to choose schools and school programs.
Figure 4.7
Socio-economic gradients for Canadian provinces
475
495
515
575PISA overall mathematics performance
Socio-economic status
535
555
Alta. (0.12)
Que. (0.12)
B.C. (0.10)
Ont. (0.09)
P.E.I. (0.10)
N.B. (0.09)
N.S. (0.13)
N.L. (0.16)
Man. (0.06)
Sask. (0.11)
Canada (0.10)
1.2-0.6 1.11.0-0.4 -0.2 0 0.2 0.4 0.6 0.8
Earlier in this chapter, the importance of SES wasdiscussed. However, schools play an important role inmoderating the effects of individual SES. Figure 4.8shows the typical range (25th to 75th percentiles) ofmathematics scores of students in schools with differentsocio-economic composition after controlling forindividual socio-economic background. Schools weregrouped into the lowest, middle, and highest thirds ofaverage SES. Even if all students had similar socio-
economic backgrounds, students tended to performbetter, on average, in schools with higher average SES.This tendency suggests that students are not only affectedby the socio-economic circumstances of their ownparents, but by those of their peers as well. This mayhave a positive effect for students surrounded by positivepeer influences and role models, but it may also doubly-disadvantage students from lower SES families attendingschool with other students from similar backgrounds.

62
Chapter 4 / The relationship between family characteristics, home environment, and mathematics performance
However, there is a great deal of overlap in thedistributions, indicating that even if all students andschools had similar SES, there would still be differencesin student performance.
Summary
The results from this chapter revealed that the homeenvironment of a student is related to mathematicsperformance. In all provinces, students whose parentshad a university education performed almost a fullproficiency level higher than those whose parents hadhigh school or less. However, there were still manyCanadian students whose parents had high school or lesswith higher mathematics scores than students withuniversity-educated parents. Parental education isassociated with, but does not determine, performancefor students.
Parental occupation was also related to themathematics performance of students. Specifically,students whose parents had occupations requiringadvanced mathematics skills performed over a fullperformance level higher than other students whoseparents had occupations associated with similar educationand income. These results suggest that the value of skills
modeled by parents through pursuit of education andoccupations may have a greater influence on studentperformance than the income or prestige associated withthe attainment of these goals.
Parents may also model the value of skills andlearning by developing a positive home environment fortheir children. Such an environment includes role modelswho demonstrate the value of skills and learning as wellas resources and opportunities to learn. Socio-economicstatus (SES) was used as a measure to describe the relativeadvantage associated with a student’s home environment.Canadian students tend to be more advantaged thanstudents in all OECD countries combined, but studentsin some provinces are more advantaged than others. Inevery province, students with higher SES tend to performbetter in mathematics. Furthermore, students tend tohave better performance when they attend schools withstudents from high SES backgrounds, regardless of theirown families’ SES.
Note22. Statistics Canada. 2003. Earnings of Canadians, 2001
Census. Catalogue no. 97F0019XCB2001000. Ottawa.
Figure 4.8
School socio-economic status (SES) and student performance in mathematics in Canada
Low SES schools
Middle SES schools
High SES schools
540520500480460
PISA overall mathematics performance (controlled for individual SES)
620600580560
PISA overall mathematics performance (controlled for individual SES)
540520500480460 620600580560

63
Measuring up: Canadian Results of the OECD PISA Study
Conclusion
domains. They were outperformed by eight countries inspace and shape compared to only one or two countries inthe other sub-domains. Further study is needed tounderstand why the performance of Canadian studentswas lower in space and shape relative to the other threesub-domains.
The mathematical abilities of students are alsodescribed using six proficiency levels. A higherproportion of Canadian students performed at the twohighest proficiency levels (Levels 5 and 6) compared tothe OECD average. Furthermore, a lower proportion of15-year-old Canadians performed at Level 1 or below.Using these proficiency levels, it is also possible to expressthe differences not only in terms of statistical significance,but also in terms of differences in mathematical abilities.The difference between the country with the highestoverall mathematics result (Hong Kong-China) and theresult for Canada is equivalent to less than a third of aproficiency level. On the other hand, Canadian 15-year-old students scored more than half a proficiency levelabove the OECD average.
It is possible to compare performance in the twomathematics sub-domains included in both PISA 2000and 2003. For Canada and most countries for which acomparison is possible, there was no change in theperformance on space and shape while there was animprovement in the performance on change andrelationships.
At the provincial level, all provinces performed ator above the OECD average in mathematics.Furthermore, students from Alberta, British Columbia,and Quebec performed as well as those from the topperforming countries. Examining provincial results inmathematics by proficiency levels reveals some importantdifferences. Students from Alberta performed around half
Ensuring that Canadian students acquire the skills andknowledge to participate fully in a knowledge-basedeconomy and society is a goal shared by all levels ofgovernment and by the Canadian population. WillCanadian youth be well equipped to compete intomorrow’s economy? Have they developed a foundationof knowledge and skills for lifelong learning?
The OECD Programme for International StudentAssessment (PISA) was first conducted in 2000. Itcompares how 15-year-old students from Canadaperform in three domains - mathematics, reading, andscience - in comparison with their peers from othercountries. Each PISA assessment provides more detailedinformation on one of the three domains. Reading wasthe major domain in 2000 and mathematics in 2003. Inaddition to having reading and science as minor domains,the 2003 assessment also assessed problem-solving skills.
The PISA 2000 results were positive for Canadasince the students’ performances were among the highestand most equitably distributed. Results from this reporton PISA 2003 also show that 15-year-old students inCanada performed well in all four domains assessed,relative to their international peers.
Canadian 15-year-olds performed well inmathematics
Students from only two countries (Hong Kong-Chinaand Finland) outperformed Canada’s 15-year-olds inmathematics. The PISA 2003 design allowed for anexamination of four sub-domains corresponding to fourcontent areas in mathematics: space and shape; change andrelationships, quantity, and uncertainty. Canadian studentsperformed less well in the space and shape sub-domainrelative to their performance in the three other sub-
64
Conclusion
Boys significantly outperformed girls inmathematics, but the magnitude of thedifference is small
Another matter that warrants further analysis is thegender difference in performance. In 27 countries,including Canada, boys’ outperformed girls inmathematics. However, it should be noted that themagnitude of the difference in Canada was small,representing only about a sixth of a proficiency level.Furthermore, there was no detectable difference betweenboys and girls in three provinces (Prince Edward Island,Quebec, and Saskatchewan).
As was the case in PISA 2000, there was a relativelylarge difference favouring girls in reading. This differencewas significant in all but one country and in all provinces.As was the case with mathematics, boys performedsignificantly higher than girls in science in Canadaoverall. However, among the provinces, the differencewas significant in Nova Scotia, Ontario and Manitoba.There was no gender difference in problem solving inCanada and in most provinces.
Differences in performance between studentsin the French-language and English-languageschool systems varied by province and subject
Except for Ontario, there was no difference in themathematics performance between students in theEnglish-language and French-language school systems.
In Ontario, students in the French-language schoolsystem performed lower than their peers in the English-language school system in mathematics as well as inreading, science, and problem solving. On the other hand,in Quebec there was no difference between the French-language and English-language school systems in any ofthe domains assessed.
The performance of students in the French-language school system from New Brunswick and NovaScotia was lower in reading, science and problem solvingas was the performance of students from the French-language school system in Manitoba in reading andscience.
a proficiency level higher, or more, than students fromNewfoundland and Labrador, Saskatchewan, NovaScotia, New Brunswick, and Prince Edward Island onthe combined mathematics scale. On the other hand,students from Prince Edward Island were outperformedby about half a proficiency level or more by students fromManitoba, Ontario, Quebec, British Columbia, andAlberta.
Between 2000 and 2003, Canadian students’performance remained unchanged in readingbut was lower in science
Canadian 15-year-olds also performed well in the otherdomains measured by PISA. Only Finland outperformedCanada in reading, while four countries outperformedCanada in science and problem solving (Finland, Japan,Hong Kong-China, Korea).
Compared with PISA 2000, the average readingperformance of Canadian 15-year-olds remainedunchanged in PISA 2003. On the other hand, the averagescience performance was lower in PISA 2003. While thisdecrease cannot be seen as a trend, it warrants furtheranalysis. Since science will be the major domain of PISA2006, the third cycle of PISA will provide additionalinsight on how well equipped Canadian students are inthis domain, will allow for a relative estimate of trend inperformance, and will provide additional insight into thefactors associated with science performance.
All provinces did well in the three minor domainsof reading, science, and problem solving and performedat or above the OECD average with one exception:Prince Edward Island performed below the OECDaverage in science. In fact, students from Albertaperformed equally well as students from the topperforming countries in all three domains. Similarly, theperformance of the students from British Columbia wasas good as students from the top performing countriesin reading. Although most provinces performed at orabove the OECD average, differences in performanceamong the provinces in all four PISA domains raiseinteresting questions of equity across Canada.

65
Measuring up: Canadian Results of the OECD PISA Study
Mathematics confidence and anxiety arestrongly related to achievement
The results presented in this report also reveal thatstudent engagement in mathematics is related toachievement. In fact, students with high mathematicsconfidence performed around two proficiency levelshigher than did students with low confidance.Furthermore, students with high mathematical anxietyperformed the equivalent of one proficiency level lowerthan students with low anxiety. These results suggest thathigh Mathematics confidence and low mathematicsanxiety may be important outcomes on their own.
Family background characteristics are relatedto student performance
Family background characteristics were also related tostudent performance in mathematics. In all provinces,15-year-old students whose parents had a universitydegree performed about two-thirds of a proficiency levelhigher than those whose parents had high schooleducation or less. Additionally, students whose parentshad an occupation requiring advanced mathematicsperformed almost one proficiency level higher than otherstudents whose parents had occupations associated withsimilar education and income but whose occupation didnot require advanced mathematics.
Students from families with higher socio-economicstatus also tended to perform better in mathematics.However, socio-economic status had a smaller impact
on mathematics achievement in Canada than in allOECD countries combined.
The socio-economic composition of schoolsinfluences mathematics achievement
Students who attended schools with students from highersocio-economic status (SES) backgrounds performedbetter in mathematics regardless of the SES of theirfamily. This finding suggests that students are not onlyaffected by the socio-economic circumstances of theirown parents, but by those of their peers as well. However,there is a great deal of overlap in the distributions ofstudent performance by the socio-economic compositionof the schools they attend. This finding indicates thateven if all students and schools had similar socio-economic status, there would still be differences instudent performance.
The performance of Canadian 15-year-olds meritsrecognition yet also raises some concerns. Overall, whencompared with their peers in other participatingcountries, Canadian students did well on the PISA 2003assessment. However, significant provincial differencesin many domains exist. Furthermore, the relatively lowerperformance in the space and shape sub-domain and thescience domain as well as the lower performance inscience between PISA 2000 and PISA 2003 arenoteworthy. Nevertheless, the performance of Canadianyouth in the PISA assessment is promising to their futureand the future of Canada.

© SchoolNet, Industry Canada
© SchoolNet, Industry Canada
67
Measuring up: Canadian Results of the OECD PISA Study
Appendix A
PISA sampling proceduresand response rates
The accuracy of PISA survey results depends on thequality of the information on which the sample is basedas well as the sampling procedures. The PISA samplefor Canada was based on a two-stage stratified sample.The first stage consisted of sampling individual schoolsin which 15-year-old students were enrolled. Schoolswere sampled systematically with probabilitiesproportional to size, the measure of size being a functionof the estimated number of eligible (15-year-old)students enrolled. A minimum of 150 schools wererequired to be selected in each country. In Canada, amuch larger sample of schools was selected in order toproduce reliable estimates for each province and for eachof the language systems in the five provinces where thesepopulations were separately sampled (Nova Scotia, NewBrunswick, Quebec, Ontario and Manitoba).
The second stage of the selection process sampledstudents within sampled schools. Once schools wereselected, a list of each sampled school’s 15-year-oldstudents was prepared. From this list, 35 students werethen selected with equal probability. All 15-year oldstudents were selected if fewer than 35 were enrolled.Additionally, in Prince Edward Island, Nova Scotia andNew Brunswick and in the French-language schoolsystem in Manitoba, more than 35 students were selectedin order to meet sample size requirements.
In order to minimize the potential for response bias,data quality standards in PISA require minimumparticipation rates for schools and students. At the
national level, a minimum response rate of 85% wasrequired for schools initially selected. School responserates were also considered acceptable where the initialschool response rate was between 65% and 85% andreplacement schools were used to achieve a schoolresponse rate of 85% or higher. Schools with studentparticipation rates between 25% and 50% were notcounted as participating schools, but data for theseschools were included in the database. Schools withstudent participation rates of less than 25% were notcounted as participating and their data were excludedfrom the database.
PISA also requires a minimum studentparticipation rate of 80% within all participating schoolscombined (original sample and replacements) at thenational level.
Table A1 shows the response rates for schools andstudents, before and after replacement, for Canada andthe 10 provinces. At the national level 1,162 schools wereselected to participate in PISA and 1,040 of these initiallyselected schools participated. Rather than calculatingschool participation rates by dividing the number ofparticipating schools by the total number of schools,school response rates were weighted based on 15-year-old enrollment numbers in each school.
With the exception of Ontario, school responserates across the provinces were 95% or higher. In Ontario,the school response rate was 64.3% after replacement.

68
Appendix A / PISA sampling procedures and response rates
Table A1
PISA 2003 school and student response rates
Total number School School of students Total
Total number response response sampled number of Weightedof selected rate before rate after (participating and students student
schools replacement replacement not participating) participating participation(participating rate after
and not weighted weighted un- un- replacementProvinces participating) N %* N %* weighted weighted weighted weighted (%)
Newfoundlandand Labrador 111 108 98.8 108 98.8 2,606 5,913 2,301 5,215 88.2Prince Edward Island 26 26 100.0 26 100.0 1,832 1,832 1,653 1,653 90.2Nova Scotia 118 117 98.8 117 98.8 3,308 10,274 2,871 8,917 86.8New Brunswick 76 76 100.0 76 100.0 4,209 8,341 3,781 7,480 89.7Quebec 138 131 96.9 131 96.9 3,918 71,373 3,357 61,286 85.9Ontario 202 116 53.2 138 64.3 4,055 81,701 3,230 63,673 77.9Manitoba 126 117 93.7 120 95.9 3,108 12,217 2,778 10,605 86.8Saskatchewan 122 112 95.2 112 95.2 2,657 11,939 2,350 10,478 87.8Alberta 119 115 94.9 116 95.2 2,777 34,504 2,442 29,587 85.8British Columbia 124 122 98.9 122 98.9 3,429 40,622 2,949 34,935 86.0
Canada 1,162 1,040 80.0 1,066 84.4 31,899 278,716 27,712 233,829 83.9
* School response rates were weighted based on 15-year-old enrollment
As response rates were lower than anticipated inOntario, a detailed analysis was undertaken in thisprovince to detect whether non-participation of schoolswas concentrated in one specific area, i.e. if there appearedto be a bias. To do this, the distribution of the non-participating schools was examined by school size andsector (French and English), by urban/rural and bypublic/private sector. Information on these characteristicswas available for all schools, whether they participatedin PISA or not. There were no differences in thedistribution of various characteristics between in-scopeschools and participating schools. Further analysis
revealed that the distribution of schools by school boardwas similar for both in-scope schools and respondingschools and that non-response was not concentratedwithin particular school boards. Consequently, amongthe variables that were available for analysis, there wasno evidence of bias between responding and non-responding schools.
This analysis was shared with the internationalPISA consortium that validated the quality of theCanadian database and concluded that the Canadian datawere of good quality.
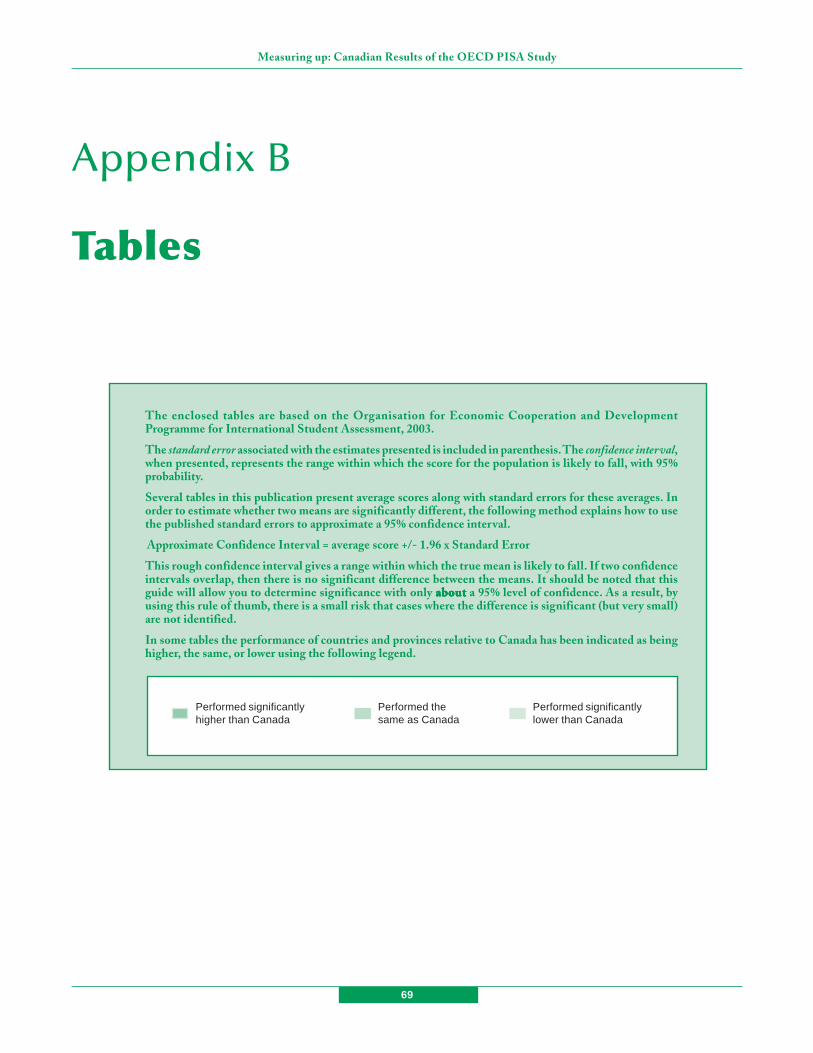
69
Measuring up: Canadian Results of the OECD PISA Study
The enclosed tables are based on the Organisation for Economic Cooperation and DevelopmentProgramme for International Student Assessment, 2003.
The standard error associated with the estimates presented is included in parenthesis. The confidence interval,when presented, represents the range within which the score for the population is likely to fall, with 95%probability.
Several tables in this publication present average scores along with standard errors for these averages. Inorder to estimate whether two means are significantly different, the following method explains how to usethe published standard errors to approximate a 95% confidence interval.
Approximate Confidence Interval = average score +/- 1.96 x Standard Error
This rough confidence interval gives a range within which the true mean is likely to fall. If two confidenceintervals overlap, then there is no significant difference between the means. It should be noted that thisguide will allow you to determine significance with only aboutaboutaboutaboutabout a 95% level of confidence. As a result, byusing this rule of thumb, there is a small risk that cases where the difference is significant (but very small)are not identified.
In some tables the performance of countries and provinces relative to Canada has been indicated as beinghigher, the same, or lower using the following legend.
Performed significantlyhigher than Canada
Performed significantlylower than Canada
Performed thesame as Canada
Appendix B
Tables
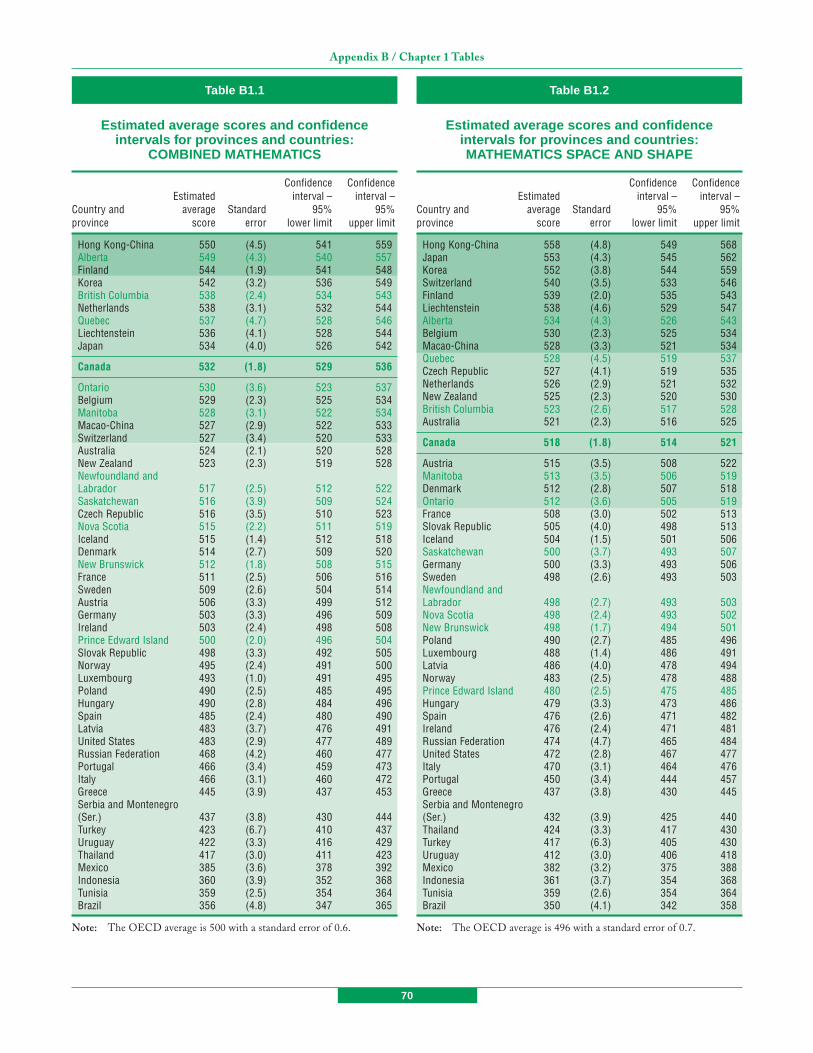
70
Appendix B / Chapter 1 Tables
Table B1.1
Estimated average scores and confidenceintervals for provinces and countries:
COMBINED MATHEMATICS
Confidence ConfidenceEstimated interval – interval –
Country and average Standard 95% 95%province score error lower limit upper limit
Hong Kong-China 550 (4.5) 541 559Alberta 549 (4.3) 540 557Finland 544 (1.9) 541 548Korea 542 (3.2) 536 549British Columbia 538 (2.4) 534 543Netherlands 538 (3.1) 532 544Quebec 537 (4.7) 528 546Liechtenstein 536 (4.1) 528 544Japan 534 (4.0) 526 542
Canada 532 (1.8) 529 536
Ontario 530 (3.6) 523 537Belgium 529 (2.3) 525 534Manitoba 528 (3.1) 522 534Macao-China 527 (2.9) 522 533Switzerland 527 (3.4) 520 533Australia 524 (2.1) 520 528New Zealand 523 (2.3) 519 528Newfoundland andLabrador 517 (2.5) 512 522Saskatchewan 516 (3.9) 509 524Czech Republic 516 (3.5) 510 523Nova Scotia 515 (2.2) 511 519Iceland 515 (1.4) 512 518Denmark 514 (2.7) 509 520New Brunswick 512 (1.8) 508 515France 511 (2.5) 506 516Sweden 509 (2.6) 504 514Austria 506 (3.3) 499 512Germany 503 (3.3) 496 509Ireland 503 (2.4) 498 508Prince Edward Island 500 (2.0) 496 504Slovak Republic 498 (3.3) 492 505Norway 495 (2.4) 491 500Luxembourg 493 (1.0) 491 495Poland 490 (2.5) 485 495Hungary 490 (2.8) 484 496Spain 485 (2.4) 480 490Latvia 483 (3.7) 476 491United States 483 (2.9) 477 489Russian Federation 468 (4.2) 460 477Portugal 466 (3.4) 459 473Italy 466 (3.1) 460 472Greece 445 (3.9) 437 453Serbia and Montenegro(Ser.) 437 (3.8) 430 444Turkey 423 (6.7) 410 437Uruguay 422 (3.3) 416 429Thailand 417 (3.0) 411 423Mexico 385 (3.6) 378 392Indonesia 360 (3.9) 352 368Tunisia 359 (2.5) 354 364Brazil 356 (4.8) 347 365
Note: The OECD average is 500 with a standard error of 0.6.
Table B1.2
Estimated average scores and confidenceintervals for provinces and countries:MATHEMATICS SPACE AND SHAPE
Confidence ConfidenceEstimated interval – interval –
Country and average Standard 95% 95%province score error lower limit upper limit
Hong Kong-China 558 (4.8) 549 568Japan 553 (4.3) 545 562Korea 552 (3.8) 544 559Switzerland 540 (3.5) 533 546Finland 539 (2.0) 535 543Liechtenstein 538 (4.6) 529 547Alberta 534 (4.3) 526 543Belgium 530 (2.3) 525 534Macao-China 528 (3.3) 521 534Quebec 528 (4.5) 519 537Czech Republic 527 (4.1) 519 535Netherlands 526 (2.9) 521 532New Zealand 525 (2.3) 520 530British Columbia 523 (2.6) 517 528Australia 521 (2.3) 516 525
Canada 518 (1.8) 514 521
Austria 515 (3.5) 508 522Manitoba 513 (3.5) 506 519Denmark 512 (2.8) 507 518Ontario 512 (3.6) 505 519France 508 (3.0) 502 513Slovak Republic 505 (4.0) 498 513Iceland 504 (1.5) 501 506Saskatchewan 500 (3.7) 493 507Germany 500 (3.3) 493 506Sweden 498 (2.6) 493 503Newfoundland andLabrador 498 (2.7) 493 503Nova Scotia 498 (2.4) 493 502New Brunswick 498 (1.7) 494 501Poland 490 (2.7) 485 496Luxembourg 488 (1.4) 486 491Latvia 486 (4.0) 478 494Norway 483 (2.5) 478 488Prince Edward Island 480 (2.5) 475 485Hungary 479 (3.3) 473 486Spain 476 (2.6) 471 482Ireland 476 (2.4) 471 481Russian Federation 474 (4.7) 465 484United States 472 (2.8) 467 477Italy 470 (3.1) 464 476Portugal 450 (3.4) 444 457Greece 437 (3.8) 430 445Serbia and Montenegro(Ser.) 432 (3.9) 425 440Thailand 424 (3.3) 417 430Turkey 417 (6.3) 405 430Uruguay 412 (3.0) 406 418Mexico 382 (3.2) 375 388Indonesia 361 (3.7) 354 368Tunisia 359 (2.6) 354 364Brazil 350 (4.1) 342 358
Note: The OECD average is 496 with a standard error of 0.7.

71
Measuring up: Canadian Results of the OECD PISA Study
Table B1.3
Estimated average scores and confidenceintervals for provinces and countries:
MATHEMATICS CHANGE AND RELATIONSHIPS
Confidence ConfidenceEstimated interval – interval –
Country and average Standard 95% 95%province score error lower limit upper limit
Alberta 554 (4.4) 546 563Netherlands 551 (3.1) 545 558Korea 548 (3.5) 541 554British Columbia 543 (2.5) 538 548Finland 543 (2.2) 539 547Hong Kong-China 540 (4.7) 531 549Liechtenstein 540 (3.7) 532 547Quebec 538 (5.0) 528 547
Canada 537 (1.9) 533 540
Japan 536 (4.3) 528 545Ontario 536 (3.8) 528 543Belgium 535 (2.4) 530 540Manitoba 532 (3.2) 526 538New Zealand 526 (2.4) 521 530Australia 525 (2.3) 521 530Switzerland 523 (3.7) 516 530Newfoundland andLabrador 521 (2.6) 516 526Saskatchewan 520 (4.1) 512 528France 520 (2.6) 515 525Macao-China 519 (3.5) 512 526Nova Scotia 517 (2.2) 513 522Czech Republic 515 (3.5) 508 522New Brunswick 513 (1.9) 509 517Iceland 509 (1.4) 507 512Denmark 509 (3.0) 503 515Germany 507 (3.7) 500 514Ireland 506 (2.4) 501 511Sweden 505 (2.9) 499 511Prince Edward Island 502 (2.0) 498 506Austria 500 (3.6) 493 507Hungary 495 (3.1) 489 501Slovak Republic 494 (3.5) 488 501Norway 488 (2.6) 483 493Latvia 487 (4.4) 479 496Luxembourg 487 (1.2) 485 489United States 486 (3.0) 480 491Poland 484 (2.7) 479 490Spain 481 (2.8) 475 486Russian Federation 477 (4.6) 468 486Portugal 468 (4.0) 460 476Italy 452 (3.2) 446 458Greece 436 (4.3) 427 444Turkey 423 (7.6) 408 438Serbia and Montenegro(Ser.) 419 (4.0) 411 427Uruguay 417 (3.6) 410 424Thailand 405 (3.4) 398 412Mexico 364 (4.1) 356 372Tunisia 337 (2.8) 331 342Indonesia 334 (4.6) 325 343Brazil 333 (6.0) 321 345
Note: The OECD average is 499 with a standard error of 0.7.
Table B1.4
Estimated average scores and confidenceintervals for provinces and countries:
MATHEMATICS QUANTITY
Confidence ConfidenceEstimated interval – interval –
Country and average Standard 95% 95%province score error lower limit upper limit
Finland 549 (1.8) 545 552Hong Kong-China 545 (4.2) 537 553Alberta 545 (4.0) 537 552Korea 537 (3.0) 531 543Liechtenstein 534 (4.1) 525 542British Columbia 533 (2.3) 528 538Macao-China 533 (3.0) 527 539Switzerland 533 (3.1) 527 539Quebec 531 (4.7) 522 541Belgium 530 (2.3) 525 534Netherlands 528 (3.1) 522 534
Canada 528 (1.8) 524 532
Czech Republic 528 (3.5) 521 535Japan 527 (3.8) 519 534Ontario 526 (3.8) 519 534Manitoba 523 (3.2) 517 529Australia 517 (2.1) 513 521Denmark 516 (2.6) 510 521Germany 514 (3.4) 507 520Sweden 514 (2.5) 509 518Iceland 513 (1.5) 510 516Austria 513 (3.0) 507 519Saskatchewan 513 (3.9) 505 520Newfoundland andLabrador 512 (2.6) 507 517Slovak Republic 513 (3.4) 506 519New Zealand 511 (2.2) 507 515Nova Scotia 511 (2.2) 506 515France 507 (2.5) 502 512New Brunswick 507 (2.1) 503 511Ireland 502 (2.5) 497 507Luxembourg 501 (1.1) 499 504Hungary 496 (2.7) 491 502Prince Edward Island 496 (2.2) 491 500Norway 494 (2.2) 490 499Spain 492 (2.5) 487 497Poland 492 (2.5) 487 497Latvia 482 (3.6) 475 489United States 476 (3.2) 470 483Italy 475 (3.4) 468 481Russian Federation 472 (4.0) 465 480Portugal 465 (3.5) 459 472Serbia and Montenegro(Ser.) 456 (3.8) 449 464Greece 446 (4.0) 438 454Uruguay 430 (3.2) 423 436Thailand 415 (3.1) 409 421Turkey 413 (6.8) 400 426Mexico 394 (3.9) 386 402Tunisia 364 (2.8) 359 370Brazil 360 (5.0) 350 370Indonesia 357 (4.3) 349 366
Note: The OECD average is 501 with a standard error of 0.6.
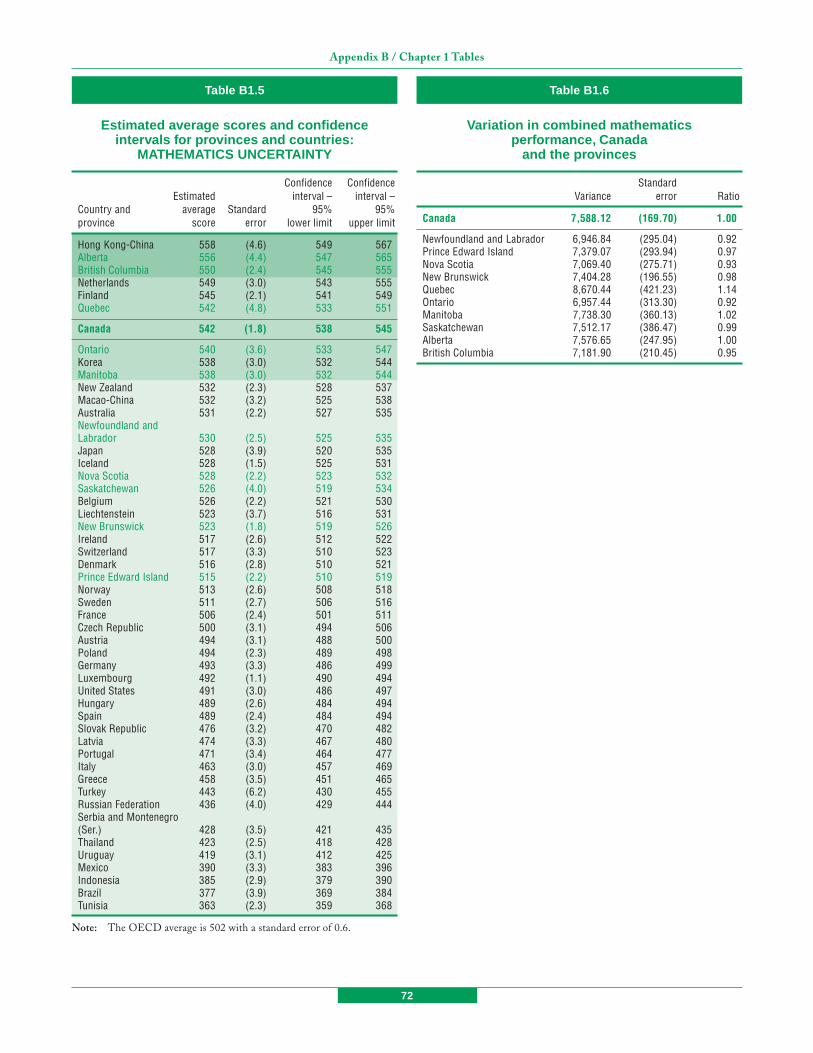
72
Appendix B / Chapter 1 Tables
Table B1.5
Estimated average scores and confidenceintervals for provinces and countries:
MATHEMATICS UNCERTAINTY
Confidence ConfidenceEstimated interval – interval –
Country and average Standard 95% 95%province score error lower limit upper limit
Hong Kong-China 558 (4.6) 549 567Alberta 556 (4.4) 547 565British Columbia 550 (2.4) 545 555Netherlands 549 (3.0) 543 555Finland 545 (2.1) 541 549Quebec 542 (4.8) 533 551
Canada 542 (1.8) 538 545
Ontario 540 (3.6) 533 547Korea 538 (3.0) 532 544Manitoba 538 (3.0) 532 544New Zealand 532 (2.3) 528 537Macao-China 532 (3.2) 525 538Australia 531 (2.2) 527 535Newfoundland andLabrador 530 (2.5) 525 535Japan 528 (3.9) 520 535Iceland 528 (1.5) 525 531Nova Scotia 528 (2.2) 523 532Saskatchewan 526 (4.0) 519 534Belgium 526 (2.2) 521 530Liechtenstein 523 (3.7) 516 531New Brunswick 523 (1.8) 519 526Ireland 517 (2.6) 512 522Switzerland 517 (3.3) 510 523Denmark 516 (2.8) 510 521Prince Edward Island 515 (2.2) 510 519Norway 513 (2.6) 508 518Sweden 511 (2.7) 506 516France 506 (2.4) 501 511Czech Republic 500 (3.1) 494 506Austria 494 (3.1) 488 500Poland 494 (2.3) 489 498Germany 493 (3.3) 486 499Luxembourg 492 (1.1) 490 494United States 491 (3.0) 486 497Hungary 489 (2.6) 484 494Spain 489 (2.4) 484 494Slovak Republic 476 (3.2) 470 482Latvia 474 (3.3) 467 480Portugal 471 (3.4) 464 477Italy 463 (3.0) 457 469Greece 458 (3.5) 451 465Turkey 443 (6.2) 430 455Russian Federation 436 (4.0) 429 444Serbia and Montenegro(Ser.) 428 (3.5) 421 435Thailand 423 (2.5) 418 428Uruguay 419 (3.1) 412 425Mexico 390 (3.3) 383 396Indonesia 385 (2.9) 379 390Brazil 377 (3.9) 369 384Tunisia 363 (2.3) 359 368
Note: The OECD average is 502 with a standard error of 0.6.
Table B1.6
Variation in combined mathematicsperformance, Canada
and the provinces
StandardVariance error Ratio
Canada 7,588.12 (169.70) 1.00
Newfoundland and Labrador 6,946.84 (295.04) 0.92Prince Edward Island 7,379.07 (293.94) 0.97Nova Scotia 7,069.40 (275.71) 0.93New Brunswick 7,404.28 (196.55) 0.98Quebec 8,670.44 (421.23) 1.14Ontario 6,957.44 (313.30) 0.92Manitoba 7,738.30 (360.13) 1.02Saskatchewan 7,512.17 (386.47) 0.99Alberta 7,576.65 (247.95) 1.00British Columbia 7,181.90 (210.45) 0.95

73
Measuring up: Canadian Results of the OECD PISA Study
Table B1.7
Percent of students at each level for provinces and countries COMBINED MATHEMATICS
BelowLevel 1 Level 1 Level 2 Level 3 Level 4 Level 5 Level 6
Country and province % (SE) % (SE) % (SE) % (SE) % (SE) % (SE) % (SE)
Finland 1.5 (0.2) 5.3 (0.4) 16.0 (0.6) 27.7 (0.7) 26.1 (0.9) 16.7 (0.6) 6.7 (0.5)Alberta 1.7 (0.3) 5.7 (0.8) 15.0 (2.1) 24.6 (1.4) 26.0 (1.7) 18.5 (1.1) 8.5 (1.4)British Columbia 1.7 (0.3) 6.9 (0.6) 17.6 (1.0) 25.8 (1.1) 26.3 (1.0) 15.8 (0.8) 5.9 (0.6)Korea 2.5 (0.3) 7.1 (0.7) 16.6 (0.8) 24.1 (1.0) 25.0 (1.1) 16.7 (0.8) 8.1 (0.9)Ontario 2.0 (0.4) 7.7 (0.8) 19.1 (1.1) 27.7 (1.3) 25.1 (1.3) 13.8 (1.2) 4.6 (0.8)
Canada 2.4 (0.3) 7.7 (0.4) 18.3 (0.6) 26.2 (0.7) 25.1 (0.6) 14.8 (0.5) 5.5 (0.4)
Hong Kong-China 3.9 (0.7) 6.5 (0.6) 13.9 (1.0) 20.0 (1.2) 25.0 (1.2) 20.2 (1.0) 10.5 (0.9)Netherlands 2.6 (0.7) 8.4 (0.9) 18.0 (1.1) 23.0 (1.1) 22.6 (1.3) 18.2 (1.1) 7.3 (0.6)Manitoba 2.8 (0.6) 8.2 (0.8) 19.2 (1.2) 26.3 (1.4) 24.5 (1.5) 14.2 (1.2) 4.8 (0.6)Quebec 3.3 (0.6) 7.8 (0.9) 16.2 (1.3) 23.5 (1.5) 25.6 (1.5) 16.6 (1.2) 7.0 (0.8)Macao-China 2.3 (0.6) 8.8 (1.3) 19.6 (1.4) 26.8 (1.8) 23.7 (1.7) 13.8 (1.6) 4.8 (1.0)Liechtenstein 4.8 (1.3) 7.5 (1.7) 17.3 (2.8) 21.6 (2.5) 23.2 (3.1) 18.3 (3.2) 7.3 (1.7)Newfoundland andLabrador 2.9 (0.6) 9.6 (0.9) 22.2 (1.6) 27.5 (1.5) 23.6 (1.4) 11.2 (1.1) 3.0 (0.5)Japan 4.7 (0.7) 8.6 (0.7) 16.3 (0.8) 22.4 (1.0) 23.6 (1.2) 16.1 (1.0) 8.2 (1.1)Nova Scotia 3.2 (0.5) 10.4 (0.7) 21.5 (1.1) 28.3 (1.1) 22.3 (1.4) 11.3 (1.1) 3.0 (0.6)Saskatchewan 3.9 (1.0) 9.9 (0.9) 20.9 (1.5) 26.7 (1.5) 23.7 (1.5) 11.7 (1.1) 3.2 (0.5)New Brunswick 3.7 (0.5) 10.6 (0.6) 22.8 (0.9) 27.4 (1.0) 22.0 (1.0) 10.1 (0.8) 3.4 (0.4)Australia 4.3 (0.4) 10.0 (0.5) 18.6 (0.6) 24.0 (0.7) 23.3 (0.6) 14.0 (0.5) 5.8 (0.4)Switzerland 4.9 (0.4) 9.6 (0.6) 17.5 (0.8) 24.3 (1.0) 22.5 (0.7) 14.2 (1.1) 7.0 (0.9)Iceland 4.5 (0.4) 10.5 (0.6) 20.2 (1.0) 26.1 (0.9) 23.2 (0.8) 11.7 (0.6) 3.7 (0.4)New Zealand 4.9 (0.4) 10.1 (0.6) 19.2 (0.7) 23.2 (0.9) 21.9 (0.8) 14.1 (0.6) 6.6 (0.4)Denmark 4.7 (0.5) 10.7 (0.6) 20.6 (0.9) 26.2 (0.9) 21.9 (0.8) 11.8 (0.9) 4.1 (0.5)Belgium 7.2 (0.6) 9.3 (0.5) 15.9 (0.6) 20.1 (0.7) 21.0 (0.6) 17.5 (0.7) 9.0 (0.5)Czech Republic 5.0 (0.7) 11.6 (0.9) 20.1 (1.0) 24.3 (0.9) 20.8 (0.9) 12.9 (0.8) 5.3 (0.5)France 5.6 (0.7) 11.0 (0.8) 20.2 (0.8) 25.9 (1.0) 22.1 (1.0) 11.6 (0.7) 3.5 (0.4)Ireland 4.7 (0.6) 12.1 (0.8) 23.6 (0.8) 28.0 (0.8) 20.2 (1.1) 9.1 (0.8) 2.2 (0.3)Sweden 5.6 (0.5) 11.7 (0.6) 21.7 (0.8) 25.5 (0.9) 19.8 (0.8) 11.6 (0.6) 4.1 (0.5)Prince Edward Island 5.2 (0.5) 12.5 (1.0) 23.7 (1.6) 28.0 (1.8) 20.5 (1.2) 7.5 (0.8) 2.6 (0.7)Austria 5.6 (0.7) 13.2 (0.8) 21.6 (0.9) 24.9 (1.1) 20.5 (0.8) 10.5 (0.9) 3.7 (0.5)Slovak Republic 6.7 (0.8) 13.2 (0.9) 23.5 (0.9) 24.9 (1.1) 18.9 (0.8) 9.8 (0.7) 2.9 (0.4)Norway 6.9 (0.5) 13.9 (0.8) 23.7 (1.2) 25.2 (1.0) 18.9 (1.0) 8.7 (0.6) 2.7 (0.3)OECD average 8.2 (0.2) 13.2 (0.2) 21.1 (0.1) 23.7 (0.2) 19.1 (0.2) 10.6 (0.1) 4.0 (0.1)Germany 9.2 (0.8) 12.4 (0.8) 19.0 (1.0) 22.6 (0.8) 20.6 (1.0) 12.2 (0.9) 4.1 (0.5)Luxembourg 7.4 (0.4) 14.3 (0.6) 22.9 (0.9) 25.9 (0.8) 18.7 (0.8) 8.5 (0.6) 2.4 (0.3)Poland 6.8 (0.6) 15.2 (0.8) 24.8 (0.7) 25.3 (0.9) 17.7 (0.9) 7.8 (0.5) 2.3 (0.3)Spain 8.1 (0.7) 14.9 (0.9) 24.7 (0.8) 26.7 (1.0) 17.7 (0.6) 6.5 (0.6) 1.4 (0.2)Hungary 7.8 (0.8) 15.2 (0.8) 23.8 (1.0) 24.3 (0.9) 18.2 (0.9) 8.2 (0.7) 2.5 (0.4)Latvia 7.6 (0.9) 16.1 (1.1) 25.5 (1.2) 26.3 (1.2) 16.6 (1.2) 6.3 (0.7) 1.6 (0.4)United States 10.2 (0.8) 15.5 (0.8) 23.9 (0.8) 23.8 (0.8) 16.6 (0.7) 8.0 (0.5) 2.0 (0.4)Portugal 11.3 (1.1) 18.8 (1.0) 27.1 (1.0) 24.0 (1.0) 13.4 (0.9) 4.6 (0.5) 0.8 (0.2)Russian Federation 11.4 (1.0) 18.8 (1.1) 26.4 (1.1) 23.1 (1.0) 13.2 (0.9) 5.4 (0.6) 1.6 (0.4)Italy 13.2 (1.2) 18.7 (0.9) 24.7 (1.0) 22.9 (0.8) 13.4 (0.7) 5.5 (0.4) 1.5 (0.2)Greece 17.8 (1.2) 21.2 (1.2) 26.3 (1.0) 20.2 (1.0) 10.6 (0.9) 3.4 (0.5) 0.6 (0.2)Serbia andMontenegro (Ser.) 17.6 (1.3) 24.5 (1.1) 28.6 (1.2) 18.9 (1.1) 8.1 (0.9) 2.1 (0.4) 0.2 (0.1)Uruguay 26.3 (1.3) 21.8 (0.8) 24.2 (0.9) 16.8 (0.7) 8.2 (0.7) 2.3 (0.3) 0.5 (0.2)Turkey 27.7 (2.0) 24.6 (1.3) 22.1 (1.1) 13.5 (1.3) 6.8 (1.0) 3.1 (0.8) 2.4 (1.0)Thailand 23.8 (1.3) 30.2 (1.2) 25.4 (1.1) 13.7 (0.8) 5.3 (0.5) 1.5 (0.3) 0.2 (0.1)Mexico 38.1 (1.7) 27.9 (1.0) 20.8 (0.9) 10.1 (0.8) 2.7 (0.4) 0.4 (0.1) 0.0 (0.0)Brazil 53.3 (1.9) 21.9 (1.1) 14.1 (0.9) 6.8 (0.8) 2.7 (0.5) 0.9 (0.4) 0.3 (0.2)Tunisia 51.1 (1.4) 26.9 (1.0) 14.7 (0.8) 5.7 (0.6) 1.4 (0.3) 0.2 (0.1) 0.0Indonesia 50.5 (2.1) 27.6 (1.1) 14.8 (1.1) 5.5 (0.7) 1.4 (0.4) 0.2 (0.1) 0.0
Note: Countries and provinces have been sorted by the total percentage of students who attained level 2 or higher.
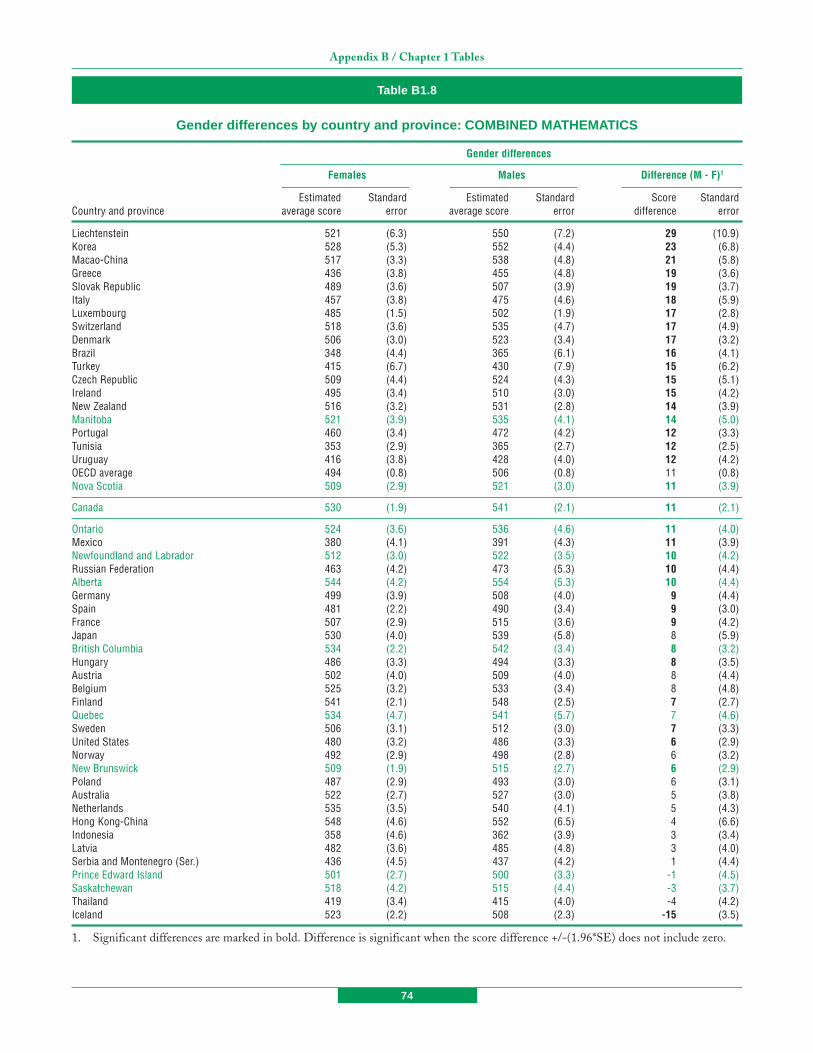
74
Appendix B / Chapter 1 Tables
Table B1.8
Gender differences by country and province: COMBINED MATHEMATICS
Gender differences
Females Males Difference (M - F)1
Estimated Standard Estimated Standard Score StandardCountry and province average score error average score error difference error
Liechtenstein 521 (6.3) 550 (7.2) 29 (10.9)Korea 528 (5.3) 552 (4.4) 23 (6.8)Macao-China 517 (3.3) 538 (4.8) 21 (5.8)Greece 436 (3.8) 455 (4.8) 19 (3.6)Slovak Republic 489 (3.6) 507 (3.9) 19 (3.7)Italy 457 (3.8) 475 (4.6) 18 (5.9)Luxembourg 485 (1.5) 502 (1.9) 17 (2.8)Switzerland 518 (3.6) 535 (4.7) 17 (4.9)Denmark 506 (3.0) 523 (3.4) 17 (3.2)Brazil 348 (4.4) 365 (6.1) 16 (4.1)Turkey 415 (6.7) 430 (7.9) 15 (6.2)Czech Republic 509 (4.4) 524 (4.3) 15 (5.1)Ireland 495 (3.4) 510 (3.0) 15 (4.2)New Zealand 516 (3.2) 531 (2.8) 14 (3.9)Manitoba 521 (3.9) 535 (4.1) 14 (5.0)Portugal 460 (3.4) 472 (4.2) 12 (3.3)Tunisia 353 (2.9) 365 (2.7) 12 (2.5)Uruguay 416 (3.8) 428 (4.0) 12 (4.2)OECD average 494 (0.8) 506 (0.8) 11 (0.8)Nova Scotia 509 (2.9) 521 (3.0) 11 (3.9)
Canada 530 (1.9) 541 (2.1) 11 (2.1)
Ontario 524 (3.6) 536 (4.6) 11 (4.0)Mexico 380 (4.1) 391 (4.3) 11 (3.9)Newfoundland and Labrador 512 (3.0) 522 (3.5) 10 (4.2)Russian Federation 463 (4.2) 473 (5.3) 10 (4.4)Alberta 544 (4.2) 554 (5.3) 10 (4.4)Germany 499 (3.9) 508 (4.0) 9 (4.4)Spain 481 (2.2) 490 (3.4) 9 (3.0)France 507 (2.9) 515 (3.6) 9 (4.2)Japan 530 (4.0) 539 (5.8) 8 (5.9)British Columbia 534 (2.2) 542 (3.4) 8 (3.2)Hungary 486 (3.3) 494 (3.3) 8 (3.5)Austria 502 (4.0) 509 (4.0) 8 (4.4)Belgium 525 (3.2) 533 (3.4) 8 (4.8)Finland 541 (2.1) 548 (2.5) 7 (2.7)Quebec 534 (4.7) 541 (5.7) 7 (4.6)Sweden 506 (3.1) 512 (3.0) 7 (3.3)United States 480 (3.2) 486 (3.3) 6 (2.9)Norway 492 (2.9) 498 (2.8) 6 (3.2)New Brunswick 509 (1.9) 515 (2.7) 6 (2.9)Poland 487 (2.9) 493 (3.0) 6 (3.1)Australia 522 (2.7) 527 (3.0) 5 (3.8)Netherlands 535 (3.5) 540 (4.1) 5 (4.3)Hong Kong-China 548 (4.6) 552 (6.5) 4 (6.6)Indonesia 358 (4.6) 362 (3.9) 3 (3.4)Latvia 482 (3.6) 485 (4.8) 3 (4.0)Serbia and Montenegro (Ser.) 436 (4.5) 437 (4.2) 1 (4.4)Prince Edward Island 501 (2.7) 500 (3.3) -1 (4.5)Saskatchewan 518 (4.2) 515 (4.4) -3 (3.7)Thailand 419 (3.4) 415 (4.0) -4 (4.2)Iceland 523 (2.2) 508 (2.3) -15 (3.5)
1. Significant differences are marked in bold. Difference is significant when the score difference +/-(1.96*SE) does not include zero.
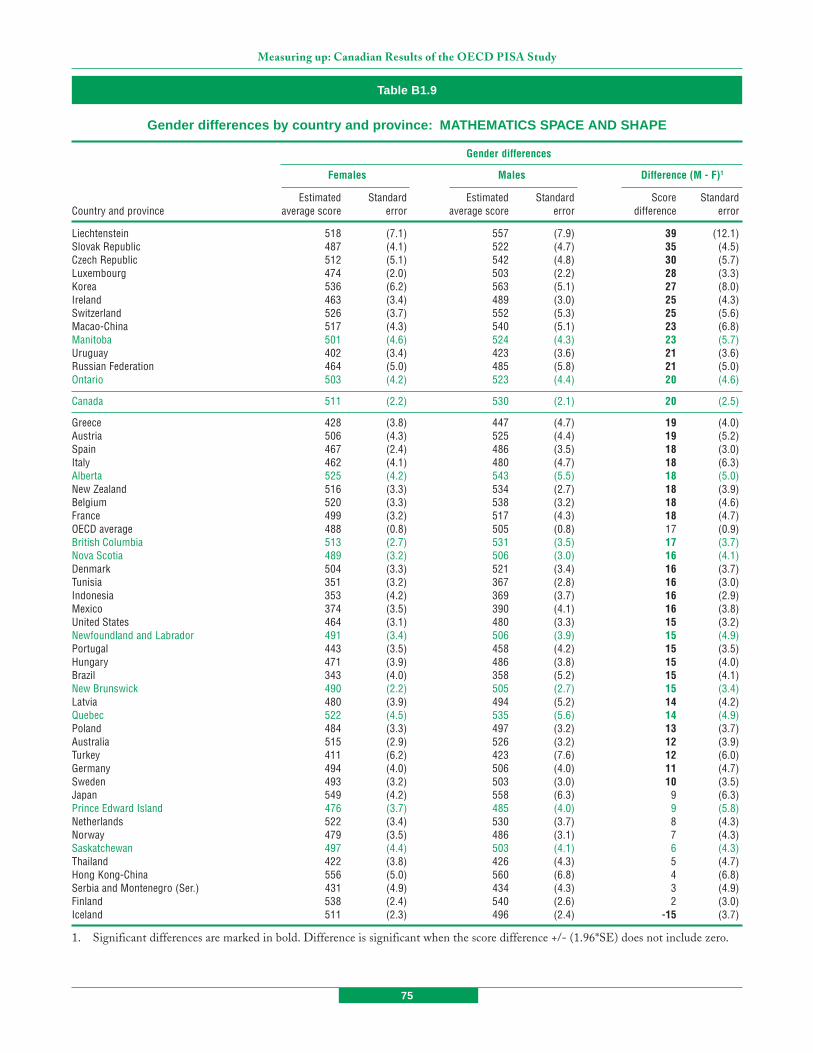
75
Measuring up: Canadian Results of the OECD PISA Study
Table B1.9
Gender differences by country and province: MATHEMATICS SPACE AND SHAPE
Gender differences
Females Males Difference (M - F)1
Estimated Standard Estimated Standard Score StandardCountry and province average score error average score error difference error
Liechtenstein 518 (7.1) 557 (7.9) 39 (12.1)Slovak Republic 487 (4.1) 522 (4.7) 35 (4.5)Czech Republic 512 (5.1) 542 (4.8) 30 (5.7)Luxembourg 474 (2.0) 503 (2.2) 28 (3.3)Korea 536 (6.2) 563 (5.1) 27 (8.0)Ireland 463 (3.4) 489 (3.0) 25 (4.3)Switzerland 526 (3.7) 552 (5.3) 25 (5.6)Macao-China 517 (4.3) 540 (5.1) 23 (6.8)Manitoba 501 (4.6) 524 (4.3) 23 (5.7)Uruguay 402 (3.4) 423 (3.6) 21 (3.6)Russian Federation 464 (5.0) 485 (5.8) 21 (5.0)Ontario 503 (4.2) 523 (4.4) 20 (4.6)
Canada 511 (2.2) 530 (2.1) 20 (2.5)
Greece 428 (3.8) 447 (4.7) 19 (4.0)Austria 506 (4.3) 525 (4.4) 19 (5.2)Spain 467 (2.4) 486 (3.5) 18 (3.0)Italy 462 (4.1) 480 (4.7) 18 (6.3)Alberta 525 (4.2) 543 (5.5) 18 (5.0)New Zealand 516 (3.3) 534 (2.7) 18 (3.9)Belgium 520 (3.3) 538 (3.2) 18 (4.6)France 499 (3.2) 517 (4.3) 18 (4.7)OECD average 488 (0.8) 505 (0.8) 17 (0.9)British Columbia 513 (2.7) 531 (3.5) 17 (3.7)Nova Scotia 489 (3.2) 506 (3.0) 16 (4.1)Denmark 504 (3.3) 521 (3.4) 16 (3.7)Tunisia 351 (3.2) 367 (2.8) 16 (3.0)Indonesia 353 (4.2) 369 (3.7) 16 (2.9)Mexico 374 (3.5) 390 (4.1) 16 (3.8)United States 464 (3.1) 480 (3.3) 15 (3.2)Newfoundland and Labrador 491 (3.4) 506 (3.9) 15 (4.9)Portugal 443 (3.5) 458 (4.2) 15 (3.5)Hungary 471 (3.9) 486 (3.8) 15 (4.0)Brazil 343 (4.0) 358 (5.2) 15 (4.1)New Brunswick 490 (2.2) 505 (2.7) 15 (3.4)Latvia 480 (3.9) 494 (5.2) 14 (4.2)Quebec 522 (4.5) 535 (5.6) 14 (4.9)Poland 484 (3.3) 497 (3.2) 13 (3.7)Australia 515 (2.9) 526 (3.2) 12 (3.9)Turkey 411 (6.2) 423 (7.6) 12 (6.0)Germany 494 (4.0) 506 (4.0) 11 (4.7)Sweden 493 (3.2) 503 (3.0) 10 (3.5)Japan 549 (4.2) 558 (6.3) 9 (6.3)Prince Edward Island 476 (3.7) 485 (4.0) 9 (5.8)Netherlands 522 (3.4) 530 (3.7) 8 (4.3)Norway 479 (3.5) 486 (3.1) 7 (4.3)Saskatchewan 497 (4.4) 503 (4.1) 6 (4.3)Thailand 422 (3.8) 426 (4.3) 5 (4.7)Hong Kong-China 556 (5.0) 560 (6.8) 4 (6.8)Serbia and Montenegro (Ser.) 431 (4.9) 434 (4.3) 3 (4.9)Finland 538 (2.4) 540 (2.6) 2 (3.0)Iceland 511 (2.3) 496 (2.4) -15 (3.7)
1. Significant differences are marked in bold. Difference is significant when the score difference +/- (1.96*SE) does not include zero.

76
Appendix B / Chapter 1 Tables
Table B1.10
Gender differences by country and province: MATHEMATICS CHANGE AND RELATIONSHIPS
Gender differences
Females Males Difference (M - F)1
Estimated Standard Estimated Standard Score StandardCountry and province average score error average score error difference error
Liechtenstein 526 (6.5) 552 (7.4) 26 (12.1)Korea 532 (5.8) 558 (4.7) 25 (7.3)Italy 442 (4.0) 463 (4.9) 21 (6.3)Denmark 499 (3.3) 520 (3.7) 21 (3.5)Macao-China 509 (4.6) 529 (5.0) 20 (6.6)Brazil 324 (5.5) 344 (7.3) 20 (4.7)Greece 427 (4.4) 445 (5.2) 18 (4.2)New Zealand 517 (3.4) 534 (2.8) 17 (4.1)Slovak Republic 486 (3.9) 502 (4.1) 16 (4.2)Manitoba 524 (3.9) 540 (4.4) 16 (5.3)Switzerland 515 (3.9) 530 (5.1) 15 (5.3)Ontario 529 (3.8) 544 (4.9) 15 (4.0)Luxembourg 480 (1.8) 494 (2.5) 14 (3.7)
Canada 532 (2.0) 546 (2.2) 13 (2.3)
Portugal 462 (4.0) 475 (4.8) 13 (3.8)Czech Republic 508 (4.0) 521 (4.5) 13 (4.9)Ireland 500 (3.5) 512 (3.0) 13 (4.4)Nova Scotia 511 (3.1) 524 (3.1) 13 (4.3)Germany 502 (4.4) 514 (4.3) 12 (4.4)OECD average 493 (0.8) 504 (0.8) 11 (0.9)Finland 537 (2.4) 549 (2.8) 11 (2.8)Tunisia 331 (3.3) 342 (3.0) 11 (3.0)Alberta 549 (4.9) 560 (5.3) 11 (5.3)Newfoundland and Labrador 516 (3.2) 526 (3.7) 10 (4.5)British Columbia 538 (2.4) 548 (3.6) 10 (3.7)Hungary 490 (3.6) 499 (3.6) 10 (3.9)Spain 477 (2.6) 485 (3.8) 8 (3.3)Quebec 534 (4.9) 542 (6.0) 8 (4.7)New Brunswick 509 (2.0) 517 (2.8) 8 (3.0)Mexico 360 (4.6) 368 (4.9) 8 (4.4)Poland 481 (3.4) 488 (3.1) 8 (3.6)Belgium 531 (3.5) 539 (3.6) 8 (5.1)Japan 533 (4.3) 539 (6.4) 6 (6.6)Turkey 419 (7.4) 425 (9.1) 6 (7.2)Netherlands 548 (3.7) 554 (3.8) 6 (4.3)United States 483 (3.3) 488 (3.4) 6 (2.9)Uruguay 414 (4.2) 420 (4.2) 5 (4.4)Austria 497 (4.4) 502 (4.4) 5 (5.0)Australia 523 (2.8) 527 (3.2) 4 (3.8)France 518 (3.2) 522 (4.0) 4 (5.0)Norway 486 (3.1) 490 (3.2) 4 (3.3)Indonesia 332 (5.4) 336 (4.4) 4 (3.4)Russian Federation 475 (4.5) 479 (6.0) 3 (5.1)Serbia and Montenegro (Ser.) 418 (4.9) 420 (4.5) 1 (4.9)Sweden 504 (3.9) 506 (3.4) 1 (4.3)Hong Kong-China 539 (4.8) 540 (6.8) 1 (7.2)Prince Edward Island 502 (2.7) 501 (3.7) -1 (5.0)Latvia 488 (4.3) 487 (5.3) -1 (4.0)Saskatchewan 521 (4.4) 519 (4.7) -2 (3.9)Iceland 514 (2.3) 505 (2.4) -10 (3.8)Thailand 409 (4.0) 400 (4.5) -10 (5.1)
1. Significant differences are marked in bold. Difference is significant when the score difference +/- (1.96*SE) does not include zero.
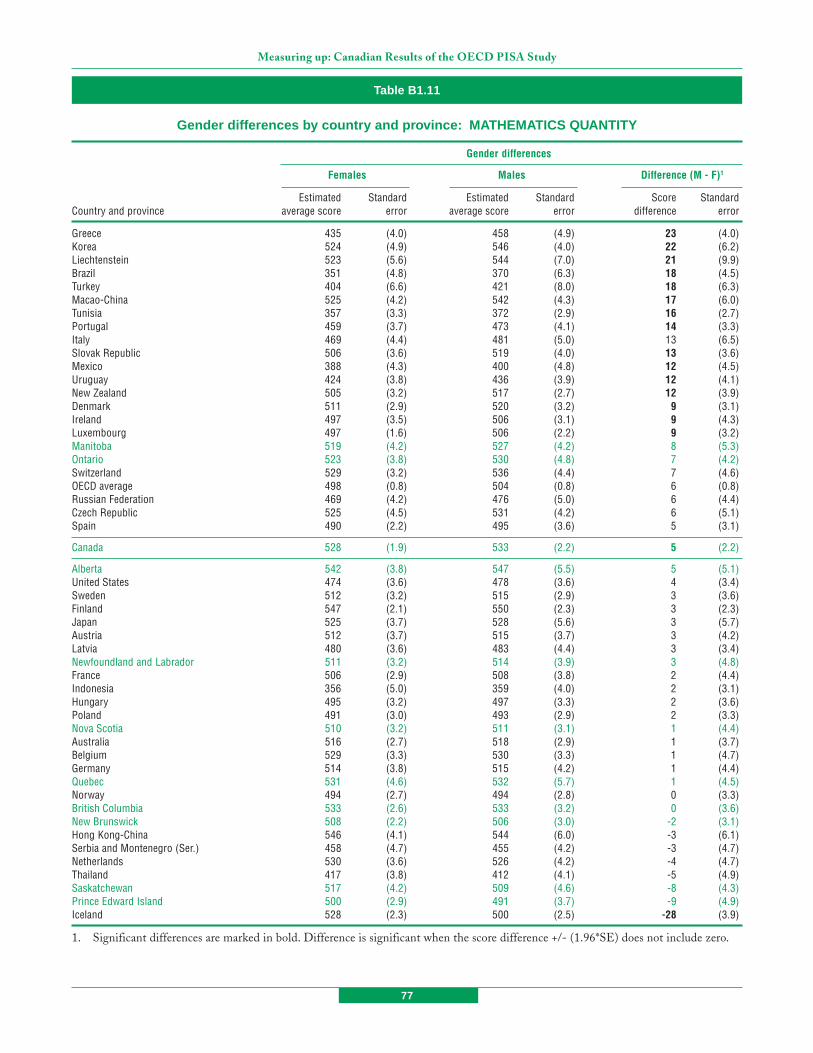
77
Measuring up: Canadian Results of the OECD PISA Study
Table B1.11
Gender differences by country and province: MATHEMATICS QUANTITY
Gender differences
Females Males Difference (M - F)1
Estimated Standard Estimated Standard Score StandardCountry and province average score error average score error difference error
Greece 435 (4.0) 458 (4.9) 23 (4.0)Korea 524 (4.9) 546 (4.0) 22 (6.2)Liechtenstein 523 (5.6) 544 (7.0) 21 (9.9)Brazil 351 (4.8) 370 (6.3) 18 (4.5)Turkey 404 (6.6) 421 (8.0) 18 (6.3)Macao-China 525 (4.2) 542 (4.3) 17 (6.0)Tunisia 357 (3.3) 372 (2.9) 16 (2.7)Portugal 459 (3.7) 473 (4.1) 14 (3.3)Italy 469 (4.4) 481 (5.0) 13 (6.5)Slovak Republic 506 (3.6) 519 (4.0) 13 (3.6)Mexico 388 (4.3) 400 (4.8) 12 (4.5)Uruguay 424 (3.8) 436 (3.9) 12 (4.1)New Zealand 505 (3.2) 517 (2.7) 12 (3.9)Denmark 511 (2.9) 520 (3.2) 9 (3.1)Ireland 497 (3.5) 506 (3.1) 9 (4.3)Luxembourg 497 (1.6) 506 (2.2) 9 (3.2)Manitoba 519 (4.2) 527 (4.2) 8 (5.3)Ontario 523 (3.8) 530 (4.8) 7 (4.2)Switzerland 529 (3.2) 536 (4.4) 7 (4.6)OECD average 498 (0.8) 504 (0.8) 6 (0.8)Russian Federation 469 (4.2) 476 (5.0) 6 (4.4)Czech Republic 525 (4.5) 531 (4.2) 6 (5.1)Spain 490 (2.2) 495 (3.6) 5 (3.1)
Canada 528 (1.9) 533 (2.2) 5 (2.2)
Alberta 542 (3.8) 547 (5.5) 5 (5.1)United States 474 (3.6) 478 (3.6) 4 (3.4)Sweden 512 (3.2) 515 (2.9) 3 (3.6)Finland 547 (2.1) 550 (2.3) 3 (2.3)Japan 525 (3.7) 528 (5.6) 3 (5.7)Austria 512 (3.7) 515 (3.7) 3 (4.2)Latvia 480 (3.6) 483 (4.4) 3 (3.4)Newfoundland and Labrador 511 (3.2) 514 (3.9) 3 (4.8)France 506 (2.9) 508 (3.8) 2 (4.4)Indonesia 356 (5.0) 359 (4.0) 2 (3.1)Hungary 495 (3.2) 497 (3.3) 2 (3.6)Poland 491 (3.0) 493 (2.9) 2 (3.3)Nova Scotia 510 (3.2) 511 (3.1) 1 (4.4)Australia 516 (2.7) 518 (2.9) 1 (3.7)Belgium 529 (3.3) 530 (3.3) 1 (4.7)Germany 514 (3.8) 515 (4.2) 1 (4.4)Quebec 531 (4.6) 532 (5.7) 1 (4.5)Norway 494 (2.7) 494 (2.8) 0 (3.3)British Columbia 533 (2.6) 533 (3.2) 0 (3.6)New Brunswick 508 (2.2) 506 (3.0) -2 (3.1)Hong Kong-China 546 (4.1) 544 (6.0) -3 (6.1)Serbia and Montenegro (Ser.) 458 (4.7) 455 (4.2) -3 (4.7)Netherlands 530 (3.6) 526 (4.2) -4 (4.7)Thailand 417 (3.8) 412 (4.1) -5 (4.9)Saskatchewan 517 (4.2) 509 (4.6) -8 (4.3)Prince Edward Island 500 (2.9) 491 (3.7) -9 (4.9)Iceland 528 (2.3) 500 (2.5) -28 (3.9)
1. Significant differences are marked in bold. Difference is significant when the score difference +/- (1.96*SE) does not include zero.
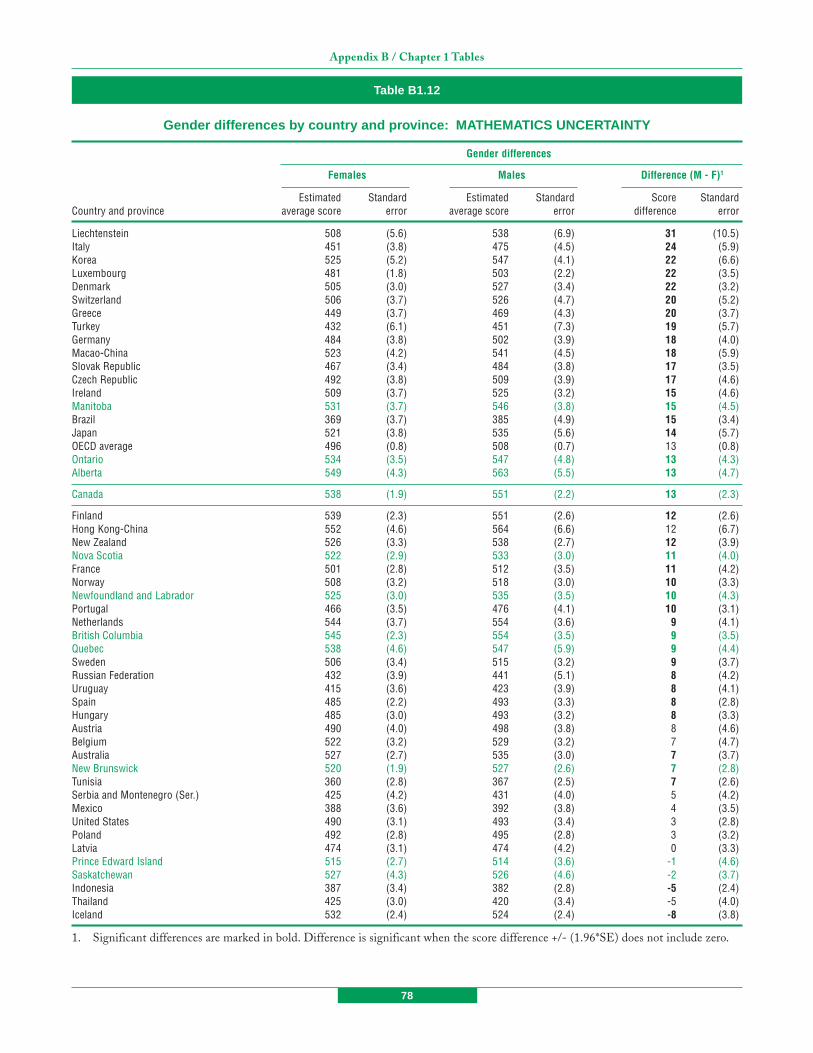
78
Appendix B / Chapter 1 Tables
Table B1.12
Gender differences by country and province: MATHEMATICS UNCERTAINTY
Gender differences
Females Males Difference (M - F)1
Estimated Standard Estimated Standard Score StandardCountry and province average score error average score error difference error
Liechtenstein 508 (5.6) 538 (6.9) 31 (10.5)Italy 451 (3.8) 475 (4.5) 24 (5.9)Korea 525 (5.2) 547 (4.1) 22 (6.6)Luxembourg 481 (1.8) 503 (2.2) 22 (3.5)Denmark 505 (3.0) 527 (3.4) 22 (3.2)Switzerland 506 (3.7) 526 (4.7) 20 (5.2)Greece 449 (3.7) 469 (4.3) 20 (3.7)Turkey 432 (6.1) 451 (7.3) 19 (5.7)Germany 484 (3.8) 502 (3.9) 18 (4.0)Macao-China 523 (4.2) 541 (4.5) 18 (5.9)Slovak Republic 467 (3.4) 484 (3.8) 17 (3.5)Czech Republic 492 (3.8) 509 (3.9) 17 (4.6)Ireland 509 (3.7) 525 (3.2) 15 (4.6)Manitoba 531 (3.7) 546 (3.8) 15 (4.5)Brazil 369 (3.7) 385 (4.9) 15 (3.4)Japan 521 (3.8) 535 (5.6) 14 (5.7)OECD average 496 (0.8) 508 (0.7) 13 (0.8)Ontario 534 (3.5) 547 (4.8) 13 (4.3)Alberta 549 (4.3) 563 (5.5) 13 (4.7)
Canada 538 (1.9) 551 (2.2) 13 (2.3)
Finland 539 (2.3) 551 (2.6) 12 (2.6)Hong Kong-China 552 (4.6) 564 (6.6) 12 (6.7)New Zealand 526 (3.3) 538 (2.7) 12 (3.9)Nova Scotia 522 (2.9) 533 (3.0) 11 (4.0)France 501 (2.8) 512 (3.5) 11 (4.2)Norway 508 (3.2) 518 (3.0) 10 (3.3)Newfoundland and Labrador 525 (3.0) 535 (3.5) 10 (4.3)Portugal 466 (3.5) 476 (4.1) 10 (3.1)Netherlands 544 (3.7) 554 (3.6) 9 (4.1)British Columbia 545 (2.3) 554 (3.5) 9 (3.5)Quebec 538 (4.6) 547 (5.9) 9 (4.4)Sweden 506 (3.4) 515 (3.2) 9 (3.7)Russian Federation 432 (3.9) 441 (5.1) 8 (4.2)Uruguay 415 (3.6) 423 (3.9) 8 (4.1)Spain 485 (2.2) 493 (3.3) 8 (2.8)Hungary 485 (3.0) 493 (3.2) 8 (3.3)Austria 490 (4.0) 498 (3.8) 8 (4.6)Belgium 522 (3.2) 529 (3.2) 7 (4.7)Australia 527 (2.7) 535 (3.0) 7 (3.7)New Brunswick 520 (1.9) 527 (2.6) 7 (2.8)Tunisia 360 (2.8) 367 (2.5) 7 (2.6)Serbia and Montenegro (Ser.) 425 (4.2) 431 (4.0) 5 (4.2)Mexico 388 (3.6) 392 (3.8) 4 (3.5)United States 490 (3.1) 493 (3.4) 3 (2.8)Poland 492 (2.8) 495 (2.8) 3 (3.2)Latvia 474 (3.1) 474 (4.2) 0 (3.3)Prince Edward Island 515 (2.7) 514 (3.6) -1 (4.6)Saskatchewan 527 (4.3) 526 (4.6) -2 (3.7)Indonesia 387 (3.4) 382 (2.8) -5 (2.4)Thailand 425 (3.0) 420 (3.4) -5 (4.0)Iceland 532 (2.4) 524 (2.4) -8 (3.8)
1. Significant differences are marked in bold. Difference is significant when the score difference +/- (1.96*SE) does not include zero.
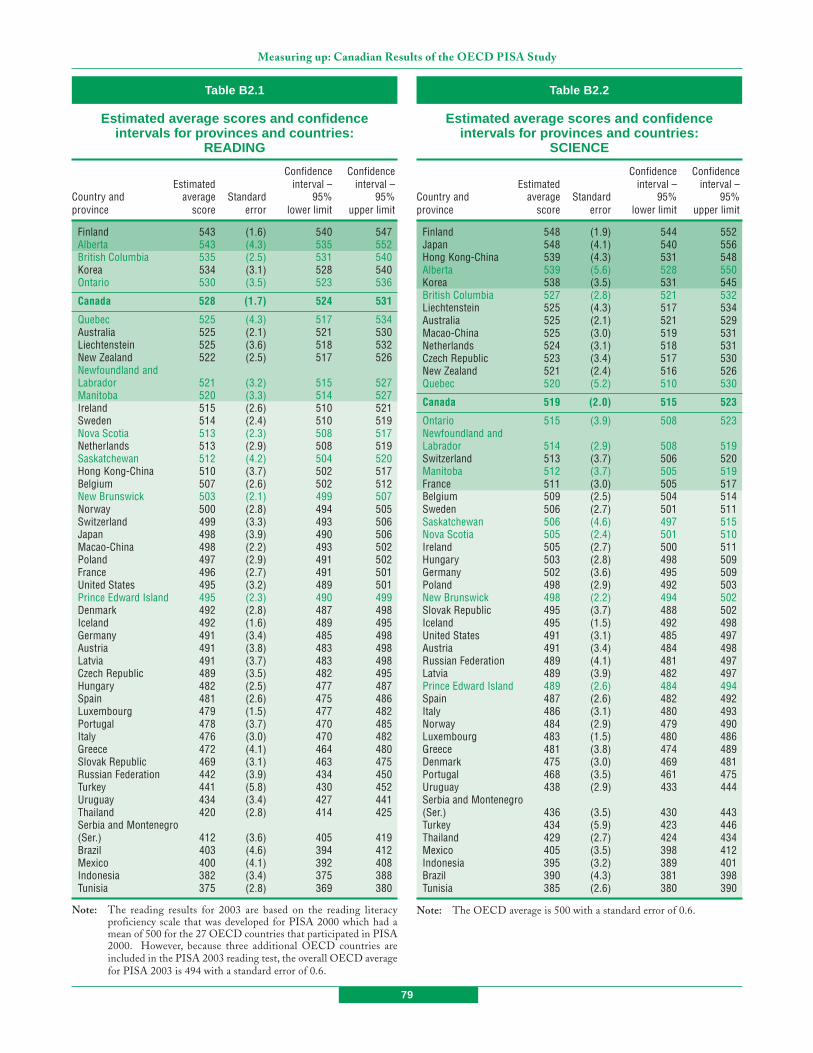
79
Measuring up: Canadian Results of the OECD PISA Study
Table B2.1
Estimated average scores and confidenceintervals for provinces and countries:
READING
Confidence ConfidenceEstimated interval – interval –
Country and average Standard 95% 95%province score error lower limit upper limit
Finland 543 (1.6) 540 547Alberta 543 (4.3) 535 552British Columbia 535 (2.5) 531 540Korea 534 (3.1) 528 540Ontario 530 (3.5) 523 536
Canada 528 (1.7) 524 531
Quebec 525 (4.3) 517 534Australia 525 (2.1) 521 530Liechtenstein 525 (3.6) 518 532New Zealand 522 (2.5) 517 526Newfoundland andLabrador 521 (3.2) 515 527Manitoba 520 (3.3) 514 527Ireland 515 (2.6) 510 521Sweden 514 (2.4) 510 519Nova Scotia 513 (2.3) 508 517Netherlands 513 (2.9) 508 519Saskatchewan 512 (4.2) 504 520Hong Kong-China 510 (3.7) 502 517Belgium 507 (2.6) 502 512New Brunswick 503 (2.1) 499 507Norway 500 (2.8) 494 505Switzerland 499 (3.3) 493 506Japan 498 (3.9) 490 506Macao-China 498 (2.2) 493 502Poland 497 (2.9) 491 502France 496 (2.7) 491 501United States 495 (3.2) 489 501Prince Edward Island 495 (2.3) 490 499Denmark 492 (2.8) 487 498Iceland 492 (1.6) 489 495Germany 491 (3.4) 485 498Austria 491 (3.8) 483 498Latvia 491 (3.7) 483 498Czech Republic 489 (3.5) 482 495Hungary 482 (2.5) 477 487Spain 481 (2.6) 475 486Luxembourg 479 (1.5) 477 482Portugal 478 (3.7) 470 485Italy 476 (3.0) 470 482Greece 472 (4.1) 464 480Slovak Republic 469 (3.1) 463 475Russian Federation 442 (3.9) 434 450Turkey 441 (5.8) 430 452Uruguay 434 (3.4) 427 441Thailand 420 (2.8) 414 425Serbia and Montenegro(Ser.) 412 (3.6) 405 419Brazil 403 (4.6) 394 412Mexico 400 (4.1) 392 408Indonesia 382 (3.4) 375 388Tunisia 375 (2.8) 369 380
Note: The reading results for 2003 are based on the reading literacyproficiency scale that was developed for PISA 2000 which had amean of 500 for the 27 OECD countries that participated in PISA2000. However, because three additional OECD countries areincluded in the PISA 2003 reading test, the overall OECD averagefor PISA 2003 is 494 with a standard error of 0.6.
Table B2.2
Estimated average scores and confidenceintervals for provinces and countries:
SCIENCE
Confidence ConfidenceEstimated interval – interval –
Country and average Standard 95% 95%province score error lower limit upper limit
Finland 548 (1.9) 544 552Japan 548 (4.1) 540 556Hong Kong-China 539 (4.3) 531 548Alberta 539 (5.6) 528 550Korea 538 (3.5) 531 545British Columbia 527 (2.8) 521 532Liechtenstein 525 (4.3) 517 534Australia 525 (2.1) 521 529Macao-China 525 (3.0) 519 531Netherlands 524 (3.1) 518 531Czech Republic 523 (3.4) 517 530New Zealand 521 (2.4) 516 526Quebec 520 (5.2) 510 530
Canada 519 (2.0) 515 523
Ontario 515 (3.9) 508 523Newfoundland andLabrador 514 (2.9) 508 519Switzerland 513 (3.7) 506 520Manitoba 512 (3.7) 505 519France 511 (3.0) 505 517Belgium 509 (2.5) 504 514Sweden 506 (2.7) 501 511Saskatchewan 506 (4.6) 497 515Nova Scotia 505 (2.4) 501 510Ireland 505 (2.7) 500 511Hungary 503 (2.8) 498 509Germany 502 (3.6) 495 509Poland 498 (2.9) 492 503New Brunswick 498 (2.2) 494 502Slovak Republic 495 (3.7) 488 502Iceland 495 (1.5) 492 498United States 491 (3.1) 485 497Austria 491 (3.4) 484 498Russian Federation 489 (4.1) 481 497Latvia 489 (3.9) 482 497Prince Edward Island 489 (2.6) 484 494Spain 487 (2.6) 482 492Italy 486 (3.1) 480 493Norway 484 (2.9) 479 490Luxembourg 483 (1.5) 480 486Greece 481 (3.8) 474 489Denmark 475 (3.0) 469 481Portugal 468 (3.5) 461 475Uruguay 438 (2.9) 433 444Serbia and Montenegro(Ser.) 436 (3.5) 430 443Turkey 434 (5.9) 423 446Thailand 429 (2.7) 424 434Mexico 405 (3.5) 398 412Indonesia 395 (3.2) 389 401Brazil 390 (4.3) 381 398Tunisia 385 (2.6) 380 390
Note: The OECD average is 500 with a standard error of 0.6.

80
Appendix B / Chapter 2 Tables
Table B2.3
Estimated average scores and confidenceintervals for provinces and countries:
PROBLEM SOLVING
Confidence ConfidenceEstimated interval – interval –
Country and average Standard 95% 95%provinces score error lower limit upper limit
Korea 550 (3.1) 544 556Hong Kong-China 548 (4.2) 540 556Finland 548 (1.9) 544 551Japan 547 (4.1) 539 555Alberta 546 (4.3) 538 555British Columbia 536 (2.4) 532 541New Zealand 533 (2.2) 529 537Macao-China 532 (2.5) 527 537Quebec 531 (4.3) 523 539Australia 530 (2.0) 526 534Liechtenstein 529 (3.9) 522 537
Canada 529 (1.7) 526 533
Ontario 527 (3.4) 520 533Manitoba 527 (2.9) 521 533Belgium 525 (2.2) 520 530Switzerland 521 (3.0) 515 527Netherlands 520 (3.0) 514 526France 519 (2.7) 514 524Newfoundland andLabrador 517 (3.2) 511 524Denmark 517 (2.5) 512 522Czech Republic 516 (3.4) 510 523Saskatchewan 516 (4.0) 508 524Nova Scotia 514 (2.3) 510 519Germany 513 (3.2) 507 520Sweden 509 (2.4) 504 513New Brunswick 508 (2.2) 503 512Austria 506 (3.2) 500 512Iceland 505 (1.4) 502 507Hungary 501 (2.9) 495 507Prince Edward Island 498 (2.2) 493 502Ireland 498 (2.3) 494 503Luxembourg 494 (1.4) 491 496Slovak Republic 492 (3.4) 485 498Norway 490 (2.6) 485 495Poland 487 (2.8) 481 492Latvia 483 (3.9) 475 490Spain 482 (2.7) 477 488Russian Federation 479 (4.6) 470 488United States 477 (3.1) 471 484Portugal 470 (3.9) 462 477Italy 470 (3.1) 463 476Greece 449 (4.0) 441 456Thailand 425 (2.7) 420 430Serbia and Montenegro(Ser.) 420 (3.3) 414 427Uruguay 411 (3.7) 403 418Turkey 408 (6.0) 396 419Mexico 384 (4.3) 376 393Brazil 371 (4.8) 361 380Indonesia 361 (3.3) 355 368Tunisia 345 (2.1) 341 349
Note: The OECD average is 500 with a standard error of 0.6.
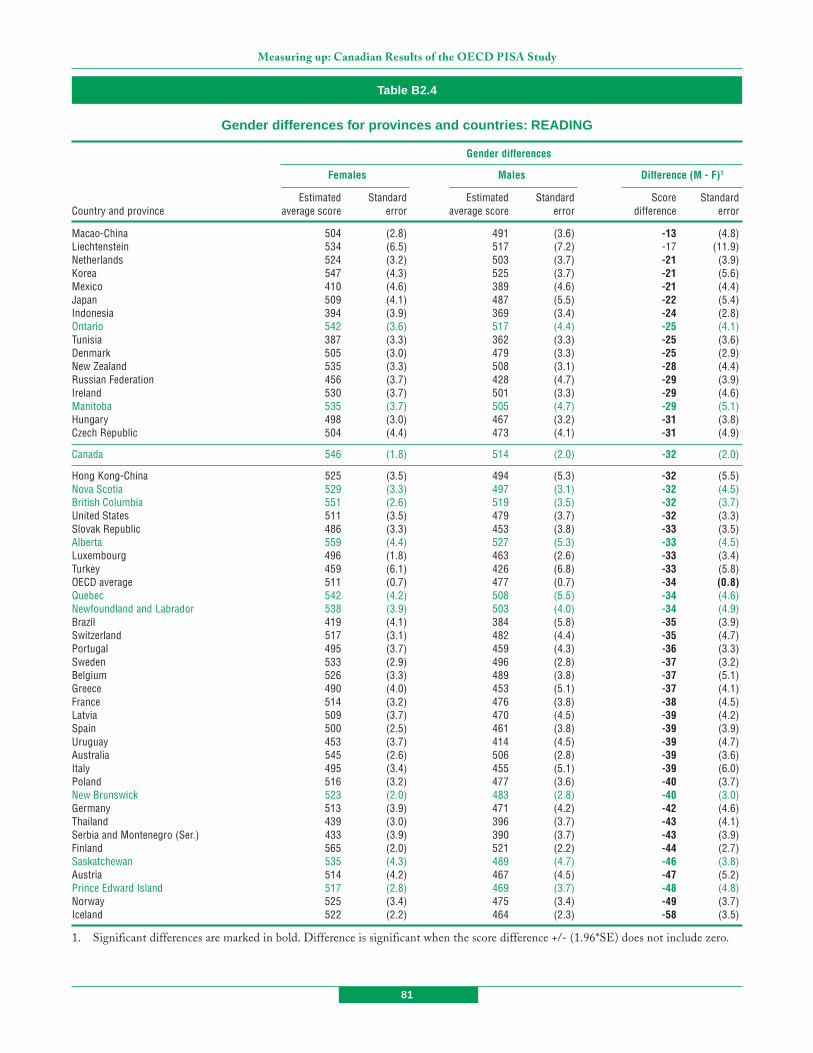
81
Measuring up: Canadian Results of the OECD PISA Study
Table B2.4
Gender differences for provinces and countries: READING
Gender differences
Females Males Difference (M - F)1
Estimated Standard Estimated Standard Score StandardCountry and province average score error average score error difference error
Macao-China 504 (2.8) 491 (3.6) -13 (4.8)Liechtenstein 534 (6.5) 517 (7.2) -17 (11.9)Netherlands 524 (3.2) 503 (3.7) -21 (3.9)Korea 547 (4.3) 525 (3.7) -21 (5.6)Mexico 410 (4.6) 389 (4.6) -21 (4.4)Japan 509 (4.1) 487 (5.5) -22 (5.4)Indonesia 394 (3.9) 369 (3.4) -24 (2.8)Ontario 542 (3.6) 517 (4.4) -25 (4.1)Tunisia 387 (3.3) 362 (3.3) -25 (3.6)Denmark 505 (3.0) 479 (3.3) -25 (2.9)New Zealand 535 (3.3) 508 (3.1) -28 (4.4)Russian Federation 456 (3.7) 428 (4.7) -29 (3.9)Ireland 530 (3.7) 501 (3.3) -29 (4.6)Manitoba 535 (3.7) 505 (4.7) -29 (5.1)Hungary 498 (3.0) 467 (3.2) -31 (3.8)Czech Republic 504 (4.4) 473 (4.1) -31 (4.9)
Canada 546 (1.8) 514 (2.0) -32 (2.0)
Hong Kong-China 525 (3.5) 494 (5.3) -32 (5.5)Nova Scotia 529 (3.3) 497 (3.1) -32 (4.5)British Columbia 551 (2.6) 519 (3.5) -32 (3.7)United States 511 (3.5) 479 (3.7) -32 (3.3)Slovak Republic 486 (3.3) 453 (3.8) -33 (3.5)Alberta 559 (4.4) 527 (5.3) -33 (4.5)Luxembourg 496 (1.8) 463 (2.6) -33 (3.4)Turkey 459 (6.1) 426 (6.8) -33 (5.8)OECD average 511 (0.7) 477 (0.7) -34 (0.8)Quebec 542 (4.2) 508 (5.5) -34 (4.6)Newfoundland and Labrador 538 (3.9) 503 (4.0) -34 (4.9)Brazil 419 (4.1) 384 (5.8) -35 (3.9)Switzerland 517 (3.1) 482 (4.4) -35 (4.7)Portugal 495 (3.7) 459 (4.3) -36 (3.3)Sweden 533 (2.9) 496 (2.8) -37 (3.2)Belgium 526 (3.3) 489 (3.8) -37 (5.1)Greece 490 (4.0) 453 (5.1) -37 (4.1)France 514 (3.2) 476 (3.8) -38 (4.5)Latvia 509 (3.7) 470 (4.5) -39 (4.2)Spain 500 (2.5) 461 (3.8) -39 (3.9)Uruguay 453 (3.7) 414 (4.5) -39 (4.7)Australia 545 (2.6) 506 (2.8) -39 (3.6)Italy 495 (3.4) 455 (5.1) -39 (6.0)Poland 516 (3.2) 477 (3.6) -40 (3.7)New Brunswick 523 (2.0) 483 (2.8) -40 (3.0)Germany 513 (3.9) 471 (4.2) -42 (4.6)Thailand 439 (3.0) 396 (3.7) -43 (4.1)Serbia and Montenegro (Ser.) 433 (3.9) 390 (3.7) -43 (3.9)Finland 565 (2.0) 521 (2.2) -44 (2.7)Saskatchewan 535 (4.3) 489 (4.7) -46 (3.8)Austria 514 (4.2) 467 (4.5) -47 (5.2)Prince Edward Island 517 (2.8) 469 (3.7) -48 (4.8)Norway 525 (3.4) 475 (3.4) -49 (3.7)Iceland 522 (2.2) 464 (2.3) -58 (3.5)
1. Significant differences are marked in bold. Difference is significant when the score difference +/- (1.96*SE) does not include zero.

82
Appendix B / Chapter 2 Tables
Table B2.5
Gender differences for provinces and countries: SCIENCE
Gender differences
Females Males Difference (M - F)1
Estimated Standard Estimated Standard Score StandardCountry and province average score error average score error difference error
Liechtenstein 512 (7.3) 538 (7.7) 26 (12.5)Korea 527 (5.5) 546 (4.7) 18 (7.0)Manitoba 504 (4.0) 521 (5.2) 17 (5.6)Denmark 467 (3.2) 484 (3.6) 17 (3.2)New Zealand 513 (3.4) 529 (3.0) 16 (4.2)Slovak Republic 487 (3.9) 502 (4.3) 15 (3.7)Luxembourg 477 (1.9) 489 (2.5) 13 (3.3)Greece 475 (3.9) 487 (4.8) 12 (4.2)Nova Scotia 500 (3.4) 511 (3.4) 11 (4.8)
Canada 516 (2.2) 527 (2.3) 11 (2.6)
Ontario 510 (4.1) 521 (5.1) 11 (4.8)Switzerland 508 (3.9) 518 (5.0) 10 (5.0)British Columbia 522 (3.2) 532 (4.0) 10 (4.7)Mexico 400 (4.2) 410 (3.9) 9 (4.1)Russian Federation 485 (4.0) 494 (5.3) 9 (4.3)Newfoundland and Labrador 510 (3.6) 518 (4.3) 9 (5.5)Macao-China 521 (4.0) 529 (5.0) 8 (6.8)Alberta 535 (5.1) 543 (7.1) 8 (5.5)Quebec 516 (5.2) 523 (6.3) 7 (4.9)Poland 494 (3.4) 501 (3.2) 7 (3.3)OECD average 497 (0.8) 503 (0.7) 6 (0.9)Portugal 465 (3.6) 471 (4.0) 6 (3.2)New Brunswick 495 (2.6) 501 (3.1) 6 (3.6)Italy 484 (3.6) 490 (5.2) 6 (6.3)Brazil 387 (4.3) 393 (5.3) 6 (3.9)Germany 500 (4.2) 506 (4.5) 6 (4.8)Czech Republic 520 (4.1) 526 (4.3) 6 (4.9)Netherlands 522 (3.6) 527 (4.2) 5 (4.7)United States 489 (3.5) 494 (3.5) 5 (3.3)Sweden 504 (3.5) 509 (3.1) 5 (3.6)Japan 546 (4.1) 550 (6.0) 4 (6.0)Uruguay 436 (3.6) 441 (3.7) 4 (4.4)Spain 485 (2.6) 489 (3.9) 4 (3.9)Ireland 504 (3.9) 506 (3.1) 2 (4.5)Norway 483 (3.3) 485 (3.5) 2 (3.6)Indonesia 394 (3.8) 396 (3.1) 1 (2.7)Turkey 434 (6.4) 434 (6.7) 0 (5.8)Belgium 509 (3.5) 509 (3.6) 0 (5.0)France 511 (3.5) 511 (4.1) 0 (4.8)Australia 525 (2.8) 525 (2.9) 0 (3.8)Hungary 504 (3.3) 503 (3.3) -1 (3.7)Prince Edward Island 489 (3.1) 488 (4.6) -1 (5.7)Austria 492 (4.2) 490 (4.3) -3 (5.0)Hong Kong-China 541 (4.2) 538 (6.1) -3 (6.0)Latvia 491 (3.9) 487 (5.1) -4 (4.7)Saskatchewan 508 (4.8) 503 (5.2) -5 (4.1)Serbia and Montenegro (Ser.) 439 (4.2) 434 (3.7) -5 (3.8)Finland 551 (2.2) 545 (2.6) -6 (2.8)Thailand 433 (3.1) 425 (3.7) -8 (4.2)Tunisia 390 (3.0) 380 (2.7) -10 (2.6)Iceland 500 (2.4) 490 (2.4) -10 (3.8)
1. Significant differences are marked in bold. Difference is significant when the score difference +/- (1.96*SE) does not include zero.
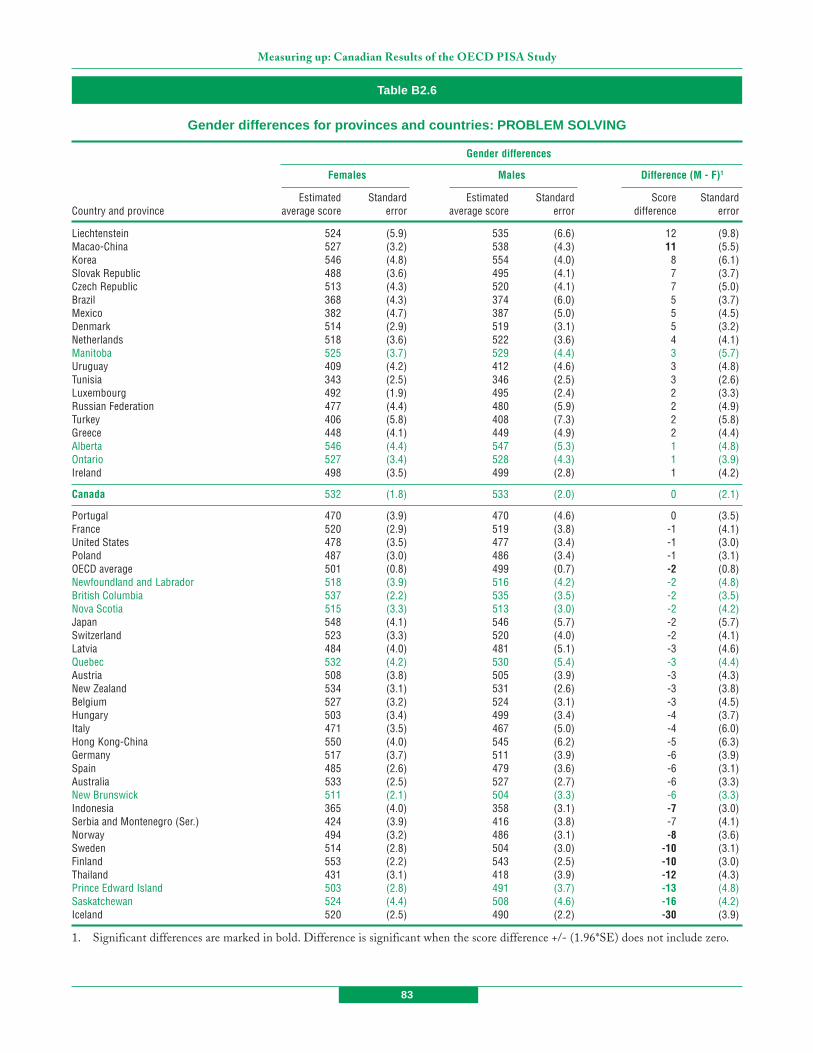
83
Measuring up: Canadian Results of the OECD PISA Study
Table B2.6
Gender differences for provinces and countries: PROBLEM SOLVING
Gender differences
Females Males Difference (M - F)1
Estimated Standard Estimated Standard Score StandardCountry and province average score error average score error difference error
Liechtenstein 524 (5.9) 535 (6.6) 12 (9.8)Macao-China 527 (3.2) 538 (4.3) 11 (5.5)Korea 546 (4.8) 554 (4.0) 8 (6.1)Slovak Republic 488 (3.6) 495 (4.1) 7 (3.7)Czech Republic 513 (4.3) 520 (4.1) 7 (5.0)Brazil 368 (4.3) 374 (6.0) 5 (3.7)Mexico 382 (4.7) 387 (5.0) 5 (4.5)Denmark 514 (2.9) 519 (3.1) 5 (3.2)Netherlands 518 (3.6) 522 (3.6) 4 (4.1)Manitoba 525 (3.7) 529 (4.4) 3 (5.7)Uruguay 409 (4.2) 412 (4.6) 3 (4.8)Tunisia 343 (2.5) 346 (2.5) 3 (2.6)Luxembourg 492 (1.9) 495 (2.4) 2 (3.3)Russian Federation 477 (4.4) 480 (5.9) 2 (4.9)Turkey 406 (5.8) 408 (7.3) 2 (5.8)Greece 448 (4.1) 449 (4.9) 2 (4.4)Alberta 546 (4.4) 547 (5.3) 1 (4.8)Ontario 527 (3.4) 528 (4.3) 1 (3.9)Ireland 498 (3.5) 499 (2.8) 1 (4.2)
Canada 532 (1.8) 533 (2.0) 0 (2.1)
Portugal 470 (3.9) 470 (4.6) 0 (3.5)France 520 (2.9) 519 (3.8) -1 (4.1)United States 478 (3.5) 477 (3.4) -1 (3.0)Poland 487 (3.0) 486 (3.4) -1 (3.1)OECD average 501 (0.8) 499 (0.7) -2 (0.8)Newfoundland and Labrador 518 (3.9) 516 (4.2) -2 (4.8)British Columbia 537 (2.2) 535 (3.5) -2 (3.5)Nova Scotia 515 (3.3) 513 (3.0) -2 (4.2)Japan 548 (4.1) 546 (5.7) -2 (5.7)Switzerland 523 (3.3) 520 (4.0) -2 (4.1)Latvia 484 (4.0) 481 (5.1) -3 (4.6)Quebec 532 (4.2) 530 (5.4) -3 (4.4)Austria 508 (3.8) 505 (3.9) -3 (4.3)New Zealand 534 (3.1) 531 (2.6) -3 (3.8)Belgium 527 (3.2) 524 (3.1) -3 (4.5)Hungary 503 (3.4) 499 (3.4) -4 (3.7)Italy 471 (3.5) 467 (5.0) -4 (6.0)Hong Kong-China 550 (4.0) 545 (6.2) -5 (6.3)Germany 517 (3.7) 511 (3.9) -6 (3.9)Spain 485 (2.6) 479 (3.6) -6 (3.1)Australia 533 (2.5) 527 (2.7) -6 (3.3)New Brunswick 511 (2.1) 504 (3.3) -6 (3.3)Indonesia 365 (4.0) 358 (3.1) -7 (3.0)Serbia and Montenegro (Ser.) 424 (3.9) 416 (3.8) -7 (4.1)Norway 494 (3.2) 486 (3.1) -8 (3.6)Sweden 514 (2.8) 504 (3.0) -10 (3.1)Finland 553 (2.2) 543 (2.5) -10 (3.0)Thailand 431 (3.1) 418 (3.9) -12 (4.3)Prince Edward Island 503 (2.8) 491 (3.7) -13 (4.8)Saskatchewan 524 (4.4) 508 (4.6) -16 (4.2)Iceland 520 (2.5) 490 (2.2) -30 (3.9)
1. Significant differences are marked in bold. Difference is significant when the score difference +/- (1.96*SE) does not include zero.
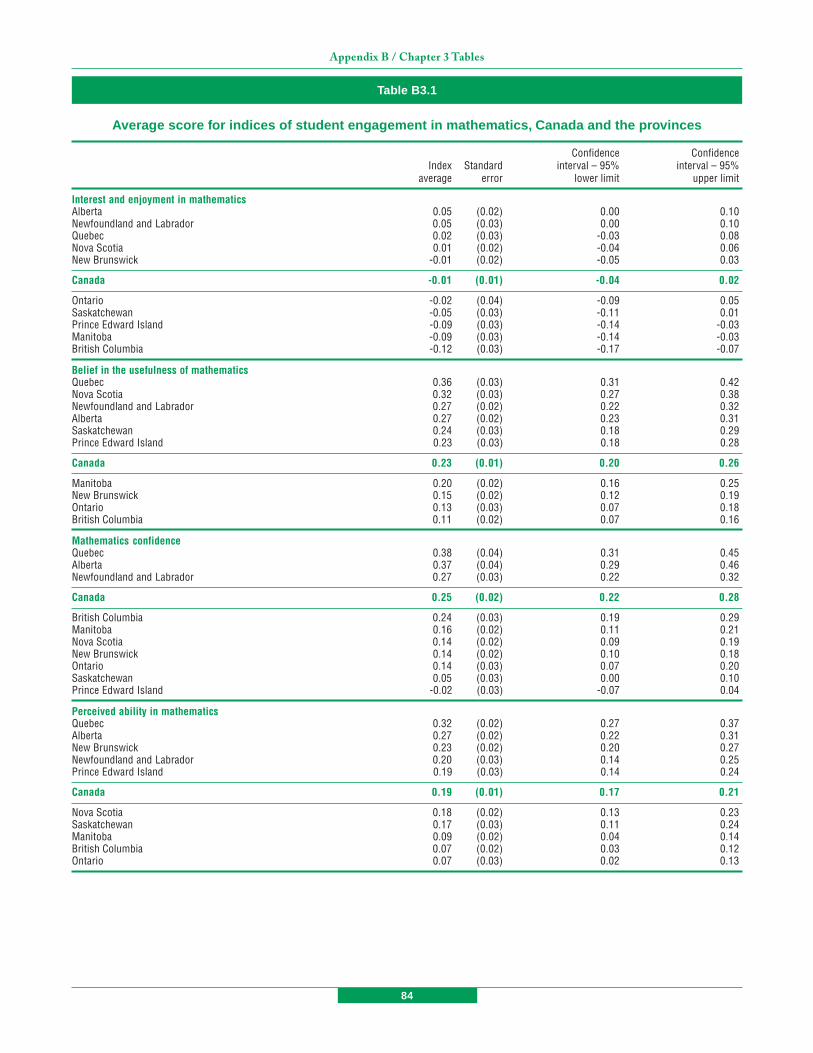
84
Appendix B / Chapter 3 Tables
Table B3.1
Average score for indices of student engagement in mathematics, Canada and the provinces
Confidence ConfidenceIndex Standard interval – 95% interval – 95%
average error lower limit upper limit
Interest and enjoyment in mathematicsAlberta 0.05 (0.02) 0.00 0.10Newfoundland and Labrador 0.05 (0.03) 0.00 0.10Quebec 0.02 (0.03) -0.03 0.08Nova Scotia 0.01 (0.02) -0.04 0.06New Brunswick -0.01 (0.02) -0.05 0.03
Canada -0.01 (0.01) -0.04 0.02
Ontario -0.02 (0.04) -0.09 0.05Saskatchewan -0.05 (0.03) -0.11 0.01Prince Edward Island -0.09 (0.03) -0.14 -0.03Manitoba -0.09 (0.03) -0.14 -0.03British Columbia -0.12 (0.03) -0.17 -0.07
Belief in the usefulness of mathematicsQuebec 0.36 (0.03) 0.31 0.42Nova Scotia 0.32 (0.03) 0.27 0.38Newfoundland and Labrador 0.27 (0.02) 0.22 0.32Alberta 0.27 (0.02) 0.23 0.31Saskatchewan 0.24 (0.03) 0.18 0.29Prince Edward Island 0.23 (0.03) 0.18 0.28
Canada 0.23 (0.01) 0.20 0.26
Manitoba 0.20 (0.02) 0.16 0.25New Brunswick 0.15 (0.02) 0.12 0.19Ontario 0.13 (0.03) 0.07 0.18British Columbia 0.11 (0.02) 0.07 0.16
Mathematics confidenceQuebec 0.38 (0.04) 0.31 0.45Alberta 0.37 (0.04) 0.29 0.46Newfoundland and Labrador 0.27 (0.03) 0.22 0.32
Canada 0.25 (0.02) 0.22 0.28
British Columbia 0.24 (0.03) 0.19 0.29Manitoba 0.16 (0.02) 0.11 0.21Nova Scotia 0.14 (0.02) 0.09 0.19New Brunswick 0.14 (0.02) 0.10 0.18Ontario 0.14 (0.03) 0.07 0.20Saskatchewan 0.05 (0.03) 0.00 0.10Prince Edward Island -0.02 (0.03) -0.07 0.04
Perceived ability in mathematicsQuebec 0.32 (0.02) 0.27 0.37Alberta 0.27 (0.02) 0.22 0.31New Brunswick 0.23 (0.02) 0.20 0.27Newfoundland and Labrador 0.20 (0.03) 0.14 0.25Prince Edward Island 0.19 (0.03) 0.14 0.24
Canada 0.19 (0.01) 0.17 0.21
Nova Scotia 0.18 (0.02) 0.13 0.23Saskatchewan 0.17 (0.03) 0.11 0.24Manitoba 0.09 (0.02) 0.04 0.14British Columbia 0.07 (0.02) 0.03 0.12Ontario 0.07 (0.03) 0.02 0.13
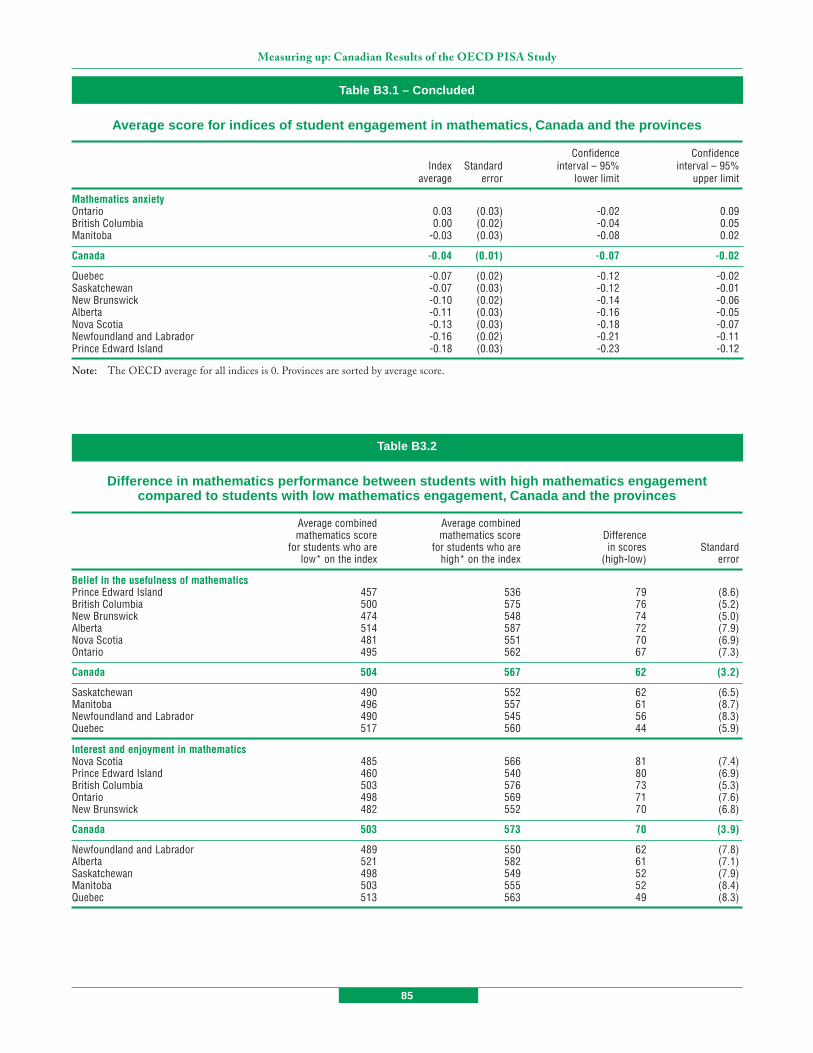
85
Measuring up: Canadian Results of the OECD PISA Study
Mathematics anxietyOntario 0.03 (0.03) -0.02 0.09British Columbia 0.00 (0.02) -0.04 0.05Manitoba -0.03 (0.03) -0.08 0.02
Canada -0.04 (0.01) -0.07 -0.02
Quebec -0.07 (0.02) -0.12 -0.02Saskatchewan -0.07 (0.03) -0.12 -0.01New Brunswick -0.10 (0.02) -0.14 -0.06Alberta -0.11 (0.03) -0.16 -0.05Nova Scotia -0.13 (0.03) -0.18 -0.07Newfoundland and Labrador -0.16 (0.02) -0.21 -0.11Prince Edward Island -0.18 (0.03) -0.23 -0.12
Note: The OECD average for all indices is 0. Provinces are sorted by average score.
Table B3.1 – Concluded
Average score for indices of student engagement in mathematics, Canada and the provinces
Confidence ConfidenceIndex Standard interval – 95% interval – 95%
average error lower limit upper limit
Table B3.2
Difference in mathematics performance between students with high mathematics engagementcompared to students with low mathematics engagement, Canada and the provinces
Average combined Average combinedmathematics score mathematics score Difference
for students who are for students who are in scores Standardlow* on the index high* on the index (high-low) error
Belief in the usefulness of mathematicsPrince Edward Island 457 536 79 (8.6)British Columbia 500 575 76 (5.2)New Brunswick 474 548 74 (5.0)Alberta 514 587 72 (7.9)Nova Scotia 481 551 70 (6.9)Ontario 495 562 67 (7.3)
Canada 504 567 62 (3.2)
Saskatchewan 490 552 62 (6.5)Manitoba 496 557 61 (8.7)Newfoundland and Labrador 490 545 56 (8.3)Quebec 517 560 44 (5.9)
Interest and enjoyment in mathematicsNova Scotia 485 566 81 (7.4)Prince Edward Island 460 540 80 (6.9)British Columbia 503 576 73 (5.3)Ontario 498 569 71 (7.6)New Brunswick 482 552 70 (6.8)
Canada 503 573 70 (3.9)
Newfoundland and Labrador 489 550 62 (7.8)Alberta 521 582 61 (7.1)Saskatchewan 498 549 52 (7.9)Manitoba 503 555 52 (8.4)Quebec 513 563 49 (8.3)

86
Appendix B / Chapter 3 Tables
Table B3.2 – Concluded
Difference in mathematics performance between students with high mathematics engagementcompared to students with low mathematics engagement, Canada and the provinces
Average combined Average combinedmathematics score mathematics score Difference
for students who are for students who are in scores Standardlow* on the index high* on the index (high-low) error
Perceived ability in mathematicsPrince Edward Island 449 582 134 (6.5)New Brunswick 457 585 128 (4.7)Manitoba 479 604 125 (8.4)Nova Scotia 466 589 123 (6.4)British Columbia 487 609 123 (5.5)Alberta 502 622 120 (8.4)Saskatchewan 472 588 116 (6.2)
Canada 492 603 111 (3.0)
Newfoundland and Labrador 468 579 111 (6.3)Quebec 488 598 110 (5.9)Ontario 485 586 102 (7.5)
Mathematics confidencePrince Edward Island 428 584 156 (8.4)Newfoundland and Labrador 440 596 156 (8.1)Quebec 461 612 150 (7.7)Alberta 472 622 149 (8.1)New Brunswick 437 583 146 (5.8)Nova Scotia 441 585 144 (7.4)British Columbia 471 614 143 (6.9)Manitoba 458 599 141 (9.9)Ontario 462 597 134 (10.0)
Canada 478 611 133 (4.0)
Saskatchewan 455 589 133 (9.6)
Mathematics anxiety
Canada 554 483 -71 (4.3)
Newfoundland and Labrador 567 479 -88 (8.1)Ontario 577 485 -92 (7.5)Prince Edward Island 543 450 -93 (7.7)British Columbia 587 491 -96 (6.7)Saskatchewan 563 462 -101 (6.8)Manitoba 582 480 -102 (9.7)Nova Scotia 570 467 -103 (6.8)Quebec 581 477 -104 (9.3)New Brunswick 566 459 -107 (5.3)Alberta 607 495 -112 (7.1)
* Students low on a given index are defined as those falling one standard deviation below the average.Students high on a given index are defined as those falling one standard deviation above the average.

87
Measuring up: Canadian Results of the OECD PISA Study
Table B3.3
Student engagement regression coefficients for females relative to males controllingfor mathematics ability, Canada and the provinces
Regression Confidence Confidencecoefficient (females Standard interval – 95% interval – 95%
relative to males) error lower limit upper limit
Interest and enjoyment in mathematicsManitoba 0.09 (0.01) 0.06 0.12Prince Edward Island 0.08 (0.03) 0.02 0.14Saskatchewan 0.03 (0.01) 0.01 0.04Nova Scotia 0.02 (0.01) 0.01 0.04Newfoundland and Labrador -0.03 (0.02) -0.06 0.00British Columbia -0.06 (0.01) -0.09 -0.03Alberta -0.07 (0.02) -0.10 -0.03Quebec -0.10 (0.03) -0.16 -0.05New Brunswick -0.11 (0.01) -0.12 -0.09
Canada -0.12 (0.04) -0.20 -0.04
Ontario -0.15 (0.02) -0.19 -0.10
Belief in the usefulness of mathematicsNewfoundland and Labrador 0.00 (0.05) -0.10 0.10
Canada -0.06 (0.01) -0.08 -0.04
Alberta -0.06 (0.01) -0.08 -0.05Manitoba -0.07 (0.02) -0.10 -0.03Saskatchewan -0.09 (0.01) -0.12 -0.06Nova Scotia -0.10 (0.01) -0.11 -0.08Prince Edward Island -0.10 (0.04) -0.17 -0.03British Columbia -0.12 (0.04) -0.19 -0.05Quebec -0.14 (0.01) -0.16 -0.13Ontario -0.22 (0.01) -0.24 -0.19New Brunswick -0.25 (0.02) -0.29 -0.21
Mathematics confidenceQuebec -0.24 (0.04) -0.31 -0.17Newfoundland and Labrador -0.25 (0.02) -0.29 -0.20Nova Scotia -0.25 (0.02) -0.29 -0.22Ontario -0.26 (0.04) -0.33 -0.19
Canada -0.26 (0.01) -0.28 -0.24
New Brunswick -0.27 (0.01) -0.30 -0.25British Columbia -0.29 (0.01) -0.32 -0.27Saskatchewan -0.31 (0.02) -0.35 -0.27Alberta -0.35 (0.03) -0.40 -0.30Prince Edward Island -0.36 (0.02) -0.39 -0.32Manitoba -0.37 (0.02) -0.42 -0.32
Perceived ability in mathematicsNewfoundland and Labrador -0.17 (0.02) -0.21 -0.14Saskatchewan -0.23 (0.01) -0.25 -0.20Manitoba -0.23 (0.02) -0.27 -0.20Prince Edward Island -0.25 (0.01) -0.28 -0.22British Columbia -0.26 (0.01) -0.28 -0.23Nova Scotia -0.27 (0.03) -0.33 -0.22
Canada -0.29 (0.01) -0.31 -0.27
Quebec -0.31 (0.01) -0.34 -0.29Alberta -0.31 (0.02) -0.35 -0.28Ontario -0.32 (0.01) -0.35 -0.30New Brunswick -0.34 (0.02) -0.37 -0.31
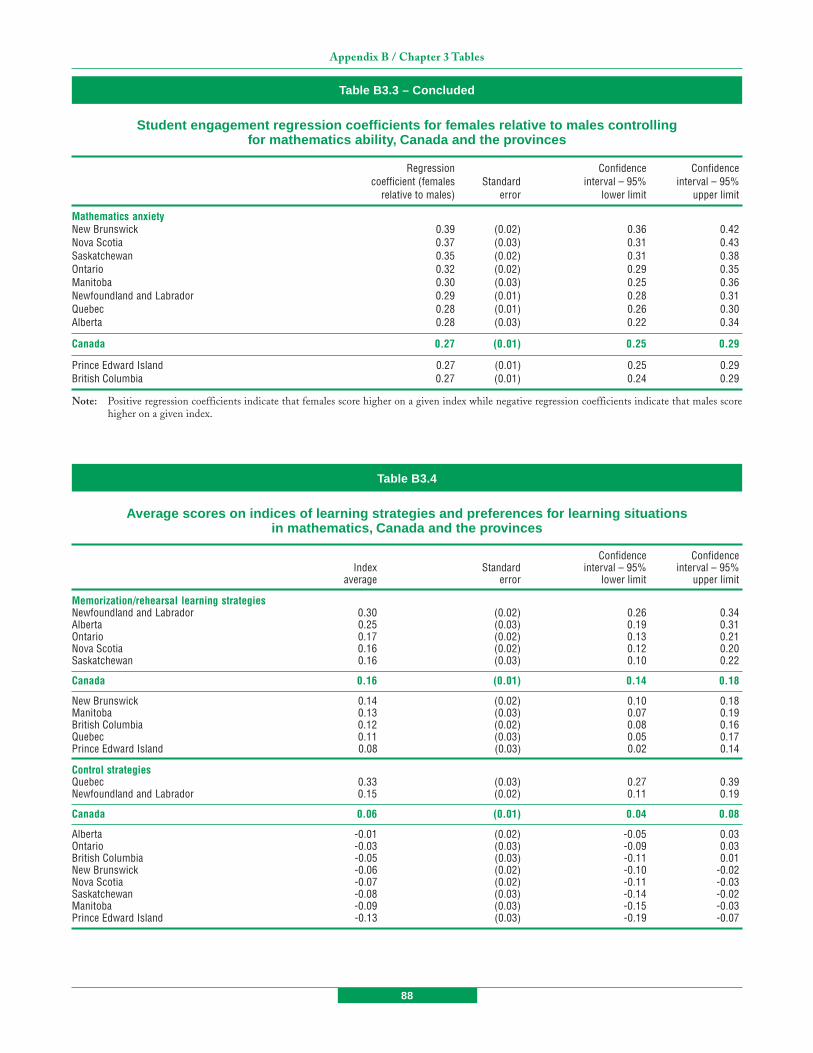
88
Appendix B / Chapter 3 Tables
Table B3.3 – Concluded
Student engagement regression coefficients for females relative to males controllingfor mathematics ability, Canada and the provinces
Regression Confidence Confidencecoefficient (females Standard interval – 95% interval – 95%
relative to males) error lower limit upper limit
Mathematics anxietyNew Brunswick 0.39 (0.02) 0.36 0.42Nova Scotia 0.37 (0.03) 0.31 0.43Saskatchewan 0.35 (0.02) 0.31 0.38Ontario 0.32 (0.02) 0.29 0.35Manitoba 0.30 (0.03) 0.25 0.36Newfoundland and Labrador 0.29 (0.01) 0.28 0.31Quebec 0.28 (0.01) 0.26 0.30Alberta 0.28 (0.03) 0.22 0.34
Canada 0.27 (0.01) 0.25 0.29
Prince Edward Island 0.27 (0.01) 0.25 0.29British Columbia 0.27 (0.01) 0.24 0.29
Note: Positive regression coefficients indicate that females score higher on a given index while negative regression coefficients indicate that males scorehigher on a given index.
Table B3.4
Average scores on indices of learning strategies and preferences for learning situationsin mathematics, Canada and the provinces
Confidence ConfidenceIndex Standard interval – 95% interval – 95%
average error lower limit upper limit
Memorization/rehearsal learning strategiesNewfoundland and Labrador 0.30 (0.02) 0.26 0.34Alberta 0.25 (0.03) 0.19 0.31Ontario 0.17 (0.02) 0.13 0.21Nova Scotia 0.16 (0.02) 0.12 0.20Saskatchewan 0.16 (0.03) 0.10 0.22
Canada 0.16 (0.01) 0.14 0.18
New Brunswick 0.14 (0.02) 0.10 0.18Manitoba 0.13 (0.03) 0.07 0.19British Columbia 0.12 (0.02) 0.08 0.16Quebec 0.11 (0.03) 0.05 0.17Prince Edward Island 0.08 (0.03) 0.02 0.14
Control strategiesQuebec 0.33 (0.03) 0.27 0.39Newfoundland and Labrador 0.15 (0.02) 0.11 0.19
Canada 0.06 (0.01) 0.04 0.08
Alberta -0.01 (0.02) -0.05 0.03Ontario -0.03 (0.03) -0.09 0.03British Columbia -0.05 (0.03) -0.11 0.01New Brunswick -0.06 (0.02) -0.10 -0.02Nova Scotia -0.07 (0.02) -0.11 -0.03Saskatchewan -0.08 (0.03) -0.14 -0.02Manitoba -0.09 (0.03) -0.15 -0.03Prince Edward Island -0.13 (0.03) -0.19 -0.07
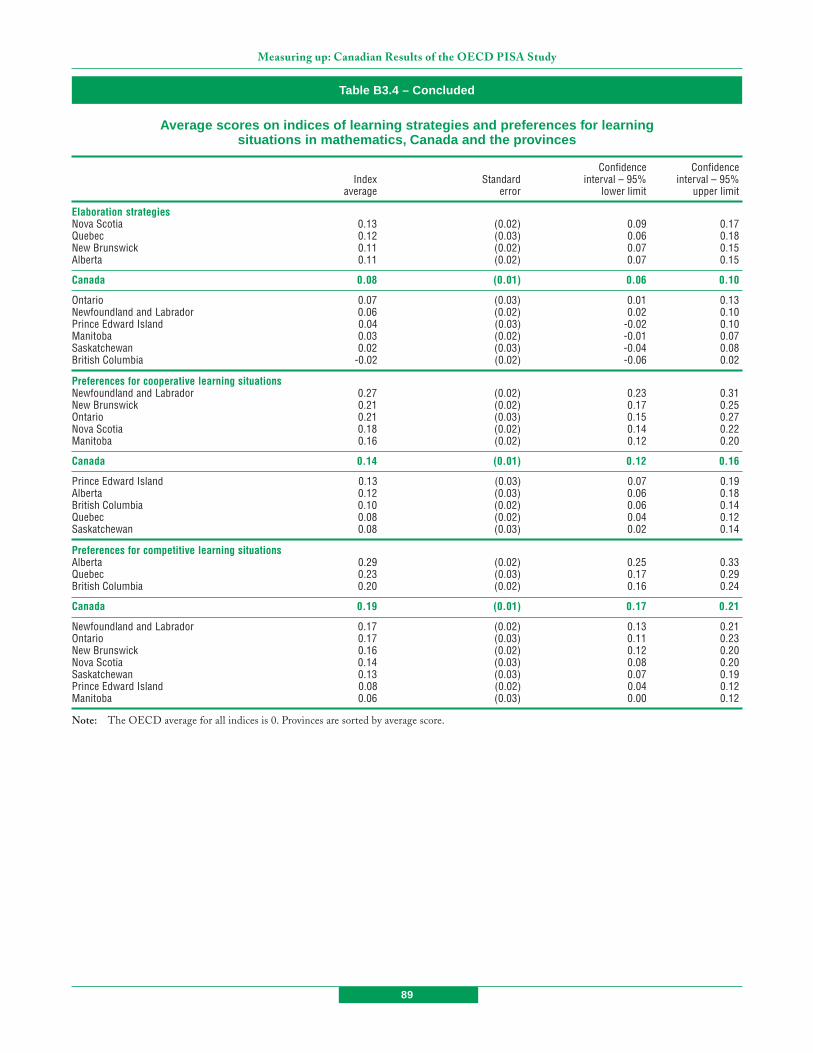
89
Measuring up: Canadian Results of the OECD PISA Study
Table B3.4 – Concluded
Average scores on indices of learning strategies and preferences for learningsituations in mathematics, Canada and the provinces
Confidence ConfidenceIndex Standard interval – 95% interval – 95%
average error lower limit upper limit
Elaboration strategiesNova Scotia 0.13 (0.02) 0.09 0.17Quebec 0.12 (0.03) 0.06 0.18New Brunswick 0.11 (0.02) 0.07 0.15Alberta 0.11 (0.02) 0.07 0.15
Canada 0.08 (0.01) 0.06 0.10
Ontario 0.07 (0.03) 0.01 0.13Newfoundland and Labrador 0.06 (0.02) 0.02 0.10Prince Edward Island 0.04 (0.03) -0.02 0.10Manitoba 0.03 (0.02) -0.01 0.07Saskatchewan 0.02 (0.03) -0.04 0.08British Columbia -0.02 (0.02) -0.06 0.02
Preferences for cooperative learning situationsNewfoundland and Labrador 0.27 (0.02) 0.23 0.31New Brunswick 0.21 (0.02) 0.17 0.25Ontario 0.21 (0.03) 0.15 0.27Nova Scotia 0.18 (0.02) 0.14 0.22Manitoba 0.16 (0.02) 0.12 0.20
Canada 0.14 (0.01) 0.12 0.16
Prince Edward Island 0.13 (0.03) 0.07 0.19Alberta 0.12 (0.03) 0.06 0.18British Columbia 0.10 (0.02) 0.06 0.14Quebec 0.08 (0.02) 0.04 0.12Saskatchewan 0.08 (0.03) 0.02 0.14
Preferences for competitive learning situationsAlberta 0.29 (0.02) 0.25 0.33Quebec 0.23 (0.03) 0.17 0.29British Columbia 0.20 (0.02) 0.16 0.24
Canada 0.19 (0.01) 0.17 0.21
Newfoundland and Labrador 0.17 (0.02) 0.13 0.21Ontario 0.17 (0.03) 0.11 0.23New Brunswick 0.16 (0.02) 0.12 0.20Nova Scotia 0.14 (0.03) 0.08 0.20Saskatchewan 0.13 (0.03) 0.07 0.19Prince Edward Island 0.08 (0.02) 0.04 0.12Manitoba 0.06 (0.03) 0.00 0.12
Note: The OECD average for all indices is 0. Provinces are sorted by average score.

90
Appendix B / Chapter 3 Tables
Table B3.5
Difference in mathematics performance between students with high levelsof mathematics learning strategies and preferences for learning compared to
students with low levels, Canada and the provinces
Average Averagemathematics score mathematics score Difference
for students who are for students who are in scores Standardlow* on the index high* on the index (high-low) error
Memorization strategiesNewfoundland and Labrador 505 535 30 (11.3)Prince Edward Island 467 513 46 (13.4)Nova Scotia 491 538 47 (7.0)New Brunswick 490 519 29 (6.0)Quebec 550 525 -25 (8.0)Ontario 497 548 51 (7.4)Manitoba 505 552 47 (9.3)Saskatchewan 502 541 39 (9.2)Alberta 524 569 45 (11.1)British Columbia 518 559 41 (6.4)
Canada 513 548 34 (3.8)
Control strategiesNewfoundland and Labrador 479 538 58 (9.3)Prince Edward Island 462 519 56 (9.2)Nova Scotia 481 536 54 (6.5)New Brunswick 482 529 47 (6.6)Quebec 514 548 33 (6.7)Ontario 494 543 49 (9.3)Manitoba 507 547 40 (8.8)Saskatchewan 490 540 50 (7.6)Alberta 529 585 56 (9.6)British Columbia 511 563 51 (6.6)
Canada 505 553 49 (3.7)
Elaboration strategiesNewfoundland and Labrador 496 543 47 (9.6)Prince Edward Island 466 525 58 (11.3)Nova Scotia 491 541 50 (7.6)New Brunswick 483 533 50 (6.5)Quebec 523 539 16 (8.5)Ontario 504 550 46 (8.2)Manitoba 513 544 30 (11.3)Saskatchewan 503 527 25 (11.8)Alberta 548 576 28 (12.7)British Columbia 517 563 46 (8.9)
Canada 509 552 43 (4.0)
Preferences for cooperative learningNewfoundland and Labrador 518 509 -9 (8.4)Prince Edward Island 491 500 9 (10.9)Nova Scotia 530 504 -26 (7.5)New Brunswick 507 508 1 (6.4)Quebec 537 535 -3 (6.9)Ontario 532 519 -14 (6.9)Manitoba 530 533 3 (10.5)Saskatchewan 519 518 -1 (7.8)Alberta 571 551 -20 (10.4)British Columbia 541 540 -1 (8.3)
Canada 524 529 5 (4.0)
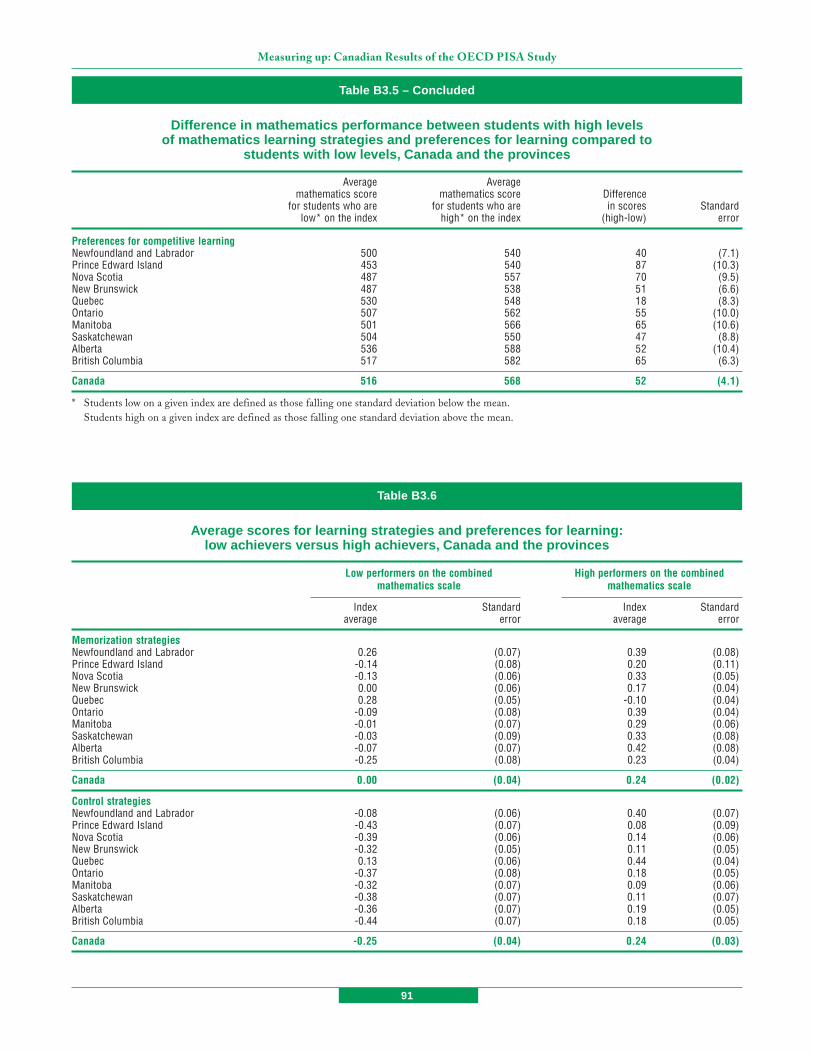
91
Measuring up: Canadian Results of the OECD PISA Study
Table B3.5 – Concluded
Difference in mathematics performance between students with high levelsof mathematics learning strategies and preferences for learning compared to
students with low levels, Canada and the provinces
Average Averagemathematics score mathematics score Difference
for students who are for students who are in scores Standardlow* on the index high* on the index (high-low) error
Preferences for competitive learningNewfoundland and Labrador 500 540 40 (7.1)Prince Edward Island 453 540 87 (10.3)Nova Scotia 487 557 70 (9.5)New Brunswick 487 538 51 (6.6)Quebec 530 548 18 (8.3)Ontario 507 562 55 (10.0)Manitoba 501 566 65 (10.6)Saskatchewan 504 550 47 (8.8)Alberta 536 588 52 (10.4)British Columbia 517 582 65 (6.3)
Canada 516 568 52 (4.1)
* Students low on a given index are defined as those falling one standard deviation below the mean.Students high on a given index are defined as those falling one standard deviation above the mean.
Table B3.6
Average scores for learning strategies and preferences for learning:low achievers versus high achievers, Canada and the provinces
Low performers on the combined High performers on the combinedmathematics scale mathematics scale
Index Standard Index Standardaverage error average error
Memorization strategiesNewfoundland and Labrador 0.26 (0.07) 0.39 (0.08)Prince Edward Island -0.14 (0.08) 0.20 (0.11)Nova Scotia -0.13 (0.06) 0.33 (0.05)New Brunswick 0.00 (0.06) 0.17 (0.04)Quebec 0.28 (0.05) -0.10 (0.04)Ontario -0.09 (0.08) 0.39 (0.04)Manitoba -0.01 (0.07) 0.29 (0.06)Saskatchewan -0.03 (0.09) 0.33 (0.08)Alberta -0.07 (0.07) 0.42 (0.08)British Columbia -0.25 (0.08) 0.23 (0.04)
Canada 0.00 (0.04) 0.24 (0.02)
Control strategiesNewfoundland and Labrador -0.08 (0.06) 0.40 (0.07)Prince Edward Island -0.43 (0.07) 0.08 (0.09)Nova Scotia -0.39 (0.06) 0.14 (0.06)New Brunswick -0.32 (0.05) 0.11 (0.05)Quebec 0.13 (0.06) 0.44 (0.04)Ontario -0.37 (0.08) 0.18 (0.05)Manitoba -0.32 (0.07) 0.09 (0.06)Saskatchewan -0.38 (0.07) 0.11 (0.07)Alberta -0.36 (0.07) 0.19 (0.05)British Columbia -0.44 (0.07) 0.18 (0.05)
Canada -0.25 (0.04) 0.24 (0.03)

92
Appendix B / Chapter 3 Tables
Table B3.6 – Concluded
Average scores for learning strategies and preferences for learning:low achievers versus high achievers, Canada and the provinces
Low performers on the combined High performers on the combinedmathematics scale mathematics scale
Index Standard Index Standardaverage error average error
Elaboration strategiesNewfoundland and Labrador 0.07 (0.06) 0.29 (0.09)Prince Edward Island -0.05 (0.07) 0.37 (0.08)Nova Scotia 0.05 (0.05) 0.42 (0.06)New Brunswick 0.03 (0.06) 0.41 (0.05)Quebec 0.33 (0.05) 0.19 (0.05)Ontario 0.01 (0.07) 0.31 (0.05)Manitoba 0.11 (0.07) 0.11 (0.05)Saskatchewan 0.05 (0.08) 0.17 (0.06)Alberta 0.06 (0.07) 0.22 (0.05)British Columbia -0.12 (0.07) 0.14 (0.05)
Canada 0.09 (0.03) 0.23 (0.02)
Preferences for cooperative learningNewfoundland and Labrador 0.34 (0.07) 0.21 (0.07)Prince Edward Island 0.03 (0.08) -0.03 (0.08)Nova Scotia 0.36 (0.06) -0.10 (0.06)New Brunswick 0.22 (0.05) 0.02 (0.06)Quebec 0.24 (0.06) -0.04 (0.04)Ontario 0.24 (0.08) 0.02 (0.04)Manitoba 0.12 (0.07) 0.00 (0.06)Saskatchewan 0.08 (0.07) -0.03 (0.06)Alberta 0.14 (0.07) -0.04 (0.05)British Columbia -0.02 (0.08) -0.06 (0.05)
Canada 0.19 (0.04) -0.02 (0.02)
Preferences for competitive learningNewfoundland and Labrador 0.10 (0.05) 0.39 (0.07)Prince Edward Island -0.10 (0.07) 0.53 (0.09)Nova Scotia -0.12 (0.05) 0.58 (0.07)New Brunswick 0.10 (0.04) 0.44 (0.06)Quebec 0.28 (0.05) 0.27 (0.05)Ontario 0.06 (0.08) 0.47 (0.06)Manitoba 0.03 (0.06) 0.40 (0.06)Saskatchewan -0.01 (0.06) 0.44 (0.07)Alberta 0.13 (0.07) 0.54 (0.08)British Columbia -0.11 (0.06) 0.53 (0.05)
Canada 0.09 (0.03) 0.44 (0.03)
Note: Low performers are defined as those who score below 420 points on the combined mathematics scale which corresponds to a proficiency level of 1or less. High performers are defined as those who score above 606 points on the combined mathematics scale which corresponds to a proficiencylevel of 5 or higher.
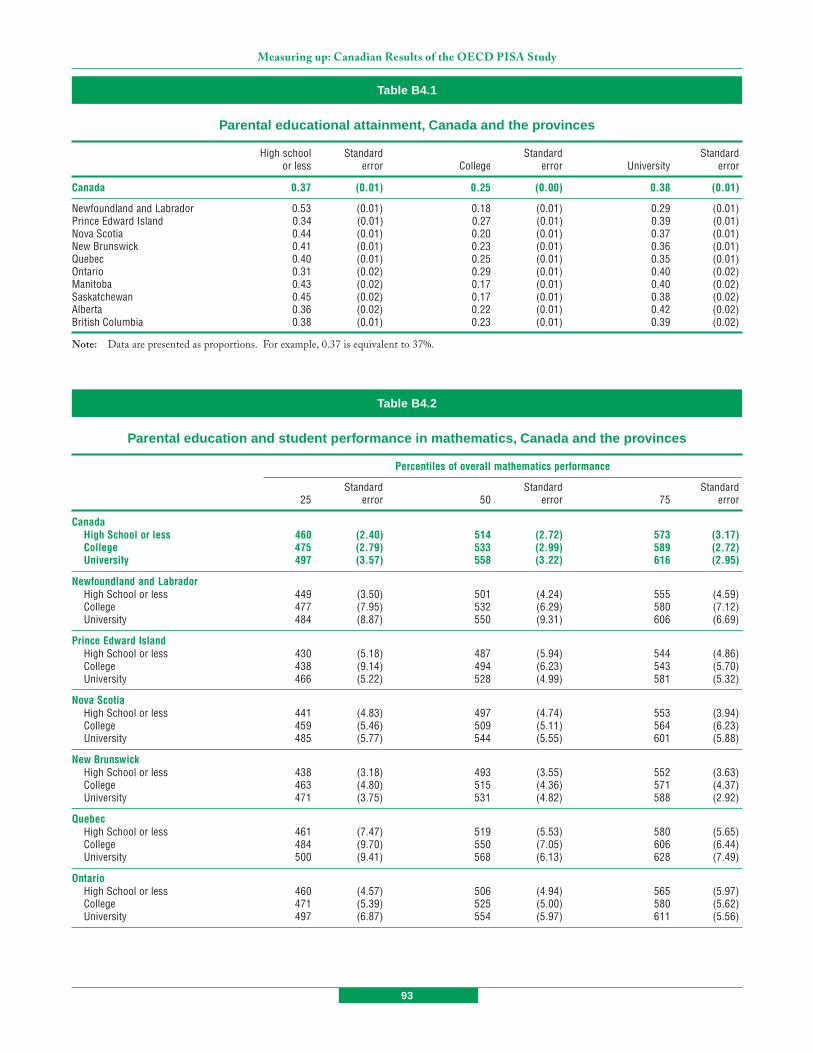
93
Measuring up: Canadian Results of the OECD PISA Study
Table B4.1
Parental educational attainment, Canada and the provinces
High school Standard Standard Standardor less error College error University error
Canada 0.37 (0.01) 0.25 (0.00) 0.38 (0.01)
Newfoundland and Labrador 0.53 (0.01) 0.18 (0.01) 0.29 (0.01)Prince Edward Island 0.34 (0.01) 0.27 (0.01) 0.39 (0.01)Nova Scotia 0.44 (0.01) 0.20 (0.01) 0.37 (0.01)New Brunswick 0.41 (0.01) 0.23 (0.01) 0.36 (0.01)Quebec 0.40 (0.01) 0.25 (0.01) 0.35 (0.01)Ontario 0.31 (0.02) 0.29 (0.01) 0.40 (0.02)Manitoba 0.43 (0.02) 0.17 (0.01) 0.40 (0.02)Saskatchewan 0.45 (0.02) 0.17 (0.01) 0.38 (0.02)Alberta 0.36 (0.02) 0.22 (0.01) 0.42 (0.02)British Columbia 0.38 (0.01) 0.23 (0.01) 0.39 (0.02)
Note: Data are presented as proportions. For example, 0.37 is equivalent to 37%.
Table B4.2
Parental education and student performance in mathematics, Canada and the provinces
Percentiles of overall mathematics performance
Standard Standard Standard25 error 50 error 75 error
CanadaHigh School or less 460 (2.40) 514 (2.72) 573 (3.17)College 475 (2.79) 533 (2.99) 589 (2.72)University 497 (3.57) 558 (3.22) 616 (2.95)
Newfoundland and LabradorHigh School or less 449 (3.50) 501 (4.24) 555 (4.59)College 477 (7.95) 532 (6.29) 580 (7.12)University 484 (8.87) 550 (9.31) 606 (6.69)
Prince Edward IslandHigh School or less 430 (5.18) 487 (5.94) 544 (4.86)College 438 (9.14) 494 (6.23) 543 (5.70)University 466 (5.22) 528 (4.99) 581 (5.32)
Nova ScotiaHigh School or less 441 (4.83) 497 (4.74) 553 (3.94)College 459 (5.46) 509 (5.11) 564 (6.23)University 485 (5.77) 544 (5.55) 601 (5.88)
New BrunswickHigh School or less 438 (3.18) 493 (3.55) 552 (3.63)College 463 (4.80) 515 (4.36) 571 (4.37)University 471 (3.75) 531 (4.82) 588 (2.92)
QuebecHigh School or less 461 (7.47) 519 (5.53) 580 (5.65)College 484 (9.70) 550 (7.05) 606 (6.44)University 500 (9.41) 568 (6.13) 628 (7.49)
OntarioHigh School or less 460 (4.57) 506 (4.94) 565 (5.97)College 471 (5.39) 525 (5.00) 580 (5.62)University 497 (6.87) 554 (5.97) 611 (5.56)

94
Appendix B / Chapter 4 Tables
ManitobaHigh School or less 459 (6.08) 519 (4.78) 579 (6.18)College 479 (7.49) 531 (6.35) 588 (8.35)University 482 (6.24) 543 (5.34) 602 (5.38)
SaskatchewanHigh School or less 448 (7.17) 505 (6.10) 566 (5.38)College 464 (10.63) 527 (6.90) 588 (9.32)University 474 (5.59) 535 (4.78) 588 (4.49)
AlbertaHigh School or less 473 (8.35) 531 (8.89) 592 (8.76)College 493 (7.79) 547 (6.48) 606 (9.30)University 516 (7.12) 572 (5.87) 632 (6.40)
British ColumbiaHigh School or less 469 (4.34) 523 (4.72) 582 (4.67)College 477 (4.60) 534 (5.14) 593 (5.31)University 503 (7.02) 563 (4.72) 617 (4.11)
Table B4.2 – Concluded
Parental education and student performance in mathematics, Canada and the provinces
Percentiles of overall mathematics performance
Standard Standard Standard25 error 50 error 75 error
Table B4.3
Distribution of parental education for Canadian students with high and low overall mathematicsperformance
Level of parental education
High school Standard Standard Standardor less error College error University error
Lowest 15% in mathematics 0.46 (0.01) 0.26 (0.01) 0.28 (0.01)Highest 15% in mathematics 0.25 (0.01) 0.23 (0.01) 0.52 (0.01)
Note: Data are presented as proportions. For example, 0.46 is equivalent to 46%.
Table B4.4
Parental educational attainment and occupation, Canada
High school Standard Standard Standardor less error College error University error
Higher service 0.13 (0.01) 0.21 (0.01) 0.41 (0.01)Lower service 0.18 (0.01) 0.31 (0.01) 0.38 (0.01)Routine clerical/sales 0.29 (0.01) 0.26 (0.01) 0.11 (0.01)Skilled-manual 0.18 (0.01) 0.11 (0.01) 0.05 (0.00)Semi-unskilled manual 0.20 (0.01) 0.09 (0.01) 0.04 (0.00)Farmers/Farm managers 0.03 (0.00) 0.02 (0.00) 0.01 (0.00)
Note: Data are presented as proportions. For example, 0.13 is equivalent to 13%.

95
Measuring up: Canadian Results of the OECD PISA Study
Table B4.5
Parental occupation and student mathematics performance, Canada and the provinces
Percentiles for overall mathematics performance
Standard Standard Standard25 error 50 error 75 error
CanadaHigher service 502 (3.56) 564 (3.35) 621 (3.12)Lower service 487 (3.34) 544 (2.51) 601 (2.69)Routine clerical / sales 471 (3.26) 528 (3.13) 584 (3.01)Skilled-manual 446 (4.05) 512 (3.95) 570 (3.78)Semi-unskilled manual 445 (4.12) 498 (3.64) 555 (3.99)Farmers / Farm managers 484 (9.62) 545 (6.73) 608 (11.12)
Newfoundland and LabradorHigher service 497 (8.16) 561 (8.16) 609 (9.25)Lower service 487 (7.46) 537 (5.45) 590 (8.19)Routine clerical / sales 462 (5.75) 510 (6.96) 564 (7.56)Skilled-manual 439 (7.88) 500 (7.95) 553 (6.41)Semi-unskilled manual 433 (7.73) 484 (8.36) 539 (9.38)Farmers / Farm managers 534 (35.15) 548 (38.40) 585 (46.37)
Prince Edward IslandHigher service 477 (10.23) 540 (9.30) 592 (8.48)Lower service 462 (6.45) 517 (5.62) 569 (6.22)Routine clerical / sales 444 (7.42) 500 (5.93) 549 (5.73)Skilled-manual 415 (11.64) 477 (9.85) 534 (7.47)Semi-unskilled manual 424 (9.65) 475 (9.55) 533 (11.32)Farmers / Farm managers 449 (16.20) 511 (11.86) 561 (17.73)
Nova ScotiaHigher service 488 (7.34) 545 (5.80) 599 (7.42)Lower service 480 (4.82) 535 (5.79) 593 (6.27)Routine clerical / sales 455 (5.22) 506 (4.94) 556 (6.47)Skilled-manual 427 (6.92) 482 (8.38) 533 (8.67)Semi-unskilled manual 421 (8.96) 479 (8.50) 538 (9.51)Farmers / Farm managers 476 (34.16) 542 (34.48) 619 (68.26)
New BrunswickHigher service 491 (5.92) 544 (4.39) 596 (5.41)Lower service 469 (4.90) 524 (5.19) 581 (4.44)Routine clerical / sales 452 (4.91) 506 (4.83) 563 (6.40)Skilled-manual 435 (6.34) 491 (6.18) 551 (6.41)Semi-unskilled manual 423 (5.29) 477 (4.89) 535 (7.75)Farmers / Farm managers 419 (16.89) 481 (30.25) 535 (21.04)
QuebecHigher service 515 (9.13) 578 (8.10) 634 (6.42)Lower service 489 (7.94) 555 (7.88) 611 (5.98)Routine clerical / sales 469 (9.55) 532 (7.90) 588 (6.20)Skilled-manual 441 (10.27) 517 (9.48) 582 (8.27)Semi-unskilled manual 448 (8.89) 503 (7.80) 559 (9.30)Farmers / Farm managers 495 (35.05) 572 (22.96) 637 (37.12)
OntarioHigher service 490 (6.61) 551 (7.64) 611 (8.56)Lower service 485 (5.56) 539 (5.88) 595 (6.60)Routine clerical / sales 477 (5.72) 532 (6.63) 584 (5.34)Skilled-manual 450 (8.48) 510 (6.54) 561 (7.68)Semi-unskilled manual 447 (8.34) 496 (6.94) 552 (9.12)Farmers / Farm managers 480 (18.63) 530 (24.39) 597 (53.13)

96
Appendix B / Chapter 4 Tables
Table B4.5 – Concluded
Parental occupation and student mathematics performance, Canada and the provinces
Percentiles for overall mathematics performance
Standard Standard Standard25 error 50 error 75 error
ManitobaHigher service 495 (7.58) 555 (7.50) 612 (8.52)Lower service 479 (7.45) 539 (6.71) 594 (5.45)Routine clerical / sales 467 (9.38) 528 (5.89) 585 (6.49)Skilled-manual 449 (9.67) 514 (9.87) 572 (10.31)Semi-unskilled manual 440 (8.60) 490 (9.83) 537 (9.09)Farmers / Farm managers 473 (9.28) 525 (13.36) 585 (16.52)
SaskatchewanHigher service 488 (8.10) 546 (6.98) 603 (7.49)Lower service 475 (8.03) 533 (6.16) 585 (5.56)Routine clerical / sales 449 (11.00) 511 (8.05) 570 (8.88)Skilled-manual 421 (11.73) 480 (10.11) 539 (15.39)Semi-unskilled manual 416 (11.30) 471 (14.54) 537 (12.60)Farmers / Farm managers 475 (9.84) 530 (11.77) 584 (11.36)
AlbertaHigher service 527 (7.51) 585 (4.53) 639 (8.20)Lower service 500 (7.84) 550 (7.55) 610 (8.47)Routine clerical / sales 479 (10.43) 532 (11.29) 594 (10.57)Skilled-manual 457 (16.07) 528 (14.09) 585 (11.80)Semi-unskilled manual 446 (14.42) 510 (16.31) 568 (9.03)Farmers / Farm managers 516 (15.26) 574 (12.93) 622 (13.29)
British ColumbiaHigher service 513 (7.23) 570 (5.57) 619 (4.76)Lower service 491 (5.21) 549 (5.05) 605 (5.23)Routine clerical / sales 470 (6.25) 527 (6.86) 586 (5.54)Skilled-manual 460 (8.28) 517 (6.29) 578 (6.75)Semi-unskilled manual 457 (9.78) 508 (8.14) 565 (8.79)Farmers / Farm managers 499 (45.65) 560 (24.65) 602 (26.15)
Table B4.6
School socio-economic status (SES) and student performance in mathematics in Canada
Percentiles of PISA overall mathematics performanceafter conditioning on individual SES
Standard Standard Standard25 error 50 error 75 error
Low SES schools 466 (3.61) 525 (3.40) 585 (3.53)Middle SES schools 482 (2.38) 535 (2.50) 589 (2.71)High SES schools 494 (3.49) 548 (3.27) 602 (3.21)

MeasurMeasurMeasurMeasurMeasuring up:ing up:ing up:ing up:ing up: Canadian Canadian Canadian Canadian CanadianRRRRResults of the OECD PISA Studyesults of the OECD PISA Studyesults of the OECD PISA Studyesults of the OECD PISA Studyesults of the OECD PISA Study
The Performance of Canada’s Youth inMathematics, Reading, Science
and Problem Solving2003 First Findings for Canadians Aged 15
The Program for International Student Assessment (PISA) is a collaborativeeffort among member countries of the Organisation for Economic Co-operationand Development. In Canada, PISA is administered through a partnership of the
Council of Ministers of Education, Canada, Human Resources and SkillsDevelopment Canada and Statistics Canada.
This program is designed to assess, on a regular basis, the achievement of15-year-olds in reading, mathematical and scientific literacy through a common
international test. Canada and 40 other countries participated in PISA 2003,which had a special focus on mathematics. About 28,000 15-year-olds from
more than 1,000 schools took part in Canada.
This report provides results of the PISA 2003 assessment of studentperformance in mathematics, reading, science and problem solving at the
provincial level and compares the achievement of Canadian students to that ofstudents internationally.
Catalogue no. 81-590-XIE — No. 2
9 780660 193977
ISBN 0-660-19397-3