Embed Size (px)
Citation preview
FIRST RESULTS FROM PISA 2003Executive Summary
Are students well prepared to meet the challenges of the future? Are they able to analyse, reason and communicate their ideas effectively? Do they have the capacity to continue learning throughout life? These are questions that parents, students, the public and those who run education systems continually ask.
The OECD Programme for International Student Assessment (PISA)
PISA is a collaborative process among the 30 member countries of the OECD and nearly 30 partner countries. It brings together scientific expertise from the participating countries and is steered by their governments on the basis of shared, policy-driven interests. PISA is an unprecedented attempt to measure student achievement, as is evident from some of its features:
– The literacy approach: PISA aims to define each assessment area (mathematics, science, reading and problem solving) not mainly in terms of mastery of the school curriculum, but in terms of the knowledge and skills needed for full participation in society.
– A long-term commitment: It will enable countries to monitor regularly and predictably their progress in meeting key learning objectives.
– The age-group covered: By assessing 15-year-olds, i.e. young people near the end of their compulsory education, PISA provides a significant indication of the overall performance of school systems.
– The relevance to lifelong learning: PISA does not limit itself to assessing students’ knowledge and skills but also asks them to report on their own motivation to learn, their beliefs about themselves and their learning strategies.
www.oecd.org
OECD’s books, periodicals and statistical databases are now available via www.SourceOECD.org, our online library.
This book is available to subscribers to the following SourceOECD themes:
Education and SkillsEmerging EconomiesTransition Economies
Ask your librarian for more details on how to access OECD books on line, or write to us at:
www.pisa.oecd.org
The OECD Programme for International Student Assessment (PISA) provides some of the answers to these questions. It assesses to what extent students near the end of compulsory schooling have acquired some of the knowledge and skills that are essential for full participation in society. The first PISA survey, with a focus on reading, was conducted in 2000, while the second PISA survey, with a focus on mathematics, was conducted in 2003 and also examined for the first time student performance in problem solving.
This Executive Summary reports on the initial results of PISA 2003 as presented in Learning for Tomorrow’s World – First Results from PISA 2003 and Problem Solving for Tomorrow’s World – First Measures of Cross-Curricular Competencies from PISA 2003. These reports go well beyond an examination of the relative standing of countries in mathematics, science, reading, and problem solving, looking at a wider range of educational outcomes that includes students’ motivation to learn, their beliefs about themselves and their learning strategies. The reports also consider how performance varies between the genders and between socio-economic groups, and provide insights into some of the factors that influence the development of knowledge and skills at home and at school, how these factors interact and what the implications are for policy development. Most importantly, the reports shed light on countries that succeed in achieving high performance standards while, at the same time, providing an equitable distribution of learning opportunities. These are noteworthy achievements. Will other countries take up the challenge?
FIRST RESULTS FROM PISA 2003
Executive Summary
P r o g r a m m e f o r I n t e r n a t i o n a l S t u d e n t A s s e s s m e n t
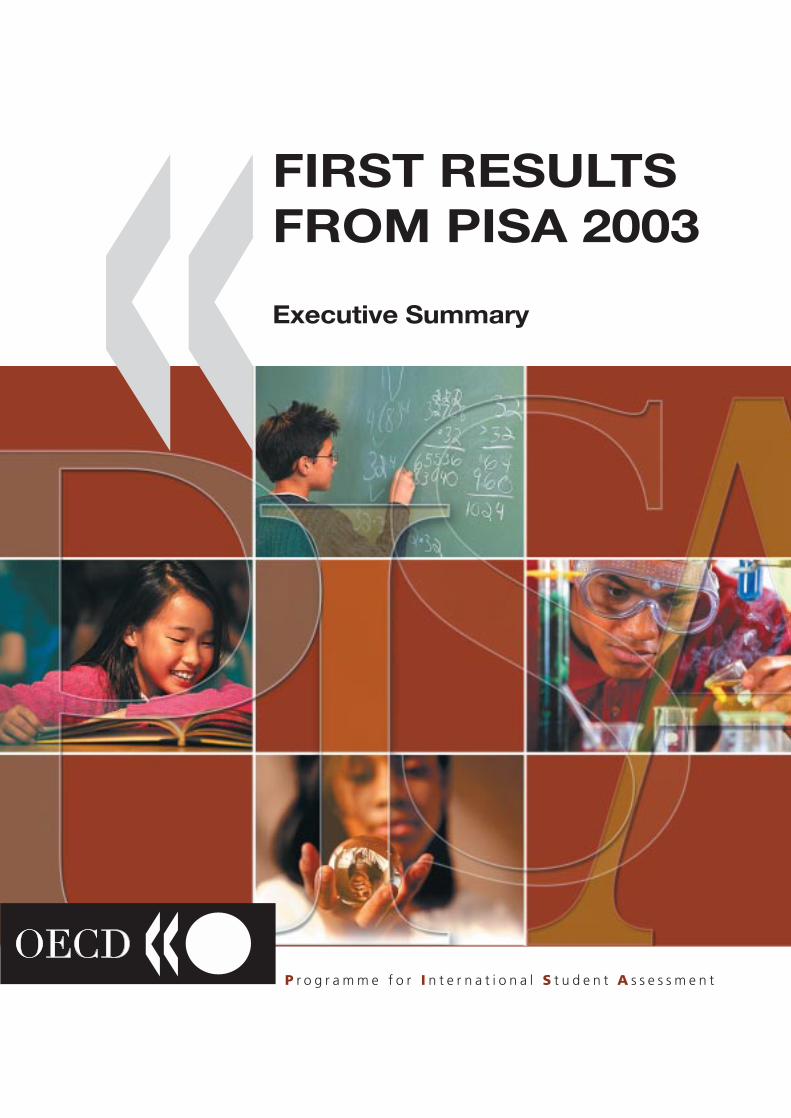
What is PISA?The Programme for International Student Assessment (PISA)is a three-yearly survey of the knowledge and skills of 15-year-olds in the principalindustrialised countries. The product of a collaboration between participatinggovernments through the Organisation for Economic Co-operation and Development(OECD), it draws on leading international expertise to develop valid comparisonsacross countries and cultures.
Key features of the PISA approach are:• Its policy orientation, with design and reporting methods determined by the need of governments
to draw policy lessons.
• Its innovative approach to “literacy”, which is concerned with the capacity of students to apply knowledge and skills in key subject areas and to analyse, reason and communicate effectively as they pose, solve and interpret problems in a variety of situations.
• Its relevance to lifelong learning, which does not limit PISA to assessing students’ curricular and cross-curricular competencies but also asks them to report on their own motivation to learn, their beliefs about themselves and their learning strategies.
• Its regularity, which will enable countries to monitor their progress in meeting key learning objectives.
• Its consideration of student performance alongside the characteristics of students’ backgrounds andschools, in order to explore some of the main features associated with educational success.
• Its breadth of geographical coverage, with the 49 countries that have participated in a PISA assessment so far and the 11 additional countries that will join the PISA 2006 assessment representing a total of one-third of the world population and almost nine-tenths of the world’s gross domestic product (GDP).

OECD countriesAustraliaAustriaBelgiumCanada Czech Republic Denmark Finland France Germany Greece
1. Response rate too low to ensure comparability. See Annex A3 in the main report.2. For the country Serbia and Montenegro, data for Montenegro are not available. The latter accounts for 7.9 per cent of the national population. Throughout this summary, the name “Serbia” is used as a shorthand for the Serbian part of Serbia and Montenegro.
HungaryIcelandIrelandItaly JapanKorea Luxembourg Mexico Netherlands New Zealand
NorwayPolandPortugalSlovak Republic Spain Sweden Switzerland Turkey United Kingdom1 United States
PISA partner countries Brazil Hong Kong-ChinaIndonesiaLatvia Liechtenstein Macao-China Russian Federation Serbia and Montenegro2 Thailand Tunisia Uruguay
PISA 2003 is the second assessment in the Programme: the first survey was in 2000. Well over a quarter of amillion students in 41 countries took part in a two-hour test in their schools, assessing their skills in mathematics,reading, science and problem solving. All 30 OECD member countries participated, as well as 11 partner countries.
New in PISA 2003:• The survey establishes a detailed profile of student performance in mathematics (in PISA 2000, the focus was on reading).
• A new part of the survey assesses students’ problem-solving skills, providing for the first time a direct assessment of lifecompetencies that apply across different areas of the school curriculum.
• The second survey makes comparisons over time possible. This must be approached with caution, however, since tworesults do not make a trend and since education systems develop relatively slowly.
Countries participating in PISA 2003:
1 2 3 4 5 6 7 8 9 10 11 12 13 14 15 16 17 18 19 20 21 22 23 24 25 26 27 28 29 30 31 32 33 34 35 36 37
First Results from PISA 2003
Executive Summary
Contents
The focus of the PISA 2003 assessment was on mathematics.
This was not a test of students’ ability simply to perform mathematical operations, but rather an assessment of how well they can recognise, formulate and tackle mathematical problems in the context of real life.
PISA reports students’ knowledge and skills separately in four areas of mathematics but also provides an overall summary of results.
This measure of overall student performance in mathematics is the basis for the analysis in this summary, which looks at factors associated with performance.
The results of PISA 2003 are reported and analysed in Learning for Tomorrow’s WorldFirst Results from PISA 2003 and Problem Solving for Tomorrow’s WorldFirst Measures of Cross-CurricularCompetencies from PISA 2003(The full reports are available at www.pisa.oecd.org)
Reporting PISAresults and findings
1 2 3 4 5 6 7 8 9 10 11 12 13 14 15 16 17 18 19 20 21 22 23 24 25 26 27 28 29 30 31 32 33 34 35 36 37

consider results in other areas measured by PISA:Pages 30 to 37
analyse a range of factors associated with student performance in mathematics, to help policy makers understand what lies behind the PISA results:
Pages 12 to 29
summarise student performance in mathematics:Pages 4 to 11
In this Executive Summary:
set out how PISA 2003 measured student performance in mathematics, summarising the framework that guided the assessment, explaining what skills students needed in order to be placed at different proficiency levels, and giving examples of the tasks used to test whether students had these skills.
give a profile of student mathematics performance in each country using three measures: how many students reach specified levels of proficiency, the average student performance and how widely student performance is dispersed around this average. In the case of average performance, comparisons are made across different areas of mathematics, between the 2000 and 2003 surveys, and between genders.
analyse some of the characteristics of effective learners. This section compares student self reports about their motivation, attitudes, self-related beliefs, anxiety levels and learning strategies to their performance in mathematics. It indicates the importance of such factors both to success at school and to preparation for lifelong learning.
consider how mathematics performance differs between schools and between students of differing socio-economic backgrounds. It shows how in both cases the size of performance differences varies considerably, and goes on to look at the relationship between school differences and socio-economic background differences. This has implications for the shape of improvement strategies designed to raise performance standards and improve equity in the distribution of educational opportunities.
ask how schools can make a difference, given that much performance variation across schools is influenced by the home backgrounds of the student intake. This section shows the extent to which schools with a positive climate, effective policies and practices and sufficient resources perform better, and how these effects appear to operate in combination with socio-economic background factors.
report on PISA 2003’s assessment of student performance in problem solving, showing first how it was conducted and then the results.
report on reading performance. Reading was the main focus in 2000, and PISA 2003 used a briefer assessment to provide an update.
report on science performance, which has again been assessed briefly in 2003, with the first detailed assessment due in 2006.
Contents
1 2 3 4 5 6 7 8 9 10 11 12 13 14 15 16 17 18 19 20 21 22 23 24 25 26 27 28 29 30 31 32 33 34 35 36 37
Pages 4-7
Pages 8-11
Pages 12-17
Pages 18-23
Pages 24-29
Pages 30-33
Pages 34-35
Pages 36-37
Assessing mathematicsHow PISA 2003 measuredstudent performance in mathematics
PISA 2003 measured student performance in four areas ofmathematics:
• Space and shape, involving spatial and geometricphenomena and the properties of objects;
• Change and relationships, involving relationshipsbetween variables, and an understanding of the ways in which they are represented, including equations;
• Quantity, involving numeric phenomena as well as quantitative relationships and patterns; and
• Uncertainty, involving probabilistic and statistical phenomena.
The PISA mathematics assessment required students to confrontmathematical problems that are based in real-world contexts,where students are required to identify features of a problemsituation that might be amenable to mathematical investigation,and to activate the relevant mathematical competencies to solvethe problem. This requires various skills, including: thinking andreasoning; argumentation; communication; modelling; problem
posing and solving; representation; and using symbolic, formaland technical language and operations. While it is generally truethat these skills operate together, and there is some overlap intheir definitions, three clusters of cognitive activity encompassedby these skills can be distinguished:
• Reproduction skills refer to the reproduction of knowledge, such as recognition of familiar mathematicalprocesses and problem types and carrying out routine operations. These are needed for the simplest of the tasks set for students in PISA.
• Connection skills require students to move beyond routine problems to make interpretations and links in different situations, but still in relatively familiar contexts.These tend to be used in problems of medium difficulty.
• Reflection skills require insight and reflection on the part of students, as well as creativity in identifying mathematical elements in a problem and in making connections. These problems are often complex, and tend to be the most difficult in PISA.
Students were presented with a series oftasks based on the kinds of problems thatthey might encounter in real life – related totheir personal lives, to learning, to work orto issues of wider public relevance such ascommunity-related or scientific phenomena.Examples of tasks are shown overleaf.
The 2003 assessment included 85 differentmathematical questions at varying levelsof difficulty. Usually several tasks wereposed about a single mathematical situationdescribed in a text or diagram. In manycases, students were required to constructa response in their own words to questionsbased on the text given. Sometimes theyhad to write down their calculations orexplain their results, to show their methods
and thought processes. These open tasksrequired the professional judgement oftrained markers to assign the observedresponses to defined response categories.For answers that were not fully correct,partial credit was often given.
Each student was awarded a score basedon the difficulty of tasks that he or she couldreliably perform. Scores were reported foreach of the four areas of mathematics, andfor overall performance in mathematics.The scale was constructed so that in 2003,the average student score in OECD countriesis 500 points, and about two-thirds ofstudents score between 400 and 600 points(i.e., standard deviation equals 100 points).
Note that a score can be used to describeboth the performance of a student and thedifficulty of a task. Thus, for example, astudent with a score of 650 can usually beexpected to complete a task with a difficultyrating of about 650, as well as easier taskswith lower ratings.
Student performance scores and the difficultyof tasks were also divided into six proficiencylevels. As shown on the facing page, eachof these levels can be described in termsof what kinds of mathematical processesstudents can do.
Mathematics tasks, student scores and proficiency levels
Today, everyone is required to use mathematics as a tool in daily life. PISA’s assessment of students’mathematical knowledge and skills is rooted in the concept of “mathematical literacy”. This is defined in terms of the capacity to see how mathematics can be used in the real world and thus to engage inmathematics to meet one’s needs. There is not a single cut-off point at which students are deemedmathematically literate, but rather various levels of mathematical proficiency related to students’ capacity to analyse, reason and communicate effectively when using mathematics.
1 2 3 4 5 6 7 8 9 10 11 12 13 14 15 16 17 18 19 20 21 22 23 24 25 26 27 28 29 30 31 32 33 34 35 36 37

Summary descriptions for the six levels of proficiency in mathematics
Student proficiency in mathematics
What students can typically do
evelScorepoints
654321
At Level 6 students can conceptualise, generalise, and utilise information based on their investigations and modelling of complex problem situations. They can link different information sources and representations and flexibly translate among them. Students at this level are capable of advanced mathematical thinking and reasoning. These students can apply insight and understanding along with a mastery of symbolic and formal mathematical operations and relationships to develop new approaches and strategies for dealing with novel situations. Students at this level can formulate and precisely communicate their actions and reflections regarding their findings, interpretations, arguments and the appropriateness of these to the original situations.
Level At Level 5 students can develop and work with models for complex situations, identifying constraints and specifying assumptions. They can select, compare, and evaluate appropriate problem-solving strategies for dealing with complex problems related to these models. Students at this level can work strategically using broad, well-developed thinking and reasoning skills, appropriately linked representations, symbolic and formal characterisations, and insight pertaining to these situations. They can reflect on their actions and formulate and communicate their interpretations and reasoning.
Level At Level 4 students can work effectively with explicit models for complex concrete situations that may involve constraints or call for making assumptions. They can select and integrate different representations, including symbolic ones, linking them directly to aspects of real-world situations. Students at this level can utilise well-developed skills and reason flexibly, with some insight, in these contexts. They can construct and communicate explanations and arguments based on their interpretations, arguments and actions.
Level At Level 3 students can execute clearly described procedures, including those that require sequential decisions. They can select and apply simple problem-solving strategies. Students at this level can interpret and use representations based on different information sources and reason directly from them. They can develop short communications reporting their interpretations, results and reasoning.
Level At Level 2 students can interpret and recognise situations in contexts that require no more than direct inference. They can extract relevant information from a single source and make use of a single representational mode. Students at this level can employ basic algorithms, formulae, procedures, or conventions. They are capable of direct reasoning and making literal interpretations of the results.
Level At Level 1 students can answer questions involving familiar contexts where all relevant information is present and the questions are clearly defined. They are able to identify information and to carry out routine procedures according to direct instructions in explicit situations. They can perform actions that are obvious and follow immediately from the given stimuli.
58
420
482
544
606
668
Figure 1
Assessing mathematics
1 2 3 4 5 6 7 8 9 10 11 12 13 14 15 16 17 18 19 20 21 22 23 24 25 26 27 28 29 30 31 32 33 34 35 36 37

Total height 252 cm
Total depth 400 cm
STAIRCASEThe diagram below illustrates a staircase with 14 steps and a total height of 252 cm :
QuestionWhat is the height of each of the 14 steps?Height: ................ cm
WALKINGThe picture shows the footprints of a man walking. The pacelength P is the distance between the rear of two consecutive footprints.
For men, the formula, n = 140, gives an approximate relationship between n and P where:
n = number of steps per minute, andP = pacelength in metres.
QuestionIf the formula applies to Heiko's walkingand Heiko takes 70 steps per minute,what is Heiko's pacelength?Show your work.
P
Assessing mathematics
1 2 3 4 5 6 7 8 9 10 11 12 13 14 15 16 17 18 19 20 21 22 23 24 25 26 27 28 29 30 31 32 33 34 35 36 37
This short response question is situated in a daily life context. Thestudent has to interpret and solve the problem which uses twodifferent representation modes: language, including numbers, and graphical. This question also has redundant information (i.e.,the depth is 400 cm) which can be confusing for students, but thisis not unusual in real-world problem solving. The actual procedureneeded is a simple division. As this is a basic operation with numbers (252 divided by 14) the question belongs to the reproduction competency cluster. All the required information ispresented in a recognisable situation and the students can extractthe relevant information from this. The question has a difficulty of421 score points (Level 2).
This open-constructed response question is situated in a personal context. The questionis about the relationship between the number of steps per minute and pacelength, whichmeans that it is in the change and relationships content area. Students need to solve theproblem by substitution into a simple formula and carrying out a routine calculation: if n/p= 140, and n = 70, what is the value of p? The competencies needed involve reproducingpractised knowledge, performing routine procedures, the application of standard technicalskills, manipulating expressions containing symbols and formulae, and carrying outcomputations. With this combination of competencies, and the real-world setting thatstudents must handle, the question has a difficulty of 611 score points (Level 5).
A sample of PISA mathematics tasksSpace and shape scale
Change and relationships scale
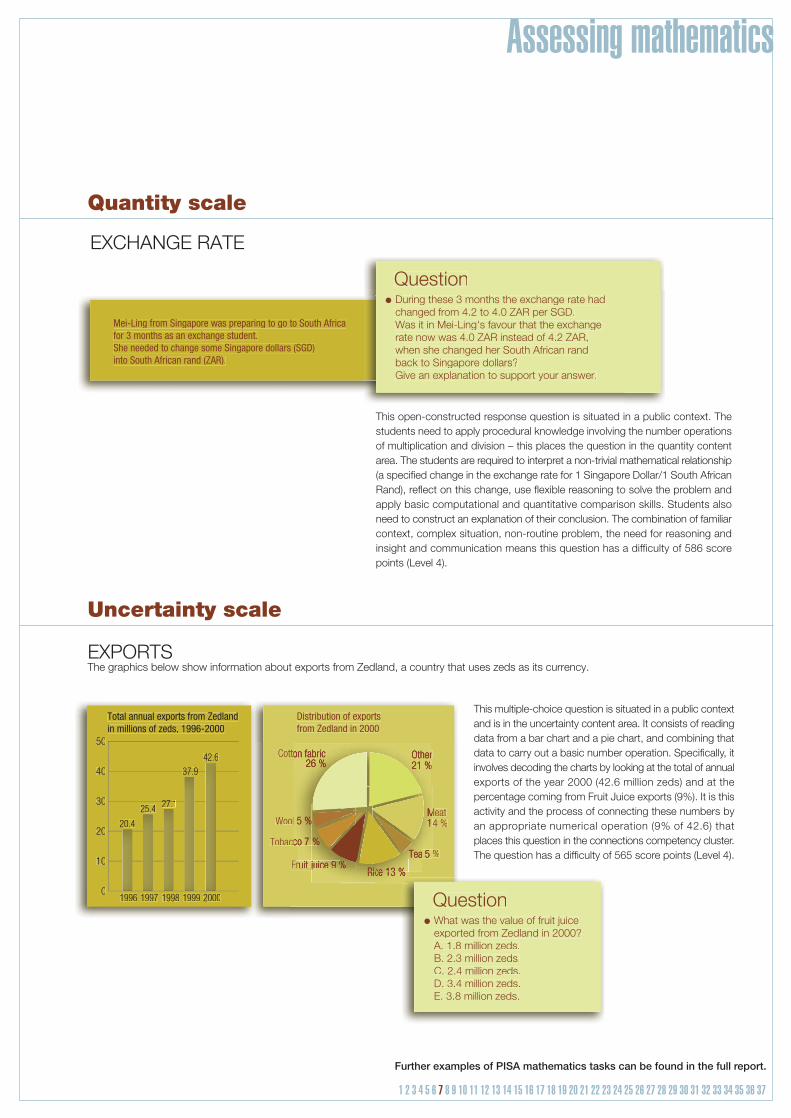
Mei-Ling from Singapore was preparing to go to South Africafor 3 months as an exchange student.She needed to change some Singapore dollars (SGD)into South African rand (ZAR).
EXCHANGE RATE
QuestionDuring these 3 months the exchange rate hadchanged from 4.2 to 4.0 ZAR per SGD.Was it in Mei-Ling's favour that the exchangerate now was 4.0 ZAR instead of 4.2 ZAR, when she changed her South African randback to Singapore dollars?Give an explanation to support your answer.
Distribution of exportsfrom Zedland in 2000
Total annual exports from Zedlandin millions of zeds, 1996-2000
EXPORTS The graphics below show information about exports from Zedland, a country that uses zeds as its currency.
QuestionWhat was the value of fruit juiceexported from Zedland in 2000?A. 1.8 million zeds.B. 2.3 million zeds.C. 2.4 million zeds.D. 3.4 million zeds.E. 3.8 million zeds.
0
10
20
30
40
50Cotto
20.425.4 27.127 1
37.937 942.6
1996 1997 1998 1999 2000
r%
Meat4 %
%Fruit j
Tobacc
Wool
Assessing mathematics
Further examples of PISA mathematics tasks can be found in the full report.
1 2 3 4 5 6 7 8 9 10 11 12 13 14 15 16 17 18 19 20 21 22 23 24 25 26 27 28 29 30 31 32 33 34 35 36 37
This open-constructed response question is situated in a public context. Thestudents need to apply procedural knowledge involving the number operationsof multiplication and division – this places the question in the quantity contentarea. The students are required to interpret a non-trivial mathematical relationship(a specified change in the exchange rate for 1 Singapore Dollar/1 South AfricanRand), reflect on this change, use flexible reasoning to solve the problem andapply basic computational and quantitative comparison skills. Students alsoneed to construct an explanation of their conclusion. The combination of familiarcontext, complex situation, non-routine problem, the need for reasoning andinsight and communication means this question has a difficulty of 586 scorepoints (Level 4).
This multiple-choice question is situated in a public contextand is in the uncertainty content area. It consists of readingdata from a bar chart and a pie chart, and combining thatdata to carry out a basic number operation. Specifically, itinvolves decoding the charts by looking at the total of annualexports of the year 2000 (42.6 million zeds) and at thepercentage coming from Fruit Juice exports (9%). It is thisactivity and the process of connecting these numbers byan appropriate numerical operation (9% of 42.6) that places this question in the connections competency cluster.The question has a difficulty of 565 score points (Level 4).
Uncertainty scale
Quantity scale
Mathematics performanceA profile of student performance in mathematics
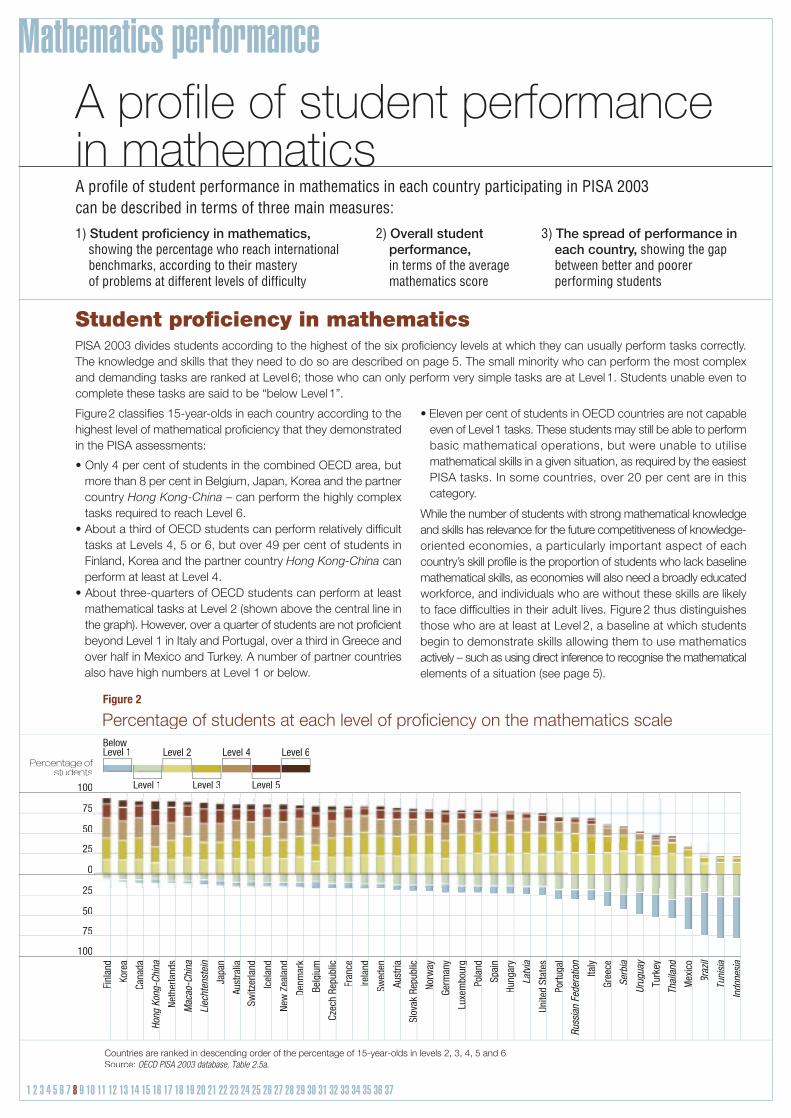
PISA 2003 divides students according to the highest of the six proficiency levels at which they can usually perform tasks correctly.The knowledge and skills that they need to do so are described on page 5. The small minority who can perform the most complexand demanding tasks are ranked at Level 6; those who can only perform very simple tasks are at Level 1. Students unable even tocomplete these tasks are said to be “below Level 1”.
Figure2 classifies 15-year-olds in each country according to the highest level of mathematical proficiency that they demonstratedin the PISA assessments:
• Only 4 per cent of students in the combined OECD area, butmore than 8 per cent in Belgium, Japan, Korea and the partnercountry Hong Kong-China – can perform the highly complextasks required to reach Level 6.
• About a third of OECD students can perform relatively difficult tasks at Levels 4, 5 or 6, but over 49 per cent of students inFinland, Korea and the partner country Hong Kong-China canperform at least at Level 4.
• About three-quarters of OECD students can perform at leastmathematical tasks at Level 2 (shown above the central line inthe graph). However, over a quarter of students are not proficientbeyond Level 1 in Italy and Portugal, over a third in Greece andover half in Mexico and Turkey. A number of partner countriesalso have high numbers at Level 1 or below.
• Eleven per cent of students in OECD countries are not capableeven of Level1 tasks. These students may still be able to performbasic mathematical operations, but were unable to utilisemathematical skills in a given situation, as required by the easiestPISA tasks. In some countries, over 20 per cent are in thiscategory.
While the number of students with strong mathematical knowledgeand skills has relevance for the future competitiveness of knowledge-oriented economies, a particularly important aspect of eachcountry’s skill profile is the proportion of students who lack baselinemathematical skills, as economies will also need a broadly educatedworkforce, and individuals who are without these skills are likelyto face difficulties in their adult lives. Figure 2 thus distinguishesthose who are at least at Level 2, a baseline at which studentsbegin to demonstrate skills allowing them to use mathematicsactively – such as using direct inference to recognise the mathematicalelements of a situation (see page 5).
Student proficiency in mathematics
A profile of student performance in mathematics in each country participating in PISA 2003 can be described in terms of three main measures:
3) The spread of performance ineach country, showing the gapbetween better and poorerperforming students
2) Overall studentperformance, in terms of the averagemathematics score
1) Student proficiency in mathematics,showing the percentage who reach internationalbenchmarks, according to their mastery of problems at different levels of difficulty
Percentage of students at each level of proficiency on the mathematics scale
Countries are ranked in descending order of the percentage of 15-year-olds in levels 2, 3, 4, 5 and 6.Source: OECD PISA 2003 database, Table 2.5a.
BelowLevel 1
Level 1
Level 2
Level 3
Level 4
Level 5
Level 6Percentage of
students
Finl
and
Kore
a
Cana
da
Neth
erla
nds
Mac
ao-C
hina
Liec
hten
stei
n
Japa
n
Aust
ralia
Switz
erla
nd
Icel
and
New
Zeal
and
Denm
ark
Belg
ium
Czec
h Re
publ
ic
Fran
ce
Irela
nd
Swed
en
Aust
ria
Norw
ay
Germ
any
Luxe
mbo
urg
Pola
nd
Spai
n
Hung
ary
Latv
ia
Unite
dSt
ates
Portu
gal
Italy
Gree
ce
Serb
ia
Urug
uay
Turk
ey
Thai
land
Mex
ico
Braz
il
Tuni
sia
Indo
nesi
a
Hong
Kon
g-Ch
ina
Slov
ak R
epub
lic
Russ
ian
Fede
ratio
n
100
75
50
25
0
25
50
75
100
Finl
and
Kore
a
Cana
da
Hong
Kon
gCh
ina
Neth
erla
nds
Mac
aoCh
ina
Liec
hten
stei
n
Japa
n
Aust
ralia
Switz
erla
nd
Icel
and
New
Zea
land
Denm
ark
Belg
ium
Czec
h Re
publ
ic
Fran
ce
Irela
nd
Swed
en
Aust
ria
Slov
ak R
epub
lic
Norw
ay
Germ
any
Luxe
mbo
urg
Pola
nd
Spai
n
Hung
ary
Latv
ia
Unite
d St
ates
Portu
gal
Russ
ian
Fede
ratio
n
Italy
Gree
ce
Serb
ia
Urug
uay
Turk
ey
Thai
land
Mex
ico
Braz
il
Tuni
sia
Indo
nesi
a
Figure 2
1 2 3 4 5 6 7 8 9 10 11 12 13 14 15 16 17 18 19 20 21 22 23 24 25 26 27 28 29 30 31 32 33 34 35 36 37
Range of ranks*
OECD countries All countries
Source:OECD PISA 2003 database.
Stat
istic
ally
sig
nific
antly
abo
ve th
e OE
CD a
vera
ge
Mean performance on the mathematics scale
ote: Beca ortexact rank order positions for countries. However, it is possible to report the range of rank order positions within which the country mean lies with 95 per cent likelihood.
Upperr
Lowerk
Upperr
Lowerk
Table 1
Not s
tatis
tical
lysi
gnifi
cant
ly
s diffe
rent
d fro
m th
e OE
CD
f aver
age
a
Stat
istic
ally
sig
nific
antly
bel
ow th
e OE
CD a
vera
geS
11223556699
1213131415
16171719
21222222252525292929323233343437383838
4579
109
10121212131716171819
20212124
24242627282828313131333436363637404040
-345-778-99
101413141516
18181821
2121232324
-24
-262627
-28
--
29---
111 -244-4779
10101112
13141516
1819191922
-22
-252527
-28
--
29---
Hong Kong-ChinaFinlandKoreaNetherlandsLiechtensteinJapanCanadaBelgiumMacao-ChinaSwitzerlandAustraliaNew ZealandCzech RepublicIcelandDenmarkFranceSweden
AustriaGermanyIrelandSlovak Republic
NorwayLuxembourgPolandHungarySpainLatviaUnited StatesRussian FederationPortugalItalyGreeceSerbiaTurkeyUruguayThailandMexicoIndonesiaTunisiaBrazil
Mathematics performance
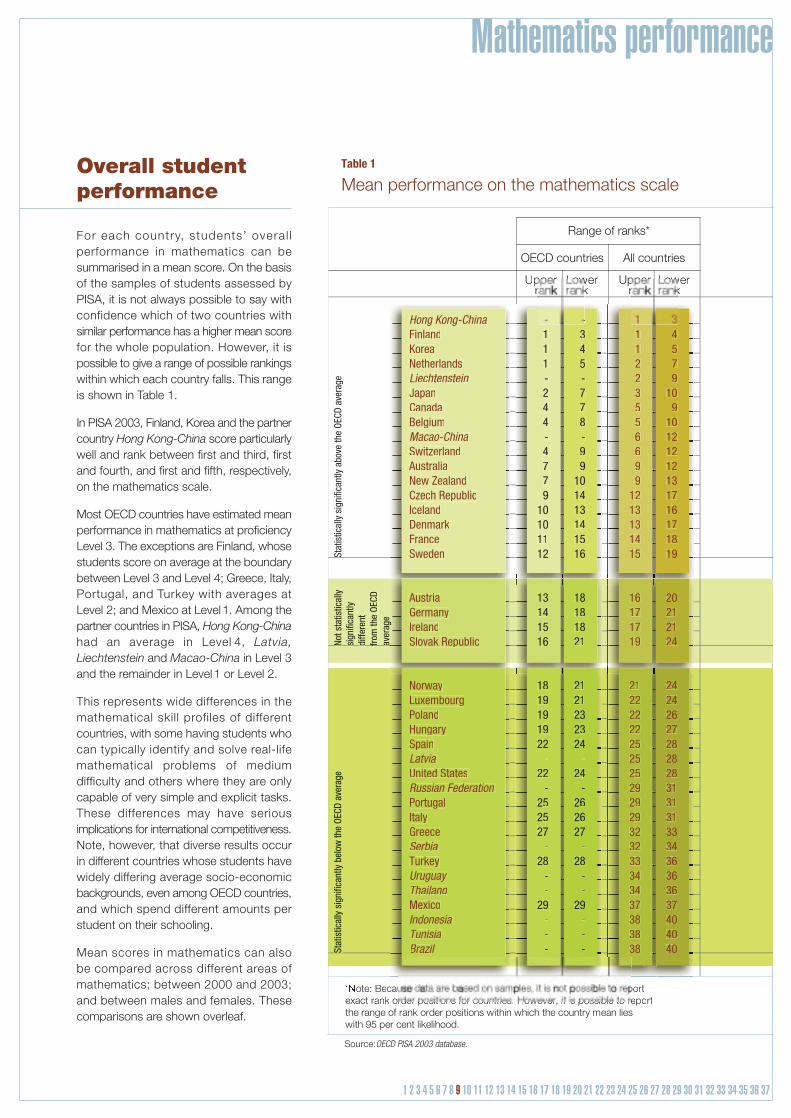
For each country, students’ overal lperformance in mathematics can besummarised in a mean score. On the basisof the samples of students assessed byPISA, it is not always possible to say withconfidence which of two countries withsimilar performance has a higher mean scorefor the whole population. However, it ispossible to give a range of possible rankingswithin which each country falls. This rangeis shown in Table 1.
In PISA 2003, Finland, Korea and the partnercountry Hong Kong-China score particularlywell and rank between first and third, firstand fourth, and first and fifth, respectively,on the mathematics scale.
Most OECD countries have estimated meanperformance in mathematics at proficiencyLevel 3. The exceptions are Finland, whosestudents score on average at the boundarybetween Level 3 and Level 4; Greece, Italy,Portugal, and Turkey with averages at Level 2; and Mexico at Level 1. Among thepartner countries in PISA, Hong Kong-Chinahad an average in Level 4, Latvia, Liechtenstein and Macao-China in Level 3and the remainder in Level 1 or Level 2.
This represents wide differences in themathematical skill profiles of different countries, with some having students whocan typically identify and solve real-lifemathematical problems of medium difficulty and others where they are onlycapable of very simple and explicit tasks.These differences may have seriousimplications for international competitiveness.Note, however, that diverse results occurin different countries whose students havewidely differing average socio-economicbackgrounds, even among OECD countries,and which spend different amounts perstudent on their schooling.
Mean scores in mathematics can also be compared across different areas ofmathematics; between 2000 and 2003; and between males and females. Thesecomparisons are shown overleaf.
Overall student performance
1 2 3 4 5 6 7 8 9 10 11 12 13 14 15 16 17 18 19 20 21 22 23 24 25 26 27 28 29 30 31 32 33 34 35 36 37

Mathematics performance
Countries showing a statistically significant change in areas of mathematics performancePISA 2000 to PISA 2003
Increase
Space and shape scale
BelgiumCzech Republic
ItalyPoland
Iceland, Mexico
BelgiumCanada
Czech RepublicFinland
GermanyHungary
KoreaPoland
PortugalSpain
Change and relationships scale
Decrease
BrazilaaLatvia
LiechtensteinBrazilIndonesia
LatviaThailand
Thailand
Table 2
1 2 3 4 5 6 7 8 9 10 11 12 13 14 15 16 17 18 19 20 21 22 23 24 25 26 27 28 29 30 31 32 33 34 35 36 37
Disadvantages faced by females in education have diminished inrecent years in many educational domains, but males continueto do better in certain disciplines, particularly in terms of theirlikelihood of gaining tertiary qualifications in mathematics-relatedfields of study.
PISA found that in most countries males outperform females, butthe overall difference is usually not large. Despite the absence ofa large overall gender difference in mathematics as there is infavour of females in reading (see page 32), gender differences inmathematics warrant continued attention for several reasons: See Table 2.5c, Fig. 2.18, main report
• The contrast between countries where such differences persistand those where they are not visible suggests that unequalperformance by gender in mathematics is not an inevitableresult, and that some countries do provide a learning environmentthat benefits both genders equally.
• Differences in the picture among different areas of mathematicsshow that some areas require particular attention. Males areahead in performing space and shape tasks in all but five OECDcountries: Finland, Iceland, Japan, the Netherlands and Norway.Gender difference is much less widespread for tasks involvingquantity: they are measurable in only 12 out of 29 OECD countries.
• In most countries, the gender differences are larger within schoolsthan they are overall, since females tend to attend the higherperforming, academically oriented tracks and schools at a higherrate than males but, within these, often perform well belowmales in mathematics. This raises issues for teachers andteaching.
PISA reported on four areas of mathematics (see page 4), showing student performance on separate scales for “space and shape”,“change and relationships”, “quantity” and “uncertainty”. In some countries, students’ relative performance is not equally strongacross these scales, which could indicate where mathematics teaching is stronger or where it puts greater emphasis. Some of themost substantial differences among OECD countries are in:
• The Czech Republic and the Slovak Republic – both above the OECD average on the space and shape scale, but aroundaverage and below average respectively on the uncertainty scale;
• New Zealand – only just above average on the quantity scale, but well above average on the other three scales.
• Switzerland – one of the highest scoring countries on three of the scales, but further down the distribution on the uncertainty scale.
• Germany – above the OECD average on the quantity scale, but below average on the uncertainty scale.See Figs. 2.6b, 2.9b, 2.12b and 2.15b, main report
Four areas of performance in mathematics
PISA allows comparison of performance over time in those areasof mathematics that were also assessed in 2000. These are spaceand shape, where overall OECD performance was similar in the twosurveys, and change and relationships, where it increased by aroundten score points between 2000 and 2003.
Some countries, however, have seen substantial change, with averagescores increasing by at least half a proficiency level (32 score points)in Poland and in the partner country Liechtenstein on the changeand relationships scale, and in the partner countries Latvia and Brazilon both of the comparable mathematics scales. Table 2 shows thecountries where mean scores showed statistically significant change:
Change since 2000
Gender differences
OECD countries with no statistically significant gender difference in mathematics overall:Australia, Austria, Belgium, Japan, the Netherlands, Norway, Poland
In other countries there remains a male advantage, except Iceland where there is a female advantage.
OECD countries where males perform better than females in all four areas of mathematics: Canada, Denmark, Greece, Ireland, Italy, Korea, Luxembourg, New Zealand, Portugal, the Slovak Republic
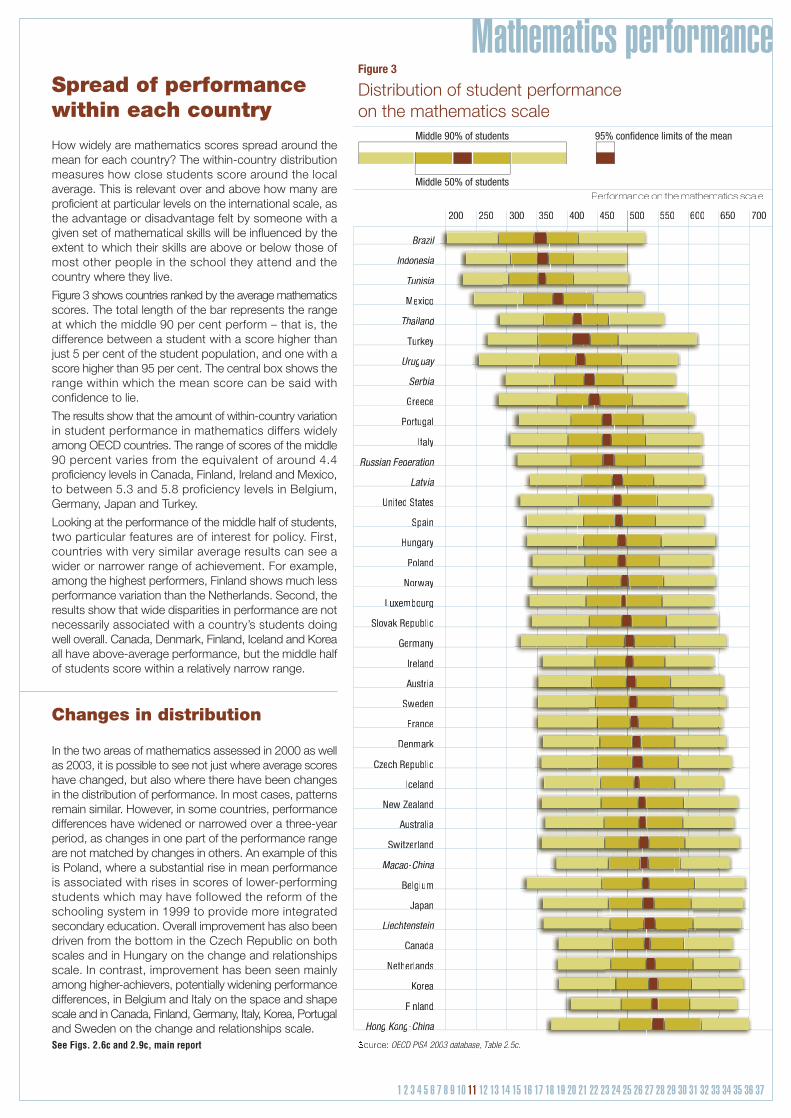
In the two areas of mathematics assessed in 2000 as wellas 2003, it is possible to see not just where average scoreshave changed, but also where there have been changesin the distribution of performance. In most cases, patternsremain similar. However, in some countries, performancedifferences have widened or narrowed over a three-yearperiod, as changes in one part of the performance rangeare not matched by changes in others. An example of thisis Poland, where a substantial rise in mean performanceis associated with rises in scores of lower-performingstudents which may have followed the reform of theschooling system in 1999 to provide more integratedsecondary education. Overall improvement has also beendriven from the bottom in the Czech Republic on bothscales and in Hungary on the change and relationshipsscale. In contrast, improvement has been seen mainlyamong higher-achievers, potentially widening performancedifferences, in Belgium and Italy on the space and shapescale and in Canada, Finland, Germany, Italy, Korea, Portugaland Sweden on the change and relationships scale.See Figs. 2.6c and 2.9c, main report
Mathematics performanceDistribution of student performance on the mathematics scale
ource: OEOO CEE DCC PIPP SII ASS 2A 022 000 3 d00 add tatt bab se,a TaTT blell 2.22 5c.55
200 250 300 350 400 450 500 550 600 650 700
Perfrr off rmance on the mataa hemataa ics scale
Middle 90% of students
Middle 50% of students
Belgium
Turkey
Germany
Japan
UUrrUUUU uurrrr gguu uuaauuuu yyaa
HHooHHH nnoooo ggnn KKooKKKK nnoooo ggnn -CChhCCCC iihhhh nniiii aannnn
BrBB arr ziaa lii
Switzerland
Lieii chee tett nee stnn ett iee nii
New Zealand
Italy
United States
Czech Republic
Australia
Greece
Sweden
Hungary
Slovak Republic
Austria
RuRR ssiuu aii naa FeFF dee eree arr titt oii noo
France
Luxembourg
Korea
Norway
Denmark
Netherlands
Poland
Iceland
Spain
Portugal
Latvivv aii
Canada
MaMM caaa oaa -ChCC ihh nii ann
Ireland
SeSS ree biaii
Mexico
Finland
TuTT nuu inn siii aii
ThTT ahh iaa lii all naa dn
InII dnn onoo en siee aii
BrBB arr ziaa lii
InII dn onoo en siee aii
TuTT nuu inn siii aii
Mexico
ThTT ahh iaa lii all naa dn
Turkey
SeS ree biaii
Greece
Portugal
Italy
RuR ssiu aii naa FeFF de eree arr titt oi noo
Latvivv aii
United States
Spain
Hungary
Poland
Norway
Luxembourg
Slovak Republic
Germany
Ireland
Austria
Sweden
France
Denmark
Czech Republic
Iceland
New Zealand
Switzerland
MaMM caa oa ChCC ihh nii ann
Belgium
Japan
Liei che tett nee stn ett iee nii
Canada
Netherlands
Korea
Finland
95% confidence limits of the mean
Figure 3
1 2 3 4 5 6 7 8 9 10 11 12 13 14 15 16 17 18 19 20 21 22 23 24 25 26 27 28 29 30 31 32 33 34 35 36 37
Changes in distribution
How widely are mathematics scores spread around themean for each country? The within-country distributionmeasures how close students score around the localaverage. This is relevant over and above how many areproficient at particular levels on the international scale, asthe advantage or disadvantage felt by someone with agiven set of mathematical skills will be influenced by theextent to which their skills are above or below those ofmost other people in the school they attend and thecountry where they live.
Figure 3 shows countries ranked by the average mathematicsscores. The total length of the bar represents the rangeat which the middle 90 per cent perform – that is, thedifference between a student with a score higher thanjust 5 per cent of the student population, and one with ascore higher than 95 per cent. The central box shows therange within which the mean score can be said withconfidence to lie.
The results show that the amount of within-country variationin student performance in mathematics differs widelyamong OECD countries. The range of scores of the middle90 percent varies from the equivalent of around 4.4proficiency levels in Canada, Finland, Ireland and Mexico,to between 5.3 and 5.8 proficiency levels in Belgium,Germany, Japan and Turkey.
Looking at the performance of the middle half of students,two particular features are of interest for policy. First,countries with very similar average results can see a wider or narrower range of achievement. For example, among the highest performers, Finland shows much less performance variation than the Netherlands. Second, theresults show that wide disparities in performance are notnecessarily associated with a country’s students doingwell overall. Canada, Denmark, Finland, Iceland and Koreaall have above-average performance, but the middle halfof students score within a relatively narrow range.
Spread of performance within each country

Student approaches to learning
Characteristics of effective learners
1 2 3 4 5 6 7 8 9 10 11 12 13 14 15 16 17 18 19 20 21 22 23 24 25 26 27 28 29 30 31 32 33 34 35 36 37
What are students like as learners at age 15? Those who are well motivated, confident intheir own abilities and who regularly adopt effective learning strategies tend to do better atschool. However, positive approaches not only help to explain student performance but arethemselves important outcomes of education. Students who have become effective learnersby the time they leave school, and particularly those who have learned to regulate their ownlearning, are often considered more likely to continue to learn throughout life.
PISA 2003 asked students about four aspects of their approaches to learning mathematics:
• Their motivation:whether they are interested in and enjoy mathematics, whether they believe it will help them fulfil their goals, whether they feel positive about their school and whether they feel that they belong there;
• Their self-related beliefs:how confident they are in their ability in mathematics (“self-concept”) and their capacity to overcome learning challenges that they find difficult (“self-efficacy”);
• Emotional factors:specifically, how anxious students feel when learning mathematics; and
• Learning strategies:the extent to which students “memorise” new information, “elaborate” it by thinking about how it relates to what they have already learned and “control” their own learning by checking that learning goals are being reached.
Analysing student responses, PISA shows three useful things about student approaches tolearning. The first is the extent to which students in different countries have certain self-identified characteristics that may help them to learn. Secondly, the PISA results show towhat degree particular characteristics are associated with performance. Third, they showhow motivation, self-related beliefs and emotional factors are linked to the adoption of effectivelearning strategies, and thus can help students become lifelong learners.
Profile of learner characteristics
See Table 3.1, Fig. 3.2, main report
Intrinsic interest in mathematics is far lower, across countries, than in reading (as reported in PISA 2000)
See Tables 3.2a-c, Fig. 3.3a, main report
On the other hand, the great majority of students believethat studying mathematics will help them in the future
See Table 3.4, Fig. 3.4, main report
All education systems aspire not just to transmit subject knowledge but also to prepare studentswell for life in general. The views of the majority of 15-year-olds suggest that educationsystems are quite successful in this respect
See Table 3.5a, Fig. 3.5, main report
Overall, students report a positive sense of belonging at school
Students’ approaches to learning mathematics show both negative and positivecharacteristics, with some countries facing some worrying concerns. In particular:
Among OECD countries, about half of the students report being interested in the things they learn in mathematicsbut only 38 per cent agree or strongly agree that they do mathematics because they enjoy it. While many studentsare still interested in the things they learn in mathematics, less than one-third report looking forward to theirmathematics lessons.
Among OECD countries 75 per cent of 15-year-olds (though only around half of students in Japan or Luxembourg)agree or strongly agree that making an effort in mathematics is worth it because it will help them in the work thatthey want to do later on. Seventy-eight per cent of 15-year-olds agree or strongly agree that learning mathematics isimportant because it will help them with the subjects that they want to study further on in school. And 70 per cent(though less than half in Japan and Korea) agree or strongly agree that they will learn many things in mathematicsthat will help them get a job. Such “instrumental motivation” may have some relationship to students’ futures, or atleast to how students envision them aged 15. PISA asked students what education level they expect to attain. Inmost countries, levels of instrumental motivation are higher among students aspiring at least to completeeducational programmes that provide access to tertiary education and the relationship tends to be stronger still if thestudents expect to complete a tertiary programme.
Typical students in the OECD agree that school helped give them confidence to make decisions and has taughtthem things which could be useful in a job. Nevertheless, a significant minority of students, 8 per cent on averageacross OECD countries consider school a waste of time. An average of 32 per cent, and above 40 per cent inGermany, Hungary, Luxembourg, Mexico and Turkey, report that school has done little to prepare them for life. Thissuggests that there is room for improvement in general attitudes towards schooling for 15-year-olds. In manycountries students’ attitudes towards school vary greatly from one school to another, suggesting that school policyand practice can address this problem.
On average across OECD countries, 81 per cent of the students agree that their school is a place where they feellike they belong. Eighty-nine per cent agree that their school is a place where they make friends easily. Nevertheless,there is considerable variation across countries. Students in Austria, Germany, Iceland, Luxembourg, Norway, Spain,Sweden and Switzerland report the highest sense of belonging at school. In contrast, the lowest sense of belongingat school is reported by students in Belgium, the Czech Republic, France, Japan, Korea, Poland, the Slovak Republic and Turkey. For example, while in Sweden 5 per cent of students report that school is a place where theyfeel awkward and out of place, more than three times this proportion report that feeling in Belgium and Japan.
Student approaches to learning
1 2 3 4 5 6 7 8 9 10 11 12 13 14 15 16 17 18 19 20 21 22 23 24 25 26 27 28 29 30 31 32 33 34 35 36 37

*Each characteristic is scored on an index. The strongest countries shown are those where the average student score is at least a quarter of a standard deviation above the OECD average, the weakest where it is at least a quarter of a standard deviation below.
The widest differences between countries on these three indicators are seen for anxiety.
See Table 3.6, Fig. 3.6, main report
Students’ concept of their mathematics abilities is both an important outcome of education and a powerful predictor of student success. A large proportion of 15–year-olds are not confident of their own abilities in mathematics
See Table 3.8, Fig. 3.8, main report
Anxiety in relation to mathematics is widespread
“Self-concept” in mathematics:
Strongest in: the United States
Weakest in: Japan, Korea, Hong Kong-China
See Table 3.6, main report
“Self-efficacy” in mathematics:
Strongest in:Canada, Hungary, the Slovak Republic, Switzerland, the United States, Liechtenstein
Weakest in: Greece, Japan, Korea, Brazil, Indonesia, Thailand, Tunisia
See Table 3.7, main report
Anxiety in mathematics:
Lowest in: Austria, Denmark, Finland, Germany,the Netherlands, Sweden, Switzerland,Liechtenstein
Highest in: France, Italy, Japan, Korea, Mexico, Spain,Turkey, Brazil, Indonesia, Thailand, Serbia,Tunisia, Uruguay
See Table 3.8, main report
Some caution is needed when comparing these self-reported characteristics acrosscountries. Analysis of responses shows that comparisons across cultures aresometimes difficult to make on such measures. Nevertheless, some of the widerreported differences show interesting contrasts about how students in different countries see themselves as learners. On the three characteristics that can most easily be compared across countries and that are clearly associated withperformance (see below), students have the strongest and weakest* approaches tolearning in the following countries:
On average across OECD countries, 67 per cent of students disagree that in their mathematics class, theyunderstand even the most difficult work. Response patterns vary by country. For example, for the aforementioneditem, percentages disagreeing range from around 84 per cent or more in Japan and Korea to 57 per cent or less inCanada, Mexico, Sweden and the United States. Similarly, on average across OECD countries, roughly half of thestudents disagree that they learn mathematics quickly. But while in Japan and Korea more than 62 per cent of students disagree, the proportion is only around 40 per cent of students in Denmark and Sweden. For most of thesequestions, comparatively large gender differences are apparent. For example, while on average across OECDcountries, 36 per cent of males agree or strongly agree with the statement that they are “simply not good atmathematics”, the average for females is 47 per cent.
On average among OECD countries, half of 15-year-old males and more than 60 per cent of females report thatthey often worry that they will find mathematics classes difficult and that they will get poor marks. Almost 30 per centof students across the OECD agree that they get very nervous doing mathematics problems, get very tense whenthey have to do mathematics homework or feel helpless when doing a mathematics problem. There is considerablecross-country variation in the degree to which students feel anxiety when dealing with mathematics, with students inFrance, Italy, Japan, Korea, Mexico, Spain, and Turkey reporting feeling most concerned and students in Denmark,Finland, the Netherlands and Sweden least concerned. For example, more than half of the students in France andJapan report that they get very tense when they have to do mathematics homework, but only 7 per cent of studentsin Finland and the Netherlands report this. It is noteworthy that Finland and the Netherlands are also two of the topperforming countries. More than two-thirds of the students in Greece, Italy, Japan, Korea, Mexico and Portugalreport that they often worry that it will be difficult for them in mathematics classes, whereas only about one-third of students in Denmark or Sweden fall into this category.
Student approaches to learning
1 2 3 4 5 6 7 8 9 10 11 12 13 14 15 16 17 18 19 20 21 22 23 24 25 26 27 28 29 30 31 32 33 34 35 36 37
Strength of association with mathematics performance
See Table 3.1, main report
Interest in and enjoyment of mathematics is closely associatedwith performance in all OECD countries
See Table 3.7, main report
Students who believe in their abilities and efficacy,and who are not anxious about mathematics, are particularly likely to do well in it
Some student characteristics that might well affect mathematics performanceare not clearly associated with it in PISA
The association of each of these characteristics with performance is complicated by the fact that different positive approaches to learning tend to go together. For example, a student who enjoys mathematics is also likely to be less anxious and more confident about it – and that student’s greater chance of performing well may be linked more to low anxiety and high self-related beliefs than directly to interest and enjoyment.
Figure 4 gives a profile of one such factor, anxiety, in different countries, by showing first the level of anxiety expressed by students in different countries and second the strength of the relationship with performance. In Japan, for example, a quarter of students express a particularly high level of anxiety about mathematics, yet still manage to score above average in the assessment. On the other hand, students in Denmark show much lower levels of anxiety, yet the most anxious quarter among them score 124 points, or two proficiency levels lower in mathematics than the quarter with least anxiety.
This association is particularly strong in some countries, notably in Finland, Japan and Korea, three high-performingcountries where the average interest expressed in mathematics is low, but those with an interest higher than the norm for their country are likely to perform better.
Here, the link is considerably stronger than for interest and enjoyment. While it is likely that success in mathematicsfeeds confidence as well as the other way around, the evidence suggests that this is a mutually reinforcing process.Moreover, the fact that gender differences in mathematics performance are relatively minor, but females haveconsiderably less confidence in mathematics than males underlines the fact that sometimes low self-related beliefsand anxiety do not simply mirror weak performance.
For example, students who make a conscious effort to control their own learning more do not on average performsignificantly better. This may be because some students with lower performance use such strategies to try toremedy deficiencies in performance, thus affecting the profile of students using control strategies.
To what extent do students with positive attitudes towards mathematics and who adopt effective learning strategies perform better in mathematics? While PISA cannotdemonstrate cause and effect, the results show a number of important associations:
Student approaches to learning
1 2 3 4 5 6 7 8 9 10 11 12 13 14 15 16 17 18 19 20 21 22 23 24 25 26 27 28 29 30 31 32 33 34 35 36 37

350 450 550400 500 600
United KingdomUnited Kingdom1
UruguayUruguay
TunisiaTunisia
ThailandThailand
SerbiaSerbia
Russian FederationRussian Federation
Macao-ChinaMacao China
LiechtensteinLiechtenstein
LatviaLatvia
IndonesiaIndonesia
Hong Kong-ChinaHong Kong China
BrazilBrazil
United StatesUnited States
TurkeyTurkey
SwitzerlandSwitzerland
SwedenSweden
SpainSpain
Slovak RepublicSlovak Republic
PortugalPortugal
PolandPoland
NorwayNorway
New ZealandNew Zealand
NetherlandsNetherlands
MexicoMexico
LuxembourgLuxembourg
KoreaKorea
JapanJapan
ItalyItaly
IrelandIreland
IcelandIceland
HungaryHungary
GreeceGreece
GermanyGermany
FranceFrance
FinlandFinland
DenmarkDenmark
Czech RepublicCzech Republic
CanadaCanada
BelgiumBelgium
AustriaAustria
AustraliaAustralia
-1.5 -1.0 -0.5 0.0 0.5 1.0 1.5 2.0
1. Response rate too low to ensure comparability.Source: OECD PISA 2003 database, Table 2.5c.
Anxiety in mathematics and its relationship to mathematics performance
How anxious students are about mathematics
Relationship of anxiety with performance
Index of anxiety in mathematics
Least anxious quarter of students
All studentsMost anxious quarter of students
Most anxious quarter of students
Average mathematics score of:Average anxiety level of:
Least anxious quarter of students
OECD averageOECD average
Figure 4
Student approaches to learning
1 2 3 4 5 6 7 8 9 10 11 12 13 14 15 16 17 18 19 20 21 22 23 24 25 26 27 28 29 30 31 32 33 34 35 36 37
Student approaches to learning
1 2 3 4 5 6 7 8 9 10 11 12 13 14 15 16 17 18 19 20 21 22 23 24 25 26 27 28 29 30 31 32 33 34 35 36 37
These results suggest that education systems have to designways to work with students to address aspects of attitudes andlearning behaviours and perhaps even make these goals just ascentral to their mission as cognitive instruction. This may haveimplications for teacher training, as well as continuous professionaldevelopment.
In designing solutions, policy makers will need to bear in mindthat weaknesses in approaches to learning mathematics do not
only affect strongly underperforming groups of students or schools.The PISA evidence suggests that even in schools where studentstend to perform relatively well, some may be held back by negativeattitudes towards mathematics, as are females to a greater extentthan might be expected from their average performance. Theimplication is that measures to improve attitudes could not beeffectively targeted on the basis of low mathematics performancealone.
Approaches to learning: overall policy implications
PISA 2003 shows that, while females generally do not performmuch below males in mathematics, they consistently report muchlower interest in and enjoyment of mathematics, lower self-relatedbeliefs and much higher levels of helplessness and stress inmathematics classes. This finding is highly relevant for policymakers, as it reveals inequalities between the genders in theeffectiveness with which schools and societies promote motivationand interest and – to an even greater extent – help studentsovercome anxiety towards different subject areas. These patterns
may well be predictive of differences between males and femalesappearing later in their educational and occupational careers,raising further questions about how the gender gap can be reduced.Related data show, for example, that, despite improvements infemale mathematics performance, males remain far more likelyto pursue studies in mathematics-related disciplines at tertiarylevel.See Table 3.16, Fig. 3.14, main report
Gender differences
Are negative attitudes to learning mathematics concentrated inunderperforming schools? This is difficult to examine throughPISA, as students often report their attitudes and learning strategieswithin the frame of reference provided by their own classroomand school. Thus, although PISA finds that the profile of students’self-reported approaches to learning varies much more withinschools than across schools, this may underestimate the truecross-school variation in students’ characteristics as learners.Nevertheless the PISA findings do highlight considerable variationof such characteristics among students within each school. This
underlines the importance for schools and teachers of being ableto engage constructively with heterogeneity not only in studentabilities but also in their characteristics as learners and theirapproaches to learning. It will not be sufficient to operate on theprinciple that “a rising tide raises all ships”, since even in well-performing schools there are students who lack confidence andmotivation and who are not inclined to set and monitor their ownlearning goals.See Table 3.15, main report
School differences
Although PISA 2003 does not show strong links between students’self-reports on the learning strategies they use and performance,the results do suggest that students are most likely to initiate highquality learning, using various strategies, if they are well motivated,not anxious about their learning and believe in their own capacities.
There are good grounds for this: high quality learning is time andeffort-intensive. It involves control of the learning process as wellas the explicit checking of relations between previously acquiredknowledge and new information, the formulation of hypotheses
about possible connections and the testing of these hypothesesagainst the background of the new material. Learners are onlywilling to invest such effort if they have a strong interest in a subjector if there is a considerable benefit, in terms of high performance,with learners motivated by the external reward of performing well.Thus, students need to be willing to learn how to learn. From theperspective of teaching this implies that effective ways of learning– including goal setting, strategy selection and the control andevaluation of the learning process – can and should be fosteredby the educational setting and by teachers.
Student attitudes and learning strategies
Role of schools and social backgroundMathematics performance, school differences and student background
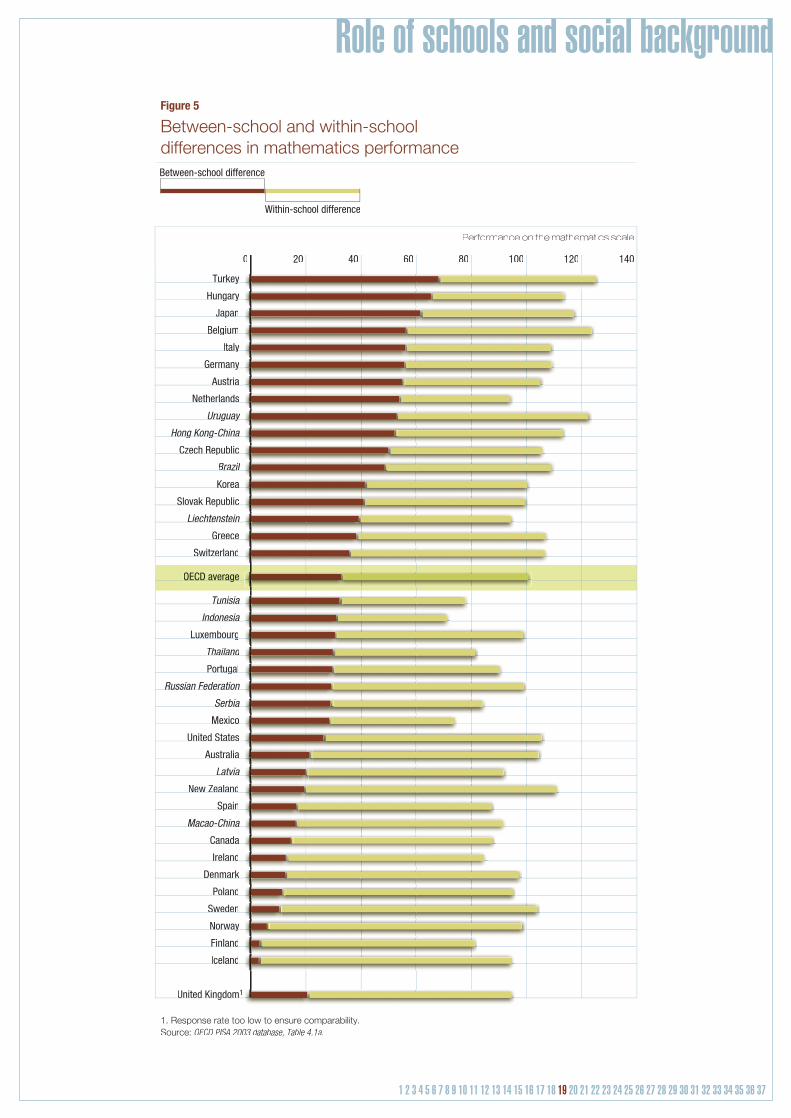
Secondary schools may vary in performance for a variety ofreasons, including policies for dividing students into differentability groups, geographical differences in student profiles anddifferences in school quality. As a result of a combination of suchfactors, countries differ greatly in the extent to which variationoccurs across schools. Figure 5 looks at the total between-school variation, as part of the overall variation in studentperformance that is found in each country. The rest of this variationis contained within schools. The graph shows that between-school variation is many times as great in some countries as inothers, and also comprises very different proportions of theoverall student variation seen within a country.
In the 11 countries at the top of the graph, variation betweenschools is much greater than the OECD area on average. InHungary and Turkey, variation in performance between schoolsis particularly large and is more than twice the OECD averagebetween-school variation. In Austria, Belgium, the Czech Republic,Germany, Italy, Japan and the Netherlands, as well as in thepartner countries Hong Kong-China and Uruguay, the proportionof variation that lies between schools and school types is still
over one-and-a-half times that of the OECD average level. Incontrast, the proportion of performance variation that lies betweenschools and school types is around one-tenth of the OECDaverage level in Finland and Iceland, and half or less in Canada,Denmark, Ireland, Norway, Poland, Sweden and in the partnercountry Macao-China. In these countries performance is largelyunrelated to the schools in which students are enrolled. It isnoteworthy that Canada, Denmark, Finland, Iceland, Ireland,Sweden and the partner country Macao-China also perform wellor at least above the OECD average level. Parents in thesecountries can be less concerned about school choice in orderto enhance their children’s performance, and can be confidentof high and consistent performance standards across schoolsin the entire education system.
In one country, Poland, there has been a marked reduction inbetween-school differences since PISA 2000, possibly linked tothe development of a more integrated school system. Here, theresult appears to have been a “levelling up”, with the improvementsamong lower-performing students noted on page 11.
Differences in performance across schools
Which schools students attend can influence educational outcomes, as can the characteristics of theirhome background.
These two factors can interact, since school differences may result not only from school factors such asteaching methods and resource inputs, but also from the combined socio-economic background of thestudents who attend the school.
This section looks at the amount of performance differences attributable to between-school variation, atthe influence of home background and at the interaction between the two.
1 2 3 4 5 6 7 8 9 10 11 12 13 14 15 16 17 18 19 20 21 22 23 24 25 26 27 28 29 30 31 32 33 34 35 36 37
Source: OEOO CEE DCC PIPP SII ASS 2003 dA atabase, Table 4.1a.1. Response rate too low to ensure comparability.
Perfrr off rmance n th m tthe ataa ics scale
Between-school difference
Within-school difference
0 20 40 60 80 100 120 140
IcelandIceland
FinlandFinland
NorwayNorway
SwedenSweden
PolandPoland
DenmarkDenmark
IrelandIreland
CanadaCanada
Macao-ChinaMacao China
SpainSpa
New ZealandNew Zealand
LatviaLatvia
United KingdomUnited Kingdom1
AustraliaAustralia
United StatesUnited States
MexicoMexico
SerbiaSerbia
Russian FederationRussian Federation
PortugalPortugal
ThailandThailand
LuxembourgLuxembourg
IndonesiaIndonesia
TunisiaTunisia
SwitzerlandSwitzerland
GreeceGreece
LiechtensteinLiechtenstein
Slovak RepublicSlovak Republic
KoreaKorea
Brazila
Czech RepublicCzech Republic
Hong Kong-ChinaHong Kong China
UruguayUruguay
NetherlandsNetherlands
AustriaAustria
GermanyGermany
ItalyItaly
BelgiumBelgium
JapanJapan
HungaryHungary
TurkeyTurkey
OECD averageOECD average
Between-school and within-school differences in mathematics performance
Figure 5
Role of schools and social background
1 2 3 4 5 6 7 8 9 10 11 12 13 14 15 16 17 18 19 20 21 22 23 24 25 26 27 28 29 30 31 32 33 34 35 36 37

Several features of students’ socio-economic backgrounds are predictive of how well they perform at school.PISA classifies students by:
BOX A
Aspects of student background related to student performance
Countries with the greatestand smallest performance gapsbetween the top and bottomquarter of studentsby parents’ occupational status:
Greatest :
Belgium, Germany, Liechtenstein
Smallest (difference of below 60 points):Iceland, Korea, Hong Kong-China,Latvia, Macao-China,the Russian Federation
See Table 4.2a, main report
Countries with the greatest
between students whosemothers’upper secondary education andthose with lower qualifications:
Greatest(difference of at least 60 points):Germany, the Slovak Republic, Turkey,Brazil
Smallest(difference of below 20 points):Australia, Finland, Iceland,the Netherlands, Spain, Macao-China
See Table 4.2b, main report
Countries with the greatestand smallest performance gapsbetween the top and bottomquarter of students by culturalpossessions in the home:
Greatest(difference of at least 75 points):Belgium, Denmark, France, Hungary,Sweden
Smallest(difference of below 40 points):Iceland, Switzerland, Indonesia,Macao-China, Thailand
See Table 4.2d, main report
On average, the quarter of students whose parents have the highest-status jobs score 93 points higher than the quarter with the lowest-status jobs.
The occupational statusof their parents
In particular, those with mothers who completed upper secondary school score on average 50 points higher than those whose mothers have lower qualifications, and having a mother with tertiary educationadds a further 24 points
The highest educational levelof their parents
PISA considered the extent to which students have home possessions related to “classical” culture, such as literature, art and poetry. This has a substantial relationship to performance, with the quarterof students with most culturalpossessions scoring on average66 points higher than the quarter with least. Even though partof this is linked to the higheraverage occupational andeducational status of the familiesof culturally advantaged students,an effect remains after controllingfor these factors, which is nearlyas high as the separate effectof occupational status.
Families’ cultural possessions
Students whose parents are immigrants show weaker performance than native students in some but not all countries. The greatest gap, of 93 points in mathematics scores, is in Germany. Students themselves born outside the country tend to lag even further behind, in Belgium by 109 points. While circumstances of different immigrant groups vary greatly, and some are disadvantaged by linguistic or socio-economic disadvantage as well as
two particular findings areworrying for some countries.One is the relatively poorperformance even amongstudents who have grown upin the country and gone to school there. The otheris that after controlling for thesocio-economic backgroundand language spoken at home,a substantial performance gap between immigrant students and others remains in many countries – it is above half a proficiency level in Belgium, Germany, the Netherlands, Sweden and Switzerland.
See Table 4.2h, main report
Students’ immigrant status and the languagethey speak at home
Role of schools and social background
1 2 3 4 5 6 7 8 9 10 11 12 13 14 15 16 17 18 19 20 21 22 23 24 25 26 27 28 29 30 31 32 33 34 35 36 37
It is well known that students from less advantaged homebackgrounds tend to do less well on average at school than theirmore advantaged peers. However, the extent to which differentcountries manage to contain this disadvantage is an indicator ofhow far school systems manage to spread equal opportunitiesto students regardless of background.
PISA 2003 looked at the relationship of a number of differentaspects of student background with mathematics performance(see Box A). It also constructed an overall index of student socio-economic background, taking account of economic, social andcultural status.
Different countries show different relationships between socio-economic background and performance in mathematics. Thiscan be measured in two main ways.See Table 4.3b, main report
First, it is possible to look at the strength of the relationship, interms of how much variation in student performance can be
accounted for by students’ differing socio-economic backgrounds.In other words, if one were to predict each student’s score on thebasis of their economic, social and cultural characteristics, howmuch of existing variation could one account for? Overall in OECDcountries, one-fifth of all student variation can be accounted forin this way, but this ranges widely:
Differences in performance by socio-economic background
Countries with the highest and lowest proportion of mathematics performance variation associated with socio-economic background:
Highest (22-27 per cent):Belgium, Germany, Hungary, the Slovak Republic, Turkey
Lowest (2-7 per cent):Iceland, Hong Kong-China, Indonesia, Macao-China
See Table 4.4, main report
Perce tage o ari nce in p rfrr or a ce i ma he ataa i e lai ed y th ind xx o e no ic, cia an c tus(r-squared x 100)
Note: OECD mean used in this figure is the arithmetic average of all OECD countries.
Source:OECD PISA 2003 database, Table 4.3a.
0102030
300
350
400
450
500
550
600
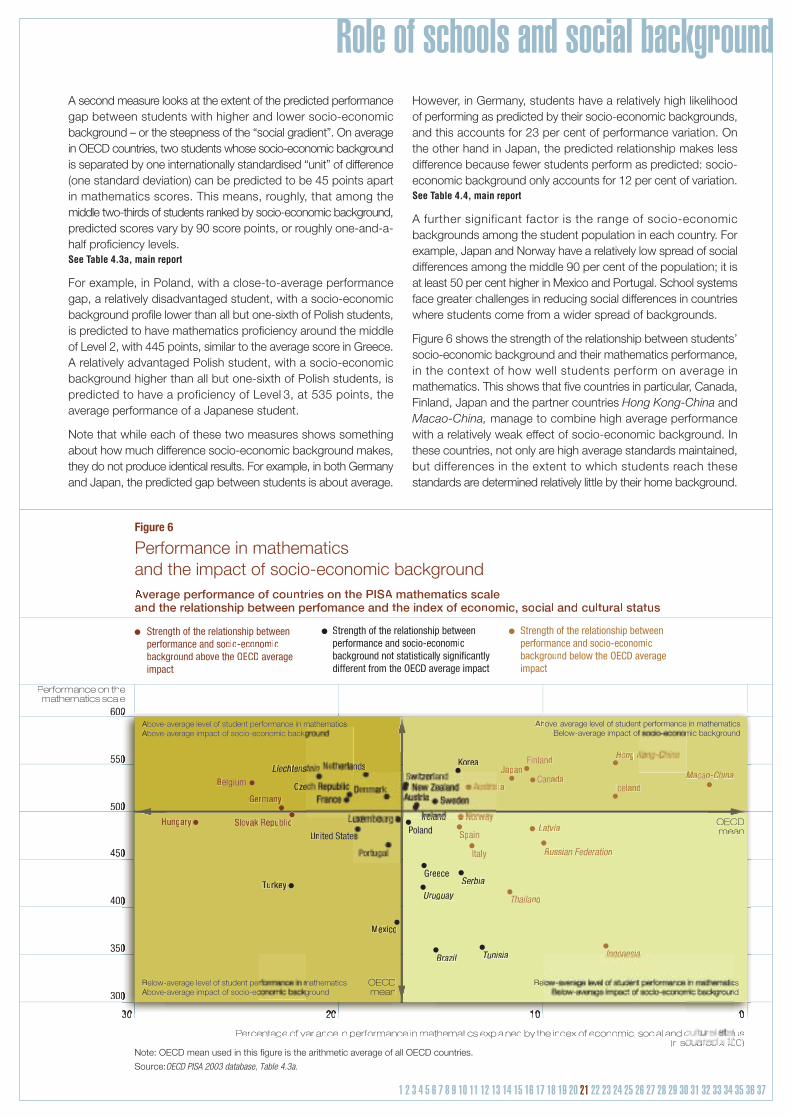
Performance in mathematics and the impact of socio-economic background
ra f un rie o th PI Aan t n soci l a d lt ral status
Stci ic
a r un averageimpact
Sic
otdi
th fcio- con mic
ba rou d ab ve the OECD average
Per hem le
Figure 6
UrUU gguauu ya
T nninn siii aii
ndnn
SeSS biaii
RuRR ssiuu n
MaMM o-C inii annLi chc tett ss
La vivv aii
InI dn o esie ai
H ngn K
BrBB arr ziaa lii
Un
Turkey
SpP
s
Mexico
KoreaJapan
I land
Greece
d
Czeada
lia
BeBA
A - csA
Ab -
Sl vak epu licHunga y
Ger any
B
OECDmean
OECDmean
Role of schools and social background
1 2 3 4 5 6 7 8 9 10 11 12 13 14 15 16 17 18 19 20 21 22 23 24 25 26 27 28 29 30 31 32 33 34 35 36 37
A second measure looks at the extent of the predicted performancegap between students with higher and lower socio-economicbackground – or the steepness of the “social gradient”. On averagein OECD countries, two students whose socio-economic backgroundis separated by one internationally standardised “unit” of difference(one standard deviation) can be predicted to be 45 points apartin mathematics scores. This means, roughly, that among themiddle two-thirds of students ranked by socio-economic background,predicted scores vary by 90 score points, or roughly one-and-a-half proficiency levels. See Table 4.3a, main report
For example, in Poland, with a close-to-average performancegap, a relatively disadvantaged student, with a socio-economicbackground profile lower than all but one-sixth of Polish students,is predicted to have mathematics proficiency around the middleof Level 2, with 445 points, similar to the average score in Greece.A relatively advantaged Polish student, with a socio-economicbackground higher than all but one-sixth of Polish students, ispredicted to have a proficiency of Level 3, at 535 points, theaverage performance of a Japanese student.
Note that while each of these two measures shows somethingabout how much difference socio-economic background makes,they do not produce identical results. For example, in both Germanyand Japan, the predicted gap between students is about average.
However, in Germany, students have a relatively high likelihoodof performing as predicted by their socio-economic backgrounds,and this accounts for 23 per cent of performance variation. Onthe other hand in Japan, the predicted relationship makes lessdifference because fewer students perform as predicted: socio-economic background only accounts for 12 per cent of variation.See Table 4.4, main report
A further significant factor is the range of socio-economicbackgrounds among the student population in each country. Forexample, Japan and Norway have a relatively low spread of socialdifferences among the middle 90 per cent of the population; it isat least 50 per cent higher in Mexico and Portugal. School systemsface greater challenges in reducing social differences in countrieswhere students come from a wider spread of backgrounds.
Figure 6 shows the strength of the relationship between students’socio-economic background and their mathematics performance,in the context of how well students perform on average inmathematics. This shows that five countries in particular, Canada,Finland, Japan and the partner countries Hong Kong-China andMacao-China, manage to combine high average performancewith a relatively weak effect of socio-economic background. Inthese countries, not only are high average standards maintained,but differences in the extent to which students reach thesestandards are determined relatively little by their home background.

Role of schools and social background
1 2 3 4 5 6 7 8 9 10 11 12 13 14 15 16 17 18 19 20 21 22 23 24 25 26 27 28 29 30 31 32 33 34 35 36 37
• Target assistance to low-performing students, regardless of socio-economicbackground, for example through early intervention or remedial assistance aimedunderperforming students. Individualising learning in order to provide students withappropriate forms of instruction is one approach.
• Target assistance to students from less advantaged backgrounds, for examplethrough preschool help for disadvantaged students or extra resources for schools in deprived areas.
• Aim to raise the performance of all students, for example by improvinginstructional techniques or curricula. A wide range of approaches can be adoptedhere, including improving learning environments, involving parents and makingschools more accountable for outcomes.
• Aim to create more inclusive school structures that reduce segregation amongstudents, for example through changes in catchment areas or magnet programmes.
PISA shows that experiences at school can too often reinforcerather than mitigate the effects of home background. This maybe because privileged families are better able to take advantageof the education system, or because schools find it easier toeducate them, or for other reasons. Yet some countries manageto combine greater equity with high performance, and all systemsface a challenge to move in this direction.
The findings from PISA can help each country to design strategiesto increase quality and equity, by describing the ways in whichperformance and socio-economic advantage are distributedacross and within schools. Different patterns in different countries suggest different solutions. Among the approaches that policy might take are to:
To what extent are the differences between the performance ofstudents at different schools associated with differences in socio-economic background? The answer again varies greatlyacross countries. In some, each school tends to educate a socially relatively homogeneous group of students. In thesecountries, the average socio-economic background of the studentsat the school is usually a much strong predictor of studentperformance than a student’s individual socio-economic background.
The combined effect of individual socio-economic backgroundand the social intake of schools accounts for 74-80 per cent ofbetween-school differences in three of the countries where these differences are among the greatest: Belgium, Germany andHungary. In these countries, the total amount of variation associatedwith differences in the socio-economic background of studentsat different schools exceeds 40 per cent of average performancevariation among students in OECD countries.See Tables 4.1a and 4.5, main report
In contrast, in Canada, Finland, Iceland, Mexico, Norway andSweden, differences in the social composition of schools do littleto explain between-school differences. In Japan, the direct effectof individuals’ backgrounds appears to have little effect, but takingaccount of the effect of the school’s social intake raises the amountof between-school variation attributable to socio-economicbackground to one of the highest levels in the OECD.
A measure of the social intake effect can be shown by consideringthe difference in predicted performance of two students who areidentical in characteristics except that they attend different schools,one more and one less advantaged in social intake. These schools’ average socio-economic backgrounds differ by aboutas much as the middle half of schools in OECD countries – thus, not exceptionally privileged or disadvantaged institutions. The magnitude of the different performance of the two students isstriking in some countries:See Table 4.5, main report
These differences among schools according to social intake mayarise from a range of factors, including peer interactions, disciplinaryclimate and a faster-paced curriculum. Any attempt to developeducation policies to reduce or to mitigate the effects of segregationwould need to take into account its underlying causes, whichmay be different in different contexts.
The interaction between school and socio-economic background differences
Mathematics scores of students attending a more and a less advantaged school differ particularly widely in:
Austria, Belgium, the Czech Republic, Germany, Hungary, Japan, Korea, the Netherlands, the Slovak Republic, Turkey, Hong Kong-China and Liechtenstein.
School and social differences: policy implications
Role of schools and social background
1 2 3 4 5 6 7 8 9 10 11 12 13 14 15 16 17 18 19 20 21 22 23 24 25 26 27 28 29 30 31 32 33 34 35 36 37
Finally, the analyses reveal that countries with greater socio-economic inclusion tend to have higher overall performance. Insome countries, socio-economic segregation can be deeplyentrenched due to economic divides between urban and ruralareas, as well as residential segregation in cities. However,segregation can also stem from educational policies that streamchildren into certain kinds of programmes early in their schoolcareers. To increase quality and equity in such countries wouldrequire specific attention to between-school differences. Reducingthe socio-economic segregation of schools would be one strategy,while allocating resources differentially to schools and programmesand seeking to provide students with differentiated and appropriateeducational opportunities are others. In countries that separatestudents more into different types of schools or programmes, it
is important to understand how the allocation of school resourcesis related to the socio-economic intake of its schools. In somecountries, there is relatively little socio-economic segregationbetween schools i.e., schools tend to be similar in their averagesocio-economic intake. In these countries, overall performanceand social differences are mainly affected by the relationshipbetween student performance and the socio-economic backgroundof individual students within each school. To increase quality andequality in these countries will require actions that predominantlyfocus within schools. Reducing the segregation within schools ofstudents of differing economic, social and cultural status wouldbe one strategy, and might require a review of classroom streamingpractices. More direct assistance for poorly performing studentsmay also be needed.
Another key issue is whether to target low-performing schools orstudents. The proportion of performance variation between schools,shown in Figure 5, can provide a useful indicator in judging theappropriateness of particular policy approaches. If there is littleperformance variation between schools, as in Canada, Denmark,Finland, Iceland, Ireland, Norway, Poland or Sweden, then within-school policies aimed at improving the performance of low-
performing students are likely to be more effective. By contrast,in countries such as Austria, Belgium, the Czech Republic, Germany,Hungary, Italy, Japan, the Netherlands and Turkey, large performancedifferences between schools would suggest that policies shouldtarget low-performing schools, at least within each type of schoolwhere the education system is stratified.
One underlying issue confronting school administrators is whetherto target low performance or low socio-economic background.Useful indicators here are the slope of the socio-economic gradient(the predicted performance difference between students of differentbackgrounds) and the strength of the gradient (the amount ofvariation accounted for by this link). Countries with relatively flatgradients are likely to find performance-based policies moreeffective in raising performance among students. Conversely,countries with steep socio-economic gradients might find somecombination of performance-targeted and socio-economically-targeted policies more effective. For example, in Canada, Finland,Iceland, Italy, Luxembourg, Portugal and Spain, with flatter thanaverage gradients, a relatively smaller proportion of low-performingstudents come from disadvantaged backgrounds. Here, policiesthat specifically target students from disadvantaged backgrounds
would not address the needs of many low performers. Moreover,socio-economically targeted policies in these countries would beproviding services to a sizeable proportion of students who alreadyhave high performance levels.
By contrast, in countries where the impact of socio-economicbackground on student performance is strong, socio-economicallytargeted policies would direct more of the resources towardsstudents who are likely to require these services. However, thecase for socio-economically-targeted policies can still be over-stated for some countries with steep socio-economic gradients.In some such countries, the amount of performance variationaccounted for by socio-economic background is only moderate,implying that a sizeable group of poorly performing students havehigher socio-economic backgrounds.
Targeting performance or background
Targeting schools or students
Systems where school and socio-economic differences go together
PISA asked students and principals about their perceptions ofthe learning environment and school climate. There is considerablevariation across countries in some crucial factors affecting theenvironment in which students learn, most notably the extent towhich they feel supported by their teachers and the disciplinaryclimate.
For example, while most students overall feel that their mathematicsteacher gives extra help when students need it, this ranges fromless than 60 per cent in Austria, Germany, Italy, Korea, the SlovakRepublic, Spain, Macao-China, Serbia and Uruguay to 75 percent or more in Australia, Canada, the Czech Republic, Finland,New Zealand, the United States and Thailand. See Fig. 5.1, main report
In terms of disciplinary climate, in most OECD countries, principalsidentify student absenteeism as the most frequent student-related obstacle to learning: on average, 48 per cent of 15-year-olds are enrolled in schools whose principals identify this as hindering learning by 15-year-olds either to some extent or a lot.Disruptive behaviour is the next most frequently indicated obstacle to learning (40 per cent). This is followed by studentsskipping classes (30 per cent). From the students’ perspective,having noise and disorder is the most frequently reported disciplinaryproblem in their mathematics lessons, with 36 per cent of studentsreporting that this happens in every lesson or at least in mostlessons. On average across OECD countries, more than a quarterof students report that in every lesson or at least in most lessons,students do not start working for a long time after lessons beginand a third of students report that the teacher must wait a longtime for students to quieten down or that students don’t listen towhat the teacher says. See Figs. 5.2 and 5.3, main report
School characteristics
How schools make a difference
The school environment
What can schools and school policies do to raise performance and promote equity? As shown above,variations in the performance of both students and schools are strongly associated with homebackground, which is largely beyond the control of policy makers. Yet research shows clearly thatthere are many things that schools can do to enhance learning effectiveness. PISA is able to probe further the influence on student performance of the school environment, schoolpolicies and practices, the resources invested in schools and the organisational structure of schooling.In each case, the analysis looks at: • First, the incidence in different countries of various characteristics that may be associated
with performance.• Second, the actual strength of this association for individual factors within each country. • Third, the combined effect of these factors on performance in the context of student background
effects. The analysis finds that the association of various school factors with enhancedperformance is in large part related to the socio-economic advantages of schools, implying thatthose school factors often work in combination with the influence of student background.
1 2 3 4 5 6 7 8 9 10 11 12 13 14 15 16 17 18 19 20 21 22 23 24 25 26 27 28 29 30 31 32 33 34 35 36 37
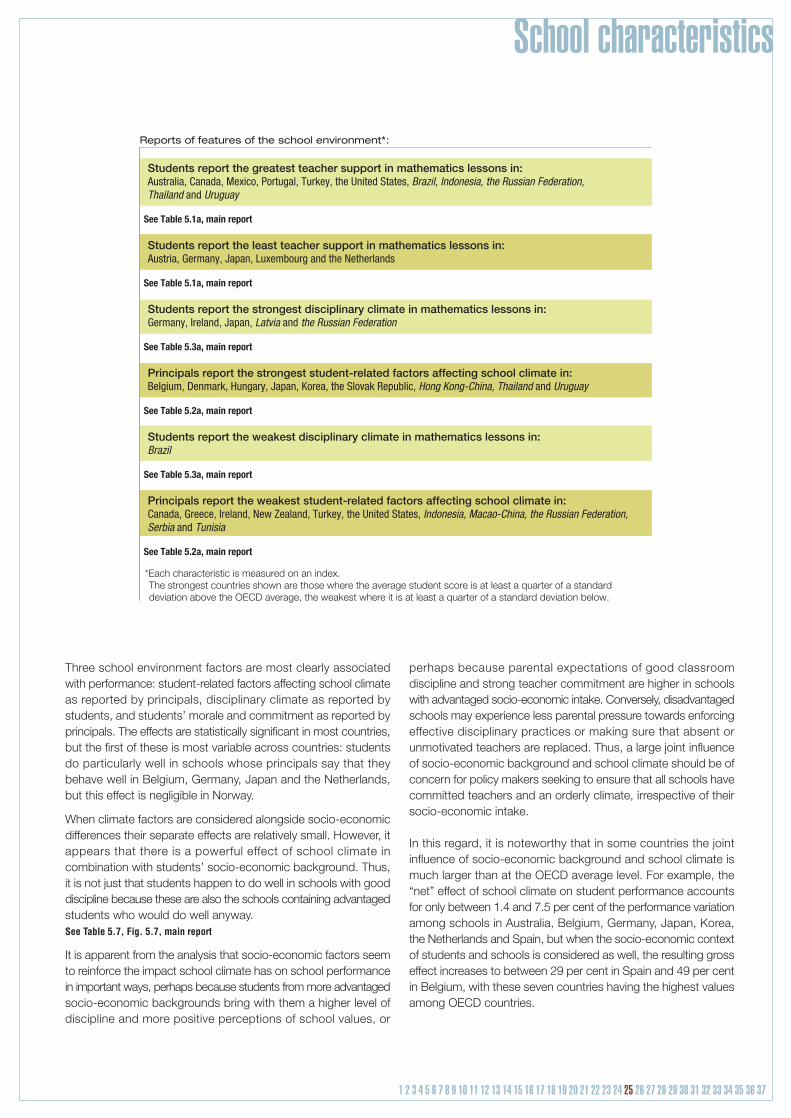
Reports of features of the school environment*:
Students report the greatest teacher support in mathematics lessons in:Australia, Canada, Mexico, Portugal, Turkey, the United States, Brazil, Indonesia, the Russian Federation,Thailand and Uruguay
See Table 5.1a, main report
Students report the least teacher support in mathematics lessons in: Austria, Germany, Japan, Luxembourg and the Netherlands
See Table 5.1a, main report
Students report the strongest disciplinary climate in mathematics lessons in:Germany, Ireland, Japan, Latvia and the Russian Federation
See Table 5.3a, main report
Principals report the strongest student-related factors affecting school climate in: Belgium, Denmark, Hungary, Japan, Korea, the Slovak Republic, Hong Kong-China, Thailand and Uruguay
See Table 5.2a, main report
Students report the weakest disciplinary climate in mathematics lessons in: Brazil
See Table 5.3a, main report
Principals report the weakest student-related factors affecting school climate in:Canada, Greece, Ireland, New Zealand, Turkey, the United States, Indonesia, Macao-China, the Russian Federation, Serbia and Tunisia
See Table 5.2a, main report
*Each characteristic is measured on an index. The strongest countries shown are those where the average student score is at least a quarter of a standard deviation above the OECD average, the weakest where it is at least a quarter of a standard deviation below.
School characteristics
Three school environment factors are most clearly associatedwith performance: student-related factors affecting school climateas reported by principals, disciplinary climate as reported bystudents, and students’ morale and commitment as reported byprincipals. The effects are statistically significant in most countries,but the first of these is most variable across countries: studentsdo particularly well in schools whose principals say that theybehave well in Belgium, Germany, Japan and the Netherlands,but this effect is negligible in Norway.
When climate factors are considered alongside socio-economicdifferences their separate effects are relatively small. However, itappears that there is a powerful effect of school climate incombination with students’ socio-economic background. Thus,it is not just that students happen to do well in schools with gooddiscipline because these are also the schools containing advantagedstudents who would do well anyway. See Table 5.7, Fig. 5.7, main report
It is apparent from the analysis that socio-economic factors seemto reinforce the impact school climate has on school performancein important ways, perhaps because students from more advantagedsocio-economic backgrounds bring with them a higher level ofdiscipline and more positive perceptions of school values, or
perhaps because parental expectations of good classroomdiscipline and strong teacher commitment are higher in schoolswith advantaged socio-economic intake. Conversely, disadvantagedschools may experience less parental pressure towards enforcingeffective disciplinary practices or making sure that absent orunmotivated teachers are replaced. Thus, a large joint influenceof socio-economic background and school climate should be ofconcern for policy makers seeking to ensure that all schools havecommitted teachers and an orderly climate, irrespective of theirsocio-economic intake.
In this regard, it is noteworthy that in some countries the jointinfluence of socio-economic background and school climate ismuch larger than at the OECD average level. For example, the“net” effect of school climate on student performance accountsfor only between 1.4 and 7.5 per cent of the performance variationamong schools in Australia, Belgium, Germany, Japan, Korea,the Netherlands and Spain, but when the socio-economic contextof students and schools is considered as well, the resulting grosseffect increases to between 29 per cent in Spain and 49 per centin Belgium, with these seven countries having the highest valuesamong OECD countries.
1 2 3 4 5 6 7 8 9 10 11 12 13 14 15 16 17 18 19 20 21 22 23 24 25 26 27 28 29 30 31 32 33 34 35 36 37
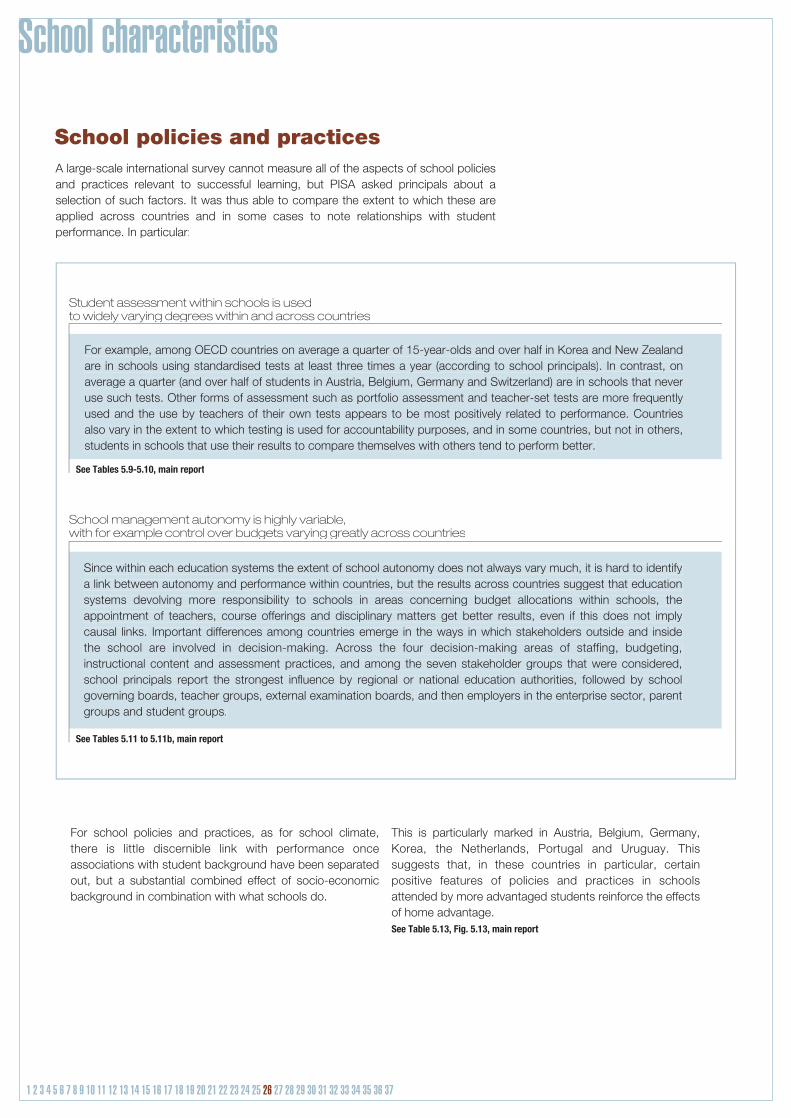
School policies and practices
See Tables 5.9-5.10, main report
Student assessment within schools is usedto widely varying degrees within and across countries
See Tables 5.11 to 5.11b, main report
School management autonomy is highly variable,with for example control over budgets varying greatly across countries
For school policies and practices, as for school climate, there is little discernible link with performance once associations with student background have been separated out, but a substantial combined effect of socio-economic background in combination with what schools do.
This is particularly marked in Austria, Belgium, Germany, Korea, the Netherlands, Portugal and Uruguay. This suggests that, in these countries in particular, certain positive features of policies and practices in schools attended by more advantaged students reinforce the effects of home advantage.See Table 5.13, Fig. 5.13, main report
A large-scale international survey cannot measure all of the aspects of school policies and practices relevant to successful learning, but PISA asked principals about a selection of such factors. It was thus able to compare the extent to which these are applied across countries and in some cases to note relationships with student performance. In particular:
For example, among OECD countries on average a quarter of 15-year-olds and over half in Korea and New Zealandare in schools using standardised tests at least three times a year (according to school principals). In contrast, onaverage a quarter (and over half of students in Austria, Belgium, Germany and Switzerland) are in schools that neveruse such tests. Other forms of assessment such as portfolio assessment and teacher-set tests are more frequentlyused and the use by teachers of their own tests appears to be most positively related to performance. Countriesalso vary in the extent to which testing is used for accountability purposes, and in some countries, but not in others,students in schools that use their results to compare themselves with others tend to perform better.
Since within each education systems the extent of school autonomy does not always vary much, it is hard to identifya link between autonomy and performance within countries, but the results across countries suggest that educationsystems devolving more responsibility to schools in areas concerning budget allocations within schools, theappointment of teachers, course offerings and disciplinary matters get better results, even if this does not implycausal links. Important differences among countries emerge in the ways in which stakeholders outside and insidethe school are involved in decision-making. Across the four decision-making areas of staffing, budgeting,instructional content and assessment practices, and among the seven stakeholder groups that were considered,school principals report the strongest influence by regional or national education authorities, followed by schoolgoverning boards, teacher groups, external examination boards, and then employers in the enterprise sector, parent groups and student groups.
School characteristics
1 2 3 4 5 6 7 8 9 10 11 12 13 14 15 16 17 18 19 20 21 22 23 24 25 26 27 28 29 30 31 32 33 34 35 36 37

Resources invested in schools
See Table 5.15, Fig. 5.16, main report
Teacher shortages appear to be of concern in a number of countries, although not in others
See Table 5.17, main report
The quality of the physical infrastructure and educational resourcescannot guarantee educational success, but having adequate material resourcesis a necessary condition for effective learning
Students in private schools, often funded partly or wholly by the public purse, tend to perform well, but also to have home advantages
Percentage of students in schools where principals report that shortage of mathematics teachers hinders instruction capacity at least to some extent:
Highest (41-84 per cent) in: Luxembourg, New Zealand, Turkey, Indonesia, Uruguay
Lowest (below 10 per cent) in: Austria, Denmark, Finland, Hungary, Korea, Portugal,the Slovak Republic, Switzerland
Various aspects of the physical and human resources invested in schools are often associated with student performance in the public debate. PISA asked principals questions about the adequacy of such resources in their schools, and also was ableto compare public and private schools, and to consider the time invested in learning:
On average in OECD countries, principals report that teacher shortages hinder instructional capacity in schools enrolling a quarter of students. Note however that this measure relies on principal perception of the effect of teacher supply, rather than being a measure of teacher supply itself: some countries where schools report more acuteteacher shortages in fact have relatively low overall ratios of students to teachers.
In some countries difficulties with physical infrastructure does little to hinder schools’ instructional capacity according to principals; in others, notably Greece, Norway and Turkey, principals raise such concerns more frequently. Only ina few countries is any link between physical resources and student performance evident; the link is slightly strongerin some countries in the case of educational resources such as instructional materials and computers. Principalswere most likely to report that shortage or low quality of educational resources hinders instruction in Greece,Mexico, Poland, the Slovak Republic, Turkey, Brazil, Indonesia, Latvia, the Russian Federation, Serbia, Thailand, Tunisia and Uruguay. Among these, the link with performance is strongest in Brazil.
Only in Japan, Korea, Mexico, Brazil, Indonesia, Macao-China and Uruguay are more than 10 per cent of 15–year-olds enrolled in independent schools resourced mainly by private means. Students in private schools perform much better on average, but the difference reduces if the socio-economic characteristics of individual students attendingthese schools are controlled for, and disappears entirely after also controlling for the fact that a student of a givensocio-economic background tends to do better in a school with a more advantaged social intake.
School characteristics
1 2 3 4 5 6 7 8 9 10 11 12 13 14 15 16 17 18 19 20 21 22 23 24 25 26 27 28 29 30 31 32 33 34 35 36 37
See Table 5.19, main report
See Figs. 5.15 and 5.16, main report
PISA looked at how much time students invested in learning, and found that thosewho had invested more in early childhood do better
There might still be some benefit associated with the school being private and not just its intake: the advantage of having more advantaged peers may be more likely to show through with certain kinds of school policies and approaches experienced in private schools. However, these comparisons show that the association between a school being private and its students doing well is at best tenuous. Thus, any policy to enhance overall performance only by moving funding from public to private institutions is subject to considerable uncertainty.
Looking at school resources as a whole reveals a substantial combined effect of socio-economic background in combination with the resources available to schools.This is particularly marked in Austria, Belgium, the Czech Republic, Germany, theNetherlands and New Zealand. In these countries policy makers need to address the fact that school resources appear to reinforce, rather than moderate, socio-economic differences.See Table 5.20, Fig. 5.19, main report
It is hard to find clear links with performance, especially for example among students who do more homework, partlybecause slower learners may need more time to complete homework. However, PISA identified one particularlyinteresting link between performance and time invested in learning: students who attended pre-school programmes often perform significantly better at age 15. In nine OECD countries this effect was particularly great – ranging between half a proficiency level and just over one proficiency level in mathematics (30-73 points). This suggests thatpreschool investments may have effects that are still marked and widespread across the student population (and insome cases greater among the least advantaged students) eight to ten years into a child’s school education.
School characteristics
1 2 3 4 5 6 7 8 9 10 11 12 13 14 15 16 17 18 19 20 21 22 23 24 25 26 27 28 29 30 31 32 33 34 35 36 37
The organisational structure of schooling
As noted above, catering for an increasingly diverse studentbody and narrowing the gaps in student performance representformidable challenges for all countries, and the approaches thatcountries have chosen to address these demands vary. Somecountries have non-selective school systems that seek to provideall students with similar opportunities for learning by requiringthat each school caters for the full range of student performance.
Other countries respond to diversity explicitly by forming groupsof students through selection either between schools or betweenclasses within schools, with the aim of serving students accordingto their academic potential and/or interests in specific programmes.Education systems can be located on a continuum ranging fromsystems with low stratification at system, school and classroomlevels to systems that are highly differentiated.

School characteristics
1 2 3 4 5 6 7 8 9 10 11 12 13 14 15 16 17 18 19 20 21 22 23 24 25 26 27 28 29 30 31 32 33 34 35 36 37
An explanation for these results is not straightforward. There isno intrinsic reason why institutional differentiation should necessarilylead to greater variation in student performance, or even to greatersocial selectivity. If teaching homogeneous groups of students ismore efficient than teaching heterogeneous groups, this shouldincrease the overall level of student performance rather than thedispersion of scores. However, in homogeneous environments,while the high performing students may profit from the wideropportunities to learn from one another, and stimulate each other’sperformance, the low performers may not be able to accesseffective models and support.
It may also be that in highly differentiated systems it is easier tomove students not meeting certain performance standards toother schools, tracks or streams with lower performance expectations,rather than investing the effort to raise their performance. Finally,it could be that a learning environment that has a greater varietyof student performance and backgrounds may stimulate teachersto use approaches that involve a higher degree of individualattention for students.
The reason why the age at which differentiation begins is closelyassociated with social selectivity may be explained by the factthat students are more dependent upon their parents and theirparental resources when they are younger. In systems with a highdegree of educational differentiation, parents from higher socio-economic backgrounds are in a better position to promote theirchildren’s chances than in a system in which such decisions aretaken at a later age, and students themselves play a bigger role.
One device to differentiate among students is the use of differentinstitutions or programmes that seek to group students, inaccordance with their performance or other characteristics. Wherestudents are sorted based on their performance, this is often doneon the assumption that their talents will develop best in a learningenvironment in which they can stimulate each other equally well,and that an intellectually homogeneous student body will beconducive to the efficiency of teaching. Countries range fromessentially undivided secondary education until the age of 15years to systems with four or more school types or distincteducational programmes (Austria, Belgium, the Czech Republic,Germany, Ireland, the Netherlands the Slovak Republic andSwitzerland). Simple cross-country comparisons show that thenumber of school types or distinct educational programmesavailable to 15-year-olds accounts for 39 per cent of the shareof the OECD average variation that lies between schools. No lessimportant, it accounts for 26 per cent of the cross-country variationamong countries in the strength of the relationship between socio-economic background and student performance. In other words,in countries with a larger number of distinct programme types,socio-economic background tends to have a significantly largerimpact on student performance such that equity is much harderto realise. The percentage of 15-year-olds in vocational programmesand the extent of grade repetition show similar associations.See Figs. 5.20a-b, main report
An important dimension of tracking and streaming is the age atwhich decisions between different school types are generallymade, and therefore students and their parents are faced withchoices. Such decisions occur very early in Austria and Germany,at around age 10. By contrast, in countries such as New Zealand,Spain and the United States no formal differentiation takes placeat least between schools until the completion of secondaryeducation. Across the OECD, the age of selection accounts forhalf of the between-school differences. While this, in itself, is notsurprising because variation in school performance is an intendedoutcome of stratification, the findings also show that educationsystems with lower ages of selection tend to show much largersocial disparities, with the age of selection accounting for 28 percent of the country average of the strength of the relationshipbetween the PISA index of economic, social and cultural statusand student performance.
Overall, these results show that institutional differentiation ofstudents is associated with performance differences across schoolsand across social groups. It is difficult to define these measuresof differentiation in ways that are cross-nationally comparable andinterpretable. However, the various indicators of stratification thathave been employed in the report are highly interrelated so thatthe results do not depend in significant ways on how stratificationis measured. Moreover, the association with performance differencesacross social groups applies for the various aspects of familybackground that were measured by PISA, and this remains trueeven when controlling for variables such as national income.
Aspects of differentiation
Possible explanations
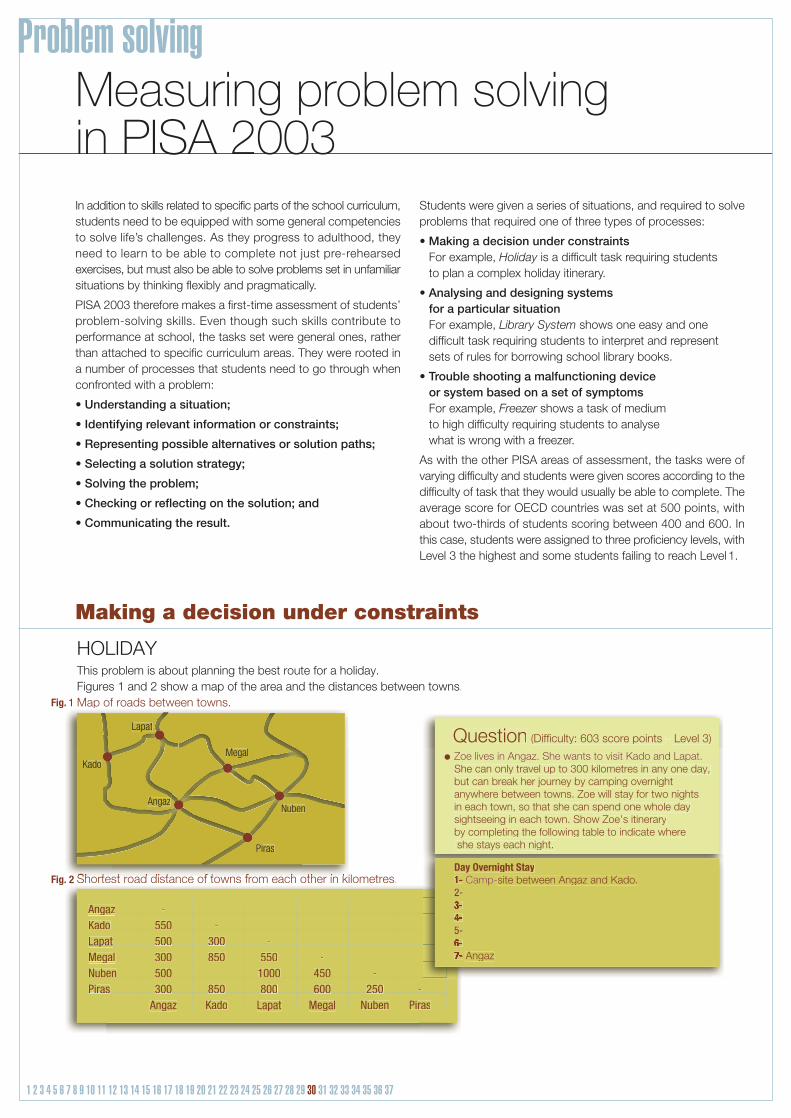
Problem solvingMeasuring problem solvingin PISA 2003In addition to skills related to specific parts of the school curriculum,students need to be equipped with some general competenciesto solve life’s challenges. As they progress to adulthood, theyneed to learn to be able to complete not just pre-rehearsedexercises, but must also be able to solve problems set in unfamiliarsituations by thinking flexibly and pragmatically.
PISA 2003 therefore makes a first-time assessment of students’problem-solving skills. Even though such skills contribute toperformance at school, the tasks set were general ones, ratherthan attached to specific curriculum areas. They were rooted ina number of processes that students need to go through whenconfronted with a problem:
• Understanding a situation;
• Identifying relevant information or constraints;
• Representing possible alternatives or solution paths;
• Selecting a solution strategy;
• Solving the problem;
• Checking or reflecting on the solution; and
• Communicating the result.
Students were given a series of situations, and required to solveproblems that required one of three types of processes:
• Making a decision under constraintsFor example, Holiday is a difficult task requiring students to plan a complex holiday itinerary.
• Analysing and designing systems for a particular situationFor example, Library System shows one easy and onedifficult task requiring students to interpret and represent sets of rules for borrowing school library books.
• Trouble shooting a malfunctioning device or system based on a set of symptomsFor example, Freezer shows a task of medium to high difficulty requiring students to analyse what is wrong with a freezer.
As with the other PISA areas of assessment, the tasks were ofvarying difficulty and students were given scores according to thedifficulty of task that they would usually be able to complete. Theaverage score for OECD countries was set at 500 points, withabout two-thirds of students scoring between 400 and 600. Inthis case, students were assigned to three proficiency levels, withLevel 3 the highest and some students failing to reach Level 1.
Kado
Lapat
Megal
Angaz
Piras
Nuben
Angaz -Kado 550 -Lapat 500 300 -Megal 300 850 550 -Nuben 500 1000 450 -Piras 300 850 800 600 250 -
Angaz Kado Lapat Megal Nuben Piras
This problem is about planning the best route for a holiday.Figures 1 and 2 show a map of the area and the distances between towns.Map of roads between towns.
HOLIDAY
ga550Kado
300500Lapatg
4501000500Nuben250600800850300Piras
Fig. 1
Fig. 2 Shortest road distance of towns from each other in kilometres.
Question (Difficulty: 603 score points – Level 3)
She can only travel up to 300 kilometres in any one day,but can break her journey by camping overnightanywhere between towns. Zoe will stay for two nightsin each town, so that she can spend one whole daysightseeing in each town. Show Zoe’s itineraryby completing the following table to indicate where she stays each night.
Day Overnight Staysite between Angaz and Kado.
Angaz
1-1-
3-3-4-4-
6-6-7-7-
1 2 3 4 5 6 7 8 9 10 11 12 13 14 15 16 17 18 19 20 21 22 23 24 25 26 27 28 29 30 31 32 33 34 35 36 37
Making a decision under constraints
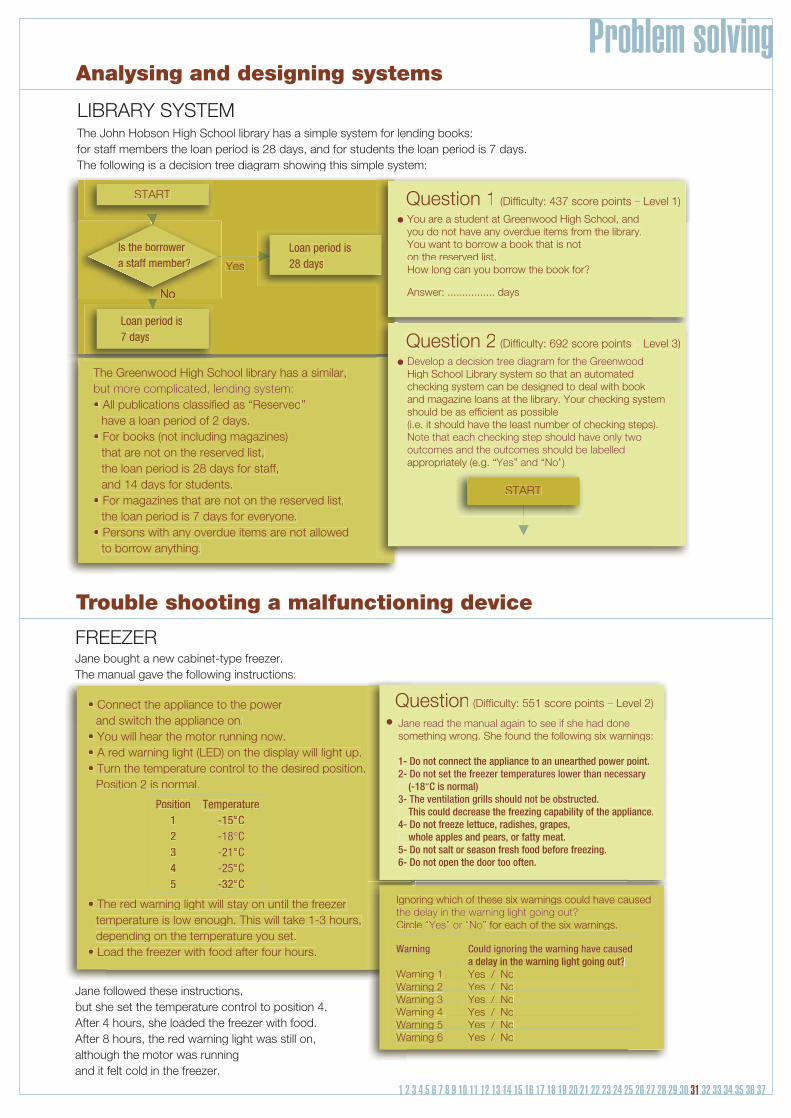
The John Hobson High School library has a simple system for lending books: for staff members the loan period is 28 days, and for students the loan period is 7 days. The following is a decision tree diagram showing this simple system:
Question 1 (Difficulty: 437 score points – Level 1)
You are a student at Greenwood High School, andyou do not have any overdue items from the library.You want to borrow a book that is noton the reserved list.How long can you borrow the book for?
Answer: ................ days
Question 2 (Difficulty: 692 score points – Level 3)
High School Library system so that an automatedchecking system can be designed to deal with bookand magazine loans at the library. Your checking systemshould be as efficient as possible(i.e. it should have the least number of checking steps).
appropriately (e.g. “ ” “ ”).
START
No
Yes
START
LIBRARY SYSTEM
Is the borrowera staff member?
Loan period is28 days
Loan period is7 days
The Greenwood High School library has a similar,
• All publications classified as “Reserved”have a loan period of 2 days.
• For books (not including magazines)that are not on the reserved list,the loan period is 28 days for staff,and 14 days for students.
• For magazines that are not on the reserved list,the loan period is 7 days for everyone.
• Persons with any overdue items are not allowedto borrow anything.
Jane bought a new cabinet-type freezer.The manual gave the following instructions:
Jane followed these instructions,but she set the temperature control to position 4.After 4 hours, she loaded the freezer with food.After 8 hours, the red warning light was still on,although the motor was running and it felt cold in the freezer.
FREEZER
• Connect the appliance to the powerand switch the appliance on.
• You will hear the motor running now.• A red warning light (LED) on the display will light up.• Turn the temperature control to the desired position.
Position 2 is normal.
Position Temperature1 -15°C23 °4 °5 -32°C
• The red warning light will stay on until the freezertemperature is low enough. This will take 1-3 hours,depending on the temperature you set.
• Load the freezer with food after four hours.
Question (Difficulty: 551 score points – Level 2)
something wrong. She found the following six warnings:
1- Do not connect the appliance to an unearthed power point.
(-18°C is normal)
This could decrease the freezing capability of the appliance.4- Do not freeze lettuce, radishes, grapes, whole apples and pears, or fatty meat.5- Do not salt or season fresh food before freezing.6- Do not open the door too often.
Ignoring which of these six warnings could have caused
Circle “ ” “ ” for each of the six warnings.
a delay in the warning light going out?Warning 1 Yes / NoWarning 2 Yes / NoWarning 3 Yes / NoWarning 4 Yes / NoWarning 5 Yes / NoWarning 6 Yes / No
a delay in the warning light going out?Yes / NoWarning 1
es / oa gYes / NoWarning 3Yes / NoWarning 4 Yes / NoWarning 5
a g 6 es / o
Problem solving
1 2 3 4 5 6 7 8 9 10 11 12 13 14 15 16 17 18 19 20 21 22 23 24 25 26 27 28 29 30 31 32 33 34 35 36 37
Trouble shooting a malfunctioning device
Analysing and designing systems
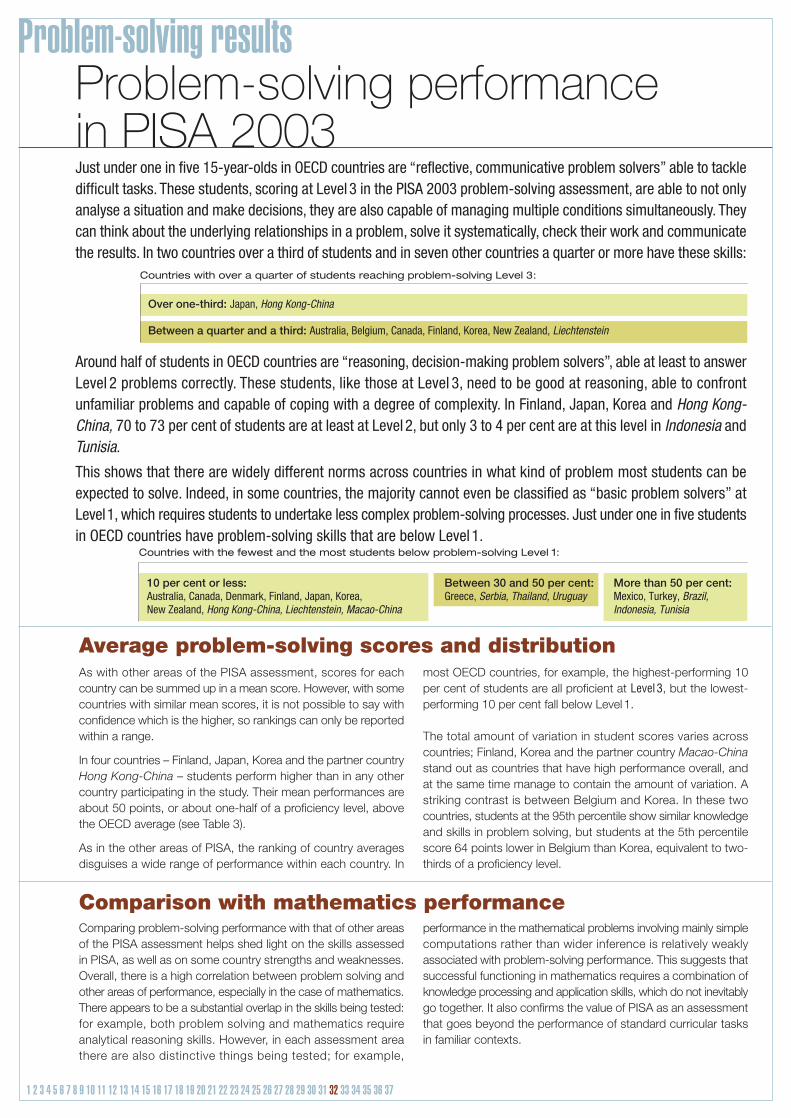
Problem-solving resultsProblem-solving performance in PISA 2003
1 2 3 4 5 6 7 8 9 10 11 12 13 14 15 16 17 18 19 20 21 22 23 24 25 26 27 28 29 30 31 32 33 34 35 36 37
Comparing problem-solving performance with that of other areasof the PISA assessment helps shed light on the skills assessedin PISA, as well as on some country strengths and weaknesses.Overall, there is a high correlation between problem solving andother areas of performance, especially in the case of mathematics.There appears to be a substantial overlap in the skills being tested:for example, both problem solving and mathematics requireanalytical reasoning skills. However, in each assessment areathere are also distinctive things being tested; for example,
performance in the mathematical problems involving mainly simplecomputations rather than wider inference is relatively weaklyassociated with problem-solving performance. This suggests thatsuccessful functioning in mathematics requires a combination ofknowledge processing and application skills, which do not inevitablygo together. It also confirms the value of PISA as an assessmentthat goes beyond the performance of standard curricular tasksin familiar contexts.
Comparison with mathematics performance
As with other areas of the PISA assessment, scores for eachcountry can be summed up in a mean score. However, with somecountries with similar mean scores, it is not possible to say withconfidence which is the higher, so rankings can only be reportedwithin a range.
In four countries – Finland, Japan, Korea and the partner countryHong Kong-China – students perform higher than in any othercountry participating in the study. Their mean performances areabout 50 points, or about one-half of a proficiency level, abovethe OECD average (see Table 3).
As in the other areas of PISA, the ranking of country averagesdisguises a wide range of performance within each country. In
most OECD countries, for example, the highest-performing 10per cent of students are all proficient at Level 3, but the lowest-performing 10 per cent fall below Level 1.
The total amount of variation in student scores varies acrosscountries; Finland, Korea and the partner country Macao-Chinastand out as countries that have high performance overall, andat the same time manage to contain the amount of variation. Astriking contrast is between Belgium and Korea. In these twocountries, students at the 95th percentile show similar knowledgeand skills in problem solving, but students at the 5th percentilescore 64 points lower in Belgium than Korea, equivalent to two-thirds of a proficiency level.
Average problem-solving scores and distribution
Countries with over a quarter of students reaching problem-solving Level 3:
Over one-third: Japan, Hong Kong-China
Between a quarter and a third: Australia, Belgium, Canada, Finland, Korea, New Zealand, Liechtenstein
Countries with the fewest and the most students below problem-solving Level 1:
10 per cent or less: Australia, Canada, Denmark, Finland, Japan, Korea, New Zealand, Hong Kong-China, Liechtenstein, Macao-China
Between 30 and 50 per cent: Greece, Serbia, Thailand, Uruguay
More than 50 per cent: Mexico, Turkey, Brazil, Indonesia, Tunisia
Just under one in five 15-year-olds in OECD countries are “reflective, communicative problem solvers” able to tackledifficult tasks. These students, scoring at Level3 in the PISA 2003 problem-solving assessment, are able to not onlyanalyse a situation and make decisions, they are also capable of managing multiple conditions simultaneously. Theycan think about the underlying relationships in a problem, solve it systematically, check their work and communicatethe results. In two countries over a third of students and in seven other countries a quarter or more have these skills:
Around half of students in OECD countries are “reasoning, decision-making problem solvers”, able at least to answerLevel 2 problems correctly. These students, like those at Level 3, need to be good at reasoning, able to confrontunfamiliar problems and capable of coping with a degree of complexity. In Finland, Japan, Korea and Hong Kong-China, 70 to 73 per cent of students are at least at Level 2, but only 3 to 4 per cent are at this level in Indonesia andTunisia.
This shows that there are widely different norms across countries in what kind of problem most students can beexpected to solve. Indeed, in some countries, the majority cannot even be classified as “basic problem solvers” atLevel1, which requires students to undertake less complex problem-solving processes. Just under one in five studentsin OECD countries have problem-solving skills that are below Level 1.
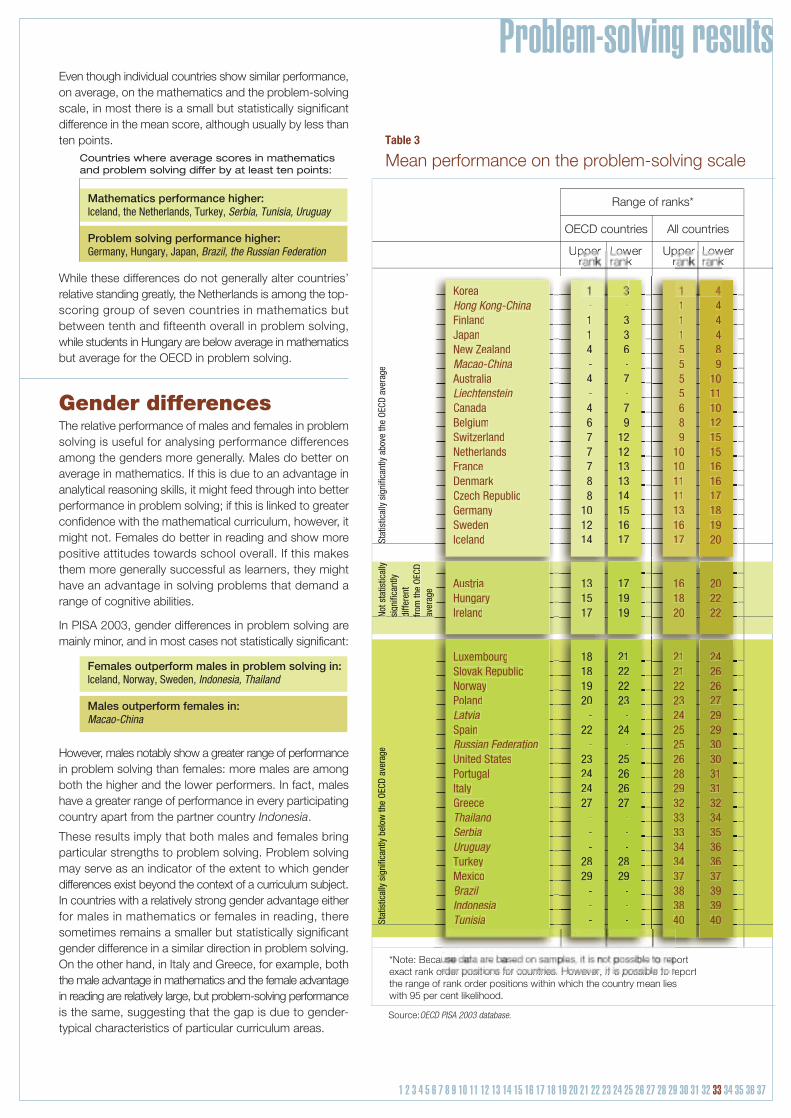
Problem-solving results
Range of ranks*
OECD countries All countries
Source:OECD PISA 2003 database.
Stat
istic
ally
sig
nific
antly
abo
ve th
e OE
CD a
vera
ge
Mean performance on the problem-solving scale
*Note: Beca ortexact rank order positions for countries. However, it is possible to report the range of rank order positions within which the country mean lies with 95 per cent likelihood.
Upperr
Lowerk
Upperr
Lowerk
Table 3
Not s
tatis
tical
ly
sign
ifica
ntly
s diffe
rent
d fro
m th
e OE
CD
f aver
age
a
Stat
istic
ally
sig
nific
antly
bel
ow th
e OE
CD a
vera
geS
1115555689
10101111131617
161820
21212223242525262829323333343437383840
44489
101110121515161617181920
202222
24262627292930303131323435363637393940
3-336-7-79
1212131314151617
171919
21222223
-24
-25262627
---
2829
---
-114-4-4677788
101214
131517
18181920
-22
-23242427
---
2829
---
KoreaHong Kong-ChinaFinlandJapanNew ZealandMacao-ChinaAustraliaLiechtensteinCanadaBelgiumSwitzerlandNetherlandsFranceDenmarkCzech RepublicGermanySwedenIceland
AustriaHungaryIreland
LuxembourgSlovak RepublicNorwayPolandLatviaSpainRussian FederationUnited StatesPortugalItalyGreeceThailandSerbiaUruguayTurkeyMexicoBrazilIndonesiaTunisia
1 2 3 4 5 6 7 8 9 10 11 12 13 14 15 16 17 18 19 20 21 22 23 24 25 26 27 28 29 30 31 32 33 34 35 36 37
Even though individual countries show similar performance,on average, on the mathematics and the problem-solvingscale, in most there is a small but statistically significantdifference in the mean score, although usually by less thanten points.
While these differences do not generally alter countries’relative standing greatly, the Netherlands is among the top-scoring group of seven countries in mathematics butbetween tenth and fifteenth overall in problem solving,while students in Hungary are below average in mathematicsbut average for the OECD in problem solving.
Gender differencesThe relative performance of males and females in problemsolving is useful for analysing performance differencesamong the genders more generally. Males do better onaverage in mathematics. If this is due to an advantage inanalytical reasoning skills, it might feed through into betterperformance in problem solving; if this is linked to greaterconfidence with the mathematical curriculum, however, itmight not. Females do better in reading and show morepositive attitudes towards school overall. If this makesthem more generally successful as learners, they mighthave an advantage in solving problems that demand arange of cognitive abilities.
In PISA 2003, gender differences in problem solving aremainly minor, and in most cases not statistically significant:
However, males notably show a greater range of performancein problem solving than females: more males are amongboth the higher and the lower performers. In fact, maleshave a greater range of performance in every participatingcountry apart from the partner country Indonesia.
These results imply that both males and females bringparticular strengths to problem solving. Problem solvingmay serve as an indicator of the extent to which genderdifferences exist beyond the context of a curriculum subject.In countries with a relatively strong gender advantage eitherfor males in mathematics or females in reading, theresometimes remains a smaller but statistically significantgender difference in a similar direction in problem solving.On the other hand, in Italy and Greece, for example, boththe male advantage in mathematics and the female advantagein reading are relatively large, but problem-solving performanceis the same, suggesting that the gap is due to gender-typical characteristics of particular curriculum areas.
Countries where average scores in mathematics and problem solving differ by at least ten points:
Mathematics performance higher: Iceland, the Netherlands, Turkey, Serbia, Tunisia, Uruguay
Problem solving performance higher: Germany, Hungary, Japan, Brazil, the Russian Federation
Females outperform males in problem solving in: Iceland, Norway, Sweden, Indonesia, Thailand
Males outperform females in: Macao-China

Reading results Reading performance in PISA 2003
1 2 3 4 5 6 7 8 9 10 11 12 13 14 15 16 17 18 19 20 21 22 23 24 25 26 27 28 29 30 31 32 33 34 35 36 37
In reading, as with mathematics, reading scores for each countrycan be summed up in a mean score. Again, with some countrieswith similar mean scores, it is not possible to say with confidencewhich is the higher, so rankings can only be reported within arange (see Table 4).
Finland’s average reading score is above those of all other countries,and is over half a proficiency level above the OECD mean andmore than two proficiency levels above the lowest-scoring countries.Despite this wide range of country performances, most variationstake place within countries, although the range of studentperformance is wider in some countries than in others. Finlandand Korea not only show the best overall performance but alsoare the two countries with the narrowest internal differences.Canada also has relatively small internal variations in its readingscore, and is among the countries with the highest mean scores.
Average reading scores
Reading literacy in PISA is not an all or nothing measure: rather,students are placed at different levels of proficiency according tothe difficulty of task that they can complete. Easier tasks requirebasic handling of simple texts, with harder ones involving increasingcomplexity and less explicit information.
Only 8 per cent of students in OECD countries are proficient atthe highest reading level, Level 5. These students are capable ofsophisticated, critical thinking and may contribute to a pool ofworld-class knowledge workers in tomorrow’s economy. At least 12per cent of students in Australia, Belgium, Canada, Finland, Korea,New Zealand and Liechtenstein are proficient at reading Level5.See Fig. 6.2, main report
Just over a quarter of OECD students are capable of difficultreading tasks at least at Level 4, and just over half can at least perform medium-difficulty tasks at least at Level 3. However, insome countries the great majority of students can function at thismidrange reading level:
Students proficient at Level 2 are capable of basic reading tasks,such as locating straightforward information, making low-levelinferences of various types, working out what a well-defined partof a text means, and using some outside knowledge to understandthe text. More than three-quarters of students in OECD countries
can perform these tasks. The remaining students, those who can at most perform very simple reading tasks at Level 1, are atrisk of not acquiring essential life skills, partly because they donot have the foundation of literacy skills needed for continuedlearning and extending their knowledge horizon. A high numberof students not reaching Level 2 is thus of considerable concernfor education systems. While 22 per cent of students on averagein OECD countries fall into this category, this varies widely acrosscountries from less than 10 per cent to more than 50 per cent:
Note that having relatively large numbers of students at the highestlevel of reading proficiency does not always go with having a verysmall number with weak reading skills. For example, Finland has15 per cent of students at Level 5 and only 1 per cent belowLevel 1, whereas Belgium, which has 13 per cent of students atLevel 5, has 8 per cent below Level 1.
Reading proficiency
PISA 2000 looked in detail at reading performance. PISA 2003 provides a brief update, with most assessment timehaving been devoted to mathematics.
PISA measures reading literacy in terms of students’ ability to use written information in situations that they encounterin their lives. This goes beyond the traditional notion of decoding information and literal interpretation. Students areshown a range of different kinds of written text, ranging from prose to lists, graphs and diagrams. For each text,they are set a series of tasks, requiring them to retrieve specified information, to interpret the text and to reflect onand evaluate what they read. These texts are set in a variety of reading situations, including reading for private use,occupational purposes, education and public use.
Countries with 65-80 per cent of students at reading Level 3 or above:Australia, Canada, Finland, Ireland, Korea, the Netherlands, New Zealand, Sweden, Hong Kong-China and Liechtenstein
Countries with the fewest and the most students at reading Level 1 or below:
Fewer than 10 per cent: Canada, Finland, Korea, Macao-China
Between a quarter and half: Greece, Turkey, the Russian Federation, Serbia, Thailand, Uruguay
More than half: Mexico, Brazil, Indonesia, Tunisia

Reading results
Range of ranks*
OECD countries All countries
Source:OECD PISA 2003 database.
Stat
istic
ally
sig
nific
antly
ab
ove
the
OECD
ave
rage
Mean performance on the reading scale
*Note: Becexact rank order positions for countries. However, it is possible to report the range of rank order positions within which the country mean lies with 95 per cent likelihood.
Upperra k
Lowerrank
Upperra k
Lowerrank
Table 4
Not s
tatis
tical
ly
sign
ifica
ntly
diffe
rent
fro
m th
e OE
CD
f aver
age
Stat
istic
ally
sig
nific
antly
bel
ow th
e OE
CD a
vera
ge
12232467779
11121212121212151715141417
24242525262729323233353536373939
135667
1010111212
18202219212223242424252525
28292930313131343434363738384040
1345-6899-
10
151718
-18181920202021
-21
24252526262727
-28
----
29--
1223-4666-8
101010
-10 10 10 12141212
-14
2020 21212123 25
-28
----
29 --
FinlandKoreaCanadaAustraliaLiechtensteinNew ZealandIrelandSwedenNetherlandsHong Kong-ChinaBelgium
NorwaySwitzerlandJapanMacao-ChinaPolandFranceUnited StatesDenmarkIcelandGermanyAustriaLatviaCzech Republic
HungarySpainLuxembourgPortugalItalyGreeceSlovak RepublicRussian FederationTurkeyUruguayThailandSerbiaBrazilMexicoIndonesiaTunisia
1 2 3 4 5 6 7 8 9 10 11 12 13 14 15 16 17 18 19 20 21 22 23 24 25 26 27 28 29 30 31 32 33 34 35 36 37
As in PISA 2000, females showed significantly higher averagereading performance than males in every country in PISA 2003(except in the partner country Liechtenstein in 2003). The femaleadvantage in reading is generally greater than the male advantagein mathematics: on average it is 34 points, or half a proficiencylevel. However, the difference ranges from 58 points in Iceland to21 points in Korea, Mexico and the Netherlands and 13 points inthe partner country Macao-China.See Table 6.3, Fig. 6.6, main report
Gender differences
Change since 2000
Countries with statistically significant changes in reading performancePISA 2000 to PISA 2003
Average foall students
Increase
Poland Austria, Iceland, Ireland, Italy,Japan, Mexico, Spain
Korea Canada, Denmark,Finland, Ireland
Decrease
Score amonghigher
performing
1. Shows countries with change at the 75th, 90th and 95th percentiles,where in at least two of these cases the change is statistically significant.
2. Shows countries with change at the 25th, 10th and 5th percentiles,where in at least two of these cases the change is statistically significant.
Hong Kong-China,the Russian Federation
Latvia, Liechtenstein
Hong Kong-China,the Russian Federation
Brazil, Latvia,Liechtenstein
performingstudents
Poland Austria, Iceland, Italy, Japan,Mexico, Spain
Score amonglower
performingLatvia, Liechtenstein Brazil, the Russian Federation
performingstudents2
gg
Table 5
In PISA 2003, reading performance was scored on the same scaleas in PISA 2000, with the average score of OECD countriesparticipating in the 2000 survey set at 500. On average for the 25OECD countries with valid results reported in both surveys, averagereading performance had not changed statistically significantlyover the three years. However, performance in some individualcountries improved, and in others it went down.
Changes in performance were not always even across the wholestudent population. In some cases they were concentrated amongeither lower or higher performers. Thus, for example, in Poland asubstantial improvement in average scores was caused by improvementamong lower-performers, while a smaller rise in performance inKorea was caused by increased scores among higher-performers.In some countries, such as Denmark and Finland, small drops inreading performance in parts of the distribution were not sufficientto produce a statistically significant fall in average scores.
Countries with the greatest gender gap in reading:
Females on average are at Level 4, males at Level 3:Finland
Females on average are at Level 3, males at Level 2: Austria, Germany, Iceland, Norway, Poland
Females on average are at Level 2, males at Level 1: Serbia, Thailand

Range of ranks*
OECD countries All countries
Source:OECD PISA 2003 database.
Stat
istic
ally
sig
nific
antly
abo
ve th
e OE
CD a
vera
ge
Mean performance on the science scale
*Note: Beca ortexact rank order positions for countries. However, it is possible to report the range of rank order positions within which the country mean lies with 95 per cent likelihood.
Upperr
Lowerk
Upperr
Lowerk
Table 6
Not s
tatis
tical
ly
sign
ifica
ntly
di
ffere
nt
from
the
OECD
f av
erag
e
Stat
istic
ally
sig
nific
antly
bel
ow th
e OE
CD a
vera
ge
1225555568
1012121313
14141718
1920192020222224262530313333333437383839
344
111010111111121516161818
19212225
2327283029293030303132323536363637394040
23-3-7-8889
1313131515
16171921
192323
--
24252525262727
--
28-
29---
1-2-4-4446799
1010
11111415
161716
--
19192022212526
--
28-
29---
FinlandJapanHong Kong-ChinaKoreaLiechtensteinAustraliaMacao-ChinaNetherlandsCzech RepublicNew ZealandCanadaSwitzerlandFranceBelgiumSwedenIreland
HungaryGermanyPolandSlovak Republic
IcelandUnited StatesAustriaRussian FederationLatviaSpainItalyNorwayLuxembourgGreeceDenmarkPortugalUruguaySerbiaTurkeyThailandMexicoIndonesiaBrazilTunisia
Science resultsScience performance in PISA 2003
1 2 3 4 5 6 7 8 9 10 11 12 13 14 15 16 17 18 19 20 21 22 23 24 25 26 27 28 29 30 31 32 33 34 35 36 37
As with mathematics and reading, science scores foreach country can be summed up in a mean score. Again,with some countries with similar mean scores, it is notpossible to say with confidence which is the higher, sorankings can only be reported within a range.
Finland and Japan have the highest mean scores andrank between first and third on the science scale, buttheir performance is not statistically significantly differentfrom that in Korea and the partner country Hong Kong-China, who both rank between second and fourth.
Average science scores
PISA 2003 looked that science more briefly thanmathematics, devoting less assessment time tothis subject. As in 2000, this gives a snapshotrather than a detailed portrait of performance inscience. Science will become the main focus ofPISA in 2006.
The emphasis in the PISA science assessment isthe application of scientific knowledge and skillsto real-life situations, as opposed to being a testof particular curricular components. In PISA 2003,the science assessment focused on a sample ofconcepts that have particular relevance to reallife, as well as having enduring significance.Students were required to show a range of scientific skills, involving the recognition andexplanation of scientific phenomena, theunderstanding of scientific investigation and theinterpretation of scientific evidence. Tasks wereset in a variety of contexts relevant to people’slives, related to life and health, technology andthe Earth and environment.
More difficult science tasks in PISA involve morecomplex concepts and greater skill requirements,as well as requiring more sophisticated scientificknowledge. However, since science has not yetbeen assessed in detail in PISA, proficiency levelshave yet to be defined.
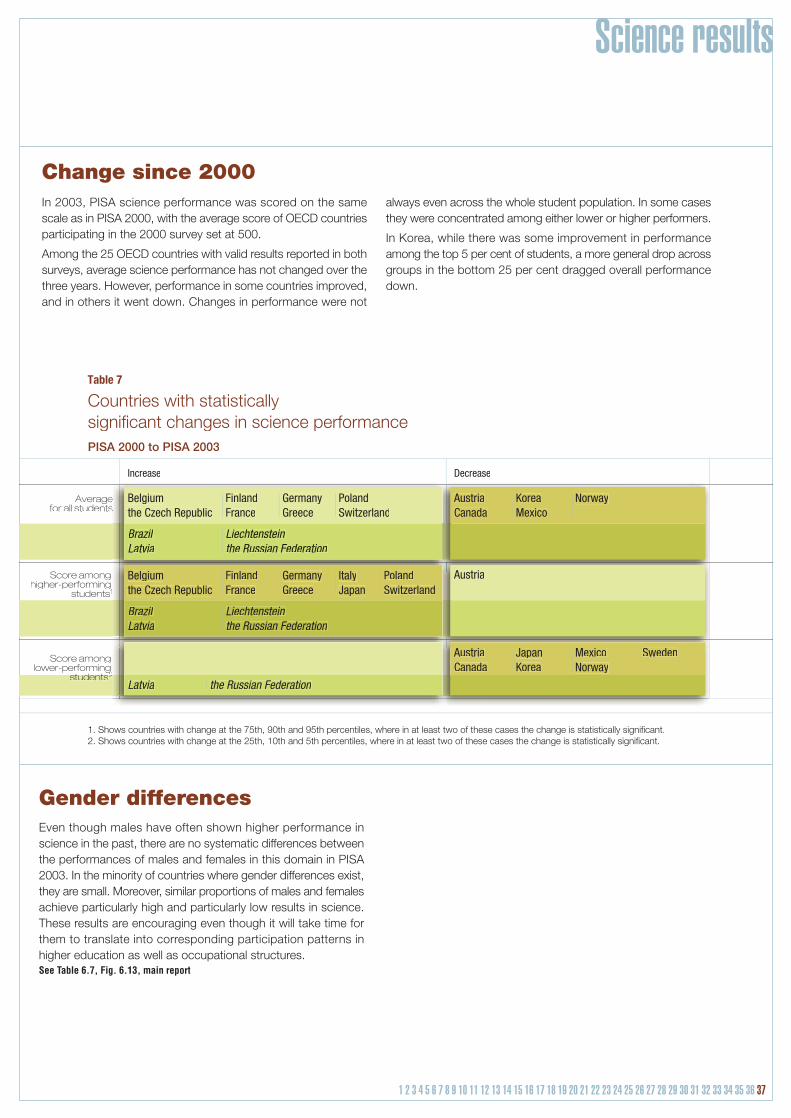
Science results
1 2 3 4 5 6 7 8 9 10 11 12 13 14 15 16 17 18 19 20 21 22 23 24 25 26 27 28 29 30 31 32 33 34 35 36 37
In 2003, PISA science performance was scored on the samescale as in PISA 2000, with the average score of OECD countriesparticipating in the 2000 survey set at 500.
Among the 25 OECD countries with valid results reported in bothsurveys, average science performance has not changed over thethree years. However, performance in some countries improved,and in others it went down. Changes in performance were not
always even across the whole student population. In some casesthey were concentrated among either lower or higher performers.
In Korea, while there was some improvement in performanceamong the top 5 per cent of students, a more general drop acrossgroups in the bottom 25 per cent dragged overall performancedown.
Even though males have often shown higher performance inscience in the past, there are no systematic differences betweenthe performances of males and females in this domain in PISA2003. In the minority of countries where gender differences exist,they are small. Moreover, similar proportions of males and femalesachieve particularly high and particularly low results in science.These results are encouraging even though it will take time forthem to translate into corresponding participation patterns inhigher education as well as occupational structures.See Table 6.7, Fig. 6.13, main report
Gender differences
Change since 2000
PISA 2000 to PISA 2003
Averagefor all students
Increase
Belgiumthe Czech Republic
FinlandFrance
AustriaCanada
KoreaMexico
Norway
Austria
Decrease
Score amonghigher-performing
students1g
Score amonglower-performing
t d t 2gg
1. Shows countries with change at the 75th, 90th and 95th percentiles, where in at least two of these cases the change is statistically significant.2. Shows countries with change at the 25th, 10th and 5th percentiles, where in at least two of these cases the change is statistically significant.
BrazilLatvia
Liechtensteinthe Russian Federation
students2
GermanyGreece
PolandSwitzerland
Belgiumthe Czech Republic
BrazilLatvia
FinlandFrance
Liechtensteinthe Russian Federation
Latvia the Russian Federation
GermanyGreece
ItalyJapan
PolandSwitzerland
AustriaCanada
JapanKorea
MexicoNorway
Sweden
Countries with statistically significant changes in science performance
Table 7

PISA 2003 Initial ReportsLearning for Tomorrow's World – First Results from PISA 2003Problem Solving for Tomorrow's World – First Measures of Cross-Curricular Competencies from PISA 2003
PISA 2003 Thematic ReportsMathematical Literacy: Student Performance and Engagement (December 2005)Teaching and Learning Strategies (April 2006)
PISA 2003 Assessment InformationThe PISA 2003 Assessment Framework: Mathematics, Reading, Science and Problem Solving Knowledge and SkillsProgramme for International Student Assessment (PISA): PISA 2003 Technical Report (September 2005)Programme for International Student Assessment (PISA): Manual for the PISA 2003 Database (April 2005)
PISA 2000 Initial ReportsKnowledge and Skills for Life: First Results from PISA 2000Literacy Skills for the World of Tomorrow: Further Results from PISA 2000
PISA 2000 Thematic ReportsReading for Change: Performance and Engagement across Countries: Results from PISA 2000Learners for Life: Student Approaches to Learning: Results from PISA 2000Student Engagement at School: A Sense of Belonging and Participation: Results from PISA 2000What Makes School Systems Perform?: Seeing School Systems through the Prism of PISAReviews of National Policies for Education: Denmark: Lessons from PISA 2000School Factors Related to Quality and Equity (February 2005)
PISA 2000 Assessment InformationMeasuring Student Knowledge and Skills: The PISA 2000 Assessment of Reading, Mathematical and Scientific LiteracySample Tasks from the PISA 2000 Assessment: Reading, Mathematical and Scientific LiteracyProgramme for International Student Assessment (PISA): PISA 2000 Technical ReportProgramme for International Student Assessment (PISA): Manual for the PISA 2000 Database
PISA Publications
Organisation for Economic Co-operation and Development2, rue André-Pascal75775 Paris Cedex 16France
Printed in France
Design: Trocadéro agency (Paris)