Embed Size (px)
Citation preview

Measuring Unilever’s Economic
Footprint in South Africa
A Report by Ethan B. Kapstein
Paul Dubrule Professor of Sustainable
Development, INSEAD, France
and
Visiting Fellow, Center for Global Development,
Washington, DC

Agenda
g Does FDI promote development?
g The South Africa context
g Report Methodology
g Key Findings
g Issues for Management
g Implications for Research and Policy

Does FDI Promote Development?
g Traditional Economic View: FDI plays two roles in developing countries: (1) fills the gap between local Savings and Investment requirements; (2) brings technology (inc. human capital): result is more economic growth. Thus, one objective of World Bank is “to promote private foreign investment” (IBRD Articles of Agreement).
g Economists also argued that, by operating at a bigger scale than domestic industry, FDI could help “lift up” an economy.
g Other benefits of FDI included provision of “public goods”:
g Technology transfer to local suppliers
g Financing of local suppliers (filling financial “gaps”)
g Transfer of business & management skills directly to suppliers and indirectly as managers left for domestic firms
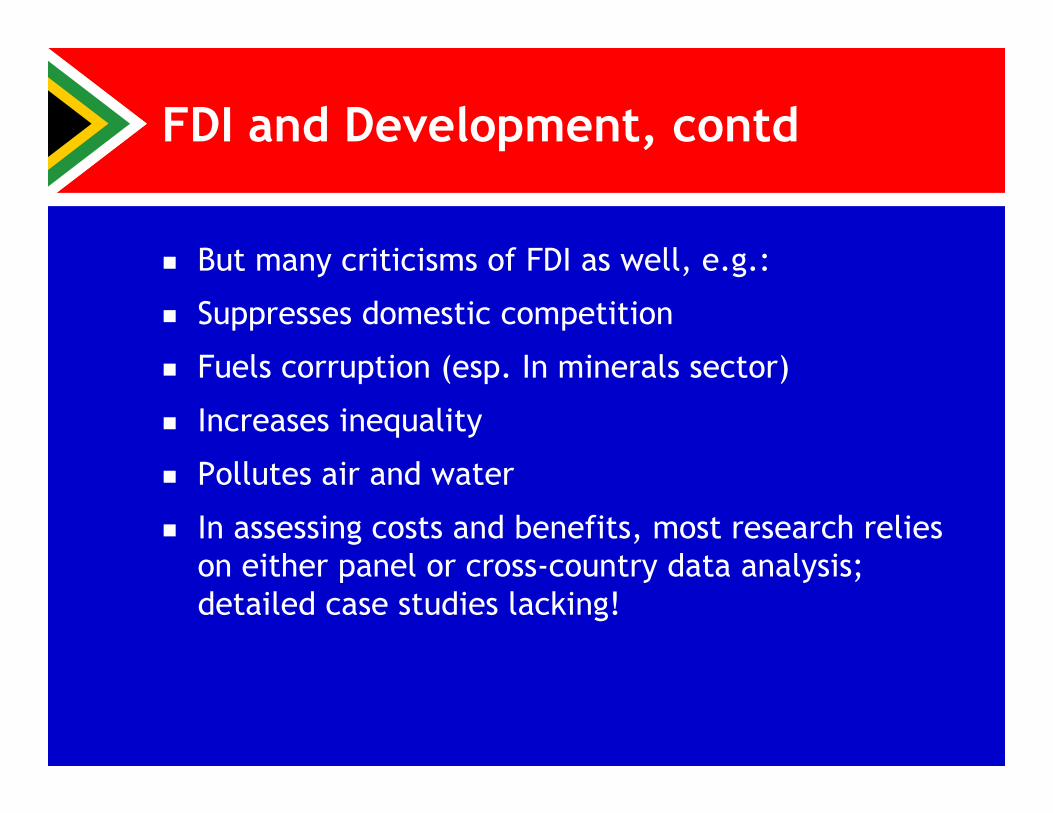
FDI and Development, contd
g But many criticisms of FDI as well, e.g.:
g Suppresses domestic competition
g Fuels corruption (esp. In minerals sector)
g Increases inequality
g Pollutes air and water
g In assessing costs and benefits, most research relies
on either panel or cross-country data analysis;
detailed case studies lacking!

The South African context
g Remarkable achievements since transition:
g Democratic, majority rule
g Macroeconomic stability and steady growth
g Introduction of BEE to redress effects of apartheid
g World Cup 2010!
g But continuing challenges:
g High unemployment (30% +)
g Shortage of educational opportunities and human capital generation
g Lack of international competitiveness in manufacturing sector and low levels of FDI
g Extreme inequality and poverty
g Crime
g Strained infrastructure (e.g. electric power)
g An HIV/AIDS pandemic

Unilever in South Africa
g Unilever is oldest foreign investor in RSA
g 1895: William Hesketh Lever visited South Africa and sent agent to sell Sunlight soap
g 1911: First factory opened in Durban
g 1947: Persuaded Government to allow sale of margarine, creating new markets
g Continued to operate during the apartheid era and to expand via new investment and acquisitions

Knorr, Rama, Robertsons,
Flora, Ola, Joko, Stork,
Lipton, Glen, Mrs Ball’s,
Rondo
Foods
Shield, Lux, Vaseline,
Sunsilk, Dawn, Axe, Ponds,
Brut, Lifebuoy
Personal care
Sunlight, Omo, Surf,
Handy Andy, Skip,
Domestos
Home care
Unilever South Africa’s main brands:
Iconic household names

Unilever South Africa: Key Indicators 2005
4,382Employees (no)
+3000Suppliers
908Net income
1,120Total labour cost
405Income tax paid
8,588Net sales
Rand (m)

Measuring ULSA’s Economic
Footprint: Methodology
g Purpose of footprint analysis is to assess corporate
impact on local economy (eg job creation, capital
formation, tax revenue, etc)
g Based on RSA’s Input-Output (I-O) Tables and
associated Social Accounting Matrix (SAM) to
measure more specific effects
g Economic rate of return (ERR) analysis where
comparative data available
g Quantitative & qualitative assessments of Social and
Environmental impacts

Measuring Unilever’s Impact
ULSA’s Direct (First Round) impact(economic impact of ULSA + immediate suppliers)
+
ULSA’s Indirect (Second Round) impact(economic impact of suppliers’ suppliers)
+
ULSA’s Induced (Third Round) impact(economic impact of all employees’ consumption decisions)
=
ULSA’s Total Economic impact

Who Profits from Unilever Sales?
Suppliers
Labour cost
Interest
Depreciation
Tax
Profit
2005 Sales of 8.5bn

Unilever’s Contribution to tax revenue
Corporate
Income
Indirect
R4 bn (0.9% of RSA tax revenue)

Unilever’s Impact on Balance of
Payments
-500
-250
0
250
500
Exports Imports Expatriated
dividends
Net
5 year Average, 2002-6; (note RSA 2004 M = R124 bn)Rm

Unilever’s Impact on Jobs in RSA
0 10 20 30 40
Other
Other services
Agriculture
Manufacturing
Business Services
Trade
%
ULSA
Total Jobs 99,062
Unilever’s Multiplier = 21.6

Jobs by race
0
10,000
20,000
30,000
40,000
50,000
60,000
70,000
Black White Coloured Asian

Jobs by skill
0
10
20
30
40
High Medium Low Informal
%

Jobs vs. income
0
10
20
30
40
High Medium Low Informal
Jobs Income
%
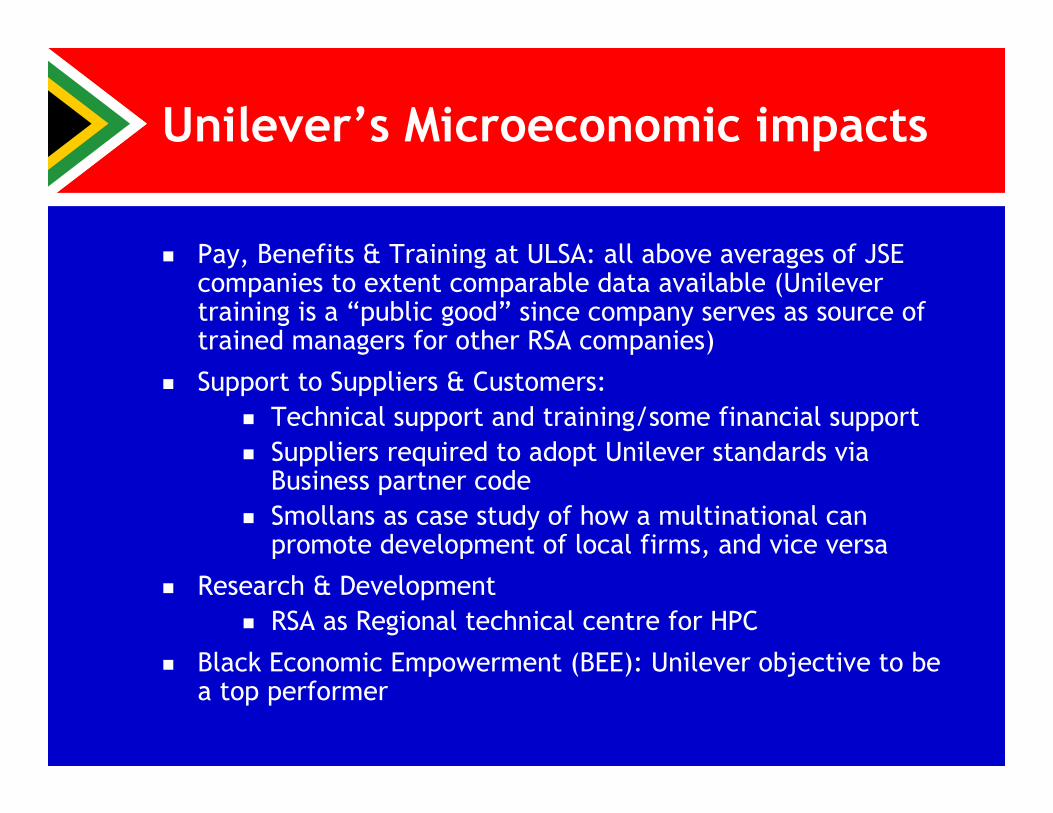
Unilever’s Microeconomic impacts
g Pay, Benefits & Training at ULSA: all above averages of JSE companies to extent comparable data available (Unilever training is a “public good” since company serves as source of trained managers for other RSA companies)
g Support to Suppliers & Customers:
g Technical support and training/some financial support
g Suppliers required to adopt Unilever standards via Business partner code
g Smollans as case study of how a multinational can promote development of local firms, and vice versa
g Research & Development
g RSA as Regional technical centre for HPC
g Black Economic Empowerment (BEE): Unilever objective to be a top performer
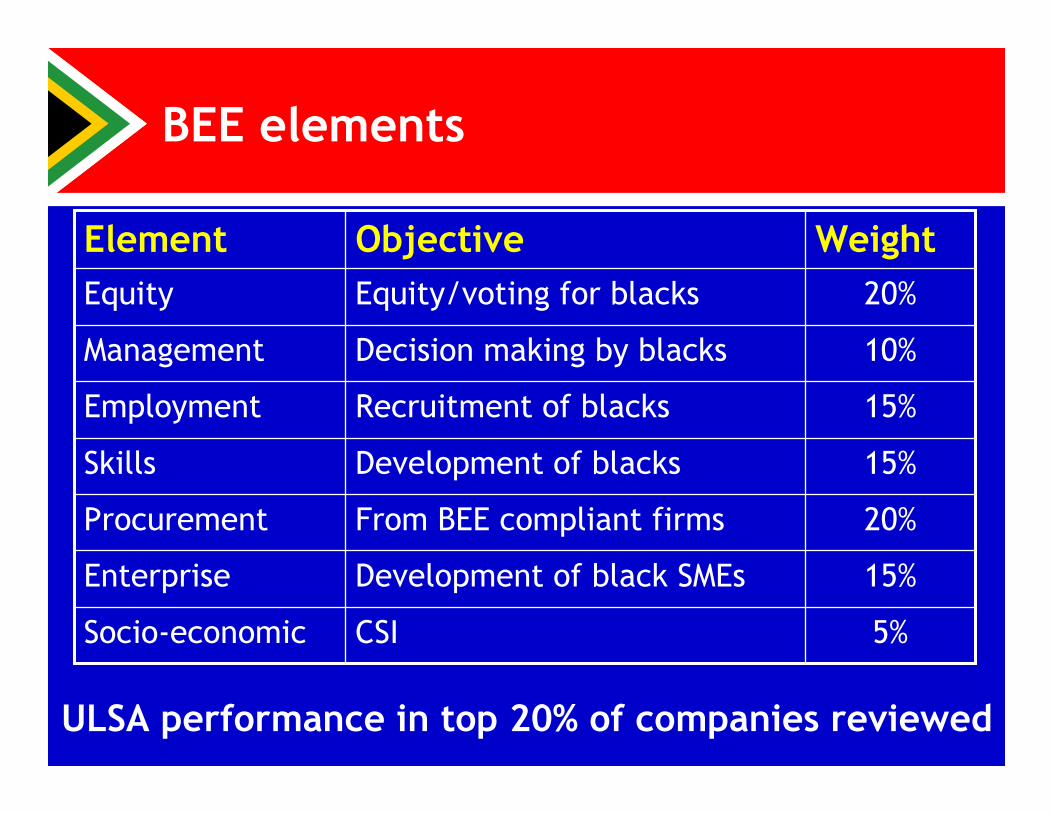
BEE elements
5%CSISocio-economic
15%Development of black SMEsEnterprise
20%From BEE compliant firmsProcurement
15%Development of blacksSkills
15%Recruitment of blacksEmployment
10%Decision making by blacksManagement
20%Equity/voting for blacksEquity
WeightObjectiveElement
ULSA performance in top 20% of companies reviewed

Unilever’s Impact on consumers
Creation of trusted brands
Introduction of innovative products
Appeal to all consumer segments
Widespread distribution networks
Linkage of products to broader social goals
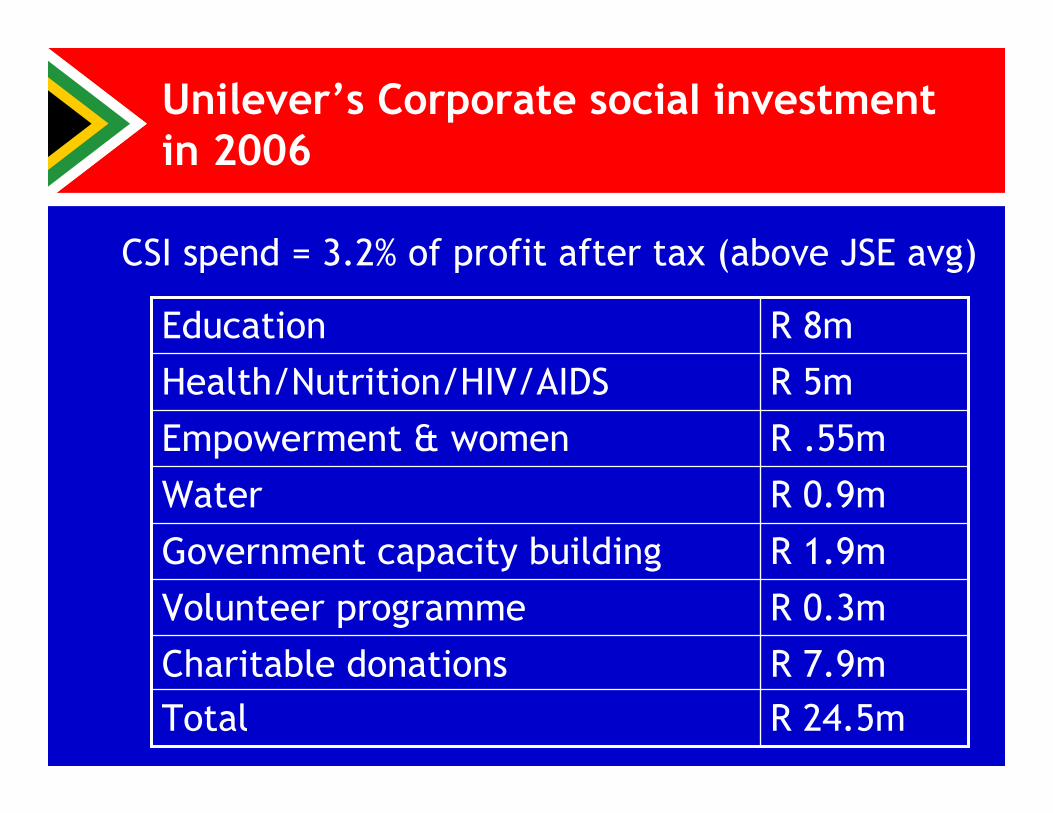
Unilever’s Corporate sociaI investment
in 2006
R 24.5mTotal
R 7.9mCharitable donations
R 0.3mVolunteer programme
R 1.9mGovernment capacity building
R 0.9mWater
R .55mEmpowerment & women
R 5mHealth/Nutrition/HIV/AIDS
R 8mEducation
CSI spend = 3.2% of profit after tax (above JSE avg)

Unilever’s environmental strategy
g Company and Suppliers required to comply with national environmental legislation: Unilever has won several awards in RSA for environmental performance
g Unilever South Africa required to comply with Unilever PLC environmental standards
g CSI funds used to support environmental protection
g Local factories also have their community-based environmental intitiatives

Unilever’s emissions in S Africa
0
20
40
60
80
100
120
140
160
1997 1998 1999 2000 2001 2002 2003 2004 2005 2006
Energy GJ/tonne CO2 Kg/tonne
Water m3/tonne Boiler SOX kg/tonne
1997 = 100

Report’s Recommendations to Unilever
South Africa
g Work with suppliers to promote their competitiveness
g Ensure provision of top-notch training
g Consider more targeted CSI programme
g Reduce environmental footprint, especially packaging waste
g Conduct more R&D in RSA
g Dialogue with government and other stakeholders to support a policy environment that promotes private sector investment

And for the future...
g Generate more comparative data to assess company’s
relative performance
g Support research on effects of modernization of RSA
economy on traditional sectors (eg small retailers) and
associated impacts on job creation, etc
g Support research on costs and benefits of local vs.
global sourcing (and outsourcing)
g THANK YOU!