Embed Size (px)
Citation preview
Un i ve r s i t y o f Kons t an z Depa r tmen t o f E c onom i c s
Measuring the Value of Research:
A Generational Accounting Approach
Robert Hofmeister
http://www.wiwi.uni-konstanz.de/workingpaperseries
Working Paper Series 2011-07
Measuring the Value of Research:A Generational Accounting Approach
Robert Hofmeister∗
Department of EconomicsUniversity of Konstanz
May 2, 2011
Abstract
This paper proposes a generational accounting approach to valuatingresearch. Based on the flow of scientific results, a value-added (VA) indexis developed that can, in principle, be used to assign a monetary value toany research result and, by aggregation, on entire academic disciplines orsub-disciplines. The VA-index distributes the value of all applications thatembody research to the works of research which the applications directly relyon, and further to the works of research of previous generations which theauthors of the immediate reference sources have directly or indirectly madeuse of. The major contribution of the VA-index is to provide a measureof the value of research that is comparable across academic disciplines. Toillustrate how the generational accounting approach works, I present a VA-based journal rating and a rating of the most influential recent journalarticles in the field of economics.
Keywords: Research evaluation, research accounting, journal ranking, cita-tions.
JEL Classification Numbers: A13, A14, I23.
∗I am grateful to Arye Hillman, Matthias Krapf, and Heinrich Ursprung for valuable com-ments and discussions. I also thank participants of the workshop on “Measurement and Evalu-ation of Academic Research Performance” in Braga, Portugal, 2010.
1 Introduction
Wilhelm Conrad Röntgen discovered the X-rays (in German referred to as Rönt-gen rays) on 8 November 1895. He observed that the rays illuminated a fluorescentscreen and noted that placing an object between the screen and the source emit-ting the rays reduced the effect but did not fully stop it. Röntgen published hisfirst results on X-rays in the very last days of 1895. In this publication, Röntgenmentioned that photographic plates are sensitive to X-rays and that he had pro-duced pictures of various objects, including a photograph showing the bones ofhis wife’s hand. This news spread so fast, that the first radiological laboratoriesopened already in March 1896, only a few months after Röntgen’s publication.1
In 1901 Röntgen received the very first Nobel Prize in physics “in recognition ofthe extraordinary services he has rendered by the discovery of the remarkable rayssubsequently named after him”.2
The discovery of the X-rays illustrates how research benefits mankind, namelythrough applications. The use of X-rays improved the quality of medical treat-ment. Subsequent research has increased the value of X-rays further, by allowingfor higher quality pictures, lower radiation and additional applications such asX-ray computed tomography. Although Röntgen’s work constitutes only a smallfraction of the research on X-rays that has been carried out ever since, his con-tribution left its imprint on any subsequent piece of research: X-ray computedtomography and other subsequent applications profess Röntgen’s legacy. Thevalue of Röntgen’s discovery for mankind thus derives from direct and indirectcontributions.
Alfred Nobel wanted his prize to be awarded “to those who, during the pre-ceding year, shall have conferred the greatest benefit on mankind.” Awardingcommittees are therefore obliged to assess the overall impact of a researcher’swork on welfare. It is thereby not important whether the honored research gen-erates direct valuable applications, as in the case of the X-rays, or whether suchapplications are likely to be forthcoming after further research and developmentas it was the case with regard to Einstein’s theory of relativity. What is supposedto count for winning the Nobel Prize is that research will eventually give rise toapplications, thereby improving the human condition.
Although the Nobel Prize is the highest distinction in science today, AlfredNobel’s selection criterion plays almost no role when it comes to judging less
1see Glasser (1995) and the reprint of Röntgen’s original publication in Glasser (1995).2Nobel Prize homepage (http://nobelprize.org/nobel_prizes/physics/laureates/1901/rontgen.html)
2
outstanding research. Evaluations of researchers nowadays measure a scientist’sresearch performance in terms of citations to his or her work, the number of pub-lished papers, the outlets in which he or she has published, or some combinationthereof. These criteria, however, provide no information on the intrinsic value ofresearch since they measure only the creation of knowledge per se and not nec-essarily the direct or indirect creation of social welfare. The informative value oftraditional research performance indices is thus limited, i.e. these indices are nothelpful in guiding the science system towards an efficient use of research time andfunds.
One of the arguably most important issues in research policy is to determinethe overall amount invested in basic and applied research and to distribute thesefunds across the various disciplines and specific fields of investigation. The com-position of the public research budget is however in large parts historically de-termined and, moreover, subject to rent-seeking activities. It would therefore besurprising if the marginal return of research, for example, in quantum physicswould be the same as in archeology.
This study proposes a research performance indicator that can, in principle (i.e.if the required information is acquired), provide researchers, managers of researchinstitutions, and politicians in charge of research policy with an instrument thatmeasures how efficiently scarce resources are used in the science system. Beforepresenting the basic idea of this indicator, I briefly survey the state of the artof research evaluation in order to show why the existing research performanceindicators fail to assess the relative contribution of different scientific disciplinestowards generating social welfare benefits.
Traditional measures of research production
Citations represent the basic ingredient of all traditional measures of research per-formance. It is therefore not surprising that the most frequently mentioned obsta-cle to comparing research productivity across disciplines consists in differences indiscipline-specific citation habits. In particular the number of studies referencedin the average research item varies a great deal across disciplines. Standardiz-ing indicators based on citation counts by normalizing discipline averages doesof course not solve the problem as it renders all disciplines equally important bydefinition.
Instead of normalizing research indicators ex post, one can control for referenceintensity when calculating an indicator. In practice these two approaches produce
3
different results, because of cross-citations between fields. Such interdisciplinarycitation flows can be used to illustrate how research is influenced by differentfields. The invariant method developed by Pinski and Narin (1976), for example,is a method to measuring journal quality that corrects for reference intensity,i.e. it corrects for the average number of references per study across disciplines.3
In addition, the invariant method also weights citations according to the qualityof the citing source. Palacios-Huerta and Volij (2004) show that the invariantmethod is the only method satisfying a set of desirable properties. This axiomaticfoundation has certainly greatly contributed to establishing the invariant methodas the state-of-the-art method of rating journals.
The quality weights that result from applying the invariant method to a set ofjournals measure the “intellectual influence” (Palacios-Huerta and Volij, 2004) ofa research outlet, i.e. a journal’s quality weight represents the journal’s relativeimportance for subsequent research. Ritzberger (2008), for example, ranks eco-nomics journals using the invariant method. He finds that business-related fieldsrank significantly lower than other sub-fields of economics. This finding is due tothe fact that business-related research is more applied and therefore contributesless input for subsequent research than more theoretical research. Consequently,the invariant method ranks applied journals systematically lower than journalsspecializing in publishing theoretical results or new research methods. Knowledgeand utility are, however, two distinct concepts which do not need to coincide. Itis therefore an open question whether the relatively poor performance of down-stream journals also holds in terms of utility.
It has repeatedly been stressed that there are many ways of evaluating researchand that the selection of a specific evaluation method is often rather arbitrary.4
Assessing research in terms of utility restricts this arbitrariness. Utility is, forexample, independent of the prevailing citation habits. Invariance to referenceintensity is thus not only a nice theoretical concept, it is an indispensable con-stituent of any utility based research assessment.
The basic idea of the VA-index
I now return to fleshing out the general idea of measuring research productivity bytracing, generation by generation, social welfare gains to their intellectual sources.
3The invariant method is also at the heart of Google’s search algorithm.4see, among others, Palacios-Huerta and Volij (2004), Kóczy and Strobel (2010), and Raval-
lion and Wagstaff (2010)
4
The purpose of research is not to have a direct effect on social welfare, but toprovide insights to politicians, entrepreneurs and the individual how to achievehigher welfare. Research is thus an investment into future utility. Different re-search fields will, typically, affect different aspects of utility. Allocating resourcesin academia is, therefore, a classical investment decision in which preferences playa role. A rational decision maker needs to maximize his or her expected utility,given his or her information. To do so efficiently, a decision maker needs to knowhow research maps into utility.
Understanding how research affects utility goes beyond knowing in which fieldsapplications emerge and how valuable these applications are. By restricting adiscipline’s relevance to applications, one ignores, for example, the fundamentalcontribution of mathematics to almost all disciplines. What one really needs tounderstand is how applications emerge, i.e. who contributed how much to thecreation of a particular application.
Reconsider X-ray computed tomography, which was developed by Allan M.Cormack and Godfrey N. Hounsfield. Cormack and Hounsfield received the No-bel Prize in Physiology or Medicine in 1979. Besides Cormack and Hounsfield,Wilhelm C. Röntgen certainly also has an intellectual share in the creation of X-ray computed tomography. Moreover, Röntgen did not discover X-rays out of theblue: he relied on earlier research. More so, Cormack and Hounsfield relied notonly on Röntgen’s work, but also on other findings. The intellectual achievementof X-ray computed tomography is, therefore, not one of Cormack and Hounsfieldalone, but one of numerous researchers, Röntgen included. The intellectual creditof X-ray computed tomography and all other inventions thus belongs to numerousresearchers. Understanding how research maps into utility means to understandhow and how much the individual idea has contributed to applications and thusto utility.
In the following I propose a generational accounting approach, that identifiesthe intellectual sources of research generated welfare. Moreover, this approachmeasures the intellectual influence of any research result on other research resultsand assigns the parent result a corresponding share of influence. The accountingfeature of this method is that all shares of influence of a research result add up toone. The sources of intellectual contribution are thus exactly identified, measured,and distributed.
The proposed method allows to assess research performance in terms of utilityby combining the value of applications with the corresponding shares of researchinfluence. Measuring the value of applications is unfortunately way beyond the
5
scope of this paper. Nederhof and Meijer (1995) argue that research does notimprove living conditions directly, but that research results need to be transferredto users outside the science system to generate useful applications. Transferringknowledge to users outside the science system can therefore be regarded as finalproduct of any scientific endeavor. The raison d’être of the VA-index is to identifythe sources of value created by scientist for a given valuation of the observedresearch transfers.
The next section presents the theoretical concept of the VA-index. I alsodiscuss some problems of applying the method to existing data. Section threepresents a first implementation for economics, albeit a purely bibliometric one,since we do not have, so far, data on research transfer and a convincing exoge-nous measure for the value of applications. The bibliometric application rankseconomics journals and individual articles published in the 1986-2004 period ac-cording to their respective influence on subsequent economic research. Sectionfour concludes.
2 Research accounting
The VA-index is designed to measure the contribution of individual research re-sults to the creation of value, i.e. to the utility accruing to the users of applica-tions that embody these research results. The idea of the VA-index rests on theinsight that research production requires research as one of its main productionfactors and this production process can be investigated and portrayed with stan-dard economic techniques. In this respect the VA-index follows the basic idea ofendogenous growth theory (see, for example, Romer, 1990).
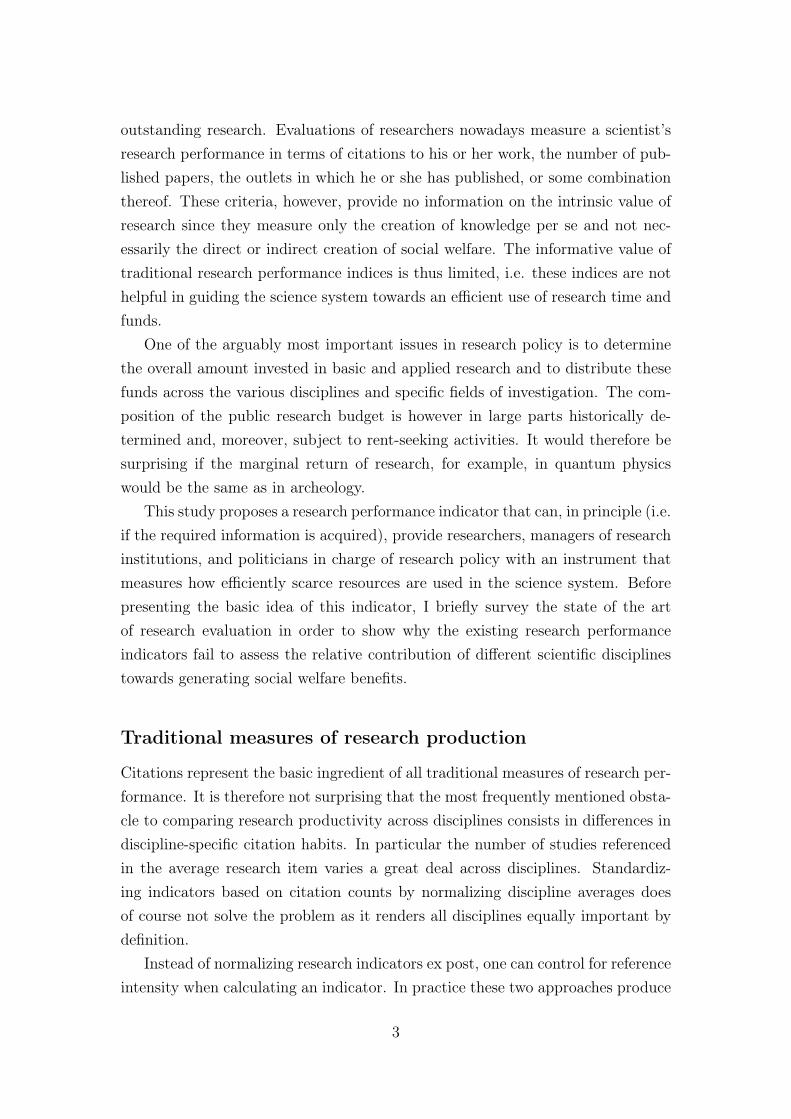
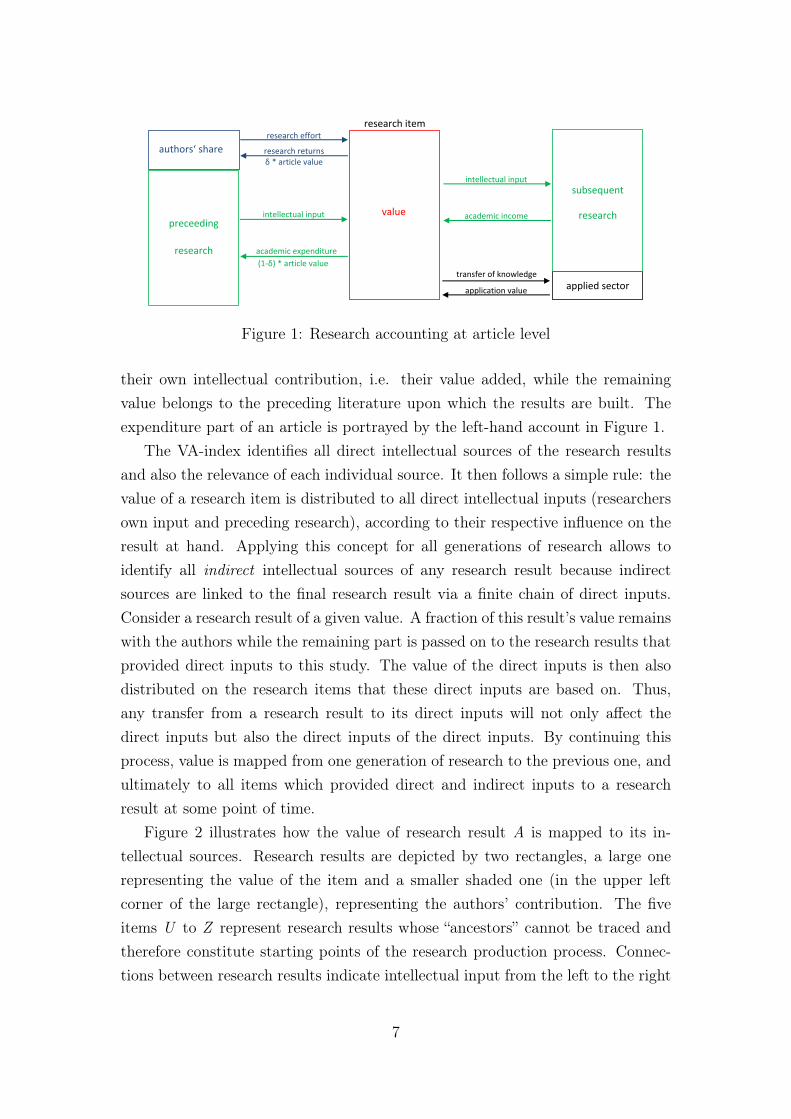
Research provides two kinds of services: transfer of knowledge to the appliedsector and intellectual input into further research. Transfer of knowledge to theapplied sector constitutes the final product of academic research, i.e. the output.Intellectual input into further research, on the other hand, is an intermediategood in the production of knowledge. The value or revenue generated by researchresults thus depends on the knowledge transferred to the applied sector and on itscontribution to subsequent research. The intellectual revenue of a research resultis illustrated with the help of the right-hand account in Figure 1.
Research relies on previous research results. Stigler and Friedland (1975), forexample, refer to citations as “a form of intellectual collaboration”. Researcherscan therefore only claim a fraction δ of the value of their research results as
6
value
applied sector
subsequent
research
transfer of knowledge
application value
intellectual input
academic income
research item
authors‘ share
preceeding
research
intellectual input
academic expenditure
(1-δ) * article value
research effort
research returns
δ * article value
Figure 1: Research accounting at article level
their own intellectual contribution, i.e. their value added, while the remainingvalue belongs to the preceding literature upon which the results are built. Theexpenditure part of an article is portrayed by the left-hand account in Figure 1.
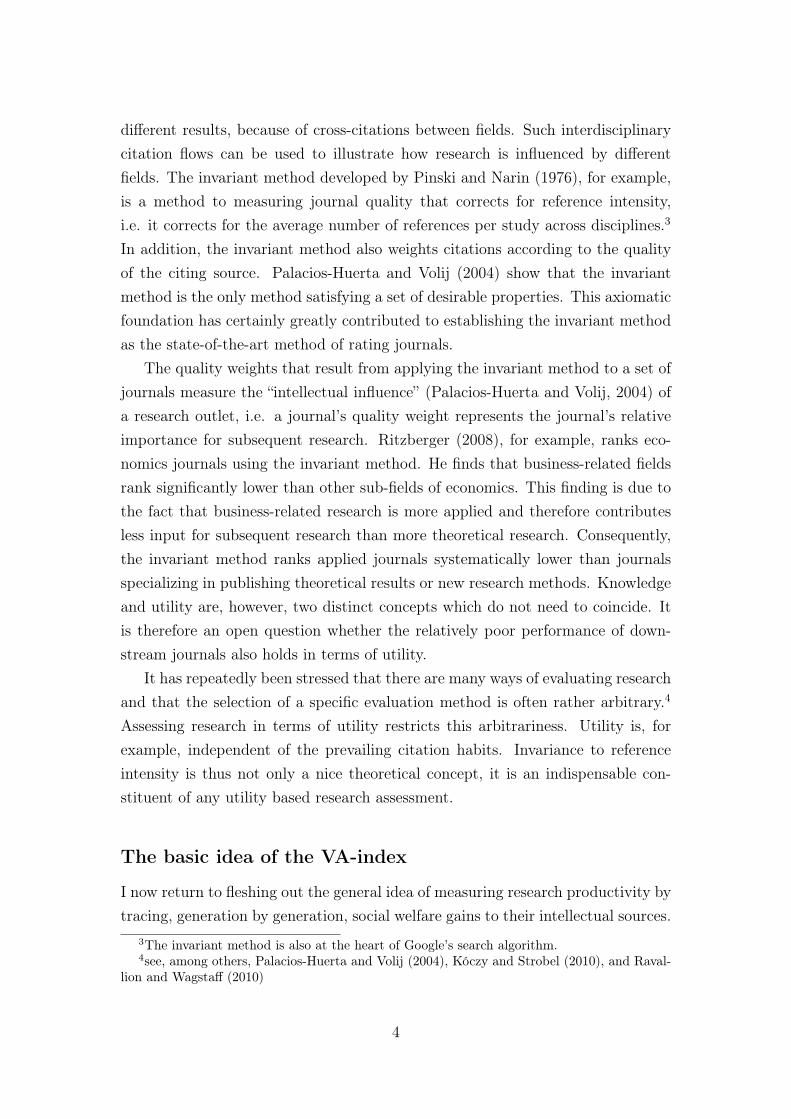
The VA-index identifies all direct intellectual sources of the research resultsand also the relevance of each individual source. It then follows a simple rule: thevalue of a research item is distributed to all direct intellectual inputs (researchersown input and preceding research), according to their respective influence on theresult at hand. Applying this concept for all generations of research allows toidentify all indirect intellectual sources of any research result because indirectsources are linked to the final research result via a finite chain of direct inputs.Consider a research result of a given value. A fraction of this result’s value remainswith the authors while the remaining part is passed on to the research results thatprovided direct inputs to this study. The value of the direct inputs is then alsodistributed on the research items that these direct inputs are based on. Thus,any transfer from a research result to its direct inputs will not only affect thedirect inputs but also the direct inputs of the direct inputs. By continuing thisprocess, value is mapped from one generation of research to the previous one, andultimately to all items which provided direct and indirect inputs to a researchresult at some point of time.
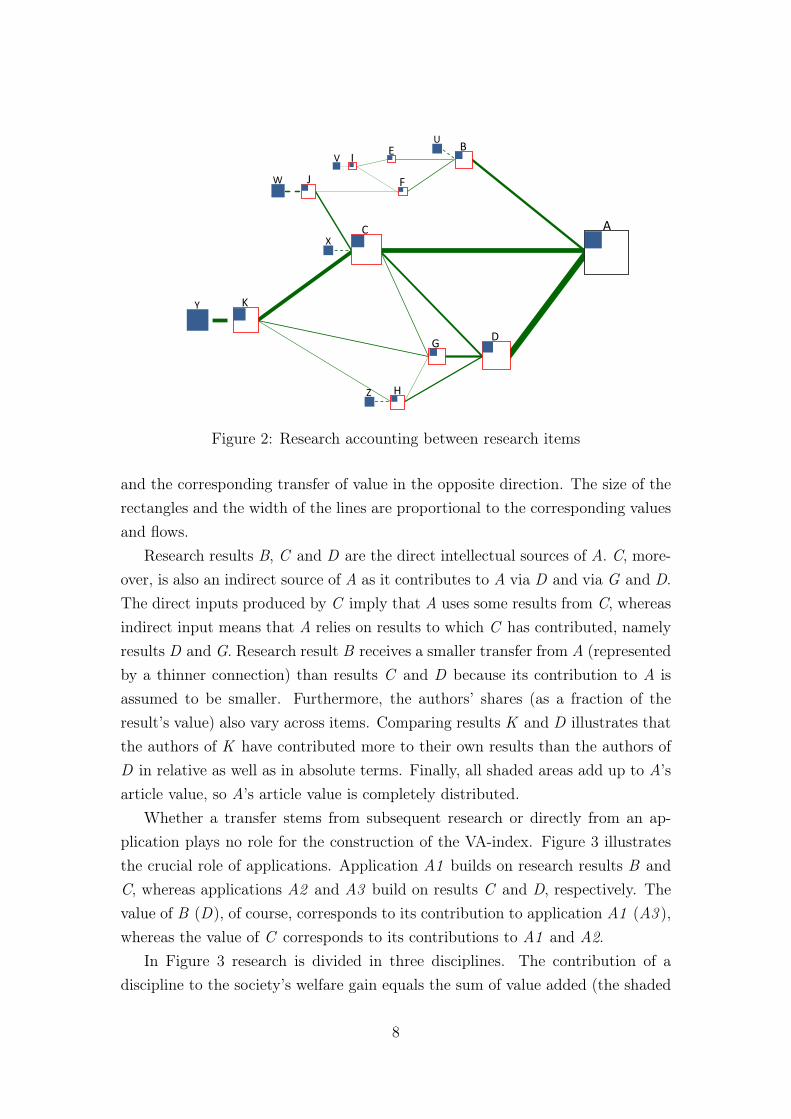
Figure 2 illustrates how the value of research result A is mapped to its in-tellectual sources. Research results are depicted by two rectangles, a large onerepresenting the value of the item and a smaller shaded one (in the upper leftcorner of the large rectangle), representing the authors’ contribution. The fiveitems U to Z represent research results whose “ancestors” cannot be traced andtherefore constitute starting points of the research production process. Connec-tions between research results indicate intellectual input from the left to the right
7
A
B
C
D
E
F
G
H
I
J
K
U
V
W
X
Y
Z
Figure 2: Research accounting between research items
and the corresponding transfer of value in the opposite direction. The size of therectangles and the width of the lines are proportional to the corresponding valuesand flows.
Research results B, C and D are the direct intellectual sources of A. C, more-over, is also an indirect source of A as it contributes to A via D and via G and D.The direct inputs produced by C imply that A uses some results from C, whereasindirect input means that A relies on results to which C has contributed, namelyresults D and G. Research result B receives a smaller transfer from A (representedby a thinner connection) than results C and D because its contribution to A isassumed to be smaller. Furthermore, the authors’ shares (as a fraction of theresult’s value) also vary across items. Comparing results K and D illustrates thatthe authors of K have contributed more to their own results than the authors ofD in relative as well as in absolute terms. Finally, all shaded areas add up to A’sarticle value, so A’s article value is completely distributed.
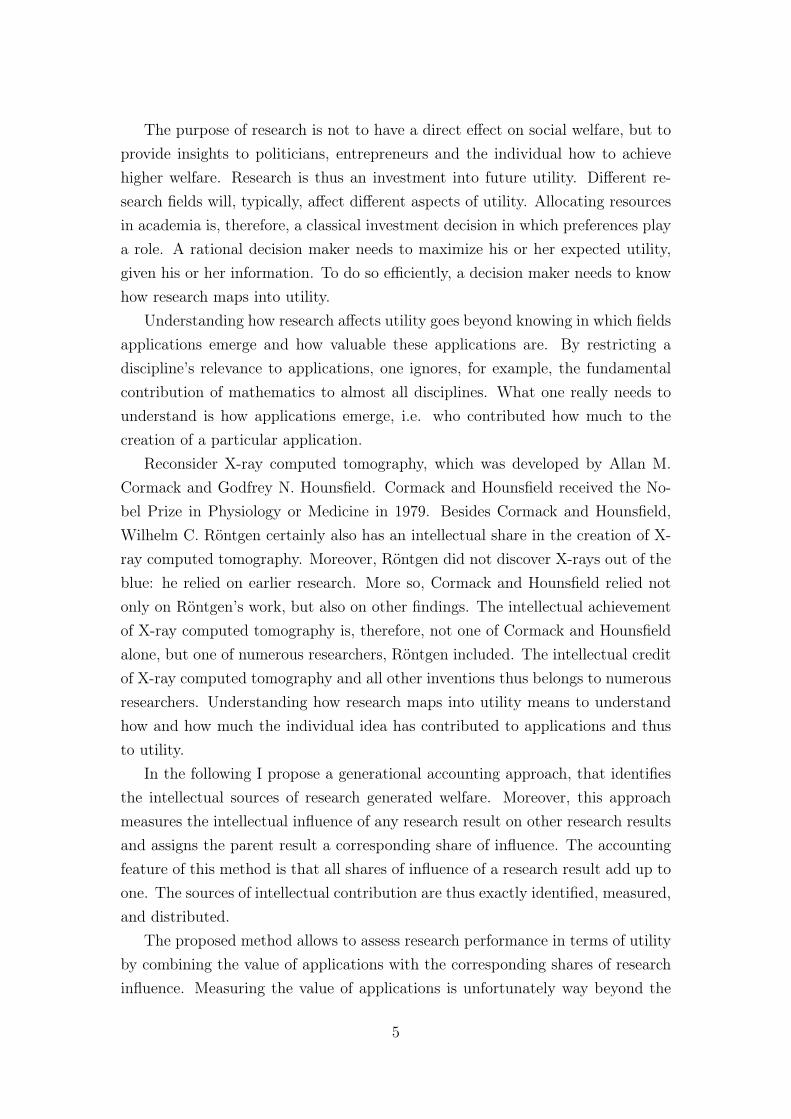
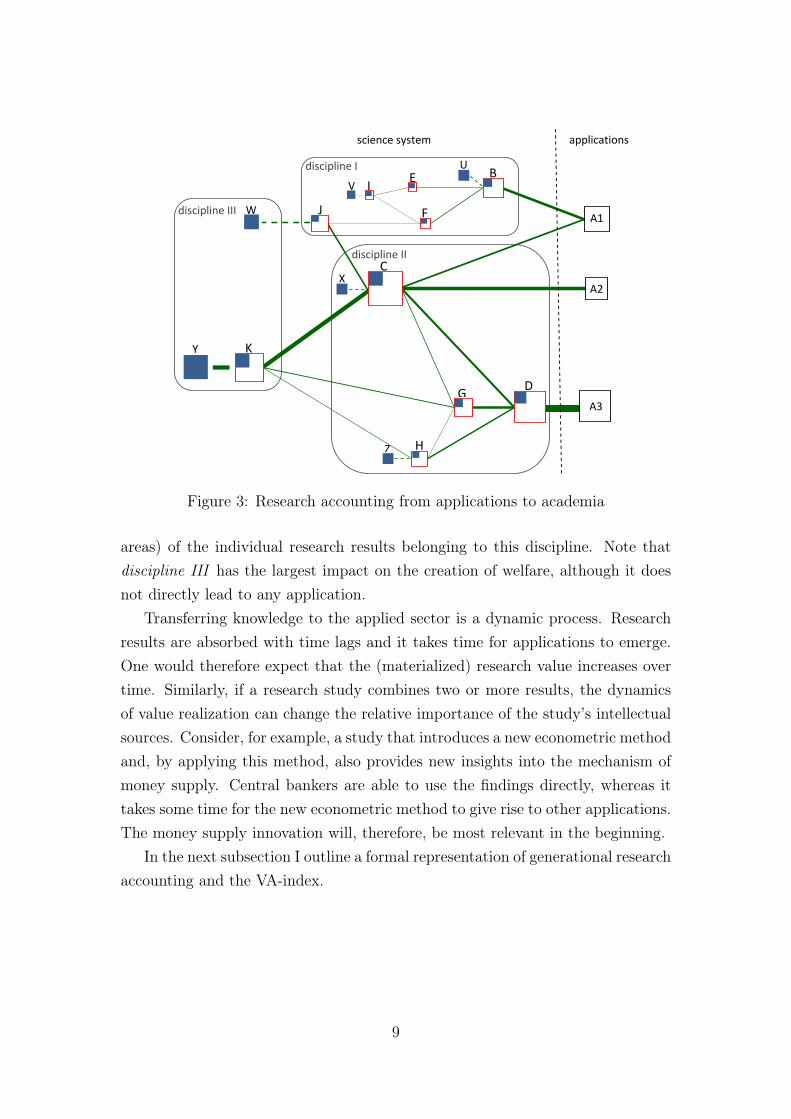
Whether a transfer stems from subsequent research or directly from an ap-plication plays no role for the construction of the VA-index. Figure 3 illustratesthe crucial role of applications. Application A1 builds on research results B andC, whereas applications A2 and A3 build on results C and D, respectively. Thevalue of B (D), of course, corresponds to its contribution to application A1 (A3 ),whereas the value of C corresponds to its contributions to A1 and A2.
In Figure 3 research is divided in three disciplines. The contribution of adiscipline to the society’s welfare gain equals the sum of value added (the shaded
8
B
C
D
E
F
G
H
I
J
K
U
V
W
X
Y
Z
A1
A2
A3
applicationsscience system
discipline I
discipline III
discipline II
Figure 3: Research accounting from applications to academia
areas) of the individual research results belonging to this discipline. Note thatdiscipline III has the largest impact on the creation of welfare, although it doesnot directly lead to any application.
Transferring knowledge to the applied sector is a dynamic process. Researchresults are absorbed with time lags and it takes time for applications to emerge.One would therefore expect that the (materialized) research value increases overtime. Similarly, if a research study combines two or more results, the dynamicsof value realization can change the relative importance of the study’s intellectualsources. Consider, for example, a study that introduces a new econometric methodand, by applying this method, also provides new insights into the mechanism ofmoney supply. Central bankers are able to use the findings directly, whereas ittakes some time for the new econometric method to give rise to other applications.The money supply innovation will, therefore, be most relevant in the beginning.
In the next subsection I outline a formal representation of generational researchaccounting and the VA-index.
9
Formal description
Let Γ be the set of intellectual contributions at a given point of time and let Γ
comprise a total of N research results (items).The value vi of item i is split between the item’s own contribution amounting
to the fraction δi of the value and the contribution to the preceding literature thatreceives, via transfers, the remaining value in return for its intellectual input.
Let ci→j denote the value of the direct intellectual input provided by item j toitem i and the corresponding value transfer from i to j; ci→i is zero by definition.The vector ci = (ci→1 . . . ci→N) collects all direct inputs provided to item i. Thetransfer matrix C = (c1; c2; . . . ; cN) describes all inputs and thus accounts for allinter-generational transfers of value added.
When mapping value transfers across many generations of items, it is conve-nient to work with transfers in relative terms. The share of total value of itemi transferred to item j is given by di→j ≡ ci→j/vi. By construction
∑Nj=1 di→j =
1 − δi, since the authors’ contribution δi is not passed further on. Moreover, letdi = (di→1 . . . di→N), D = (d1; d2; . . . ; dN) and ai→j be a dummy variable as-suming the value 1 if research result j contributes to research result i (ci→j > 0)and ai→j = 0 otherwise.
An indirect link of order q connecting item i to item j is a chainai→k1 ak1→k2 . . . akq→j, with no zeros.5 That is, an indirect link of order q is alink passing through q generations of research results.
Note that research results can be linked through many different chains orpaths connecting item i with item j. For example items A and K in Figure 2 areindirectly linked of order 1 via A → C → K, of order 2 via A → D → C → K,A → D → G → K and A → D → H → K, and of order 3 via A → D → G →C → K and A→ D → G→ H → K.
Indirect links reveal the channels through which research results affect eachother. The order of an indirect link indicates the importance of the link. Thehigher the order of a link, the smaller is the value passing through this channel,because each generation of items between the two ends keeps a fraction of value.
The share of indirect transfer via a link of order q ≥ 1 between item i and5Formally, if i = k0 and j = kq+1, then an indirect link of order q between i and j via
k1, . . . , kq exists, if∏q
n=0 akn→kn+1= 1.
10
item j is given by
idi→j,q = idi→1,q−1 d1→j + . . .+ idi→N,q−1 dN→j
=N∑k=1
idi→k,q−1 dk→j. (1)
Adding over all research results in Γ implies that all potential paths are takeninto account. Because a share δk of value at level q − 1 remains with the con-tributing research result, only the remaining fraction is passed on. Direct trans-fers are indirect transfers of order zero, i.e. idi→j,0 ≡ di→j(1− δi). Finally, defineidi,q = (idi→1 . . . idi→N) and IDq = (id1,q; . . . ; idN,q).
Using the concept of indirect transfers, one can express the transfer of valuefrom applications to their intellectual sources and the resulting measures of value-added in the following manner:
va = ∆
[u +
Q∑q=0
ID′qu
], (2)
where va is the resulting vector of value added, ∆ is a diagonal matrix with theindividual δs on the main diagonal, u is the utility gain deriving from each item’sknowledge transfer to the applied sector, and Q is the order of the longest indirectlink.
va is a measure of valuation of individual research results. Based on thismeasure one can derive (1) valuations of individual scientists, (2) entire researchunits, (3) evaluations of journal quality, and (4) evaluations of entire disciplines.
The contribution of an arbitrary research entity e is given by:
vae =∑i∈E
vai ∗ si,e, (3)
where E is the set of research projects which entity e was involved in, and si,e
captures the entity’s share in result i. If a result has three authors, each of themmight be credited by s = 1
3.
Since the creation of research results and the creation of the utility relatedto these results are separated in time, the costs and benefits are not directlycomparable. One therefore my want to account for time preferences by addinga discount factor to equation 3. Discounting valuations is also appropriate when
11
comparing different disciplines. Suppose an average result in mathematics hasa larger impact on welfare than a result in economics. If the average impacttime in mathematics is much longer than in economics, the effective returns frommathematics can actually be smaller than those from economics.6
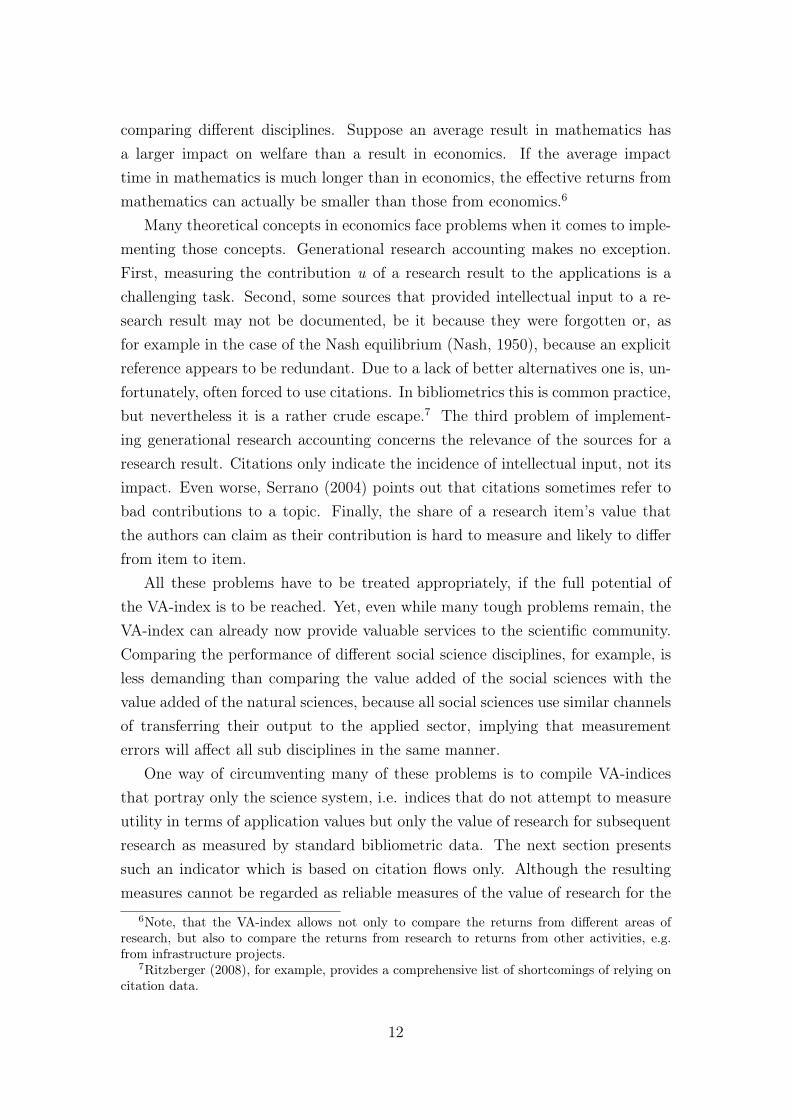
Many theoretical concepts in economics face problems when it comes to imple-menting those concepts. Generational research accounting makes no exception.First, measuring the contribution u of a research result to the applications is achallenging task. Second, some sources that provided intellectual input to a re-search result may not be documented, be it because they were forgotten or, asfor example in the case of the Nash equilibrium (Nash, 1950), because an explicitreference appears to be redundant. Due to a lack of better alternatives one is, un-fortunately, often forced to use citations. In bibliometrics this is common practice,but nevertheless it is a rather crude escape.7 The third problem of implement-ing generational research accounting concerns the relevance of the sources for aresearch result. Citations only indicate the incidence of intellectual input, not itsimpact. Even worse, Serrano (2004) points out that citations sometimes refer tobad contributions to a topic. Finally, the share of a research item’s value thatthe authors can claim as their contribution is hard to measure and likely to differfrom item to item.
All these problems have to be treated appropriately, if the full potential ofthe VA-index is to be reached. Yet, even while many tough problems remain, theVA-index can already now provide valuable services to the scientific community.Comparing the performance of different social science disciplines, for example, isless demanding than comparing the value added of the social sciences with thevalue added of the natural sciences, because all social sciences use similar channelsof transferring their output to the applied sector, implying that measurementerrors will affect all sub disciplines in the same manner.
One way of circumventing many of these problems is to compile VA-indicesthat portray only the science system, i.e. indices that do not attempt to measureutility in terms of application values but only the value of research for subsequentresearch as measured by standard bibliometric data. The next section presentssuch an indicator which is based on citation flows only. Although the resultingmeasures cannot be regarded as reliable measures of the value of research for the
6Note, that the VA-index allows not only to compare the returns from different areas ofresearch, but also to compare the returns from research to returns from other activities, e.g.from infrastructure projects.
7Ritzberger (2008), for example, provides a comprehensive list of shortcomings of relying oncitation data.
12
society at large, one can gain from this exercise first insights into how the VA-indexperforms as compared to other bibliometric measures of research performance.
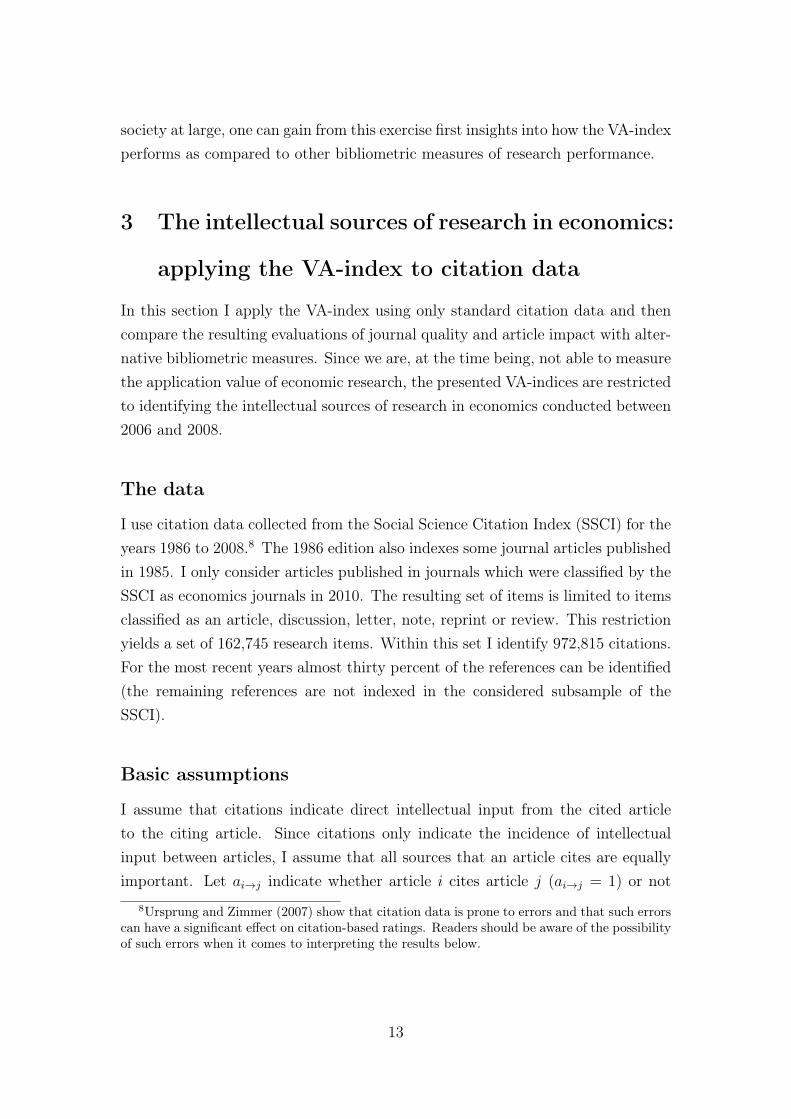
3 The intellectual sources of research in economics:
applying the VA-index to citation data
In this section I apply the VA-index using only standard citation data and thencompare the resulting evaluations of journal quality and article impact with alter-native bibliometric measures. Since we are, at the time being, not able to measurethe application value of economic research, the presented VA-indices are restrictedto identifying the intellectual sources of research in economics conducted between2006 and 2008.
The data
I use citation data collected from the Social Science Citation Index (SSCI) for theyears 1986 to 2008.8 The 1986 edition also indexes some journal articles publishedin 1985. I only consider articles published in journals which were classified by theSSCI as economics journals in 2010. The resulting set of items is limited to itemsclassified as an article, discussion, letter, note, reprint or review. This restrictionyields a set of 162,745 research items. Within this set I identify 972,815 citations.For the most recent years almost thirty percent of the references can be identified(the remaining references are not indexed in the considered subsample of theSSCI).
Basic assumptions
I assume that citations indicate direct intellectual input from the cited articleto the citing article. Since citations only indicate the incidence of intellectualinput between articles, I assume that all sources that an article cites are equallyimportant. Let ai→j indicate whether article i cites article j (ai→j = 1) or not
8Ursprung and Zimmer (2007) show that citation data is prone to errors and that such errorscan have a significant effect on citation-based ratings. Readers should be aware of the possibilityof such errors when it comes to interpreting the results below.
13
(ai→j = 0), i.e.
ai→j =
{1 if ci→j > 0
0 if ci→j = 0.
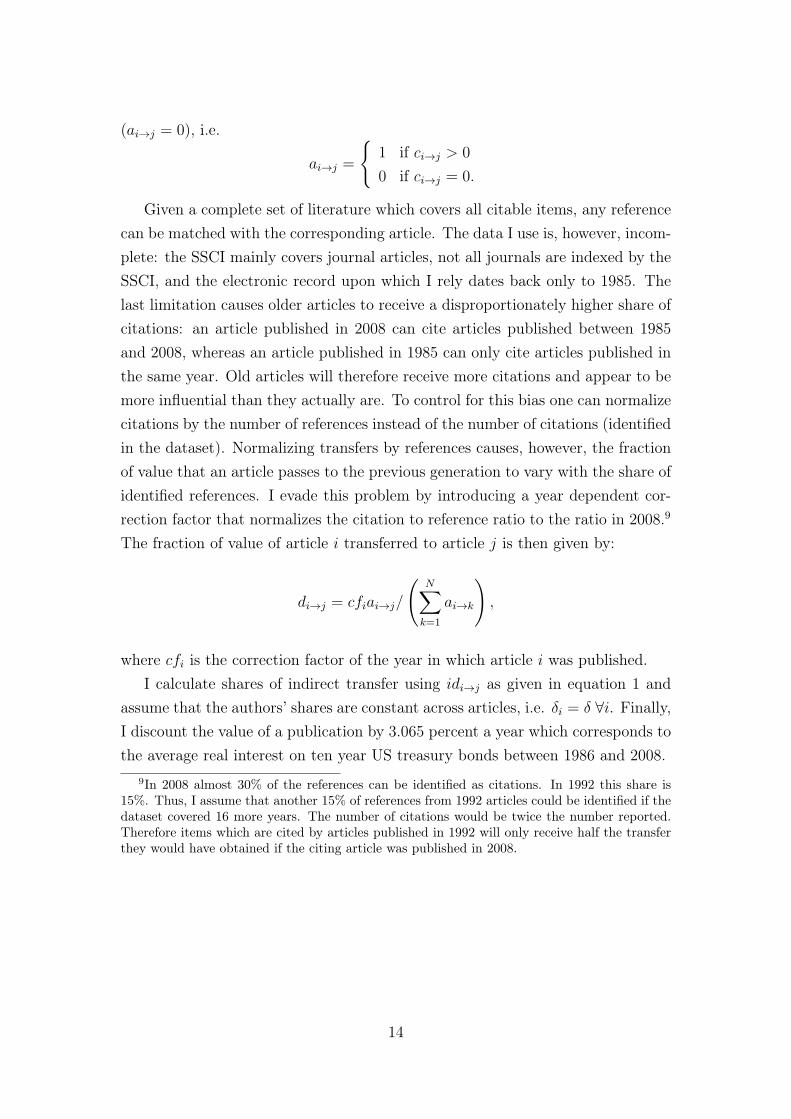
Given a complete set of literature which covers all citable items, any referencecan be matched with the corresponding article. The data I use is, however, incom-plete: the SSCI mainly covers journal articles, not all journals are indexed by theSSCI, and the electronic record upon which I rely dates back only to 1985. Thelast limitation causes older articles to receive a disproportionately higher share ofcitations: an article published in 2008 can cite articles published between 1985and 2008, whereas an article published in 1985 can only cite articles published inthe same year. Old articles will therefore receive more citations and appear to bemore influential than they actually are. To control for this bias one can normalizecitations by the number of references instead of the number of citations (identifiedin the dataset). Normalizing transfers by references causes, however, the fractionof value that an article passes to the previous generation to vary with the share ofidentified references. I evade this problem by introducing a year dependent cor-rection factor that normalizes the citation to reference ratio to the ratio in 2008.9
The fraction of value of article i transferred to article j is then given by:
di→j = cfiai→j/
(N∑k=1
ai→k
),
where cfi is the correction factor of the year in which article i was published.I calculate shares of indirect transfer using idi→j as given in equation 1 and
assume that the authors’ shares are constant across articles, i.e. δi = δ ∀i. Finally,I discount the value of a publication by 3.065 percent a year which corresponds tothe average real interest on ten year US treasury bonds between 1986 and 2008.
9In 2008 almost 30% of the references can be identified as citations. In 1992 this share is15%. Thus, I assume that another 15% of references from 1992 articles could be identified if thedataset covered 16 more years. The number of citations would be twice the number reported.Therefore items which are cited by articles published in 1992 will only receive half the transferthey would have obtained if the citing article was published in 2008.
14
3.1 Rating journal quality
The invariant method
Evaluating journal quality on the basis of citations has been popular among sci-entists ever since Garfield (1972) proposed the journal impact factor. While theimpact factor considers only the number of citations, Liebowitz and Palmer (1984)proposed to take the citing journal’s quality into account. The invariant methoddeveloped by Pinski and Narin (1976) controls not only for citation quality butalso for reference intensity, i.e. the number of items an article refers to. Palacios-Huerta and Volij (2004) establish the invariant method as current the state-of-the-art method to rate journals by showing that the invariant method is the onlymethod that satisfies a set of desirable properties.
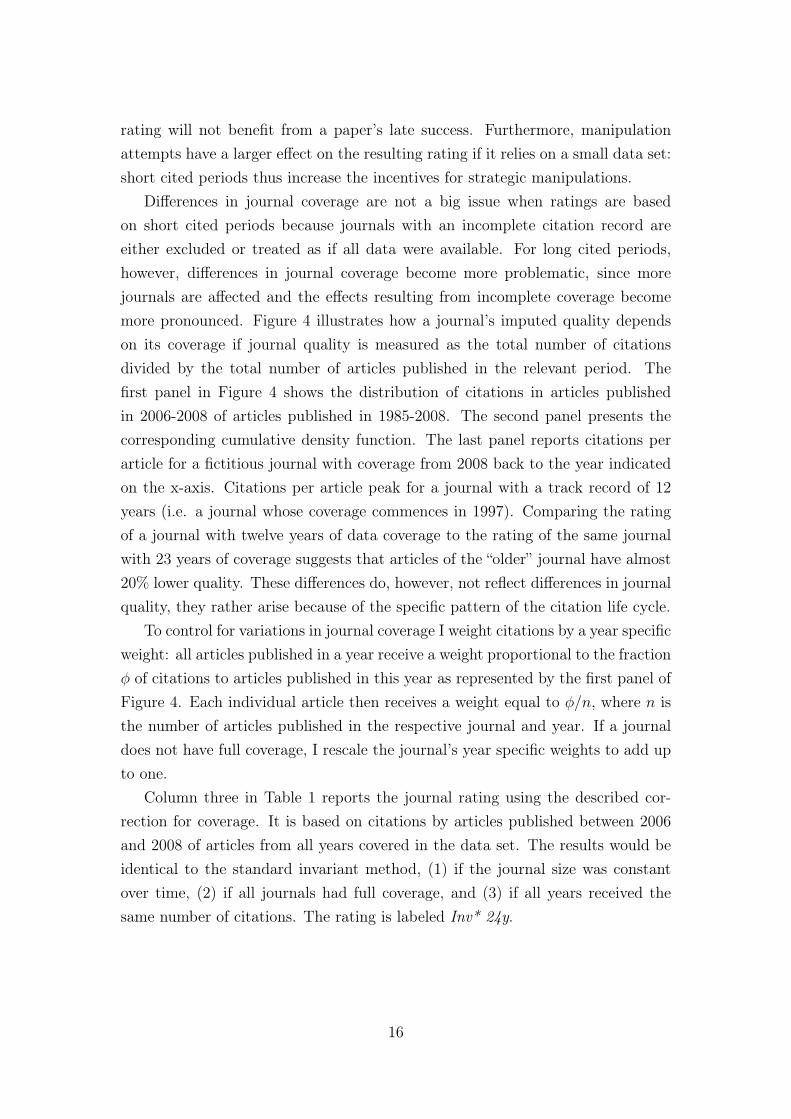
I therefore regard the invariant method to represent the natural benchmarkfor the VA-index. Invariant quality weights of those journals which have had fullcoverage in the SSCI between 2002 and 2008 are reported in the second columnof Table 4 in the appendix. Table 1 below presents a selection of the top-rankedjournals. In contrast to most other applications of the invariant method, I controlfor reference intensity at the article level and not at the aggregate journal level.Palacios-Huerta and Volij (2004) point out that controlling for reference inten-sity at the article level gives an equal vote to each article in a journal, whereascontrolling for reference intensity at the journal level causes articles to receive adisproportional high (low) weight if they have relatively many (few) references.The citing and the cited period are both 2006-2008. I omit self-citations at thelevel of journals, because some journals, for whatever reasons, show excessive ratesof self-citations. The resulting rating with the three year window 2006-2008 is la-beled Inv 3y. Journal weights are normalized so that the top journal has a scoreof 100.
The journal rating Inv 3y corresponds to the state of the art in bibliometrics,but it is nevertheless not the best rating of the invariant type. In the following Iwill elaborate on the shortcomings of the standard invariant rating and present asuperior invariant rating.
Journal ratings usually rely on rather short cited periods.10 Limiting the citedperiod gives, however, editors and thereby researchers an incentive to focus onhot topics which are likely to attract citations quickly. Promising research, whichis however not en vogue, is more likely to remain unpublished, since the journal’s
10Palacios-Huerta and Volij (2004) use seven years, Kalaitzidakis, Mamuneas, and Stengos(2003) five years and Ritzberger (2008) three years
15
rating will not benefit from a paper’s late success. Furthermore, manipulationattempts have a larger effect on the resulting rating if it relies on a small data set:short cited periods thus increase the incentives for strategic manipulations.
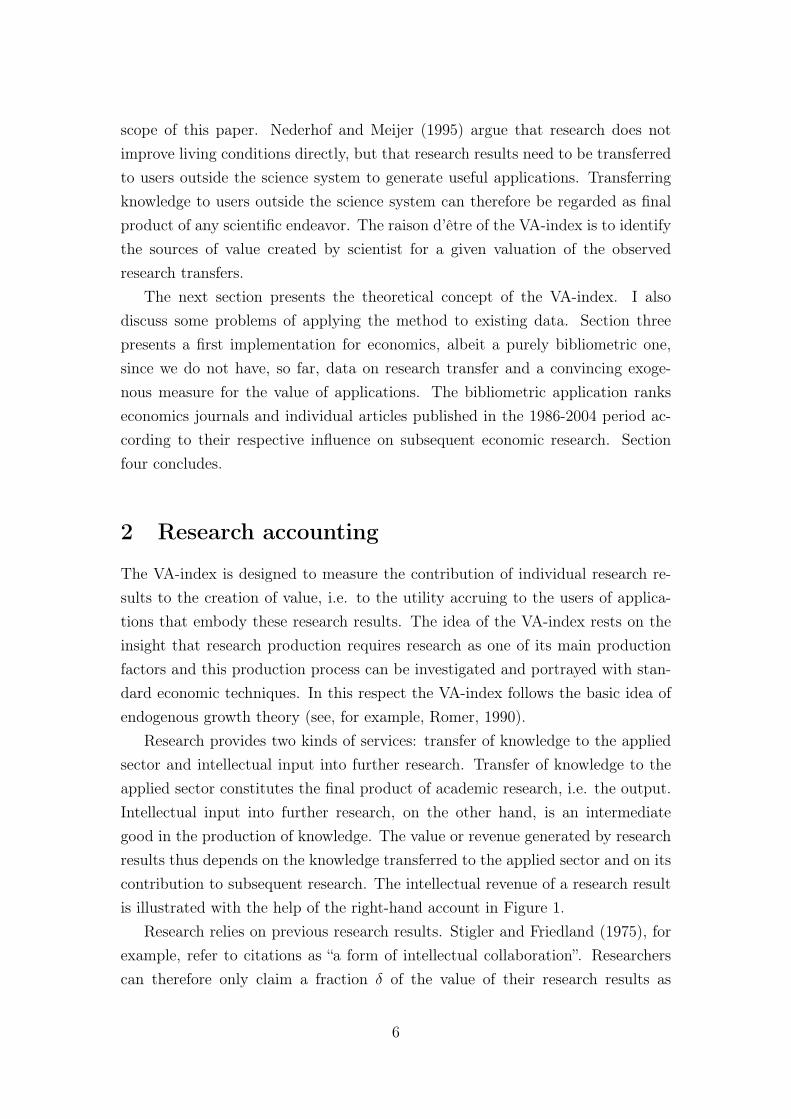
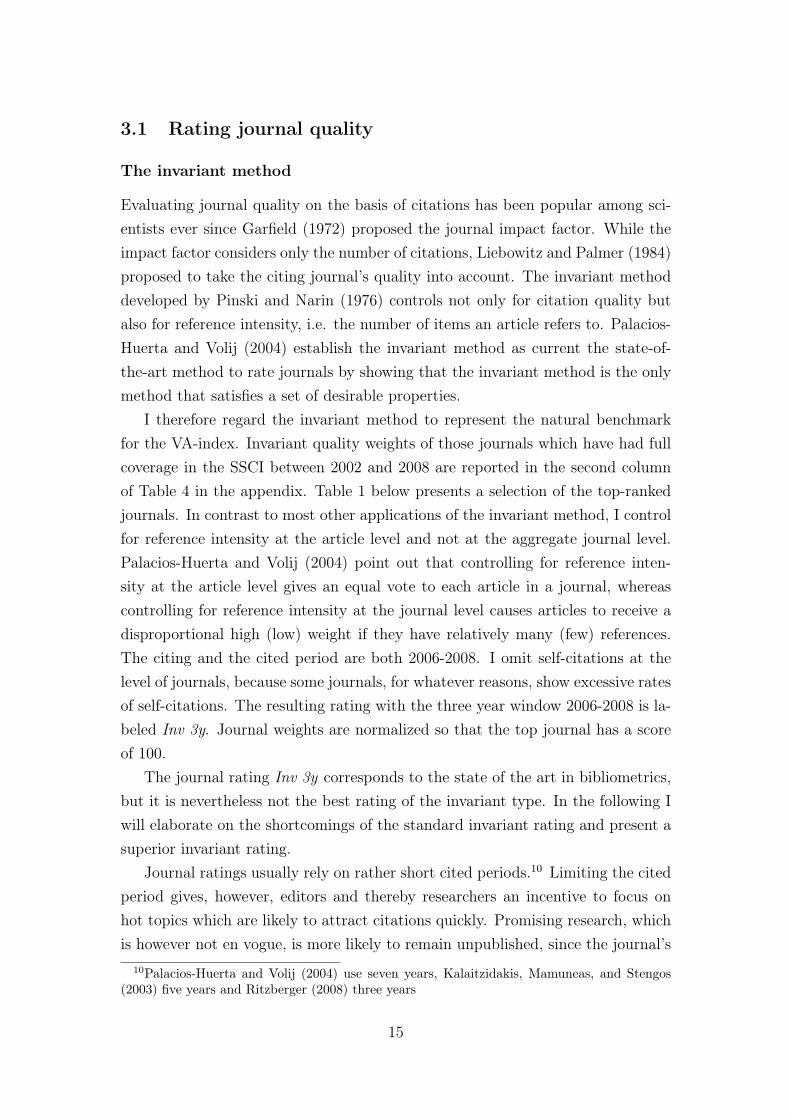
Differences in journal coverage are not a big issue when ratings are basedon short cited periods because journals with an incomplete citation record areeither excluded or treated as if all data were available. For long cited periods,however, differences in journal coverage become more problematic, since morejournals are affected and the effects resulting from incomplete coverage becomemore pronounced. Figure 4 illustrates how a journal’s imputed quality dependson its coverage if journal quality is measured as the total number of citationsdivided by the total number of articles published in the relevant period. Thefirst panel in Figure 4 shows the distribution of citations in articles publishedin 2006-2008 of articles published in 1985-2008. The second panel presents thecorresponding cumulative density function. The last panel reports citations perarticle for a fictitious journal with coverage from 2008 back to the year indicatedon the x-axis. Citations per article peak for a journal with a track record of 12years (i.e. a journal whose coverage commences in 1997). Comparing the ratingof a journal with twelve years of data coverage to the rating of the same journalwith 23 years of coverage suggests that articles of the “older” journal have almost20% lower quality. These differences do, however, not reflect differences in journalquality, they rather arise because of the specific pattern of the citation life cycle.
To control for variations in journal coverage I weight citations by a year specificweight: all articles published in a year receive a weight proportional to the fractionφ of citations to articles published in this year as represented by the first panel ofFigure 4. Each individual article then receives a weight equal to φ/n, where n isthe number of articles published in the respective journal and year. If a journaldoes not have full coverage, I rescale the journal’s year specific weights to add upto one.
Column three in Table 1 reports the journal rating using the described cor-rection for coverage. It is based on citations by articles published between 2006and 2008 of articles from all years covered in the data set. The results would beidentical to the standard invariant method, (1) if the journal size was constantover time, (2) if all journals had full coverage, and (3) if all years received thesame number of citations. The rating is labeled Inv* 24y.
16
0%
2%
4%
6%
8%
2008 2007 2006 2005 2004 2003 2002 2001 2000 1999 1998 1997 1996 1995 1994 1993 1992 1991 1990 1989 1988 1987 1986 1985
distribution of citations over time
0%
20%
40%
60%
80%
100%
2008 2007 2006 2005 2004 2003 2002 2001 2000 1999 1998 1997 1996 1995 1994 1993 1992 1991 1990 1989 1988 1987 1986 1985
cdf of citations
0%
2%
4%
6%
2008 2007 2006 2005 2004 2003 2002 2001 2000 1999 1998 1997 1996 1995 1994 1993 1992 1991 1990 1989 1988 1987 1986 1985
citations per article published between 2008 and year x
Figure 4: Journal coverage and citation life cycle
Table 1: Comparison of journal ratingsJournal Inv 3y Inv* 24y VA-index w VA-index u
QUARTERLY JOURNAL OF ECONOMICS 96.37 (2) 100 (1) 100 (1) 100 (1)JOURNAL OF POLITICAL ECONOMY 86.97 (3) 81.59 (3) 71.78 (2) 69.3 (3)ECONOMETRICA 100 (1) 85.23 (2) 70.23 (3) 68.65 (4)JOURNAL OF ECONOMIC LITERATURE 51.13 (6) 73.02 (4) 68.36 (4) 99.87 (2)AMERICAN ECONOMIC REVIEW 75.23 (5) 59.81 (6) 56.23 (5) 64.35 (5)REVIEW OF ECONOMIC STUDIES 80.71 (4) 63.5 (5) 53.04 (6) 48.3 (7)BROOKINGS PAPERS ON ECONOMIC ACTIVITY 7.1 (56) 35.27 (7) 40.31 (7) 52.51 (6)JOURNAL OF ECONOMIC PERSPECTIVES 34.95 (11) 27.27 (10) 28.19 (8) 39.25 (8)JOURNAL OF FINANCIAL ECONOMICS 28.74 (15) 27.08 (11) 27.66 (9) 35.6 (11)JOURNAL OF ECONOMIC GROWTH 24.18 (22) 28.05 (9) 25.64 (10) 37.67 (10)JOURNAL OF MONETARY ECONOMICS 25.89 (18) 24.7 (13) 25.32 (11) 32.3 (12)RAND JOURNAL OF ECONOMICS 40 (8) 30.01 (8) 24.68 (12) 30 (13)JOURNAL OF ECONOMIC THEORY 39.11 (9) 26.61 (12) 21.55 (13) 21.2 (28)ECONOMIC POLICY 27.26 (16) 18.69 (18) 20.7 (14) 38.74 (9)JOURNAL OF LABOR ECONOMICS 31.2 (14) 20.6 (14) 20.12 (15) 24.84 (21)REVIEW OF ECONOMICS AND STATISTICS 40.65 (7) 20.4 (15) 20.07 (16) 29.58 (14)INTERNATIONAL ECONOMIC REVIEW 35.82 (10) 19.93 (16) 17.86 (17) 20.3 (32)JOURNAL OF HUMAN RESOURCES 24.26 (21) 16.32 (23) 17.54 (18) 23.82 (22)JOURNAL OF LAW & ECONOMICS 31.92 (13) 17.53 (20) 16.96 (19) 20.45 (31)GAMES AND ECONOMIC BEHAVIOR 32.69 (12) 19.16 (17) 16.7 (20) 16.84 (40)AER Papers & Proceedings 18.12 (30) 15.81 (24) 16.62 (21) 21.59 (25)JOURNAL OF ECONOMETRICS 23.92 (23) 18.06 (19) 16.2 (22) 26 (18)JOURNAL OF INTERNATIONAL ECONOMICS 26.48 (17) 14.58 (28) 16.08 (23) 26.7 (17)REVIEW OF ECONOMIC DYNAMICS 20.86 (26) 16.57 (21) 15.09 (24) 16.13 (44)ECONOMIC JOURNAL 25.56 (20) 15.26 (25) 14.66 (25) 25.76 (19)JOURNAL OF FINANCIAL AND QUANTITATIVE ANALYSIS 25.8 (19) 16.43 (22) 14.46 (26) 17.53 (37)JOURNAL OF ACCOUNTING & ECONOMICS 7.87 (52) 13.85 (29) 13.65 (27) 13.73 (51)JOURNAL OF BUSINESS & ECONOMIC STATISTICS 22.97 (24) 14.87 (27) 13.41 (28) 21.34 (26)JOURNAL OF LAW ECONOMICS & ORGANIZATION 8.9 (48) 13.65 (30) 12.62 (29) 17.27 (38)JOURNAL OF PUBLIC ECONOMICS 19.33 (27) 12.38 (32) 12.39 (30) 19.98 (33)JOURNAL OF INDUSTRIAL ECONOMICS 21.46 (25) 13.56 (31) 11.93 (31) 21.13 (29)
17
Brooking Pap
J Risk Uncert
Econ Philo
J Housing Ec
Open EC Rev
0
30
60
90
120
150
180
0 30 60 90 120 150 180
ran
k a
cco
rdin
g t
o I
nv
3y
rank according to Inv* 24y
Inv* 24y vs. Inv 3y
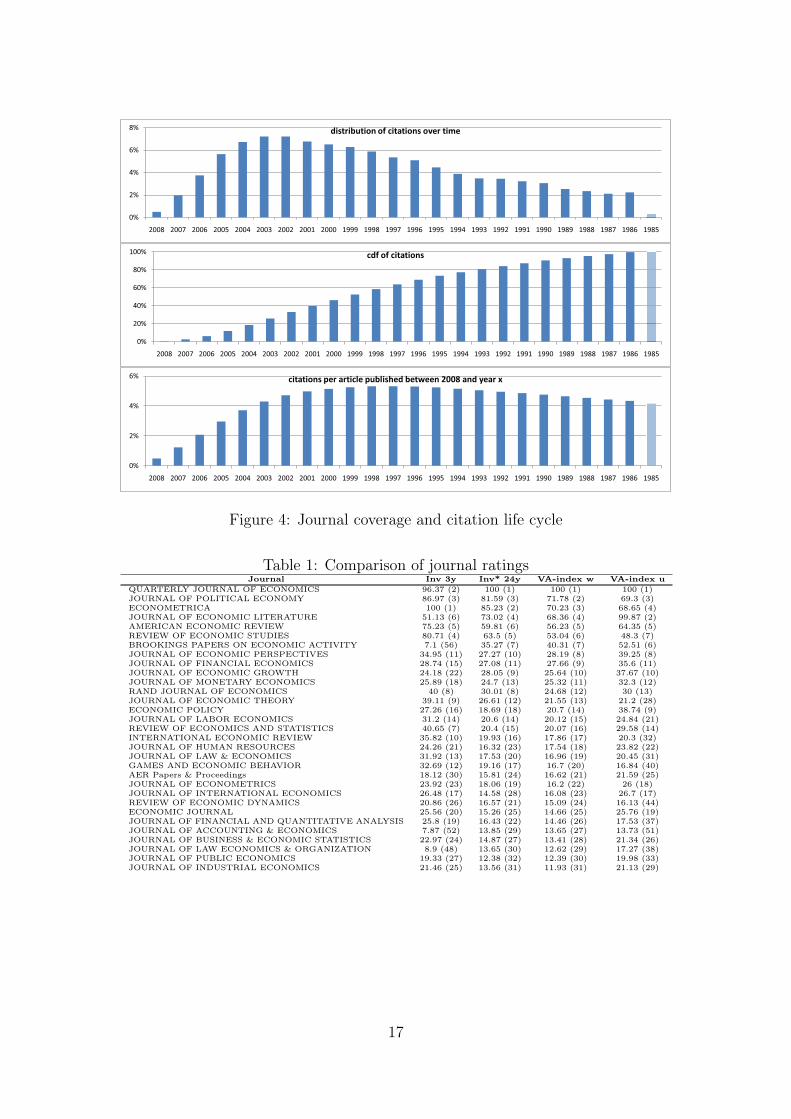
Figure 5: Scatter plot of journal ranks according to Inv* 24 and Inv 3y
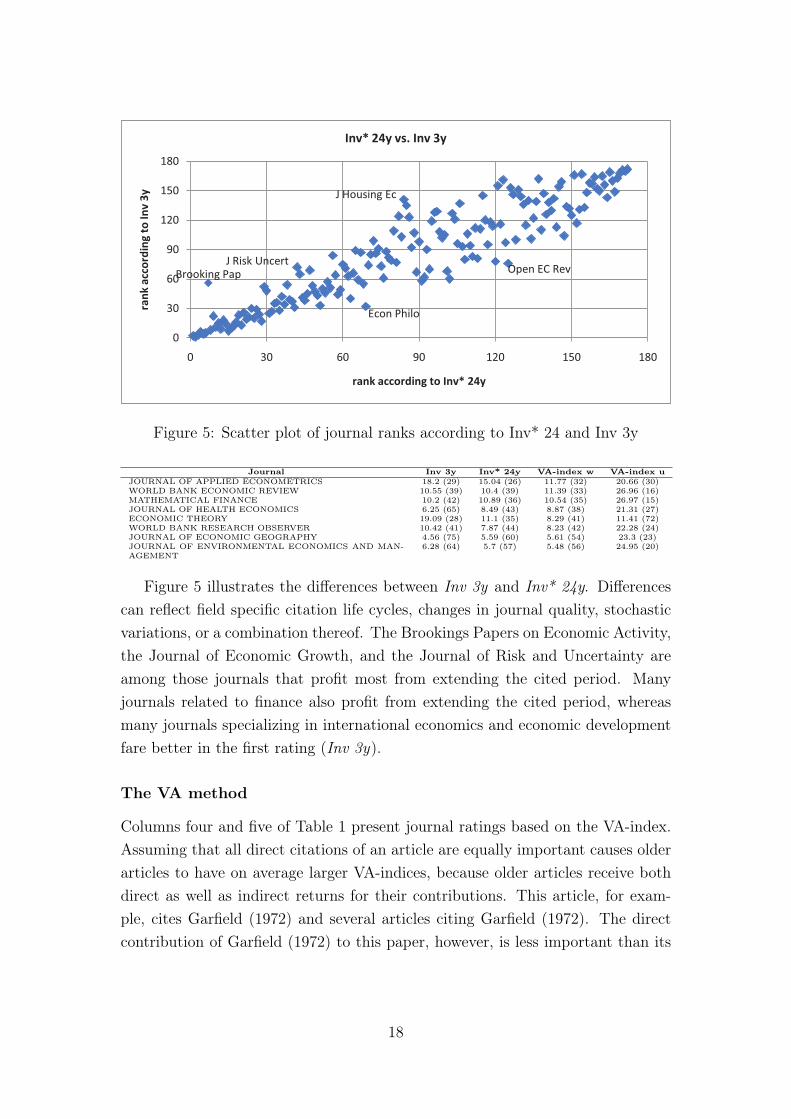
Journal Inv 3y Inv* 24y VA-index w VA-index uJOURNAL OF APPLIED ECONOMETRICS 18.2 (29) 15.04 (26) 11.77 (32) 20.66 (30)WORLD BANK ECONOMIC REVIEW 10.55 (39) 10.4 (39) 11.39 (33) 26.96 (16)MATHEMATICAL FINANCE 10.2 (42) 10.89 (36) 10.54 (35) 26.97 (15)JOURNAL OF HEALTH ECONOMICS 6.25 (65) 8.49 (43) 8.87 (38) 21.31 (27)ECONOMIC THEORY 19.09 (28) 11.1 (35) 8.29 (41) 11.41 (72)WORLD BANK RESEARCH OBSERVER 10.42 (41) 7.87 (44) 8.23 (42) 22.28 (24)JOURNAL OF ECONOMIC GEOGRAPHY 4.56 (75) 5.59 (60) 5.61 (54) 23.3 (23)JOURNAL OF ENVIRONMENTAL ECONOMICS AND MAN-AGEMENT
6.28 (64) 5.7 (57) 5.48 (56) 24.95 (20)
Figure 5 illustrates the differences between Inv 3y and Inv* 24y. Differencescan reflect field specific citation life cycles, changes in journal quality, stochasticvariations, or a combination thereof. The Brookings Papers on Economic Activity,the Journal of Economic Growth, and the Journal of Risk and Uncertainty areamong those journals that profit most from extending the cited period. Manyjournals related to finance also profit from extending the cited period, whereasmany journals specializing in international economics and economic developmentfare better in the first rating (Inv 3y).
The VA method
Columns four and five of Table 1 present journal ratings based on the VA-index.Assuming that all direct citations of an article are equally important causes olderarticles to have on average larger VA-indices, because older articles receive bothdirect as well as indirect returns for their contributions. This article, for exam-ple, cites Garfield (1972) and several articles citing Garfield (1972). The directcontribution of Garfield (1972) to this paper, however, is less important than its
18
refinement by Pinski and Narin (1976).11 Assuming that all citations are equallyimportant will, in general, lead to an overestimation of the direct contributionof older studies. In computing the VA-index, I therefore use yearly weights asin the case of Inv* 24y. I also discount article scores by 3.065 percent a year.Moreover, I normalize article scores such that the sum of the article scores in eachyear equals the number of articles published in this year. Finally, I set δ equalto 0.164, because this value implies that the growth rate of knowledge roughlyequals the growth rate of the economy.12
I present two versions of the VA-index: Both versions assign exogenous appli-cation values to articles published between 2006 and 2008 and then use citationsby all articles in the sample to identify the intellectual sources. For the VA-indexw I assume that a 2006-2008 article’s value equals the quality weight of the journalin which the article was published. Journal quality weights are thus determined bya system of equations. The VA-index u, on the other hand, relies on unweighted2006-2008 article value, i.e. every article’s application value is normalized to one.In both cases the VA-indices of the quality of articles published between 1986 and2008 are calculated according to equation 2 and subsequently discounted.
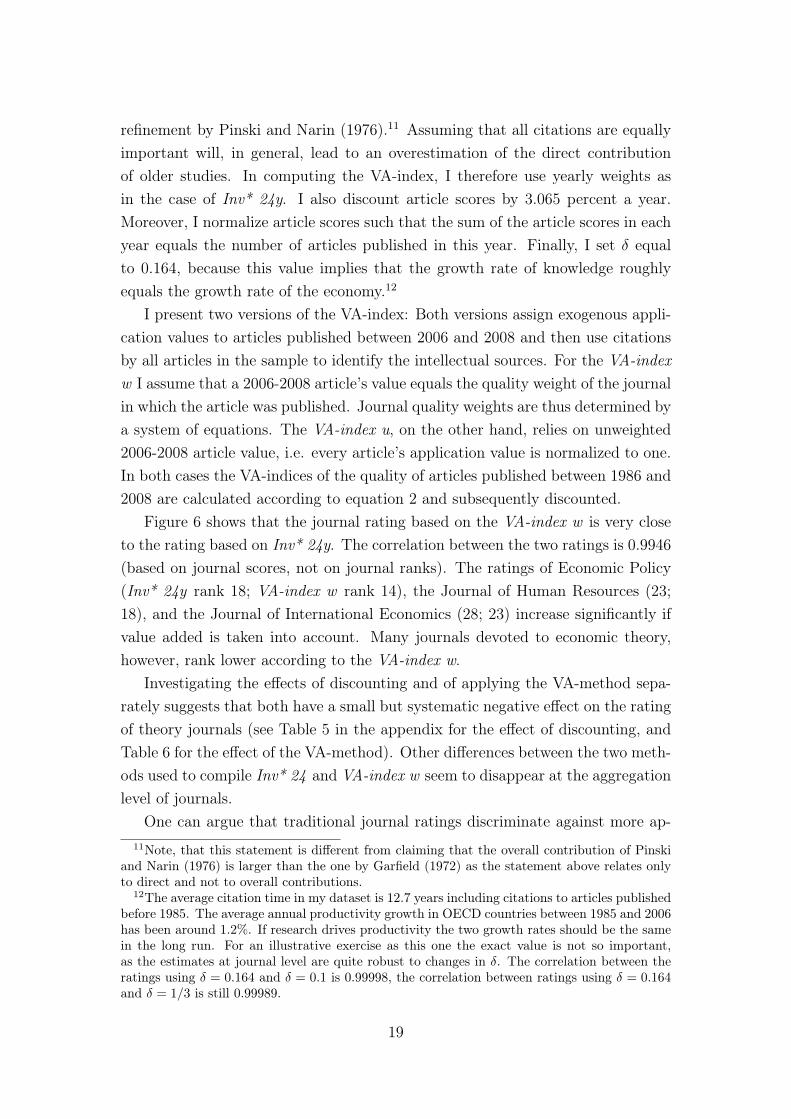
Figure 6 shows that the journal rating based on the VA-index w is very closeto the rating based on Inv* 24y. The correlation between the two ratings is 0.9946(based on journal scores, not on journal ranks). The ratings of Economic Policy(Inv* 24y rank 18; VA-index w rank 14), the Journal of Human Resources (23;18), and the Journal of International Economics (28; 23) increase significantly ifvalue added is taken into account. Many journals devoted to economic theory,however, rank lower according to the VA-index w.
Investigating the effects of discounting and of applying the VA-method sepa-rately suggests that both have a small but systematic negative effect on the ratingof theory journals (see Table 5 in the appendix for the effect of discounting, andTable 6 for the effect of the VA-method). Other differences between the two meth-ods used to compile Inv* 24 and VA-index w seem to disappear at the aggregationlevel of journals.
One can argue that traditional journal ratings discriminate against more ap-11Note, that this statement is different from claiming that the overall contribution of Pinski
and Narin (1976) is larger than the one by Garfield (1972) as the statement above relates onlyto direct and not to overall contributions.
12The average citation time in my dataset is 12.7 years including citations to articles publishedbefore 1985. The average annual productivity growth in OECD countries between 1985 and 2006has been around 1.2%. If research drives productivity the two growth rates should be the samein the long run. For an illustrative exercise as this one the exact value is not so important,as the estimates at journal level are quite robust to changes in δ. The correlation between theratings using δ = 0.164 and δ = 0.1 is 0.99998, the correlation between ratings using δ = 0.164and δ = 1/3 is still 0.99989.
19
0
30
60
90
120
150
180
0 30 60 90 120 150 180
ran
k a
cco
rdin
g t
o w
eig
hte
d V
A-i
nd
ex
rank according to Inv* 24y
Inv* 24y vs. weighted VA-index
Figure 6: Scatter plot of journal ranks according to Inv* 24 and weighted VA-index
plied journals because the transfer of knowledge to the applied sector and the cre-ation of knowledge are treated as being one thing. Therefore VA-index u presentsa reference case giving equal voting power to all articles. The VA-index u ratingis reported in the last column of Table 1.
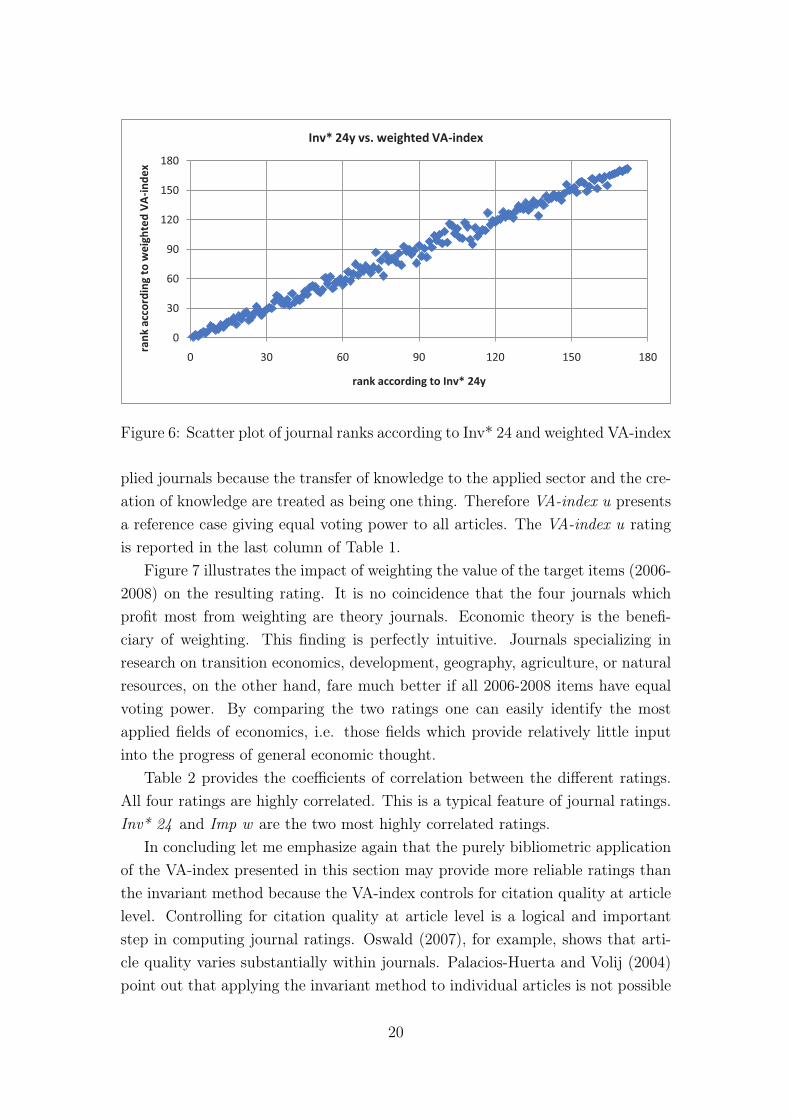
Figure 7 illustrates the impact of weighting the value of the target items (2006-2008) on the resulting rating. It is no coincidence that the four journals whichprofit most from weighting are theory journals. Economic theory is the benefi-ciary of weighting. This finding is perfectly intuitive. Journals specializing inresearch on transition economics, development, geography, agriculture, or naturalresources, on the other hand, fare much better if all 2006-2008 items have equalvoting power. By comparing the two ratings one can easily identify the mostapplied fields of economics, i.e. those fields which provide relatively little inputinto the progress of general economic thought.
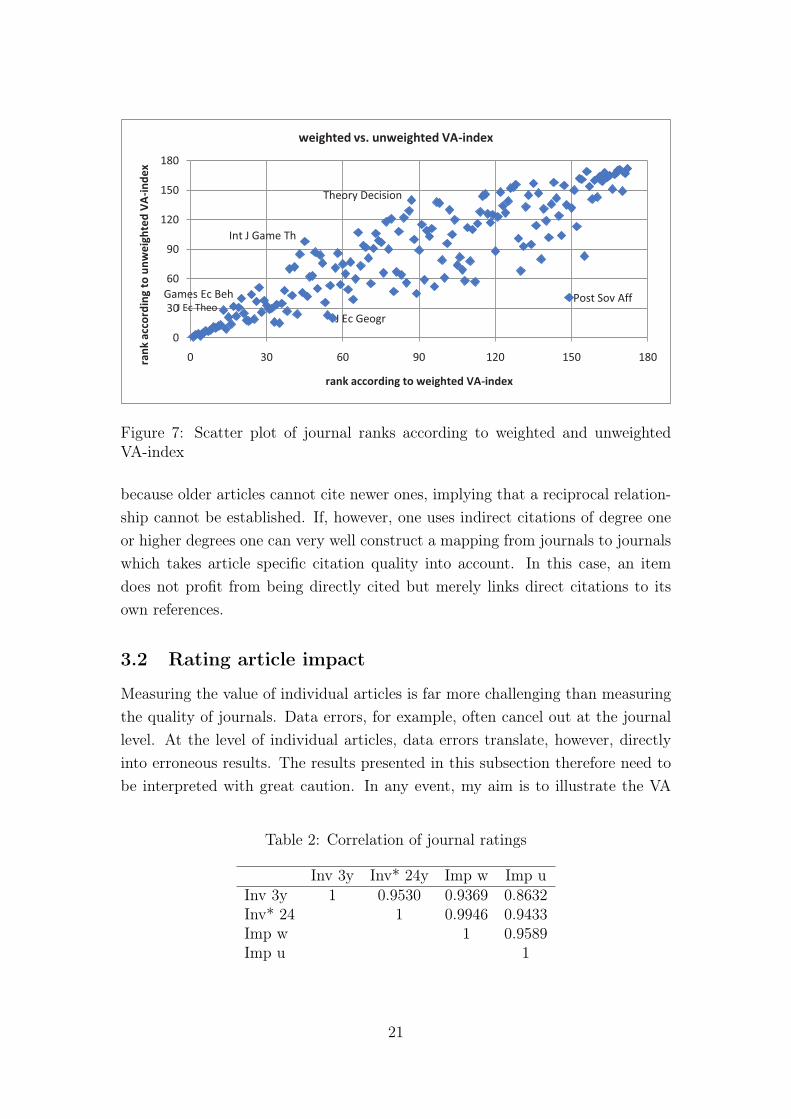
Table 2 provides the coefficients of correlation between the different ratings.All four ratings are highly correlated. This is a typical feature of journal ratings.Inv* 24 and Imp w are the two most highly correlated ratings.
In concluding let me emphasize again that the purely bibliometric applicationof the VA-index presented in this section may provide more reliable ratings thanthe invariant method because the VA-index controls for citation quality at articlelevel. Controlling for citation quality at article level is a logical and importantstep in computing journal ratings. Oswald (2007), for example, shows that arti-cle quality varies substantially within journals. Palacios-Huerta and Volij (2004)point out that applying the invariant method to individual articles is not possible
20
J Ec Theo
Games Ec Beh
Int J Game Th
J Ec Geogr
Theory Decision
Post Sov Aff
0
30
60
90
120
150
180
0 30 60 90 120 150 180ran
k a
cco
rdin
g t
o u
nw
eig
hte
d V
A-i
nd
ex
rank according to weighted VA-index
weighted vs. unweighted VA-index
Figure 7: Scatter plot of journal ranks according to weighted and unweightedVA-index
because older articles cannot cite newer ones, implying that a reciprocal relation-ship cannot be established. If, however, one uses indirect citations of degree oneor higher degrees one can very well construct a mapping from journals to journalswhich takes article specific citation quality into account. In this case, an itemdoes not profit from being directly cited but merely links direct citations to itsown references.
3.2 Rating article impact
Measuring the value of individual articles is far more challenging than measuringthe quality of journals. Data errors, for example, often cancel out at the journallevel. At the level of individual articles, data errors translate, however, directlyinto erroneous results. The results presented in this subsection therefore need tobe interpreted with great caution. In any event, my aim is to illustrate the VA
Table 2: Correlation of journal ratings
Inv 3y Inv* 24y Imp w Imp uInv 3y 1 0.9530 0.9369 0.8632Inv* 24 1 0.9946 0.9433Imp w 1 0.9589Imp u 1
21
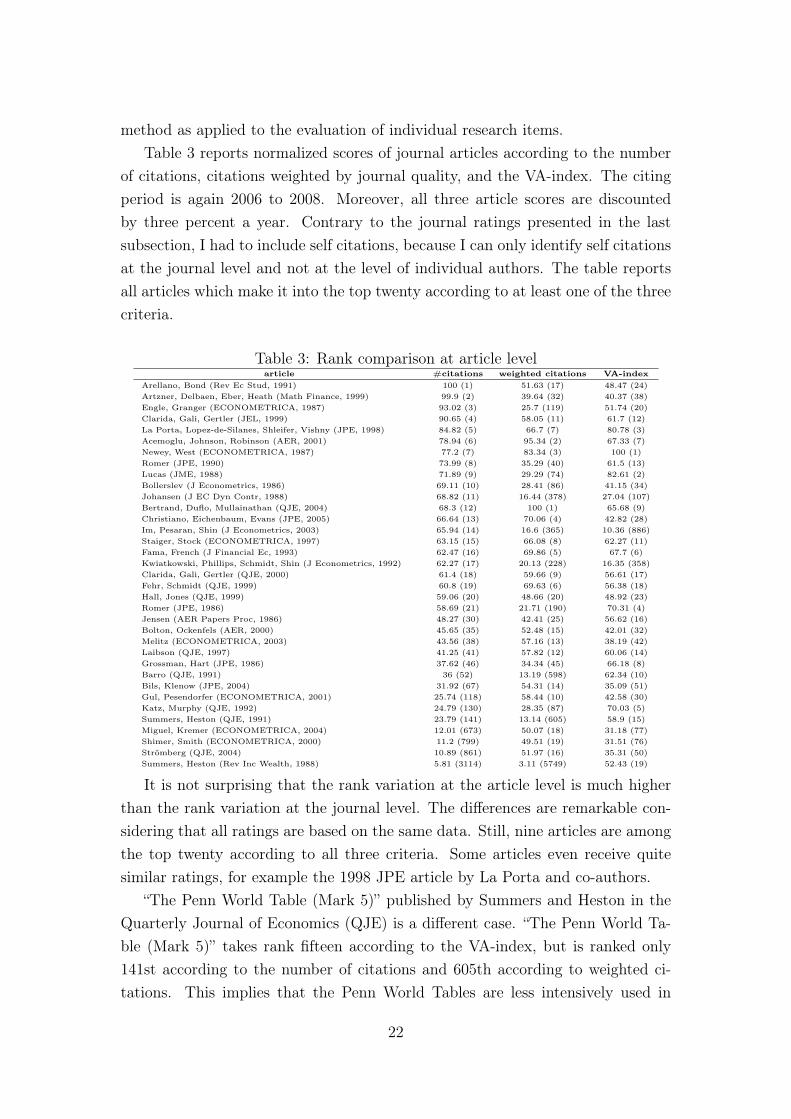
method as applied to the evaluation of individual research items.Table 3 reports normalized scores of journal articles according to the number
of citations, citations weighted by journal quality, and the VA-index. The citingperiod is again 2006 to 2008. Moreover, all three article scores are discountedby three percent a year. Contrary to the journal ratings presented in the lastsubsection, I had to include self citations, because I can only identify self citationsat the journal level and not at the level of individual authors. The table reportsall articles which make it into the top twenty according to at least one of the threecriteria.
Table 3: Rank comparison at article levelarticle #citations weighted citations VA-index
Arellano, Bond (Rev Ec Stud, 1991) 100 (1) 51.63 (17) 48.47 (24)Artzner, Delbaen, Eber, Heath (Math Finance, 1999) 99.9 (2) 39.64 (32) 40.37 (38)Engle, Granger (ECONOMETRICA, 1987) 93.02 (3) 25.7 (119) 51.74 (20)Clarida, Gali, Gertler (JEL, 1999) 90.65 (4) 58.05 (11) 61.7 (12)La Porta, Lopez-de-Silanes, Shleifer, Vishny (JPE, 1998) 84.82 (5) 66.7 (7) 80.78 (3)Acemoglu, Johnson, Robinson (AER, 2001) 78.94 (6) 95.34 (2) 67.33 (7)Newey, West (ECONOMETRICA, 1987) 77.2 (7) 83.34 (3) 100 (1)Romer (JPE, 1990) 73.99 (8) 35.29 (40) 61.5 (13)Lucas (JME, 1988) 71.89 (9) 29.29 (74) 82.61 (2)Bollerslev (J Econometrics, 1986) 69.11 (10) 28.41 (86) 41.15 (34)Johansen (J EC Dyn Contr, 1988) 68.82 (11) 16.44 (378) 27.04 (107)Bertrand, Duflo, Mullainathan (QJE, 2004) 68.3 (12) 100 (1) 65.68 (9)Christiano, Eichenbaum, Evans (JPE, 2005) 66.64 (13) 70.06 (4) 42.82 (28)Im, Pesaran, Shin (J Econometrics, 2003) 65.94 (14) 16.6 (365) 10.36 (886)Staiger, Stock (ECONOMETRICA, 1997) 63.15 (15) 66.08 (8) 62.27 (11)Fama, French (J Financial Ec, 1993) 62.47 (16) 69.86 (5) 67.7 (6)Kwiatkowski, Phillips, Schmidt, Shin (J Econometrics, 1992) 62.27 (17) 20.13 (228) 16.35 (358)Clarida, Gali, Gertler (QJE, 2000) 61.4 (18) 59.66 (9) 56.61 (17)Fehr, Schmidt (QJE, 1999) 60.8 (19) 69.63 (6) 56.38 (18)Hall, Jones (QJE, 1999) 59.06 (20) 48.66 (20) 48.92 (23)Romer (JPE, 1986) 58.69 (21) 21.71 (190) 70.31 (4)Jensen (AER Papers Proc, 1986) 48.27 (30) 42.41 (25) 56.62 (16)Bolton, Ockenfels (AER, 2000) 45.65 (35) 52.48 (15) 42.01 (32)Melitz (ECONOMETRICA, 2003) 43.56 (38) 57.16 (13) 38.19 (42)Laibson (QJE, 1997) 41.25 (41) 57.82 (12) 60.06 (14)Grossman, Hart (JPE, 1986) 37.62 (46) 34.34 (45) 66.18 (8)Barro (QJE, 1991) 36 (52) 13.19 (598) 62.34 (10)Bils, Klenow (JPE, 2004) 31.92 (67) 54.31 (14) 35.09 (51)Gul, Pesendorfer (ECONOMETRICA, 2001) 25.74 (118) 58.44 (10) 42.58 (30)Katz, Murphy (QJE, 1992) 24.79 (130) 28.35 (87) 70.03 (5)Summers, Heston (QJE, 1991) 23.79 (141) 13.14 (605) 58.9 (15)Miguel, Kremer (ECONOMETRICA, 2004) 12.01 (673) 50.07 (18) 31.18 (77)Shimer, Smith (ECONOMETRICA, 2000) 11.2 (799) 49.51 (19) 31.51 (76)Strömberg (QJE, 2004) 10.89 (861) 51.97 (16) 35.31 (50)Summers, Heston (Rev Inc Wealth, 1988) 5.81 (3114) 3.11 (5749) 52.43 (19)
It is not surprising that the rank variation at the article level is much higherthan the rank variation at the journal level. The differences are remarkable con-sidering that all ratings are based on the same data. Still, nine articles are amongthe top twenty according to all three criteria. Some articles even receive quitesimilar ratings, for example the 1998 JPE article by La Porta and co-authors.
“The Penn World Table (Mark 5)” published by Summers and Heston in theQuarterly Journal of Economics (QJE) is a different case. “The Penn World Ta-ble (Mark 5)” takes rank fifteen according to the VA-index, but is ranked only141st according to the number of citations and 605th according to weighted ci-tations. This implies that the Penn World Tables are less intensively used in
22
current research but they nevertheless made an important indirect contributionto the literature which is still noticeable. The indirect contributions are even morepronounced for the last article in Table 3 which is an earlier version of the PennWorld Tables. The earlier versions of the Penn World Tables laid the foundationfor the version published 13 years later in the QJE. Ratings based the two tradi-tional indices fail, however, to capture this important input. The ratings of thetwo articles by Romer (JPE 1986 and 1990) tell a similar story. Romer’s 1990article “Endogenous Technological Change” ranks higher according to the two tra-ditional indices, but not according to the VA-index. Here, the VA-index againcaptures the contribution of the earlier and maybe more innovative work.
Given the variation of article quality within journals, the VA-index is likely tobe more reliable than ratings based on unweighted or weighted citations. More-over, the VA-index also reduces incentives for strategic manipulations since thecited source receives only a fraction of the credit and it would be rather tediousto figure out who else is going to profit from such a manipulation.
4 Conclusion
In this paper I have presented a theoretical basis for an ideal measure of researchperformance, the VA-index. I have also provided a first implementation of theindex to research in economics, which illustrates some features of the index. Theimplementation illustrates the gap that exists between the current potential ofbibliometric data and the informational requirements of the VA-index. Closingthis gap is a challenge for future research. In the meantime, the theoretical conceptof the VA-index provides a point of reference for existing indicators.
Fortunately, improvements to research assessment are fairly easy to make.Campbell (2008) mentions that Nature’s editorial policy followed some medicaljournals in now giving authors the option to report contributions of particularauthors to a piece of research. Moreover, he mentions the possibility of not citingentire papers but to refer to particular (sub)sections of a paper. Such local cita-tions allow, for example, differentiating citations due to methodological aspectsfrom citations due to a paper’s main conclusion. A related option is to use localreferences that indicate the part of an article for which a reference was relevant.Classifying references into, say, essential, important, and useful references couldbe another simple, but important step towards better metrics.
An aspect often ignored in evaluating research is that measuring the successof research and rewarding it are two related but not necessarily identical issues.Measuring research success is necessary for developing a rational research policy.
23
Only when we understand how much different parts of science add to humanwell-being, how these parts interact, how the realization of value-added evolvesover time, and how risky the production of science is, will we be able to establishefficient institutions for research. Consider for example the risk in producingresearch. If no risk were involved in producing research, a linear reward schemecan be optimal, whereas in a purely stochastic environment fixed rewards wouldsuffice.
Understanding and improving the science system, however, clearly goes be-yond assessing research output. We also need to gain a better understanding ofthe determinants of research success. Ellison (2002), for example, claims that, ineconomics, a paper’s main contribution has become less important for publica-tion success than other aspects of quality (such as generality, robustness checks,extensions, discussions of related literature, etc.). According to Ellison, this shiftreflects changing norms in the economics profession and provides little benefit athigh cost. Sunderland, Sunderland-Groves, Shanley, and Campbell (2009) pointat a ‘research-implementation gap’ in conservation biology and suggest ways toimprove the transmission of knowledge from researchers to practitioners and alsoa transmission of experience in the opposite direction. Shanley and López (2009)find that contemporary researchers in conservation biology face wrong incentivesand propose that research institutions should “restructure institutional incentivestructures to take into account actual ‘impact’ rather than solely ‘high impact’journals”. This is exactly what the VA-index does by linking actual impact to itsscientific sources.
A Appendix
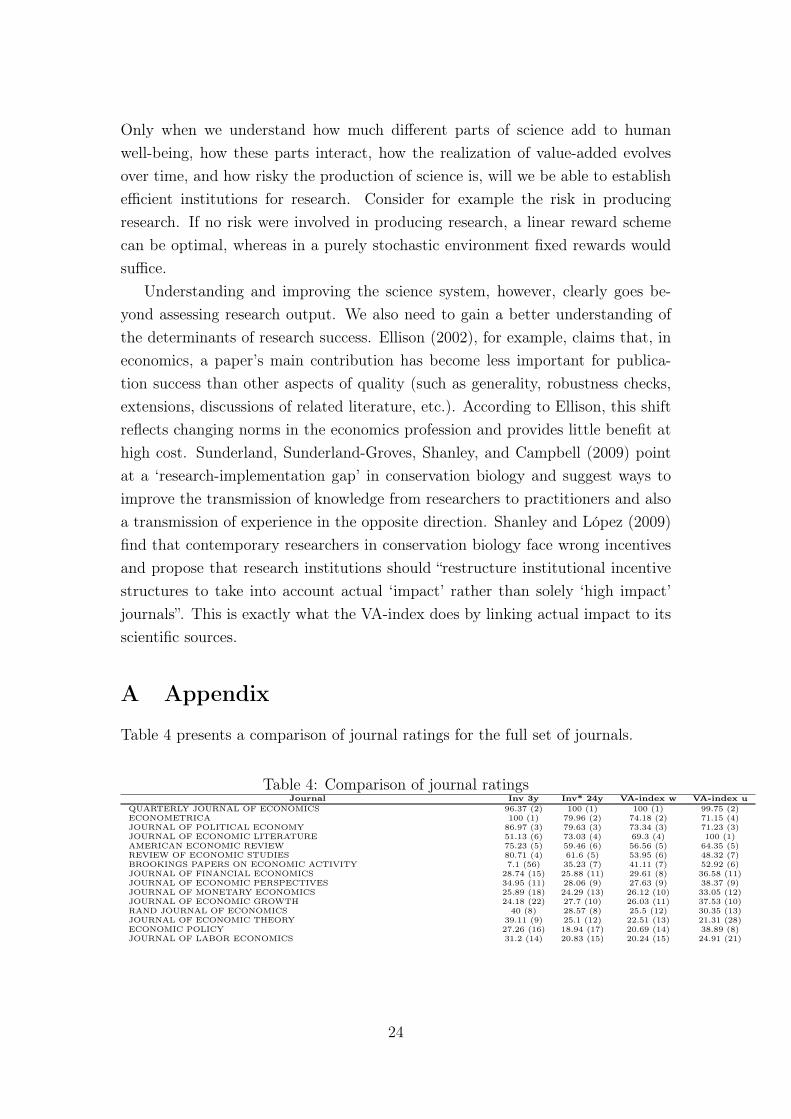
Table 4 presents a comparison of journal ratings for the full set of journals.
Table 4: Comparison of journal ratingsJournal Inv 3y Inv* 24y VA-index w VA-index u
QUARTERLY JOURNAL OF ECONOMICS 96.37 (2) 100 (1) 100 (1) 99.75 (2)ECONOMETRICA 100 (1) 79.96 (2) 74.18 (2) 71.15 (4)JOURNAL OF POLITICAL ECONOMY 86.97 (3) 79.63 (3) 73.34 (3) 71.23 (3)JOURNAL OF ECONOMIC LITERATURE 51.13 (6) 73.03 (4) 69.3 (4) 100 (1)AMERICAN ECONOMIC REVIEW 75.23 (5) 59.46 (6) 56.56 (5) 64.35 (5)REVIEW OF ECONOMIC STUDIES 80.71 (4) 61.6 (5) 53.95 (6) 48.32 (7)BROOKINGS PAPERS ON ECONOMIC ACTIVITY 7.1 (56) 35.23 (7) 41.11 (7) 52.92 (6)JOURNAL OF FINANCIAL ECONOMICS 28.74 (15) 25.88 (11) 29.61 (8) 36.58 (11)JOURNAL OF ECONOMIC PERSPECTIVES 34.95 (11) 28.06 (9) 27.63 (9) 38.37 (9)JOURNAL OF MONETARY ECONOMICS 25.89 (18) 24.29 (13) 26.12 (10) 33.05 (12)JOURNAL OF ECONOMIC GROWTH 24.18 (22) 27.7 (10) 26.03 (11) 37.53 (10)RAND JOURNAL OF ECONOMICS 40 (8) 28.57 (8) 25.5 (12) 30.35 (13)JOURNAL OF ECONOMIC THEORY 39.11 (9) 25.1 (12) 22.51 (13) 21.31 (28)ECONOMIC POLICY 27.26 (16) 18.94 (17) 20.69 (14) 38.89 (8)JOURNAL OF LABOR ECONOMICS 31.2 (14) 20.83 (15) 20.24 (15) 24.91 (21)
24
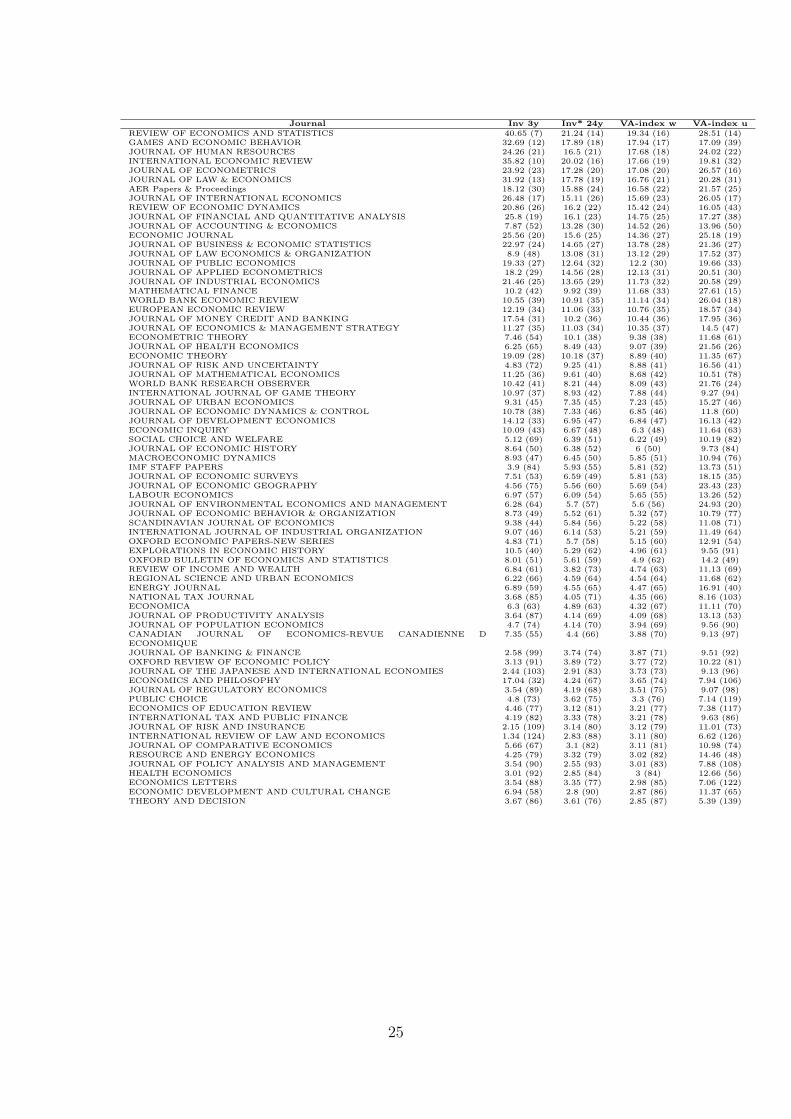
Journal Inv 3y Inv* 24y VA-index w VA-index uREVIEW OF ECONOMICS AND STATISTICS 40.65 (7) 21.24 (14) 19.34 (16) 28.51 (14)GAMES AND ECONOMIC BEHAVIOR 32.69 (12) 17.89 (18) 17.94 (17) 17.09 (39)JOURNAL OF HUMAN RESOURCES 24.26 (21) 16.5 (21) 17.68 (18) 24.02 (22)INTERNATIONAL ECONOMIC REVIEW 35.82 (10) 20.02 (16) 17.66 (19) 19.81 (32)JOURNAL OF ECONOMETRICS 23.92 (23) 17.28 (20) 17.08 (20) 26.57 (16)JOURNAL OF LAW & ECONOMICS 31.92 (13) 17.78 (19) 16.76 (21) 20.28 (31)AER Papers & Proceedings 18.12 (30) 15.88 (24) 16.58 (22) 21.57 (25)JOURNAL OF INTERNATIONAL ECONOMICS 26.48 (17) 15.11 (26) 15.69 (23) 26.05 (17)REVIEW OF ECONOMIC DYNAMICS 20.86 (26) 16.2 (22) 15.42 (24) 16.05 (43)JOURNAL OF FINANCIAL AND QUANTITATIVE ANALYSIS 25.8 (19) 16.1 (23) 14.75 (25) 17.27 (38)JOURNAL OF ACCOUNTING & ECONOMICS 7.87 (52) 13.28 (30) 14.52 (26) 13.96 (50)ECONOMIC JOURNAL 25.56 (20) 15.6 (25) 14.36 (27) 25.18 (19)JOURNAL OF BUSINESS & ECONOMIC STATISTICS 22.97 (24) 14.65 (27) 13.78 (28) 21.36 (27)JOURNAL OF LAW ECONOMICS & ORGANIZATION 8.9 (48) 13.08 (31) 13.12 (29) 17.52 (37)JOURNAL OF PUBLIC ECONOMICS 19.33 (27) 12.64 (32) 12.2 (30) 19.66 (33)JOURNAL OF APPLIED ECONOMETRICS 18.2 (29) 14.56 (28) 12.13 (31) 20.51 (30)JOURNAL OF INDUSTRIAL ECONOMICS 21.46 (25) 13.65 (29) 11.73 (32) 20.58 (29)MATHEMATICAL FINANCE 10.2 (42) 9.92 (39) 11.68 (33) 27.61 (15)WORLD BANK ECONOMIC REVIEW 10.55 (39) 10.91 (35) 11.14 (34) 26.04 (18)EUROPEAN ECONOMIC REVIEW 12.19 (34) 11.06 (33) 10.76 (35) 18.57 (34)JOURNAL OF MONEY CREDIT AND BANKING 17.54 (31) 10.2 (36) 10.44 (36) 17.95 (36)JOURNAL OF ECONOMICS & MANAGEMENT STRATEGY 11.27 (35) 11.03 (34) 10.35 (37) 14.5 (47)ECONOMETRIC THEORY 7.46 (54) 10.1 (38) 9.38 (38) 11.68 (61)JOURNAL OF HEALTH ECONOMICS 6.25 (65) 8.49 (43) 9.07 (39) 21.56 (26)ECONOMIC THEORY 19.09 (28) 10.18 (37) 8.89 (40) 11.35 (67)JOURNAL OF RISK AND UNCERTAINTY 4.83 (72) 9.25 (41) 8.88 (41) 16.56 (41)JOURNAL OF MATHEMATICAL ECONOMICS 11.25 (36) 9.61 (40) 8.68 (42) 10.51 (78)WORLD BANK RESEARCH OBSERVER 10.42 (41) 8.21 (44) 8.09 (43) 21.76 (24)INTERNATIONAL JOURNAL OF GAME THEORY 10.97 (37) 8.93 (42) 7.88 (44) 9.27 (94)JOURNAL OF URBAN ECONOMICS 9.31 (45) 7.35 (45) 7.23 (45) 15.27 (46)JOURNAL OF ECONOMIC DYNAMICS & CONTROL 10.78 (38) 7.33 (46) 6.85 (46) 11.8 (60)JOURNAL OF DEVELOPMENT ECONOMICS 14.12 (33) 6.95 (47) 6.84 (47) 16.13 (42)ECONOMIC INQUIRY 10.09 (43) 6.67 (48) 6.3 (48) 11.64 (63)SOCIAL CHOICE AND WELFARE 5.12 (69) 6.39 (51) 6.22 (49) 10.19 (82)JOURNAL OF ECONOMIC HISTORY 8.64 (50) 6.38 (52) 6 (50) 9.73 (84)MACROECONOMIC DYNAMICS 8.93 (47) 6.45 (50) 5.85 (51) 10.94 (76)IMF STAFF PAPERS 3.9 (84) 5.93 (55) 5.81 (52) 13.73 (51)JOURNAL OF ECONOMIC SURVEYS 7.51 (53) 6.59 (49) 5.81 (53) 18.15 (35)JOURNAL OF ECONOMIC GEOGRAPHY 4.56 (75) 5.56 (60) 5.69 (54) 23.43 (23)LABOUR ECONOMICS 6.97 (57) 6.09 (54) 5.65 (55) 13.26 (52)JOURNAL OF ENVIRONMENTAL ECONOMICS AND MANAGEMENT 6.28 (64) 5.7 (57) 5.6 (56) 24.93 (20)JOURNAL OF ECONOMIC BEHAVIOR & ORGANIZATION 8.73 (49) 5.52 (61) 5.32 (57) 10.79 (77)SCANDINAVIAN JOURNAL OF ECONOMICS 9.38 (44) 5.84 (56) 5.22 (58) 11.08 (71)INTERNATIONAL JOURNAL OF INDUSTRIAL ORGANIZATION 9.07 (46) 6.14 (53) 5.21 (59) 11.49 (64)OXFORD ECONOMIC PAPERS-NEW SERIES 4.83 (71) 5.7 (58) 5.15 (60) 12.91 (54)EXPLORATIONS IN ECONOMIC HISTORY 10.5 (40) 5.29 (62) 4.96 (61) 9.55 (91)OXFORD BULLETIN OF ECONOMICS AND STATISTICS 8.01 (51) 5.61 (59) 4.9 (62) 14.2 (49)REVIEW OF INCOME AND WEALTH 6.84 (61) 3.82 (73) 4.74 (63) 11.13 (69)REGIONAL SCIENCE AND URBAN ECONOMICS 6.22 (66) 4.59 (64) 4.54 (64) 11.68 (62)ENERGY JOURNAL 6.89 (59) 4.55 (65) 4.47 (65) 16.91 (40)NATIONAL TAX JOURNAL 3.68 (85) 4.05 (71) 4.35 (66) 8.16 (103)ECONOMICA 6.3 (63) 4.89 (63) 4.32 (67) 11.11 (70)JOURNAL OF PRODUCTIVITY ANALYSIS 3.64 (87) 4.14 (69) 4.09 (68) 13.13 (53)JOURNAL OF POPULATION ECONOMICS 4.7 (74) 4.14 (70) 3.94 (69) 9.56 (90)CANADIAN JOURNAL OF ECONOMICS-REVUE CANADIENNE DECONOMIQUE
7.35 (55) 4.4 (66) 3.88 (70) 9.13 (97)
JOURNAL OF BANKING & FINANCE 2.58 (99) 3.74 (74) 3.87 (71) 9.51 (92)OXFORD REVIEW OF ECONOMIC POLICY 3.13 (91) 3.89 (72) 3.77 (72) 10.22 (81)JOURNAL OF THE JAPANESE AND INTERNATIONAL ECONOMIES 2.44 (103) 2.91 (83) 3.73 (73) 9.13 (96)ECONOMICS AND PHILOSOPHY 17.04 (32) 4.24 (67) 3.65 (74) 7.94 (106)JOURNAL OF REGULATORY ECONOMICS 3.54 (89) 4.19 (68) 3.51 (75) 9.07 (98)PUBLIC CHOICE 4.8 (73) 3.62 (75) 3.3 (76) 7.14 (119)ECONOMICS OF EDUCATION REVIEW 4.46 (77) 3.12 (81) 3.21 (77) 7.38 (117)INTERNATIONAL TAX AND PUBLIC FINANCE 4.19 (82) 3.33 (78) 3.21 (78) 9.63 (86)JOURNAL OF RISK AND INSURANCE 2.15 (109) 3.14 (80) 3.12 (79) 11.01 (73)INTERNATIONAL REVIEW OF LAW AND ECONOMICS 1.34 (124) 2.83 (88) 3.11 (80) 6.62 (126)JOURNAL OF COMPARATIVE ECONOMICS 5.66 (67) 3.1 (82) 3.11 (81) 10.98 (74)RESOURCE AND ENERGY ECONOMICS 4.25 (79) 3.32 (79) 3.02 (82) 14.46 (48)JOURNAL OF POLICY ANALYSIS AND MANAGEMENT 3.54 (90) 2.55 (93) 3.01 (83) 7.88 (108)HEALTH ECONOMICS 3.01 (92) 2.85 (84) 3 (84) 12.66 (56)ECONOMICS LETTERS 3.54 (88) 3.35 (77) 2.98 (85) 7.06 (122)ECONOMIC DEVELOPMENT AND CULTURAL CHANGE 6.94 (58) 2.8 (90) 2.87 (86) 11.37 (65)THEORY AND DECISION 3.67 (86) 3.61 (76) 2.85 (87) 5.39 (139)
25
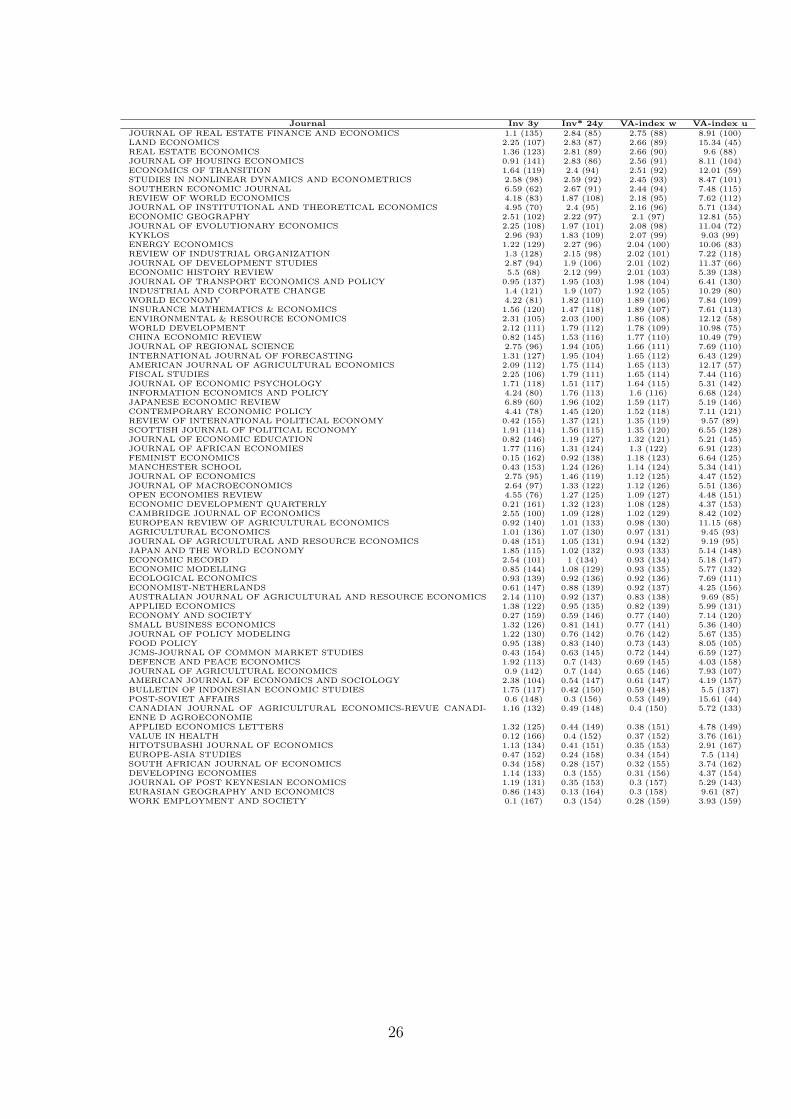
Journal Inv 3y Inv* 24y VA-index w VA-index uJOURNAL OF REAL ESTATE FINANCE AND ECONOMICS 1.1 (135) 2.84 (85) 2.75 (88) 8.91 (100)LAND ECONOMICS 2.25 (107) 2.83 (87) 2.66 (89) 15.34 (45)REAL ESTATE ECONOMICS 1.36 (123) 2.81 (89) 2.66 (90) 9.6 (88)JOURNAL OF HOUSING ECONOMICS 0.91 (141) 2.83 (86) 2.56 (91) 8.11 (104)ECONOMICS OF TRANSITION 1.64 (119) 2.4 (94) 2.51 (92) 12.01 (59)STUDIES IN NONLINEAR DYNAMICS AND ECONOMETRICS 2.58 (98) 2.59 (92) 2.45 (93) 8.47 (101)SOUTHERN ECONOMIC JOURNAL 6.59 (62) 2.67 (91) 2.44 (94) 7.48 (115)REVIEW OF WORLD ECONOMICS 4.18 (83) 1.87 (108) 2.18 (95) 7.62 (112)JOURNAL OF INSTITUTIONAL AND THEORETICAL ECONOMICS 4.95 (70) 2.4 (95) 2.16 (96) 5.71 (134)ECONOMIC GEOGRAPHY 2.51 (102) 2.22 (97) 2.1 (97) 12.81 (55)JOURNAL OF EVOLUTIONARY ECONOMICS 2.25 (108) 1.97 (101) 2.08 (98) 11.04 (72)KYKLOS 2.96 (93) 1.83 (109) 2.07 (99) 9.03 (99)ENERGY ECONOMICS 1.22 (129) 2.27 (96) 2.04 (100) 10.06 (83)REVIEW OF INDUSTRIAL ORGANIZATION 1.3 (128) 2.15 (98) 2.02 (101) 7.22 (118)JOURNAL OF DEVELOPMENT STUDIES 2.87 (94) 1.9 (106) 2.01 (102) 11.37 (66)ECONOMIC HISTORY REVIEW 5.5 (68) 2.12 (99) 2.01 (103) 5.39 (138)JOURNAL OF TRANSPORT ECONOMICS AND POLICY 0.95 (137) 1.95 (103) 1.98 (104) 6.41 (130)INDUSTRIAL AND CORPORATE CHANGE 1.4 (121) 1.9 (107) 1.92 (105) 10.29 (80)WORLD ECONOMY 4.22 (81) 1.82 (110) 1.89 (106) 7.84 (109)INSURANCE MATHEMATICS & ECONOMICS 1.56 (120) 1.47 (118) 1.89 (107) 7.61 (113)ENVIRONMENTAL & RESOURCE ECONOMICS 2.31 (105) 2.03 (100) 1.86 (108) 12.12 (58)WORLD DEVELOPMENT 2.12 (111) 1.79 (112) 1.78 (109) 10.98 (75)CHINA ECONOMIC REVIEW 0.82 (145) 1.53 (116) 1.77 (110) 10.49 (79)JOURNAL OF REGIONAL SCIENCE 2.75 (96) 1.94 (105) 1.66 (111) 7.69 (110)INTERNATIONAL JOURNAL OF FORECASTING 1.31 (127) 1.95 (104) 1.65 (112) 6.43 (129)AMERICAN JOURNAL OF AGRICULTURAL ECONOMICS 2.09 (112) 1.75 (114) 1.65 (113) 12.17 (57)FISCAL STUDIES 2.25 (106) 1.79 (111) 1.65 (114) 7.44 (116)JOURNAL OF ECONOMIC PSYCHOLOGY 1.71 (118) 1.51 (117) 1.64 (115) 5.31 (142)INFORMATION ECONOMICS AND POLICY 4.24 (80) 1.76 (113) 1.6 (116) 6.68 (124)JAPANESE ECONOMIC REVIEW 6.89 (60) 1.96 (102) 1.59 (117) 5.19 (146)CONTEMPORARY ECONOMIC POLICY 4.41 (78) 1.45 (120) 1.52 (118) 7.11 (121)REVIEW OF INTERNATIONAL POLITICAL ECONOMY 0.42 (155) 1.37 (121) 1.35 (119) 9.57 (89)SCOTTISH JOURNAL OF POLITICAL ECONOMY 1.91 (114) 1.56 (115) 1.35 (120) 6.55 (128)JOURNAL OF ECONOMIC EDUCATION 0.82 (146) 1.19 (127) 1.32 (121) 5.21 (145)JOURNAL OF AFRICAN ECONOMIES 1.77 (116) 1.31 (124) 1.3 (122) 6.91 (123)FEMINIST ECONOMICS 0.15 (162) 0.92 (138) 1.18 (123) 6.64 (125)MANCHESTER SCHOOL 0.43 (153) 1.24 (126) 1.14 (124) 5.34 (141)JOURNAL OF ECONOMICS 2.75 (95) 1.46 (119) 1.12 (125) 4.47 (152)JOURNAL OF MACROECONOMICS 2.64 (97) 1.33 (122) 1.12 (126) 5.51 (136)OPEN ECONOMIES REVIEW 4.55 (76) 1.27 (125) 1.09 (127) 4.48 (151)ECONOMIC DEVELOPMENT QUARTERLY 0.21 (161) 1.32 (123) 1.08 (128) 4.37 (153)CAMBRIDGE JOURNAL OF ECONOMICS 2.55 (100) 1.09 (128) 1.02 (129) 8.42 (102)EUROPEAN REVIEW OF AGRICULTURAL ECONOMICS 0.92 (140) 1.01 (133) 0.98 (130) 11.15 (68)AGRICULTURAL ECONOMICS 1.01 (136) 1.07 (130) 0.97 (131) 9.45 (93)JOURNAL OF AGRICULTURAL AND RESOURCE ECONOMICS 0.48 (151) 1.05 (131) 0.94 (132) 9.19 (95)JAPAN AND THE WORLD ECONOMY 1.85 (115) 1.02 (132) 0.93 (133) 5.14 (148)ECONOMIC RECORD 2.54 (101) 1 (134) 0.93 (134) 5.18 (147)ECONOMIC MODELLING 0.85 (144) 1.08 (129) 0.93 (135) 5.77 (132)ECOLOGICAL ECONOMICS 0.93 (139) 0.92 (136) 0.92 (136) 7.69 (111)ECONOMIST-NETHERLANDS 0.61 (147) 0.88 (139) 0.92 (137) 4.25 (156)AUSTRALIAN JOURNAL OF AGRICULTURAL AND RESOURCE ECONOMICS 2.14 (110) 0.92 (137) 0.83 (138) 9.69 (85)APPLIED ECONOMICS 1.38 (122) 0.95 (135) 0.82 (139) 5.99 (131)ECONOMY AND SOCIETY 0.27 (159) 0.59 (146) 0.77 (140) 7.14 (120)SMALL BUSINESS ECONOMICS 1.32 (126) 0.81 (141) 0.77 (141) 5.36 (140)JOURNAL OF POLICY MODELING 1.22 (130) 0.76 (142) 0.76 (142) 5.67 (135)FOOD POLICY 0.95 (138) 0.83 (140) 0.73 (143) 8.05 (105)JCMS-JOURNAL OF COMMON MARKET STUDIES 0.43 (154) 0.63 (145) 0.72 (144) 6.59 (127)DEFENCE AND PEACE ECONOMICS 1.92 (113) 0.7 (143) 0.69 (145) 4.03 (158)JOURNAL OF AGRICULTURAL ECONOMICS 0.9 (142) 0.7 (144) 0.65 (146) 7.93 (107)AMERICAN JOURNAL OF ECONOMICS AND SOCIOLOGY 2.38 (104) 0.54 (147) 0.61 (147) 4.19 (157)BULLETIN OF INDONESIAN ECONOMIC STUDIES 1.75 (117) 0.42 (150) 0.59 (148) 5.5 (137)POST-SOVIET AFFAIRS 0.6 (148) 0.3 (156) 0.53 (149) 15.61 (44)CANADIAN JOURNAL OF AGRICULTURAL ECONOMICS-REVUE CANADI-ENNE D AGROECONOMIE
1.16 (132) 0.49 (148) 0.4 (150) 5.72 (133)
APPLIED ECONOMICS LETTERS 1.32 (125) 0.44 (149) 0.38 (151) 4.78 (149)VALUE IN HEALTH 0.12 (166) 0.4 (152) 0.37 (152) 3.76 (161)HITOTSUBASHI JOURNAL OF ECONOMICS 1.13 (134) 0.41 (151) 0.35 (153) 2.91 (167)EUROPE-ASIA STUDIES 0.47 (152) 0.24 (158) 0.34 (154) 7.5 (114)SOUTH AFRICAN JOURNAL OF ECONOMICS 0.34 (158) 0.28 (157) 0.32 (155) 3.74 (162)DEVELOPING ECONOMIES 1.14 (133) 0.3 (155) 0.31 (156) 4.37 (154)JOURNAL OF POST KEYNESIAN ECONOMICS 1.19 (131) 0.35 (153) 0.3 (157) 5.29 (143)EURASIAN GEOGRAPHY AND ECONOMICS 0.86 (143) 0.13 (164) 0.3 (158) 9.61 (87)WORK EMPLOYMENT AND SOCIETY 0.1 (167) 0.3 (154) 0.28 (159) 3.93 (159)
26
Journal Inv 3y Inv* 24y VA-index w VA-index uPOST-COMMUNIST ECONOMIES 0.13 (164) 0.23 (160) 0.24 (160) 5.25 (144)JOURNAL OF ECONOMIC ISSUES 0.37 (157) 0.24 (159) 0.19 (161) 3.89 (160)TIJDSCHRIFT VOOR ECONOMISCHE EN SOCIALE GEOGRAFIE 0.13 (165) 0.2 (161) 0.17 (162) 3.41 (164)JAHRBUCHER FUR NATIONALOKONOMIE UND STATISTIK 0.56 (150) 0.19 (162) 0.17 (163) 2.86 (168)EMERGING MARKETS FINANCE AND TRADE 0.37 (156) 0.15 (163) 0.12 (164) 3.47 (163)FUTURES 0.06 (169) 0.12 (165) 0.11 (165) 3.4 (165)EASTERN EUROPEAN ECONOMICS 0.26 (160) 0.09 (166) 0.1 (166) 4.33 (155)JOURNAL OF MEDIA ECONOMICS 0.58 (149) 0.08 (167) 0.07 (167) 3.05 (166)TRIMESTRE ECONOMICO 0.14 (163) 0.06 (168) 0.06 (168) 2.67 (170)REVUE D ETUDES COMPARATIVES EST-OUEST 0 (171) 0.01 (170) 0.01 (169) 2.5 (171)POLITICKA EKONOMIE 0.08 (168) 0.01 (169) 0.01 (170) 4.67 (150)EKONOMICKY CASOPIS 0.05 (170) 0 (171) 0 (171) 2.83 (169)EKONOMISKA SAMFUNDETS TIDSKRIFT 0 (172) 0 (172) 0 (172) 2.33 (172)
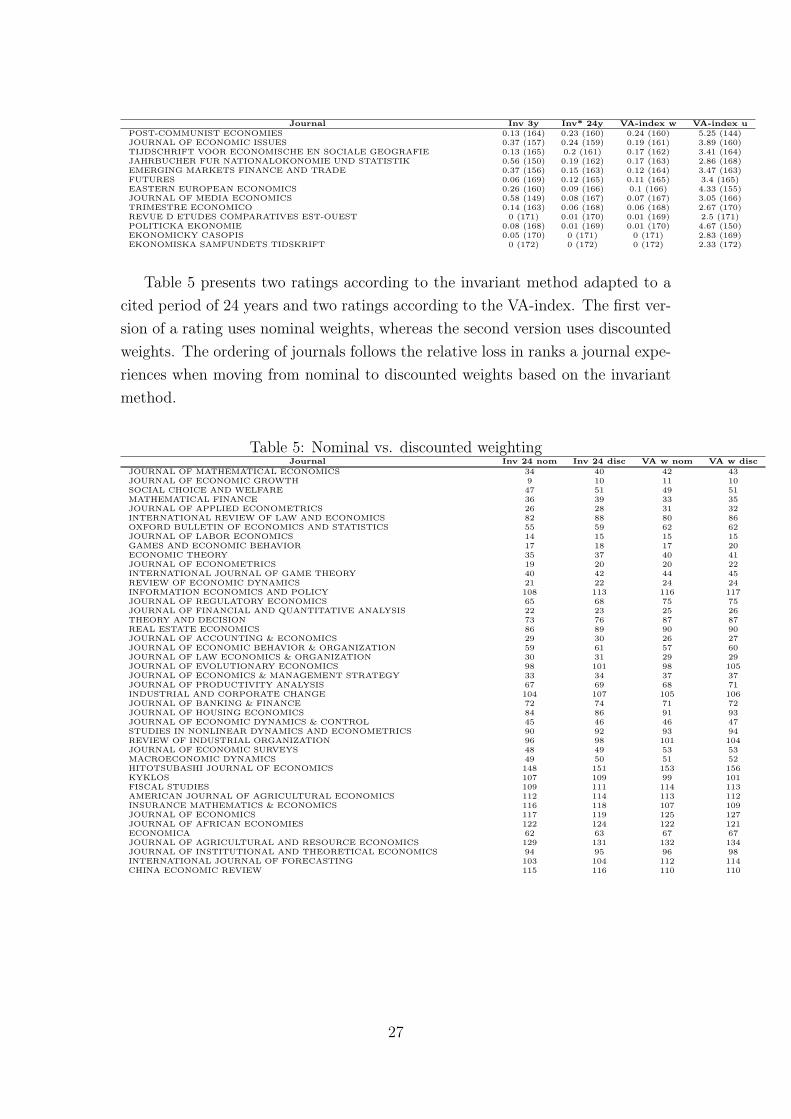
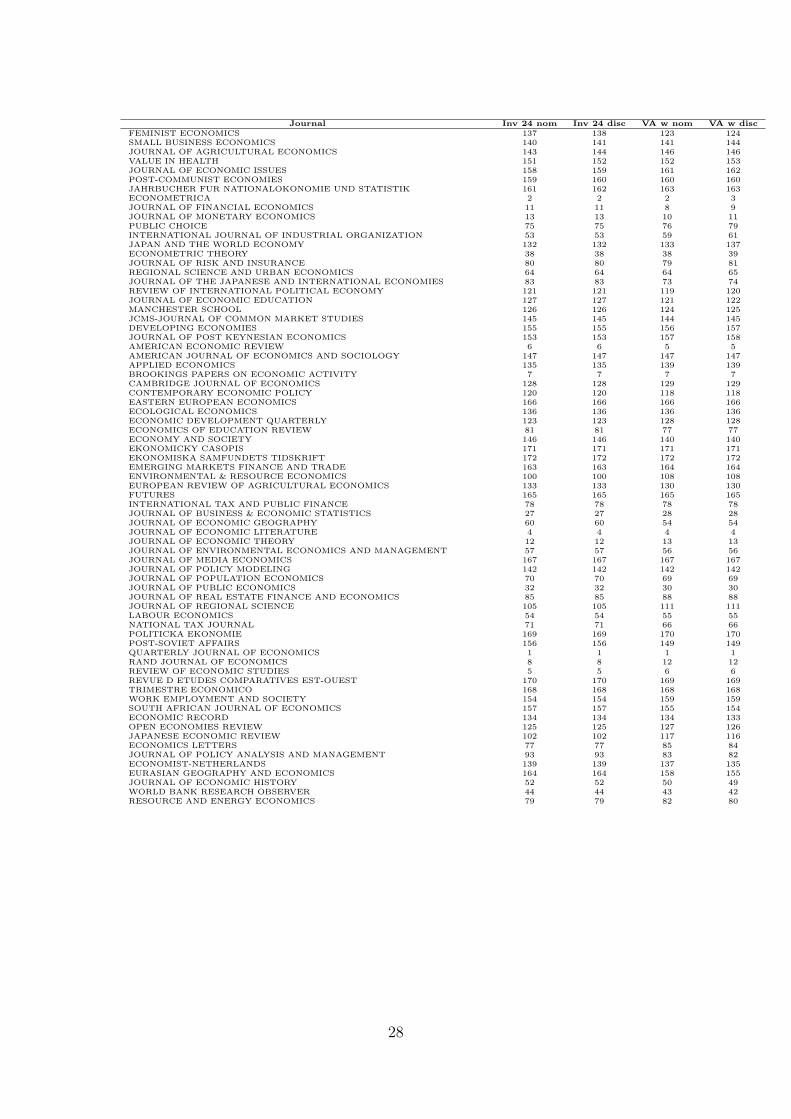
Table 5 presents two ratings according to the invariant method adapted to acited period of 24 years and two ratings according to the VA-index. The first ver-sion of a rating uses nominal weights, whereas the second version uses discountedweights. The ordering of journals follows the relative loss in ranks a journal expe-riences when moving from nominal to discounted weights based on the invariantmethod.
Table 5: Nominal vs. discounted weightingJournal Inv 24 nom Inv 24 disc VA w nom VA w disc
JOURNAL OF MATHEMATICAL ECONOMICS 34 40 42 43JOURNAL OF ECONOMIC GROWTH 9 10 11 10SOCIAL CHOICE AND WELFARE 47 51 49 51MATHEMATICAL FINANCE 36 39 33 35JOURNAL OF APPLIED ECONOMETRICS 26 28 31 32INTERNATIONAL REVIEW OF LAW AND ECONOMICS 82 88 80 86OXFORD BULLETIN OF ECONOMICS AND STATISTICS 55 59 62 62JOURNAL OF LABOR ECONOMICS 14 15 15 15GAMES AND ECONOMIC BEHAVIOR 17 18 17 20ECONOMIC THEORY 35 37 40 41JOURNAL OF ECONOMETRICS 19 20 20 22INTERNATIONAL JOURNAL OF GAME THEORY 40 42 44 45REVIEW OF ECONOMIC DYNAMICS 21 22 24 24INFORMATION ECONOMICS AND POLICY 108 113 116 117JOURNAL OF REGULATORY ECONOMICS 65 68 75 75JOURNAL OF FINANCIAL AND QUANTITATIVE ANALYSIS 22 23 25 26THEORY AND DECISION 73 76 87 87REAL ESTATE ECONOMICS 86 89 90 90JOURNAL OF ACCOUNTING & ECONOMICS 29 30 26 27JOURNAL OF ECONOMIC BEHAVIOR & ORGANIZATION 59 61 57 60JOURNAL OF LAW ECONOMICS & ORGANIZATION 30 31 29 29JOURNAL OF EVOLUTIONARY ECONOMICS 98 101 98 105JOURNAL OF ECONOMICS & MANAGEMENT STRATEGY 33 34 37 37JOURNAL OF PRODUCTIVITY ANALYSIS 67 69 68 71INDUSTRIAL AND CORPORATE CHANGE 104 107 105 106JOURNAL OF BANKING & FINANCE 72 74 71 72JOURNAL OF HOUSING ECONOMICS 84 86 91 93JOURNAL OF ECONOMIC DYNAMICS & CONTROL 45 46 46 47STUDIES IN NONLINEAR DYNAMICS AND ECONOMETRICS 90 92 93 94REVIEW OF INDUSTRIAL ORGANIZATION 96 98 101 104JOURNAL OF ECONOMIC SURVEYS 48 49 53 53MACROECONOMIC DYNAMICS 49 50 51 52HITOTSUBASHI JOURNAL OF ECONOMICS 148 151 153 156KYKLOS 107 109 99 101FISCAL STUDIES 109 111 114 113AMERICAN JOURNAL OF AGRICULTURAL ECONOMICS 112 114 113 112INSURANCE MATHEMATICS & ECONOMICS 116 118 107 109JOURNAL OF ECONOMICS 117 119 125 127JOURNAL OF AFRICAN ECONOMIES 122 124 122 121ECONOMICA 62 63 67 67JOURNAL OF AGRICULTURAL AND RESOURCE ECONOMICS 129 131 132 134JOURNAL OF INSTITUTIONAL AND THEORETICAL ECONOMICS 94 95 96 98INTERNATIONAL JOURNAL OF FORECASTING 103 104 112 114CHINA ECONOMIC REVIEW 115 116 110 110
27
Journal Inv 24 nom Inv 24 disc VA w nom VA w discFEMINIST ECONOMICS 137 138 123 124SMALL BUSINESS ECONOMICS 140 141 141 144JOURNAL OF AGRICULTURAL ECONOMICS 143 144 146 146VALUE IN HEALTH 151 152 152 153JOURNAL OF ECONOMIC ISSUES 158 159 161 162POST-COMMUNIST ECONOMIES 159 160 160 160JAHRBUCHER FUR NATIONALOKONOMIE UND STATISTIK 161 162 163 163ECONOMETRICA 2 2 2 3JOURNAL OF FINANCIAL ECONOMICS 11 11 8 9JOURNAL OF MONETARY ECONOMICS 13 13 10 11PUBLIC CHOICE 75 75 76 79INTERNATIONAL JOURNAL OF INDUSTRIAL ORGANIZATION 53 53 59 61JAPAN AND THE WORLD ECONOMY 132 132 133 137ECONOMETRIC THEORY 38 38 38 39JOURNAL OF RISK AND INSURANCE 80 80 79 81REGIONAL SCIENCE AND URBAN ECONOMICS 64 64 64 65JOURNAL OF THE JAPANESE AND INTERNATIONAL ECONOMIES 83 83 73 74REVIEW OF INTERNATIONAL POLITICAL ECONOMY 121 121 119 120JOURNAL OF ECONOMIC EDUCATION 127 127 121 122MANCHESTER SCHOOL 126 126 124 125JCMS-JOURNAL OF COMMON MARKET STUDIES 145 145 144 145DEVELOPING ECONOMIES 155 155 156 157JOURNAL OF POST KEYNESIAN ECONOMICS 153 153 157 158AMERICAN ECONOMIC REVIEW 6 6 5 5AMERICAN JOURNAL OF ECONOMICS AND SOCIOLOGY 147 147 147 147APPLIED ECONOMICS 135 135 139 139BROOKINGS PAPERS ON ECONOMIC ACTIVITY 7 7 7 7CAMBRIDGE JOURNAL OF ECONOMICS 128 128 129 129CONTEMPORARY ECONOMIC POLICY 120 120 118 118EASTERN EUROPEAN ECONOMICS 166 166 166 166ECOLOGICAL ECONOMICS 136 136 136 136ECONOMIC DEVELOPMENT QUARTERLY 123 123 128 128ECONOMICS OF EDUCATION REVIEW 81 81 77 77ECONOMY AND SOCIETY 146 146 140 140EKONOMICKY CASOPIS 171 171 171 171EKONOMISKA SAMFUNDETS TIDSKRIFT 172 172 172 172EMERGING MARKETS FINANCE AND TRADE 163 163 164 164ENVIRONMENTAL & RESOURCE ECONOMICS 100 100 108 108EUROPEAN REVIEW OF AGRICULTURAL ECONOMICS 133 133 130 130FUTURES 165 165 165 165INTERNATIONAL TAX AND PUBLIC FINANCE 78 78 78 78JOURNAL OF BUSINESS & ECONOMIC STATISTICS 27 27 28 28JOURNAL OF ECONOMIC GEOGRAPHY 60 60 54 54JOURNAL OF ECONOMIC LITERATURE 4 4 4 4JOURNAL OF ECONOMIC THEORY 12 12 13 13JOURNAL OF ENVIRONMENTAL ECONOMICS AND MANAGEMENT 57 57 56 56JOURNAL OF MEDIA ECONOMICS 167 167 167 167JOURNAL OF POLICY MODELING 142 142 142 142JOURNAL OF POPULATION ECONOMICS 70 70 69 69JOURNAL OF PUBLIC ECONOMICS 32 32 30 30JOURNAL OF REAL ESTATE FINANCE AND ECONOMICS 85 85 88 88JOURNAL OF REGIONAL SCIENCE 105 105 111 111LABOUR ECONOMICS 54 54 55 55NATIONAL TAX JOURNAL 71 71 66 66POLITICKA EKONOMIE 169 169 170 170POST-SOVIET AFFAIRS 156 156 149 149QUARTERLY JOURNAL OF ECONOMICS 1 1 1 1RAND JOURNAL OF ECONOMICS 8 8 12 12REVIEW OF ECONOMIC STUDIES 5 5 6 6REVUE D ETUDES COMPARATIVES EST-OUEST 170 170 169 169TRIMESTRE ECONOMICO 168 168 168 168WORK EMPLOYMENT AND SOCIETY 154 154 159 159SOUTH AFRICAN JOURNAL OF ECONOMICS 157 157 155 154ECONOMIC RECORD 134 134 134 133OPEN ECONOMIES REVIEW 125 125 127 126JAPANESE ECONOMIC REVIEW 102 102 117 116ECONOMICS LETTERS 77 77 85 84JOURNAL OF POLICY ANALYSIS AND MANAGEMENT 93 93 83 82ECONOMIST-NETHERLANDS 139 139 137 135EURASIAN GEOGRAPHY AND ECONOMICS 164 164 158 155JOURNAL OF ECONOMIC HISTORY 52 52 50 49WORLD BANK RESEARCH OBSERVER 44 44 43 42RESOURCE AND ENERGY ECONOMICS 79 79 82 80
28
Journal Inv 24 nom Inv 24 disc VA w nom VA w discJOURNAL OF HEALTH ECONOMICS 43 43 39 38AER Papers & Proceedings 24 24 22 21ECONOMIC JOURNAL 25 25 27 25INTERNATIONAL ECONOMIC REVIEW 16 16 19 17JOURNAL OF POLITICAL ECONOMY 3 3 3 2TIJDSCHRIFT VOOR ECONOMISCHE EN SOCIALE GEOGRAFIE 162 161 162 161APPLIED ECONOMICS LETTERS 150 149 151 151CANADIAN JOURNAL OF AGRICULTURAL ECONOMICS-REVUE CANADI-ENNE D AGROECONOMIE
149 148 150 150
DEFENCE AND PEACE ECONOMICS 144 143 145 143FOOD POLICY 141 140 143 141AUSTRALIAN JOURNAL OF AGRICULTURAL AND RESOURCE ECONOMICS 138 137 138 138AGRICULTURAL ECONOMICS 131 130 131 131ECONOMIC MODELLING 130 129 135 132JOURNAL OF ECONOMIC PSYCHOLOGY 118 117 115 115ENERGY ECONOMICS 97 96 100 99ECONOMICS OF TRANSITION 95 94 92 92SOUTHERN ECONOMIC JOURNAL 92 91 94 91ECONOMIC DEVELOPMENT AND CULTURAL CHANGE 91 90 86 83LAND ECONOMICS 88 87 89 89EUROPE-ASIA STUDIES 160 158 154 152BULLETIN OF INDONESIAN ECONOMIC STUDIES 152 150 148 148ENERGY JOURNAL 66 65 65 64EXPLORATIONS IN ECONOMIC HISTORY 63 62 61 58JOURNAL OF MACROECONOMICS 124 122 126 123WORLD DEVELOPMENT 114 112 109 107IMF STAFF PAPERS 56 55 52 50ECONOMIC HISTORY REVIEW 101 99 103 97ECONOMIC GEOGRAPHY 99 97 97 96JOURNAL OF URBAN ECONOMICS 46 45 45 44JOURNAL OF RISK AND UNCERTAINTY 42 41 41 40WORLD ECONOMY 113 110 106 103REVIEW OF WORLD ECONOMICS 111 108 95 95OXFORD REVIEW OF ECONOMIC POLICY 74 72 72 70JOURNAL OF TRANSPORT ECONOMICS AND POLICY 106 103 104 102ECONOMICS AND PHILOSOPHY 69 67 74 73CANADIAN JOURNAL OF ECONOMICS-REVUE CANADIENNE DECONOMIQUE
68 66 70 68
SCOTTISH JOURNAL OF POLITICAL ECONOMY 119 115 120 119HEALTH ECONOMICS 87 84 84 85SCANDINAVIAN JOURNAL OF ECONOMICS 58 56 58 57JOURNAL OF DEVELOPMENT STUDIES 110 106 102 100REVIEW OF INCOME AND WEALTH 76 73 63 63ECONOMIC INQUIRY 50 48 48 48OXFORD ECONOMIC PAPERS-NEW SERIES 61 58 60 59JOURNAL OF LAW & ECONOMICS 20 19 21 19ECONOMIC POLICY 18 17 14 14JOURNAL OF INDUSTRIAL ECONOMICS 31 29 32 31REVIEW OF ECONOMICS AND STATISTICS 15 14 16 16JOURNAL OF INTERNATIONAL ECONOMICS 28 26 23 23JOURNAL OF DEVELOPMENT ECONOMICS 51 47 47 46JOURNAL OF COMPARATIVE ECONOMICS 89 82 81 76JOURNAL OF HUMAN RESOURCES 23 21 18 18JOURNAL OF ECONOMIC PERSPECTIVES 10 9 9 8WORLD BANK ECONOMIC REVIEW 39 35 34 33EUROPEAN ECONOMIC REVIEW 37 33 35 34JOURNAL OF MONEY CREDIT AND BANKING 41 36 36 36
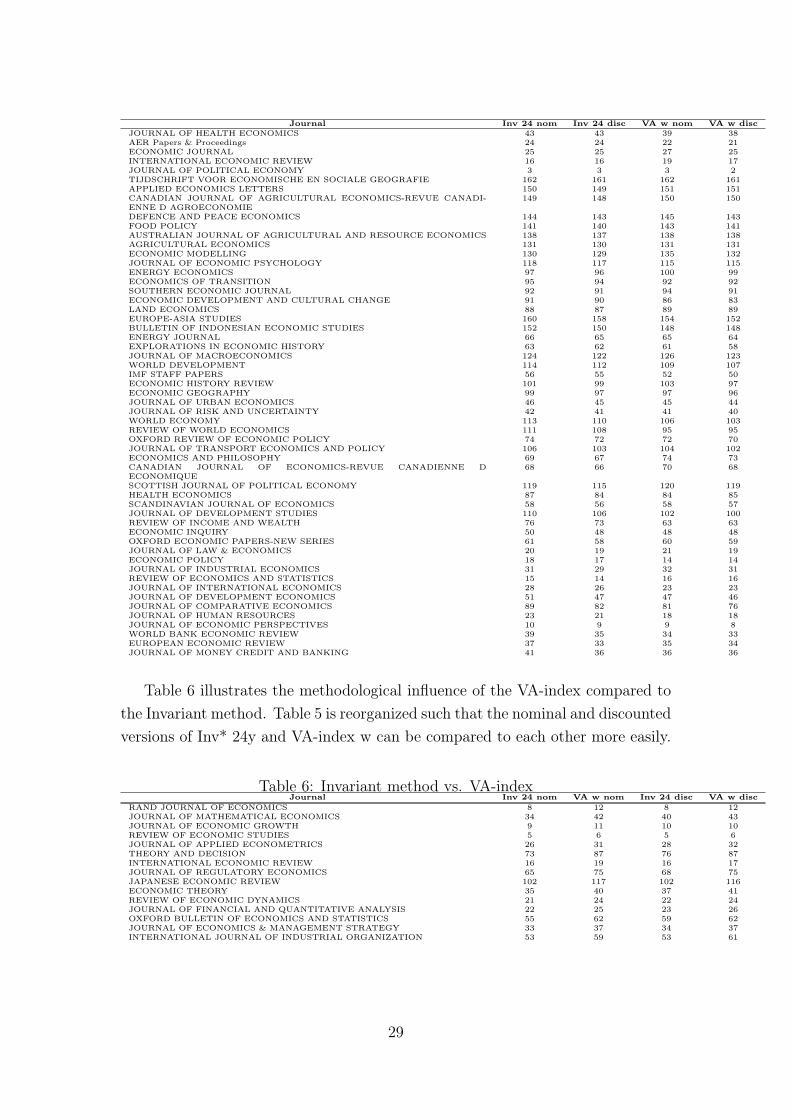
Table 6 illustrates the methodological influence of the VA-index compared tothe Invariant method. Table 5 is reorganized such that the nominal and discountedversions of Inv* 24y and VA-index w can be compared to each other more easily.
Table 6: Invariant method vs. VA-indexJournal Inv 24 nom VA w nom Inv 24 disc VA w disc
RAND JOURNAL OF ECONOMICS 8 12 8 12JOURNAL OF MATHEMATICAL ECONOMICS 34 42 40 43JOURNAL OF ECONOMIC GROWTH 9 11 10 10REVIEW OF ECONOMIC STUDIES 5 6 5 6JOURNAL OF APPLIED ECONOMETRICS 26 31 28 32THEORY AND DECISION 73 87 76 87INTERNATIONAL ECONOMIC REVIEW 16 19 16 17JOURNAL OF REGULATORY ECONOMICS 65 75 68 75JAPANESE ECONOMIC REVIEW 102 117 102 116ECONOMIC THEORY 35 40 37 41REVIEW OF ECONOMIC DYNAMICS 21 24 22 24JOURNAL OF FINANCIAL AND QUANTITATIVE ANALYSIS 22 25 23 26OXFORD BULLETIN OF ECONOMICS AND STATISTICS 55 62 59 62JOURNAL OF ECONOMICS & MANAGEMENT STRATEGY 33 37 34 37INTERNATIONAL JOURNAL OF INDUSTRIAL ORGANIZATION 53 59 53 61
29
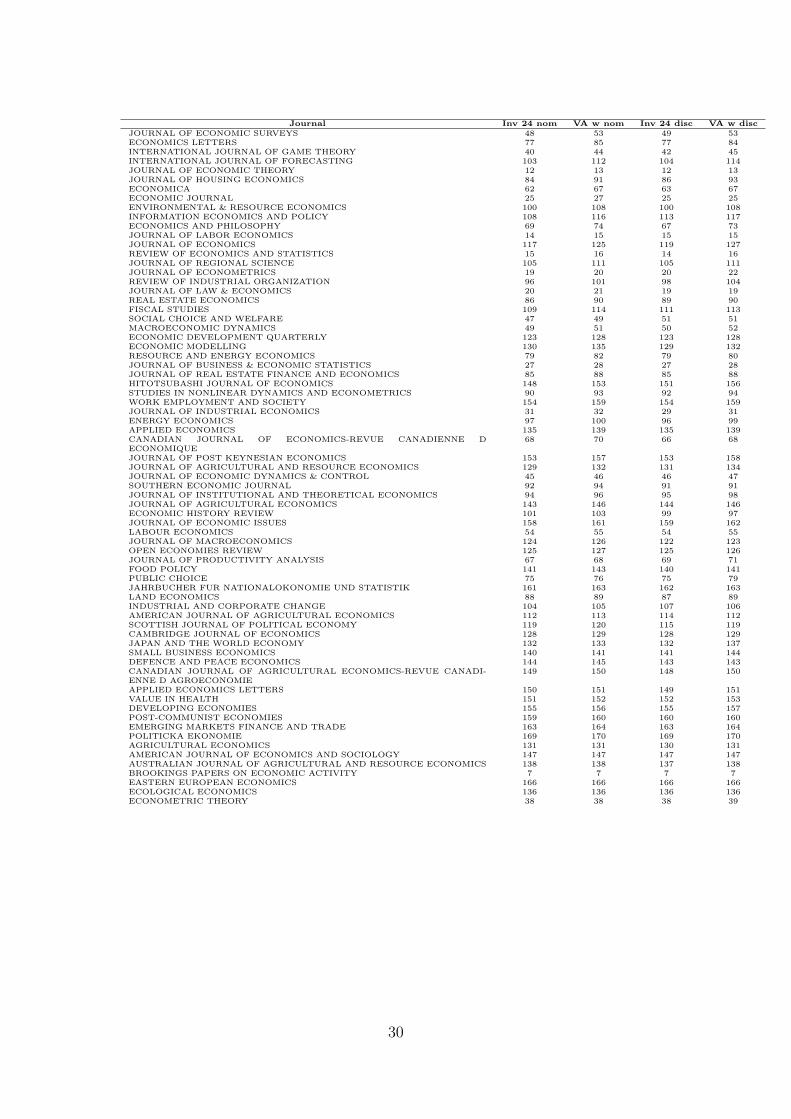
Journal Inv 24 nom VA w nom Inv 24 disc VA w discJOURNAL OF ECONOMIC SURVEYS 48 53 49 53ECONOMICS LETTERS 77 85 77 84INTERNATIONAL JOURNAL OF GAME THEORY 40 44 42 45INTERNATIONAL JOURNAL OF FORECASTING 103 112 104 114JOURNAL OF ECONOMIC THEORY 12 13 12 13JOURNAL OF HOUSING ECONOMICS 84 91 86 93ECONOMICA 62 67 63 67ECONOMIC JOURNAL 25 27 25 25ENVIRONMENTAL & RESOURCE ECONOMICS 100 108 100 108INFORMATION ECONOMICS AND POLICY 108 116 113 117ECONOMICS AND PHILOSOPHY 69 74 67 73JOURNAL OF LABOR ECONOMICS 14 15 15 15JOURNAL OF ECONOMICS 117 125 119 127REVIEW OF ECONOMICS AND STATISTICS 15 16 14 16JOURNAL OF REGIONAL SCIENCE 105 111 105 111JOURNAL OF ECONOMETRICS 19 20 20 22REVIEW OF INDUSTRIAL ORGANIZATION 96 101 98 104JOURNAL OF LAW & ECONOMICS 20 21 19 19REAL ESTATE ECONOMICS 86 90 89 90FISCAL STUDIES 109 114 111 113SOCIAL CHOICE AND WELFARE 47 49 51 51MACROECONOMIC DYNAMICS 49 51 50 52ECONOMIC DEVELOPMENT QUARTERLY 123 128 123 128ECONOMIC MODELLING 130 135 129 132RESOURCE AND ENERGY ECONOMICS 79 82 79 80JOURNAL OF BUSINESS & ECONOMIC STATISTICS 27 28 27 28JOURNAL OF REAL ESTATE FINANCE AND ECONOMICS 85 88 85 88HITOTSUBASHI JOURNAL OF ECONOMICS 148 153 151 156STUDIES IN NONLINEAR DYNAMICS AND ECONOMETRICS 90 93 92 94WORK EMPLOYMENT AND SOCIETY 154 159 154 159JOURNAL OF INDUSTRIAL ECONOMICS 31 32 29 31ENERGY ECONOMICS 97 100 96 99APPLIED ECONOMICS 135 139 135 139CANADIAN JOURNAL OF ECONOMICS-REVUE CANADIENNE DECONOMIQUE
68 70 66 68
JOURNAL OF POST KEYNESIAN ECONOMICS 153 157 153 158JOURNAL OF AGRICULTURAL AND RESOURCE ECONOMICS 129 132 131 134JOURNAL OF ECONOMIC DYNAMICS & CONTROL 45 46 46 47SOUTHERN ECONOMIC JOURNAL 92 94 91 91JOURNAL OF INSTITUTIONAL AND THEORETICAL ECONOMICS 94 96 95 98JOURNAL OF AGRICULTURAL ECONOMICS 143 146 144 146ECONOMIC HISTORY REVIEW 101 103 99 97JOURNAL OF ECONOMIC ISSUES 158 161 159 162LABOUR ECONOMICS 54 55 54 55JOURNAL OF MACROECONOMICS 124 126 122 123OPEN ECONOMIES REVIEW 125 127 125 126JOURNAL OF PRODUCTIVITY ANALYSIS 67 68 69 71FOOD POLICY 141 143 140 141PUBLIC CHOICE 75 76 75 79JAHRBUCHER FUR NATIONALOKONOMIE UND STATISTIK 161 163 162 163LAND ECONOMICS 88 89 87 89INDUSTRIAL AND CORPORATE CHANGE 104 105 107 106AMERICAN JOURNAL OF AGRICULTURAL ECONOMICS 112 113 114 112SCOTTISH JOURNAL OF POLITICAL ECONOMY 119 120 115 119CAMBRIDGE JOURNAL OF ECONOMICS 128 129 128 129JAPAN AND THE WORLD ECONOMY 132 133 132 137SMALL BUSINESS ECONOMICS 140 141 141 144DEFENCE AND PEACE ECONOMICS 144 145 143 143CANADIAN JOURNAL OF AGRICULTURAL ECONOMICS-REVUE CANADI-ENNE D AGROECONOMIE
149 150 148 150
APPLIED ECONOMICS LETTERS 150 151 149 151VALUE IN HEALTH 151 152 152 153DEVELOPING ECONOMIES 155 156 155 157POST-COMMUNIST ECONOMIES 159 160 160 160EMERGING MARKETS FINANCE AND TRADE 163 164 163 164POLITICKA EKONOMIE 169 170 169 170AGRICULTURAL ECONOMICS 131 131 130 131AMERICAN JOURNAL OF ECONOMICS AND SOCIOLOGY 147 147 147 147AUSTRALIAN JOURNAL OF AGRICULTURAL AND RESOURCE ECONOMICS 138 138 137 138BROOKINGS PAPERS ON ECONOMIC ACTIVITY 7 7 7 7EASTERN EUROPEAN ECONOMICS 166 166 166 166ECOLOGICAL ECONOMICS 136 136 136 136ECONOMETRIC THEORY 38 38 38 39
30
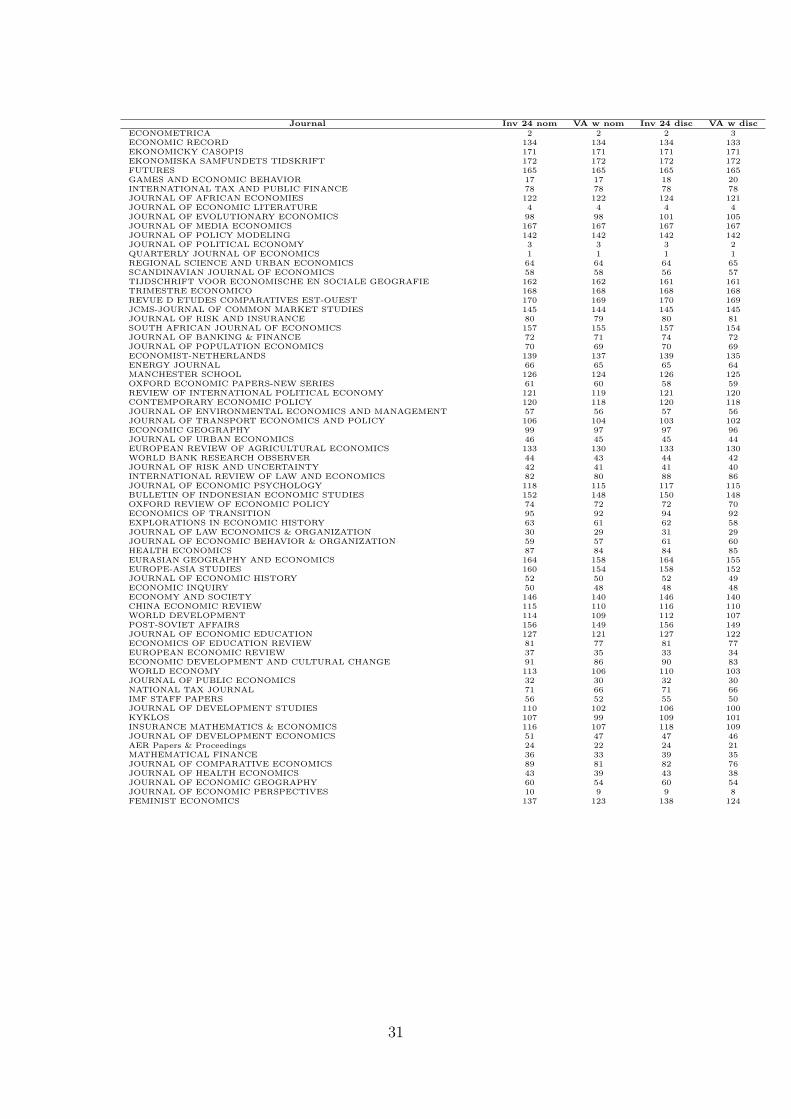
Journal Inv 24 nom VA w nom Inv 24 disc VA w discECONOMETRICA 2 2 2 3ECONOMIC RECORD 134 134 134 133EKONOMICKY CASOPIS 171 171 171 171EKONOMISKA SAMFUNDETS TIDSKRIFT 172 172 172 172FUTURES 165 165 165 165GAMES AND ECONOMIC BEHAVIOR 17 17 18 20INTERNATIONAL TAX AND PUBLIC FINANCE 78 78 78 78JOURNAL OF AFRICAN ECONOMIES 122 122 124 121JOURNAL OF ECONOMIC LITERATURE 4 4 4 4JOURNAL OF EVOLUTIONARY ECONOMICS 98 98 101 105JOURNAL OF MEDIA ECONOMICS 167 167 167 167JOURNAL OF POLICY MODELING 142 142 142 142JOURNAL OF POLITICAL ECONOMY 3 3 3 2QUARTERLY JOURNAL OF ECONOMICS 1 1 1 1REGIONAL SCIENCE AND URBAN ECONOMICS 64 64 64 65SCANDINAVIAN JOURNAL OF ECONOMICS 58 58 56 57TIJDSCHRIFT VOOR ECONOMISCHE EN SOCIALE GEOGRAFIE 162 162 161 161TRIMESTRE ECONOMICO 168 168 168 168REVUE D ETUDES COMPARATIVES EST-OUEST 170 169 170 169JCMS-JOURNAL OF COMMON MARKET STUDIES 145 144 145 145JOURNAL OF RISK AND INSURANCE 80 79 80 81SOUTH AFRICAN JOURNAL OF ECONOMICS 157 155 157 154JOURNAL OF BANKING & FINANCE 72 71 74 72JOURNAL OF POPULATION ECONOMICS 70 69 70 69ECONOMIST-NETHERLANDS 139 137 139 135ENERGY JOURNAL 66 65 65 64MANCHESTER SCHOOL 126 124 126 125OXFORD ECONOMIC PAPERS-NEW SERIES 61 60 58 59REVIEW OF INTERNATIONAL POLITICAL ECONOMY 121 119 121 120CONTEMPORARY ECONOMIC POLICY 120 118 120 118JOURNAL OF ENVIRONMENTAL ECONOMICS AND MANAGEMENT 57 56 57 56JOURNAL OF TRANSPORT ECONOMICS AND POLICY 106 104 103 102ECONOMIC GEOGRAPHY 99 97 97 96JOURNAL OF URBAN ECONOMICS 46 45 45 44EUROPEAN REVIEW OF AGRICULTURAL ECONOMICS 133 130 133 130WORLD BANK RESEARCH OBSERVER 44 43 44 42JOURNAL OF RISK AND UNCERTAINTY 42 41 41 40INTERNATIONAL REVIEW OF LAW AND ECONOMICS 82 80 88 86JOURNAL OF ECONOMIC PSYCHOLOGY 118 115 117 115BULLETIN OF INDONESIAN ECONOMIC STUDIES 152 148 150 148OXFORD REVIEW OF ECONOMIC POLICY 74 72 72 70ECONOMICS OF TRANSITION 95 92 94 92EXPLORATIONS IN ECONOMIC HISTORY 63 61 62 58JOURNAL OF LAW ECONOMICS & ORGANIZATION 30 29 31 29JOURNAL OF ECONOMIC BEHAVIOR & ORGANIZATION 59 57 61 60HEALTH ECONOMICS 87 84 84 85EURASIAN GEOGRAPHY AND ECONOMICS 164 158 164 155EUROPE-ASIA STUDIES 160 154 158 152JOURNAL OF ECONOMIC HISTORY 52 50 52 49ECONOMIC INQUIRY 50 48 48 48ECONOMY AND SOCIETY 146 140 146 140CHINA ECONOMIC REVIEW 115 110 116 110WORLD DEVELOPMENT 114 109 112 107POST-SOVIET AFFAIRS 156 149 156 149JOURNAL OF ECONOMIC EDUCATION 127 121 127 122ECONOMICS OF EDUCATION REVIEW 81 77 81 77EUROPEAN ECONOMIC REVIEW 37 35 33 34ECONOMIC DEVELOPMENT AND CULTURAL CHANGE 91 86 90 83WORLD ECONOMY 113 106 110 103JOURNAL OF PUBLIC ECONOMICS 32 30 32 30NATIONAL TAX JOURNAL 71 66 71 66IMF STAFF PAPERS 56 52 55 50JOURNAL OF DEVELOPMENT STUDIES 110 102 106 100KYKLOS 107 99 109 101INSURANCE MATHEMATICS & ECONOMICS 116 107 118 109JOURNAL OF DEVELOPMENT ECONOMICS 51 47 47 46AER Papers & Proceedings 24 22 24 21MATHEMATICAL FINANCE 36 33 39 35JOURNAL OF COMPARATIVE ECONOMICS 89 81 82 76JOURNAL OF HEALTH ECONOMICS 43 39 43 38JOURNAL OF ECONOMIC GEOGRAPHY 60 54 60 54JOURNAL OF ECONOMIC PERSPECTIVES 10 9 9 8FEMINIST ECONOMICS 137 123 138 124
31
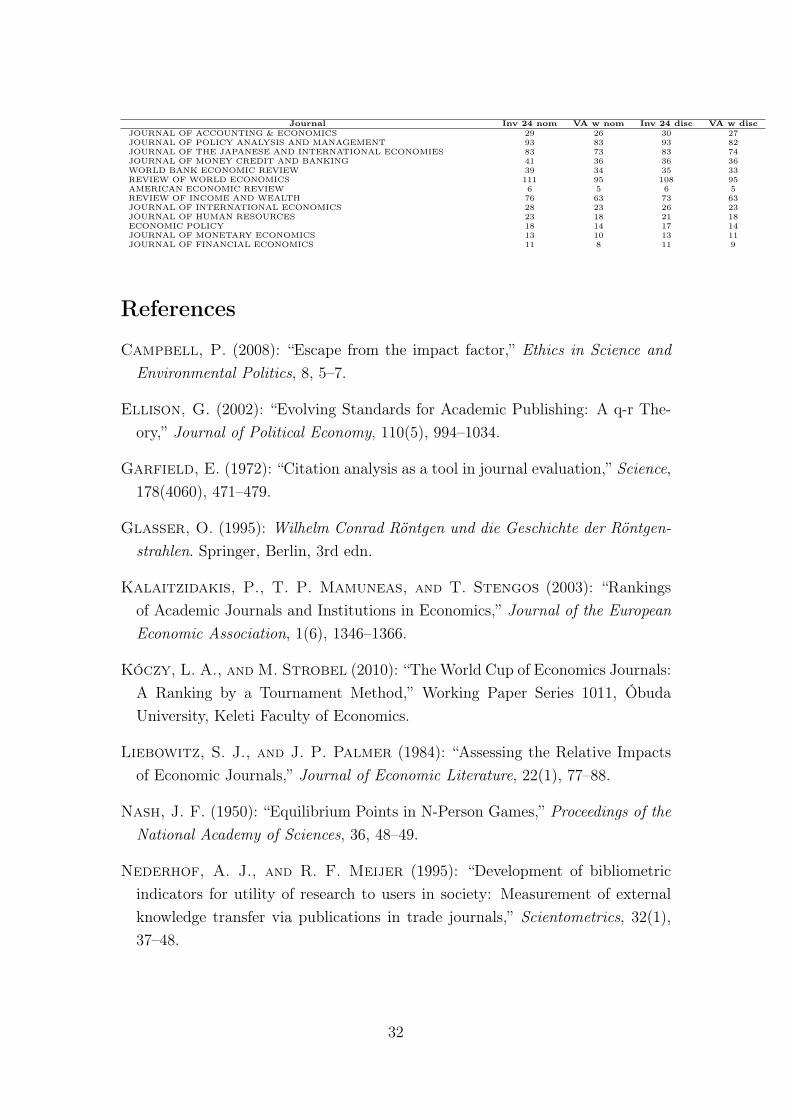
Journal Inv 24 nom VA w nom Inv 24 disc VA w discJOURNAL OF ACCOUNTING & ECONOMICS 29 26 30 27JOURNAL OF POLICY ANALYSIS AND MANAGEMENT 93 83 93 82JOURNAL OF THE JAPANESE AND INTERNATIONAL ECONOMIES 83 73 83 74JOURNAL OF MONEY CREDIT AND BANKING 41 36 36 36WORLD BANK ECONOMIC REVIEW 39 34 35 33REVIEW OF WORLD ECONOMICS 111 95 108 95AMERICAN ECONOMIC REVIEW 6 5 6 5REVIEW OF INCOME AND WEALTH 76 63 73 63JOURNAL OF INTERNATIONAL ECONOMICS 28 23 26 23JOURNAL OF HUMAN RESOURCES 23 18 21 18ECONOMIC POLICY 18 14 17 14JOURNAL OF MONETARY ECONOMICS 13 10 13 11JOURNAL OF FINANCIAL ECONOMICS 11 8 11 9
References
Campbell, P. (2008): “Escape from the impact factor,” Ethics in Science andEnvironmental Politics, 8, 5–7.
Ellison, G. (2002): “Evolving Standards for Academic Publishing: A q-r The-ory,” Journal of Political Economy, 110(5), 994–1034.
Garfield, E. (1972): “Citation analysis as a tool in journal evaluation,” Science,178(4060), 471–479.
Glasser, O. (1995): Wilhelm Conrad Röntgen und die Geschichte der Röntgen-strahlen. Springer, Berlin, 3rd edn.
Kalaitzidakis, P., T. P. Mamuneas, and T. Stengos (2003): “Rankingsof Academic Journals and Institutions in Economics,” Journal of the EuropeanEconomic Association, 1(6), 1346–1366.
Kóczy, L. A., and M. Strobel (2010): “The World Cup of Economics Journals:A Ranking by a Tournament Method,” Working Paper Series 1011, ÓbudaUniversity, Keleti Faculty of Economics.
Liebowitz, S. J., and J. P. Palmer (1984): “Assessing the Relative Impactsof Economic Journals,” Journal of Economic Literature, 22(1), 77–88.
Nash, J. F. (1950): “Equilibrium Points in N-Person Games,” Proceedings of theNational Academy of Sciences, 36, 48–49.
Nederhof, A. J., and R. F. Meijer (1995): “Development of bibliometricindicators for utility of research to users in society: Measurement of externalknowledge transfer via publications in trade journals,” Scientometrics, 32(1),37–48.
32
Oswald, A. J. (2007): “An Examination of the Reliability of Prestigious Schol-arly Journals: Evidence and Implications for Decision-Makers,” Economica,74(293), 21–31.
Palacios-Huerta, I., and O. Volij (2004): “The Measurement of IntellectualInfluence,” Econometrica, 72(3), 963–977.
Pinski, G., and F. Narin (1976): “Citation influence for journal aggregates ofscientific publications: Theory, with application to the literature of physics,”Information Processing & Management, 12(5), 297 – 312.
Ravallion, M., and A. Wagstaff (2010): “On measuring scientific influence,”Policy Research Working Paper Series 5375, The World Bank.
Ritzberger, K. (2008): “A Ranking of Journals in Economics and RelatedFields,” German Economic Review, 9, 402–430.
Romer, P. M. (1990): “Endogenous Technological Change,” Journal of PoliticalEconomy, 98(5), S71–102.
Serrano, R. (2004): “The Measurement of Intellectual Influence: the Views ofa Sceptic,” Economics Bulletin, 1(3), 1–6.
Shanley, P., and C. López (2009): “Out of the Loop: Why Research RarelyReaches Policy Makers and the Public and What Can be Done,” Biotropica, 41,535–544.
Sunderland, T., J. Sunderland-Groves, P. Shanley, and B. Campbell(2009): “Bridging the Gap: How Can Information Access and Exchange Be-tween Conservation Biologists and Field Practitioners be Improved for BetterConservation Outcomes?,” Biotropica, 41, 549–554.
Ursprung, H. W., and M. Zimmer (2007): “Who is the “Platz-Hirsch” of theGerman Economics Profession? A Citation Analysis,” Journal of Economicsand Statistics (Jahrbücher für Nationalökonomie und Statistik), 227(2), 187–208.
33