Embed Size (px)
Citation preview

1
MEASURING THE POTENTIAL CONTRIBUTION OF DEVELOPMENT FINANCE INSTITUTIONS TO ECONOMIC TRANSFORMATION
Alberto F. Lemma
September 2018

MEASURING THE POTENTIAL CONTRIBUTION OF DFIS TO ECONOMIC TRANSFORMATION|
ii
Acknowledgements The author would like to thank Dirk Willem te Velde (ODI) for his invaluable comments throughout the writing process, Miguel Laric (DFID) and Adrian Stone (DFID), Camilo Mondragon (IFC) and Deepa Chakrapani (IFC) for their insights at the IFC and Alex MacGillivray at the CDC. For further information about the ODI’s Supporting Economic Transformation (SET) please visit our online portal at www.set.odi.org or contact Georgia Cooke, Acting Programme Manager ([email protected]).
© SUPPORTING ECONOMIC TRANSFORMATION. The views presented in this publication are those of the author(s) and do not necessarily represent the views of DFID or ODI.
MEASURING THE POTENTIAL CONTRIBUTION OF DFIS TO ECONOMIC TRANSFORMATION|
iii
CONTENTS Acronyms __________________________________________________ iv
Executive summary ____________________________________________ v
1 Introduction ________________________________________________ 1
2 Economic transformation through FDI impacts _____________________ 2
2.1 Pathways to economic transformation ___________________________________ 2
2.1.1 Between sectors ______________________________________________________ 2 2.1.2 Within sector _________________________________________________________ 3
2.2 FDI and economic transformation ______________________________________ 6
2.2.1 FDI and promoting higher-productivity sectors _______________________________ 6 2.2.2 FDI support to sector and firm performance _________________________________ 8
3 How to measure economic transformation ________________________ 11
3.1 Methods to evaluate economic transformation potential between sectors_______ 11
3.2 Methods to measure within-sector economic transformation _________________ 15
3.3 Methods to evaluate the business environment __________________________ 18
4 How are DFI investments shaping economic transformation? _________ 20
4.1 Economic transformation impacts by DFIs ______________________________ 20
4.2 Current measures to understand impact of DFIs on economic transformation ___ 24
4.1.1 CDC ______________________________________________________________ 24 4.2.2 IFC _______________________________________________________________ 25
5 How could DFIs evaluate economic transformation? ________________ 30
5.1 National sectoral-level indicators ______________________________________ 30
5.2 Sectoral specific indicators __________________________________________ 31
5.3 Business environment indicators ______________________________________ 32
5.4 Firm-level indicators _______________________________________________ 32
5.5 Future indicator: climate change mitigation/adaptation impacts ______________ 33
6 A way forward _____________________________________________ 34
References _________________________________________________ 36
Annex 1 ____________________________________________________ 43

MEASURING THE POTENTIAL CONTRIBUTION OF DFIS TO ECONOMIC TRANSFORMATION|
iv
ACRONYMS AIMM Anticipated Impact Measurement and Monitoring ASEAN Association of Southeast Asian Nations CDC CDC Group UK DFID Department for International Development DFI Development Finance Institution DOTS Development Outcome Tracking System DVA Domestic Value Added EC European Commission ECI Economic Complexity Index E&S Environmental and Social EU European Union FDI Foreign Direct Investment GDP Gross Domestic Product GFCF Gross Fixed Capital Formation GMM General Mean of Moments GVC Global Value Chain HHPSA Hausmann-Hidalgo Product Space Analysis HS Harmonized Commodity Description and Coding Systems ICT Information and Communication Technology IDG IFC Development Goal IFC International Finance Corporation IFPRI International Food Policy Research Institute ILO International Labour Organization ITC International Trade Centre IMF International Monetary Fund MENA Middle East and North Africa MIT Massachusetts Institute of Technology MNC Multinational Corporation OECD Organisation for Economic Co-operation and Development ODI Overseas Development Institute PCI Product Complexity Index R&D Research and Development RCA Revealed Comparative Advantage RFI Revealed Factor Intensity SADC Southern African Development Community SAM Social Accounting Matrix SET Supporting Economic Transformation SMEs Small and Medium-Sized Enterprises TFP Total Factor Productivity TiVA Trade in Value Added UK United Kingdom UN United Nations UNCTAD UN Conference on Trade and Development UNIDO UN Industrial Development Organisation US United States WDI World Development Indicators WEF World Economic Forum WITS World Integrated Trade Solution WESO World Economic Social Outlook

MEASURING THE POTENTIAL CONTRIBUTION OF DFIS TO ECONOMIC TRANSFORMATION|
v
EXECUTIVE SUMMARY This report proposes several measures that development finance institutions (DFIs) can use to assess ex-ante the potential of investments to contribute to economic transformation. It reviews the literature on economic transformation and examines how DFI investments are expected to contribute to economic transformation by looking at the impacts of foreign direct investment (FDI). It proposes several quantitative and qualitative analytical methodologies that can be used to assess economic transformation outcomes and impacts. It contributes to the economic transformation literature by suggesting a set of metrics than can be used to evaluate firm-level economic transformation impacts. These are all pre-existing metrics that, based on the economic transformation and FDI impact literature, can feasibly be used to quantify the economic transformation contribution of individual firms. The study provides a brief overview of the economic transformation potential of DFIs (focusing on the CDC Group UK and the International Finance Corporation) based on publicly available portfolio data. It finds some exposure and capacity to channel investments towards economic transformation sectors. Using the theoretical basis and the metrics highlighted in Sections 2 and 3, the report proposes 13 indicators that DFIs could use to assess the potential transformational potential of their investments. Such indicators can be used both ex-ante for investment decision-making and ex-post for impact monitoring and evaluation. Table ES1: Summary of indicators
Indicator Reason
Nat
iona
l sec
tora
l le
vel
National sectoral productivity contribution
Assess if investments in the sector help raise national productivity levels
Economic complexity Investing in sectors with higher complexity (and connectivity) levels opens up production in multiple areas
Sectoral multiplier effects Investing in the sector has positive growth impacts in other sectors
Sect
oral
-spe
cific
le
vel
Firm sectoral productivity contribution
Assess if investments in the firm help raise sectoral productivity levels
Local sourcing of goods and services
Higher levels of local input sourcing can result in greater local economy impacts
Skilled employment effect Sectors with higher levels of skilled workers exhibit higher productivity levels
Bus
ines
s en
viro
nmen
t Transport, energy and communication infrastructure ranking
Better transport, energy and communication infrastructure facilitates more efficient firm operations
Tertiary education levels Higher education levels help generate capacity to adopt technology and knowledge through FDI
Firm access to credit Deeper financial markets improve firm capacity to absorb FDI spillover effects
Transformative investment catalytic effects
Catalysing increased levels of funding can help improve the transformative impacts of the project by enhancing the scale of the project or by inducing or complementing other investments
Firm
leve
l
Product complexity score More complex products indicate more productive technology and labour use
Firm international trade participation
Increased exposure to international trade results in a higher productivity level
DFI firm intervention plan DFI interventions can help increase firm efficiency/productivity

MEASURING THE POTENTIAL CONTRIBUTION OF DFIS TO ECONOMIC TRANSFORMATION|
1
1 INTRODUCTION This report aims to provide feasible entry points for development finance institutions (DFIs) to measure ex-ante their potential impact on economic transformation. It is intended to support the United Kingdom’s Department for International Development (DFID) by contributing to its engagement in economic transformation and focuses on DFID’s strategic priority DFIs – that is, the CDC Group UK (CDC) and the International Finance Corporation (IFC). Section 1 introduces the report and provides an overview of the report structure. Section 2 provides the theoretical backbone of the report through a literature review of economic transformation and details pathways to economic transformation, first briefly discussing the approach to economic transformation then moving on to discuss inter- and intra-sectoral determinants. The section then discusses foreign direct investment (FDI) spillover effects on productivity, at the national, sectoral and firm level. Section 3 gives an account of the multiple techniques that can be used to measure economic transformation, divided between inter-sectoral and intra-sectoral techniques. Based on these techniques, Section 4 provides potential metrics that DFIs could feasibly use to measure the transformational impacts of their investments, on an ex-ante basis. The report discusses existing methodologies used to measure (or evaluate) these impact channels (or the impacts themselves). The section is of significance as it provides a practical set of quantitative indicators that can be used to measure the impact of individual firms on economic transformation. Section 4 provides an overview of CDC and IFC investment portfolios to understand their current economic transformation potential, applying (where data allow) indicators similar, but not identical, to those highlighted in Section 3. Section 5 follows with a proposal for 13 indicators, grouped into four meta-metrics, to assess the potential impact of DFIs on economic transformation. The indicators were screened based on two criteria: relevance to economic transformation and practical feasibility. Of the four meta-metrics, the first looks at whether an impact will have a positive effect at the national level, the second at the effect at the sectoral level, the third evaluates whether the business environment that the investment occurs in facilitates or promotes more effective transformational impacts whilst the fourth and final level looks at impacts at the firm level. The section proposes a need for future investigations into economic transformation and environmental sustainability to define a future fifth meta-metric that would assess the nexus between the two. Finally, Section 6 represents a brief discussion of what potential future actions could be taken, by future research, to understand the practical feasibility of gathering and using these metrics. The overall aim is to help DFIs select triple-win investments – that is, financially sustainable, generating positive development impacts and contributing to economic transformation.
MEASURING THE POTENTIAL CONTRIBUTION OF DFIS TO ECONOMIC TRANSFORMATION|
2
2 ECONOMIC TRANSFORMATION THROUGH FDI IMPACTS
We define economic transformation as the continuous process of (i) moving labour and other resources from lower- to higher-productivity sectors (structural change) and (ii) raising within-sector productivity growth (McMillan et al., 2017) by raising productivity at the sectoral level and at the firm level. This means that economic transformation is a process that begins at the macroeconomic scale and continues down to the microeconomic level. Its aim is to fill productivity gaps that exist at the national level, within individual sectors and even at the firm level, moving resources away from ‘traditional’ sectors – such as agriculture – into more ‘modern’ sectors – such as industry and services (Dercon and Gollin, 2014). Why is this important for a discussion based around DFI metrics? For two reasons, the first of which is that the theoretic background determines what kind of impacts can be defined as transformational, the second being that these will determine the metrics (and associated methodologies) used to evaluate the impacts. This section therefore highlights the main pathways to economic transformation; at the macroeconomic level these are (i) movements of resources between sectors and (ii) movements of resources within sectors, including productivity-enhancing changes at the firm level. As the report represents an investigation of how DFIs can measure and promote economic transformation, it then looks in greater detail at the spillover effects (and associated drivers) of FDI, which DFIs can promote through their investment choices, on (i) promoting higher-productivity sectors and (ii) improving productivity at the sectoral level. The point of the section is to provide the theoretical basis for Section 3, which highlights metrics that can be used to measure economic transformation.
2.1 Pathways to economic transformation 2.1.1 Between sectors This section provides the evidence and theory that highlight where shifts in productive resources between economic sectors have the greatest productivity potential. Such movement forms the basis of ‘structural transformation’, whereby the typical transformational pathway posits movement from low-productivity sectors such as agriculture into high-productivity sectors (initially industry, subsequently moving to services). The pathway presents an inverted-u shape, where, as per capita income rises, the share of agriculture in an economy declines, industry first increases then subsequently declines and services follows an upward trend (Rodrik, 2013). The trend was first discussed by Lewis (1955), who observed growth patterns in Europe, East Asia and North America, identifying three distinct phases of national development –starting from an agriculturally dominated economy, moving into industry and finally into services. The theory was further refined by Kuznets (Kuznets and Murphy, 1966; Kuznets, 1973), who ascribed this movement
Key messages • Two main processes describe economic transformation: between-sector and within-sector
transformation processes. • Movements towards more ‘modern’ sectors such as manufacturing tend to increase aggregate
productivity levels, in turn helping increase gross domestic product growth levels in developing countries.
• Productivity improvements can also occur within sectors – that is, improving firm-level productivity or by allocating resources to more productive firms.
• Foreign direct investment affects economic transformation by channelling investments into more productive sectors and more productive firms and by making firms more productive.

MEASURING THE POTENTIAL CONTRIBUTION OF DFIS TO ECONOMIC TRANSFORMATION|
3
– that is, structural transformation – as one of the six key features of a developing economy, together with increases in productivity rates and movements away from ‘personal enterprise to impersonal organization of economic firms’ (Kuznets, 1973), implying decreased levels of informality and individual enterprise and greater degrees of formalisation into larger firms as part of the development process. The key reason as to why these transitions are important is the fact that the movement of resources from sectors with lower levels of productivity to higher levels of productivity as well as resource movements that help ‘fill the gaps’ in productivity by improving productivity levels within underperforming sectors can be significant drivers of growth (McMillan and Rodrik, 2011; McMillan et al., 2014). For example, McMillan and Harttgen (2014a) discuss changes in labour productivity in sub-Saharan Africa, stating that the greatest increase in labour productivity, in the decade between 2000 and 2010, occurred within the agriculture sector. However, it was the movement of labour from agriculture into manufacturing that drove growth in the continent within the same period (McMillan and Harttgen, 2014b). As part of the process to promote increases in productivity, movements into industry (and manufacturing) are typically cited as the most effective in raising productivity levels. Evidence from the (formal) manufacturing sector in 118 countries, across a 10-year period, shows there is convergence of productivity levels in manufacturing levels across countries. This means productivity levels of manufacturing of low-income countries are catching up to those of high-income countries at a rate of approximately 2% a year. This convergence, however, is not occurring at the economy-wide level, as the relative importance of manufacturing in low-income countries is lower than in developed countries, hindering the scaling-up of this effect at the national level (Rodrik, 2013a). Duarte and Restuccia (2010) found similar evidence – using panel data for 29 countries over a 48-year period – for manufacturing and agriculture. This showed convergence over time between countries for both sectors but not for the services sector, and that half of all catch-up in productivity can be attributed to increases in industry productivity levels whereas low productivity in services often acts as a drag to the catch-up process. Changes in labour participation can also influence productivity, where surges in new entrants to the labour market can decrease labour productivity – although evidence from the EU and the US suggests that such decreases tend to occur only in the short term and to dissipate within five years. The effect has been proposed as occurring where the surge of new entrants to the labour market is lacking in training (Broersma, 2008). From a livelihoods perspective, there is evidence that movements of resources between sectors reflect increases in per capita incomes: as country per capita income rises so does their level of diversification. This increase in diversification occurs up to a point where they start to re-specialise (Imbs and Wacziarg, 2003). The process therefore highlights how moving away from a single dominating sector (such as agriculture) into multiple sectors can help improve livelihoods. Gollin et al. (2014) note that, at the highest levels of income, there is convergence between agriculture and non-agriculture sector levels of productivity – hence allocation of resources into agricultural production does become feasible once high levels of income are reached. This supposedly owes to the greater capacity to invest in agricultural resources aimed at enhancing production capacity. 2.1.2 Within sector The second component of economic transformation is the allocation of resources to more productive firms within a given sector as well as increasing productivity levels of firms within sectors. ‘Modern’1 sectors such as manufacturing continue to exhibit productivity gaps (McMillan et al., 2014). Reductions in these gaps, by improving productivity within the sector, can help increase growth rates. This tells us that growth-enhancing increases in productivity levels do not occur solely by 1 A now, slightly anachronistic, way of describing industry (especially manufacturing) and services, vis-à-vis agriculture, which would be considered a ‘non-modern’ sector.

MEASURING THE POTENTIAL CONTRIBUTION OF DFIS TO ECONOMIC TRANSFORMATION|
4
repositioning resources away from ‘non-modern’ sectors to ‘modern’ sectors but can also occur by targeting productivity improvements within both ‘non-modern’ and ‘modern’ sectors. The reallocation of resources from less productive to more productive firms could raise productivity levels, as shown by Hsieh and Klenlow (2009). Measuring productivity through dispersals in marginal product of capital and labour for Chinese and Indian manufacturing firms, this paper showed that movements towards US levels of ‘total factor productivity (TFP) efficiency’ would result in between 30% and 50% productivity gains in Chinese firms and between 40% and 60% gains in Indian firms. Evidence from a cross country firm-level dataset, covering five ‘industrial’ and three ‘transitional’ economies (Bartelsman et al., 2013), focusing on productivity dispersion within industries, finds that, while labour productivity has a greater dispersal than TFP, productivity enhancement can occur where resources are allocated from less to more efficient firms. The effect grows stronger over the long term (i.e. productivity impacts are less visible in the short term) and is reinforced through (net) firm entry into the market. Differences in technology levels between firms can result in higher levels of productivity for firms that use more advanced typologies of production capital (i.e. automated design, production, etc.). Where firms are increasing their labour skill levels, the uptake of advanced capital increases (Doms et al., 1997). Where there are changes in the technology level of a firm, triggered by increases in the level of firm research and development, firms can expect to see increases in productivity levels (and faster productivity catch-up rates), as data from 12 Organisation for Economic Co-operation and Development (OECD) countries over a 16-year period show (Griffith et al., 2000). The evidence is backed up by research that shows investments in labour skills, information and communication technology (ICT) capital and research and development (R&D) can result in TFP growth, especially in industries that are close to the technological frontier (Dabla-Norris et al., 2015). A comparison between UK, EU and US levels of productivity points to lower levels of technological innovation in the UK – described as lower levels of firm R&D and innovation diffusion – as one of the main reasons why UK productivity remained low (Nickell and van Reenen, 2001). Distance to the technology frontier was also found to have a negative impact on productivity for export-oriented firms in Ghana (Damoah, 2016). Of interest, there is some evidence that the mere ‘threat’ of entry of more technologically advanced firms into markets can spur productivity growth in markets that are close to the technological frontier, though the opposite can occur in ‘laggard’ sectors, where incumbent firms are discouraged from innovating as they perceive limited (or no) gains from doing so (Aghion et al., 2009) Another important aspect that governs productivity differences between firms in the same sector is whether they participate in (international) trade. Trade participation can be thought of as a signal (rather than cause) of greater productivity levels as it has been shown that, once a sector has been exposed to international trade, more productive firms will tend to take part in international trade – as these links are strengthened resources are reallocated to the more productive, outward-facing, firms (Melitz, 2003). Export-oriented Canadian firms exhibit higher growth in labour productivity (by 0.6%), higher wages (also 0.6%) and higher levels of shipment growth (by 0.3%) than non-exporting firms; however, employment growth in these firms is lower – increasing value addition of products but reducing labour inputs (Baldwin and Gu, 2004). Similarly results occurred in China after trade liberalisation, where increased import competition led to increased technical change within firms as well as reallocating labour between firms towards more technologically advanced firms (Bloom et al., 2015). Participation in global value chains (GVCs) has shown to increase firm level productivity (Criscuolo et al., 2016). Investigations into trade linkages with firm-level productivity changes in the Latin American and Caribbean region 2 find a positive causal relationship between participation in 2 Using a combination of the World Bank Enterprise Survey and OECD Trade in Value Added datasets.

MEASURING THE POTENTIAL CONTRIBUTION OF DFIS TO ECONOMIC TRANSFORMATION|
5
international trade and firm productivity, where increased involvement in GVCs increases the performance effect (Montalbano et al., 2014). Similar effects were found for Ghanaian manufacturing firms (Damoah, 2016), as well as manufacturing firms in North Africa, although the level of human capital, trade barriers and trade logistics play a significant role that will shape the strength of impact (del Prete et al., 2016). Wagner (2005) tests whether only the most productive firms (in the German market) engage with FDI, a theory initially proposed by Helpman et al. (2004), showing that the most productive firms undertake FDI, followed by firms that choose to export and subsequently those that only serve the domestic market. Two individual studies for Japanese manufacturing firms, by Tomiura (2006) and Kimura and Kiyota (2006), found similar results. Similarly, trade in intermediate goods also affects firm-level productivity. In an analysis of productivity shifts on a sample of 30 sectors in 25 EU countries, during the EU’s eastward expansion phase, Parteka (2013) found that trade participation had a positive effect on intra-industry productivity growth – an effect that is stronger through intermediate good trade. Strong international sectoral ties – that is, the use of foreign intermediate inputs into production – can have positive impacts on labour productivity in low- and middle-income countries. An increase in 10% in the export exposure ratio3 can lead here to a 0.1% increase in labour productivity (Kowalski and Buge, 2013). Where firms locate geographically, whether they choose to or naturally cluster vis-à-vis geographic dispersal, may also affect productivity. Clustering allows the concentration of productive resources into specific geographic areas, allowing firms to take advantage of economies of scope to save money on production – that is, taking advantage of the same transport, energy and communications infrastructure or co-locating near firms in the same value chain to reduce transaction costs such as goods transport (Fujita et al., 1999). Rosenthal and Strange (2003) provide a comprehensive literature review of clustering (and urbanisation effects) on firm productivity, highlighting previous findings that estimates of increases in productivity accruing from agglomeration range from 6% to 27%, also citing a potential increase in worker wages, where urban workers gain a premium of 33% on their wages as opposed to rural equivalents (Glaeser and Mare, 2001). Evidence from developing countries, such as in Chhair and Newman (2014) in Cambodia, suggests positive productivity spillovers from clustering; in Ethiopia there is a positive relationship between agglomeration and productivity (Siba et al., 2012), as there is in Vietnam (Howard et al., 2014) and Tunisia (Ayadi and Matoussi, 2014). Firm size and firm specialisation also have an impact on productivity levels. OECD (2013) tests the idea that increasing the size of a firm will increase its productivity levels, highlighting a positive relationship between firm size (as measured by number of employees) and worker output, especially in countries with larger industrial sectors (and lower levels of per capita income), where larger firms exhibited labour productivity levels two to three times larger than labour productivity levels in small firms. Additional evidence from Canada highlights a positive relationship between TFP, labour productivity and the size of a firm (Leung and Terajima, 2008) and the fact that exporting firms in Canada tend to specialise production, in turn increasing productivity (Baldwin and Gu, 2004). Firm ownership may be a determinant of productivity. Driffield and Du (2007) found that formerly publicly owned firms in China exhibited a positive increase in productivity when privatised, whereas privately owned steel producers were owned to be more productive than state-owned equivalents4 (Brandt et al., 2016). In terms of foreign vs. domestic ownership, data from Venezuela (Aitken and Harrison, 1999) show that joint ventures increase productivity but foreign investment in locally owned enterprises has a negative impact on firm productivity. Finally, there are some suggestions that the nationality of ownership may be less of a determinant than firm characteristics in terms of productivity (Bellak, 2004), with other aspects, such as firm management, export orientation, technological level, labour skill levels etc., potentially more significant. 3 Intended as the ‘ratio of the value of exports from the supplying industry k in country i and period t and the value of total output of industry k in country I’ (Kowalski and Buge, 2013). 4 However, given the Chinese context, such findings may not be universally representative.
MEASURING THE POTENTIAL CONTRIBUTION OF DFIS TO ECONOMIC TRANSFORMATION|
6
The above findings paint an interesting picture about intra-industry productivity differences. On the one hand, we see that labour productivity dispersals are greater than TFP (i.e. total) and that labour skills drive technological uptake, which, in turn, drives productivity uptake. Labour is clearly a motivating factor in explaining differences in productivity levels.
2.2 FDI and economic transformation A significant body of evidence links FDI with growth, especially for developing countries, with Barba-Navaretti and Venables (2006) as well as Dunning and Lundan (2008) providing extensive coverage. Given the fact that equity investments – an equivalent FDI investment instrument – represent over 50% of DFI investment portfolios (see Table 8), discussing FDI impacts on economic transformation is highly pertinent to the discussion. The current section provides an overview of the theoretical links between FDI and economic transformation through FDI spillover effects, defined as the transfer of technology from multinational firms to domestic firms, raising domestic firm productivity levels (Crespo and Fontoura, 2007). The concept was pioneered by Findlay (1978), who looked at backward linkages and technology transfer arising from FDI. This was followed by Das (1987), who, in the assumption that technology transfer is priceless, theorised (through a dynamic model) that, while technology transfer may not benefit host country firms (in terms of output and profits), the aggregate effect is, overall, positive. Below, we discuss first FDI spillover impacts on sectoral level productivity and subsequently FDI spillover effects on firm-level productivity. 2.2.1 FDI and promoting higher-productivity sectors The main impact channels of FDI on productivity work through firm-level spillovers, which, aggregated at the sectoral and national levels, would facilitate knowledge transfers, which, in turn, would increase productivity, facilitate technological transfer (and facilitate local capital deepening and production as initially highlighted by Borensztein et al., 1998), enhance management techniques, etc., as well as help create jobs, contribute to structural transformation, increase export diversification levels, complement local investments with foreign investment capital and help increase overall technological levels (Alfaro, 2015). Even though Keller (2004) suggests that over 90% of developing country domestic productivity gains have occurred thanks to access to foreign technology, there is mixed evidence that FDI affects productivity. An investigation of FDI spillover effects on productivity in five Association of South East Asian Nations (ASEAN) countries5 between 1970 and 2005 finds a strong relationship (Uttama and Peridy, 2010). A previous study, looking at eight East Asian economies receiving significant levels of FDI, found evidence in half of the countries6 that FDI had led to increases in technical capacity and in three countries7 that it had led to increases in productivity (UNIDO, 2006). A similar exercise carried out in 14 sub-Saharan African countries between 1970 and 2000 found weak evidence that FDI caused productivity increases, uncovering such evidence in only two countries (Botswana and Congo) in its sample (UNIDO, 2008). More recent data (Baltabaev, 2013) provide some macroeconomic evidence on FDI impacts on TFP. The study states that previous macroeconomic results are mixed owing to econometric estimation problems; to overcome this issue, the paper uses the General Mean of Moments (GMM) estimation method on panel data for 49 countries in the 1974–2008 period to evaluate potential endogeneity and fixed effects. It finds positive effects between FDI and GDP growth as well as between FDI and TFP growth. The results are in line with FDI impact results previously seen by Li and Liu (2005), who 5 Indonesia, Malaysia, Philippines, Singapore and Thailand. 6 China, Hong Kong, Indonesia and Thailand. 7 China, Hong Kong, Singapore.

MEASURING THE POTENTIAL CONTRIBUTION OF DFIS TO ECONOMIC TRANSFORMATION|
7
found a positive relationship between FDI and economic growth through panel data on 84 countries between 1970 and 1999. Woo (2009), on panel data for 92 developed and developing countries between 1970 and 2000, found a statistically significant and positive effect from FDI on TFP growth. The choice of what sector to channel FDI into does matter at the national level. Walsh and Yu (2010) find that FDI flows are not shaped by underlying factors when they are aimed at primary sector investments; on the other hand, for secondary and tertiary sectors, FDI flows can be dependent on country income levels, exchange rate fluctuations, financial depth, school enrolment, governing institution set-ups, labour market flexibility and judicial independence. In terms of the impacts of FDI, evidence suggests that FDI in primary sectors may have a negative effect on aggregate growth, whereas FDI in the manufacturing sector can have a positive impact on growth (Alfaro, 2003). Similar results are found by Aykut and Sayek (2007), who use cross-country data (between 1990 and 2003) to show that, as the share of manufacturing sector in FDI flows increases, the positive effect on economic growth increases; conversely, as the share of primary or services sector investments increases, the effect on growth is negative. At the national (aggregate) level, Contessi and Weinberger (2009) look at FDI and its impacts on national growth rates with limited success, as the paper declares that evidence and macroeconomic data are still not strong enough to prove conclusively whether impacts are positive or negative. A review of FDI spillovers on productivity changes – using what is more robust firm-level data aggregated at the sectoral level (ibid.) – in developing countries finds negative intra-industry but positive inter-industry spillover effects (Gerschewski, 2013). This means that FDI causes negative productivity impacts on firms within the same sector as the multinational entrant that crowds out local competitors but, when linked to local suppliers, helps them increase their productivity levels through knowledge-sharing and technological transfer. Evidence from Brazil (Bruhn and Calegario, 2014) points to negative FDI spillover productivity effects in labour-intensive sectors but positive impacts in technology-/capital-intensive sectors. Wang (2010), looking at Canadian manufacturing firms from the early 1970 to the end of the 1990s, states that the effect of FDI on productivity is strongest in industries that have significant inter-industry linkages and in those industries that have the greatest capacity to absorb technology. Further evidence (in Alfaro et al., 2009) assesses the impacts of FDI, via financial markets, on growth. The paper finds that the main channel through which FDI affects growth is TFP improvements (rather than factor accumulation), facilitated by well-functioning financial markets. It therefore highlights that the environment (i.e. ‘local conditions’) within which FDI occurs matters in terms of its productive – hence transformative – impacts. Contemporary research by Bijsterbosch and Kolasa (2009) finds that FDI has a strong role in productivity growth and productivity convergence in Central and Eastern Europe, though the effect is determined by the absorptive capacity of host countries and industries. Similar data show that capacity to absorb innovation is an important component in explaining why growth because of FDI diverged in China, with more ‘absorptive’ regions on the coastline showing greater benefits from FDI than inner regions with lower levels of development and capacity to absorb technology (Fu, 2008). More recent research by Alfaro and Chauvin (2016) discusses the impact of FDI on host economies, including an analysis of macroeconomic benefits such as changes in aggregate productivity, which provides more evidence that that the level of financial development is a major determinant of the impacts of FDI. Complementarity conditions were also found to be an import factor in explaining FDI impacts in Middle-East and North Africa (MENA) countries between 1996 and 2012. Sophistication of financial markets, human capital development, good governance, etc. are seen to determine the impacts of FDI, accounting for differences in FDI growth effects between countries (Saidi et al., 2014). Aitken et al. (1997) provide evidence from Mexico that shows that, when FDI, through multinational activity, enters a foreign market, its activities help reduce export costs from the market it entered. Data show that complementarities between FDI and exports – that is, increasing levels of FDI within a sector (equally applicable to manufacturing and non-manufacturing sectors) – help increase export
MEASURING THE POTENTIAL CONTRIBUTION OF DFIS TO ECONOMIC TRANSFORMATION|
8
levels. However, the relationship is unidirectional – that is, growth in exports leads to growth in FDI rather than growth in FDI leading to growth in exports (Bouras and Raggad, 2015). There is also some acknowledgement of the importance of the labour force in driving FDI spillover effects. For example, Fosfuri et al. (2001) state that spillover effects occur when multinational trained domestic workers are hired by host country firms and thus promulgate knowledge. Dasgupta (2012) finds similar results stating that local workers, through multinational firm management knowledge transfer – that is, local people working and learning from foreign management, helps increase local income levels as well as the potential size of firms founded by local workers. 2.2.2 FDI support to sector and firm performance Similarly to the national- and sectoral-level data FDI evidence impacts, there is also mixed evidence of FDI spillover effects on productivity at the firm level. Available firm-level data on the impact of FDI on productivity provides evidence of positive impacts in manufacturing firms in the US (Keller and Yeaple, 2008), the Czech Republic and Latvia (Javorcik, 2008), Lithuania (Javorcik, 2004) and the UK (Haskel et al., 2002). In addition, evidence from a panel of 25,000 manufacturing firms in a group of 78 developing countries, covering the 2006–2010 period, shows there are positive FDI spillovers on domestic firm productivity (Farole and Winkler, 2014). FDI spillover effects on productivity within the same sector and within related industries in Central and Eastern European economies was found to be, in the main, positive, and effects were found to be significantly stronger through vertical links (i.e. from foreign firms to their local suppliers) rather than through horizontal effects (i.e. between firms in the same segment of a value chain), potentially attributed to brain drain or market stealing effects (Gersl et al., 2007). The FDI productivity spillover drivers tend to fall in the ‘endogenous growth’ theory, as discussed first by Romer (1986) and subsequently by Mankiw et al. (1992), where internal activities such as R&D, innovation, human capital improvements and physical capital investments all contribute to firm-level productivity improvements (Dunne and Masiyandima, 2016). For example, World Bank Enterprise Survey data for Southern African Development Community countries demonstrated positive within-firm and within-sector FDI productivity spillovers. Of interest is the fact that the paper identifies stronger FDI effects on productivity for smaller firms, through the greater impacts accrued thanks to technological diffusion towards less ‘advanced’ firms. There was also a distinction between more technologically advanced countries, where intra-industry gains were larger than for less advanced countries, with within-firm gains in productivity more noticeable (Dunne and Masiyandima, 2016). Innovation capacity is shown to be an important driver determining absorptive capacity of FDI spiIlovers, as highlighted in Spain (Sanchez-Sellero et al., 2013), where firms that undertake R&D activities and process innovation activities are better able to absorb productivity spillovers from FDI. Liu (2008) shows that there may be a time component in terms of FDI technology spillover impacts – that is, in the short term for Chinese manufacturing firms, FDI lowered productivity levels – given the costly learning process associated with technological and technical skills diffusion. Once technical were incorporated they helped increase the long-term rate of productivity growth through increased opportunities to research new products. These long-term gains are firm-specific – that is, they are dependent on the management incentive structure in place. Management structures that are more geared towards longer-term outcomes are more capable of achieving longer-term productivity gains. Other endogenous characteristics such as firm size and ownership may also play a role. Greater degrees of foreign ownership can also increase short- and long-term productivity gains, as shown in China (Liu, 2008) and further investigated by Girma et al. (2014), who found, that for Chinese manufacturing firms, when foreign ownership was less than 40% (but greater than 0%), FDI spillover effects on firm-level productivity were negative but became positive over 40% ownership. Other firm ownership evidence suggests foreign ownership may not, by itself, be enough of a determinant of firm productivity, but may have more to do with inherent characteristics of firms (Bellak, 2004). Multinational firm size does impact FDI spillover: data from Romanian manufacturing firms in a 10-year period (1996–2005) shows that larger firms are more likely to have productive spillovers than

MEASURING THE POTENTIAL CONTRIBUTION OF DFIS TO ECONOMIC TRANSFORMATION|
9
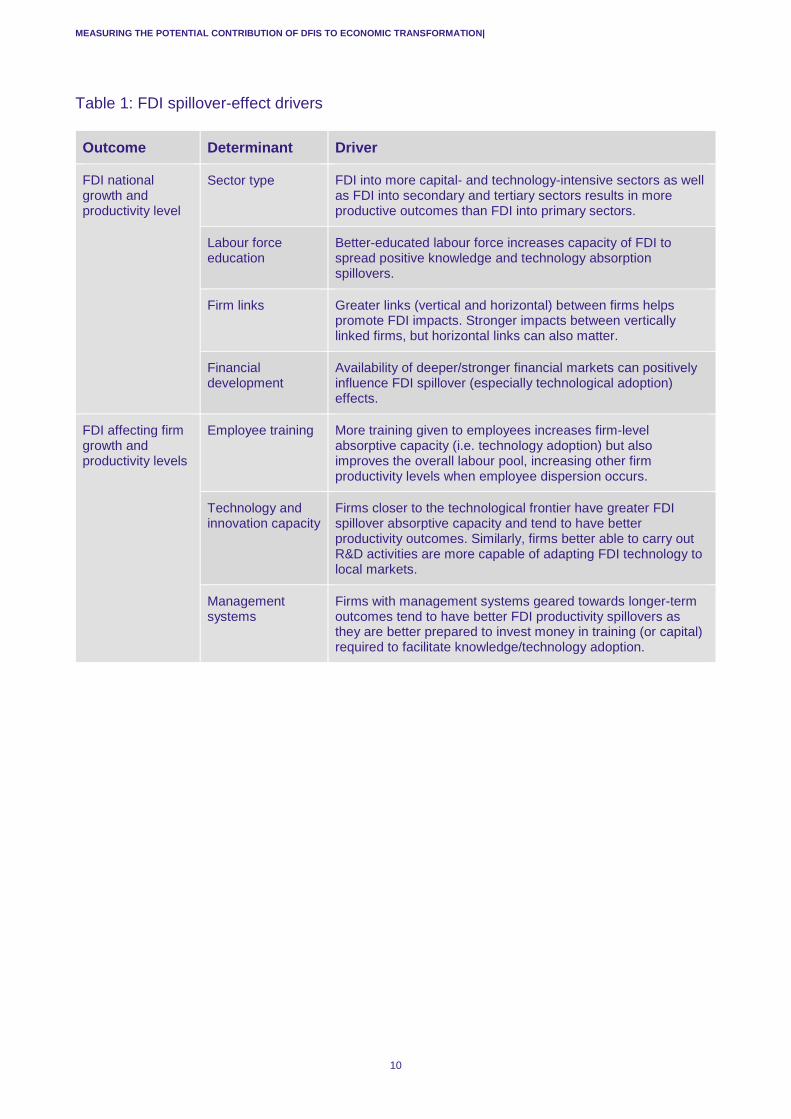
smaller firms; however, the evidence on the size of domestic firms and FDI is not conclusive (Lenaerts and Merlevede, 2015). Productivity growth can also be exogenous – that is, the drive to increase productivity can come from outside of the firm. In a process of self-selection, multinational corporations (MNCs) are expected to be the most productive firms within a given industry (as theorised by Helpman et al., 2004). This may cause a ‘between-firm selection effect’, where only the most productive domestic firms will survive MNC entry into a market. In addition, MNC entry will also influence innovation – that is, increasing patenting activities in domestic markets but also playing a role in domestic firm exit from markets, where domestic firms with the lowest productivity rates will leave the market (Alfaro and Chen, 2016). National changes to the capacity to participate in trade can play a role. For example, evidence from Australia, in a paper analysing manufacturing firm-level data between 1988 and 2012, shows that, while trade liberalisation has provided positive productivity impacts on local firms – that is, orienting local firms towards export markets – inward FDI has not shown such effects (Turnbull et al., 2016). Related to international trade participation, Kokko (1996) looked at productivity spillovers from competition between local firms and their foreign affiliates for Mexican manufacturing firms, and showed that positive productive spillovers did occur when foreign and domestic firms interacted, rather than simply competing. Similarly, the modus of FDI can also shape outcomes, as investigated in the UK, where only FDI motivated by maintaining a technological advantage for the investor firm showed spillover domestic productivity gains; FDI geared towards using local technical resources showed no such gains. That is, investing foreign firms should be bringing a new technology into the market rather than using already locally available technology, for there to be a productive gain (Driffield and Love, 2007). Table 1 summarises the FDI spillover into either greater national-level productivity and growth or firm-level productivity outcomes. The outcomes can be modified by several ‘determinants’, which we highlight below.
MEASURING THE POTENTIAL CONTRIBUTION OF DFIS TO ECONOMIC TRANSFORMATION|
10
Table 1: FDI spillover-effect drivers Outcome Determinant Driver
FDI national growth and productivity level
Sector type FDI into more capital- and technology-intensive sectors as well as FDI into secondary and tertiary sectors results in more productive outcomes than FDI into primary sectors.
Labour force education
Better-educated labour force increases capacity of FDI to spread positive knowledge and technology absorption spillovers.
Firm links Greater links (vertical and horizontal) between firms helps promote FDI impacts. Stronger impacts between vertically linked firms, but horizontal links can also matter.
Financial development
Availability of deeper/stronger financial markets can positively influence FDI spillover (especially technological adoption) effects.
FDI affecting firm growth and productivity levels
Employee training More training given to employees increases firm-level absorptive capacity (i.e. technology adoption) but also improves the overall labour pool, increasing other firm productivity levels when employee dispersion occurs.
Technology and innovation capacity
Firms closer to the technological frontier have greater FDI spillover absorptive capacity and tend to have better productivity outcomes. Similarly, firms better able to carry out R&D activities are more capable of adapting FDI technology to local markets.
Management systems
Firms with management systems geared towards longer-term outcomes tend to have better FDI productivity spillovers as they are better prepared to invest money in training (or capital) required to facilitate knowledge/technology adoption.
MEASURING THE POTENTIAL CONTRIBUTION OF DFIS TO ECONOMIC TRANSFORMATION|
11
3 HOW TO MEASURE ECONOMIC TRANSFORMATION
The section provides an overview of the methods that can be used to evaluate economic transformation outcomes, and metrics that can be used to decide whether a sector, sub-sector or individual product is transformational within a given national context (Section 3.1). The report makes a new theoretical contribution to the economic transformation literature by suggesting several instruments that can be applied at the firm level to see if a given firm is oriented towards economic transformation potential (Section 3.2). These metrics are presented here to provide a basis from which to take the DFI specific set of metrics (further highlighted in Section 4).
3.1 Methods to evaluate economic transformation potential between sectors The production structure of an economy is a simple set of metrics that can be updated on an annual basis to provide some information on the economic structure of a country, divided into high-level sectors. At the most basic level we have the three sectors, further divided into sub-sectors (see annex 1 for an example). The division allows an assessment of the basic requirements of structural transformation. That is, the higher the representation of more productive sectors, such as industry or services, the greater the degree of development – in theory. Part of the more detailed view involves, using data from National Account statistics8 or, for a select group of countries, the SET data portal, providing a disaggregated view of the production structure and adding an additional layer of information that can better provide information on production structures. The disaggregated data prove to be useful in terms of identifying whether activities are in the productive realm or the consumption realm, as well as allowing evaluators to understand how much economic activity sits in the manufacturing sector, which the previous section has shown to be an important driver of economic transformation. Finally, in terms of the most granular level of production potential in the country, there is the analysis of national ‘resource endowments’ and ‘growth diagnostics’. Resource endowment analysis provides an in-depth understanding of the resources (natural, human, technological or a combination of the three) available to the country and can be a useful analytical component of any scoping study; however, their availability depends on ad hoc research. Growth diagnostic analysis, typically following the Hausmann et al. (2005) methodology, highlights what constraints to growth should be resolved to have the greatest impact. These diagnostics follow the constraints down to their root causes (in theory) through a ‘problem tree’ model, helping identify where interventions could have the greatest positive impacts. These have generally been carried out for many developing countries
8 The data are typically available from either national statistical agencies or economic/finance ministries.
Key messages • Economic transformation metrics can be applied to measure three distinct changes: inter-sectoral
shifts, intra-sectoral shifts and changes to the operational environment. • Inter-sectoral changes are mostly measured through quantitative analytical techniques such as
RCE, ECI scores, TiVA, Input-Out modelling, etc., which provide estimates on economic transformation impacts at the national (macro) level.
• Assessing intra-sectoral transformation changes (or potential) requires firm (or firm-level) data and can help us understand which firms already contribute to economic transformation, which lag and can be improved or where firm interventions can have the biggest impacts.
• Operational environment metrics look at market parameters that affect the economic transformation impact effectiveness of investment.

MEASURING THE POTENTIAL CONTRIBUTION OF DFIS TO ECONOMIC TRANSFORMATION|
12
by multilateral and bilateral development organisations, although ad hoc growth diagnostics for sectors may prove more useful when a detailed sectoral picture is necessary. Production techniques are used to measure what impacts changes in production will have on employment and output, as well as to identify where productivity gaps exist, which, if filled, can act as drivers of growth in each economy 9 by providing a view of the productivity level at the disaggregated sectoral level. Multiplier analysis – that is, Social Accounting Matrices (SAMs)10 based on Input-Output modelling11 – helps us understand what effects changes in demand will have on productive outputs and employment, for different degrees of skilled labour (Mendez-Parra, 2015). SAMs are a useful speculative tool when Input-Output tables are available to calculate them. However, they base their assumption on demand increasing for a product, hence their use can be curtailed if demand for a good (or service) is not expected to increase. Sectoral labour productivity levels can be identified through the combined use of sectoral employment shares and sectoral value added, where each source of data is also individually useful. Sectoral employment data12 help us understand how labour is divided between different sectors: where labour is still channelled in less ‘modern’ sectors such as agriculture there is therefore potential to move it in more ‘modern’ and productive sectors such as manufacturing. Sectoral value added13 provides similar data14 to the production structure data above. When both, in absolute monetary and numeric value forms, are combined, they produce labour productivity values in monetary terms – that is, per worker how much output each sector produces. Comparisons of this metric between sectors produce relative labour productivity values. Although some productivity data are already available through the Groningen Growth and Development Centre and through the ODI SET data portal, for over 200 countries the use of the International Labour Organization’s (ILO’s) ILOStat database (ILO, 2018) can be used to evaluate output per worker (in US dollars). Trade-based measures such as the RCA, Trade in Value Added (TivA) and ECI measures help us understand what opportunities there are to promote exports, increase international competitiveness and provide the stimulus necessary for the movement of production structures towards more complex and transformative goods and services. The RCA index15 was first proposed by Balassa (1965), who used it to calculate the degree of trade specialisation within a country and helps us understand what goods countries have an advantage (or disadvantage) in trading internationally. For the purposes of evaluating the economic transformation potential of individual sectors, the RCA provides figures on a year-on-year basis for individual countries. When computed, sectors with a higher score have a (potential) greater comparative advantage when globally traded. A country’s RCA is typically computed using the United Nations Comtrade 2-Digit HS level,16 but can also be computed at a more detailed level down to the 6-digit HS computations (though not any further), which can be particularly useful if specific products are being evaluated rather than sub-sectors. The World Bank provides a current database to compare RCAs between countries (World Bank WITS, 2018) for the period between 2009 and 2013. 9 Or even a particular region, should sufficient information be available, although for low-income and developing countries such information is less likely to be available. 10 See Annex 1 for an example. 11 These provide information on how different sectors are linked to one another through the purchase and delivery of inputs (Mendez-Parra, 2015). 12 Available through the International Labour Organization (ILO) World Employment and Social Outlook (WESO) database 13 See Annex 1 for an example. 14 Available through the UN Data database, searching for gross value-added figures for individual sectors by country 15 See Annex 1 for an example RCA table. 16 Harmonized Commodity Description and Coding Systems (HS)

MEASURING THE POTENTIAL CONTRIBUTION OF DFIS TO ECONOMIC TRANSFORMATION|
13
In addition, there is a sub-strand of the RCA analysis (pioneered by Shirotori et al., 2010) that uses national-level capital stock, human capital stock and natural factor endowments to provide a weighted version of the RCA that also considers resource availability within a given country – that is, Revealed Factor Intensity (RFI). In terms of export orientation, such data allow an evaluator to understand whether highlighted RCA products (or any other trade product) can feasibly be produced within the country. The United Nations Conference on Trade and Development (UNCTAD) provides RFT data. Economic Complexity analysis uses trade data between countries to calculate the Economic Complexity Index (ECI) of countries, a holistic measure that looks at export data to rank countries according to the degree of product export diversification (indicating greater economic complexity) and product export ubiquity (how common the products are in the export market). There is a negative relationship between the diversity of country and the ubiquity score; that is, countries that are more diversified tend to export less common goods (Hausmann et al., 2014). This means they are in competition with less countries, as well as being more specialised in terms of production capacity. The measure negatively correlates with income inequality (Hartmann et al. 2017) and positively correlates with country income level (Hidalgo and Hausmann, 2007). To supplement the ECI, it is possible to use the International Monetary Fund’s (IMF’s) Export Diversification Index (IMF, 2017), which provides a measure of export diversification and helps us understand if a country’s export structure is either too concentrated or too diversified. However, the data run only up to 2010, hence they are useful historically but not for up-to-date assessments. An additional sub-component of the ECI is the Product Complexity Index (PCI), which can be useful when evaluating the transformational capacity of investing in an individual product, as it ranks products by the ‘amount of capabilities or know-how necessary to manufacture them’ (Hausmann et al., 2011). Products with a higher PCI score can provide greater transformative potential as they represent higher productivity capabilities within an economy. Product scores are not country-specific but are ranked against one another, typically disaggregated at the 6-digit HS level (MIT, 2018), and can be a useful complement to the RCA ranking. An additional component of economic complexity analysis is the Product Space,17 which is available for individual countries It provides a graphical indication of what products a country produces and visibly links them to other products, this allows an identification of which higher PCI products a country could feasibly produce as connected products tend to require similar productive capabilities. The aim is to move towards products located in the central clusters, which have a higher product complexity score (see below) and greater interconnections with other products, opening up new productive sectors. Moving towards these improves economic complexity (including international competitiveness) but also represents a shift in productive resources (i.e. labour or capital) towards products with greater transformative potential. The degree of domestic value added (DVA)18 to the product helps us understand what proportion of the final value of a traded good is produced within the target country and what proportion is produced abroad. The greater the domestic contribution, the greater the productive capabilities in the domestic country (which increase as the product complexity increases) and the greater the domestic final product value capture. If DVA is low in a product, investment in value addition can help increase domestic capture. If DVA is high, investment in the product means greater capture within the country. DVA data are available through the TiVA data within the EORA database (EORA, 2018). Once we have identified potential international trade products (either goods or services), we can evaluate potential demand in the global economy by means of regional or global demand for goods
17 See Annex 1 for an example map. 18 See Annex 1 for an example.

MEASURING THE POTENTIAL CONTRIBUTION OF DFIS TO ECONOMIC TRANSFORMATION|
14
or services. Vice versa, if there are goods that are predicted to be in strong demand, once identified the feasibility of their production and export from target countries can be tested. Trade trends can be calculated based either on past trends in international trade (i.e. using the UN COMTRADE database (2018), the World Bank World Integrated Trade Solution (WITS) database (World Bank WITS, 2018) or the International Trade Centre Trade Map database (ITC, 2018)) or they can be based on assumptions or predictions of future trade trends. Table 2 summarises inter-sectoral economic transformation metrics, the techniques used to measure changes and the type of impact they are used to assess. The majority are macro-level quantitative techniques with data available from internationally respected data libraries, hence their availability should not present significant difficulty for evaluating agents.
Table 2: Summary of between sector metrics
Metric Economic transformation impact channel
Technique Data source
Employment potential effects
Jobs created in different sectors and at different educational levels
Input-Output multiplier analysis
Ad hoc research, national sources and IFPRI
Direct and indirect output effects
Used to determine which sectors have the greatest employment/output effects
Input-Output multiplier analysis
Ad hoc research, national sources and IFPRI
Domestic value addition
Higher degrees of value added captured in-country, results in greater productivity and growth capacity
TiVA database
EORA database
Demand for goods and services
Can be used to evaluate whether demand exists for specific products i.e. linked to ECI/PCI/RCA choices
Historic trends WITS; UN COMTRADE; Trade Map
Export specialisation
Investing in higher RCA score products improves trade competitiveness and helps increase diversification, both associated with greater levels of productivity, though potentially measured as an outcome rather than cause
RCA for broad sectors SET-ODI
RCA for specific products SET-ODI
RFI for endowment cross reference
UNCTAD (up to 2010)
Export diversification IMF Export Diversification Index (up to 2010)
Production structure
Used to identify current production structure, with the aim of identifying flagging sectors
Aggregated production structure
Word Bank WDI
Disaggregated production structure
National Accounts data
Manufacturing production shares
Word Bank WDI and National Accounts
Resource endowments
Triangulated with product identification to understand what is
Qualitative analysis Mixed sources
MEASURING THE POTENTIAL CONTRIBUTION OF DFIS TO ECONOMIC TRANSFORMATION|
15
Metric Economic transformation impact channel
Technique Data source
viable to produce with in-country resources
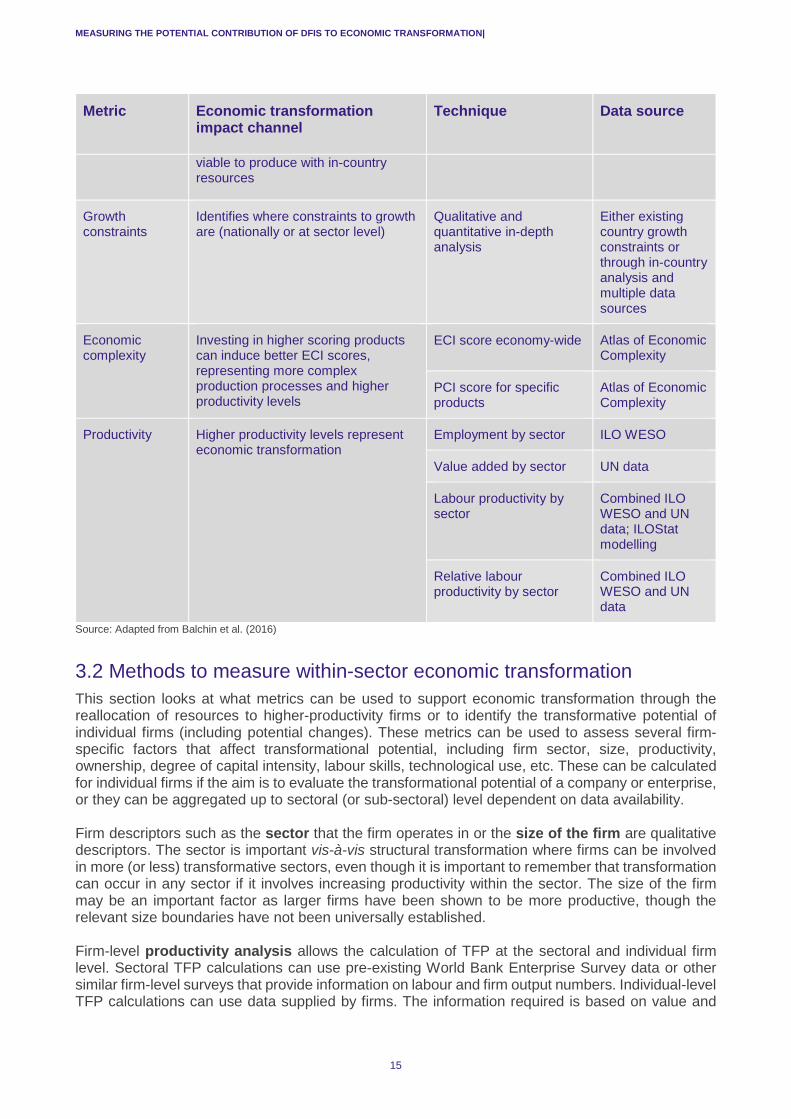
Growth constraints
Identifies where constraints to growth are (nationally or at sector level)
Qualitative and quantitative in-depth analysis
Either existing country growth constraints or through in-country analysis and multiple data sources
Economic complexity
Investing in higher scoring products can induce better ECI scores, representing more complex production processes and higher productivity levels
ECI score economy-wide Atlas of Economic Complexity
PCI score for specific products
Atlas of Economic Complexity
Productivity Higher productivity levels represent economic transformation
Employment by sector ILO WESO
Value added by sector UN data
Labour productivity by sector
Combined ILO WESO and UN data; ILOStat modelling
Relative labour productivity by sector
Combined ILO WESO and UN data
Source: Adapted from Balchin et al. (2016)
3.2 Methods to measure within-sector economic transformation This section looks at what metrics can be used to support economic transformation through the reallocation of resources to higher-productivity firms or to identify the transformative potential of individual firms (including potential changes). These metrics can be used to assess several firm-specific factors that affect transformational potential, including firm sector, size, productivity, ownership, degree of capital intensity, labour skills, technological use, etc. These can be calculated for individual firms if the aim is to evaluate the transformational potential of a company or enterprise, or they can be aggregated up to sectoral (or sub-sectoral) level dependent on data availability. Firm descriptors such as the sector that the firm operates in or the size of the firm are qualitative descriptors. The sector is important vis-à-vis structural transformation where firms can be involved in more (or less) transformative sectors, even though it is important to remember that transformation can occur in any sector if it involves increasing productivity within the sector. The size of the firm may be an important factor as larger firms have been shown to be more productive, though the relevant size boundaries have not been universally established. Firm-level productivity analysis allows the calculation of TFP at the sectoral and individual firm level. Sectoral TFP calculations can use pre-existing World Bank Enterprise Survey data or other similar firm-level surveys that provide information on labour and firm output numbers. Individual-level TFP calculations can use data supplied by firms. The information required is based on value and
MEASURING THE POTENTIAL CONTRIBUTION OF DFIS TO ECONOMIC TRANSFORMATION|
16
costs. TFP calculations use a Cobb-Douglas Production Function to estimate firm productivity levels, using the Saliola and Seker (2011) methodology. In terms of economic transformation, for the individual firm this information helps us understand if it contributes to transformation by being a high-productivity firm or, if a low-productivity firm, if it can be changed to contribute to transformation, for example by reallocating resources away to another firm or by improving its productivity levels. When averaged for a given sector (or sub-sector), the information can be used to assess firm-level productivity. The information also helps us understand how capital- or labour-intensive firms are. Rather than being averaged, if aggregated and counted at the sectoral level, TFP measurements can be used to provide a picture of sectoral TFP dispersion,19 which can be a particularly useful measure when evaluating within-sector economic transformation shifts or potential. TFP dispersion groups firms by TFP levels in different sectors in individual countries. Where there is a large discrepancy between firms there is a greater potential towards increasing productivity at the sectoral level either by increasing laggard firm productivity or reallocating resources towards more productive firms, thereby increasing the sector’s contribution to growth. Firms that are closer to the technological frontier – that is, firms that are more technologically advanced – tend to reap greater benefits from FDI and to be more productive, with greater potential gains where the productivity gap is (relatively) larger. Understanding how technologically advanced a firm is a complex undertaking. Two potential proxy measures can be used. The first is used by Dabla-Norris et al. (2015), who calculate a global technology frontier using average TFP of firms in the US (typically regarded as firms on the technological frontier). Here, the technological advancement of a firm is calculated based on the distance between the firm and the specified frontier. Frontiers can be defined either as Dabla-Norris et al. (2015) have or can be tailored – that is, using firms in specific countries, firms in specific sectors or even the TFP of an individual ‘example’ firm. An alternative measure is proposed by Bloom et al. (2015), who use a personal computer headcount per firm measure – how many computers firms use per employee – with the idea that the higher the number the more technologically capable the firm is. Finally, for firms that produce material goods (rather than services), it is possible to use the PCI rankings as a proxy for technological intensity, as more complex products will likely require more technologically complex production processes. Increased participation in trade by firms tends to result in higher productivity levels. Individual firm data can be used and compared with World Bank Enterprise Survey (World Bank, 2018a) data (if available for the country) to provide a good idea of the degree of export orientation of target firms vis-à-vis other country firms. The Enterprise Survey databank looks at the percentage of sales directed towards the export market, towards third party intermediates to export and towards the domestic market. Similarly, firms that participate in GVCs also tend to be more productive, and data from Enterprise Surveys on the proportion of inputs that are of foreign origin can provide a proxy measure of participation of GVCs, together with a measurement of the proportion of foreign ownership of a firm. The higher the labour skill level of firm workers, the more productive a firm and the greater the capacity to absorb positive FDI productivity spillover effects. The World Bank Enterprise Survey collects data on the percentage of the workforce that is low-, medium- and high-skilled. Alternatively, at the sectoral level, national labour force surveys or specific sectoral surveys can be used evaluate the labour skill degree.
19 See Annex 1 for an example.

MEASURING THE POTENTIAL CONTRIBUTION OF DFIS TO ECONOMIC TRANSFORMATION|
17
Table 3 provides a summary of the metrics and associated impacts that can be used to evaluate either a firm’s contribution to sectoral transformation (i.e. enhancing productivity within sector) or the capacity for a firm to contribute to economic transformation.
Table 3: Summary of within-sector metrics
Metric Economic transformation impact channel
Technique Data source
Firm sector Used to evaluate whether the firm is within a sector with greater impact on modern sectors, i.e. manufacturing
Qualitative Firm data
Firm Size Larger firms may be more productive. Impact either on scaling up smaller firms or supporting larger firms
Qualitative Firm data
Firm productivity
Increases in firm productivity can either be an assessed impact or be measured to evaluate contributions at the sectoral/national level. Higher productivity levels indicate better transformational outcomes or contribution potential
TFP for individual firms
Firm data; World Bank Enterprise Survey data; national firm surveys
TFP dispersion TFP analysis
Capital and labour intensity
TFP analysis
Trade and participation in GVCs
Increased participation in trade can indicate greater levels of productivity. The metrics can also be used to identify firms that already participate in trade to invest in
Percentage of sales abroad
Firm data; World Bank Enterprise Survey data; national firm surveys
Percentage of inputs from foreign sources
Firm data; World Bank Enterprise Survey data; national firm surveys
Proportion of foreign ownership
Firm data; World Bank Enterprise Survey data; national firm surveys
Technology level
Higher levels of technology use in firms improve absorptive capacity and productivity
Sectoral proximity to TFP frontier
TFP analysis
Computer use per employee
Firm data or market data sources
PCI Atlas of Economic Complexity
Labour skills
Better skilled labour helps increase productivity, improving FDI technology/knowledge spillover absorption effects
Firm % of high/medium/low skilled labour
Firm data; World Bank Enterprise Survey data
Sectoral % of high/medium/low skilled labour
National labour force survey; ILO WESO
MEASURING THE POTENTIAL CONTRIBUTION OF DFIS TO ECONOMIC TRANSFORMATION|
18
3.3 Methods to evaluate the business environment The economic transformation literature, firm-level productivity literature and FDI literature all point out the importance of the business environment (i.e. institutions, business regulations, financial institutions, etc.) in shaping how successful transformational agents (firms, institutions, etc.) can be. There are several business environment metrics that are of relevance per the theoretical background, generally taken at the national level, although some of these can also be captured at the sectoral level if in-depth sectoral studies are carried out. These metrics can be used for two purposes: (i) to understand if a target firm will be operating within a conducive operational environment and (ii) to identify whether any changes can (or should) be made to the operational environment through other potential investments. The first is the quality of infrastructure, determined in terms of both transport infrastructure and communications infrastructure. These can influence how efficient the domestic and international trade of goods and services is, affecting firm productive capacity as well as access, and proximity, to markets. The better the infrastructure network, the more effective are trade outcomes. At the national level, both metrics can be found through the annual World Economic Forum (WEF) Competitiveness Rankings (WEF, 2017). As they are rankings, they only present relative information (rather than absolute metrics). However, the established rankings provide some idea of how good the transport and communication infrastructure is in target countries. Closely related are the institutions that influence market operations. Of greatest relevance (and with the greatest ease of accessing data) are two data points that can be used: the Institutional Quality ranking in the WEF Competitiveness Ranking (WEF, 2018) and the Enforcing Contract metric from the World Bank Doing Business index (World Bank, 2018b). Although these are not holistic measures (or representations) of institutional quality, they can provide a picture of the institutional context that firms operate in, where a more conducive context theoretically posits better productivity (and transformative) outcomes. The FDI and firm-level literature provides some evidence that better (or deeper) financial markets help firms increase productivity and better absorb FDI spillovers. There are three simple measures of financial deepening. The World Development Indicators (WDI) (World Bank, 2018c) provide a national-level indicator that measures credit to the private sector (as a proportion of GDP); the higher the proportion, the higher the availability of finance to firms. The Enterprise Surveys provide information on the percentage of firms that have access to bank credit. The World Bank Doing Business rankings provide a meta-indicator on the capacity firms to access to credit. Firm operations include two metrics. The first looks at ease of firm entry into and exit from markets, as more dynamic markets facilitate the allocation of resources towards more productive firms. The metric is proxied by the World Bank Doing Business data on starting a firm and on insolvency measures, with better scores indicating more dynamic firm entry into and exit from markets. The second is a trade composite (the components of which are in Table 8 below), which provides information on how easy it is for firms to engage in international trade, backed by the theory that national participation in trade and increased market competition both foster greater firm productivity. The final metric is the education level of a country: where education levels are high, markets can operate closer to the technology frontier by being more effective at implementing and using high-tech inputs – either by means of their own capacity or through FDI technology absorption effects. The metric measures the percentage of the (eligible) population that is enrolled in tertiary education as a proxy to indicate the skill and educational level of the employment pool that firms can draw on. Greater access to educated labour can result in more productive capacity. Table 4 provides a summary of the operational environment considerations that should be used to evaluate how effective an investment within a firm can be, given the operational environment within

MEASURING THE POTENTIAL CONTRIBUTION OF DFIS TO ECONOMIC TRANSFORMATION|
19
which it operates. Alternatively, they can be used to assess the business environment to identify where changes, conducive to economic transformation, could be made.
Table 4: Summary of business environment metrics
Criteria Economic transformation impact channel
Technique Data source
Infrastructure Better transport and communication infrastructure facilitates more efficient production (and trade)
Transport infrastructure ranking
WEF World Competitiveness rankings
Communications infrastructure ranking
WEF World Competitiveness rankings
Institutions More transparent and effective institutions facilitate market (and firm) operations, enhancing productivity gains
Institutional Quality WEF World Competitiveness rankings
Enforcing Contracts World Bank Doing Business rankings
Financial deepening
Firms that operate in more effective financial markets are better able to absorb FDI spillover effects, thereby increasing productivity levels
Credit to private sector (% GDP)
WDI
% of firms with bank credit World Bank Enterprise Survey data
Access to credit World Bank Doing Business rankings
Firm operations
Faster firm entry/exit helps indicate whether more productive firms can enter the market and less productive firms exit the market. Trade time helps evaluate how quickly/effectively firms can engage in international trade
Firm Entry and Exit (Starting a Business and Resolving Insolvency measures)
World Bank Doing Business Rankings
Trade composite (time to import/export; customs burden; documents required to trade)
World Bank Doing Business rankings
Education The higher the percentage of workforce educated at tertiary level, the greater the capacity to adapt and use more productive technologies, improving productivity outcomes
Tertiary education enrolment
WDI
MEASURING THE POTENTIAL CONTRIBUTION OF DFIS TO ECONOMIC TRANSFORMATION|
20
4 HOW ARE DFI INVESTMENTS SHAPING ECONOMIC TRANSFORMATION?
The section aims to answer two questions: (i) how do existing CDC and IFC investments affect economic transformation? and (ii) to what extent do these organisations assess the economic transformation impact potential of their investments? Understanding these impacts means looking at the sectoral allocation of the publicly disclosed investment portfolio of the two organisations, not with a critical eye on the extent to which they have achieved economic transformation but rather looking at where existing interventions could already be achieving economic transformation impacts. The section then reviews existing data analysing the effects of the CDC and the IFC on productivity and growth, before assessing whether the tools the two DFIs use to inform and evaluate their investments could steer investment choices towards those with the greatest transformative impact effects.
4.1 Economic transformation impacts by DFIs Understanding current economic transformation impacts requires an analysis of publicly available data. This means there will be a significantly high degree of aggregation excluding granular contributions towards economic transformation – that is, whether investments support the production of more complex and internationally competitive products. The section thus provides an overview of the CDC and IFC portfolios, looking at sectoral allocation of investments, integrating recent evidence that highlights CDC/IFC macroeconomic impacts and the structural transformation impact of their potential employment outcomes. The effects of DFIs on labour productivity were measured by Jouanjean and te Velde (2013), who used panel data to evaluate DFI investments in 63 countries and found a statistically significant positive relationship between DFI investments and labour productivity, where an increase of 1% in DFI investments as a proportion of GDP can result in an increase of 3.4% in labour productivity. More recently, Massa et al. (2016) measured the individual impacts of DFI investments on three relevant metrics: economic growth, labour productivity and gross fixed capital formation (GFCF). The report finds that both IFC and CDC investments have positive impacts on growth and labour productivity. It is important to note that the sample sizes available for effective measurement of impacts of individual DFIs are quite small hence it is not possible to give strong support to the above statements, however when the data for all DFIs is aggregated, the effect of DFIs on growth and labour productivity is both positive and significant. This points out the need for more detailed portfolio
Key messages • From a disclosed portfolio perspective, the CDC and IFC both invest in transformative sectors
such as manufacturing. • Macroeconomic studies show that IFC investments do have an impact on some measures of
economic transformation, for example labour productivity. • The CDC uses two tools to evaluate development. Although the ex-ante tool does favour
manufacturing investments, neither tool, beyond measuring employment effects, captures economic transformation impacts to a significant degree.
• The IFC uses three evaluation systems: the IFC Development Goals (IDGs), which represent the development impacts the IFC prioritises; the Development Outcome Tracking System (DOTS), which is primarily a monitoring and evaluation tool; and systemic evaluations. There is limited overlap between IDG/DOTS indicators and economic transformation metrics.
• There is no clear indication that, for either DFI, development impact tools (both ex-ante and ex-post) have any effect on directing investment choices towards more transformational outcomes.
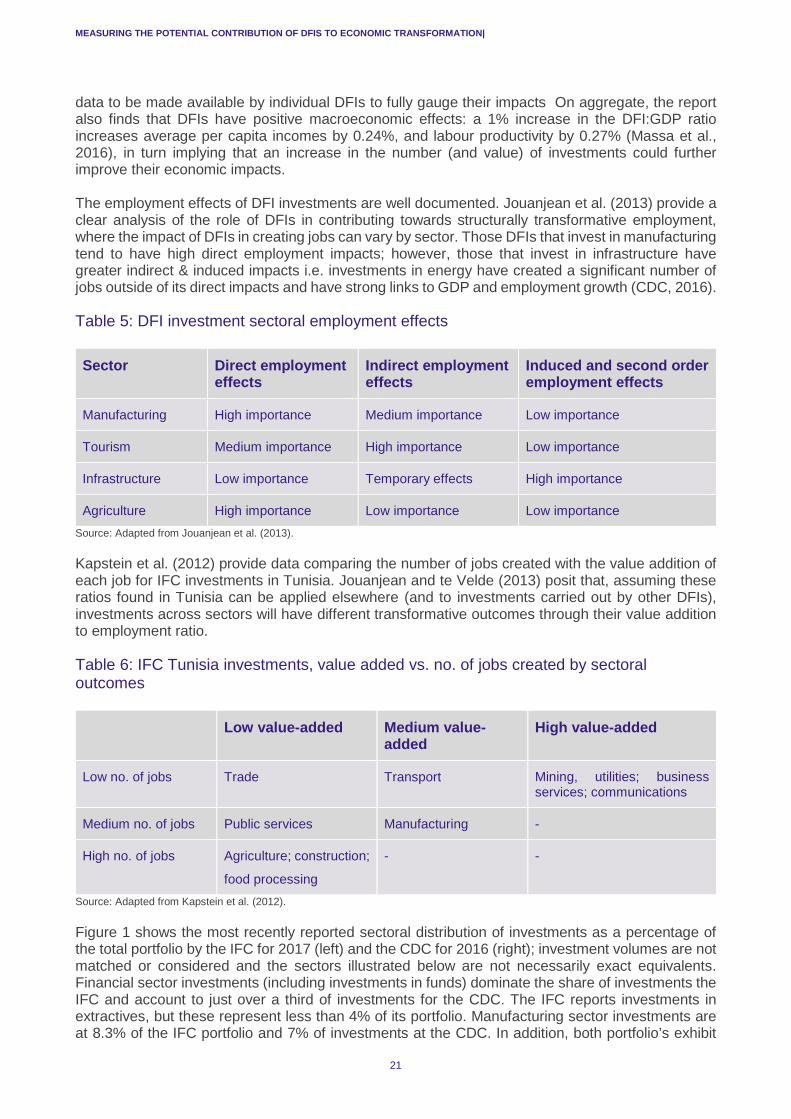
MEASURING THE POTENTIAL CONTRIBUTION OF DFIS TO ECONOMIC TRANSFORMATION|
21
data to be made available by individual DFIs to fully gauge their impacts On aggregate, the report also finds that DFIs have positive macroeconomic effects: a 1% increase in the DFI:GDP ratio increases average per capita incomes by 0.24%, and labour productivity by 0.27% (Massa et al., 2016), in turn implying that an increase in the number (and value) of investments could further improve their economic impacts. The employment effects of DFI investments are well documented. Jouanjean et al. (2013) provide a clear analysis of the role of DFIs in contributing towards structurally transformative employment, where the impact of DFIs in creating jobs can vary by sector. Those DFIs that invest in manufacturing tend to have high direct employment impacts; however, those that invest in infrastructure have greater indirect & induced impacts i.e. investments in energy have created a significant number of jobs outside of its direct impacts and have strong links to GDP and employment growth (CDC, 2016).
Table 5: DFI investment sectoral employment effects Sector Direct employment
effects Indirect employment effects
Induced and second order employment effects
Manufacturing High importance Medium importance Low importance
Tourism Medium importance High importance Low importance
Infrastructure Low importance Temporary effects High importance
Agriculture High importance Low importance Low importance Source: Adapted from Jouanjean et al. (2013).
Kapstein et al. (2012) provide data comparing the number of jobs created with the value addition of each job for IFC investments in Tunisia. Jouanjean and te Velde (2013) posit that, assuming these ratios found in Tunisia can be applied elsewhere (and to investments carried out by other DFIs), investments across sectors will have different transformative outcomes through their value addition to employment ratio.
Table 6: IFC Tunisia investments, value added vs. no. of jobs created by sectoral outcomes Low value-added Medium value-
added High value-added
Low no. of jobs Trade Transport Mining, utilities; business services; communications
Medium no. of jobs Public services Manufacturing -
High no. of jobs Agriculture; construction;
food processing
- -
Source: Adapted from Kapstein et al. (2012).
Figure 1 shows the most recently reported sectoral distribution of investments as a percentage of the total portfolio by the IFC for 2017 (left) and the CDC for 2016 (right); investment volumes are not matched or considered and the sectors illustrated below are not necessarily exact equivalents. Financial sector investments (including investments in funds) dominate the share of investments the IFC and account to just over a third of investments for the CDC. The IFC reports investments in extractives, but these represent less than 4% of its portfolio. Manufacturing sector investments are at 8.3% of the IFC portfolio and 7% of investments at the CDC. In addition, both portfolio’s exhibit

MEASURING THE POTENTIAL CONTRIBUTION OF DFIS TO ECONOMIC TRANSFORMATION|
22
significant investments in infrastructure (24% for the CDC and 14.4% for the IFC), whilst the IFC also reports investments in services such as ICT (2%) and tourism, retail & property (3.7%).
Figure 1: IFC 2017 (left) and CDC 2016 (right) portfolios by broad sector (%)
Sources: CDC (2017b) and IFC (2017).
As a comparator, the European Development Finance Institutions (EDFI) association also provides broadly comparable portfolio data (see figure 2 below) for the aggregate of European DFIs (which also includes the CDC). Similarly, to the CDC and IFC, the aggregate portfolio has a significant financial sector presence. Industry and manufacturing sector investments represent about 15% of the aggregate portfolio, hence less than the CDC but more than the IFC. Infrastructure accounts for 17.8% of the portfolio whilst service sector investment represent around 4.7%.
Figure 2: EDFI 2017 portfolio by broad sector (%)
Source: EDFI (2017)
49.4
14.4
9.8
8.3
5.83.7
3.63
2
IFC
Financial Markets InfrastructureAgribusiness & Forestry ManufacturingHealth & Education Oil, Gas & MiningTourism, Retail & Property FundsICT
36
24
8
7
5
42
14
CDC
Financial Institutions InfrastructureHealth ManufacturingFood & Agriculture ConstructionEducation Other
32.8
15.218.3
9.3
8.5
4.7
11.2
EDFI
Financial Sector Industry/Manufacturing Energy InfrastructureInfrastructure (non-energy) Agribusiness ServicesOther

MEASURING THE POTENTIAL CONTRIBUTION OF DFIS TO ECONOMIC TRANSFORMATION|
23
Following the findings in Jouanjean and te Velde (2013) and Kapstein et al. (2012), we find some similarities and some differences in the degrees of transformative impact potential within the CDC and the IFC portfolios. Both invest part of their portfolios in manufacturing which can have a significant transformative growth and higher-value employment potential. Both DFIs investment in infrastructure, which can have positive transformative transversal impacts across a wide range of sectors as well as wider induced employment impacts, falling in line with the United Nations Conference on Trade and Development’s (UNCTAD’s) call for development banks to fund investments that ‘generate externalities’ by promoting wider impacts and contributing to structural transformation (UNCTAD, 2014). In addition, both DFIs investment in the financial sector, which can also promote transformative growth when investments are geared to help increase access to finance, especially when targeted at SME finance. In addition, the IFC specifically reports investments in tourism and ICT which represent higher-value service and higher-value employment outcomes. Overall the portfolio distribution shows a positive contribution to transformative sectors for both DFIs. The nature of DFI investments, which are carried out through either loan- or equity-based instruments, and the division between the two can shed further light on economic transformation potential. Assuming that the ‘pecking order’ theory, whereby firms prefer to generate their own funding, and if not they will rely on loans and finally on equity financing (Myers and Majluf, 1984), the choice of financing preference may not be pertinent. In addition, financing preferences may be determined by cultural norms and firm managerial preferences, as Gleason et al. (2000) point out. Given these caveats, as the economic transformation discussion assumes FDI spillover effects on firm performance, through DFI investments that are assumed to occur through equity-based investment instruments, it is also important to assess whether debt financing can have positive economic transformation outcomes. From an economic transformation point of view, the use of debt and equity instruments seems to be mixed. Country-level evidence from 80 small and medium-sized enterprises (SMEs) in Zimbabwe shows that debt financing has a positive impact on firm productivity; however, higher levels of interest on loans resulted in decreases in productivity (Dube, 2013). Similar results were found for Ghanaian microenterprises, with debt finance shown to have a strong positive relationship with productivity – unlike self-raised finance, which did not exhibit any relationship (Osei-Assibey, 2010). In both cases, the relationship is attributed to the need for microenterprise owners to increase productivity to ensure their ability to pay off loans, which, given the circular logic of the thesis, is not enough to explain the strong relationship. This relationship is also contested by other studies. For example, in Italy TFP and firm debt levels (for a set of 40,000 Italian firms between 1982 and 1998) were found to be inversely related (Nucci et al., 2005). Levine and Warusawitharana (2014) test changes in TFP on a four-country dataset over the 2000–2010 period and find a positive relationship between debt and TFP growth in all four countries,20 but a significant positive relationship between equity financing and TFP growth in only two.21 On the other hand, data covering 11,000 firms in 47 countries between 1997 and 2007 suggested the opposite was true, with higher levels of debt leading to lower productivity and higher levels of equity financing leading to higher productivity rates (Mallick and Yang, 2011). Davis et al. (2014) find that leveraged buyouts22 do lead to TFP gains; however, this owes to labour reallocation and comes at the cost of a reduction in earnings per worker. A panel of 80 private equity owned firms in Sweden showed a 10% level of productivity growth between 2004 and 2013 (Sheng and Svenningsson, 2014). Although it is not to be taken as a thorough review of equity and debt productivity outcomes, the evidence does show some mixed results. The outcome of the investment instruments may be largely 20 Italy, Spain, France and the UK. 21 Spain and the UK; the relationship was still positive but not significant in Italy and France. 22 A caveat is necessary here as leveraged buyouts are not directly comparable with DFI equity investments; however, they do represent a form of equity investment.
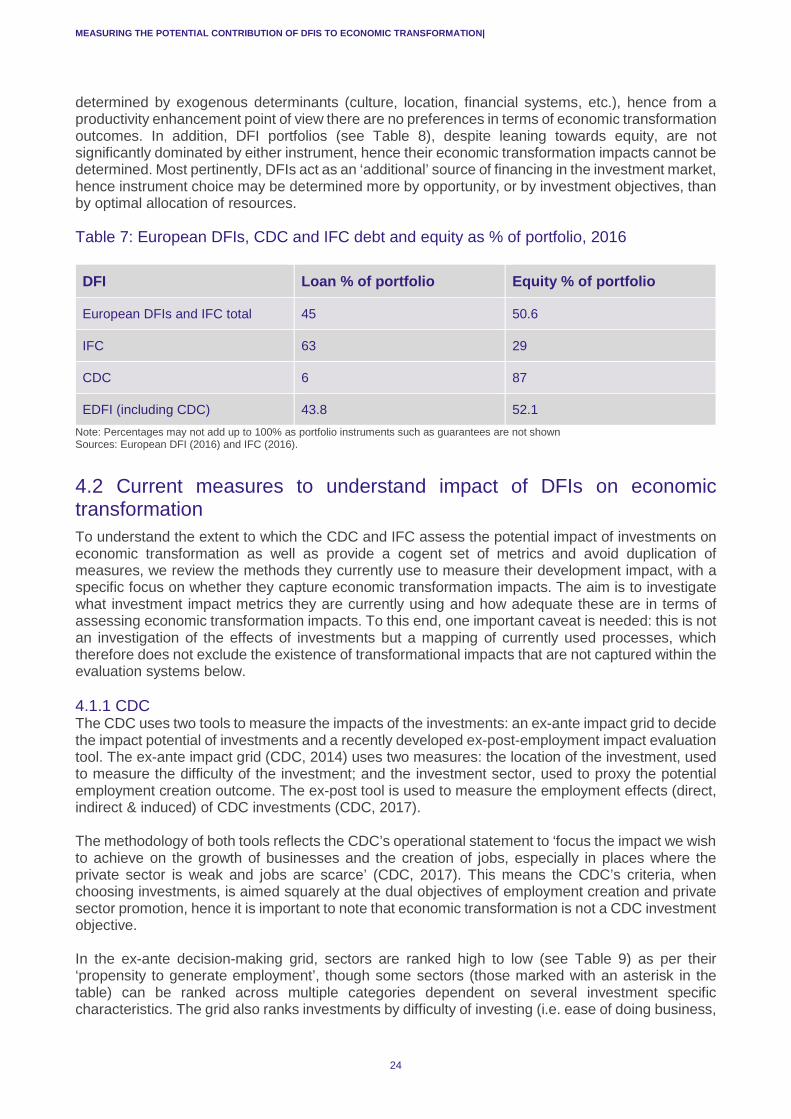
MEASURING THE POTENTIAL CONTRIBUTION OF DFIS TO ECONOMIC TRANSFORMATION|
24
determined by exogenous determinants (culture, location, financial systems, etc.), hence from a productivity enhancement point of view there are no preferences in terms of economic transformation outcomes. In addition, DFI portfolios (see Table 8), despite leaning towards equity, are not significantly dominated by either instrument, hence their economic transformation impacts cannot be determined. Most pertinently, DFIs act as an ‘additional’ source of financing in the investment market, hence instrument choice may be determined more by opportunity, or by investment objectives, than by optimal allocation of resources.
Table 7: European DFIs, CDC and IFC debt and equity as % of portfolio, 2016 DFI Loan % of portfolio Equity % of portfolio
European DFIs and IFC total 45 50.6
IFC 63 29
CDC 6 87
EDFI (including CDC) 43.8 52.1 Note: Percentages may not add up to 100% as portfolio instruments such as guarantees are not shown Sources: European DFI (2016) and IFC (2016).
4.2 Current measures to understand impact of DFIs on economic transformation To understand the extent to which the CDC and IFC assess the potential impact of investments on economic transformation as well as provide a cogent set of metrics and avoid duplication of measures, we review the methods they currently use to measure their development impact, with a specific focus on whether they capture economic transformation impacts. The aim is to investigate what investment impact metrics they are currently using and how adequate these are in terms of assessing economic transformation impacts. To this end, one important caveat is needed: this is not an investigation of the effects of investments but a mapping of currently used processes, which therefore does not exclude the existence of transformational impacts that are not captured within the evaluation systems below. 4.1.1 CDC The CDC uses two tools to measure the impacts of the investments: an ex-ante impact grid to decide the impact potential of investments and a recently developed ex-post-employment impact evaluation tool. The ex-ante impact grid (CDC, 2014) uses two measures: the location of the investment, used to measure the difficulty of the investment; and the investment sector, used to proxy the potential employment creation outcome. The ex-post tool is used to measure the employment effects (direct, indirect & induced) of CDC investments (CDC, 2017). The methodology of both tools reflects the CDC’s operational statement to ‘focus the impact we wish to achieve on the growth of businesses and the creation of jobs, especially in places where the private sector is weak and jobs are scarce’ (CDC, 2017). This means the CDC’s criteria, when choosing investments, is aimed squarely at the dual objectives of employment creation and private sector promotion, hence it is important to note that economic transformation is not a CDC investment objective. In the ex-ante decision-making grid, sectors are ranked high to low (see Table 9) as per their ‘propensity to generate employment’, though some sectors (those marked with an asterisk in the table) can be ranked across multiple categories dependent on several investment specific characteristics. The grid also ranks investments by difficulty of investing (i.e. ease of doing business,

MEASURING THE POTENTIAL CONTRIBUTION OF DFIS TO ECONOMIC TRANSFORMATION|
25
geography, fragility, etc.); however, this dimension is of limited significance in terms of economic transformation. From an economic transformation perspective, the ex-ante grid’s evaluation of sectors is of significance. The grid prioritises investments into sectors that may have important direct impacts on economic transformation – that is, manufacturing and food processing – as well as important transversal impact sectors – such as renewable energy and construction. However, some sectors that are important because of their high value addition, such as business services, or their potential contribution transitions, such as financial services, are ranked low. Given the high priority on productive industries (manufacturing, textiles and food processing), the overall propensity of the grid can be thought of as ‘transformative’. However, translation of this propensity into the investment reality shows that only (approximately) 9% of investments fall into this category – possibly as a reflection both of ‘natural’ DFI propensity to invest in finance and of the fact that the CDC has only relatively recently started to directly invest in firms (CDC, 2012), increasing the share of the portfolio represented by the (productive) industrial sector.
Table 8: CDC sectoral prioritisation for investments (ex-ante) Low Medium High
Business services
Communication
Financial services
Mineral extraction
Trade*
Agricultural crops
Forestry/fisheries
Meat/livestock
Trade
Transport
Utilities and power*
Construction
Food processing
Manufacturing (light and heavy)
Microfinance*
Public services (including health and education)
Renewables*
Textiles
Trade* Source: CDC (2013).
The ex-post evaluation tool (McGillivray et al., 2017) measures six employment effects for existing (or completed) CDC investments, aggregating impacts at the portfolio level on an annual basis. These are meant to capture the CDC investment employment creation effects, including the direct impacts (jobs created within the CDC investment target), indirect employment impacts (jobs created through cascade effects through affected supply chains) and induced employment impacts created through income expenditure. The methodology also captures economy-wide employment effects through investments in financial services and in energy infrastructure. The methodology has been used to evaluate employment generation effects across the whole CDC portfolio for 2014 and 2015. As the methodology of the ex-post tool is presented, it contains no economic transformation impact evaluation. As such, at this level, beyond a numerical analysis of employment impacts, there is no significant evaluation of such impacts. However, the methodology specifies that sectoral multipliers have been calculated (albeit not presented), hence ex-post-employment evaluations for individual projects are possible. The tool cannot be used as a transformative impact evaluation measure. 4.2.2 IFC The IFC aims to achieve the ‘twin goals of eradicating extreme poverty and boosting shared prosperity’ (IFC, 2017a). Impact evaluation follows a three-pronged process based on the IFC’s Development Goals (IDGs), the application and use of the Development Outcome Tracking System (DOTS) and systemic evaluations of IFC impacts. The 2017/19 and 2018/20 IFC Strategy and

MEASURING THE POTENTIAL CONTRIBUTION OF DFIS TO ECONOMIC TRANSFORMATION|
26
Business Outlook documents identify industry as a priority area, given its potential to create jobs and contribute to productivity growth (IFC, 2017b), hence a strategic bias towards economic transformation exists within the IFC. Ex-ante project selection uses a ‘portfolio approach’ whereby investment projects are selected based on their development impacts and expected financial performance. At a project level, the IFC currently uses the DOTS to provide an ex-ante evaluation of the development impact of potential investments. The DOTS is also used as a monitoring and evaluation tool throughout the lifecycle of the project. The four areas measured with the DOTs system are as follows (IFC, 2011):
1. Financial performance: Whether the project is likely to meet IFC financial performance boundary targets;
2. Economic performance: Looking at the economic contribution of the project – that is, increasing access to finance, contribution to energy and telecommunication infrastructure, etc.;
3. Environmental and social (E&S) performance: What environmental and social impact the project will have;
4. Private sector development: Contribution to local private sector development – that is, changes in gender composition of boards, percentage of purchases made locally, etc.
Table 10 evaluates whether the DOTS indicators in the four areas can be used to measure economic transformation impacts. The indicators for Financial Performance self-evidently do not capture changes in firms that could have an impact on (or be a result of) economic transformation, as they are focused on the financial viability of the investment. On the other hand, the Economic Performance indicators are a close fit with economic transformation indicators that measure changes in infrastructure (access and availability), access to finance and (non-disaggregated) employment effects. E&S Performance is not assumed to be a measure of economic transformation and is thus not included in the metrics considered in this paper. 23 Finally, the Private Sector Development measurements could be used indirectly to understand if there have been any positive changes in the business environment and access to finance through impacts on individual firms, although not effects at the national level.
Table 9: The IFC’s DOTS mapped onto ET DOTS Main areas measured Transformational?
Financial performance
Returns on equity/invested capital (annual/lifetime)
No. Although improvements in the financial viability of firms may be indirectly related to better productivity, this measure cannot be indirectly inferred or assumed.
Internal rate of return or/and financial rate of return
Project/investment costs
Economic performance
Utilities generation (energy/water/sewage) Yes, directly links to improvements in infrastructure and access to finance and indirectly to employment measures of economic transformation.
Transport (passenger and logistics) improvement
ITC improvements
23 See Section 5 for a discussion of the co-relation between environmental and economic transformation actions and impacts.

MEASURING THE POTENTIAL CONTRIBUTION OF DFIS TO ECONOMIC TRANSFORMATION|
27
Access to finance
Employment generation (direct and indirect)
E&S performance Affected communities (%) N/A, no E&S metrics in economic transformation measurements.
Mitigation and development benefits
Occupational health and safety
Resource efficiency
Private sector development
Domestic purchases Yes, indirectly linked with improvements in business environment, market participation and access to finance measures of economic transformation.
Gender participation (employee/management/board)
Corporate governance and risk management improvements
Financial instruments
Demonstration effects
Attract FDI Source: IFC (2011)
In addition to the DOTS indicator areas, a proposed investment project needs to meet the IDGs, of which there are five: infrastructure, financial institutions, climate change mitigation, health & education and agribusiness. Table 11 maps the indicators that are used to monitor the IDGs in the five interest areas against economic transformation considerations. Apart from the climate change mitigation IDG, the IDGs could all contribute to some aspects of economic transformation. Table 11 maps the main indicators measured by the IDGs to transformational impacts, finding that the indicators used to measure infrastructure impacts could be directly used to measure existing (or potential) economic transformation impacts. The financial institutions score would indirectly provide some measure of economic transformation; however, impact measures are limited to supported financial institution portfolio rather than economy-wide impacts. On the other hand, the indicators used to measure health & education and agribusiness IDG impacts do not provide a measure of economic transformation effects, as they measure access to health care and education. From a transformational point of view, the education indicator would look at any changes in tertiary/high skilled education access (or achievement). The agribusiness indicator, though relevant to the financial benefit of agricultural firms, does not measure whether there have been any changes in productivity and production systems. Finally, the Environmental & Social (E&S) indicators have no equivalence for economic transformation impacts.

MEASURING THE POTENTIAL CONTRIBUTION OF DFIS TO ECONOMIC TRANSFORMATION|
28
Table 10: IFC’s IDGs mapped onto economic transformation IDG Main indicators Transformational?
Infrastructure Power generation Yes, directly linked with economic transformation indicators looking at improvements in infrastructure. Utilities distribution
No. of passengers
Company subscribers
Financial institutions
Access to finance for enterprises Yes, indirectly linked, as % of financial institution portfolio rather than economy-wide measures are used, to economic transformation indicators measuring access to finance.
Access to finance for women
Access to financial services
Access to insurance and pensions
Electronic payments
Climate change mitigation
Greenhouse gas emissions reduced
N/A. There is no climate change metric in economic transformation measurements.
Health and education
People receiving new or improved health services
No, only tangential link with education but no specification of level or quality of education.
People receiving new or improved education services
Agribusiness Farmers access to supply chains
No. Improvements in agribusiness outcomes do not include changes in economic transformation measures such as productivity levels, technology use or labour mix. Farmer increase in sales,
purchasing or finance
Farmer improvements in environmental and social sustainability
Source: IFC (2011).
Finally, the IFC uses systemic evaluations of its investments to assess their impacts, providing access to multiple publicly disclosed evaluations and complementing the work carried out by the World Bank’s Independent Evaluation Group. The IFC uses these evaluations to help the organisation learn about its impacts and provide feedback on future investments. The evaluations do not follow standard formats and are carried out on specific themes, hence their capacity to measure economic transformation impacts would be strictly set by the theme that they investigate. An overarching Ex-Ante Development Impact Framework will be used to select projects based on their expected development impacts (IFC, 2017b). The IFC recognises that the DOTS framework, while useful for measuring the direct impacts of its investments, does not capture indirect and induced impacts. As part of this framework, the IFC is preparing a tool that will use Input-Output and SAM multiplier tables to evaluate the effects of its projects (ibid.), with the aim of implementing it in the 2018–2020 business period. The use of Input-Output and SAM multiplier tables will improve the capacity to differentiate impacts between sectors, allowing for better targeting of transformative

MEASURING THE POTENTIAL CONTRIBUTION OF DFIS TO ECONOMIC TRANSFORMATION|
29
sectors. At the national level, the IFC will implement private sector diagnostics, although the specifics of these have not been disclosed. It is important to keep in mind that the IFC is currently working on a new ex-ante and ex-post evaluation system called the Anticipated Impact Measurement and Monitoring (AIMM) framework.24 This will heavily feature the measurement of how the IFC ‘shapes markets’, which will closely align with several economic transformation measures.
24 Information gained through personal communication with IFC representatives. The IFC has yet to formally launch the AIMM and is in the process of refining the framework.

MEASURING THE POTENTIAL CONTRIBUTION OF DFIS TO ECONOMIC TRANSFORMATION|
30
5 HOW COULD DFIS EVALUATE ECONOMIC TRANSFORMATION?
This section builds on the theoretical foundations set out in Section 2 and the methodologies described in Section 3 to provide metrics that DFIs could use to evaluate the transformative potential of their investments. The metrics have been chosen to fill the gap related to indicators used in the evaluation systems used by the CDC and the IFC, although their use is open to all DFIs. These indicators are set out in order of increased granularity. For example, the first set of indicators looks at inter-sectoral issues, the second set at intra-sectoral, the third set look at the business environment, whilst the last set looks at firm level issues. Hence DFI’s looking to prioritise what indicators to use need only those that are required for their intended level impact evaluation level.
5.1 National sectoral-level indicators The national sectoral-level indicators look at sectors, as whole units, and are meant to provide a comparison between sectors of an economy.25 The indicators below are meant to test whether the sector receiving the investment contributes to national-level economic transformation through three areas:
1. Will the investment contribute to changes in national productivity? Whether the investment will contribute to an increase in national productivity levels by investing in sectors where productivity is higher than the national average.
2. Will the investment promote economic complexity? Whether the sector that the investment is carried out in is in a high ECI scoring sector. The higher the score, the greater the complexity of the sector, allowing for production across more complex sectors and providing a competitive advantage in international trade. Whether the sector has a high RCA score, which would indicate a strong opportunity both to export and to produce locally.
3. What are the cross-sectoral effects? Whether the selected sector will have wider (beneficial) impacts on other sectors in the economy as well what type of economy-wide employment effects are expected.
25 It is important to note that national level indicators (i.e. GDP growth, Gross Fixed Capital Formation etc.) are left out of the index as DFI investment location are generally based on investment opportunities existing within pre-determined country lists, hence comparisons between countries are not applicable within the context of the proposed methodology.
Key messages
• This section presents a set of indicators divided into four meta groups. • The four meta groups are each composed of multiple sub-indicators, chosen because of the
availability of data and the impact relevance of DFI investments. • The four indicator groups look at the potential national-level impact of investments, sectoral-level
effects, impacts on the firm and whether the business environment is conducive to investments that would facilitate economic transformation.
• More research is required to identify metrics that should be used for a potentially crucial future meta group that would look at environmental outcomes occurring because of intended economic transformation impacts.
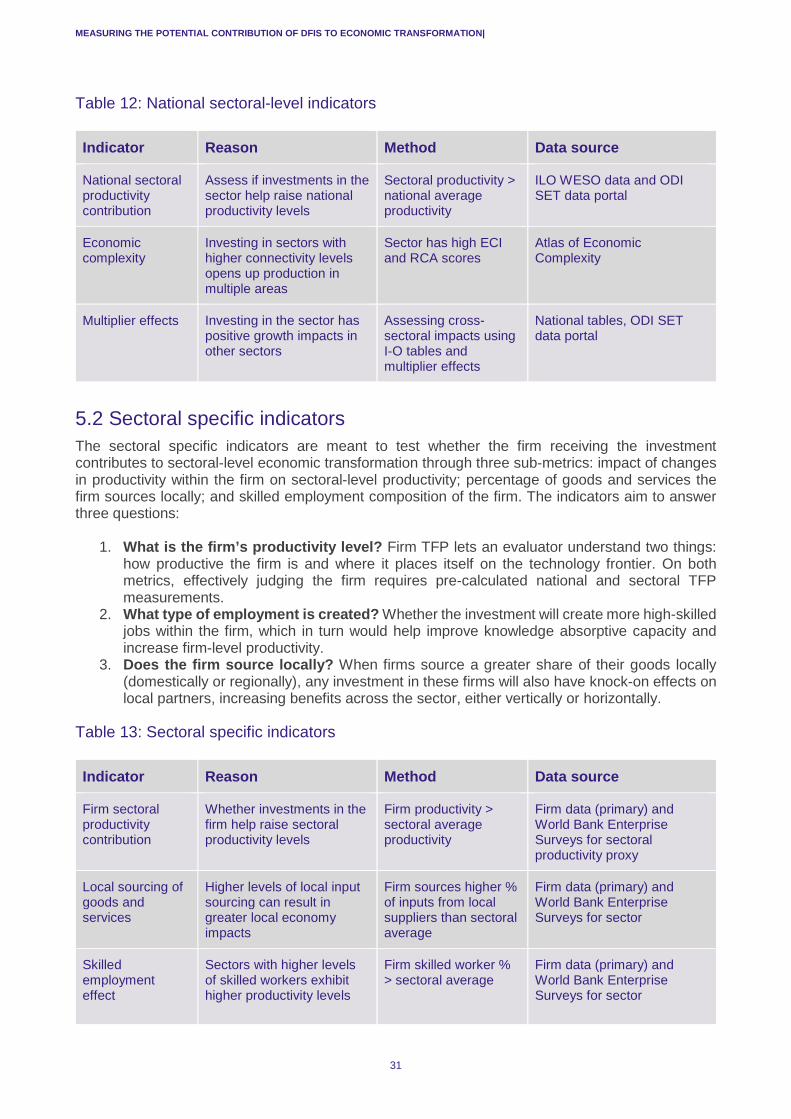
MEASURING THE POTENTIAL CONTRIBUTION OF DFIS TO ECONOMIC TRANSFORMATION|
31
Table 12: National sectoral-level indicators Indicator Reason Method Data source
National sectoral productivity contribution
Assess if investments in the sector help raise national productivity levels
Sectoral productivity > national average productivity
ILO WESO data and ODI SET data portal
Economic complexity
Investing in sectors with higher connectivity levels opens up production in multiple areas
Sector has high ECI and RCA scores
Atlas of Economic Complexity
Multiplier effects Investing in the sector has positive growth impacts in other sectors
Assessing cross-sectoral impacts using I-O tables and multiplier effects
National tables, ODI SET data portal
5.2 Sectoral specific indicators The sectoral specific indicators are meant to test whether the firm receiving the investment contributes to sectoral-level economic transformation through three sub-metrics: impact of changes in productivity within the firm on sectoral-level productivity; percentage of goods and services the firm sources locally; and skilled employment composition of the firm. The indicators aim to answer three questions:
1. What is the firm’s productivity level? Firm TFP lets an evaluator understand two things: how productive the firm is and where it places itself on the technology frontier. On both metrics, effectively judging the firm requires pre-calculated national and sectoral TFP measurements.
2. What type of employment is created? Whether the investment will create more high-skilled jobs within the firm, which in turn would help improve knowledge absorptive capacity and increase firm-level productivity.
3. Does the firm source locally? When firms source a greater share of their goods locally (domestically or regionally), any investment in these firms will also have knock-on effects on local partners, increasing benefits across the sector, either vertically or horizontally.
Table 13: Sectoral specific indicators Indicator Reason Method Data source
Firm sectoral productivity contribution
Whether investments in the firm help raise sectoral productivity levels
Firm productivity > sectoral average productivity
Firm data (primary) and World Bank Enterprise Surveys for sectoral productivity proxy
Local sourcing of goods and services
Higher levels of local input sourcing can result in greater local economy impacts
Firm sources higher % of inputs from local suppliers than sectoral average
Firm data (primary) and World Bank Enterprise Surveys for sector
Skilled employment effect
Sectors with higher levels of skilled workers exhibit higher productivity levels
Firm skilled worker % > sectoral average
Firm data (primary) and World Bank Enterprise Surveys for sector

MEASURING THE POTENTIAL CONTRIBUTION OF DFIS TO ECONOMIC TRANSFORMATION|
32
5.3 Business environment indicators The business environment indicators help us understand whether the investment is being carried out in an environment that helps improve the absorption of FDI spillover effects, such as through capacity to adopt new skills, knowledge and technical know-how and to use new technologies. In addition, they assess whether the infrastructure level is adequate and whether the financial sector is deep enough, both important factors to promote positive FDI spillover effects. The grouping also includes the catalytic effect of the investment: the DFI can assess whether the investment leads other funding actors to pledge (or disburse) funding for the project or whether the investment induces or complements funding in similar or complementary transformative activities.
Table 14: Business environment indicators Indicator Reason Method Data source
Transport, energy and communication infrastructure ranking
Better transport, energy and communication infrastructure facilitates more efficient firm operations
Country has good ranking level in transport, energy and communication infrastructure ranking
WEF Global Competitiveness Index
Tertiary education levels
Higher education levels help with capacity to adopt technology and knowledge through FDI
% of national labour force with tertiary education high
ILO WESO data
Firm access to credit
Deeper financial markets improve firm capacity to absorb FDI spillover effects
% of firms with access to credit high
World Bank Enterprise Surveys and Doing Business rankings
Transformative investment catalytic effect
Catalysing increased levels of funding can help improve the impacts of the project, by increasing the scale of the project (i.e. multiple funders in the same project), complementing other investments or inducing more funding in transformative investments
% of own investment funds matched by other DFIs, directly (within the project), indirectly for complementary projects or mobilised by other funders because of the investment
Primary data
5.4 Firm-level indicators Firm-level indicators assess whether investments in the target firm help improve sectoral productivity levels. These can be assessed by asking three questions:
1. How complex is the product? Investment in more complex products means targeting firms that have better productivity levels through a combination of higher-skilled labourers and use of more advanced capital.
2. Is firm international trade participation strong? Assessing if the target firm participates in export trade is a good measure to understand whether the firm has high productivity rates and capacity to learn from international practices.
3. Will the investment improve firm practices? DFI investments may include plans to improve firm efficiency (as a method to reduce financial risks); such practices – for example better management or the introduction of systems such as Kaizen – help increase firm-level productivity.
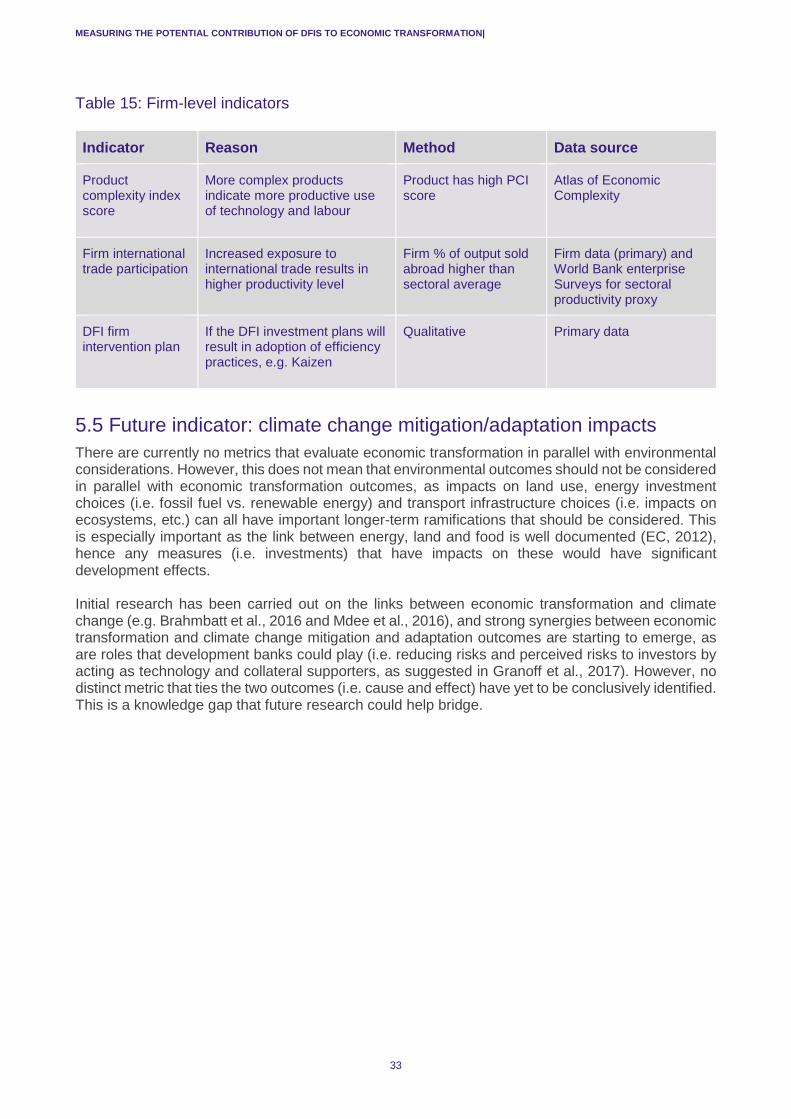
MEASURING THE POTENTIAL CONTRIBUTION OF DFIS TO ECONOMIC TRANSFORMATION|
33
Table 15: Firm-level indicators Indicator Reason Method Data source
Product complexity index score
More complex products indicate more productive use of technology and labour
Product has high PCI score
Atlas of Economic Complexity
Firm international trade participation
Increased exposure to international trade results in higher productivity level
Firm % of output sold abroad higher than sectoral average
Firm data (primary) and World Bank enterprise Surveys for sectoral productivity proxy
DFI firm intervention plan
If the DFI investment plans will result in adoption of efficiency practices, e.g. Kaizen
Qualitative Primary data
5.5 Future indicator: climate change mitigation/adaptation impacts There are currently no metrics that evaluate economic transformation in parallel with environmental considerations. However, this does not mean that environmental outcomes should not be considered in parallel with economic transformation outcomes, as impacts on land use, energy investment choices (i.e. fossil fuel vs. renewable energy) and transport infrastructure choices (i.e. impacts on ecosystems, etc.) can all have important longer-term ramifications that should be considered. This is especially important as the link between energy, land and food is well documented (EC, 2012), hence any measures (i.e. investments) that have impacts on these would have significant development effects. Initial research has been carried out on the links between economic transformation and climate change (e.g. Brahmbatt et al., 2016 and Mdee et al., 2016), and strong synergies between economic transformation and climate change mitigation and adaptation outcomes are starting to emerge, as are roles that development banks could play (i.e. reducing risks and perceived risks to investors by acting as technology and collateral supporters, as suggested in Granoff et al., 2017). However, no distinct metric that ties the two outcomes (i.e. cause and effect) have yet to be conclusively identified. This is a knowledge gap that future research could help bridge.

MEASURING THE POTENTIAL CONTRIBUTION OF DFIS TO ECONOMIC TRANSFORMATION|
34
6 A WAY FORWARD
This report has sequentially looked at the drivers of economic transformation, how FDI affects economic transformation and how to assess transformation drivers and effects. As part of this undertaking, it has proposed a new set of metrics that could be used to assess how individual firms contribute to economic transformation. This methodology is new and would require testing, in terms of the feasibility of gathering and using data and would require a significant amount of information from target firms. Overall, using currently available data, the report has shown that the effects of CDC and IFC investments on economic transformation are not particularly significant. It is important to note that the report is not providing a critique of the agencies’ investment portfolio choices. It is abundantly clear that for both the CDC and the IFC the main purpose of these investments, following their stated mandate, is to generate other types of development impacts – that is, to create employment and foster private sector development, outcomes that the investments certainly promote well. In addition, publicly available information on investments is severely limited. This means that transformational impacts at the firm level cannot be measured, nor can the downstream economic transformation impact of financial sector investments or those placed in ‘funds’ be observed and captured. The research does, however, show that, from a sectoral point of view, excluding investments in financial institutions and funds, DFIs have in-built biases that favour investments in (broadly) transformative areas, such as infrastructure, which has positive horizontal transformative spillovers, and manufacturing, which generates vertical transformative spillovers. These biases stem from the ex-ante systems used to ascertain the development impacts of potential investments: the CDC grid and the IFC’s IDG/DOTS. The CDC grid favours high employment sectors, which also tend to include transformative sectors such as manufacturing, agro-processing, infrastructure, etc. The IFC’s DOTS and IDGs use metrics that favour investments in energy generation, transport and communication infrastructure and access to finance, and that promote private sector development. In both cases there, currently, is no quantitative metric that steers investments towards pro-transformational sectors such as manufacturing. The aim of this conceptual paper therefore, was to build the theoretical basis for a set of indicators that DFIs could use to measure the potential (ex-ante) and actual (ex-post) impacts of their existing or future investments. The report has used multiple methods to measure economic transformation and distilled them it into a set of indicators that DFIs could, theoretically, apply to their existing development impact evaluation systems. The indicators encompass transformative impacts at the national level, the sectoral level and the firm level and on the business environment. This brings the report to one of the unknowns that warrants future investigation: the inter-linkages between climate change mitigation/adaptation and economic transformation. A future fifth meta-metric is proposed but not defined – one that would help us understand how economic transformation
Key messages • To understand whether the proposed set of indicators is feasible, future research should aim to
collaborate with DFIs to perform three stress tests. • The first test would help understand whether DFIs can feasibly collect the required data,
especially individual firm data. The second test would help to assess what the risk levels are for transformative investments – that is, whether they can be financially sustainable. The third test would look at the compatibility between economic transformation impacts and mandated DFI development impacts – that is, employment creation.
MEASURING THE POTENTIAL CONTRIBUTION OF DFIS TO ECONOMIC TRANSFORMATION|
35
impacts affect environmental issues (and vice versa); this would require a well-understood and proven causality effect that can be quantified. Based on the consolidated indicators, the way forward is clear. To enhance the economic transformation potential of the DFIs, the meta-metrics should be stress tested (i) for the feasibility of data-gathering – especially firm-level data; (ii) to see whether transformative investments are also financially sustainable; and (iii) to assess whether transformative investments are compatible with other DFI development targets. The first test acknowledges that DFIs do not have limitless capacity to gather information, even from their clients. As such, it is important to evaluate whether the proposed metrics are simple enough for DFIs to gather data on them. The main issue relates to firm-level data: gathering such data may be feasible where direct equity investments are concerned but more complicated if ‘client of client’ data are required – that is, where the transformative impacts of investment funds are being evaluated. The second test is important to understand what the risk boundaries of transformative investments look like. The third test should assess whether these investments are compatible with the broader DFI development mandate. DFIs are meant to be financially sustainable; investments are not meant to be sunk costs but to generate returns that can be invested in further projects. Not all transformative investments can generate financial returns, hence baseline data need to be created so we can understand what types of investments can generate dual wins in terms of revenues and transformative outcomes. Similarly, not all transformative investments can meet other pre-existing DFI development objectives – for example creating high levels of employment or increasing access to finance for excluded social groups. Putting these metrics to the test would, therefore, enables an understanding of what a triple-win investment would look like – that is, generating financial returns, promoting DFI development objectives and facilitating economic transformation. A more refined understanding of the interplay between economic transformation and the environment would then allow us to understand where quadruple win investments are possible.

36
REFERENCES Aghion, P., Blundell, R., Griffith, R., Howitt, P. and Prantl, S. (2009) ‘The effects of entry on incumbent innovation and productivity’, The Review of Economics and Statistics 91(1): 20–32. Aitken, B.J., Hanson, G.H. and Harrison, A.E. (1997) ‘Spillovers, foreign investment and export behaviour’, Journal of International Economics 43(1–2): 103–32. Aitken, B.J. and Harrison, A.E. (1999) ‘do domestic firms benefit from direct foreign investment? Evidence from Venezuela’, The American Economic Review 98(3): 605–18. Alfaro, L. (2003) ‘Foreign direct investment and growth: Does the sector matter?’ Cambridge, MA: Harvard Business School. Alfaro, L. (2015) ‘Foreign direct investment: effects, complementarities and promotion’, in S. Auguste, M. Cuevas and O. Manzano (eds) Partners or creditors? Attracting foreign investment and productive development to Central America and Dominican Republic. Santiago: IADB. Alfaro, L. and Chauvin, J. (2016) ‘Foreign direct investment, finance, and economic development’, Chapter for Encyclopaedia of International Economics and Global Trade, September. Alfaro, L. and Chen, M. (2010) Surviving the global financial crisis: Foreign direct investment and establishment performance. Working Paper 10-110. Cambridge, MA: Harvard Business School. Alfaro, L. and Chen, M. (2016) Selection and market reallocation: Productivity gains from multinational production. Working Paper 12-111. Cambridge, MA: Harvard Business School. Alfaro, L., Kalemli-Ozcan, S. and Sayek, S. (2009) ‘FDI, productivity and financial development’, The World Economy 32(1): 111–35. Ayadi, M. and Matoussi, W. (2014) Disentangling the patterns of geographic concentration in Tunisian manufacturing industries. Working Paper 213. Tunis: AfDB. Aykut, D. and Sayek, S. (2007) ‘The role of the sectoral composition of foreign direct investment on growth’. Washington, DC: World Bank and Bilkent University. Balassa, B. (1965) ‘Trade liberalisation and “revealed” comparative advantage’, The Manchester School 33(2): 99–123. Balchin, N., Kelsall, T., Kilama, B., Lemma, A., Mmari, D., Mendez-Parra, M., te Velde, D.W., Wangwe, S. and Worral, L. (2016) ‘Supporting the Preparation of Tanzania’s Second Five-Year Development Plan (FYDP II) 2016/17-2020/21’, ODI-SET Report, February 2016. Baldwin, J.R. and Gu, W. (2004) ‘Trade liberalization: Export-market participation, productivity growth and innovation’. Economic Analysis Research Paper 27. Ottawa: Statistics Canada. Baltabaev, B. (2013) ‘FDI and total factor productivity growth: New macro evidence’. Discussion Paper 27/12. Melbourne: Monash University, Department of Economics. Barba-Navaretti, G. and Venables, A.J. (2006) Multinational firms in the world economy. Princeton, NJ: Princeton University Press. Bartelsman, E., Haltiwanger, J. and Scarpetta, S. (2013) ‘Cross-country differences in productivity: The role of allocation and selection’, The American Economic Review 103(1): 305–34. Bellak, C. (2004) ‘How domestic and foreign firms differ and why does it matter?’ Journal of Economic Surveys 18(4): 483–514. Bijsterbosch, M. and Kolasa, M. (2009) FDI and productivity convergence in Central and Eastern Europe: An industry level investigation. Working Paper 992. Basle: ECB. Bloom, N., Draca, M. and Van Reenen, J. (2015) ‘Trade induced technical change? The impact of Chinese imports on innovation, IT and productivity’. Oxford: OUP.
MEASURING THE POTENTIAL CONTRIBUTION OF DFIS TO ECONOMIC TRANSFORMATION|
37
Borensztein, E., de Gregorio, J. and Lee, J.W. (1998) ‘How does foreign direct investment affect economic growth?’, Journal of International Economics 45(1): 115–35. Bouras, H. and Raggad, B. (2015) ‘Foreign direct investment and exports: Complementarity or substitutability, an empirical investigation’, International Journal of Economics and Financial Issues 5(4): 933–41. Brahmbatt, M., Bishop, R., Zhao, X., Lemma, A., Granoff, I., Godfrey, N. and te Velde D.W. (2016) ‘Africa’s new climate economy: Economic transformation and social and environmental change’ London and Washington, DC: New Climate Economy and ODI. Brandt, L., Jiang, F., Luo, Y. and Su, Y. (2016) ‘Ownership and productivity in vertically-integrated firms: Evidence from the Chinese steel industry’. Toronto: University of Toronto. Broersma, L. (2008) ‘Productivity-participation trade-off: Europe versus Anglo-Saxon countries’. Groningen: University of Groningen. Bruhn, N.C.P. and Calegario, C.L.L. (2014) ‘Productivity spillovers from foreign direct investment in the Brazilian processing industry’, BAR, Rio de Janeiro 11(1): 22–46. CDC (CDC Group UK) (2012) ‘Investment policy for the period from 1 January 2012 to 31 December 2016’. http://www.cdcgroup.com/Documents/Transparency%20and%20reporting/CDC%20Investment%20Policy%202012_16.pdf CDC (2013) ‘CDC Development Impact Potential Grid Summary’ at: http://www.cdcgroup.com/Documents/Operational%20Information/CDC%20Development%20Impact%20Grid%20summary_20131220.pdf CDC (2014) ‘CDC development impact potential grid summary’. http://www.cdcgroup.com/Documents/Operational%20Information/CDC%20Development%20Impact%20Grid%20summary_20131220.pdf CDC (2016) ‘What are the links between power, economic growth and job creation?’ CDC Development Impact Evaluation: Evidence Review, January 2016 CDC (2017) ‘Development impact – at the heart of our decisions’. http://www.cdcgroup.com/How-we-do-it/Investment_strategy/Investment-selection/ CDC (2017b) Annual Review 2016 at: http://www.cdcgroup.com/Documents/Annual%20Reviews/Annual%20Review%202016.pdf Chhair, C. and Newman, C. (2014) Clustering, competition and spillover effects: Evidence from Cambodia. Working Paper 2014/065. Helsinki: UNU WIDER. Contessi, S. and Weinberger, A. (2009) ‘Foreign direct investment, productivity, and country growth: An overview’, Federal Reserve Bank of St. Louis Review 91(2): 61–78. Crespo, N. and Fontoura, M.P. (2007) ‘Determinant factors of FDI spillovers – what do we really know?’ World Development 35(3): 410–25. Criscuolo, C., Timmis, J. and Johnstone, N. (2016) ‘The relationship between GVCs and productivity’. Global Forum on Productivity Background Paper. Dabla-Norris, E., Guo, S., Haksar, V., Kim, M., Kochar, K., Wiseman, K. and Zdzienicka, A. (2015) ‘The new normal: A sector-level perspective on productivity trends in advanced economies’. Staff Discussion Note, March. Washington, DC: IMF. Das, S. (1987) ‘Externalities and technology transfer through multinational corporations: A theoretical analysis’, Journal of International Economics 22(1–2): 171–82. Dasgupta, K. (2012) ‘Learning and knowledge diffusion in a global economy’, Journal of International Economics 87(2): 323–36. Damoah, K.A. (2016) ‘Trade-productivity nexus: Learning and knowledge spillovers in African manufacturing’. Trento: University of Trento.

MEASURING THE POTENTIAL CONTRIBUTION OF DFIS TO ECONOMIC TRANSFORMATION|
38
Davis, S.J., Haltiwanger, J. Handley, K., Jarmin, R., Lerner, J. and Miranda, J (2014) ‘Private equity, jobs, and productivity’, The American Economic Review 104(12): 3956–90. Del Prete, D., Giovannetti, G. and Marvani, E. (2016) ‘Global value chains participation and productivity gains for North African firms’. Rome: IMT Lucca, AXES Research Unit. Dercon, S. and Gollin, D. (2014) Agriculture in African development: A review of theories and strategies. Working Paper WPS/ 2014-22. Oxford: CSAE. Doms, M., Dunne, T. and Troske, K.R. (1997) ‘Workers, wages and technology’, The Quarterly Journal of Economics 112(1): 253–90. Driffield, N. and Du, J. (2007) ‘Privatisation, state ownership and productivity: Evidence from China’, International Journal of the Economics of Business 14(2): 215–39. Driffield, N. and Love, J.H. (2007) ‘Linking FDI motivation and host economy productivity effects: conceptual and empirical analysis’, Journal of International Business Studies 38: 460–73. Duarte, M. and Restuccia, D. (2010) ‘The role of the structural transformation in aggregate productivity’, Quarterly Journal of Economics 125(1): 129–73. Dube, H (2013) ‘The impact of debt financing on productivity of small and medium scale enterprises (SMEs): A case study of SMEs in Masvingo Urban’, International Journal of Economics, Business and Finance 1(10): 5–13. Dunne, P.J. and Masiyandima, N. (2016) Foreign firm ownership and productivity spillovers in the Southern African Development Community (SADC) region. Working Paper 595. Pretoria: ERSA Dunning, J.H. & Lundan, S.M. (2008) ‘Multinational Enterprises and the Global Economy’ Edward Elgar Publishing, January 2008 EC (European Commission) (2012) Confronting scarcity: Managing water, energy and land for inclusive and sustainable growth. 2011/2012 European Report on Development. Brussels: EC. EDFI (2017) ‘EDFI Facts & Figures 2017’ at: https://www.edfi.eu/members/facts-figures/ EORA (2018) EORA Database at: http://www.worldmrio.com/ European DFIs (2016) ‘EDFI flagship report 2016’. Brussels: EFDI. Farole, T. and Winkler, D. (2014) Making foreign direct investment work for sub-Saharan Africa. Washington, DC: World Bank. Findlay, R. (1978) ‘Relative backwardness, direct foreign investment and the transfer of technology: A simple dynamic model’, The Quarterly Journal of Economics 42(1): 1–16. Fosfuri, A. Motta, M. and Rondee, T. (2001) ‘Foreign direct investment and spillovers through workers’ mobility’, Journal of International Economics 54(1): 205–22. Fu, X. (2008) ‘foreign direct investment, absorptive capacity and regional innovation capabilities: Evidence from China’, Oxford Development Studies 36(1): 89–110. Fujita, M. Krugman, P.R. & Venables, A.J. (1999) The spatial economy: Cities, regions, and international trade. Cambridge: MIT Press. Gersl, A., Rubene, I. and Zumer, T. (2007) ‘Foreign direct investment and productivity spillovers in the Central and Eastern European countries’. Proceedings of OeNB Workshops 12, March. Gerschewski, S. (2013) ‘Do local firms benefit from foreign direct investment? An analysis of spillover effects in developing countries’, Asian Social Science 9(4). Girma, S., Gong, Y., Gorg, H. and Lancheros, S. (2014) Estimating direct and indirect effects of foreign direct investment on firm productivity in the presence of interactions between firms. Kiel Working Papers 1961. Glaeser, E.L. and Mare, D.C. (2001) ‘Cities and skills’, Journal of Labor Economics 19(2): 316–42.

MEASURING THE POTENTIAL CONTRIBUTION OF DFIS TO ECONOMIC TRANSFORMATION|
39
Gleason, K.C., Mathur, L.K. & Mathur, I. (2000) ‘The interrelationship between culture, capital structure, and performance: Evidence from European retailers’, Journal of Business Research 50(2): 185–91. Gollin, D., Lagakos, D. and Waugh, M.E. (2014) ‘Agricultural productivity differences across countries’, The American Economic Review 104(5): 165–70. Granoff, I., Nassiry, D., Bird, N., Humphrey, C., Carter, P., Lemma, A. and Prizzon, A. (2017) ‘Six development finance proposals to expand climate investments’. Policy Brief. London: ODI. Griffith, R., Redding, S. and Van Reenen, J. (2000) ‘Mapping the two faces of R&D: Productivity growth in a panel of OECD industries’. Discussion Paper. London: CEPR. Hartmann, D. Guevara, M, R. Jara-Figueroa, C. Aristaran, M. & Hidalgo, C, A. (2017) ‘Linking Economic Complexity, Institutions, and Income Inequality’ World Development Vol. 93, pp. 75-93, 2017 Haskel, J.E., Pereira, S.C. and Slaughter, M.J. (2002) Does inward foreign direct investment boost the productivity of domestic firms?’ Working Paper 8724. Cambridge, MA: NBER. Hausmann, R., Rodrik, D. and Velasco, A. (2005) Growth diagnostics. Cambridge, MA: John F. Kennedy School of Government, Harvard University. Hausmann, R., Hidalgo, C.A., Bustos, S., Coscia, M., Chung, S., Jimenez, J., Simoes, A. and Yildirim, M.A. (2014) ‘The atlas of economic complexity: Mapping paths to prosperity’. Cambridge, MA: Harvard University and MIT. Helpman, E., Meltiz, M.J. and Yeaple, S.R. (2004) ‘Export versus FDI with heterogenous firms,’ The American Economic Review 94(1): 300–16. Hidalgo, C. A. Klinger, B. Barabasi, A, L. & Hausmann, R. (2007) ‘The Product Space Conditions the Development of Nations’ Science, Vol. 317, July 2007 Hsieh, C.T and Klenow, P.J (2009) ‘Misallocation and Manufacturing TFP in China and India’ The Quarterly Journal of Economics, Vol. 124, Issue. 4, November 2009 Howard, E. Newman, C. Rand, J. and Tarp, F. (2014) Productivity-enhancing manufacturing clusters: Evidence from Vietnam. Learning to Compete, Working Paper 14. Helsinki: UNU WIDER. IATI (2017) ‘International Aid Transparency Initiative Registry’ at: https://www.iatiregistry.org/ IFC (2011) ‘IFC DOTS’ at: http://www.ifc.org/wps/wcm/connect/b72fa3004c79d6b89c7ebdd4c83f5107/DOTS+Indicators.pdf?MOD=AJPERES IFC (International Finance Corporation) (2016) ‘Annual Report 2016’ at: http://www.ifc.org/wps/wcm/connect/corp_ext_content/ifc_external_corporate_site/annual+report/2016+online+report/printed+version IFC (2017a) ‘Development impact’ at: http://www.ifc.org/wps/wcm/connect/Topics_Ext_Content/IFC_External_Corporate_Site/Development+Impact IFC (2017b) ‘IFC Strategy and Business Outlook FY18-FY20’. Washington, DC: IFC. ILO (2018) ‘ILOStat’ at: http://www.ilo.org/ilostat/faces/ilostat-home/home?_adf.ctrl-state=zfctzdjbs_4&_afrLoop=167552481294549#! IMF (2017) The Diversification Toolkit: Export Diversification and Quality Database at: https://www.imf.org/external/np/res/dfidimf/diversification.htm Imbs, J. and Wacziarg, R. (2003) ‘Stages of diversification’, The American Economic Review 93(1): 63–86. ITC (2018) ‘ITC TradeMap’ at: http://www.trademap.org/

MEASURING THE POTENTIAL CONTRIBUTION OF DFIS TO ECONOMIC TRANSFORMATION|
40
Javorcik, B. (2004) ‘Does foreign direct investment increase the productivity of domestic firms? In search of spillovers through backwards linkages’, The American Economic Review 94(3): 605–27. Javorcik, B. (2008) ‘Can survey evidence shed light on spillovers from foreign direct investment?’ The World Bank Research Observer 23(2): 139–59. Jouanjean, M. and te Velde, D.W. (2013) The role of development finance institutions in promoting jobs and structural transformation: a quantitative assessment. Working Paper 377. London: ODI. Jouanjean, M., Massa, I. and te Velde, D.W. (2013) ‘The role of development finance institutions in promoting jobs and structural transformation’. Project Summary. London: ODI. Kapstein, E.B., Kim, R. and Eggeling, H. (2012) ‘Modeling the socio-economic impact of potential IFC investments in Tunisia’. Washington, DC: USAID. Keller, W. (2004) ‘International technology diffusion’, Journal of Economic Literature Vol. 42: 752–82. Keller, W. and Yeaple, S. (2008) Global production and trade in the knowledge economy. Working Paper. Cambridge, MA: NBER. Kimura, F. and Kiyota, K. (2006) ‘Exports, FDI and productivity: Dynamic evidence from Japanese firms’, Review of World Economics 142(4): 619–715. Kokko, A. (1996) ‘Productivity spillovers from competition between local firms and foreign affiliates’, Journal of International Development 8(4): 517–30. Kowalski, P and Buge, M (2013) ‘Assessing the Trade Related Sources of Productivity Growth in Emerging Economies’ OECD Trade Policy Papers, No. 158, OECD Kuznets, S. (1973) ‘Modern economic growth: Findings and reflections’, The American Economic Review 63(3): 247–58. Kuznets, S.S. and Murphy, J.T. (1966) Modern economic growth: Rate, structure, and spread. Vol. 2. New Haven, CT: Yale University Press. Levine, O. and Warusawitharana, M. (2014) ‘Finance and productivity growth: Firm-level evidence’. Finance and Economics Discussion Series Divisions of Research & Statistics and Monetary Affairs Federal Reserve Board, Washington, DC. Leung, D. Meh, C and Terajima, Y (2008) ‘Firm Size and Productivity’ Bank of Canada Working Paper 2008-45, November 2008 Lewis, A.W. (1955) The theory of economic growth. Homewood, IL: Richard D. Irwin. Lenaerts, K. and Merlevede, B. (2015) ‘Firm size and spillover effects from foreign direct investment: the case of Romania’, Small Bus Econ 45. Li, X. and Liu, X. (2005) ‘Foreign direct investment and economic growth: An increasingly endogenous relationship’, World Development 33(3): 393–407. Liu, Z. (2008) ‘Foreign direct investment and technology spillovers: Theory and evidence’, Journal of Development Economics 85: 176–93. Mallick, S. and Yang, Y. (2011) ‘Sources of financing, profitability and productivity: First evidence from matched firms’, New York: New York University Salomon Center and Wiley Periodicals, Inc. Mankiw, N.G., Romer, D. and Weil, D.N. (1992) ‘A contribution to the empirics of economic growth’, The Quarterly Journal of Economics 107(2): 407–37. Massa, I., Mendez-Parra, M. and te Velde, D.W. (2016) ‘The macroeconomic effects of development finance institutions in sub-Saharan Africa’. London: ODI. McGillivray, A., Kim, R., van Moorsel, T. and Kehoe, A. (2017) ‘Measuring total employment effects: A lean data methodology for a portfolio of investments in developing countries’. London: CDC. McMillan, M. and Harttgen, K. (2014a) ‘Africa’s quiet revolution’, in C. Monga and J.Y. Lin (eds) (2015) The Oxford handbook of Africa and economics. Oxford: OUP.

MEASURING THE POTENTIAL CONTRIBUTION OF DFIS TO ECONOMIC TRANSFORMATION|
41
McMillan, M. and Harttgen, K. (2014b) What is driving the African growth miracle? Working Paper 209. Tunis: AfDB. McMillan, M. and Rodrik, D. (2011) Globalisation, structural change and productivity growth. Working Paper 17143. Cambridge, MA: NBER. McMillan, M. Rodrik, D. and Verduzco, I. (2014) ‘Globalisation, structural change and productivity growth with an update on Africa’, World Development 63: 11–32. McMillan, M., Page, J., Booth, D. and te Velde, D.W. (2017) ‘Supporting economic transformation: An approach paper’. London: ODI, SET. Mdee, A., Emmott, R. and Lemma, A. (2016) ‘Compatible or contradictory? The challenge of inclusive structural economic and environmental transformation’. Challenge Paper. London: CPAN. Melitz, M.J (2003) ‘The impact of trade on intra-industry reallocations and aggregate industry productivity’, Econometrica 71(6): 1695–1725. Mendez-Parra, M. (2015) ‘Using a social accounting matrix to calculate output and employment effects in Tanzania’. Working Paper. London: ODI SET. MIT (2018) ‘Atlas of Economic Complexity’ at: http://atlas.media.mit.edu/en/rankings/hs92/?depth=6 Montalbano, P., Nenci, S. and Pietrobelli, C. (2014) International linkages, value added trade and LAC firms’ productivity. Working Paper 198. Rome: University of Roma Tre. Myers, S.C. and Majluf, N.S. (1984) Corporate financing and investment decisions when firms have information the investors do not have. Working Paper 1396. Cambridge, MA: NBER. Nickell, S. and van Reenen, J. (2001) ‘Technological innovation and economic performance in the United Kingdom’. London: LSE, CEP. Nucci, F., Pozzolo, A.F. and Schivardi, F. (2005) ‘Is firm’s productivity related to its financial structure? Evidence from microeconomic data’. Universita’ La Sapienza, Universita’ del Molise & Banca D’Italia. OECD (Organisation for Economic Co-operation and Development) (2013) Entrepreneurship at a glance 2013. Paris: OECD. Osei-Assibey, E. (2010) ‘Does source of finance matter for microenterprise productivity growth in Ghana?’ Nagoya: Graduate School of International Development, Nagoya University. Parteka, A. (2013) The role of trade in intra-industry productivity growth – the case of old and new European Union Countries (1995-2007). Working Paper 1/ 2013 (1). Gdansk: GUT Faculty of Management and Economics. Rodrik, D. (2013a) The past, present and future of economic growth. Working Paper 1. London: Global Citizen Foundation. Rodrik, D. (2013b) ‘Unconditional convergence in manufacturing’, The Quarterly Journal of Economics 128(1): 165–204. Romer, P.M. (1994) ‘The origins of endogenous growth’, The Journal of Economic Perspectives 8(1): 3–22. Rosenthal, S.S. and Strange, W.C. (2003) ‘Evidence on the nature and sources of agglomeration economies’, in Handbook of Urban and Regional Economics Vol. 4. Amsterdam: Elsevier. Saliola, F. and Seker, M. (2011) ‘Total factor productivity across the developing world’. World Bank Enterprise Surveys Enterprise Note Series Note 23. Washington, DC: World Bank. Saidi, Y., Haousa, A. and Ochi, A. (2014) ‘Foreign direct investment, complementarities, and economic growth: The case of MENA economies’, Journal of Research in Economics and International Finance 3(3): 1971–2011.

MEASURING THE POTENTIAL CONTRIBUTION OF DFIS TO ECONOMIC TRANSFORMATION|
42
Sanchez-Sellero, P., Rosell-Martinez, J. and Garcia-Vazquez, J.M. (2013) ‘Innovation as a driver of absorptive capacity from foreign direct investment in Spanish manufacturing firms’, Procedia – Social and Behavioural Sciences 75. SET (2018) ‘Supporting Economic Transformation Data’ at: www.set.odi.org Sheng, S. and Svenningsson, K. (2014) ‘The effect of private equity ownership on firm level productivity’. Stockholm: Stockholm School of Economics. Siba, E., Mans, S., Arne, B. and Mulu, G. (2012) Enterprise agglomeration, output prices and physical productivity: Firm-level evidence from Ethiopia. Working Paper 2012/85. Helsinki: UNU WIDER. Tomiura, E. (2006) ‘Foreign outsourcing, exporting, and FDI: A productivity comparison at the firm level’. Yokohama: Department of Economics, Yokohama National University. Turnbull, C., Sun, S. and Anwar, S. (2016) ‘Trade liberalisation, inward FDI and productivity within Australia’s manufacturing sector’, Economic Analysis and Policy 50: 41–50. UN COMTRADE (2018) ‘UN COMTRADE Database’ at: https://comtrade.un.org/ UNCTAD (UN Conference on Trade and Development) (2014) The least developed countries report 2014. Geneva: UNCTAD. UNIDO (UN Industrial Development Organization) (2006) Foreign direct investment and productivity: Evidence from East Asian economies. Staff Working Paper 03/2006. Vienna: UNIDO Research and Statistics Branch. UNIDO (2008) Has foreign direct investment led to higher productivity in sub-Saharan Africa?’ Staff Working Paper 08/2008. Vienna: UNIDO Research and Statistics Branch. Uttama, P. and Peridy, N. (2010) ‘Foreign direct investment and productivity spillovers: The experience of ASEAN countries’, Journal of Economic Integration 25(2): 298–323. Wagner, J. (2005) ‘Exports, foreign direct investment, and productivity: Evidence from German firm level data’. Discussion Paper 318. Hamburg: HWWA. Walsh, J.P. and Yu, J. (2010) Determinants of foreign direct investment: A sectoral and institutional approach. Working Paper WP/10/187. Washington, DC: IMF. Wang, Y. (2010) ‘FDI and productivity growth: The role of inter-industry linkages’, Canadian Journal of Economics 43(4): 1243–72. WEF (2017) ‘Global Competitiveness Report 2016-2017’ at: https://www.weforum.org/reports/the-global-competitiveness-report-2016-2017-1 WEF (2018) ‘Global Competitiveness Report 2017-2018’ at: https://www.weforum.org/reports/the-global-competitiveness-report-2017-2018 Woo, J. (2009) ‘Productivity growth and technological diffusion through foreign direct investment’, Economic Inquiry 46(2). World Bank (2017) ‘World Development Indicators’ at: http://data.worldbank.org/data-catalog/world-development-indicators World Bank (2018a) ‘Enterprise Survey Database’ at: http://www.enterprisesurveys.org/ World Bank (2018b) ‘Doing Business Database’ at: http://www.doingbusiness.org/rankings World Bank (2018c) ‘World Development Indicators’ at: https://data.worldbank.org/products/wdi World Bank WITS (2018) at: wits.worldbank.org/CountryProfile/en/Country/ALL/startyear/2009/endyear/2013/tradeFlow/Export/indicator/RCA/partner/WLD/product/Total
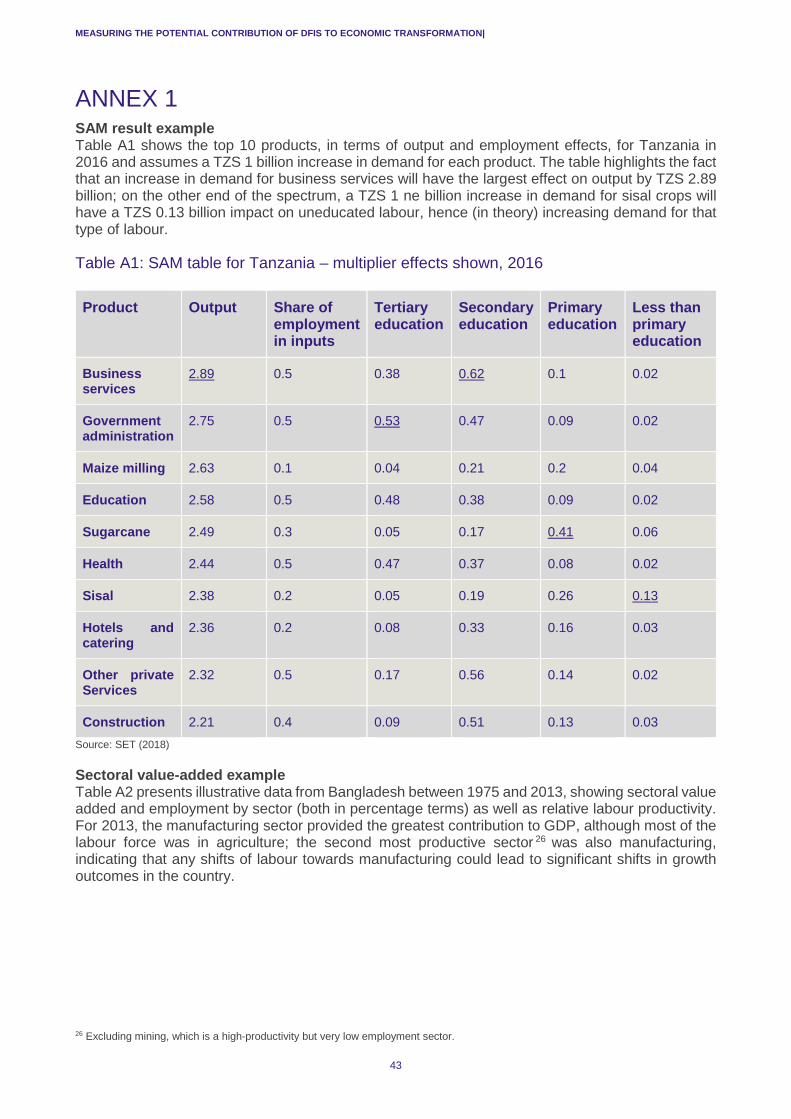
MEASURING THE POTENTIAL CONTRIBUTION OF DFIS TO ECONOMIC TRANSFORMATION|
43
ANNEX 1 SAM result example Table A1 shows the top 10 products, in terms of output and employment effects, for Tanzania in 2016 and assumes a TZS 1 billion increase in demand for each product. The table highlights the fact that an increase in demand for business services will have the largest effect on output by TZS 2.89 billion; on the other end of the spectrum, a TZS 1 ne billion increase in demand for sisal crops will have a TZS 0.13 billion impact on uneducated labour, hence (in theory) increasing demand for that type of labour.
Table A1: SAM table for Tanzania – multiplier effects shown, 2016 Product Output Share of
employment in inputs
Tertiary education
Secondary education
Primary education
Less than primary education
Business services
2.89 0.5 0.38 0.62 0.1 0.02
Government administration
2.75 0.5 0.53 0.47 0.09 0.02
Maize milling 2.63 0.1 0.04 0.21 0.2 0.04
Education 2.58 0.5 0.48 0.38 0.09 0.02
Sugarcane 2.49 0.3 0.05 0.17 0.41 0.06
Health 2.44 0.5 0.47 0.37 0.08 0.02
Sisal 2.38 0.2 0.05 0.19 0.26 0.13
Hotels and catering
2.36 0.2 0.08 0.33 0.16 0.03
Other private Services
2.32 0.5 0.17 0.56 0.14 0.02
Construction 2.21 0.4 0.09 0.51 0.13 0.03 Source: SET (2018)
Sectoral value-added example Table A2 presents illustrative data from Bangladesh between 1975 and 2013, showing sectoral value added and employment by sector (both in percentage terms) as well as relative labour productivity. For 2013, the manufacturing sector provided the greatest contribution to GDP, although most of the labour force was in agriculture; the second most productive sector 26 was also manufacturing, indicating that any shifts of labour towards manufacturing could lead to significant shifts in growth outcomes in the country.
26 Excluding mining, which is a high-productivity but very low employment sector.

44
Table A2: Sectoral value added, employment and labour productivity, Bangladesh, 1975–2013 Economic activity Gross value added (current US$, %) Employment by sector (%) Relative productivity levels a
1975
1991
2000
2005
2010
2013
1975
1991
2000
2005
2010
2013
1975
1991
2000
2005
2010
2013
Agriculture 51.2 29.5 24.4 19.3 17.8 16.3 n/a 61.1 59.5 48.1 47.3 44.1 n/a 0.4 0.4 0.4 0.4 0.4
Mining and utilities 0.3 2.5 2.8 3.0 2.8 3.1 n/a 0.7 0.9 0.3 0.4 0.4 n/a 3.3 3.1 9.9 7.0 7.2
Manufacturing 10.9 12.6 14.3 15.6 16.9 17.3 n/a 10.9 7.0 11.0 12.4 12.2 n/a 1.1 2.1 1.4 1.4 1.6
Construction 2.7 4.6 6.0 6.4 6.5 7.2 n/a 0.9 2.0 3.2 4.8 5.5 n/a 4.6 2.8 2.0 1.4 1.3
Wholesale, retail, hotels 13.6 12.3 12.7 14.1 14.9 14.5 n/a 12.6 14.1 16.5 15.4 16.3 n/a 1.0 0.9 0.9 0.9 0.9
Transport, storage, communications
6.2 9.4 8.5 10.6 10.6 10.9 n/a 2.9 4.6 8.4 7.4 8.1 n/a 3.3 2.1 1.3 1.5 1.4
Other 15.2 29.1 31.3 31.1 30.6 30.7 n/a 11.0 12.0 12.6 12.3 13.3 n/a 3.1 2.7 2.5 2.4 2.1
Total 100 100 100 100 100 100 n/a 100 100 100 100 100 n/a 1.0 1.0 1.0 1.0 1.0 Source: SET (2018)
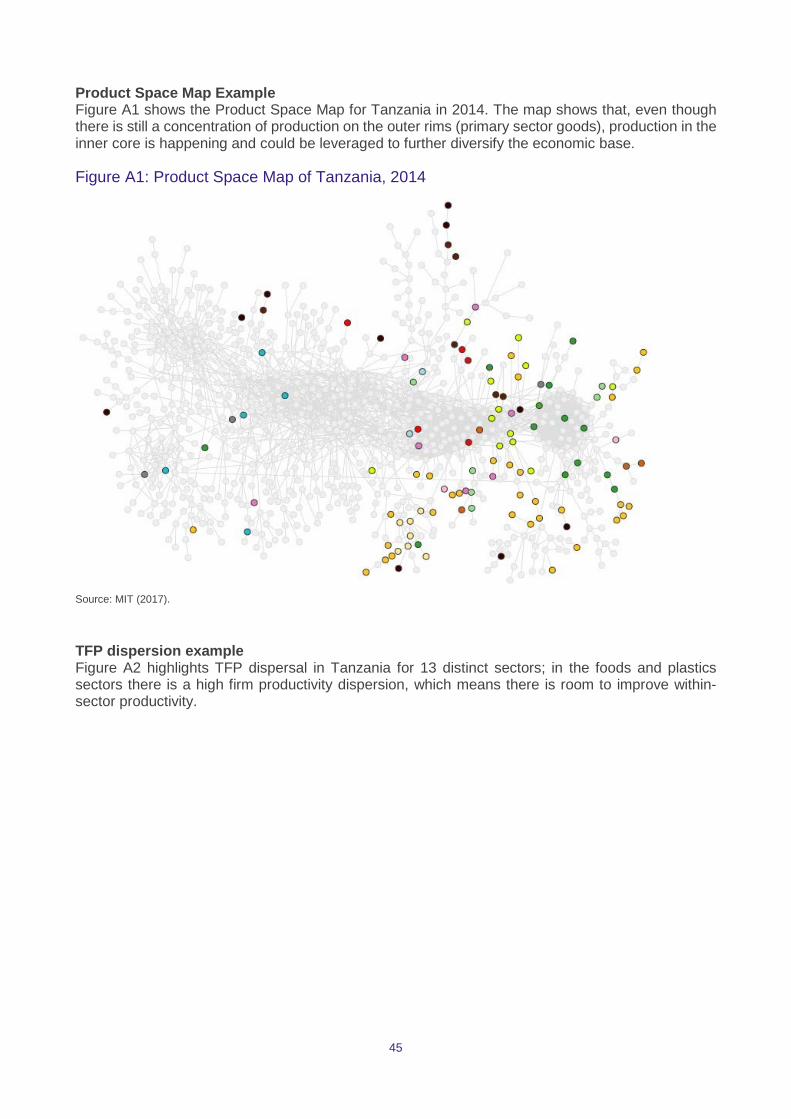
45
Product Space Map Example Figure A1 shows the Product Space Map for Tanzania in 2014. The map shows that, even though there is still a concentration of production on the outer rims (primary sector goods), production in the inner core is happening and could be leveraged to further diversify the economic base.
Figure A1: Product Space Map of Tanzania, 2014
Source: MIT (2017).
TFP dispersion example Figure A2 highlights TFP dispersal in Tanzania for 13 distinct sectors; in the foods and plastics sectors there is a high firm productivity dispersion, which means there is room to improve within-sector productivity.

MEASURING THE POTENTIAL CONTRIBUTION OF DFIS TO ECONOMIC TRANSFORMATION|
46
Figure A2: TFP dispersal by sector, Tanzania, 2013
Source: SET (2018)
Domestic value-added example Table A3 provides an example of domestic value addition for Ethiopia between 1996 and 2011, highlighting industrial sectors (such as metal products) where Ethiopia has limited domestic value added and where improvements in the sector could help it accrue a greater proportion of the value of final products.
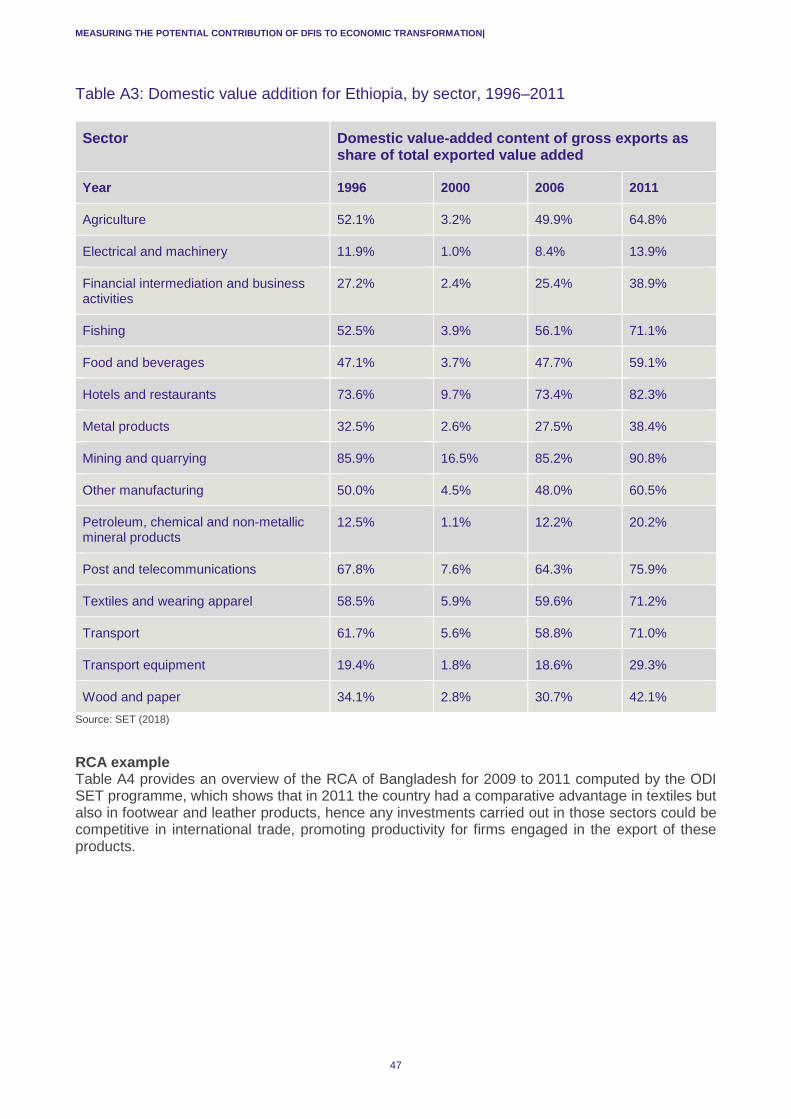
MEASURING THE POTENTIAL CONTRIBUTION OF DFIS TO ECONOMIC TRANSFORMATION|
47
Table A3: Domestic value addition for Ethiopia, by sector, 1996–2011 Sector Domestic value-added content of gross exports as
share of total exported value added
Year 1996 2000 2006 2011
Agriculture 52.1% 3.2% 49.9% 64.8%
Electrical and machinery 11.9% 1.0% 8.4% 13.9%
Financial intermediation and business activities
27.2% 2.4% 25.4% 38.9%
Fishing 52.5% 3.9% 56.1% 71.1%
Food and beverages 47.1% 3.7% 47.7% 59.1%
Hotels and restaurants 73.6% 9.7% 73.4% 82.3%
Metal products 32.5% 2.6% 27.5% 38.4%
Mining and quarrying 85.9% 16.5% 85.2% 90.8%
Other manufacturing 50.0% 4.5% 48.0% 60.5%
Petroleum, chemical and non-metallic mineral products
12.5% 1.1% 12.2% 20.2%
Post and telecommunications 67.8% 7.6% 64.3% 75.9%
Textiles and wearing apparel 58.5% 5.9% 59.6% 71.2%
Transport 61.7% 5.6% 58.8% 71.0%
Transport equipment 19.4% 1.8% 18.6% 29.3%
Wood and paper 34.1% 2.8% 30.7% 42.1% Source: SET (2018)
RCA example Table A4 provides an overview of the RCA of Bangladesh for 2009 to 2011 computed by the ODI SET programme, which shows that in 2011 the country had a comparative advantage in textiles but also in footwear and leather products, hence any investments carried out in those sectors could be competitive in international trade, promoting productivity for firms engaged in the export of these products.

MEASURING THE POTENTIAL CONTRIBUTION OF DFIS TO ECONOMIC TRANSFORMATION|
48
Table A4: RCA for Bangladesh, 2009–2011 HS Section
Product label 2009 2010 2011
Total in HS 1-97 1.00 1.00 1.00
1 Live animals; animal products 1.22 1.44 1.35
2 Vegetable products 0.27 0.31 0.31
3 Animal or vegetable fats and oils and their cleavage products; prepared edible fats; animal or vegetable waxes
0.08 0.06 0.04
4 Prepared foodstuffs; beverages, spirits and vinegar; tobacco and manufactured tobacco substitutes
0.17
0.20
0.19
5 Mineral products 0.11 0.12 0.07
6 Products of the chemical or allied industries 0.08 0.05 0.05
7 Plastics and articles thereof; rubber and articles thereof 0.08 0.08 0.09
8 Raw hides and skins, leather, furskins and articles thereof; saddlery and harness; travel goods, handbags and similar containers; articles of animal gut (other than silk-worm gut)
2.29
2.71
2.72
9 Wood and articles of wood; wood charcoal; cork and articles of cork; manufactures of straw, of esparto or of other plaiting materials; basketware and wickerwork
0.04
0.04
0.03
10 Pulp of wood or of other fibrous cellulosic material; recovered (waste and scrap) paper or paperboard; paper and paperboard and articles thereof
0.09
0.07
0.07
11 Textiles and textile articles 18.94 20.03 20.36
12 Footwear, headgear, umbrellas, sun umbrellas, walking-sticks, seat-sticks, whips, riding-crops and parts thereof; prepared feathers and articles made therewith; artificial flowers; articles of human hair
1.95
2.09
2.17
13 Articles of stone, plaster, cement, asbestos, mica or similar materials; ceramic products; glass and glassware
0.19
0.17
0.15
14 Natural or cultured pearls, precious or semi-precious stones, precious metals, metals clad with precious metal and articles thereof; imitation jewellery; coin thereof; imitation jewellery; coin
0.00
0.00
0.00
15 Base metals and articles of base metal 0.08 0.09 0.07
16 Machinery and mechanical appliances; electrical equipment; parts thereof; sound recorders and reproducers, television image and sound recorders and reproducers, and parts and accessories of such articles
0.01
0.02
0.02
17 Vehicles, aircraft, vessels and associated transport equipment 0.12 0.09 0.07

MEASURING THE POTENTIAL CONTRIBUTION OF DFIS TO ECONOMIC TRANSFORMATION|
49
18 Optical, photographic, cinematographic, measuring, checking, precision, medical or surgical instruments and apparatus; clocks and watches; musical instruments; parts and accessories thereof
0.02
0.04
0.04
19 Arms and ammunition; parts and accessories thereof 0.01 0.01 0.14
20 Miscellaneous manufactured articles 0.10 0.11 0.10
21 Works of art, collectors’ pieces and antiques 0.01 0.01 0.01 Source: SET (2018)