Embed Size (px)
Citation preview
Measuring the Economic Impact of PLEI
Research and Statistics Division Susan McDonald
PLEAC, October 2012

The Department of Justice as Funder
• The Department provides annual funding in each province to 1 organization whose designation is recommended by the province.
• In the Yukon, Northwest Territory and Nunavut, PLEI is funded through the Access to Justice Agreements between the respective governments and the Department.
• The Department also provides PLEI project funding to non-governmental organizations from: The Justice Partnership and Innovation Program; the Victims Fund; the Family Violence Initiative; the Youth Justice Fund; the Supporting Families Fund; the Aboriginal Justice Strategy Fund; and the Access to Justice in Both Official Languages Support Fund.
2
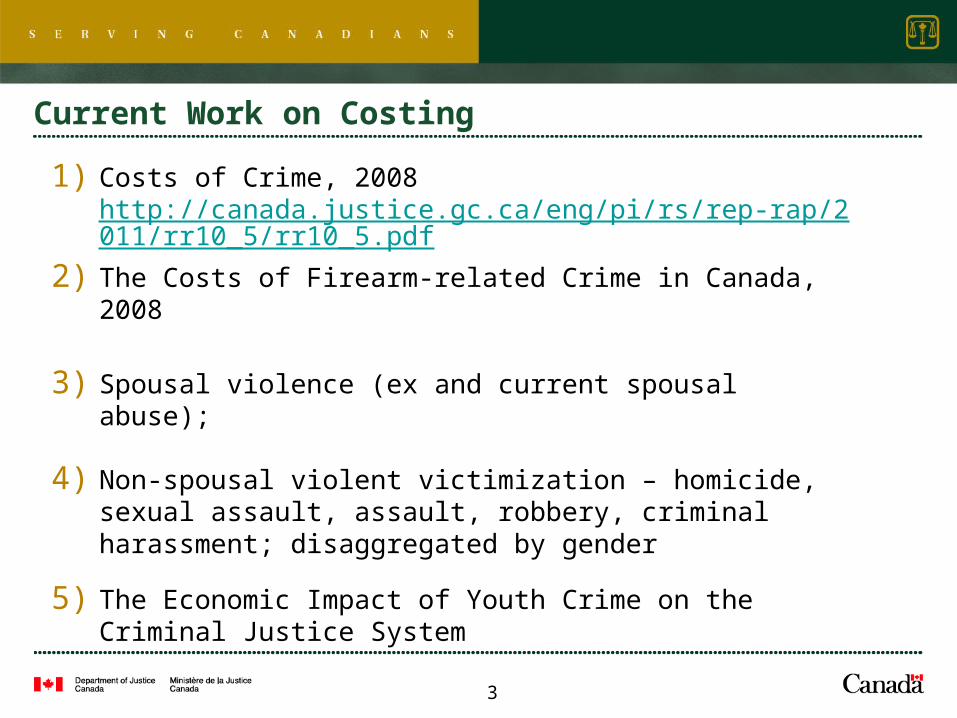
Current Work on Costing
1) Costs of Crime, 2008 http://canada.justice.gc.ca/eng/pi/rs/rep-rap/2011/rr10_5/rr10_5.pdf
2) The Costs of Firearm-related Crime in Canada, 2008
3) Spousal violence (ex and current spousal abuse);
4) Non-spousal violent victimization – homicide, sexual assault, assault, robbery, criminal harassment; disaggregated by gender
5) The Economic Impact of Youth Crime on the Criminal Justice System
3
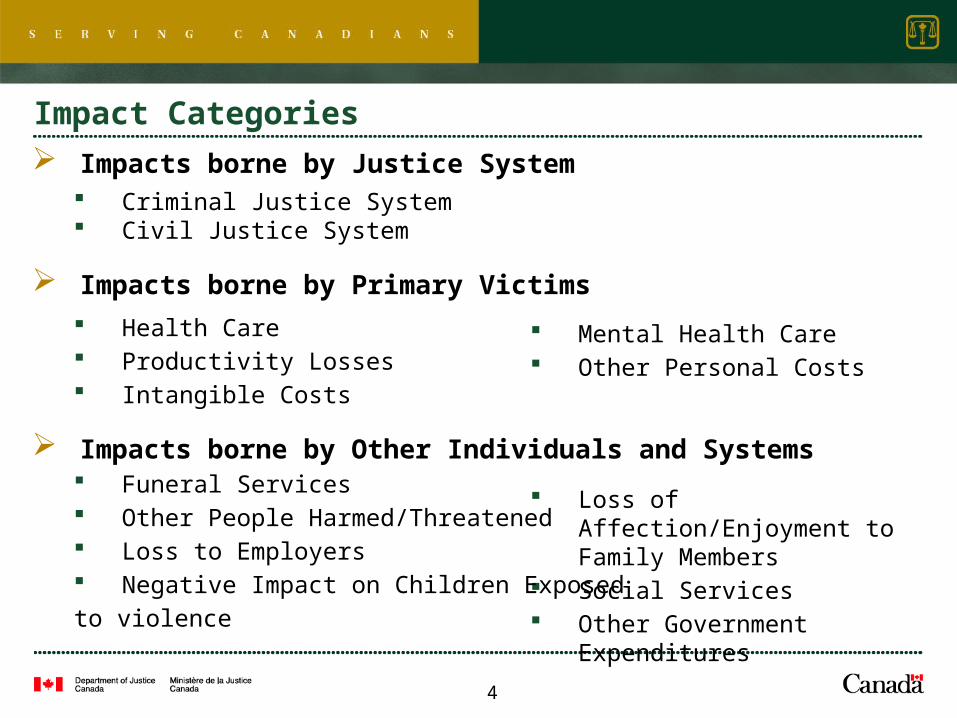
Impact Categories
Mental Health Care Other Personal Costs
Loss of Affection/Enjoyment to Family Members
Social Services Other Government Expenditures
4
Impacts borne by Justice System Criminal Justice System Civil Justice System
Impacts borne by Primary Victims
Health Care Productivity Losses Intangible Costs
Impacts borne by Other Individuals and Systems Funeral Services Other People Harmed/Threatened Loss to Employers Negative Impact on Children Exposed
to violence
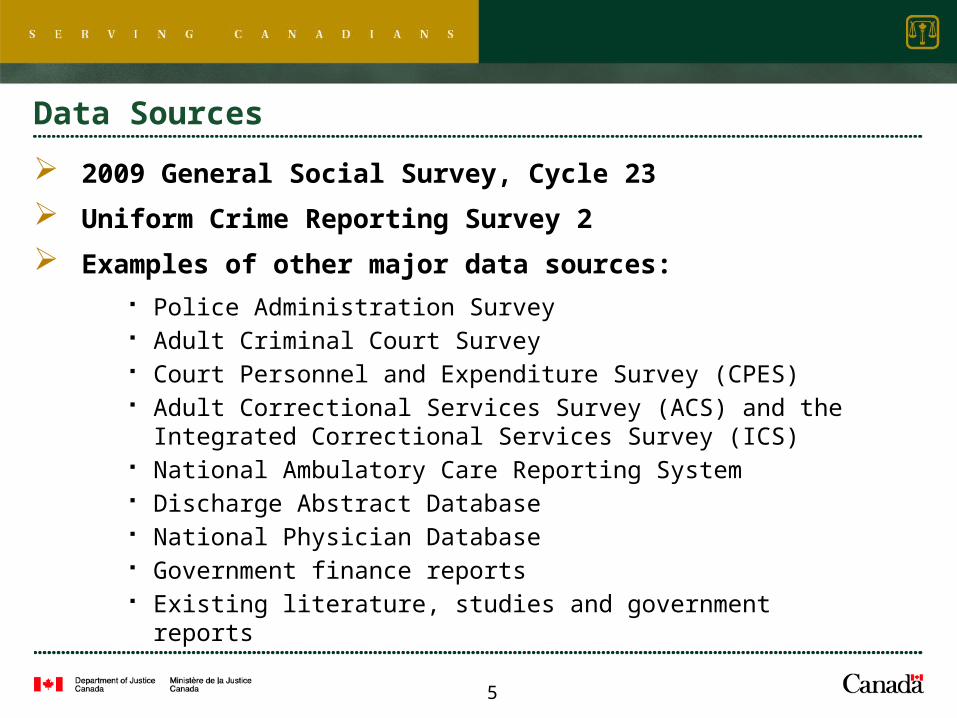
Data Sources
2009 General Social Survey, Cycle 23
Uniform Crime Reporting Survey 2
Examples of other major data sources: Police Administration Survey Adult Criminal Court Survey Court Personnel and Expenditure Survey (CPES) Adult Correctional Services Survey (ACS) and the Integrated
Correctional Services Survey (ICS) National Ambulatory Care Reporting System Discharge Abstract Database National Physician Database Government finance reports Existing literature, studies and government reports
5
Key Challenges
Lack of data/information
Lack of access to data
Limitations of the General Social Survey
Limitations of small, non-representative studies
6
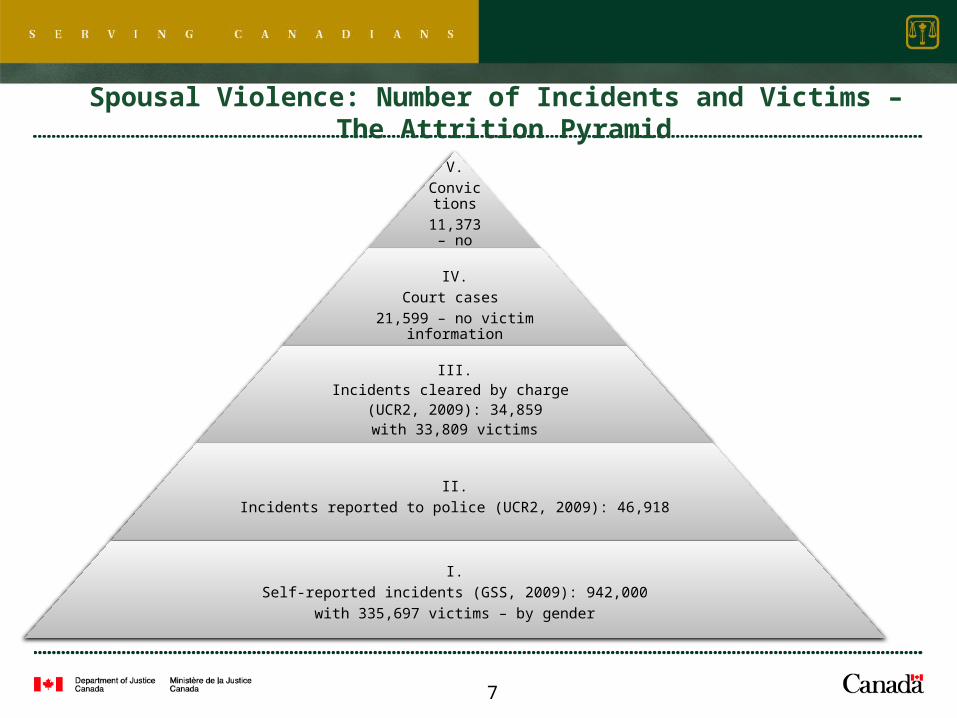
Spousal Violence: Number of Incidents and Victims – The Attrition Pyramid
7
V.Convictions
11,373 – no victim information
IV.Court cases
21,599 – no victim information
III.Incidents cleared by charge
(UCR2, 2009): 34,859with 33,809 victims
II.Incidents reported to police (UCR2, 2009): 46,918
I.Self-reported incidents (GSS, 2009): 942,000
with 335,697 victims – by gender
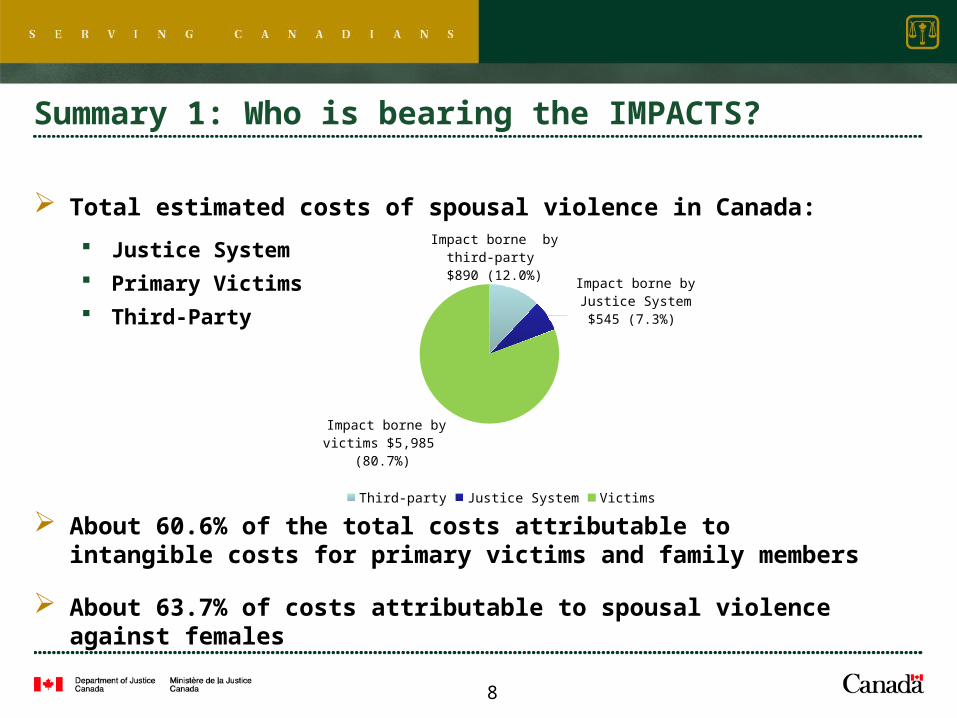
Summary 1: Who is bearing the IMPACTS?
Total estimated costs of spousal violence in Canada:
Justice System
Primary Victims
Third-Party
About 60.6% of the total costs attributable to intangible costs for primary victims and family members
About 63.7% of costs attributable to spousal violence against females
8
Impact borne by third-party
$890 (12.0%) Impact borne by
Justice System$545 (7.3%)
Impact borne by victims $5,985
(80.7%)
Third-party Justice System Victims
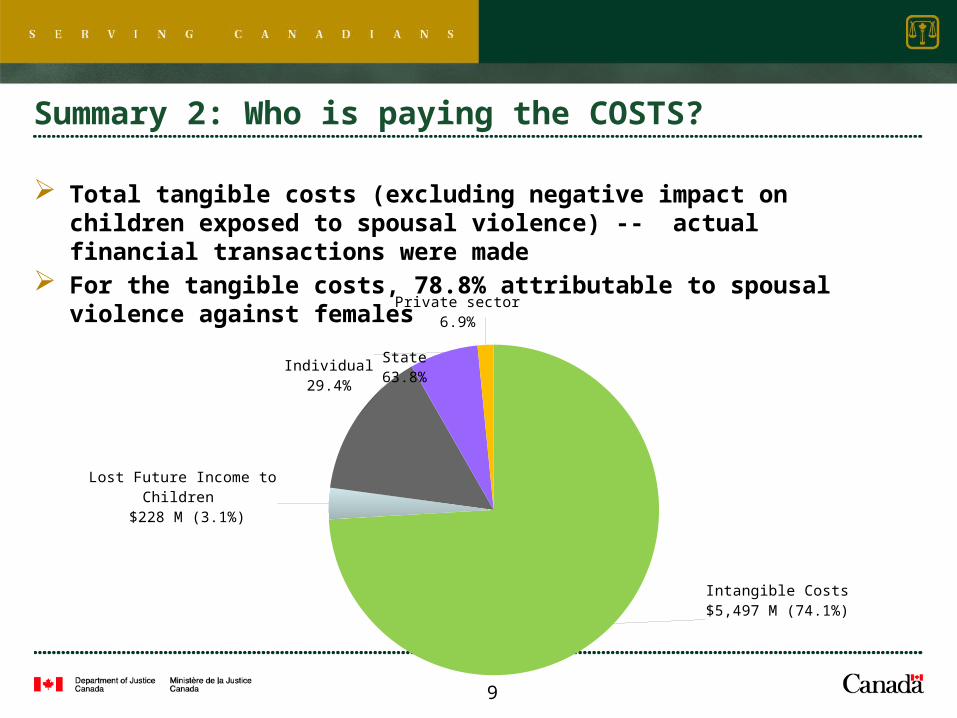
Summary 2: Who is paying the COSTS?
Total tangible costs (excluding negative impact on children exposed to spousal violence) -- actual financial transactions were made
For the tangible costs, 78.8% attributable to spousal violence against females
9
Intangible Costs$5,497 M (74.1%)
Lost Future Income to Children
$228 M (3.1%)
State63.8%
Individual29.4%
Private sector6.9%
ANNUAL CRIMINAL JUSTICE ISSUEEXCLUSIVE RATINGS
Over 200 Crime–Related Programs and Policies
Programs
programs
taxpayer dollars
that reduce crime and save taxpayers money.
programs
BEST 2011Crime
Policies to Adopt
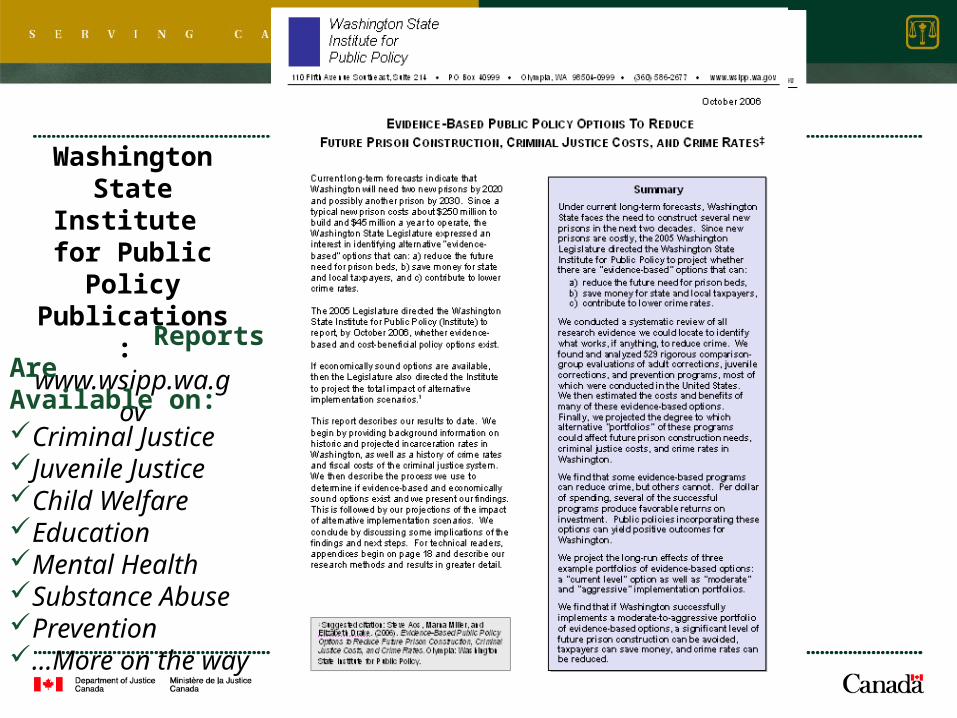
SWashington State
Institute for Public PolicyPublications:
www.wsipp.wa.gov
Reports Are Available on:
Criminal JusticeJuvenile JusticeChild WelfareEducationMental HealthSubstance AbusePrevention…More on the way
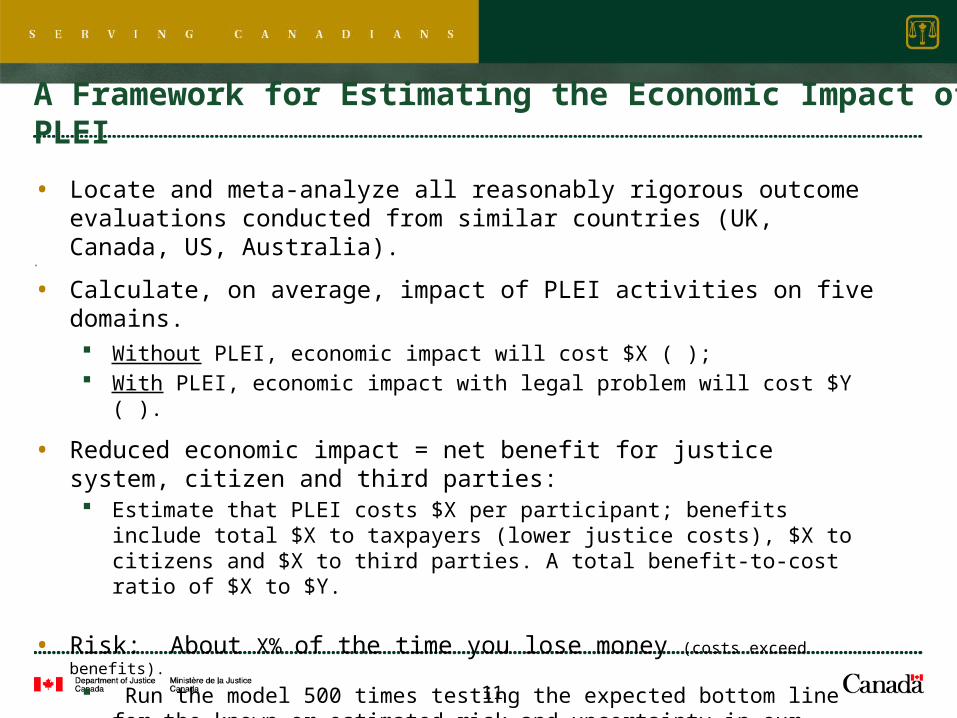
A Framework for Estimating the Economic Impact of PLEI
• Locate and meta-analyze all reasonably rigorous outcome evaluations conducted from similar countries (UK, Canada, US, Australia).
•
• Calculate, on average, impact of PLEI activities on five domains. Without PLEI, economic impact will cost $X ( ); With PLEI, economic impact with legal problem will cost $Y ( ).
• Reduced economic impact = net benefit for justice system, citizen and third parties: Estimate that PLEI costs $X per participant; benefits include total $X to
taxpayers (lower justice costs), $X to citizens and $X to third parties. A total benefit-to-cost ratio of $X to $Y.
• Risk: About X% of the time you lose money (costs exceed benefits).
Run the model 500 times testing the expected bottom line for the known or estimated risk and uncertainty in our findings.
11
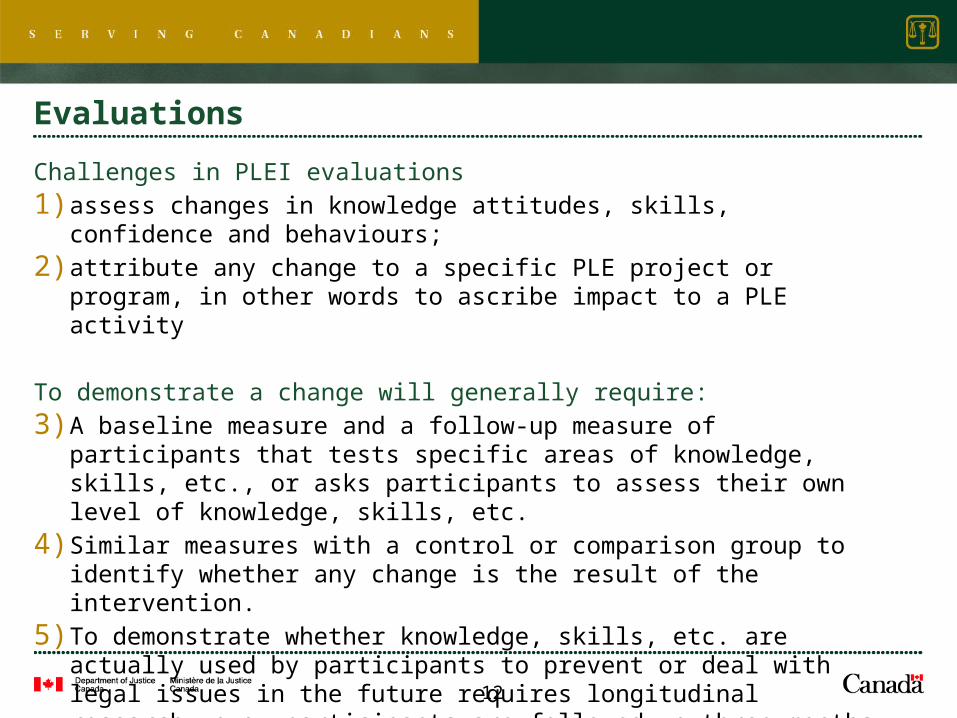
Evaluations
Challenges in PLEI evaluations1) assess changes in knowledge attitudes, skills, confidence and
behaviours;2) attribute any change to a specific PLE project or program, in other
words to ascribe impact to a PLE activity
To demonstrate a change will generally require:3) A baseline measure and a follow-up measure of participants that
tests specific areas of knowledge, skills, etc., or asks participants to assess their own level of knowledge, skills, etc.
4) Similar measures with a control or comparison group to identify whether any change is the result of the intervention.
5) To demonstrate whether knowledge, skills, etc. are actually used by participants to prevent or deal with legal issues in the future requires longitudinal research, e.g. participants are followed up three months after the intervention.
12
13
Questions?
The TeamTing Zhang, PhDJosh Hoddenbagh, MAKatie Scrim, BA
Susan McDonald, LLB, PhD Principal Researcher Research and Statistics Division Department of Justice Canada 284 Wellington, 6th Floor Ottawa, ON K1A OH8 Tel: (613) 957-9315 Email: [email protected]


![[Challenge:Future] Augmented Education Platform - PLEI](https://img.pdfslide.us/doc/110x75/58cfd33b1a28ab13238b494b/challengefuture-augmented-education-platform-plei.jpg)