Embed Size (px)
Citation preview
Measuring the EconomicImportance ofthe Meetings Industry
Developing aTourism Satellite Account Extension

Copyright © 2006 World Tourism Organization Calle Capitán Haya, 4228020 Madrid, Spain
Measuring the Economic Importance of the Meetings Industry – Developing a Tourism Satellite Account Extension
ISBN-13: 978-92-844-1195-5ISBN-10: 92-844-1195-5
Published and printed by the World Tourism Organization, Madrid, SpainFirst printing 2006All rights reserved
The designations employed and the presentation of material in this publication do not imply the expression of anyopinions whatsoever on the part of the Secretariat of the World Tourism Organization concerning the legal statusof any country, territory, city or area, or of its authorities or concerning the delimitation of its frontiers orboundaries.
World Tourism OrganizationCalle Capitán Haya, 4228020 Madrid, SpainTel.: (+34) 915 678 100Fax: (+34) 915 713 733Website: www.unwto.org Email: [email protected]
All UNWTO publications are protected by copyright. Therefore and unless otherwise specified, no part of anUNWTO publication may be reproduced, stored in a retrieval system or utilized in any form or by any means,electronic or mechanical, including photocopying, microfilm, scanning, without prior permission in writing.UNWTO encourages dissemination of its work and is pleased to consider permissions, licensing, and translationrequests related to UNWTO publications.
Permission to photocopy UNWTO material in Spain must be obtained through:
CEDRO, Centro Español de Derechos ReprográficosCalle Monte Esquinza, 1428010 Madrid, SpainTel.: (+34) 91 308 63 30, Fax: (+34) 91 308 63 [email protected]; www.cedro.org
For authorization of the reproduction of UNWTO works outside of Spain, please contact one of CEDRO’s partnerorganizations, with which bilateral agreements are in place(see: http://www.cedro.org/ingles_funcion_internacional.asp)
For all remaining countries as well as for other permissions, requests should be addressed directly to the WorldTourism Organization. For applications see: http://www.unwto.org/pub/rights.htm

© 2006 World Tourism Organization - ISBN 978-92-844-1195-5
Table of Contents
Achnowledgements . . . . . . . . . . . . . . . . . . . . . . . . . . . . . . . . . . . . . . . . . . . . . . . . . . . . . v
Executive Summary . . . . . . . . . . . . . . . . . . . . . . . . . . . . . . . . . . . . . . . . . . . . . . . . . . . . . viiAims of the Study . . . . . . . . . . . . . . . . . . . . . . . . . . . . . . . . . . . . . . . . . . . . . . . . . . . . viiWhat is a Tourism Satellite Account? . . . . . . . . . . . . . . . . . . . . . . . . . . . . . . . . . . . . . viiiMethod . . . . . . . . . . . . . . . . . . . . . . . . . . . . . . . . . . . . . . . . . . . . . . . . . . . . . . . . . . . . ixKey Finding . . . . . . . . . . . . . . . . . . . . . . . . . . . . . . . . . . . . . . . . . . . . . . . . . . . . . . . . . ix
Trends in the Meetings Industry . . . . . . . . . . . . . . . . . . . . . . . . . . . . . . . . . . . ixKey Measures of the Meetings Industry . . . . . . . . . . . . . . . . . . . . . . . . . . . . . xRecommendations on Meetings Industry Data Collection . . . . . . . . . . . . . . . xiRecommendations on Meetings Industry Definitions . . . . . . . . . . . . . . . . . . . . xiiCurrent Problems in Measurement of the Meetings Industry . . . . . . . . . . . . . . xiiLimitations in Use of Existing TSA for Estimating the Economic Contribution of the Meetings Industry . . . . . . . . . . . . . . . . . . . . . . . . . . . . . . . . . . . . . . . . . xiiiAdapting the TSA to Measure the Meetings Industry . . . . . . . . . . . . . . . . . . . xivStatistical Issues . . . . . . . . . . . . . . . . . . . . . . . . . . . . . . . . . . . . . . . . . . . . . . . xv
Summary . . . . . . . . . . . . . . . . . . . . . . . . . . . . . . . . . . . . . . . . . . . . . . . . . . . . . . . . . . xviiProposed Broad Methodological Steps . . . . . . . . . . . . . . . . . . . . . . . . . . . . . xviiFurther Issues to be Considered . . . . . . . . . . . . . . . . . . . . . . . . . . . . . . . . . . xvii
Main Report . . . . . . . . . . . . . . . . . . . . . . . . . . . . . . . . . . . . . . . . . . . . . . . . . . . . . . . . . . . . 1
1 Introduction . . . . . . . . . . . . . . . . . . . . . . . . . . . . . . . . . . . . . . . . . . . . . . . . . . . . . . . . . . . . 31.1 Aims of the Study . . . . . . . . . . . . . . . . . . . . . . . . . . . . . . . . . . . . . . . . . . . . . . . . . . . . 31.2 Background to the Study . . . . . . . . . . . . . . . . . . . . . . . . . . . . . . . . . . . . . . . . . . . . . . 31.3 Scope . . . . . . . . . . . . . . . . . . . . . . . . . . . . . . . . . . . . . . . . . . . . . . . . . . . . . . . . . . . . 41.4 Structure . . . . . . . . . . . . . . . . . . . . . . . . . . . . . . . . . . . . . . . . . . . . . . . . . . . . . . . . . . . 41.5 Method . . . . . . . . . . . . . . . . . . . . . . . . . . . . . . . . . . . . . . . . . . . . . . . . . . . . . . . . . . . . 4
2 Global Overview of the Industry . . . . . . . . . . . . . . . . . . . . . . . . . . . . . . . . . . . . . . . . . . . 52.1 Trends in the Global Meetings Industry . . . . . . . . . . . . . . . . . . . . . . . . . . . . . . . . . . . . 5
2.1.1 Trends in Meetings and Conferences. . . . . . . . . . . . . . . . . . . . . . . . . . . . . . . . 52.1.2 Trends in Exhibitions . . . . . . . . . . . . . . . . . . . . . . . . . . . . . . . . . . . . . . . . . . . 92.1.3 Trends in Incentives . . . . . . . . . . . . . . . . . . . . . . . . . . . . . . . . . . . . . . . . . . . . 11
2.2 Current Data Collection Practices . . . . . . . . . . . . . . . . . . . . . . . . . . . . . . . . . . . . . . . . . 112.2.1 Data Collection by Global Agencies . . . . . . . . . . . . . . . . . . . . . . . . . . . . . . . . 122.2.2 Data Collection by National Tourism Organisations . . . . . . . . . . . . . . . . . . . . . 132.2.3 Convention Bureaux and City Reports . . . . . . . . . . . . . . . . . . . . . . . . . . . . . . 13

2.2.4 Summary of Previous Studies . . . . . . . . . . . . . . . . . . . . . . . . . . . . . . . . . . . . 142.2.5 Gaps in Meeting Industry Data . . . . . . . . . . . . . . . . . . . . . . . . . . . . . . . . . . . 17
2.3 Definitional Issues . . . . . . . . . . . . . . . . . . . . . . . . . . . . . . . . . . . . . . . . . . . . . . . . . . . 182.3.1 Nomenclature for the Industry . . . . . . . . . . . . . . . . . . . . . . . . . . . . . . . . . . . . 182.3.2 Definition of Meetings . . . . . . . . . . . . . . . . . . . . . . . . . . . . . . . . . . . . . . . . . . 19
3 Using the TSA to Evaluate the Economic Contribution of the Meetings Industry. . . 213.1 The Economic Contribution of the Meetings Industry has Two Components. . . . . . . . 253.2 Use of an Existing TSA to Provide an Indicative Estimate
of the Economic Contribution of the Meetings Industry . . . . . . . . . . . . . . . . . . . . . . . 253.3 Limitations of the Use of the TSA in Measuring Meetings’ Activity . . . . . . . . . . . . . . . 263.4 The new International Standard Industrial Classification 823,
‘Convention and Trade Show Organisers’ . . . . . . . . . . . . . . . . . . . . . . . . . . . . . . . . . . 273.5 Implications of ISIC 823 . . . . . . . . . . . . . . . . . . . . . . . . . . . . . . . . . . . . . . . . . . . . . . . 283.6 Presentation of Results: A Meetings ‘Satellite Account’ . . . . . . . . . . . . . . . . . . . . . . . 293.7 Conclusions . . . . . . . . . . . . . . . . . . . . . . . . . . . . . . . . . . . . . . . . . . . . . . . . . . . . . . . . 30
4 Framework for an Evaluation of the Meetings Industry . . . . . . . . . . . . . . . . . . . . . . . . 334.1 Measurement Problems . . . . . . . . . . . . . . . . . . . . . . . . . . . . . . . . . . . . . . . . . . . . . . . 334.2 Data to be Collected . . . . . . . . . . . . . . . . . . . . . . . . . . . . . . . . . . . . . . . . . . . . . . . . . . 344.3 Collection of Expenditure Data . . . . . . . . . . . . . . . . . . . . . . . . . . . . . . . . . . . . . . . . . . 354.4 Lessons from Previous Research in the Meetings Industry . . . . . . . . . . . . . . . . . . . . . 354.5 Surveying Participants in Meetings . . . . . . . . . . . . . . . . . . . . . . . . . . . . . . . . . . . . . . . 364.6 Expenditure on Travel to Meetings in Other Countries . . . . . . . . . . . . . . . . . . . . . . . . . 374.7 The Use of Survey Data to Measure the Economic Contribution
of the Meetings Industry . . . . . . . . . . . . . . . . . . . . . . . . . . . . . . . . . . . . . . . . . . . . . . . 384.8 Quarterly Measures of Meetings Industry Performance . . . . . . . . . . . . . . . . . . . . . . . . 39
5 Proposed Broad Methodological Steps and Further Issues to be Considered . . . . . 435.1 Proposed Broad Methodological Steps . . . . . . . . . . . . . . . . . . . . . . . . . . . . . . . . . . . 435.2 Further Issues to be Considered . . . . . . . . . . . . . . . . . . . . . . . . . . . . . . . . . . . . . . . . . 45
Appendices . . . . . . . . . . . . . . . . . . . . . . . . . . . . . . . . . . . . . . . . . . . . . . . . . . . . . . . . . . . . 47A: Summary of Supply of the Meetings Industry Facilities by Country . . . . . . . . . . . . . . . 47B: Congress and Convention Centres in the Americas Region . . . . . . . . . . . . . . . . . . . . 59C: Case Study . . . . . . . . . . . . . . . . . . . . . . . . . . . . . . . . . . . . . . . . . . . . . . . . . . . . . . . . 61D: Definitions . . . . . . . . . . . . . . . . . . . . . . . . . . . . . . . . . . . . . . . . . . . . . . . . . . . . . . . . . 63E: Example of Venue Identification from the National Business Events Study (NBES) . . . 67F: ICCA Categories . . . . . . . . . . . . . . . . . . . . . . . . . . . . . . . . . . . . . . . . . . . . . . . . . . . . 69G: Examples of Questionnaires to Collect Relevant Data . . . . . . . . . . . . . . . . . . . . . . . . 71
Bibliography. . . . . . . . . . . . . . . . . . . . . . . . . . . . . . . . . . . . . . . . . . . . . . . . . . . . . . . . . . . . 79
List of Abbreviations. . . . . . . . . . . . . . . . . . . . . . . . . . . . . . . . . . . . . . . . . . . . . . . . . . . . . 81
iv Measuring the Economic Importance of the Meetings Industry
The publication of this study on Meetings Tourism is the result of a fruitful collaborative effort carriedout by the World Tourism Organization (UNWTO) and Affiliate Members Reed Travel Exhibitions, theInternational Congress & Convention Association (ICCA) and Meeting Professional International (MPI).
Given the common interest in gaining better knowledge of the tourism industry and of all the elementsthat contribute to the development of tourism in general, the UNWTO Department of Statistics andEconomic Measurement of Tourism and the Business Council of the Affiliate Members addressed theconcerns raised by these Members regarding how to measure the meetings industry’s linkage to tourismand the extent to which the conceptual framework of the Tourism Satellite Account is capable ofelucidating this linkage from a macroeconomic perspective consistent with the measurement andanalysis framework of the National Accounts of countries in which this industry is a prominent activity.
Thus the groundwork was laid for an intensive effort carried out with great professionalism by the teamof experts - Margaret Deery, Leo Jago, Larry Dwyer, Ray Spurr and Liz Fredline - of the SustainableTourism Cooperative Research Centre (STCRC) of Australia, which was able to rely on the support ofthe collaborating entities at all times. In fact, the “National Business Events Study: An Evaluation of theAustralian Business Events Industry”, conducted by the STCRC and published in 2005 served as animportant reference source for this new study.
From that perspective, the study constitutes the starting point of a longer-term task that, with the effortsof the parties involved, will contribute to broadening and strengthening the public’s recognition of thisindustry, which has taken off so spectacularly over the past several years and has consolidated itself asa tourism segment of the first order.
We also wish to underline the importance of the coordination efforts carried out by Jens Jensen, initiallyfrom his post within the Business Council, and in the latter stages, as an expert on the subject, whichmade it possible to achieve the necessary coherence of the study within the framework of the objectivesof the programme of the Business Council of the UNWTO Affiliate Members.
Lastly, we would like to acknowledge the editing work carried out by UNWTO consultant StanFleetwood (Australia), who drew on his comprehensive knowledge of the Tourism Satellite Account forthe final revision of this study.
Madrid, November 2006
Victoria MarcosExecutive Director Affiliate Members
Antonio MassieuChief, Statistics and Economic Measurement of Tourism
© 2006 World Tourism Organization - ISBN 978-92-844-1195-5
Acknowledgements

© 2006 World Tourism Organization - ISBN 978-92-844-1195-5
The Meetings Industry has emerged over recent decades as an important contributor to nationaleconomies. It is perceived as a significant and growing component of tourism and other industries andyet little reliable and consistent data exist to support this perception. With the lack of consistentconcepts and definitions, as well as data, it is impossible to measure the industry accurately. Thereforethe industry is unable to credibly demonstrate its value.
In an attempt to rectify this gap, the World Tourism Organisation (UNWTO), and Affiliate Members,Reed Travel Exhibitions and International Congress & Convention Association (ICCA) – in cooperationwith Meeting Professional International (MPI) commissioned the Sustainable Tourism CooperativeResearch Centre (STCRC) from Australia “to encourage the UNWTO to focus more on the MeetingsIndustry and in partnership to undertake a study that would lead to proposals for the adaptation of theTourism Satellite Account (TSA) to reflect the real importance of the Meetings Industry and itscontribution to tourism” (Meetings Industry Terms of Reference, p 1).
Tourism, in fact, was confronted with this same problem of being unable to demonstrate its value andhence the TSA was developed. This study is a first important contribution on how the TSA could be usedas an analytical tool to measure the tourism connection of the Meetings Industry. In order to obtaincomparable figures, however, additional efforts by the Meetings Industry will be required to:
1. define the appropriate concepts and definitions to be measured,
2. identify a list of appropriate commodities (services) for inclusion, and
3. promote and cooperate in the collection of data, both from the demand and supply sides.
Aims of the Study
The aim of this study is to analyse whether and how the TSA conceptual framework can be adapted tothe measurement of the Meetings Industry. This approach can provide an analytical framework thatallows the measurement in macroeconomic terms of different sub-sectors of Tourism in the overallframework of tourism’s economic contribution in the economy.
Specific aims of the study are to provide an understanding of the global Meetings Industry withparticular attention to the measurement of the economic importance of the industry. The three keycomponents of the report are:
a) to present an overview of the current measurement of the global Meetings Industry and theinherent gaps in this, including the issue of definitions for meetings;
b) to provide a summary of the demand and supply data that should be collected to evaluate theMeetings Industry using the Tourism Satellite Account (TSA) conceptual and measurementframework;
c) to examine the use of these data in developing a model for evaluating the economic contributionof the Meetings Industry in macroeconomic terms.
Executive Summary
viii Measuring the Economic Importance of the Meetings Industry
What is a Tourism Satellite Account?
The Tourism Satellite Account (TSA) is a measurement framework, based on the concepts, definitionsand classifications of the System of National Accounts (SNA) developed to provide a credible measureof the economic contribution of the tourism sector.
The National Accounts measure the economic contribution of industries that are specified in acountry’s official classification of industries. These classifications are usually based on the InternationalStandard Industrial Classification (ISIC) code (although some countries have their own classificationsystems). Industries are usually defined as groups of businesses producing a similar product.
As tourism is a demand side activity (dependent on the status of the consumer rather than on the typeof supplier), and hence is not identified in ISIC or in countries’ National Accounts. The TSA extracts alltourism-related economic activity which is included in the National Accounts but not identified astourism. Tourism activity is “hidden” in the relevant industry activities, e.g. the Accommodation,Transport, and Travel Agency industries. This activity will be identified and brought together in aseparate but related account, i.e. an account that is a satellite of the core national accounts. Animportant aspect of this approach is that the TSA is an official part of the national accounts, usingsimilar concepts, definitions, valuations and classification systems. This means that for the first time, itis possible to have available an official, objective and credible measure of the tourism sector,comparable with other industries.
Basically, the TSA identifies tourism characteristic industries, i.e. those which would disappear or besubstantially reduced if tourism did not exist. The TSA identifies the total output, costs, value added(GVA) and employment of those industries, (the production account) similar to what is provided for allindustries in the core SNA. Surveys of visitors identify product purchases which can be related to theproduction of characteristic (and other) industries. A tourism-ratio for each industry is calculatedcorresponding to the share of each tourism characteristic industry’s output that is attributable topurchases by visitors. These tourism ratios are applied to the production accounts for tourismcharacteristic industries to calculate the value of these variables that are attributable to tourismdemand.
The results are often split to show the contribution of Domestic and International tourism and of Leisureand Business (including Government) tourism.
The TSA measures only those transactions undertaken directly between the visitor and the provider ofthe goods and services. That is, only measures of the “direct” economic contribution of the tourismsector are included. However, there are other contributions resulting from tourism demand (such asindirect and induced effects). These “up-stream” effects result from the demand by businesses directlysupplying the visitors, for inputs produced by other businesses. For example, a hotel needs to buy food,electricity, possibly cleaning services, etc. Industries producing these products also benefit fromtourism demand.
This indirect contribution from tourism can legitimately be claimed by the tourism sector as part of itsoverall contribution to the economy. Indirect effects can be calculated by the use of modellingtechniques.
It is important when quoting the contribution of an industry, or a sector such as tourism, to an economy,to be clear whether the contribution includes only the direct effects or also includes indirect andinduced effects. This point is also relevant in discussing the measurement of the contribution of theMeetings Industry. If such a measure is based on the TSA, then the result will show only the directcontribution, and further analysis is needed to calculate the other types of effects.
ixExecutive Summary
Method
The consultants collated the data necessary to inform the findings of the study by means of acomprehensive literature search followed by extensive communications with industry experts.
The comprehensive literature search investigated industry reports, national statistical data includingTSA, and academic articles focussing on conferences, meetings, exhibitions and incentives. Inparticular, the search concentrated on the type of statistics collected, how these were collected, andthe use made of the information.
Extensive discussions with industry experts and widespread consultation with organisations such as theUNWTO and ICCA then complemented the literature search.
Industry experts still require a list of identified products provided by the Meetings Industry, so thatmethods can be developed to classify and measure them in terms of revenues received.
A provisional list has been drawn up by industry, represented by the International Association ofProfessional Congress Organizers (IAPCO)1, from which a list could possibly be drawn formeasurement purposes, including items such as:
• assistance with congress bids
• finance consultancy
• secretariat and office facilities
• abstract handling
• delegate transfers and on-site transportation
• accommodation bookings
and many more.
Key Findings
Trends in the Meetings Industry
The Meetings Industry has difficulty in obtaining consistent and credible trend data due to the plethoraof definitions for the various components of the industry. The industry needs to define consistentdefinitions and concepts that can be widely used by its members.
When examining the International Meetings Industry, however, some trends do emerge. The Industryappears to have gone through a period of decline beginning in 2000, but showed improvement in2005. This fits with the notion that the Meetings Industry is cyclical with five-year cycles. Other ‘trends’that appear in the data are:
• while there has been a decrease in the number of events over the 2000-2004 period, thereappears to have been an increase in the number of participants at these events;
• the duration of all events including exhibitions, conventions and incentive travel have becomeshorter;
• the number of exhibitors at exhibitions is increasing;
• the number of new competitors in the Meetings Industry, such as those in China and Dubai, isincreasing; and
• the incentive travel area remains the most lucrative but the most volatile component of theMeetings Industry.
1 Extract from Appendix A, How to Choose the right PCO, copyright, IAPCO, 4th edition, March 2005

x Measuring the Economic Importance of the Meetings Industry
Key Measures of the Meetings Industry
There are two types of measures relating to the economic contribution of activities relating to meetingsfor which information is required:
• Supply side measures of the industry include such variables as income (represented by fees, andcommissions) costs, value added and employment. Businesses may be identified by using therecently developed class of ISIC (International Standard Industrial Classification) 823, forexample. In addition to those businesses which provide meetings services as their primary activity,it is important to include other relevant businesses that provide such services as a secondaryactivity, e.g. government agencies producing these services, hotels, etc.. These variables are thebuilding blocks to measure the contribution of this industry to GDP.
• Demand side measures include such variables as expenditure by participants at meetings onspecific identified services supplied by the meetings industry or other industries. Non-monetaryvariables to be related to the expenditure data include: numbers of participants, lengths ofmeetings, number of nights in hotels, or other accommodation, distance travelled to get to themeeting, and number in the travelling party.
A complete picture of the industry requires measurement of both dimensions. A demand side onlyapproach does not identify the contribution of industry to the economy (e.g. Production account), whilea supply side approach does not identify expenditure by participants on products purchased from otherindustries (e.g. the accommodation industry, transport industry, etc.) while participating in the meeting.
So far this report has not mentioned the possibility of adding a regional dimension to the analysis. Insome countries this aspect is very important, as the type of meetings may be quite different betweenregions of a country. The contribution of the industry to regional GDP and employment may vary.
Data are collected through four main types of agencies:
• Global agencies that collect meetings industry data are the specific industry groups such as ICCA,MPI, SITE, UIA and Reed Exhibitions e.g. FutureWatch (MPI); Five Year Trends Report (EIBTM)
• National Statistics Offices, e.g. Business surveys for hotels, businesses renting out meetingfacilities and other relevant industries
• Other government agencies, such as US Business Traveller to Canada Study Summary 2002(Canadian Tourism Commission)
• Convention Bureau and Regional or City Reports such as those by the Finland Convention Bureauand the Sri Lankan Convention Bureau.
Other surveys are conducted – either specifically designed or by adding questions to existing surveys– of members of industry associations (such as IAPCO), to obtain their views, or to explore possibilitiesof the types of data that could be collected.
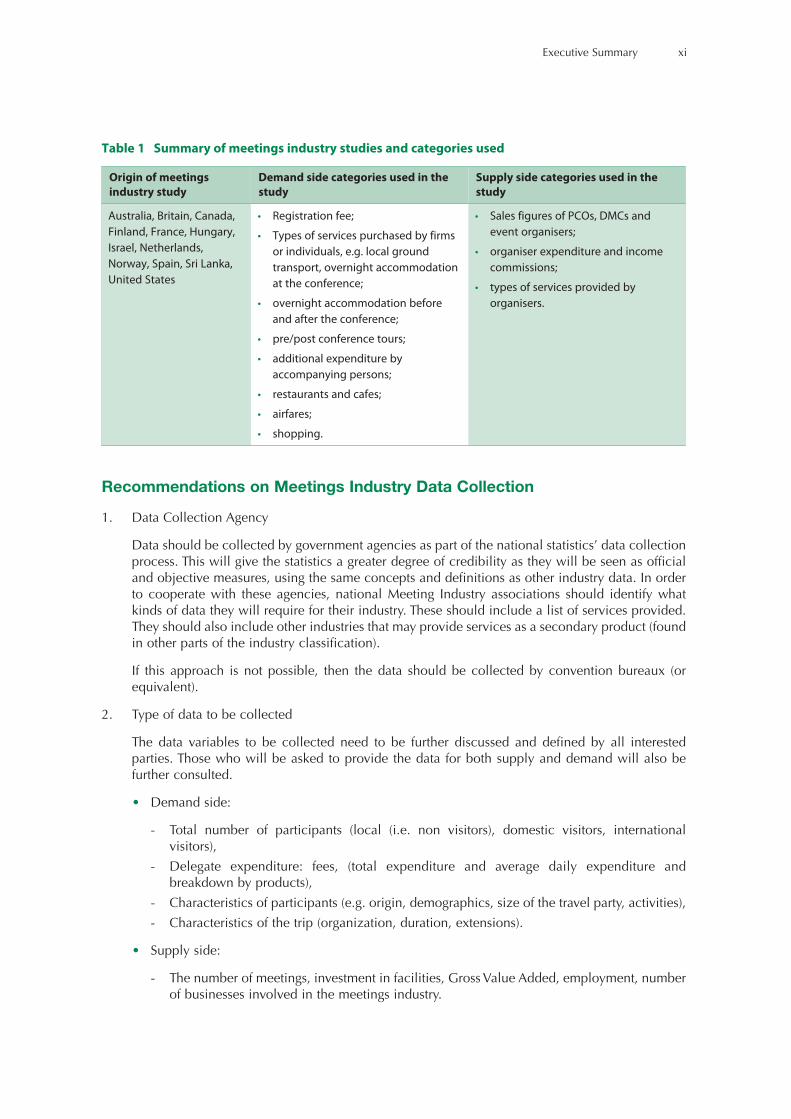
A number of countries and regions have undertaken economic studies on the Meetings Industry. Someof these are mis-named as ‘economic impact’ studies, although it is likely that they are either economiccontribution studies or expenditure estimates. This study examined twelve detailed studies of theMeetings Industry over the last three years. A summary of the studies and the categories used isprovided in Table 1.
xiExecutive Summary
Table 1 Summary of meetings industry studies and categories used
Recommendations on Meetings Industry Data Collection
1. Data Collection Agency
Data should be collected by government agencies as part of the national statistics’ data collectionprocess. This will give the statistics a greater degree of credibility as they will be seen as officialand objective measures, using the same concepts and definitions as other industry data. In orderto cooperate with these agencies, national Meeting Industry associations should identify whatkinds of data they will require for their industry. These should include a list of services provided.They should also include other industries that may provide services as a secondary product (foundin other parts of the industry classification).
If this approach is not possible, then the data should be collected by convention bureaux (orequivalent).
2. Type of data to be collected
The data variables to be collected need to be further discussed and defined by all interestedparties. Those who will be asked to provide the data for both supply and demand will also befurther consulted.
• Demand side:
- Total number of participants (local (i.e. non visitors), domestic visitors, internationalvisitors),
- Delegate expenditure: fees, (total expenditure and average daily expenditure andbreakdown by products),
- Characteristics of participants (e.g. origin, demographics, size of the travel party, activities),
- Characteristics of the trip (organization, duration, extensions).
• Supply side:
- The number of meetings, investment in facilities, Gross Value Added, employment, numberof businesses involved in the meetings industry.
Origin of meetings
industry study
Demand side categories used in the
study
Supply side categories used in the
study
Australia, Britain, Canada,
Finland, France, Hungary,
Israel, Netherlands,
Norway, Spain, Sri Lanka,
United States
• Registration fee;
• Types of services purchased by firms
or individuals, e.g. local ground
transport, overnight accommodation
at the conference;
• overnight accommodation before
and after the conference;
• pre/post conference tours;
• additional expenditure by
accompanying persons;
• restaurants and cafes;
• airfares;
• shopping.
• Sales figures of PCOs, DMCs and
event organisers;
• organiser expenditure and income
commissions;
• types of services provided by
organisers.

xii Measuring the Economic Importance of the Meetings Industry
Recommendations on Meetings Industry Definitions
A major problem with the previously-mentioned studies is that they frequently use different definitionsand include different components of the industry. In examining the many definitions adopted byvarious organisations, the following definitions are recommended for adoption by the MeetingsIndustry.
Table 2 Recommended meetings industry definitions and rationale for definitions
As noted in Table 2, some definitions, such as the size of a meeting, are not really necessary for the taskof evaluating the economic contribution of the Meetings Industry. The minimum essential criteria arethe meeting aims and the meeting venue.
A recent proposal from the UNWTO for a new International Standard Industrial Classification (ISIC)code 8230 “Convention and trade show organisers” represents an important new step towardagreement on the scope of the ‘Meetings Industry’.
• This class includes the organisation, promotion and/or management of events, such as businessand trade shows, conventions, conferences and meetings, whether or not including themanagement and provision of the staff to operate the facilities in which these events take place.
As a result of the inclusion of activity 8230 in ISIC, there is now the capacity to identify allestablishments who undertake trade show organization activities (as their primary activity). We nowhave the possibility to have a picture of all establishments that produce convention and trade showorganization, with more comprehensive coverage than has been possible previously. These activitieswere all included before in macro economic measurement, but could not easily be separatelyidentified.
Current Problems in Measurement of the Meetings Industry
The economic contribution of the Meetings Industry internationally appears to be significant but thereare several major problems with its measurement and, hence, comparability. These measurementproblems, affecting both supply side and demand side measures, arise because of the following:
• The standard industrial classifications (e.g. ISIC) do not currently identify a separate ‘Meetings’industry.
Issue Recommendation Rationale
Nomenclature for
the industry
Meetings industry This name represents the supply side. It has
support from key industry participants.
Meeting aims To motivate participants, to conduct
business, share ideas, to learn, socialise and
hold discussions.
These aims, or similar aims, were the most
common in the industry and academic
literature .
Meeting size Minimum number of ten (10) participants Many meetings organisations use this
number.
Meeting venue Venues where there is payment for the use
of the venue for meetings
Where there is payment for the use of a
contracted venue, there will be an economic
contribution to the economy.
Meeting duration A half-day (four hours) or more Although a minimum duration may not be
needed, the limit of four hours will provide a
practical and sensible in-scope boundary for
data collection.

xiiiExecutive Summary
• The data collected show enormous diversity and inconsistency.
• The statistics are based on different measures of both supply side and demand side data.
• The data are created for different purposes using different methodologies and thus cannot becompared.
• The quality of the data collection is often not up to strict statistical standards and thus results areof questionable reliability.
Some work can be done in the future by the meetings industry to ensure greater consistency todefinitions and methods.
Limitations in Use of Existing TSA for Estimating the Economic Contributionof the Meetings Industry
In the TSA, products are those which are purchased by or for visitors. Products – which comprise goodsand services – are what are purchased by consumers.
Activities (industries) produce products.
The TSA splits products into two categories, specific tourism products, (comprising tourismcharacteristic and tourism connected products) and non-specific products (all those which areconsidered of no major direct tourism interest). Broadly, “Tourism characteristic products” are thoseproducts which represent an important part of tourism consumption, or for which a significantproportion of the sales are to visitors.
Productive units include tourism-specific activities/industries (comprising tourism characteristic andtourism connected activities/industries) and non-specific activities/industries (which includes all otherproductive activities). “Tourism characteristic activities” are those industries that would either cease toexist in their present form or would be significantly affected if tourism were to cease.
Table 3 provides these characteristic industries and characteristic products (UNWTO).
Table 3 List of tourism characteristic industries and products2
Industries: Products:
1. Hotels and similar 1. Accommodation Services
2. Second home ownership (imputed) 2. Food and Beverage Serving Industries
3. Restaurants and similar 3. Passenger Transport Services
4. Railway passenger transport services 4. Travel Agency, tour operator and tourist guide services
5. Road passenger transport services 5. Cultural Services
6. Water passenger transport services 6. Recreation and Other Equipment Services
7. Air passenger transport services 7. Miscellaneous tourism services (e.g. insurance, travel
card services
8. Transport supporting services
9. Transport equipment rental
10. Travel agencies and similar
11. Cultural Services
12. Sporting and other recreational services
2 Tourism Satellite Account (TSA): Recommended Methodological Framework,UNWTO/UNSD/OECD/Eurostat

xiv Measuring the Economic Importance of the Meetings Industry
In applying these lists to the Meetings Industry, however, there are limitations to the use of these lists,including:
• The lack of clear definition of the Meetings Industry
• The lists of tourism characteristic industries and products do not reflect meetings’ activity (i.e.meetings’ characteristic industries and products)
The underlying issue is that meetings activity cannot be explicitly identified as a sub-set of tourismactivity. Because of this the TSA cannot be used, in its existing form, to provide a complete measure ofthe Meetings Industry. Modifications are required to the presentation and to the data collectioncurrently used in production of the TSA (see page 16). This is clearly technically possible, but it wouldinvolve extra expense, particularly for data collection, than would be required if the current TSA resultscould be used to provide a measure of Meetings Industry activity.
One way to partially address this would be to add the Meetings Industry to the TSA as a tourismcharacteristic industry. This would work if it can be determined approximately what share of theMeetings Industry output goes to visitors, rather than local residents. The criterion could be set atsomething like 25-30% of the output going to visitors. If this criterion is not met, the Meeting Industrycould be separately identified in the TSA as a ‘special’ case.
Adapting the TSA to Measure the Meetings Industry
The recommended new ISIC code ‘8230 – Convention and trade show organisers’ represents animportant development regarding adaptation of the TSA to measure the Meetings Industry. Countries’classifications of industries and products to be used for measuring meetings’ activity can in future betaken from the international standards, ISIC and CPC (Central Product Classification). Two products willbe identified at present in the CPC: Services of convention organisers, and services of trade showorganisers.
The new ISIC categories are:
• 823 Convention and trade show organisers
See class 8230
• 8230 Convention and trade show organisers
This class includes the organisation, promotion and/or management of events, such as business and trade shows,conventions, conferences and meetings, whether or not including the management and provision of the staff to operatethe facilities in which these events take place.
The TSA approach enables the supply side (industry) contribution to be measured through the activityof the Meetings Industry and all other relevant ISIC industries (e.g. Accommodation industry), and alsoenables the full contribution of meetings’ participants to be measured through their total consumptionof goods and services associated with their participation in meetings. The separate identification of theMeetings Industry means that, once implemented, statistical agencies will be able to survey thisindustry in the same way as other industries in the economy are surveyed.
Several issues need to be highlighted:
1. The new ISIC category excludes some supplier types that one may wish to count as part of theMeetings Industry.
- Types of businesses that possibly may not be represented in the 8230 ISIC code includeIncentive Houses, as well as a range of other organisations.
- The great majority of meetings take place without using the services of businesses whoseprimary activity is organising meetings, conferences, conventions and trade shows. Thus, use

xvExecutive Summary
of the code to define the Meetings Industry from the supply side will capture only a smallpercentage of the production of meetings’ goods and services. The identification of industriesfor which meetings’ organization is a secondary activity can be measured as well.
2. Different and unique bundles of services related to meetings can be packaged. This characteristiccan complicate the measurement issues. Normally, consumption of accommodation, transport,food, etc. by meetings’ participants would be an activity of the relevant industries providing theseservices to the participants, and not of the Meetings Industry. However, a complication ariseswhen, for example, the meeting organiser includes in the meeting/conference registration fee, thecost of accommodation, entertainment, and possibly some transport – services which will beprovided directly to the meeting participant by the business rather than the meeting organiser. Thesame issues arise when an exhibition organiser pays for various goods and services from exhibitorfees which are provided directly to participants.
The question is: should the Gross Value Added in providing these services be attributed to themeetings’ organiser, treating the package as a single product (known as the “gross” approach), orshould the Gross Value Added be attributed to the direct providers of each of the packages’components, i.e. to the Accommodation industry, the Transport industry, the Tourist Attractionsindustry, etc. (known as the “net” approach).
In compiling the TSA, the UNWTO recommends that the “net” approach is taken. Consistencywith UNWTO guidelines would suggest that this approach should be taken in measuring theMeetings Industry. The potential ‘downside’ of this is that the apparent economic contribution ofthe Meetings Industry will be lower compared to what the gross approach would indicate. Theoverall total Gross Value Added will not be affected as the GVA associated with the supply ofthese products will be attributed to the supplying industry (rather than to the Meetings Industry).It is important that the approach taken be consistent with existing official standards to ensure thatthe method is accepted as providing an objective and credible measure of the industry.
3. The listing of the new ISIC code for the Meetings Industry does not, in itself, ensure that centralstatistical agencies will implement the new code, or that they will automatically collect thisinformation as they would for other industries. In most cases industry information is collected ata higher level than the 3 (or 4)-digit level. The agencies would have to be persuaded to collectdata on this industry at this lower level. This would involve more costs for the agency in datacollection and might be resisted for this reason.
4. The presentation of statistical results needs close consideration. Adoption of the new ISIC 8230code will be a useful step towards higher credibility if implemented by central statistical agenciesbecause it will provide central statistical agency imprimatur to the measurement of the MeetingsIndustry.
Statistical Issues
A number of statistical issues need to be addressed, including:
• Creation of a list of services provided by meeting organisers. Some such lists exist already, whichcould be utilized.
• Central statistical agencies should be encouraged to collect the data in their annual businesssurveys. This will involve additional costs and the need for ‘political’ will/support. The appropriatebusiness surveys, which would cover where primary and secondary products are produced for themeetings industry, need to be identified.
• Meeting Industry associations could complement this information with business intention surveys(also called business opinion or expectation surveys, condition or climate surveys) which collectqualitative type information from business managers on a monthly and/or quarterly basis.

xvi Measuring the Economic Importance of the Meetings Industry
• The new ISIC code 8230 does not necessarily resolve all of the supply side data issues. Industryshould identify what is missing.
• Many meetings do not make use of a professional meetings’ organiser. ISIC code 8230 may notinclude:
- Incentive Houses,
- Exhibition organisers (perhaps),
- Exhibition contractors,
- Speaker bureaux,
- Corporate entertainment,
- Catering companies,
- Hotels which host meetings but would not regard themselves as meetings specialists.
A further issue relates to how the results of any measurement of the Meetings Industry would bepresented. In practice options are limited to the following typology:
1. incorporated in the TSA, with the “Meetings Industry” identified as another tourism industry;
2. incorporated in the TSA framework as a complementary set of tables specifically identifyingmeetings’ activity; or
3. as a separate satellite account.
Therefore there are three options:
The first option implies that the Meeting Industry is a tourism characteristic activity such asAccommodation, Passenger Transportation, Travel Agencies, etc. There is no clear evidence that this isthe case at least on a national level The Meetings Industry is not a clear subset of the Tourism sector –indeed the new ISIC 8230 code will cover activity by conference organisers on behalf of residentconference and meeting participants as well as those for visitor participants (whether domestic orinternational visitors). Some organisers which fall under the code may do very little of their businesswith ‘visitors’ as defined under the TSA
The second option (to consider the development of a separate industry extension relevant for theMeetings Industry) seems the proper way to proceed. Such an extension could involve, for example,the usual supply and demand information for the industry plus other information and characteristicsnot normally found in the TSA. The TSA could be a supporting instrument and framework, but moreinformation about the industry could be incorporated. Although such specific industry extensionscannot be referenced, analogies of this approach appear, for example, in the Balance of Payments asmemoranda items, where information is provided outside the specific BOP guidelines, but which is stillof interest to users. In one specific case, (in Canada), a memorandum item has been used to provide aprovincial breakdown for travel. This is not actually a component of the BOP. It elaborates the usualBOP compilation, but provides additional useful information. (Such an analysis could be assembled forany industry in the SNA, where some descriptive characteristics are available and important, but lieoutside the specific SNA requirements). In this context, the Meetings Industry could use the synergy ofthe TSA framework, but add supplementary information of particular interest as a memorandum item.The industry itself could elaborate such characteristics as they wish.
The tables to be produced as supplements to the main TSA tables could be set up along the lines of theTSA-RMF (consumption by products and categories of visitors, and production accounts for theindustry). Below are examples of such tables, using the Tourism Satellite Account: RecommendedMethodological Framework (TSA-RMF) as an example and some hypothetical detail.
The Meetings Industry would make a valuable contribution to the discussion by reviewing theseproposals before identifying the optimal alternative for their specific situation.
Finally, the third option while perhaps ideal from the industry viewpoint, is most unlikely to beaccepted by statistical agencies, at least until they have some sense of the importance of the industry.

xviiExecutive Summary
Summary
Proposed Broad Methodological Steps
This proposed method relates to measuring the economic contribution at the national level. It is basedon, and an extension of the Tourism Satellite Account.
As previously indicated, a regional perspective may be important, as diversity of Meetings Industryactivity among regions in a country may exist. Some regions may have a Meetings Industry that issufficiently important to be considered part of a tourism industry, while others may not.
Steps required are:
1. Decide scope of industry and meetings participants
2. Identify data requirements on the supply side and demand side
3. Develop data collection methods
4. Surveying organisation should, where possible, be the National Statistical Office
5. Incorporation of the data into the Tourism Satellite Account (TSA)
6. The results should at a minimum, show (1) the demand side value of consumption resulting frommeetings’ activity, and (2) how much meetings’ activity contributes to a country’s Gross ValueAdded (and/or GDP).
See sub-chapter 5.1 for more details of proposed method.
Further Issues to be Considered
Throughout this report, we have noted many issues that need further consideration, mainly by theMeetings Industry in conjunction with the relevant technical experts.
The following is an outline of the main issues that need to be considered by the Steering Committee toprogress this exercise:
1. Discuss with technical experts and any other relevant international agencies, how an internationalstandard method can be adopted, by building on the findings of this report.
2. Agree on the scope of the industry.
3. How will national industry associations be “brought on board” to actively support themeasurement of the industry in their country?
4. How will national industry associations be encouraged to educate their members and otherindustry participants to actively support the implementation of the measurement?
5. How will industry participants be persuaded to fully co-operate with and contribute to theimplementation of the adopted measurement of their industry?
Further information on these issues is provided in sub-chapter 5.2.


Main Report


1.1 Aims of the Study
This report outlines some steps that could be taken to overview the characteristics of the MeetingsIndustry, using the analytical model of the Tourism Satellite Account (TSA) that would show theimportance of this industry and identify how it could be defined and measured. The benefits of usingthe TSA are that it establishes an analytical framework that would provide credible results for theMeetings Industry. This would be of value in the context of the industry’s wish to draw the attention ofgovernments to the economic importance of the sector.
More specifically, the report aims to provide an understanding of the global Meetings Industry, withparticular attention to the measurement of its economic importance.
The three key objectives of the report are to:
a. present an overview of the current measurement of the global Meetings Industry and the gapsinherent in this, including the issue of definitions for meetings;
b. provide a summary of the demand and supply side data that should be collected to evaluate theMeetings Industry using a TSA; and
c. use these data in developing a model for evaluating the economic contribution of the MeetingsIndustry.
1.2 Background to the Study
Competition for the tourist dollar is becoming more intense and countries around the world are seekingto gain a competitive edge through niche tourism activity. Meetings and business events are one suchniche tourism activity that contributes significantly to Gross Domestic and Regional Product as well asto the branding and awareness of tourist destinations. While the benefits of meetings and businessevents are becoming recognised by the industry, the size and importance of this sector is not reflectedsystematically in official statistics. National Statistical Offices generally do not produce data on theactivities of business event segments such as meetings, conferences, exhibitions and incentives in thestructural and economic statistics.
In response to this lack of systematic data collection and the growth of business event activity, theWorld Tourism Organisation (UNWTO) Affiliate Members Reed Travel Exhibitions and the InternationalCongress & Convention Association (ICCA) – in cooperation with Meeting Professionals International(MPI) encouraged the UNWTO to undertake a study that would lead to proposals for the modificationof the TSA to reflect the real importance of the Meetings Industry and its contribution to tourism. TheUNWTO thus commissioned the Australian based Sustainable Tourism Co-operative Research Centre(STCRC) to undertake this study.
Chapter 1
Introduction
© 2006 World Tourism Organization - ISBN 978-92-844-1195-5

4 Measuring the Economic Importance of the Meetings Industry
1.3 Scope
The UNWTO, MPI and ICCA have developed a definition for the International Standard IndustrialClassification (ISIC) revision process, recently undertaken. (The ISIC is the official internationalstatistical classification system for identifying industries. Many countries base their own industrialclassification system on this international standard).
Based on this definition, we have defined a Meetings sector (sometimes referred to as the Meetings,Incentives, Conferences and Exhibitions – or ‘MICE’ Sector) to include: activities based on theorganisation, promotion, sales and delivery of meetings and events; products and services that includecorporate, association and government meetings, corporate incentives, seminars, congresses,conferences, conventions events, exhibitions and fairs.
Although this definition provides substantial detail in terms of defining the various components of theMeetings Industry, further refinement of this definition will ultimately be required. Issues that will needto be considered include:
• whether this definition applies only to purpose built conference facilities,
• the minimum number of participants and duration for a meeting, and
• the criteria to distinguish international meetings.
These issues and others will be considered in a later section.
1.4 Structure
There are five chapters making up the remainder of this report. The method chapter appears next,followed by a chapter relating to each part of the project as identified in the project brief, and a finalchapter on further actions needed.
2.0 Method
3.0 Global Overview of the Industry
4.0 The Role and Use of the TSA in an evaluation
5.0 Framework for an Evaluation of the Meetings Industry
6.0 Roadmap for Further Action for Shareholders
1.5 Method
The consultants used two methods to collate the data necessary to inform the findings.
First, a comprehensive literature search investigated industry reports, national statistical data includingTSA, and academic articles focussing on conferences, meetings, exhibitions and incentives. Inparticular, the search concentrated on the type of statistics collected, how these were collected and theuse made of the information.
The second phase of the project entailed extensive interviews and discussions with industry experts andwidespread consultation with organisations such as the UNWTO and ICCA. These interviews providedinvaluable material and industry insights that confirmed and expanded the information obtained fromthe reports and other literature.
© 2006 World Tourism Organization - ISBN 978-92-844-1195-5
In undertaking the search for information, reports were obtained from a number of sources within theMeetings Industry such as ICCA, MPI and the Convention Industry Council (CIC), as well as fromtourism bodies such as the UNWTO. Although some of this information comes from tourism, there isthe recognition that meetings are broader than tourism in that some participants are local residents andnot tourists.
In addition, a search was conducted of the academic literature, which added to the findings. The keyaim of this part of the report is to document trends within the industry and the current data collectionpractices. This leads to identification of gaps in the statistics on the Meetings Industry that inhibit aconsistent and reliable evaluation of its economic importance.
2.1 Trends in the Global Meetings Industry
The Meetings Industry has three main components that will be examined here:
• meetings and conferences,
• exhibitions, and
• incentives.
Of these three key segments, the meetings and conference component has been examined more often,while the exhibitions and incentives components have been relatively under-researched. That said,there are many inconsistencies in the ways meetings and conferences are measured and reported, andthe trends presented here illustrate these inconsistencies.
2.1.1 Trends in Meetings and Conferences
Weber and Ladkin (2004), in their study on trends affecting the convention industry in the 21st century,argue that the growth of the knowledge economy has enhanced the growth of the conventions industry.The continual need for information and updating of knowledge provides a strong platform forconventions as a key medium for the dissemination of such knowledge. A number of countries andconvention associations have recognised the importance of meetings and conventions in this growth ofthe knowledge economy and have attempted to evaluate the size and scope of the industry. Thesestudies have been undertaken at varying levels of complexity.
Unfortunately, however, these evaluations have been undertaken in isolation and so comparing theresults and making global estimations is difficult. To illustrate the difficulties, Table 1 provides asummary of some of the most recent evaluations of the industry.
Chapter 2
Global Overview of the Industry

6 Measuring the Economic Importance of the Meetings Industry
Table 1 Some recent meetings industry evaluations
The majority of these reports indicate an upturn in the Meetings Industry for 2005 after some years ofdecline. The exception to this is the report by The Union of International Associations (UIA). (TheBrookings Institute evaluation also predicts a decline, but this was written from the perspective of theinvestment climate in relation to convention centres.) The UIA report highlights the definitionalproblems that exist in the industry. The UIA criteria for an international meeting are:
• a minimum of 300 participants,
• lasting a minimum of three days, and
• with representatives from at least five different countries.
A definition such as this only allows data to be collected from a select group of meetings and does notprovide a more general overview of the industry. In many ways, such a definition disadvantages theMeetings Industry, since it narrows the scope of industry activity.
One report, however, conducted annually by the ICCA, International Association and CorporateMeetings Market: Statistics Report, does attempt to bring some consistency into the reporting of theMeetings Industry, and the definition of international meetings1 used by ICCA has been adopted by theUNWTO when collecting Meetings Industry data for its Tourism Market Trends. This definesinternational meetings as having a minimum of 50 participants, be held regularly and rotate among atleast three different countries. The data collected in the ICCA annual reports have been collated andsummarised here to provide some trend data for the industry.
Meetings industry
evaluation report Source and frequency of report Snapshots from the evaluation
State of the Industry
2005
Successful Meetings
Bi annual
“For the last few years, the Meetings Industry as a
whole seemed like a seriously ill patient.” (p. 1) 2005
looks promising: The majority of planners expect
meeting size and frequency to increase (p. 2)
Future Watch 2004 Meeting Professionals
International 2004 (MPI)
Annual
“In a positive indicator for international business travel,
USA planners expect an 11% growth in international
meetings in 2004, twice that of 2003. Overall predicted
international meetings by European planners are
about the same in 2004 as in 2003. The difference is the
significant increase in projected travel to the United
States with European planners indicating a 50% rise in
travel to USA destinations, up to 9% vs. 6% of all
meetings last year.
International
Meetings Statistics
for the Year 2004
Union of International
Associations (UIA)
Annual
“While two year projections suggest a levelling out, the
number of meetings already scheduled for 2005 is
–22% lower than the same time last year; this suggests
a downturn for 2005” (p. 2)
The Realities of
Convention Centres
as Economic
Development
Strategy 2005
Brookings Institute
Annual
“The overall convention marketplace is declining in a
manner that suggests that a recovery or turnaround is
unlikely to yield much increased business for any
given community, contrary to repeated industry
projections.” (p. 1)
1 International meetings are defined by ICCA as having a minimum of 50 participants, be held regularly and rotate among atleast 3 different countries.

2000 2001 2002 2003 20040
500
1.000
1.500
2.000
2.500
7Global Overview of the Industry
2.1.1.1 Trends in the international Meetings Industry
2.1.1.1.1 Demand
The research by ICCA on the trends in the international Meetings Industry provides consistentlongitudinal data on this component of the industry. The data are important in that they use a consistentdefinition and are collected from the six global UNWTO tourism regions. In using these data, it ispossible to examine the trends over time and location as well as aligning the Meetings Industry withinthe tourism industry. This enables comparisons of, for example, meetings visitors to leisure visitors. Thenumber of international meetings held globally over the 2000-2004 period is presented in Figure 1.
Figure 1 The number of international meetings by region (ICCA statistics adapted from UNWTO)2000-2004
Source: ICCA statistics adapted from UNWTO, 2005, Basic Introductory Report: The Meeting Conventions Market in the Americas’,
International Seminar on MICE Tourism and Business Tourism, World Tourism Organisation, Chile, 25-26 May 2005.
As illustrated in Figure 1, there appears to have been a decrease in the number of internationalmeetings over the last five-year period. The decrease in the number of international meetings isparticularly marked in Europe, although each region shows a drop in numbers.
It is argued, however, that the Meetings Industry is cyclical in nature (Weber and Ladkin, 2004;UNWTO, 2005) and in arguing this, the UNWTO report suggests that the year 2000 is the peak of afive year cycle. The report further argues that the ICCA 2005 results show a significant improvement innumbers and it states that “2005 […] looks as if it will be an excellent year – the best since the previousworld peak figure in 2000” (p. 3).
In providing reasons for the variation in the industry, the report suggests that there was a general declinein the world economy; the impact of events such as September 11, SARS and the Iraq war curtailedtravel; and, there were budgetary restrictions within some important industries, such aspharmaceuticals.
Although there appears to have been a decrease in the number of events during the 2000 to 2004period, the numbers of attendees appear to have increased. Figure 2 illustrates the trend in the numberof attendees to international meetings.
Europe
Asia
North America
Latin America
Australia/Pacific
Africa

2000 2001 2002 2003 20040
200
400
600
800
1.000
1.200
1.400
1.600
8 Measuring the Economic Importance of the Meetings Industry
Figure 2 Average numbers of participants in meetings by region (ICCA statistics adapted fromUNWTO) 2000-2004
Source: ICCA statistics adapted from UNWTO, 2005, Basic Introductory Report: The Meeting Conventions Market in the Americas’,International Seminar on MICE Tourism and Business Tourism, World Tourism Organisation, Chile, 25-26 May 2005.
The numbers of attendees to international meetings in North America rose substantially in 2004,following the continuous decline from 2000. Industry sources suggest that visa difficulties for thoseentering the USA, for example, may have contributed to this fall in numbers, with these restrictionsbeing eased in 2004. By 2004, the number of participants in international meetings had increased inall but the Latin America region. It is also interesting to note that the growth in the size of meetings wasin the smaller meetings category (50-249 participants), which grew by 37% (ICCA, 2004).
Another important variable for examining trends in the industry is the duration of the meeting. The trendhas been for shorter meetings and in 2004, the average duration for international meetings was 4.2days, the lowest average for the past 10 years (ICCA, 2004). These statistics are confirmed in otherstudies such as the Australian study by Deery et al (2005), the research on Israel conference tourism(Sultan, Ditzan and Darsa, 2002) and the Korean Meetings Industry study by Kim et al (2003).
2.1.1.1.2 Supply
The growth of the international Meetings Industry can be illustrated through a discussion of the supplyside of the industry. With regard to the supply of convention facilities and convention capacity, thefollowing discussion is structured according to the five regions identified by the UNWTO. The data aretaken from the Tourism Market Trends, 2005 Edition (UNWTO). Appendix A of this report provides asummary for each country within these regions.
Africa
The report on the supply of convention facilities is divided into North and South Africa. In North Africa,countries such as Morocco and Algeria have substantial facilities for the Meetings Industry. Many of thecountries have conference facilities that could host between 400 and 3,000 conference delegates andmost have high quality accommodation nearby the convention centre. In the South Africa region, therewould appear to be stronger development of the industry – Botswana, Kenya and Mozambique haveall acquired new conference centres. In some areas, however, such as Eritrea, there are constraints onthe growth of the industry due to the frequency, capacity and cost of flights into the country. Littleinformation is provided on the impact of political unrest in these areas on the Meetings Industry.
Latin America
North America
Australia
Africa
Asia
Europe
9Global Overview of the Industry
Americas
Some regions, such as the Americas, have collected data on the main congress and convention centresin the key areas of the region. These data are presented in Appendix B and although it provides asnapshot of the size and location of key centres, it unfortunately does not provide a full picture of thesupply side in this region. The UNWTO report, The Meeting Conventions Market in the Americas(2005b, p. 45), suggests that “while the more mature parts of the region have seen little growth insupply, there has been a considerable amount of activity in the Caribbean, Central America and SouthAmerica.”
Asia and the Pacific
One of the main Asian convention destinations is Hong Kong, with its Hong Kong Convention &Exhibition Centre of 64,000 m2. In addition, Macao, China and India have increased their capacity forholding large conventions, with major destinations being Beijing, Shanghai, New Delhi, Agra,Bangalore, Chennai and Mumbai. In Oceania, some of the Pacific Islands such as New Caledonia andFiji are expanding their convention facilities while Australia and New Zealand both provide acomprehensive range of convention properties.
Europe
Europe is traditionally one of the key locations for the Meetings Industry. Many European countrieshave state-of-the-art facilities and the easy access to these countries make them favoured MeetingsIndustry destinations. It is a highly competitive environment. France, for example, currently has 120convention centres, making it the top European country in terms of facilities. Those countries thatprovide value-added conference facilities, such as the Netherlands and Spain, have excellentinfrastructure with a wide range of product. In addition, countries which are new to themeetings/conference industry, such as Estonia and Andorra, are developing their Meetings Industryfacilities and offering different types of facilities.
Middle East
According to the UNWTO (2005b), Dubai offers the most comprehensive Meetings Industry supply inthe Middle East. Other countries in this region, however, such as Saudi Arabia, Bahrain and Syria, alsohave excellent facilities that compete strongly with other destinations.
2.1.2 Trends in Exhibitions
2.1.2.1 Demand
A global overview of the exhibition industry is even more difficult to provide. While there is generalagreement on the definition of exhibitions2, and the Convention Industry Council’s (CIC) definitionpresents an example of this, there is little global information on the trends in this sector. The industrytends to assess its performance on the size of the space used for exhibitions, but there is no consistencyin the boundaries of these measures.
2 Convention Industry Council definition of exhibition: 1) An event at which products and services are displayed. The primaryactivity of attendees is visiting exhibits on the show floor. These events focus primarily on business-to-business (B2B) rela-tionships. 2) Display of products or promotional material for the purposes of public relations, sales and/or marketing.

10 Measuring the Economic Importance of the Meetings Industry
A study undertaken on the South African Exhibition sector (Heath et al, 2005) and that undertaken inAustralia (Deery et al, 2005) show some trends that could be extrapolated to the global situation. InSouth Africa, for example, the average number of exhibitions per exhibition organiser increased from1.97 in 2001 to 2.2 exhibitions per organiser in 2004. The majority of exhibitions (77%) take placeannually, which is consistent with the Australian situation (73% in 2003).
Paralleling trends in the international Meetings Industry, the actual number of show days declined from4.86 days in 2002 to 4 days in 2004. This 4-day average was also in line with international trends inthe exhibition sector with a 3.7 days average duration in the United States in 2004 and 3 days durationin Australia in 2003 (Heath et al, 2005).
In an attempt to obtain consistent data from the USA and Canadian exhibition sectors, the Centre forExhibition Industry Research (CEIR) has developed an Exhibition Industry Index which measures arange of indicators of the industry’s development. This provides data for the North American scene butdoes not provide any global overview.
2.1.2.2 Supply
The information provided on the supply side of the exhibition sector is somewhat limited andinconsistent in the way it is reported. In Africa, for example, the UNWTO reports that while places suchas Tunisia, Zimbabwe and Ghana have dedicated facilities for exhibitions and fairs, other countrieswithin the region appear to use convention centres and other spaces such as cultural and sportingcentres for the purposes of exhibiting.
Within the Americas region, there appears to have been considerable growth in the exhibition sectorwith countries such as Mexico, Cuba, Curacao, Brazil, Chile, Barbados and Bermuda all expandingtheir facilities. The more mature markets, such as North America, do not appear to have grown theexhibition component substantially.
The Asia and Pacific region possesses significant exhibition facilities with countries such as Hong Kong,China and India being among the largest providers of exhibition space. Although there was a decreasein the number of exhibitions in Hong Kong due to the SARS outbreak, the sector appears to haverecovered and a new exhibition centre has been completed.
Europe has traditionally held some of the largest and most comprehensive exhibitions in the world. Inparticular, Germany has six very large exhibition locations while countries such as the UnitedKingdom, Luxembourg and Monaco have increased their exhibitions’ capacity.
Finally, it is the Middle East that has increased its profile within the exhibition arena. In particular, thehigh-tech, purpose-built Dubai Airport Exhibition Centre and the Bahrain International ExhibitionCentre have increased the Middle East exhibition capacity.
In summary, the exhibition sector appears to be following similar trends to the international MeetingsIndustry, with predicted growth in exhibition events, but a decrease in the duration of the exhibitions.
One of the greatest challenges for the exhibition industry is the increase in competition globally withthe emergence of countries such as China, where there are 57 new convention and exhibition centrescurrently under construction, Dubai, which is planning a dedicated city for exhibitions spread over 74acres, and India, which has five new convention and exhibition centres planned (Tourism Australia,2005). For the smaller exhibition countries, such as South Africa and Australia, there is an opportunityfor strategic regional alliances to combat such competition.

11Global Overview of the Industry
2.1.3 Trends in Incentives
Of the three key components of the Meetings Industry, the incentives sector is the least researched.Corporations implement incentive programs to drive sales, increase profits, improve service, enhancemorale, retain staff or provide high-profile recognition.
The level of secrecy surrounding this component largely explains the lack of research and, as stated inthe Sri Lankan Convention Bureau Report 2004 (p.3), “The Incentive Travel figures had been left outonce again in view of the reluctance of producing such data with the perception that informationprovided will be detrimental to their business and/or inability to separate incentive travel figures byhotels from general tourism data“. Incentive Travel is regarded, within the Meetings Industry, as thehighest yielding sector of the industry. The world wide incentive market is a ‘multi-billion dollar globalindustry’. (The Society of Incentive & Travel Executives (SITE)), 2004.
While it is difficult to provide world-wide trends, there are common elements in the changes occurringin the industry around the world. For example, the shortening of the duration of incentive programsfrom seven days to an average of four days is recorded in the USA (SITE, 2005) and 5.1 days in Australia(Deery et al, 2005). In a comprehensive study undertaken by the Malta Tourism Authority on theincentive sector in 2000-2001, incentive program duration had already decreased to four days duringthis period.
The incentive travel sector is probably the most vulnerable to volatility in world events. According tothe Incentive Federation’s Incentive Study 2003, of the respondents who did not use incentives in thepast 2 years, a concern about cost was the main reason for their companies not using incentives. Otherconcerns included difficulties in making the program fair, uncertainty of program outcomes,uncertainty about the kind of incentives to offer, not knowing enough about incentive programs or howto measure results, administration, legal/liabilities and management resistance.
The Australian study (Deery et al, 2005) found that a number of those organizations involved in theincentive travel industry had lost business for a variety of reasons. These included that companies werechoosing cheaper options, the impact of world events such as SARS, September 11, and the Balibombing, additional competition, the non availability of flights, the destination’s inability to meet needsof participants, the distance barrier and visa problems.
In summary, the incentive travel area is a lucrative, yet volatile, component of the Meetings Industry.While this component is an extremely competitive one as new destinations replace older, less attractiveand potentially less safe destinations, new markets such as China and India are emerging. Thechallenge for those involved in the incentive travel component is to attract these new markets – whichtend to be presently lower yield markets- into longer stay programs.
2.2 Current Data Collection Practices
Data are collected on the Meetings Industry in a myriad of ways, and this section summarises thetechniques used in existing studies.
However, there is value in considering the components of the Meetings Industry to provide a contextfor the discussion. A simple model of the meetings industry is presented in Figure 3.

12 Measuring the Economic Importance of the Meetings Industry
Figure 3 The Meetings Industry
The Meetings Industry can be regarded as having two broad dimensions: the demand side and thesupply side. For the purposes of this study, the demand side is defined as the delegates (the consumers)– or participants, as they will be referred to in this report – and the supply side is defined as comprisingthe organiser, the venue and the host organisation. While the activities of suppliers of other goods andservices, e.g. accommodation, transport, etc., that delegates use in conjunction with their attendanceat the meeting will be measured in assessing the economic contribution of meetings’ participants, thesesuppliers are not components of the Meetings Industry. The overlapping hashed lines above indicatethat in some cases the host organisation acts as the organiser, and in some cases, the venue will act asthe organiser. This has implications for data collection.
Demand side research collects data about the delegates in terms of their total numbers, their origin andexpenditure on registration and other goods and services. Supply side research collects data about themeetings, the organisers, the numbers of participants, and the costs and revenues associated withhosting/organising the meeting.
A complete picture of the industry requires data from both the demand and supply sides. A demandonly approach does not identify the full economic contribution of the industry, while the supply sideapproach does not identify additional expenditure by participants incurred in the host region.
2.2.1 Data Collection by Global Agencies
The UNWTO, in its Tourism Market Trends 2004 survey, collates data by asking each country whetherstatistics are collected on international meetings in their country. No definition of the Meetings Industryis provided as none existed at the time of the data collection. If the answer is ‘yes’, there is a smalldescription of the importance and size of the industry and another on the evolution of the MeetingsIndustry.
Typically, these are demand estimates, with countries providing an estimate of the size of theirinternational meetings tourism as a percentage of total inbound tourism. The difficulties with thismethod are:
Demand Supply
DelegatesOrganiser Host Organisation
Venue
Other Goods and
Services e.g. transport,
accommodation,
restaurants, retail
Pay other suppliers for
various goods and services
Pay registration
fee to organisers
Exhibitors

13Global Overview of the Industry
a) there is no consistent definition used for the meetings industry and so the estimates of the size ofmeetings activity vary widely from country to country, and
b) these figures do not include the domestic meetings market which can be a sizeable market.
Other global agencies that collect meetings industry data are the specific industry groups such as ICCA,MPI, SITE, UIA and Reed Exhibitions. These organisations issue regular reports including:
• FutureWatch (MPI)
• The State of the Industry (Successful Meetings)
• International Association Meetings Market: Statistics Report (ICCA)
• Five Year Trends Report (EIBTM)
• Economic Impact Study (CIC)
• International Meetings Statistics (UIA)
• The SITE Foundation Industry Reports (SITE)
While these organisations collect regular and consistent data, it tends to be in a specific context, forexample, purely international meetings (ICCA, UIA, MPI) or the incentive industry (SITE). By and large,these reports are not intended to provide an economic evaluation of the meetings component on whichthey are reporting. Only a few reports contain definitions and little information is provided on themethods used.
While these reports provide a ‘snapshot’ for industry practitioners, it is difficult to discern whatassumptions underpin the measurements and analysis, therefore making them of little use in trackingconsistent data for use in an overall evaluation of the industry. While the reports are useful, they alsohighlight the need for a more consistent data collection process.
2.2.2 Data Collection by National Tourism Organisations
A number of national studies have been undertaken on the Meetings Industry or components of theindustry. These appear to be able to collect more accurate data on both the demand and supply sides,and they generally provide greater information on the methods used. These reports, by and large,provide sufficient detail to enable planning by the tourism authorities. Some of the reports collected forthis study include:
• Estudio Del Mercado De Reuniones en España 2003 (Instituto de Turismo de España)
• USA Business Traveller to Canada Study Summary 2002 (Canadian Tourism Commission)
• British Conference Venues Survey 2003 (British Tourist Authority)
• Characteristics of Conference Tourism in Israel (Israel Ministry of Tourism)
• National Business Events Study 2005 (Australian Sustainable Tourism Co-operative ResearchCentre)
• The Conference and Incentive Travel Market in Malta for the Years 2000-2001 (Malta TourismAuthority)
2.2.3 Convention Bureaux and City Reports
As the level of data collection moves from the global to the region or city, there tends to be greaterlevels of detail in the reports with regard to data collected and the level of analysis. Again, these studiesgenerally consider both the demand and supply aspects. Reports such as those by the FinlandConvention Bureau and the Sri Lankan Convention Bureau illustrate that the bureaux have access tothe industry and have the links to obtain the data.

14 Measuring the Economic Importance of the Meetings Industry
2.2.4 Summary of Previous Studies
In order to provide some understanding of the ways in which data are collected and used, a numberof more detailed studies investigating the value of the Meetings Industry are summarised here. Thestudies provided to the research team that are included in this summary are:
• Estudios de Productos Turisticos: Spanish National Tourism Board
• The MICE Industry: Sri Lankan Convention Bureau
• The World of Meeting Statistics: Finland Convention Bureau
• Netherlands Board of Tourism & Conventions
• The Economic Impact of Business Conventions in Toronto in 2002: Ontario Ministry of Tourismand Recreation
• Estimating the Direct Expenditure Benefits of Conferences to a Local Area: British Tourist Authority
• Survey of economic benefits: France Congres
• Characteristics of Conference Tourism in Israel: Israel Ministry of Tourism
• National Business Events Study: An Evaluation of the Australian Business Events Sector: AustralianSustainable Tourism Co-operative Research Centre
Further details with regard to these studies are provided in Table 2.
Table 2 Examples of national and regional economic studies of the Meetings Industry
Country Method Collection agency Categories
Australia • Online survey;
• self-complete mail-
out questionnaires
Tourism Australia
and STCRC
• Registration fee;
• Local ground transport overnight
accommodation at the conference;
• overnight accommodation before and after the
conference;
• pre/post conference tours;
• additional expenditure by accompanying
persons;
• restaurants and cafes airfares within Australia;
• shopping.
ECONOMIC CONTRIBUTION: YES
Britain • Face-to-face
interviews with
delegates
• post-event
questionnaires
• conference
organiser
questionnaires
British Tourist
Authority
• Registration fee;
• overnight accommodation at the conference;
• overnight accommodation before and after the
conference;
• travel to the United Kingdom;
• travel in the United Kingdom to the conference;
• local travel at the destination;
• food and drink;
• evening events and entertainment;
• shopping and gifts; day trips and/or pre/post
conference tours;
• additional expenditure by accompanying
persons.
ECONOMIC CONTRIBUTION: YES

15Global Overview of the Industry
Country Method Collection agency Categories
Canada
(Toronto)
• Data collected
through survey
method
Ontario Ministry of
Tourism and
Recreation
• Travel services;
• public transport;
• private transport (rental and operation);
• local transportation; accommodation;
• food and beverage (at stores and at
restaurants);
• recreation and entertainment;
• retail (clothing and other).
ECONOMIC IMPACT: YES
Canada
(USA
Business
Traveller to
Canada)
• Survey of USA
business travellers
to Canada
Canadian Tourism
Commission
• Trip planning and information seeking;
• length of stay;
• demographics;
• association and corporate sectors;
• recent trip information;
• additional nights stayed;
• ratings of Canada as a business venue.
ECONOMIC IMPACT: NO
Finland • Information
gathered from
venues on a
monthly basis
(internet
questionnaire)
• Event organisers
• Weighted to
national statistics’
collections
Finland Convention
Bureau
• Number of meetings and participants;
• average size, duration, location and seasons;
• meeting sales figures of venues;
• sales figures of PCOs, DMCs and event
organisers;
• organiser expenditure;
• delegate expenditure and travelling costs.
ECONOMIC IMPACT: YES
France • Data collected at
convention centres
France Congress • Economic evaluation includes direct and
indirect benefits;
• induced benefits;
• jobs;
• days of attendance by participants;
• overnight stays.
ECONOMIC IMPACT: YES
Hungary • Survey of congress
organisers, venues
and organisations
Hungarian National
Tourist Office
• Numbers of international meetings;
• international exhibition;
• average number of nationalities;
• average length of conferences;
• numbers of conferences organised by PCOs;
• location of conferences;
• types of venues;
• subject matter;
• seasonality;
• nationality of meeting planners;
• expected and factual number of participants.
ECONOMIC IMPACT: NO

16 Measuring the Economic Importance of the Meetings Industry
Country Method Collection agency Categories
Israel • Data reported by
conference
organisers to the
Ministry of Tourism
• survey of inbound
tourists
Israel Ministry of
Tourism
• Characteristics of the tourists (age, family group
size, nationality);
• length of stay;
• places visited; purpose of visit;
• expenditure on various items (not provided);
• opinions about tourist services in Israel;
• characteristics of international meetings by
month, place and subject.
ECONOMIC IMPACT: NO
Netherlands • Data collected
through survey
method
Netherlands Board
of Tourism &
Conventions
• Total number of conventions;
• average duration of convention;
• average number of participants;
• total number of participant days.
ECONOMIC IMPACT: NO
Norway • Data collected on a
monthly basis from
hotels
Central Bureau of
Statistics
• Number of bednights and roomnights;
• nationality;
• purpose of visit.
ECONOMIC IMPACT: NO
Spain • Survey of cities
categorised by
population
Spanish National
Tourism Board
Supply:
• Number of meetings and participants;
• daily expenditure of participants;
• duration of stay.
Demand:
• registration costs;
• daily accommodation expenditure;
• daily expenditure;
• % of delegates that attended with partner;
• average number of companions;
• duration of the convention;
• total number of nights stayed in the city;
• nights additional to the convention.
ECONOMIC IMPACT: YES
Sri Lanka • Data collected from
meetings/conference
organisers through
interviews and
questionnaires
Sri Lanka
Convention Bureau
• Number of national and international
conferences and meetings;
• number of exhibitions;
• air travel;
• pre and post tours;
• shopping;
• equipment and material;
• food and beverage;
• revenue.
ECONOMIC IMPACT: NO
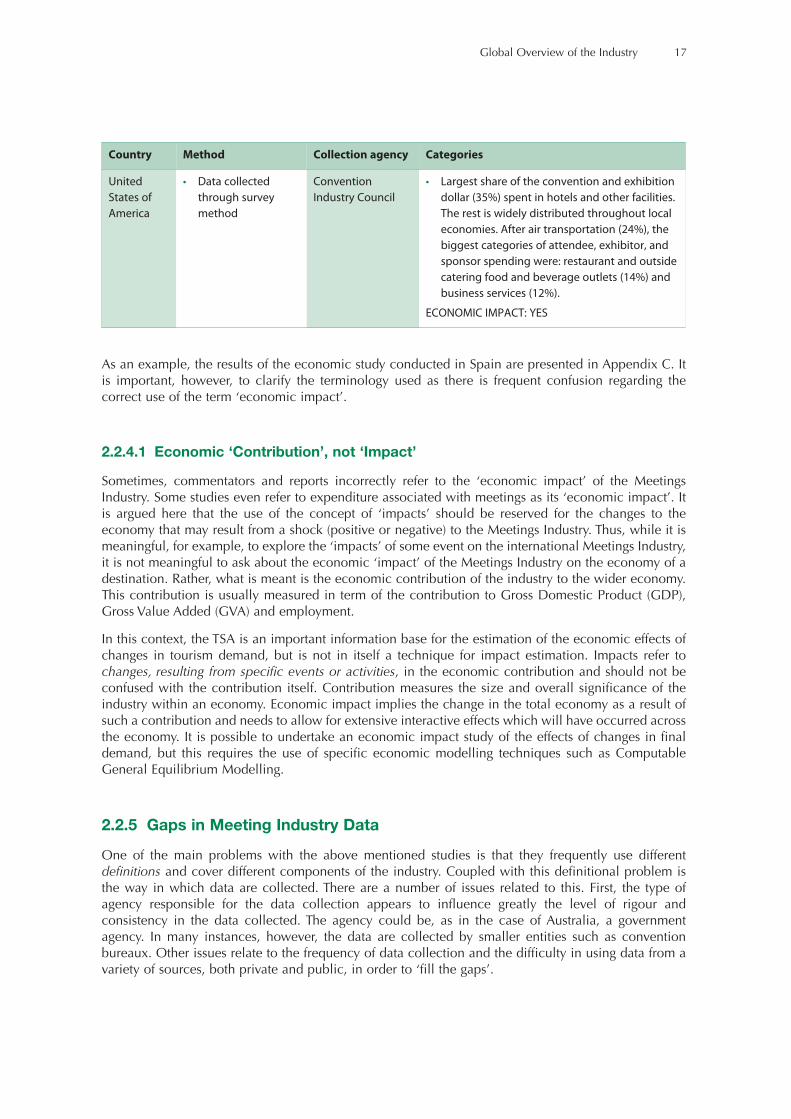
17Global Overview of the Industry
As an example, the results of the economic study conducted in Spain are presented in Appendix C. Itis important, however, to clarify the terminology used as there is frequent confusion regarding thecorrect use of the term ‘economic impact’.
2.2.4.1 Economic ‘Contribution’, not ‘Impact’
Sometimes, commentators and reports incorrectly refer to the ‘economic impact’ of the MeetingsIndustry. Some studies even refer to expenditure associated with meetings as its ‘economic impact’. Itis argued here that the use of the concept of ‘impacts’ should be reserved for the changes to theeconomy that may result from a shock (positive or negative) to the Meetings Industry. Thus, while it ismeaningful, for example, to explore the ‘impacts’ of some event on the international Meetings Industry,it is not meaningful to ask about the economic ‘impact’ of the Meetings Industry on the economy of adestination. Rather, what is meant is the economic contribution of the industry to the wider economy.This contribution is usually measured in term of the contribution to Gross Domestic Product (GDP),Gross Value Added (GVA) and employment.
In this context, the TSA is an important information base for the estimation of the economic effects ofchanges in tourism demand, but is not in itself a technique for impact estimation. Impacts refer tochanges, resulting from specific events or activities, in the economic contribution and should not beconfused with the contribution itself. Contribution measures the size and overall significance of theindustry within an economy. Economic impact implies the change in the total economy as a result ofsuch a contribution and needs to allow for extensive interactive effects which will have occurred acrossthe economy. It is possible to undertake an economic impact study of the effects of changes in finaldemand, but this requires the use of specific economic modelling techniques such as ComputableGeneral Equilibrium Modelling.
2.2.5 Gaps in Meeting Industry Data
One of the main problems with the above mentioned studies is that they frequently use differentdefinitions and cover different components of the industry. Coupled with this definitional problem isthe way in which data are collected. There are a number of issues related to this. First, the type ofagency responsible for the data collection appears to influence greatly the level of rigour andconsistency in the data collected. The agency could be, as in the case of Australia, a governmentagency. In many instances, however, the data are collected by smaller entities such as conventionbureaux. Other issues relate to the frequency of data collection and the difficulty in using data from avariety of sources, both private and public, in order to ‘fill the gaps’.
Country Method Collection agency Categories
United
States of
America
• Data collected
through survey
method
Convention
Industry Council
• Largest share of the convention and exhibition
dollar (35%) spent in hotels and other facilities.
The rest is widely distributed throughout local
economies. After air transportation (24%), the
biggest categories of attendee, exhibitor, and
sponsor spending were: restaurant and outside
catering food and beverage outlets (14%) and
business services (12%).
ECONOMIC IMPACT: YES

18 Measuring the Economic Importance of the Meetings Industry
Recommendation on the Data Collection Agency for the Meetings Industry
It is recommended that data relating to the Meetings Industry are collected by government agencies aspart of a national statistics collection. This will ensure that the data relate to the country as a whole andthat consistent and rigorous methods are used. National statistics’ agencies are generally viewed witha level of credibility and authority, and may have the legal power to compel the provision of data.Where such legal power does not exist, it is suggested that convention bureaux (or appropriate industryassociations) be employed to encourage responses by promoting the benefits of a more informedindustry.
2.3 Definitional Issues
The plethora of definitions – and in many cases, lack of definitions – is widely acknowledged withinthe Meetings Industry. The debates focus on a number of components of the definition. These are:
• The nomenclature of the industry
• Definitions of meetings:
- The aims of a meeting
- Meeting venues
- Meeting size
- Meeting duration
2.3.1 Nomenclature for the Industry
The definitional issues relate to a number of areas including the naming of the industry as a whole. Theindustry has most commonly been named the Meetings, Incentives, Conventions and Exhibitions(MICE) Industry. This nomenclature has the disadvantage of presenting the industry as a collection ofdiscrete parts rather than in any holistic manner. The UNWTO has used the term ‘Meetings Industry’and ‘International Meetings Industry’ in what appears to be an interchangeable fashion and these termsencompass the organisation, promotion, sales and delivery of events for corporate, association andgovernment meetings, corporate incentives, seminars, congresses, conferences, conventions, events,technical visits, exhibitions and fairs.
The UNWTO has proposed that a new International Standard Industrial Classification (ISIC) categorybe developed to represent the activities of the Meetings Industry. (This is discussed in more depth inSection 4.5). The new ISIC category represents an attempt to identify an industry representing theMeetings Industry, through the addition of a new class, viz. 8230 ‘Convention and trade showorganisers’. This industry includes: the organisation, promotion and/or management of events, such asbusiness and trade shows, conventions, conferences and meetings, whether or not including themanagement and provision of the staff to operate the facilities in which these events take place.
Within the brief for this study there is a proposed title and definition for the industry. This definition,proposed by the UNWTO, ICCA, Reed Exhibitions and MPI, calls the industry ‘The Meetings and EventsIndustry’. In consultation with key industry participants, however, the title of the ‘Meetings Industry’appears to have greater acceptability. In general, the term ‘event’ is perceived to be too broad to beused in this context. The definition that is proposed by UNWTO, ICCA, Reed Exhibitions and MPI ismore encompassing than the new ISIC definition, detailing the clients (association, government andcorporate) and including the incentives area. It would be useful for the industry to further promote theadoption of this definition.
19Global Overview of the Industry
Recommendation for the Industry Name
Given that key industry stakeholders have suggested the name of the industry to be the ‘MeetingsIndustry’, the consultants recommend this term be adopted since the key component of any businessevent is a meeting of people. This title is inclusive of the meeting components such as conventions,congresses, conferences, symposia, seminars, company general meetings and events such as public ortrade shows, exhibitions, and incentive events that include a meeting booked through a convention ortrade show organiser.
2.3.2 Definition of Meetings
There are a number of components of meetings that need to be considered in order to facilitate thecollection of data that can be used for accurate measurement of the industry. These are addressed underthe headings of:
a) aims of a meeting,
b) meeting venue,
c) meeting size, and
d) meeting duration.
2.3.2.1 The Aims of a Meeting
There are a number of aims of a meeting that are articulated in the literature, both academic researchand industry reports alike. The common elements of these definitions are that attendance at an eventmust be for a common purpose with a number of other participants with whom to share ideas, socialiseand discuss. Frequency can be on an ad hoc basis or according to a set pattern. The key terms used inthe definitions are ‘to meet’, ‘to confer’, and ‘to share information’. A summary of definitions can befound in Appendix D and, based on the review of the literature, the consultants recommend thefollowing definition be adopted.
Recommendation for a Definition of a Meeting Based on its Aims
The ICCA definition encompasses most of the key elements of all the definitions. It is thereforerecommended that the definition of the aim of a meeting be:
A meeting is a general term indicating the coming together of a number of people in one place, toconfer or carry out a particular activity. The key purposes of meetings are to motivate participants andto conduct business. Frequency can be on an ad hoc basis or according to a set pattern, as for instanceannual general meetings, committee meetings, etc.
Within the literature, definitions are also offered for other categories within the Meetings Industry suchas conferences, congresses and conventions. All these definitions differ subtly from each other and asummary of them has also been provided in Appendix D as part of the overview of definitions. For thepurposes of this exercise – i.e. to provide a working definition for meetings that will assist in theevaluation of the Meetings Industry – the subtle differences between these various meeting types arenot considered important.
2.3.2.2 Meeting Venue
Some definitions include the need for the meeting to be held in specific types of venues. For example,Weber and Chon (2002) state that “a meeting should be held at a purpose built facility”. The BusinessEvents Council of Australia states that business events must be ‘held in a specific venue or venues’. The

20 Measuring the Economic Importance of the Meetings Industry
British Tourist Authority uses the definition of a conference as an ‘out of office meeting of at least sixhours’.
The issue for debate then is what constitutes a specific venue? The National Business Events Study(Deery et al, 2005) provided a list of the types of venues that were not included in the data collection.These exclusions covered a range of venues where business events were not seen to be a core part oftheir overall business (see Appendix E). These included venues such as scout halls, motels andrestaurants. The definition of a meeting, therefore, would also need to include a criterion on the typeof venue used, but this may vary from country to country.
Recommendation for the Inclusion of the Type of Venue for Meetings in the Definition
It is recommended that data be collected on meeting activity from contracted venues where there ispayment (or in-kind payment) for the use of the venue for meetings (and related events such asexhibitions and incentive activities).
For the purposes of data collection, meetings not held in commercial venues should not be consideredas a meeting. This is because of the difficulty in obtaining data from these non-commercial venues. Thistreatment is also justified by the fact that the holding of such meetings is not a business activity of thevenue.
2.3.2.3 Meeting Size
The issue of the minimum size of a meeting to fit within the criterion has been well debated by theindustry. Different organisations such as ICCA and UIA, have set different minimum numbers for ameeting to be included in data collections. From the numerous reports and research into the MeetingsIndustry, it is clear that the number of required participants at a meeting is the most contested criterion.Table 3 presents a variety of definitions.
Table 3 Size, duration/frequency and the number of countries involved in meetings
TypeNumberof parti-cipants
Duration/frequency
Number ofcountriesinvolved
Other Source
Meeting > 10 Finland Convention Bureau
> 10 Korea NTO
> 15 > 6 hours
< 2 days
Hughes 1988
> 15 - - Held in commercial
venue space
Meetings Industry Association
of Australia (MIAA)
Up to 250 On average
1 day
German Convention Bureau
International
Meeting
> 300 > 3 days > 5 countries > 40% foreign
attendees
Union of International
Associations (UIA)
- - > 4 countries > 45% foreign
attendees
MIAA
> 50 > 4 hours > 3 countries > 40% foreign
attendees
Instituto de Turismo de
España

21Global Overview of the Industry
While different definitions may be justifiable in themselves in different contexts, it is essential that acommon definition be developed to promote consistency internationally and to facilitate thecomparison of economic measures. However, it is quite arbitrary what the minimum number ofparticipants should be, and this issue will always be contentious.
The consultants suggest that data collection complexities would be reduced if no minimum size wasimposed, as survey respondents would not be required to filter out meetings which do not conform tothe criterion. It is also unlikely that meetings with very few participants would be held in commercialvenues, so the inclusion of this criterion in the definition essentially overcomes the need to agree on aminimum size for a meeting. However, the industry has traditionally defined meetings using aminimum size and may be reluctant to give up this practice. If this is the case then the smallestminimum should be adopted, that is, ten participants.
Recommendation for the Minimum Size of a Meeting
In order to obtain a comprehensive collection of data on all meetings, it is recommended to collectdata on meetings with ten participants or more.
2.3.2.4 Meeting Duration
As illustrated in Table 3, there is a range of suggestions for the minimum duration of a meeting, fromfour hours to three days. Again, the consultants would recommend no minimum duration, based on theargument that this reduces complexity in the data collection process, and that in practice it is unlikelythat a meeting of very short duration would be held in a commercial venue. However, if a minimumduration is seen as essential this should be as inclusive as possible – i.e. a half day or four hours.
2.3.2.5 International Meetings
With respect to the venue, size and duration of international meetings, there is no valid reason whythese should be defined differently than for meetings per se. The only difference between a meetingand an international meeting is that the latter attracts a substantial proportion of international delegates.Therefore, the number of countries and proportion of international delegates need to be considered.
In terms of the minimum number of participating countries required to meet the criteria of anInternational Meeting, the consultants suggest that there be participants from at least one country otherthan the host country.
TypeNumberof parti-cipants
Duration/frequency
Number ofcountriesinvolved
Other Source
International
Association
Meeting
> 50 regular
basis
(annually,
biennially)
> 3 countries ICCA
International
Board Meeting
> 10 Association must be
in the UIA Yearbook
UIA
Corporate
MeetingGathering of employees or representatives of a commercial
organisation. Usually, attendance is required and travel, room
and most meal expenses are paid for by the organisation.
CIC
Government
Meeting
An event at which attendees are civil servants, elected officials
or service providers to governmental entities.
CIC
22 Measuring the Economic Importance of the Meetings Industry
With regard to the percentage of international participants that are required to meet the definition,many of the definitions include percentages in the range of 40%-45%. This proportion may beappropriate in regions where countries are close geographically and cross border travel iscommonplace, such as Europe. However, for meetings held outside Europe this proportion seemsexcessive as many meeting with a far smaller proportion of international delegates would nonethelessbe regarded as international. The consultants recommend, therefore, that international delegates shouldcomprise a minimum of 20% of the total meeting numbers.
However, there may also be cases, particularly in large meetings, where this 20% criterion would failto identify meetings which attract large numbers of international delegates but where their numbersrepresent less than 20% of total participants. For example, a medical meeting of 2,000 participants heldin North America may have 200 international participants, but would fail to meet the criterion currentlyoffered. Consideration should be given to perhaps using a criterion based on an absolute number insituations such as this.
Recommendation for the Minimum Criteria of an International Meeting
An international meeting is defined as a meeting having a minimum of ten participants, of at least half-day duration, with participants representing at least one country other than the host country and witha minimum of 20% of all participants being of international origin. In the case of large meetings, anabsolute number of international delegates should be considered.

This chapter looks at the role that TSAs can play in the evaluation of the economic contribution of theMeetings Industry, and the issues that need to be considered in this process. A major aim of this reportis to discuss how these issues may be addressed.
Employing the TSA to estimate the economic contribution of the Meetings Industry involves measuringthe total contribution to the economy from people participating in meetings, together with theconsequent contribution made by the industry itself.
The structure of the TSA is designed to show the relationship between the demand for productsgenerated by tourism, and their total supply. The process for tourism involves identifying productsconsumed by tourists (or, the correct UNWTO term, ‘visitors’), such as accommodation services andmeals, and linking these products to the industries that produce them.
The UNWTO defines tourism as:
“the activities of persons travelling to and staying in places outside their usual environment, fornot more than one consecutive year for leisure, business and other purposes not related to theexercise of an activity remunerated from within the place visited.”
Information on the role tourism plays in national economies throughout the world is deficient, andcredible data concerning the scale and significance of tourism are needed. To address this, theUNWTO, in conjunction with the Commission of the European Communities-Eurostat, Organisationfor Economic Co-operation and Development (OECD) and United Nations Statistical Division), hasproduced the Tourism Satellite Account: Recommended Methodological Framework.
For purposes of the TSA, the UNWTO has identified a list of tourism characteristic activities/industriesas follows:
1. Hotels and similar
2. Second home ownership (imputed)
3. Restaurants and similar
4. Railway passenger transport services
5. Road passenger transport services
6. Water passenger transport services
7. Air passenger transport services
8. Transport supporting services
9. Transport equipment rental
10. Travel agencies and similar
11. Cultural Services
12. Sporting and other recreational services
These are industries which produce tourism characteristic products, defined below.
Chapter 3
Using the TSA to Evaluate the EconomicContribution of the Meetings Industry
© 2006 World Tourism Organization - ISBN 978-92-844-1195-5
24 Measuring the Economic Importance of the Meetings Industry
An ‘industry’ is normally regarded as ‘a group of establishments engaged in the same kind of productiveactivities’. The definition of the characteristic industries can vary across countries. (Note: The USA,Canada, Australia and New Zealand use the concept of ‘industry’ and Europe uses the concept of‘activity’.)
In the TSA, products are what are purchased by or for visitors. Activities (or industries) produceproducts. These products are classified as tourism characteristic, tourism connected and tourismspecific (related).
Tourism characteristic products are those products, which, in most countries, it is considered, wouldcease to exist in meaningful quantity or those for which the level of consumption would be significantlyreduced in the absence of visitors, and for which statistical information seems possible to obtain.
Tourism connected products are a residual category including those that have been identified astourism specific in a given country, but for which this attribute has not been acknowledged on a worldwide basis.
Tourism specific products are the sum of the two previous categories. In some countries these productsare called ‘tourism related’.
Another category is products which are consumed by visitors but which are not important enough tofall into the above categories. In the TSA, these are aggregated into a single category “Other”.
In order to measure demand (products consumed) information is required on purchases by or forvisitors. (Fixed capital formation and government collective consumption are not currently included forestimating value added, GDP or employment in the TSA although there is provision for them to beincluded in separate tables in the TSA).
Tourism consumption comprises, as well as consumption by leisure visitors, consumption by businessvisitors relating to a business trip. Such visitors may be conducting business on behalf of themselves ora private or public sector employer. In the System of National Accounts (SNA), such consumption istreated as intermediate consumption, but in the TSA, to fully reflect the full value of tourism demand,it is treated as tourism final consumption.
It is important to understand, however, that while the TSA is recognised internationally as an importantinformation base for the calculation of tourism’s contribution to the economy, the Meetings Industry isnot simply a subset of the tourism industry. The TSA defines a ‘visitor’ as ‘any person travelling to aplace other than that of his/her usual environment for less than twelve months and whose main purposeof trip is other than the exercise of an activity remunerated within the place visited’. A proportion ofthese ‘visitors’ will be ‘international’ while others (perhaps the majority) will be ‘domestic visitors’.
Thus, while some participants at meetings will meet the TSA’s criteria for a ‘visitor’, the majority ofmeeting participants may well be ‘local residents’ who reside within the city or immediate confines inwhich the meeting is being held and who do not meet the TSA’s ‘visitor’ criteria of travelling outsidetheir usual environment. While these participants are not visitors and thus their economic activitiesassociated with meetings are not included within the TSA, to omit the economic contribution of theseparticipants would be to significantly under-state the economic contribution of the Meetings Industryto the economy.
Because some of these meeting participants are not visitors, and their activity is not included in theTSA, this means that the TSA cannot be used directly to measure the activity of all meeting participants.As a result, revisions or additions to the TSA have to be made to measure the activity of all meetingparticipants.
However, the consultants believe that the TSA can still be usefully used to estimate the economiccontribution of the Meetings Industry. This requires a number of significant challenges to be overcome.
The discussion below will proceed in two main parts. The first part outlines how destinations mayemploy existing TSAs to estimate the economic contribution of meetings, with a discussion of the

25Using the TSA to Evaluate the Economic Contribution of the Meeting Industry
challenges this presents. The second part will explore the implications of the development of the newInternational Standard Industrial Classification of All Economic Activities (ISIC) category, 823Convention and Trade Show Organisers.
3.1 The Economic Contribution of the Meetings Industry has TwoComponents
There are two important aspects of the economic contribution of activities relating to meetings whichneed to be addressed.
Supply side measures relate to the size of the specific industry being considered – in this case thosefirms or agencies that fall within the specific definition of the ‘Meetings Industry’ which is adopted, forexample, under ISIC 823. We might regard these as comprising the core professional meetings’organising firms. These measures will include such variables as number of meetings held, employment,number of businesses involved in the Meetings Industry, contribution to GDP, etc. They will measurethe activity of the defined ‘Meetings Industry’, including that resulting from both visitor and non-visitordemand. They will not include activity in other industry sectors, such as accommodation, transport orcatering, which results from demand generated by meeting/events participants. They will also notinclude the activity of organising/hosting meetings where this activity is a secondary activity of abusiness, e.g. a large hotel, which will be included in the ‘Accommodation’ industry.
Demand side measures include such variables as expenditure by participants attending meetings,number of meetings’ participants, the origin of the participants, their demographic profiles and so on.They would also include demand from meeting/events participants for goods and services provided byindustries outside the Meetings Industry, e.g. for food, accommodation, entertainment, transport etc.Some of this demand will come from traditionally defined ‘visitors’ and already be accounted for undertheir various categories in the TSA. Other demand will come from local (non-visitor) participants inmeetings which are not included in the TSA measures.
The supply side and demand side measures are quite different, and it should be clear in the mind ofthe user what exactly is being measured. Each measure serves a different purpose. Estimating the totaleconomic contribution of meetings-related activity will involve both identifying the size of theMeetings Industry itself (the supply side), and also the total consumption of participants resulting fromtheir participation in meetings/events (the demand side).
3.2 Use of an Existing TSA to Provide an Indicative Estimate of theEconomic Contribution of the Meetings Industry
Under the System of National Accounts (SNA), industry size and economic significance are normallymeasured from the supply side only. In recent years, Tourism Satellite Accounts have been developedto estimate the economic contribution of the tourism sector to the economy. The TSA is a relatively newconcept in national accounting terms – it matches demand side activity of the relevant consumers (i.e.visitors) with the supply side activity of the industries meeting this demand.
A TSA extracts from the National Accounts the contribution which tourism makes to each industry ofthe economy, allowing measurement of the contribution of tourism to GVA and employment, andpermitting comparison with other industries which are listed in the core National Accounts. The TSAmeasures tourism consumption, and relates that to the total output of the tourism connected industries.This enables identifying and measuring the supply side activities of the ‘tourism industry’. Byaggregating the activity of each industry resulting from tourism demand, total ‘tourism industry’ activitycan be examined and compared to traditional industries in the national accounts.

26 Measuring the Economic Importance of the Meetings Industry
The TSA thus identifies tourism activities within the national accounting framework so that acomprehensive set of economic data on tourism can be compiled. Approximately 80 nations have nowdeveloped or are developing a TSA for their economy.
Measurement of the economic activity of industries in the SNA comprises only the direct activity ofeach industry. That is, the indirect or upstream activity, which flows from the activity of any industry, isnot incorporated in the size of that industry’s contribution to the economy. This same principle appliesto the TSA. So, for example, the TSA does not include the activity of suppliers to the accommodationindustry (food suppliers, cleaning services, electricity supply, etc.). It only includes the activity of thosebusinesses that directly supply goods or services to the consumer (the visitors).
Because of this, any use of the TSA to measure the economic activity of the Meetings Industry will notinclude the upstream activity resulting from the activities of this industry (e.g. providers of equipmentfor meetings, events, venue cleaning services, etc.). If this indirect contribution is required – to combinewith the measure of the direct activity of the industry to arrive at the full economic contribution ofmeetings’ activity – then further analysis is required.
The UNWTO has identified the potential benefits from development of a TSA as being to:
“Increase and improve knowledge of tourism’s importance relative to overall economic activityin a given country; provide an instrument for designing more efficient policies relating to tourismand its employment aspects; and create awareness among the various players directly andindirectly involved with tourism of the economic importance of this activity; and by extension itsrole in all the industries involved in the production of goods and services demanded by visitors”[www.unwto.org/statistics/tsa-project].
The TSA provides a framework that can be employed to produce similar benefits for the MeetingsIndustry by giving greater rigour and credibility to its measurement and improving awareness of theimportance of the industry. However, a number of difficulties arise in seeking to do this. These will beconsidered below.
3.3 Limitations of the Use of the TSA in Measuring Meetings’ Activity
As it currently stands the TSA cannot provide a reasonable measure, or estimate, of the size of meetingsactivity. This is primarily because meetings activity is not a sub-set of tourism activity, as discussedearlier. These two activities overlap, but neither is fully encompassed by the other. The great majorityof tourism activity is non-meetings activity, while a significant part – in some countries a majority – ofmeetings activity is activity of locals who are not visitors to the area, and thus whose activity is notincluded in the TSA.
Even if all meetings activity were encompassed in tourism (and the TSA), the TSA as it currently iscompiled would not be able to measure meetings activity. This is because extra data, which are notcurrently required for the TSA would be needed to measure meetings activity.
The basis for the TSA is a supply-use table which splits the economy into ‘tourism activity’ and ‘all othereconomic activity’. Meetings activity is not identified. The TSA calculates tourism ratios for productsand industries, i.e. what proportion of products and industries’ activities come from tourismconsumption. As consumption by meetings’ participants is completely different in level andcomposition from that of ‘visitors’, the TSA tourism ratios cannot be used to measure meetings activity.While the tourism ratios could be calculated for ‘Business visitors’, it is not known how these woulddiffer from the ratios which would apply to meetings participants. These would certainly differ,particularly as the consumption level and composition of non-visitor (i.e. local) meeting participantswould be significantly different from that of ‘Business visitors’.
To use the TSA to measure meetings activity, it would be necessary to collect extra data than are nowrequired for the TSA.

27Using the TSA to Evaluate the Economic Contribution of the Meeting Industry
On the supply side it would be necessary to collect economic data on those industries which areidentified as ‘meetings-characteristic industries’. The addition of a new category to the ISIC, which isdiscussed elsewhere in this report, will go a long way to addressing this.
However, the existence of relevant ISIC categories is not sufficient – it merely provides the statisticalindustry framework which facilitates the required data collection. National Statistical Offices would stillneed to be persuaded to collect the required data from these industries.
The collection of the extra supply side data would provide a basis for an estimate of the economicactivity of the Meetings Industry.
However, the framework for supply side data collection, e.g. ISIC or a national derivative, isconstructed so that each business is allocated to the industry category which reflects its primary activity.Many businesses also have secondary activities. For example, a large hotel would be categorised tothe ‘Accommodation’ industry, and all of its activity, including organising and hostingmeetings/conferences would be measured as part of that industry and not to the ‘Meetings Industry’.
On the demand side, it would be necessary to expand the list of ‘purposes of visit’ in the data collectionand analysis to identify ‘Meeting participant’. Currently for many countries such visitors are includedin ‘Business visitors’ and not identified separately. The separate identification of ‘Meeting participants’does not involve any technical problems. The main issue would be the extra cost of collecting andanalysing this data.
This extra data collection would still not encompass the total value of consumption of meetingsparticipants. This is because it would still not include consumption by local (i.e. non-visitor)participants. A separate exercise would be needed to measure this consumption.
3.4 The new International Standard Industrial Classification 823,‘Convention and Trade Show Organisers.’
If the TSA is to be used to estimate the economic contribution of meetings participants as a subset ofvisitors, what is required is a clear definition of ‘meetings tourism’ and a ‘meetings visitor’.
Some guidance on this is provided by UNWTO, ICCA, IMP in their proposal for the ISIC revisionprocess, resulting in the development of new ISIC code 8230. That is, ISIC is currently undergoingrevision which will add the identification of a separate category, as follows:
• 823 Convention and trade show organisers
See class 8230
• 8230 Convention and trade show organisers
This class includes the organisation, promotion and/or management of events, such as business and trade shows,conventions, conferences and meetings, whether or not including the management and provision of the staff to operatethe facilities in which these events take place.
This means that there will be one ISIC activity group (ISIC 823/8230 Convention and Trade ShowOrganisers) in which all businesses, whose primary activity is as described, are included. Whilst somebusinesses have a variety of activities, they will be allocated to the one category that reflects theirprimary activity.
The ISIC 8230 can serve to define the scope of the Meetings Industry, providing a consistency ofdefinition lacking in the industry to date, thus enhancing the credibility of measures of its economicsignificance.
Whether or not the Meetings Industry is categorised as a tourism connected industry will depend tosome extent on the share of its revenues that are attributable to tourism. Although no precise share

28 Measuring the Economic Importance of the Meetings Industry
threshold is specified, it should not be below 25% in most cases. The tourism aspects of the MeetingsIndustry are its direct transactions with meetings participants who are visitors. Given the scale of localresident (non-visitors’) expenditure on meetings and events activities, it seems very likely that theMeetings ‘industry’ will fall below the 25% threshold. In that event it may be important to seek to havethe Meetings Industry regarded as a special case in order to have it explicitly identified in the TSAtables.
The TSA approach enables the ‘industry’ contribution to be measured by measuring the activity of allthe relevant ISIC industries, and also enables the full contribution of meeting participants to bemeasured through their total consumption of goods and services. The separate identification of thisindustry means that, once implemented, statistical agencies will be able to survey the industry in thesame way as other, more traditional, industries are surveyed.
3.5 Implications of ISIC 823
While many of the implications of use of ISIC 823/8230 have been identified above it is appropriate toacknowledge them explicitly at this point:
1. The code itself could exclude some supplier types that one may wish to count as part of theMeetings Industry. Businesses that may not be represented in ISIC 8230 include Incentive Houses,or in-house corporate planners as well as a range of other organisations. For example, many hotelsmay host meetings but as their primary activity providing accommodation, they would beincluded in the ISIC Accommodation code.
Additionally, a large number of Associations worldwide host meetings/conferences for membersbut do not have as their primary activity the types of activities falling under ISIC 8230. Thus, whilethe new ISIC code will be suitable for the classification of firms primarily engaged in organisingmeetings, conferences, conventions and trade shows, this industry category will understate thetotal activity of organising meetings.
The great majority of meetings do not use the services of organisations where meetings are theirprimary activity. For example, as noted above, smaller hotels which do not have a designatedconvention or conference centre will in many cases still provide meetings organisation andhosting services .Where such meetings are organised by a professional meetings organiser whichdoes qualify under the ISIC 8230 definition this activity will be included, but otherwise it willappear as part of the Accommodation Industry in ISIC.
The use of the concept of activity, however, can bring together production of similar products inthe different industries where this production occurs.
In Deery et al (2005), it was found that Professional Conference and Convention organisers wereemployed for only about 10 per cent of the meetings held annually in Australia. These companiesare important and specific players in the Meetings Industry as this is their core business, but theydo not represent the full scope of the industry from a spending or revenue standpoint: a largenumber of meetings – including very large ones – are organised by in-house professionals withinassociations and corporations. This implies that use of the code to define the Meetings Industryfrom the supply side may capture only a small percentage of inputs and outputs of the productionof meetings goods and services.
2. Depending on the requirements of the client, different and unique bundles of services related tomeetings can be packaged. This characteristic can complicate the measurement issues, as theyshould all be aggregated to reflect the industry output. Normally, consumption ofaccommodation, transport, food, etc. by meetings’ participants would be treated as an activity ofthe relevant industries providing these services to the attendees, and not of the Meetings Industry.However, a complication arises when, for example, the meeting organiser includes in the

29Using the TSA to Evaluate the Economic Contribution of the Meeting Industry
meeting/conference registration fee, the cost of accommodation, conference speaker, corporateentertainment, and possibly some transport – services which will be provided directly to themeeting participant by the business rather than the meeting organiser. The same issue arises whenan exhibition organiser pays for various goods and services from exhibitor fees. Both areanalogous to the situation where a travel agent sells a package tour – comprising a number ofproducts (e.g. accommodation, transport, sight-seeing, etc.) which will be provided directly to thevisitor by the service provider rather than by the travel agent. The question is: should the GrossValue Added in providing these services be attributed to the meetings organiser, treating thepackage as a single product (known as the ‘gross’ approach), or should the Gross Value Added beattributed to the direct providers of each of the packages’ components, i.e. to the Accommodationindustry, the Transport industry, the Tourist Attractions industry, etc. (known as the ‘net’ approach).
In compiling the TSA, the UNWTO recommends that the ‘net’ approach is taken. Consistencywith UNWTO guidelines would suggest that this approach should be taken in measuring theMeetings Industry, using the TSA as a basis. The potential ‘downside’ of this is that the apparenteconomic contribution of the Meetings Industry will be lower than what the gross approachwould indicate. However, it is important that the approach taken be consistent with existingofficial standards to ensure that the methodology is accepted as providing an objective andcredible measure of the industry.
3. One might also note that the listing of the new ISIC code does not, in itself, imply that centralstatistical agencies will implement new ISIC 3 (and 4) digit code for Meetings or that they willautomatically collect this information as they would for other industries. In most cases industryinformation is collected at a higher (ISIC 2- or even 1-digit) level than the 3- or 4-digit level. Theagencies would have to be persuaded to collect data on this industry at this lower level. Thiswould involve more costs for the agency in data collection and might be resisted for this reason.
A related issue is that, while ISIC may incorporate this new code, each individual country willhave to decide whether it will create a corresponding code in its national industrial classificationsystem. Even if so, changing such classification systems can take a considerable amount of timeand it could be years before such a new code is actually included.
4. The presentation of statistical results needs close consideration. Adoption of the new ISIC 8230code will be a useful step towards such credibility if implemented by central statistical agenciesbecause it will provide central statistical agency imprimatur to an important element of theMeetings Industry data. Where the measure of the Meetings Industry is based on TSA data, itscredibility will be improved by the fact that the TSA is a part of the official National Accounts andthus enjoys the credibility and status of a National Accounts measure.
3.6 Presentation of Results: A Meetings ‘Satellite Account’
A further issue relates to how the results of any measurement of the tourism connection of the MeetingsIndustry would be presented.
It can be argued that the credibility of the Meetings Industry estimates will ultimately depend onwhether they can be incorporated into the mainstream of the TSA (or the SNA itself). From this point ofview some form of link to the TSA may be the best route to credibility for the Meetings Industry as itwould attach the industry to an existing and credible national accounting structure which alreadyincorporates the form of demand side analysis which is recommended here for the Meetings Industry.To establish a completely new identity for meetings activity, independent of that of tourism activitywould be a difficult and lengthy process. It is not apparent that the Meetings Industry of itself has thepolitical clout or influence to succeed without a major champion such as the tourism community.

30 Measuring the Economic Importance of the Meetings Industry
In practice options are limited to the following typology:
1. incorporated in the TSA, with the “Meetings Industry” identified as another tourism industry;
2. incorporated in the TSA framework as a complementary set of tables specifically identifyingmeetings’ activity; or
3. as a separate satellite account.
Therefore there are three options.
The first option implies that the Meeting Industry is a tourism characteristic activity such asAccommodation, Passenger Transportation, Travel Agencies, etc. There is no clear evidence that this isthe case at least on a national levelThe Meetings Industry is not a clear subset of the Tourism sector –indeed the new ISIC 8230 code will cover activity by conference organisers on behalf of residentconference and meeting participants as well as those for visitor participants (whether domestic orinternational visitors). Some organisers which fall under the code may do very little of their businesswith ‘visitors’ as defined under the TSA.
The second option (to consider the development of a separate industry extension relevant for theMeetings Industry) seems the proper way to proceed. Such an extension could involve, for example,the usual supply and demand information for the industry plus other information and characteristicsnot normally found in the TSA. The TSA could be a supporting instrument and framework, but moreinformation about the Meetings Industry could be incorporated. Although such specific industryextensions cannot be referenced, analogies of this approach appear, for example, in the Balance ofPayments as memoranda items, where information is provided outside the specific BOP guidelines, butwhich is still of interest to users. For example, in Australia, memorandum items in the BoP identifyTourism Exports and Tourism Imports. In another case, Canada, a memorandum item has been used toprovide a provincial breakdown for travel. These are not actually components of the BOP. Theyelaborate the usual BOP compilation, and provide additional useful information. (Such analyses couldbe assembled for any industry in the SNA, where some descriptive characteristics are available andimportant, but lie outside the specific SNA requirements.) In this context, the Meetings Industry coulduse the basis of the TSA framework, and add supplementary information of particular interest as amemorandum item. The industry itself could identify such characteristics as they wish.
The tables to be produced as supplements to the main TSA tables could be set up along the lines of theTSA-RMF (consumption by products and categories of visitors, and production accounts for theindustry).
The Meetings Industry would make a valuable contribution to the discussion by reviewing theseproposals before identifying the optimal tables for their specific needs.
Finally, the third option, while perhaps ideal from the industry viewpoint, is most unlikely to beaccepted by statistical agencies, at least until they have some sense of the importance of the industry.The industry may be able to help, by providing judgments to the statistical agencies, as to the numberof meetings held in specific countries, and the share of these meetings that are organised by themeetings industry.
3.7 Conclusions
A credible international system, and eventual incorporation into the mainstream of the TSA, requiresthat we move towards some consistent definitions of meetings.
The TSA framework allows for special insight into tourism related industries. The term “TSA extension”should be understood as a complementary set of data on a specific issue of special interest for tourismrelated economic analysis (such as the tourism connection of the Meetings Industry), which may alsoinclude some conceptual clarification issues on the TSA official text. The closest comparison could beBalance of Payment memorandum items.
31Using the TSA to Evaluate the Economic Contribution of the Meeting Industry
TSAs provide a mechanism for countries to estimate the economic contribution of the variouscomponents of the tourism sector. The aim of this study has been to undertake some preliminary worktowards the development of a standard methodology for measuring the economic value of the MeetingsIndustry based on Tourism Satellite Accounting. This initiative should adapt the conceptual frameworkof the TSA and raise worldwide awareness of the need for TSA compilers to identify and measureadequately the Meetings Industry. Incorporating meetings explicitly within the TSA would enhancecredibility of any measurements of economic contribution of this industry.
While it is possible to present a framework to assist in estimating the value of the Meetings Industryglobally, the issue of lack of consistency in the method and frequency of data collection will remain abarrier to progress. The ongoing refinement of the global data collection process will requireconsiderable attention by the UNWTO and the current study will provide criteria andrecommendations for the statistics that are collected and the assumptions underlying these statistics.


The following chapter outlines a potential strategy for collecting the data necessary to inform theestimation of economic contribution described in Section 4.1. The methods are based loosely on thoseused in the National Business Events Study (Deery et al, 2005) taking into account lessons learnedduring that study.
4.1 Measurement Problems
There are several major problems with measurement of the Meetings Industry to date. Thesemeasurement problems, affecting both supply side and demand side measures, arise because:
• The standard industrial classifications (e.g. ISIC) do not (currently) identify a separate MeetingsIndustry.
• The data collected by existing surveys shows enormous diversity and inconsistency.
• The data are created for different purposes and are frequently not comparable.
• The data are often not up to acceptable statistical standards.
Ideally, there should be agreement on the basic data to be collected for the purpose of estimating theeconomic contribution of the Meetings Industry. Statistical agencies in different countries should alsoadopt the same method of collecting the basic data for the Meetings Industry and the same approachto estimating its economic contribution. This would enhance the credibility of the estimates made andfacilitate comparison of Meetings Industry performance between destinations and with other industries.
The size and value of the economic contribution made by ‘meetings’ depends on the definition of theMeetings Industry both in aggregate and in terms of its constituent parts (meetings, incentives,conventions and exhibitions). The definitions formulated in Chapter 3 can help to define a meetings’participant. As indicated earlier, there is presently much confusion in the industry as to the appropriatedefinitions of ‘meetings’. We have seen that the definitions proposed differ in respect of requirednumbers of participants, mix of nationalities, duration and so on. Use of the TSA to estimate theeconomic contribution of the Meetings Industry requires that participants at meetings be clearlydefined. Different definitions will result in different numbers and expenditure counts for meetingsparticipants.
Clearly, the set of tourism related activities/industries (characteristic plus connected) does not equate towhat might be regarded as the set of ‘meetings related’ activities/industries. What is required is that theTSA, or a Meetings Industry sub-set of the TSA, identifies specific industries which reasonably representthe activity of this sector. This requires that the industrial classification used identifies the relevantindustries. At the moment, the current version of the ISIC – on which many countries base their officialnational industrial classifications – does not identify a category specific to ‘meetings organisers’. Suchbusinesses would currently be included in a broad category encompassing a range of businessesproviding a variety of services. This category is far too broad to use for the purpose of measuring theactivity of the Meetings Industry.
Chapter 4
Framework for an Evaluation of the Meetings Industry
© 2006 World Tourism Organization - ISBN 978-92-844-1195-5
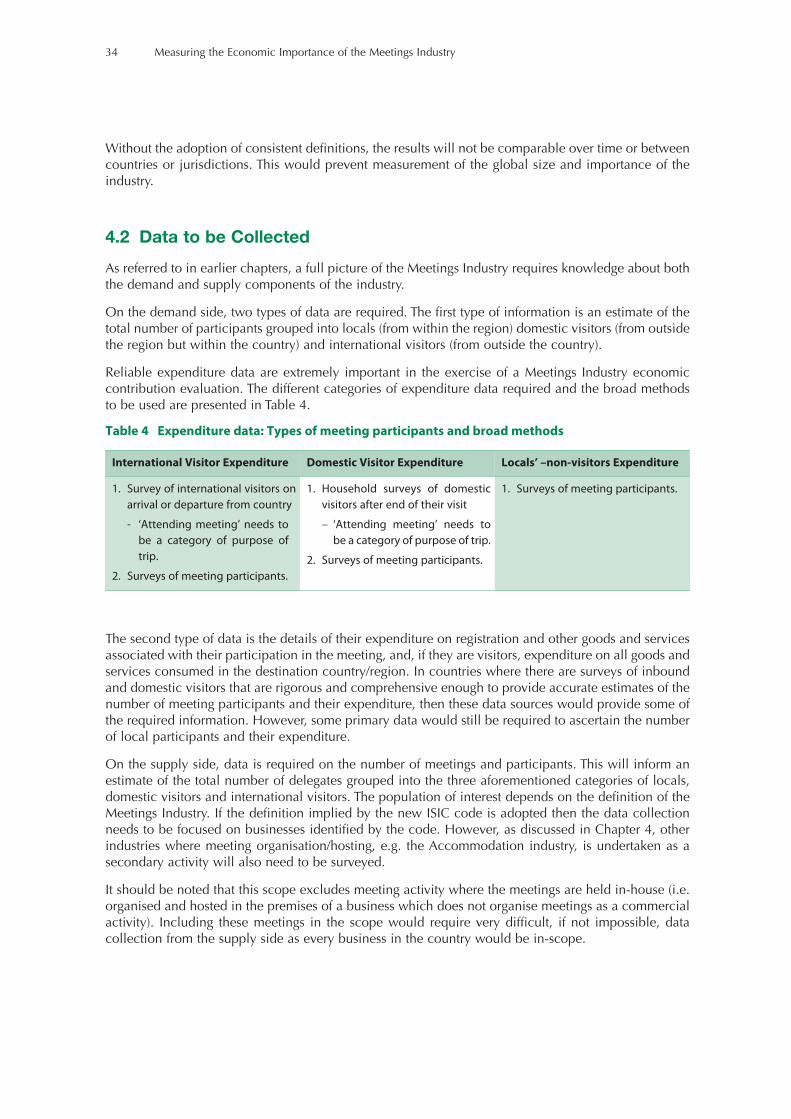
34 Measuring the Economic Importance of the Meetings Industry
Without the adoption of consistent definitions, the results will not be comparable over time or betweencountries or jurisdictions. This would prevent measurement of the global size and importance of theindustry.
4.2 Data to be Collected
As referred to in earlier chapters, a full picture of the Meetings Industry requires knowledge about boththe demand and supply components of the industry.
On the demand side, two types of data are required. The first type of information is an estimate of thetotal number of participants grouped into locals (from within the region) domestic visitors (from outsidethe region but within the country) and international visitors (from outside the country).
Reliable expenditure data are extremely important in the exercise of a Meetings Industry economiccontribution evaluation. The different categories of expenditure data required and the broad methodsto be used are presented in Table 4.
Table 4 Expenditure data: Types of meeting participants and broad methods
The second type of data is the details of their expenditure on registration and other goods and servicesassociated with their participation in the meeting, and, if they are visitors, expenditure on all goods andservices consumed in the destination country/region. In countries where there are surveys of inboundand domestic visitors that are rigorous and comprehensive enough to provide accurate estimates of thenumber of meeting participants and their expenditure, then these data sources would provide some ofthe required information. However, some primary data would still be required to ascertain the numberof local participants and their expenditure.
On the supply side, data is required on the number of meetings and participants. This will inform anestimate of the total number of delegates grouped into the three aforementioned categories of locals,domestic visitors and international visitors. The population of interest depends on the definition of theMeetings Industry. If the definition implied by the new ISIC code is adopted then the data collectionneeds to be focused on businesses identified by the code. However, as discussed in Chapter 4, otherindustries where meeting organisation/hosting, e.g. the Accommodation industry, is undertaken as asecondary activity will also need to be surveyed.
It should be noted that this scope excludes meeting activity where the meetings are held in-house (i.e.organised and hosted in the premises of a business which does not organise meetings as a commercialactivity). Including these meetings in the scope would require very difficult, if not impossible, datacollection from the supply side as every business in the country would be in-scope.
International Visitor Expenditure Domestic Visitor Expenditure Locals’ –non-visitors Expenditure
1. Survey of international visitors on
arrival or departure from country
- ‘Attending meeting’ needs to
be a category of purpose of
trip.
2. Surveys of meeting participants.
1. Household surveys of domestic
visitors after end of their visit
– ‘Attending meeting’ needs to
be a category of purpose of trip.
2. Surveys of meeting participants.
1. Surveys of meeting participants.
35Framework for an Evaluation of the Meetings Industry
4.3 Collection of Expenditure Data
A potential strategy for collecting the expenditure data of meetings’ participants is outlined below.
A series of four draft questionnaires containing the data to be collected has been developed to collectdata from venues, organisers, delegates and exhibitors. These are presented in Appendix G.
Step 1: Development of a sampling frame of commercial meeting venues stratified by appropriatevariables such as size, region, and annual volume of business.
Step 2: Collection of data from a representative sample of these businesses identifying total number ofmeetings hosted, total number of delegates and region of origin of participants. Respondentscould be asked to provide a sampling frame of participants, or to recruit via email for a surveyof the participants in their meetings.
Step 3: Examination of inbound and domestic visitor survey data to identify the number of participantswho were visitors to the region in each category.
Step 4: Estimation of the number of local participants by subtracting the number of participants whowere visitors (Step 3) from total number of participants (Step 2).
Step 5: Participants’ expenditure data would be collected through a survey, possibly administered viathe web, of the participants identified in the survey frame (Step 2).
See Appendix G for examples of questionnaires to collect this data.
4.4 Lessons from Previous Research in the Meetings Industry
The consultants have past practical experience in the collection of data on both the demand and supplyside of the Meetings Industry through their National Business Events Study (2005). Following is a briefsummary of some of the difficulties experienced during that study presented here in the interests ofdesigning a data collection program that mitigates these difficulties.
1. At the national level (or even at a large sub-national regional level) it is difficult to identify acomprehensive sampling frame of commercial meeting venues unless they are members of anindustry association. If an industry association does not exist, or there is reason to believe that itsmembership is not comprehensive, then a simple rule for inclusion needs to be developed, suchas the venues marketing of their services in a business directory. Ideally the criteria for inclusionin the venue sampling frame should be consistent across all regions and countries undertaking thisexercise and it might therefore be appropriate for the UNWTO to define this.
2. The information required from venue managers is complex and it may take them some time tocollate this depending on the way in which such information is stored. It will also depend on thetime period being covered, e.g. a year, a quarter, a month, etc. Difficult survey questions oftenlead to non-response (because respondents are unable or cannot be bothered to supply theinformation) or to survey error (because respondents do not take the time to accurately collate theinformation). To promote accuracy, effort should be made to simplify the task as much as possiblefor the respondents. One initiative in this regard is a project by the STCRC investigating methodsfor extracting venue information directly from booking systems rather than requiring venuemanagers to complete a survey.
3. It has been suggested that inbound and domestic tourism surveys can be used to derive anestimate of the number of meetings’ visitors. However, people may have multiple reasons for theirvisit and everyone attending a ‘meeting’ may not identify this as their main purpose. These surveystherefore need to have an additional specific question asking whether they attended a meeting,conference, exhibition or incentive event during their trip.
36 Measuring the Economic Importance of the Meetings Industry
4. Initial response rates from supply side operators (organisers and venues) were very low, and it wasonly with extensive and labour-intensive follow up (through repeated telephone calls and emails)that acceptable response rates were achieved. It appears as though operators in the MeetingsIndustry are extremely concerned about the competitive implications of sharing information abouttheir businesses. For this reason it is suggested that the data be collected by an independentresearch organisation through industry associations who should promote to their members theimportance of their participation in the interests of the industry as a whole.
4.5 Surveying Participants in Meetings
There are two ways of obtaining visitor expenditure associated with the Meetings Industry:
a) from the surveys of total visitors conducted for general tourism statistical purposes, e.g. nationalor regional tourism surveys of international or domestic visitors; and
b) from customised surveys specifically targeted at participants during or soon after their attendanceat meetings.
a) From tourism visitor surveys
Some countries specifically include attendance at meetings in their tourism visitor surveys. Forinternational visitors, this may be by way of the official Immigration Arrival/Departure cards completedby international visitors at border posts or by way of tourism specific surveys of international visitors.These may be a useful tool for estimating total attendance at meetings by international visitors andpossibly for weighting purposes for other more detailed survey data.
Expenditure undertaken by meetings’ participants can be estimated from general tourism surveys whichinclude expenditure information. These are conducted in many countries by government tourismauthorities or joint government/tourism industry agencies. They use techniques such as householdsurveys, sample exit surveys or diary records maintained by sample visitor groups recruited for thepurpose.
These surveys will normally be managed by government agencies and involve large scale samplingwith large numbers of questions. The extent to which individual small groups (such as meetings’participants) can be identified will depend on the sample size and consequent level of sampling error.It could be expected that sample sizes would need to be very large and indeed larger than most currentnational tourism survey samples, to ensure statistically significant results for Meeting Industryparticipants. Increasing the sample sizes to achieve statistically significant results can be expensive andwould require strong government and industry commitment to the objectives to be achieved by doingso.
A problem in measuring visitors’ participation in meetings relates to the way such participation is to beidentified in the tourism survey question. For example, can the sort of label, which is usable in a largetourism survey accurately, reflect the Meetings Industry as we may propose to define it? A question suchas “Was the main purpose of your visit to attend a conference or convention?”, may not catch all of thenuances of attendance at a possible Meetings Industry event, but expanding the survey wording, in analready large tourism survey, will add expense and possibly contribute to respondent fatigue.Alternatively, the use of the more general term ‘meeting’ may involve considerable ambiguity for manytravellers who will be engaging in meetings during their visit which would not fall within the activityof the defined Meetings Industry referred to here. It will thus be necessary in the context of the surveyinstrument to find a simple way of conveying the relevant definition of ‘meeting’ in the context of thesurvey instrument.
A further complication arises when a traveller has dual motives for visitation (e.g. attending aconference and also visiting family, or having a holiday). The survey questionnaire should allow visitorsto subsequently identify other purposes of visit in addition to their main purpose of visit to the

37Framework for an Evaluation of the Meetings Industry
destination. Secondary purposes should include ‘participating in meeting/conference/convention/etc.’.This will ensure that all visitors who participate in a meeting, and not just those who visit for theprimary purpose of participating in a meeting, will be identified. It is recommended that all suchidentified persons who participate in a meeting, whether this is the primary or a secondary purpose ofvisit, should be included in the measurement. This will provide a more accurate measure of thecontribution of all meetings’ participants.
Another issue relates to persons accompanying meetings’ participants. It is common for spouses toaccompany a meetings’ participant and to identify their main purpose of visit as “holiday” (or someother purpose). Any accompanying person’s expenditure should be included in the meetings’ relatedexpenditure. This is because of the principle that the purpose of visit should be identified as the purpose‘in the absence of which the visit would not have taken place’. In this case it is assumed that theaccompanying person would not have visited the destination if the meeting was not taking place (eventhough that person him/herself was not participating in the meeting). It is recommended, to assist this,that the list of (main and secondary) purposes of visit should include ‘Accompanyingconvention/conference/seminar/trade fair/exhibition visitor’.
b) From Customised Surveys
The expenditure of participants within the destination can be estimated using customised surveyscarried out on participants in ‘meetings’ which meet the definition of the Meetings Industry. Thesewould need to cover a sufficiently large number and range of such meetings to achieve a level ofstatistical reliability. As such, this approach is also expensive. If the survey process is to be driven bythe industry rather than by government, this approach will probably be the only option available. Suchsurveys will require the active participation of individual Meetings Industry organisers. They would besubject to the normal limitations of survey use and caution would need to be exercised in the use andinterpretation of results. Continuous surveying is, however, an expensive undertaking.
An additional issue arises in respect to surveying participants in meetings who are residents in a hostcountry. These residents can be classified as either ‘domestic visitors’ or ‘local residents’. The domesticversus local distinction would be made (according to UN/UNWTO tourism statistics’ standards)primarily on the basis of whether the visitor/participant has travelled outside his/her usual environment.
As for international visitors, the expenditure of destination residents (domestic visitors or locals) can beestimated from general tourism surveys or specifically targeted to meetings participants. Specificsurveys are likely to be clearly preferable in this case, in order to pick up expenditures by local residentmeeting participants who will be omitted from tourism surveys.
4.6 Expenditure on Travel to Meetings in Other Countries
An issue arises in relation to the treatment of expenditures in the meeting participant’s country/place oforigin in relation to attending a meeting or event in another country/place. Some of this expenditurewill contribute to the economy of the origin country/place while some will contribute to the economyof the destination country/place.
For example, the participant may pay a travel agent in the origin country/place for accommodation inthe destination country/place. This payment contributes to the economy of the destinationcountry/place and not the economy of the origin country/place. Therefore this expenditure should notbe included in a measure of the contribution of meetings to the origin country/place. However, theGVA of the travel agent does contribute to the economy of the origin country/place and so should beincluded. This will be only a small part of the payment made to the travel agent by the meetingparticipant, but it must be included in the measure to ensure that the full value of meetings’ activity tothe economy is measured.
Where such payments are made to a meeting or event organising business in the country/place of originand must be passed on to the meeting organiser or service provider in the destination country/place,
38 Measuring the Economic Importance of the Meetings Industry
for example as a payment for conference fees or accommodation, these payments become the revenuesof the Meetings Industry in the destination country/country.
A component of such payments may, however, relate to services provided in the originatingcountry/place, in effect the value added provided by staff of the meetings organising firm in thecountry/place of origin. In national accounting terms and for consistency with the TSA, this value addedgenerated in the country/place of origin should be included as part of the production of the meetingsand events industry in the origin country/place rather than in the destination country/place.
The over-riding principle here is that any GVA by a business which is resident in the origincountry/place which relates to meeting activity in another country/place should be included in themeasure of meetings’ contribution to the origin country’s/place’s economy.
4.7 The Use of Survey Data to Measure the Economic Contribution ofthe Meetings Industry
The expenditure data can now be employed to estimate the economic contribution of the meetingsindustry. The expenditure of meetings’ participants (and those accompanying them) is a major inputinto the estimation of the economic contribution of the meetings industry in respect of variables suchas Gross Value Added and employment.
The method outlined introduces consistent and credible techniques for measurement, using TSAconcepts and methods, but inevitably relies heavily on industry surveys and existing data types. Sinceexpenditure pertaining to different industries (e.g. accommodation, air and water transport, casinos andother gambling services) will have different effects on value added and employment in the widereconomy, it is crucial that the expenditure surveys reflect accurately the patterns of purchases bymeetings’ participants. Every care needs to be taken that the surveys conform to correct statisticalsampling requirements and sound statistical methodology.
A problem with expenditure surveys is that the information they yield is invariably very aggregative or‘blunt’. Surveys generally will not provide sufficient detail to enable us to know what specific productsand services are purchased by meetings participants except under general categories such as ‘shopping’or ‘accommodation’ or ‘tours’. Gaps in our knowledge here will affect the estimated economiccontribution from meetings’ participants since purchases of the different products are associated withdifferent value added and employment effects. This problem is no different for ‘meetings tourism’ thanit is for ‘leisure tourism’ or ‘business tourism’ generally and highlights a more general concern with useof the TSA generally to estimate tourism’s contribution to the economy. Of course, more detailed surveyinstruments can be constructed which distinguish a greater array of products and services purchasedby meetings participants, but this brings with it the likelihood of a much lower survey response ratefrom delegates, with corresponding loss of survey accuracy.
Since it is impractical to construct surveys that are so detailed as to cover all specific goods and servicespurchased by meetings’ participants, analysts’ judgements will be called for. It has been indicatedpreviously that expenditure surveys can be based upon a general tourism survey approach or bycustomised surveys of meetings’ participants. On either method, the financial costs are significant togather consistent and acceptably reliable data. Not all countries have extensive international anddomestic visitor surveys which include expenditure information. Even those that do would have to addquestions and would probably need to expand sample size to ensure statistical significance of sampleresults. This will involve considerable expense and political commitment.
No matter how accurate the surveys might be at a given time, expenditure patterns can change overtime in unpredictable ways. As new products and services become available, meetings’ participantsmay change their patterns of expenditure. Such changes will affect the economic contribution ofmeetings’ participants to a destination.

39Framework for an Evaluation of the Meetings Industry
It is also the case that the level of detailed data required to produce the estimates of the economiccontribution of meetings is much greater than that normally provided in the national accounts. Someof the industries and products identified in the literature review as relevant to expenditure on meetingsare at a more detailed level, or do not directly concord, with the industry and product categories in thenational supply and use tables or the TSA.
4.8 Quarterly Measures of Meetings Industry Performance
The measurement of activity relating to meetings addressed in this report covers activity in the sectorover a period of a full year. This would usually be for a calendar year or a financial year. For mostcountries this measure would not be produced for every year. This is because the TSA, which themeasure is based on, is usually only produced periodically – for example every five years or so. Inaddition, the TSA can take a number of years to produce after the reference year. This is because thedata in the TSA takes considerable time to collect, process and manipulate before the TSA can beproduced. A TSA could typically be produced two or three – and even more – years after the referenceyear. If the TSA is produced on a five yearly cycle, then the latest results could relate to the periodseven, or even more, years ago.
The tourism sector is one which is subject to very rapid short term changes in demand. Not only is itsubject to seasonal changes – and in many destinations these can be significant – but it is also subjectto a wide range of influences. These include economic conditions in the source countries/regions andglobally, international events such as terrorist activities, wars, epidemics, etc., events in the destinationcountry/region, e.g. Olympic Games, political relations between a source country and a potentialdestination country, and many other factors.
Because the level of tourism demand can change significantly and unexpectedly in a very short time,there is a need for up-to-date measures of what is happening currently rather than historically. Thetraditional measures of tourism demand typically relate to a period six or more months previously.These data are essential for monitoring movements in tourism activity, composition and trends overtime. However, they do not reflect current activity.
The increasing sophistication of the tourism industry has led to growing demands for indicators ofcurrent demand. Operators in the industry need this information to assess how their business isperforming compared to the wider industry and which sectors are performing better than others. Thisinformation is needed as the basis for decisions on whether current business strategies need to bechanged. Some sectors which are not performing well may require special assistance which can onlybe provided by governments.
While this discussion has related to the wider tourism sector, it applies also to the related MeetingsIndustry. While this industry is not as heterogenous as the wider tourism industry, and at the destinationlevel may be easier to monitor on an anecdotal basis, its growth in size and competition means thatthe availability of up-to-date measures is increasingly required.
Ideally it would be useful to be able to up-date the results of meetings’ data in the TSA on a regularshort-term basis. However, this is not practicable as the data required to produce the TSA is notavailable on a short-term basis. Even if this data were available, the cost and resources needed toproduce, in effect, a regular short-term TSA could not be justified. This is not necessarily a particularproblem as the range and depth of data from the TSA is not essential for the monitoring of short-termchanges in meetings’ activity. The TSA provides a wealth of data on the structure, composition andeconomic contribution of the sector on a longer-term time series basis. It enables trends over time inthese variables to be examined and provides the rich database on which further research into the sectorcan be built. It provides the basis for strategic decision making on such issues as investment, businesspolicy, training needs, structural change and other long-term development issues. The short-termmonitoring of the sector does not need this range and depth of information.

40 Measuring the Economic Importance of the Meetings Industry
For such short-term monitoring, it is suggested that the following measures would be sufficient toindicate short-term movements in the sector’s activity and health.
1. on the demand side: numbers of meetings’ participants and total expenditure by these participants; and
2. on the supply side: industry GVA, employment and possibly export earnings (i.e. earnings from internationalparticipants).
In relation to the demand side indicators, where a country has in existence on-going surveys ofinternational and domestic visitors, these surveys should be used to provide these measures. Suchsurveys typically ask for the visitor’s purpose (or purposes) of visit, and attendance at ameeting/exhibition/etc. should be identified as one of the main (and secondary) purposes of the visit.Typically also, these surveys collect details of total trip expenditure by visitors. For those whose mainpurpose of visit – i.e. the purpose, in the absence of which the trip would not have taken place – is toattend a meeting/exhibition/etc. total expenditure for these visitors should be identified and aggregated.This should be done separately for international and domestic visitors.
This procedure will provide data on numbers and total expenditure by visitors to a destination whohave attended a meeting/exhibition/etc as primary purpose of visit. However, this is not a completeindicator of meetings activity as it excludes local residents who attend such events.
To produce such an indicator, it is suggested that a survey of the meetings organisers/venues beconducted. The population of businesses to be surveyed could be those businesses falling into the newISIC 823 class. Alternatively, in a regional destination where the number of relevant businesses may besmall, the local industry association would know of all such relevant businesses and these could besurveyed. Such surveys, depending on local conditions, may be conducted by the industry association,or preferably by a professional research agency on behalf of the industry association. At the nationallevel, it is suggested that such industry surveys should be conducted by the national statistical agency,in conjunction with the national industry association. The collection of accurate and reliable data is notan easy exercise and should be undertaken by, or at the very least be overseen by, a professional datacollection agency.
On the supply side, it may be possible to collect the data for the indicators through the industry surveysdiscussed above. However, only data which can reasonably and easily be provided by businessesshould be included. For example, it may be easy enough for businesses to provide good data onnumbers employed, but it might be difficult to provide data on GVA, for the reference period.Collecting data on such economic variables as GVA on a regular basis may result in the surveybecoming too burdensome for the responding businesses. This could result in low response rates andthus unreliable and possibly unusable information. It is advisable to keep any such surveys as simpleas possible.
The demand side indicators discussed above can be used to approximate movements in industry GVA.The TSA will provide benchmark measures of GVA, and changes in the short-term demand sideindicators can be applied to this benchmark data to provide estimated indicators of movements inGVA. This, of course, assumes that the relationship between demand side numbers and GVA isconstant, which may not actually be the case. However, in the absence of actual GVA data, such abroad assumption may provide short-term estimates which are sufficiently reliable to monitor thegeneral health of the sector. Any such short-term indicators would be recalibrated each time a new TSAis produced. This would then provide a time series of short-term indicators of industry GVA.
The question arises as to what is a reasonable period for a short-term indicator to refer to. Typically,‘short-term’ would be considered to relate to a period of a month or a quarter. Which of these wouldbe most appropriate depends on a number of factors relating to the needs of the industry and the costand practicality of the data collection and production. These are considerations relating to any datacollection exercise. The more frequently a data collection is conducted, the more onerous it is for the

41Framework for an Evaluation of the Meetings Industry
data providers, in this case the businesses, and for the survey organisers. The provision of such data andthe processing and production of results on a less than quarterly (e.g. monthly) basis would, in thiscase, very likely be too demanding on resources, and therefore costs, than could be justified. It isrecommended, therefore, that short-term indicators be produced on a quarterly basis.
A caveat needs to be attached to this recommendation. While, ideally, the industry would likeindicators to be collected and published in a very timely manner rather than over some longer period,we should not minimise the reality that the frequent collation of information relevant to such indicatorscan be very costly and may not yield benefits commensurate with the costs. Whatever the indicatorsdeveloped, they will be ‘lagging indicators’ and thus of limited relevance for planning purposes. Thequestion must be asked: what will the industry do with such indicators, particularly those that arepublished frequently? The answer given to this question will influence the view of how timely theindicators need to be, given the costs involved in their production. It may well be the case that, formany purposes, quarterly estimates of some of the indicators together with annual updates of otherswill provide a sufficient balance between the industry’s information needs and their cost of production.


Having discussed the many issues relating to the measurement of the economic contribution ofmeetings to the economy, in this chapter we propose a standard methodology for consideration. Theproposed steps below provide an outline of a broad methodology. There are many more detailed stepsinvolved but these should be dealt with when a broad methodology is agreed on.
This report has identified a number of issues still to be discussed and resolved before a finalmethodology could be adopted. This chapter also identifies those issues which need furtherconsideration by the Steering Committee.
5.1 Proposed Broad Methodological Steps
This proposed methodology relates to measuring the economic contribution at the national level. It isbased on, and an expansion of, the Tourism Satellite Account.
It is proposed that agreement be first arrived at for a national level methodology, before anymethodology for assessing the local (sub-national) economic contribution is developed.
1. Scope of industry and meetings participants
a) Supply side
• Decide scope of the “Meetings Industry”. (This might be a national equivalent of the ISIC8230 category, if one exists).
• Decide what industries should be identified as “meetings characteristic industries”. Thiswould include, for example, the “Accommodation” industry and any other industries whichhost or provide venues for meetings/conferences/exhibitions/etc. as a secondary activity.
• Identify a list of services provided by the Meeting Industry as a whole.
b) Demand side
• Broadly, the scope of meetings’ participants will be those participants at meetings asidentified through international and domestic tourism surveys, and/or lists of participantsidentified by the in-scope supply side businesses. Participants will comprise locals,domestic visitors and international visitors.
• In the case of visitors, it will also include persons accompanying meetings’ participants.
2. Data requirements
a) Demand side
• The main data required are expenditure by meeting participants. For local participants, thiswill cover expenditure on registration fees. For visitors, it will cover expenditure onregistration fees, plus all other expenditure on goods and services received in the
Chapter 5
Proposed Broad Methodological Steps and Further Issues to be Considered
© 2006 World Tourism Organization - ISBN 978-92-844-1195-5

44 Measuring the Economic Importance of the Meetings Industry
destination country/region relating to the trip taken. Expenditure on the main goods andservices consumed should be identified.
• Other information which would be of value relating to meetings’ participants wouldinclude: length of meetings attended, distance travelled to meeting, numbers in thetravelling party.
b) Supply side
• Data required from the in-scope businesses (as per step 1) include the economic datarequired to measure Gross Value Added (e.g. income and costs) and employment resultingfrom the hosting or organising of meetings.
• Also of interest are: data on the number of meetings held and the number of participants(broken down by whether local, domestic visitors or international visitors), and investmentin facilities.
3. Data collection methods
a) Demand side.
• For meetings’ participants who are visitors, the data collection should be primarily by wayof existing tourism surveys of international and domestic visitors. In such surveys, meetingsparticipants will need to be identified by a question asking respondents whether theyparticipated in a meeting/conference/exhibition/incentive event/etc., or whether theyaccompanied such a visitor. For international visitors, such surveys are often conducted byway of a sample survey of visitors departing the country. For domestic visitors, the surveysare often conducted by way of a sample survey of households.
• Customised surveys should be conducted of a sample of meetings’ participants. The list ofparticipants should be provided by the businesses or a sample of them identified as beingin-scope (in step 1). Such surveys may be conducted at the time of the meeting, orafterwards by contacting participants via the internet.
• These two methods (or only the second one where a country does not have tourism surveysin existence) will identify expenditure separately by participants who are local, domesticvisitors or international visitors.
b) Supply side.
• The economic data required to measure the industries’ GVA and employment, should becollected by way of the normal industry surveys conducted (usually) by countries’ NationalStatistical Offices for national accounts’ purposes.
• Services produced by the industry will need to be identified and a selection made of themost significant items for measurement. (Note, as a starting point, the list supplied byIAPCO in AppendixA). Industries producing these services can also be identified forpurposes of data collection.
• These surveys will need to sample the Meetings Industry and the meetings characteristicindustries (identified in step 1).
• In any interim period before National Statistical Offices introduce the collection ofMeetings Industry supply side data, it may be necessary to collect this information byseparate supply side surveys. (An example of such a survey is attached at Appendix G).

45Proposed Broad Methodological Steps and Further Issues to be Considered
4. Surveying organisation
• Where possible the surveying organisation should be the organisation that collects the ongoingdata for a country’s national accounts. This is usually the official National Statistical Office(NSO), but in some countries may be another organisation.
• The demand side data relating to visitors’ expenditure may be collected by the NationalTourism Agency (NTA).
• The important thing, however, is that data collection should, where at all possible, beundertaken by those organisations who are collecting the data for the Tourism SatelliteAccount.
• Where meetings’ data are not already being collected, these should, if possible be collectedby the NSO or the NTA in close collaboration with the meetings’ industry association(s).
5. Incorporation into the Tourism Satellite Account (TSA)
• The data collected should all be provided to the compilers of the TSA. This will supplementthe wider scope data inputted into the TSA. In the TSA, in addition to the identified tourismcharacteristic industries, the same data should be shown for the Meetings Industry and themeetings’ characteristic industries. This could be by way of additional tables to the standardTSA tables as previously mentioned in 3.6.
• In these tables the meetings activity which results from participants who are locals (i.e. are notvisitors and are therefore not included in the TSA data) should be added to the activity resultingfrom visitors who are meetings’ participants.
• These tables will then show the measures of meetings’ activity from the supply side and thedemand side, in the same way that the TSA does for tourism supply and demand.
6. Output
• The tables to be produced as supplements to the main TSA tables (see 3.6) could be set upalong the lines of the TSA-RMF (consumption by products and visitors and productionaccounts for the industry).
5.2 Further Issues to be Considered
Throughout this report, we have noted many issues that need further consideration, mainly by theMeetings Industry, and also by National Statistical Office counterparts and TSA compilers, to ultimatelymove the measurements towards international standards for all industries in the economy of a country.
The following is an outline of the main issues that need to be considered to progress this exercise:
1. Discuss with technical experts, such as National Statistical Offices, and other relevantinternational agencies, how an international standard method can be adopted, by building on thefindings of this report.
• are the recommendations of this report fully or partially accepted?; if so, how can the methodbe further developed?; if not, how can an alternative method be developed?
• this will involve working with technical TSA and other experts to agree on the more technicalissues discussed in this report, e.g. the “net” or “gross” approach to participants’ purchase ofmeetings’ packages;
• also important, will be the decision on whether the proposed TSA extension (by way ofsupplementary tables to make explicit the Meetings Industry tourism connection) is seen, forthe time being, as the preferred option (see 3.6).

46 Measuring the Economic Importance of the Meetings Industry
2. Agree on the scope (and the name) of the industry and its products:
• appropriateness of adopting the new ISIC 8230 category;
• identification of industries for which meetings are a secondary activity (e.g. Accommodation);
• exclusion of meetings not organised or hosted by a business undertaking the organisation orhosting of meetings as a business activity (e.g. excluding in-house meetings);
• should Incentive Houses specifically be included as a meetings’ connected industry (perhapsonly in certain countries?).
3. How will national industry associations be “brought on board” in this exercise?
• it is important that the national associations fully support any adopted international standardmeasurement of the industry;
• also important is for these to assist with developing a list of services provided to participantsat meetings.
4. How will national industry associations educate their members and other industry participants toactively support the implementation of the measurement?
5. How will industry participants be persuaded to fully co-operate with and contribute to theimplementation of the adopted measurement of their industry, through:
• working with the national and other industry associations to lobby for the expansion of the TSAto include the measurement of the meetings industry;
• rovide funding for the exercise;
• contributing the full range of data requested to ensure the credible measurement of the activity.

© 2006 World Tourism Organization - ISBN 978-92-844-1195-5
Appendix A
Summary of Supply of the Meetings Industry Facilities by country
Africa
North Africa
Algeria Palais des Nations holds major national and international congresses
Wide range of smaller conference halls and meetings rooms available in hotels, cultural
centres and youth centres
Morocco No detailed information
Sudan 3 fully equipped conference halls
Range of hotel facilities
Large area suitable for international and regional fairs
Tunisia No detailed information
West Africa
Benin No detailed information
Burkina Faso Large conference halls with modern equipment
Cape Verde No detailed information
Cote d’lvoire Hotel Ivoire Convention Centre
Cultural Centre
Gambia Kariba Conference Hall
Ghana Meeting rooms with capacity for 200 to 1,600 delegates
International Conference Centre, International Trade Fair, Luxury hotels with conference
facilities
Guinea No detailed information
Guinea-Bissau No detailed information
Liberia No detailed information
Mali Conference Centre with capacity for 1,000 people
Cultural Centre with capacity for 300,000 people
Many hotels with spacious conference rooms
Mauritania Conference Centre with four meeting rooms and a large hall with capacity for 400
delegates
Most 3-star hotels have meeting rooms
Niger Convention Centre was renovated in 2004
Large hall with capacity for 3,000 delegates was added
Nigeria No detailed information

48 Measuring the Economic Importance of the Meetings Industry
Africa
West Africa
Senegal Large state-of-the-art conference rooms fully equipped for international conferences
40% of hotels have world class meeting facilities
International Trade Centre has meeting rooms
Sierra Leone No detailed information
Togo No detailed information
Central Africa
Angola No detailed information
Cameroon No detailed information
Central African Republic No detailed information
Chad No detailed information
Congo No detailed information
Democratic Republic
of the Congo
No detailed information
Equatorial Guinea No detailed information
Gabon Convention Centre
Range of hotel meeting facilites
Sao Tome and Principe Various hotels which can accommodate trade shows, congresses, meetings and
conferences
Convention Centre suitable for large meetings
East Africa
Burundi No detailed information
Comoros No detailed information
Djibouti No detailed information
Eritrea Only one hotel (Inter Continental Asmara) has the capacity and necessary facilities and
infrastructure to host business events
Ethiopia United Nations Conference Centre
Hotels such as Hilton and Sheraton Addis have meeting facilities
Addis Ababa Exhibition Centre
Kenya Kenyatta International Conference Centre
Madagascar Hotels equipped with conference rooms that can hold hundreds of people
Malawi 3 international conference centres
1 trade fair
Mauritius New convention centres being built
Mozambique New conference centre in Maputo
Reunion No detailed information
Rwanda High capacity conference hall in Hotel Intercontinental
2 other new facilities opened recently
Seychelles Usually organise small regional conferences (max 40 people)

49Appendix A: Summary of Supply of the Meetings Industry Facilities by Country
Africa
East Africa
Somalia No detailed information
Tanzania No detailed information
Uganda No detailed information
Zambia No detailed information
Zimbabwe The main auditorium in the Harare International Conference Centre has a capacity for
more than 4,500 participants
Recently opened Celebration Centre in Harare has a seating capacity of 3,000
South Africa
Botswana International Convention Centre attracts major international meetings and conferences
Lesotho No detailed information
Namibia No detailed information
South Africa International Conference Centres in Durban, Johannesburg and Cape Town
Swaziland Meetings Industry dominated by international chain establishments such as Sun Hotels
and Orion Hotels
Americas
North America
Canada No detailed information
Mexico No detailed information
United States No detailed information
Caribbean
Anguilla No detailed information
Antigua and Barbuda 3 venues available to hold meetings for over 50 people
Aruba 22,000 sq feet space available for meeting and functions
Ballroom with 15,000 sq feet of pre-function space
Convention facility can accommodate 1,000 people for banquet, 1,600 people for theatre
style conventions and 500 people for classroom style meetings
Many hotels have the facilities for business events
Bahamas No detailed information
Barbados Sherbourne Conference Centre
Bermuda 115,000 sq feet of meeting space
British Virgin Islands No detailed information
Cayman Islands No detailed information
Cuba 73 facilities (4 or 5 star hotels) which hold medical, scientific and social events
10 venues specifically for business events (including Havana Conference Centre and Hotel
Nacional de Cuba)
Further 14 facilities
Dominica No detailed information

50 Measuring the Economic Importance of the Meetings Industry
Americas
Caribbean
Dominican Republic Many city hotels offer conference facilities
Barcelo Bavaro Convention Centre
Grenada Facility which can accommodate 250 to 300 delegates
Trade Centre can accommodate international and regional trade shows
Guadeloupe No detailed information
Haiti No detailed information
Jamaica No detailed information
Martinique Four hotels with conference rooms for up to 800 people
Conference centre with 10 meeting rooms (each room has 400 seats)
Montserrat Small meeting facilities available in hotels
Largest facility can accommodate 200 people in theatre style
Netherlands Antilles No detailed information
Bonaire No detailed information
Curacao International Trade Centre with facilities for up to 1,200 people for meetings,
800 to 1,000 people for banquets
Two auditoriums with capacity for 200 and 325 people
1,200 m2 of exhibition space
Large hotels offer facilities for up to 300 people
Saba Venues adequate to host 50 person conferences or meetings
Saint Eustatius No detailed information
Saint Maarten 1 large facility
Many small facilities
Puerto Rico Puerto Rico Convention Centre being constructed
Saint Kitts and Nevis No detailed information
Saint Lucia No detailed information
Saint Vincent and the
Grenadines
No detailed information
Trinidad and Tobago Courtyard Marriott will be opened soon with conference facilities
Turks and Caicos Islands Convention facilities at major hotel properties
United States Virgin
Islands
No detailed information
Central America
Belize No detailed information
Costa Rica 4 or 5 star city and beach hotels can accommodate meetings for 500 to 2,000 people
El Salvador No detailed information
Guatemala 23,000 m2 conference and meeting space (including convention centres, conference
rooms, hotels, restaurants and a fair and exhibition site)
New convention centre with capacity for 5,000 people
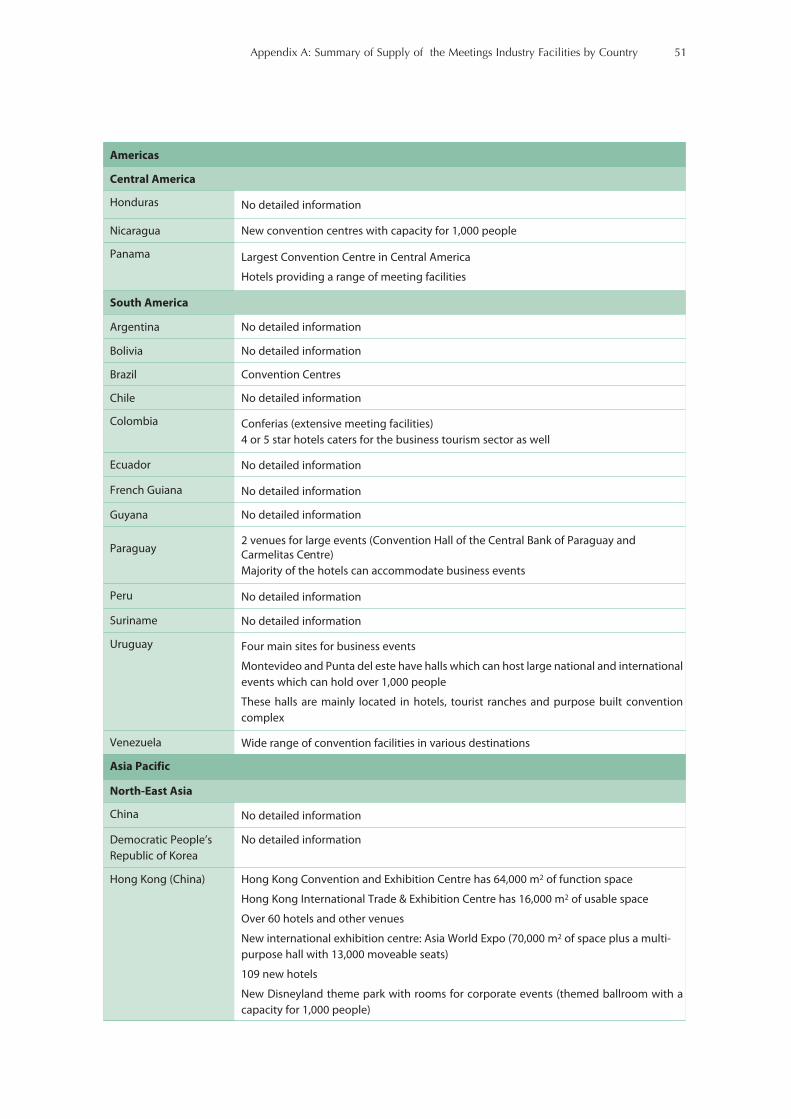
51Appendix A: Summary of Supply of the Meetings Industry Facilities by Country
Americas
Central America
Honduras No detailed information
Nicaragua New convention centres with capacity for 1,000 people
Panama Largest Convention Centre in Central America
Hotels providing a range of meeting facilities
South America
Argentina No detailed information
Bolivia No detailed information
Brazil Convention Centres
Chile No detailed information
Colombia Conferias (extensive meeting facilities)
4 or 5 star hotels caters for the business tourism sector as well
Ecuador No detailed information
French Guiana No detailed information
Guyana No detailed information
Paraguay2 venues for large events (Convention Hall of the Central Bank of Paraguay and
Carmelitas Centre)
Majority of the hotels can accommodate business events
Peru No detailed information
Suriname No detailed information
Uruguay Four main sites for business events
Montevideo and Punta del este have halls which can host large national and international
events which can hold over 1,000 people
These halls are mainly located in hotels, tourist ranches and purpose built convention
complex
Venezuela Wide range of convention facilities in various destinations
Asia Pacific
North-East Asia
China No detailed information
Democratic People’s
Republic of Korea
No detailed information
Hong Kong (China) Hong Kong Convention and Exhibition Centre has 64,000 m2 of function space
Hong Kong International Trade & Exhibition Centre has 16,000 m2 of usable space
Over 60 hotels and other venues
New international exhibition centre: Asia World Expo (70,000 m2 of space plus a multi-
purpose hall with 13,000 moveable seats)
109 new hotels
New Disneyland theme park with rooms for corporate events (themed ballroom with a
capacity for 1,000 people)

52 Measuring the Economic Importance of the Meetings Industry
Asia Pacific
North-East Asia
Japan No detailed information
Macao (China) 3, 4 or 5 star hotels provide meeting facilities
Mongolia No detailed information
Republic of Korea 4 state-of-the-art Convention Centres
5 more Convention Centres are being built
Taiwan (province of
China)
Taipei financial centre
New facility: Nangang International Conference Centre
South-East Asia
Brunei Darussalam No detailed information
Cambodia No detailed information
Indonesia No detailed information
Lao People’s
Democratic Republic
No detailed information
Malaysia Putrajaya Convention Centre
Kuala Lumpur Convention Centre
Melaka International Exhibition Centre
Wide range of hotels with meeting facilities
Myanmar Myanmar Convention Centre
Yangon Trade Centre
Other hotels and resorts
Philippines Philippine International Convention Centre
Hotels, Sports clubs and training centres
Singapore No detailed information
Thailand No detailed information
Timor-Leste 1 conference hall with capacity for 200 people
Vietnam No detailed information
Oceania
American Samoa No detailed information
Australia Purpose built convention centres in each state
Cook Islands No detailed information
Fiji Facilities available can cater for business event to a maximum of 1,000 people
French Polynesia Total capacity of about 1,300 people in major hotels
New hotel will increase capacity by 300
Guam No detailed information
Kiribati No detailed information
Marshall Islands No detailed information

53Appendix A: Summary of Supply of the Meetings Industry Facilities by Country
Asia Pacific
Oceania
Micronesia, Federated
States of
No detailed information
New Caledonia No detailed information
New Zealand International Convention Centres with capacity for up to 2,500 people
4 or 5 star business hotels
Specialist venues
Niue No detailed information
Northern Mariana
Islands
No detailed information
Palau No detailed information
Papua New Guinea No detailed information
Samoa New facilities being built
Solomon Islands No detailed information
Tonga No detailed information
Tuvalu No detailed information
Vanuatu No detailed information
South Asia
Afghanistan No detailed information
Bangladesh 1 quality convention centre
Bhutan No detailed information
India 2 largest convention venues (Vigyan Bhawan & Ashok Hotel)
Pragati Maidan: Premier Exhibition Venue with 62,000 m2 of space
10 main convention centres in different cities
New venues being built
Iran (Islamic Republic of) No detailed information
Maldives No detailed information
Nepal International Convention Centre of Nepal has 7 meeting areas with the largest auditorium
seating 1,046 persons
Royal Nepal Academy has a capacity for 1,250 people
Rastriya Sabha Griha seats 676 people
Russian Cultural Centre seats 200 people
Bhrikuti Mandap Exhibition Hall has 35,000 sq feet of space
Various 5 star hotels in Kathmandu
Pakistan No detailed information
Sri Lanka Facility available for up to 1,200 delegates

54 Measuring the Economic Importance of the Meetings Industry
Europe
Northern Europe
Denmark Large variety of meeting and conference facilities (castles, hotels, International state-of-
the-art Congress Centres in 5 cities)
Finland No detailed information
Iceland No detailed information
Ireland No detailed information
Norway No detailed information
Sweden 3 main destinations for conventions and meetings
Wide range of unique regions for smaller events
United Kindom Purpose built venues in 14 cities
10,000 m2 of space in each venue in 5 cities for exhibition and fairs
Western Europe
Austria No detailed information
Belgium - Brussels No detailed information
Palais des Congres Convention Centre
France 2,000 establishments have the capacity to host professional events of at least 20 people
1,500 hotels have developed business services (including large capacity conference halls)
120 Convention Centres (15 centres in major cities with the capacity for 4,000 people,
30 centres with the capacity for 2,000 - 4,000 people)
Total exhibit area of 1,586,878 m2
(with 2 exhibition centres in Paris of over 100,000 m2 each)
Germany 6 cities have the largest exhibition centres
4 of the 6 are among the top locations within Europe
Liechtenstein No detailed information
Luxembourg Luxembourg Congress Centre
New Congress Centre (2005)
Monaco Hotels and Conference Centres
Netherlands 8 main congress destinations
Switzerland No detailed information
Central and Eastern Europe
Armenia No detailed information
Azerbaijan No detailed information
Belarus No detailed information
Bulgaria No detailed information
Czech Republic Prague Convention Centre
Estonia Most meeting facility providers can cater up to 300 participants
Few bigger conference halls with a capacity for 1,000 delegates
One arena can seat up to 6,000 delegates
Main conference and meeting destination is Tallinn
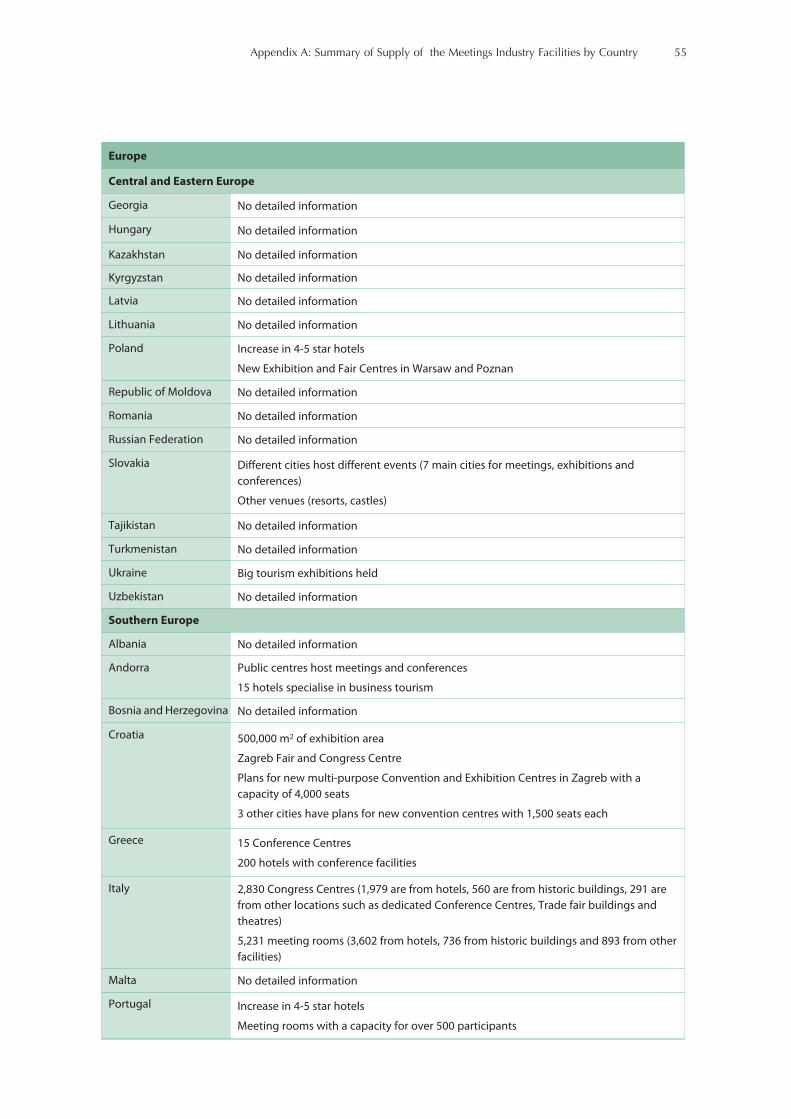
55Appendix A: Summary of Supply of the Meetings Industry Facilities by Country
Europe
Central and Eastern Europe
Georgia No detailed information
Hungary No detailed information
Kazakhstan No detailed information
Kyrgyzstan No detailed information
Latvia No detailed information
Lithuania No detailed information
Poland Increase in 4-5 star hotels
New Exhibition and Fair Centres in Warsaw and Poznan
Republic of Moldova No detailed information
Romania No detailed information
Russian Federation No detailed information
Slovakia Different cities host different events (7 main cities for meetings, exhibitions and
conferences)
Other venues (resorts, castles)
Tajikistan No detailed information
Turkmenistan No detailed information
Ukraine Big tourism exhibitions held
Uzbekistan No detailed information
Southern Europe
Albania No detailed information
Andorra Public centres host meetings and conferences
15 hotels specialise in business tourism
Bosnia and Herzegovina No detailed information
Croatia 500,000 m2 of exhibition area
Zagreb Fair and Congress Centre
Plans for new multi-purpose Convention and Exhibition Centres in Zagreb with a
capacity of 4,000 seats
3 other cities have plans for new convention centres with 1,500 seats each
Greece 15 Conference Centres
200 hotels with conference facilities
Italy 2,830 Congress Centres (1,979 are from hotels, 560 are from historic buildings, 291 are
from other locations such as dedicated Conference Centres, Trade fair buildings and
theatres)
5,231 meeting rooms (3,602 from hotels, 736 from historic buildings and 893 from other
facilities)
Malta No detailed information
Portugal Increase in 4-5 star hotels
Meeting rooms with a capacity for over 500 participants

56 Measuring the Economic Importance of the Meetings Industry
Europe
Southern Europe
San Marino No detailed information
Serbia and Montenegro No detailed information
Slovenia 7 main congress destinations
Building new congress infrastructure
Spain More than 50 Convention Centres and 4 or 5 star hotels
The Former Yugoslav
Republic of Macedonia
No detailed information
East Mediterranean Europe
Cyprus Cyprus International Conference Centre offers 2,916 m2 of function space which
accommodates 1,600 delegates
Israel No detailed information
Turkey Wide range of hotels providing conference facilities
Newly opened Lutfi Kirdar Istanbul International Conference Centre has doubled the
capacity of facilities
Middle East
Bahrain Bahrain International Exhibition Centre
Gulf International Convention Centre
Bahrain Conference Centre
Ritz Carlton (27 conference rooms)
Hilton Hotel
Diplomat Forte Grand (1,200 m2 of ballroom space which caters for 1,500 people and
6 rooms catering for 20 people each)
Regency Intercontinental accommodates 800 for receptions or 440 for banquets
Sheraton Bahrain supplies a conference hall for 800 people and 5 other conference rooms
Egypt No detailed information
Iraq No detailed information
Jordan Growing investment in building more conference facilities
Kuwait No detailed information
Lebanon All hotels have conference facilities
Libyan Arab Jamahiriya No detailed information
Oman No detailed information
Palestine No detailed information
Qatar No detailed information
Saudi Arabia 61,000 m2 of conference and meeting space
29,000 m2 of exhibition space
Hotels with capacity for 37,000 people (theatre style rooms)
Syrian Arab Republic Many well equipped venues (such as Omayad Conference Palace)

57Appendix A: Summary of Supply of the Meetings Industry Facilities by Country
Middle East
United Arab Emirates -
Dubai
All leading hotels provide multi-purpose meeting venues and facilities
Dubai World Trade Centre provides 53,000 m2 of exhibition space
Other venues catering for smaller events
Dubai Airport Exhibition Centre
Yemen No detailed information
Source: Data collated by authors from UNWTO 2004, Tourism Market Trends, World Tourism Organization, Madrid.


© 2006 World Tourism Organization - ISBN 978-92-844-1195-5
Appendix B
Congress and Convention Centres in the Americas Region
Region Country City Congress and convention centre Total (m2)
North
America
Canada Montreal Montreal Convention Centre 12,247
Quebec Quebec City Convention Centre 21,170
USA Washington, DC Convention and Tourism Corporation 11,617
New York Jacob K. Javits Convention Center 73.296
Chicago Navy Pier
McCormick Place
15,300
198,000
Mexico Mexico City Centro Banamex 34,000
Central
America and
the Carribean
Panama Panama City Atlapa Centro de Convenciones de Panamá 80,000
Cuba Havana Centro Internacional de Conferencias de La Habana
Palacio de Convenciones de La Habana
5,783
2,100
South
America
Chile Santiago Espacio Riesco
Centro Cutural Estación Mapocho
Diego Portales
Casa Piedra
Centro de Extensión Universidad Católica de Chile
San Carlos de Apoquindo
8,000
8,000
5,720
4,400
2,850
2,200
Argentina Buenos Aires (1) Centro Cultural General San Martín
Golden Center
Paseo La Plaza Congresos y Convenciones
Punta Carrasco
Centro Costa Salguero
Centro del Gobierno de la Ciudad
La Rural
5,122
-
-
-
20,533
23,403
44,520
Brazil São Paulo São Paulo Anhembi
Rebouças Convention Center
77,424
1,060
Rio de Janeiro Riocentro
Congresses Hall
100,029
14,222
Uruguay Montevideo (2) Hotel Radisson Victoria Plaza
Hotel Sheraton Montevideo
2,420
Source: Adapted from UNWTO Report, 2005


Total More than 1,000,000
habitants (2 cities)
Between 500,000 and
1,000,000 habitants
(4 cities)
Between 200,000 and
500,000 habitants
(17 cities)
Less than 200,000
habitants (96 cities)
210 642 442 287 166
Case Study: Estudio del Mercado de reuniones en Espana 2003 (Instituto de Turismo de España)
This study was undertaken by the Spanish Ministry of Tourism in 2003 and published in 2004. Itrepresents one of the more comprehensive “economic impact” studies examined as part of this projectand it collected data from the demand and supply sides of the Spanish Meetings Industry.
Method
1. Demand side data collection.
a. 1,816 completed questionnaires by meeting participants
b. Every category had 3 dimensions:
• Geographical: International, national, regional
• Geographical: Size of host city
• Type of event: congress, convention, meeting
c. Delegate Expenditure captured information on accommodation, food, registration fee,shopping, leisure, local transport and “other expenditure”
The participants of the study also had to rate the host city (architecture, cultural offer, etc.), thevenue (interpretation service, facilities, hygiene of rooms, etc.), hotels (service, etc.), restaurants(service, quality of product, etc.), public transport, social programmes during the event (forthemselves and companions)
2. Supply side data collection.
a. 126 completed questionnaires by hotels, city councils, Convention Exhibition Centres
b. Every category the same three dimensions as above
Findings
Average daily expenditure (including registration fee, leisure, accommodation) (€)
Source: Spanish National Tourism Board, 2004, Estudios de Productos Turisticos
Appendix C
Case Study
© 2006 World Tourism Organization - ISBN 978-92-844-1195-5
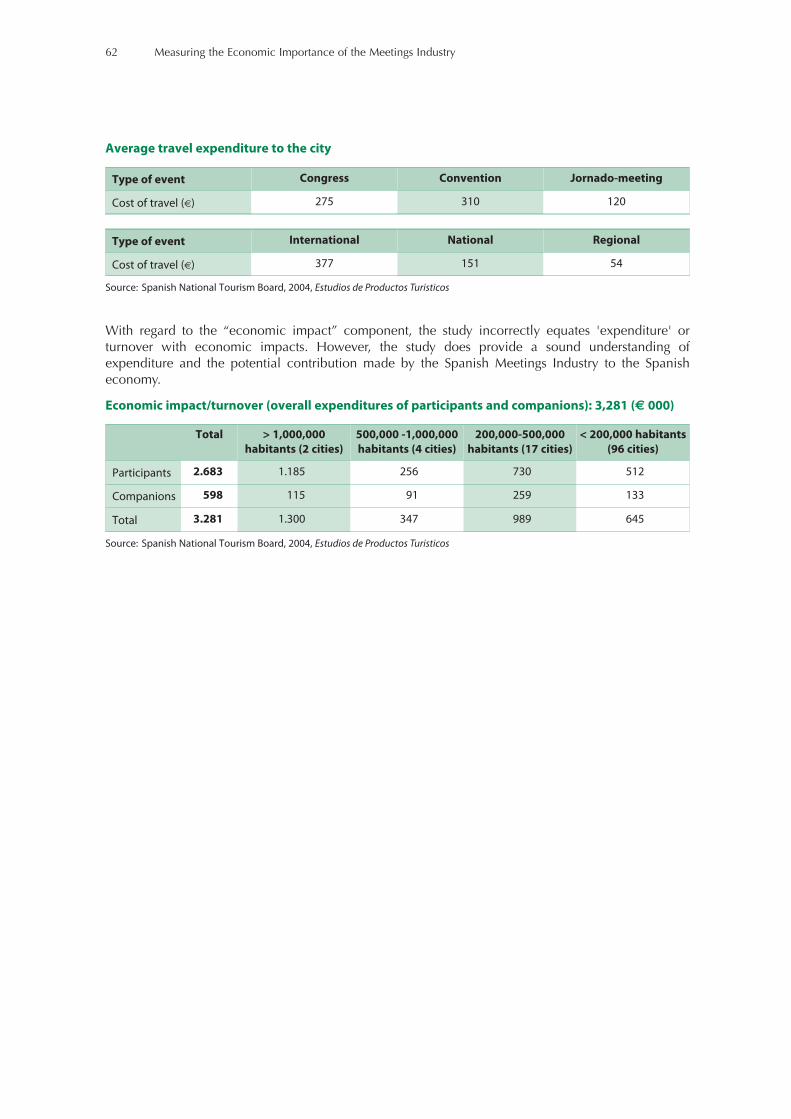
Total > 1,000,000
habitants (2 cities)
500,000 -1,000,000
habitants (4 cities)
200,000-500,000
habitants (17 cities)
< 200,000 habitants
(96 cities)
Participants 2.683 1.185 256 730 512
Companions 598 115 91 259 133
Total 3.281 1.300 347 989 645
Type of event International National Regional
Cost of travel (€) 377 151 54
Average travel expenditure to the city
Source: Spanish National Tourism Board, 2004, Estudios de Productos Turisticos
With regard to the “economic impact” component, the study incorrectly equates 'expenditure' orturnover with economic impacts. However, the study does provide a sound understanding ofexpenditure and the potential contribution made by the Spanish Meetings Industry to the Spanisheconomy.
Economic impact/turnover (overall expenditures of participants and companions): 3,281 (€ 000)
Source: Spanish National Tourism Board, 2004, Estudios de Productos Turisticos
62 Measuring the Economic Importance of the Meetings Industry
Type of event Congress Convention Jornado-meeting
Cost of travel (€) 275 310 120

Appendix D
Definitions
© 2006 World Tourism Organization - ISBN 978-92-844-1195-5
Definition/aim of meeting Source
Any off-site gathering (including conventions, congresses, conferences, seminars,
workshops and symposiums) which brings together people for a common
purpose, the sharing of information. This defines both corporate business (CB) and
association meetings
BECA
(Business Events Council of
Australia)
An event where the primary activity of the attendees is to attend educational
sessions, participate in meetings/discussions, socialise, or attend other organised
events. There is no exhibit component to this event.
CIC
(Convention Industry Council)
A meeting is a coming together of a number of people in one place, to confer or
carry out a particular activity. This can be on an ad hoc basis, or according to set
pattern.
Convention Liaison Council;
CLC, 1993
A meeting is a general term indicating the coming together of a number of people
in one place, to confer or carry out a particular activity.
Frequency: can be on an ad hoc basis or according to a set pattern, as for instance
annual general meetings, committee meetings, etc.
ICCA (International Congress
& Convention Association);
IAPCO
A meeting is an event where fifteen or more people meet on the premise for a
minimum of six hours with a fixed agenda. A meeting lasts less than two days and
does not include overnight accommodation.
Hughes, 1988
A meeting is an event that brings people together for the purposes of sharing
information and to discuss and solve organisational and operational problems. It is
usually a small event, often involving only a few executives. It can be a corporate
meeting, seminar, symposium, or training program.
Rutherford, 1990
Definition/aim of conference Source
1) Participatory meeting designed for discussion, fact-finding, problem solving
and consultation.
2) An event used by any organisation to meet and exchange views, convey a
message, open a debate or give publicity to some area of opinion on a specific
issue. No tradition, continuity or periodicity is required to convene a conference.
Although not generally limited in time, conferences are usually of short duration
with specific objectives. Conferences are generally on a smaller scale than
congresses.
CIC
(Convention Industry Council)
Participatory meeting designed for discussion, fact-finding, problem solving and
consultation. As compared with a congress, a conference is normally smaller in
scale and more select in character – features which tend to facilitate the exchange
of information. The term “conference” carries no special connotation as to
frequency. Though not inherently limited in time, conferences are usually of
limited duration with specific objectives.
ICCA (International Congress
& Convention Association);
IAPCO
A meeting of two or more people to discuss a common concern. IACVB (International
Association of Convention &
Visitor Bureaux)

64 Measuring the Economic Importance of the Meetings Industry
Definition/aim of congress Source
1) The regular coming together of large groups of individuals, generally to discuss
a particular subject. A congress will often last several days and have several
simultaneous sessions. The length of time between congresses is usually
established in advance of the implementation stage, and can be either pluri-
annual or annual. Most international or world congresses are of the former type
while national congresses are more frequently held annually.
2) Meeting of an association of delegates or representatives from constituent
organisations.
3) European term for convention.
CIC
(Convention Industry Council)
Definition/aim of convention Source
An event where the primary activity of the attendees is to attend educational
sessions, participate in meetings/discussions, socialise, or attend other organised
events. There is a secondary exhibit component.
CIC
(Convention Industry Council)
Assemblage of delegates, representatives, and members of an organisation
convened for a common purpose. A general and formal meeting of a legislative
body, social or economic group in order to provide information on a particular
situation and in order to establish consent on policies among the participants.
Usually of limited duration with set objectives, but no determined frequency.
IACVB
(International Association of
Convention & Visitor Bureaux)
Definition/aim of incentive Source
The term “incentives” refers to a global management tool that uses an exceptional
travel experience to motivate and/or recognise participants for increased levels of
performance in support of other organisational tools.
SITE (Society of Incentive &
Travel Executives), 2000.
Meeting event as part of a programme which is offered to its participants to
reward a previous performance.
ICCA (International Congress &
Convention Association);
IAPCO
Definition/aim of association Source
In which the organiser represents an association with members from more than
one entity, which could include service and sporting clubs.
Tourism Australia
(SITE Incentive Magazine,
October 1996;
Market Insights Unit Buyer In-
Depth Interviews Dreamtime
September 2001)
An organised group of individuals and/or companies who band together to
accomplish a common purpose, usually to provide for the needs of its members.
Usually non profit.
CIC
(Convention Industry Council)
A grouping of individuals or companies that collectively serve the interests of their
members that cannot be met effectively by individual action.
ASAE
(American Society of
Association Executives)
Organisation of people with a common purpose. IACVB
(International Association of
Convention & Visitor Bureaux)

65Appendix D: Definitions
Definition/aim of corporate Source
In which the organiser represents a commercial entity. Tourism Australia
(SITE Incentive Magazine,
October 1996;
Market Insights Unit Buyer In-
Depth Interviews Dreamtime
September 2001)
Definition/aim of governmental organisation Source
In which the organiser represents the Commonwealth, state or local government
agency or enterprise.
Tourism Australia
(SITE Incentive Magazine,
October 1996;
Market Insights Unit Buyer In-
Depth Interviews Dreamtime
September 2001)
Definition/aim of non-governmental organisation Source
These are organised by or for federations, professional associations, universities,
NGOs.
UNWTO
(World Tourism Organisation)
An NGO is an organisation established and governed by a group of private citizens
for a stated philanthropic purpose, and supported by voluntary individual
contributions.
Model UNWTO 2000;
Accountability of NGOs
The United Nations” term for a non-profit organisation. ASAE
(American Society of
Association Executives)
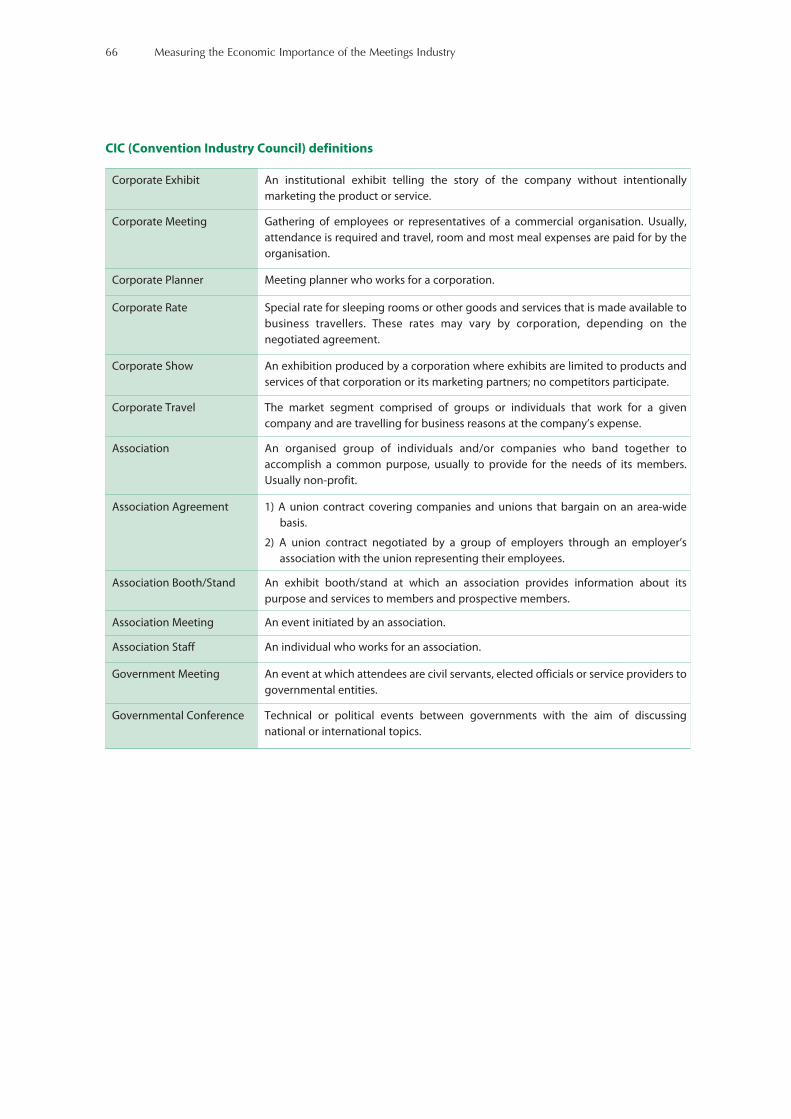
66 Measuring the Economic Importance of the Meetings Industry
CIC (Convention Industry Council) definitions
Corporate Exhibit An institutional exhibit telling the story of the company without intentionally
marketing the product or service.
Corporate Meeting Gathering of employees or representatives of a commercial organisation. Usually,
attendance is required and travel, room and most meal expenses are paid for by the
organisation.
Corporate Planner Meeting planner who works for a corporation.
Corporate Rate Special rate for sleeping rooms or other goods and services that is made available to
business travellers. These rates may vary by corporation, depending on the
negotiated agreement.
Corporate Show An exhibition produced by a corporation where exhibits are limited to products and
services of that corporation or its marketing partners; no competitors participate.
Corporate Travel The market segment comprised of groups or individuals that work for a given
company and are travelling for business reasons at the company’s expense.
Association An organised group of individuals and/or companies who band together to
accomplish a common purpose, usually to provide for the needs of its members.
Usually non-profit.
Association Agreement 1) A union contract covering companies and unions that bargain on an area-wide
basis.
2) A union contract negotiated by a group of employers through an employer’s
association with the union representing their employees.
Association Booth/Stand An exhibit booth/stand at which an association provides information about its
purpose and services to members and prospective members.
Association Meeting An event initiated by an association.
Association Staff An individual who works for an association.
Government Meeting An event at which attendees are civil servants, elected officials or service providers to
governmental entities.
Governmental Conference Technical or political events between governments with the aim of discussing
national or international topics.

In 2005, the Australian Sustainable Tourism Co-operative Research Centre conducted a “NationalBusiness Events Study” (NBES), a national review of the business events sector.
The key objectives of the NBES were:
• To provide an estimate of the sector in relation to its:
- Size;
- Economic contribution
• To provide increased knowledge of the decision-making processes of delegates/attendees in theBusiness Events Sector; and
• To provide key indicators for monitoring the performance of the Business Events Sector insubsequent years.
Only venues that were members of a convention bureau were included in the study. This was felt to beoverly restrictive as there are many commercial event venues that are not members of a conventionbureau, especially in regional areas. As a consequence, it was decided to expand the range of venuesincluded in the NBES. Excluded from the list of venues, however, were the following categories ofvenues as business events were not seen to be a core part of their overall business:
• Metropolitan community halls, school halls
• Bowling clubs, scout halls
• RSL clubs
• Motels, serviced apartments, apartments
• Restaurants
• Cruise ships, boats
• Leisure and aquatic centres, small sports clubs
• Guest houses, cottages
• Marquees.
There was substantial debate surrounding these exclusions between members of the steering committeedue to the fact that major differences occur across states and more particularly between capital citiesand regional areas. However, the above exclusions were finally agreed upon in the interests of ensuringcomparability of the findings. It should be noted that because only commercial venues were includedin the study, many meetings held in corporate offices and the like were not included. Additionally, itmust be noted that only the venue where the meeting component was held was included, not anyvenue which may have hosted associated social functions. It was important to exclude the latter toavoid double counting.
Source: Deery, M., Jago, L., Fredline, L. and Dwyer, L. (2005). National Business Events Study: An Evaluation Of The Australian Business
Events Sector, Common Ground, Melbourne.
Appendix E:
Example of Venue Identification fromthe National Business Events Study (NBES)
© 2006 World Tourism Organization - ISBN 978-92-844-1195-5


A: Congress Travel Agencies & Destination Management Companies. These handle the groundarrangements and/or flight arrangements for conference delegates.
B: Airlines and airline alliances. The code covers the departments responsible for selling andpromoting special conference packages for large events; significant variations between the sizeand functions of these departments, or even whether they are a separate department or part of a“partnerships” department. Delegate expenditure on flights is a big slice of the value of theindustry, but there are no decent estimates for how large this is, since airlines don’t segment bypurpose of visit.
C: Professional Congress Organisers. PCO’s typically handle international association meetings, butthe larger PCO companies also handle corporate events. Other types of intermediaries (whowould join ICCA as part of this group if they were to apply for membership) include: venue findingagencies; conference agencies (specialise in corporate events); production houses; marketing andcommunication agencies. A general term could be “event organising companies”.
Exhibition organisers should in reality be a different segment altogether, we only have those whoorganise Meetings Industry exhibitions (see below for Meetings Industry types we don’t represent).
D: Convention bureaux and tourist boards. These include national and city bodies with responsibilityfor destination marketing. Could be public sector, private sector, or more commonly partnershiporganisations involving public and private sectors working together. Frequently have responsibilityfor leisure tourism marketing as well as meetings business.
E: Meeting information and technical specialists. This category of ICCA membership covers a rangeof different types of suppliers, of which the largest groupings are: Trade publications and mediacovering different aspects of the Meetings Industry; IT companies producing specialised softwareor electronic hardware to run meetings; Non-electronic hardware, such as seating systems orexhibition stand builders; and Consultants and marketing representation companies.
F: Meetings Hotels. These include Specialist hotels with large meetings facilities.
G: Convention and Exhibition Centres. These include a wide range of venues, from converted historicpalaces to massive purpose built convention halls, including university facilities and somecombined hotel/convention centre properties.
Supplier types not represented in ICCA include:
• Incentive Houses
• Exhibition organisers
• Exhibition contractors
• Speaker bureaux
• Corporate entertainment
• Catering companies
• Smaller hotels which host lots of meetings but wouldn’t regard themselves as meetings specialists
Appendix F:
ICCA (International Congress & ConventionAssociation) Categories
© 2006 World Tourism Organization - ISBN 978-92-844-1195-5

70 Measuring the Economic Importance of the Meetings Industry
And in-house planners are not represented:
• In-house Corporate planners
• In-House Association and not-for profit organisations (NGOs, government) planners

Questionnaire One: Venue Survey
1. Where is your venue? City
State/Region
2. What was the total number of “meetings” that your venue hosted overthe period? (suggest the data collect period be either a month or a quarter)
Of the total number of “meetings” how many were Government meetings?
How many were association meetings?
How many were corporate meetings?
Of the total number of “meetings” how many were predominantly conferences?
How many were predominantly exhibitions?
Of the total number of “meetings” how many ran for a single day or less?
How many ran for more than one day?
Of the total number of “meetings”, how many were small meetings(less than 100 delegates)
How many were medium sized meetings? (100 – 500 delegates)
How many were large meetings? (more than 500 delegates)
3. What was the total number of delegates at these “meetings”?(all delegates at all meetings)
Of the total number of delegates how many were attendingGovernment meetings?
How many were attending association meetings?
How many were attending corporate meetings?
Appendix G
Examples of Questionnaires toCollect Relevant Data
© 2006 World Tourism Organization - ISBN 978-92-844-1195-5

72 Measuring the Economic Importance of the Meetings Industry
Of the total number of delegates how many were attending conferences?
How many were attending exhibitions?
Of the total number of delegates how many attended “meetings”which ran for a single day or less?
How many attended meetings that ran for more than one day?
4. What is the total seating capacity of your venue with all“meeting” facilities combined?
5. What is the seating capacity of your largest single space, that ishow many delegates can you host in a single space?
6. Which of the following best describes your venue?
Purpose built conference/exhibition centre
Large hotel (more than 50 rooms) with meeting facilities
Small hotel (less than 50 rooms) with meeting facilities
Other ______________________________

73Appendix G: Examples of Questionnaires to Collect Relevant Data
Questionnaire Two: Organiser Survey
1. Where was this “meeting” held? City
State/Region
2. Which of the following best describes this “meeting”?
Conference/convention with registration fees
Conference/convention without registration fees
Exhibition/trade show
Incentive
3a. How many delegates attended this “meeting” in total?
3b. How many delegates came from the local area, that is, the city where your“meeting” was hosted?
3c. How many delegates came from a different region within the host country?
3d. How many delegates came from overseas?
4. Which of the following best describes the host of this “meeting”;that is, the organisation that hired your company to organise the meeting?
Government
Association
Corporate
Other _______________________________________
5. For how many days did the “meeting” run? Days or hours
If less that 1 full day please report hours
6. In organising this “meeting”, how much money did you (or the host organisation)spend in each of the following categories?
Venue Hire
Food and Beverage
Equipment/production/technical costs
Administration
Advertising and promotion of meeting
Keynote speaker and other sponsored attendees
Insurance
Other _________________________________________________
Total expenditure
$
$
$
$
$
$
$
$
$
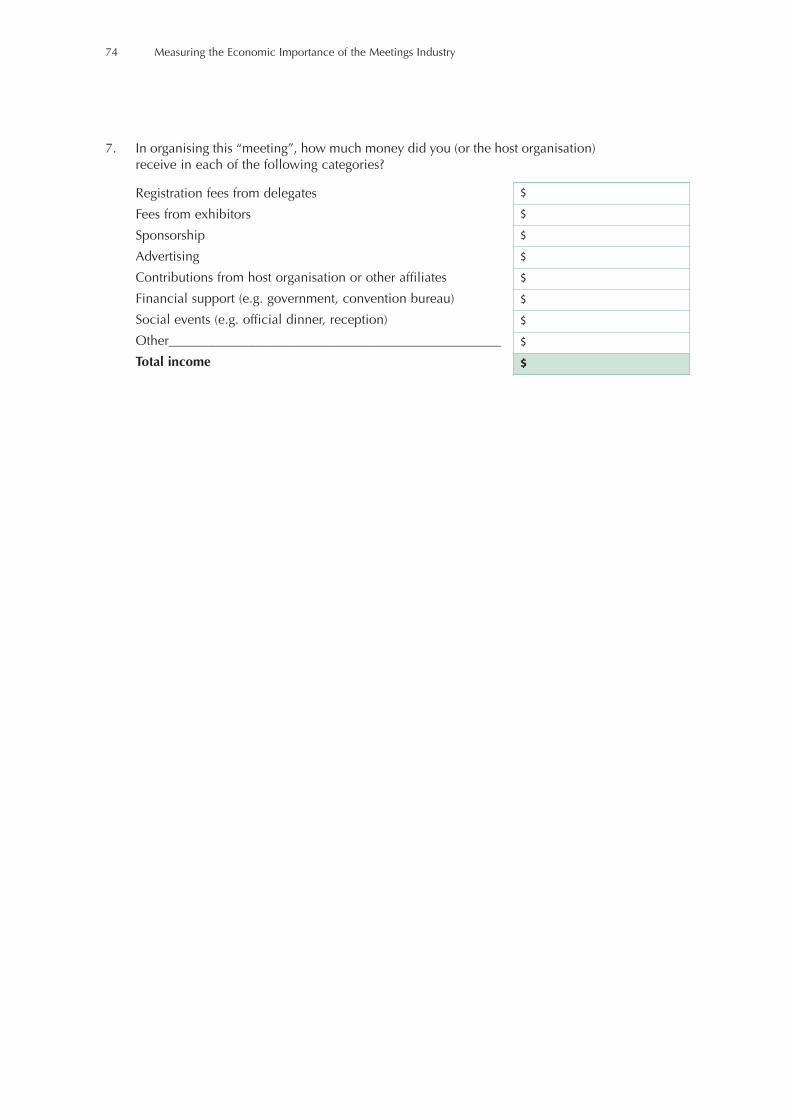
74 Measuring the Economic Importance of the Meetings Industry
7. In organising this “meeting”, how much money did you (or the host organisation)receive in each of the following categories?
Registration fees from delegates
Fees from exhibitors
Sponsorship
Advertising
Contributions from host organisation or other affiliates
Financial support (e.g. government, convention bureau)
Social events (e.g. official dinner, reception)
Other__________________________________________________
Total income
$
$
$
$
$
$
$
$
$
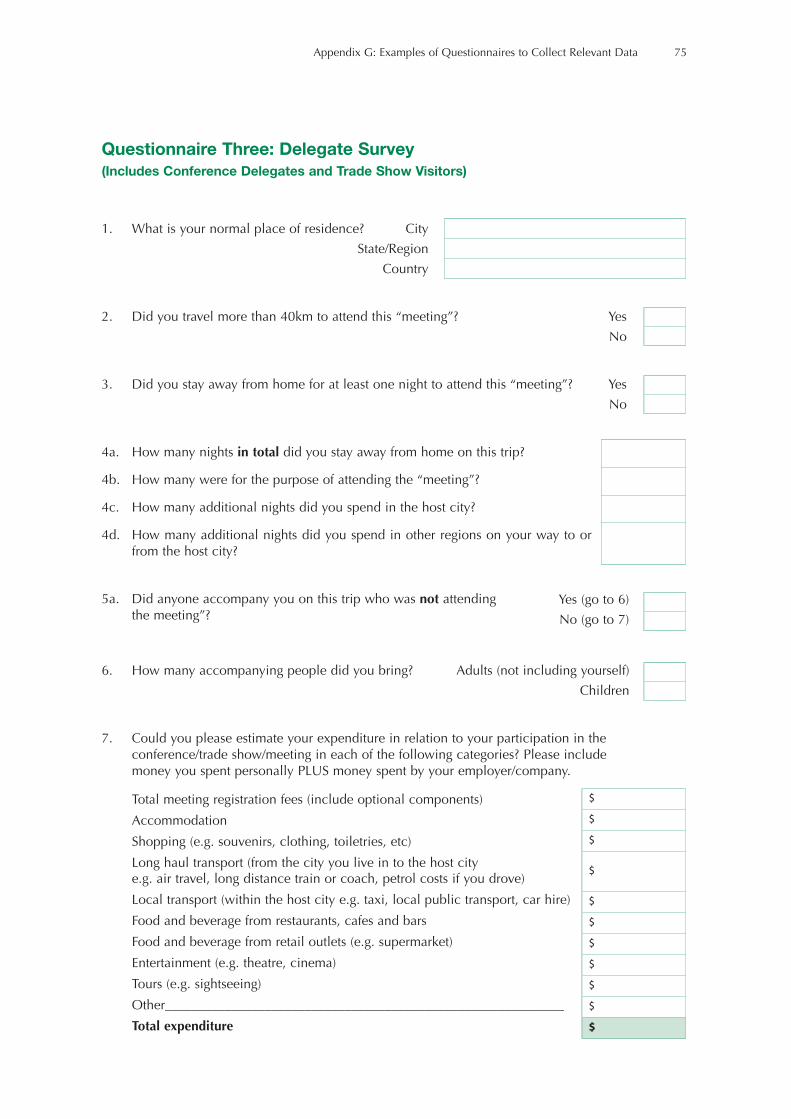
75Appendix G: Examples of Questionnaires to Collect Relevant Data
Questionnaire Three: Delegate Survey (Includes Conference Delegates and Trade Show Visitors)
1. What is your normal place of residence? City
State/Region
Country
2. Did you travel more than 40km to attend this “meeting”? Yes
No
3. Did you stay away from home for at least one night to attend this “meeting”? Yes
No
4a. How many nights in total did you stay away from home on this trip?
4b. How many were for the purpose of attending the “meeting”?
4c. How many additional nights did you spend in the host city?
4d. How many additional nights did you spend in other regions on your way to orfrom the host city?
5a. Did anyone accompany you on this trip who was not attending the meeting”?
6. How many accompanying people did you bring? Adults (not including yourself)
Children
7. Could you please estimate your expenditure in relation to your participation in theconference/trade show/meeting in each of the following categories? Please includemoney you spent personally PLUS money spent by your employer/company.
Total meeting registration fees (include optional components)
Accommodation
Shopping (e.g. souvenirs, clothing, toiletries, etc)
Long haul transport (from the city you live in to the host city e.g. air travel, long distance train or coach, petrol costs if you drove)
Local transport (within the host city e.g. taxi, local public transport, car hire)
Food and beverage from restaurants, cafes and bars
Food and beverage from retail outlets (e.g. supermarket)
Entertainment (e.g. theatre, cinema)
Tours (e.g. sightseeing)
Other____________________________________________________________
Total expenditure
Yes (go to 6)
No (go to 7)
$
$
$
$
$
$
$
$
$
$
$

76 Measuring the Economic Importance of the Meetings Industry
8. Does the above expenditure relate to yourself only or does it includeexpenditure for the people who accompanied you?
Myself only
Includes accompanying people

77Appendix G: Examples of Questionnaires to Collect Relevant Data
Questionnaire Four: Exhibitor Survey
1. What is your normal place of residence? City
State/Region
Country
2. Did you travel more than 40km to attend this exhibition? Yes
No
3. Did you stay away from home for at least one night to attend this exhibition? Yes
No
5. Could you please estimate your expenditure in each of the following categoriesassociated with your exhibit? Please include money you spent personallyplus money spent by your employer/company.
Floor space rental for your exhibit
Stand construction cost
Equipment hire
Electricity/lighting
Advertising/promotion
Hire of temporary staff
Display material
Freight
Other __________________________________________________
Total expenditure
6. Could you please estimate your expenditure in each of the following categoriesfor your trip? Please include money you spent personally plus money spent byyour employer/company.
Accommodation
Shopping (e.g. souvenirs, clothing, toiletries etc)Long haul transport (from the city you live in to the host city e.g. air travel, long distance train or coach, petrol costs if you drove)Local transport (within the host city e.g. taxi, local public transport, car hire)
Food and beverage from restaurants, cafes and bars
Food and beverage from retail outlets (e.g. supermarket)
Entertainment (e.g. theatre, cinema)
Tours (e.g. sightseeing)
Other __________________________________________________
Total expenditure
$
$
$
$
$
$
$
$
$
$
$
$
$
$
$
$
$
$
$
$


Brookings Institute (2005), The Realities of Convention Centres as Economic Development Strategy
British Tourist Authority (2001), Estimating the Direct Expenditure Benefits of Conferences to a Local Area
British Tourist Authority (2003), British Conference Venues Survey 2003
Canadian Tourism Commission (2002), US Business Traveller to Canada Study, Summary 2002
Deery, M., Jago, L., Fredline, L. and Dwyer, L. (2005), National Business Events Study: An Evaluation Of TheAustralian Business Events Sector, Common Ground, Melbourne
Finland Convention Bureau (2005), The World of Meeting Statistic, Presentation by Tuula Lindberg, EFCT SummerSchool, Malta
France Congres (2003), Survey of Economic Benefits, available: http://www.france-congres.org (30-8-2005)
Heath, E., Pretorius, T. & Fairer-Wessels, F. (2005), Executive Summary: EXSA Extension 3 Research Study,University of Pretoria
International Congress & Convention Association, ICCA Data, Statistics Report International Association andCorporate Meetings Market 2003, available: http://www.tourism.australia.com/BTEvents.asp?sub=0295(20-5-2005)
Incentive Federation Inc. (2003), Federation Study 2003: Incentive Federation Survey of Motivation and IncentiveApplications, Centre for Concept Development Ltd.
Instituto de Turismo de España (2003), Estudio del mercado de reuniones en España – 2004, Madrid
International Congress & Convention Association, ICCA (2004), Statistics Report. International Association andCorporate Meetings Market, Netherlands
Kim, S., Chon, K. & Chung, K. (2003), ‘Convention industry in South Korea: an Economic Impact Analysis’, TourismManagement, 24, pp. 533-541
Malta Tourism Authority (2003), The Conference and Incentive Travel Market in Malta for the Years 2000-2001,Malta
Meeting Professionals International, MPI (2004), FutureWatch 2004, Colin Rorrie
Ontario Ministry of Tourism and Recreation (2005), The Economic Impact of Business Conventions in Toronto in2002, Toronto
Society of Incentive and Executive Travel Executives (2004), available: http://www.site-intl.org/ (25-10-2005)
Spanish National Tourism Board (2004), Estudios de productos turísticos
Sri Lankan Convention Bureau (2004), ‘The MICE Report’, Sri Lankan Convention Bureau Research Bulletin
Successful Meetings (2005), 2005 State of the Industry Report, New York
Sultan, E., Ditzian, I., & Darsa, J. (2002), Characteristics of Conference Tourism in Israel. 6th International Forumon Tourism Statistics, Budapest, 25-27 September 2002
Bibliography
80 Measuring the Economic Importance of the Meetings Industry
Tourism Australia (2005), Business Events, Presentation by Meg Yeates, Sydney (27-7-2005)
Union of International Associations (UIA) (2003), available: http://www.uia.org/statistics/press/press03.pdf(30-8-2004)
World Tourism Organization (2001), Tourism Satellite Account: Recommended Methodological Framework, WorldTourism Organisation, Commission of the European Communities-Eurostat, Organisation for Economic Co-operation and Development (OECD) and United Nations Statistical Division
World Tourism Organization (2004), Tourism Market Trends
World Tourism Organization (2005), Basic Introductory Report: The Meeting Conventions Market in the Americas’,International Seminar on MICE Tourism and Business Tourism, World Tourism Organisation, Chile, 25-26 May2005
Weber, K. & Chon, K. (2002), ‘Convention tourism. International research and industry perspectives’, The HaworthHospitality Press, New York
Weber, K. & Ladkin, A. (2004), ‘Trends Affecting the Convention Industry in the 21st Century’, Journal ofConvention & Event Tourism, 6 (4), pp. 47-63

List of Abbreviations
© 2006 World Tourism Organization - ISBN 978-92-844-1195-5
Acronym Meaning
CEIR Centre for Exhibition Industry Research
CIC Convention Industry Council
CPC Central Product Classification
GDP Gross Domestic Product
GVA Gross Value Added
IACVB International Association of Convention and Visitor Bureaux
IAPCO International Association of Professional Congress Organisers
ICCA International Congress and Convention Association
ISIC International Standard Industrial Classification
MIAA Meetings Industry Association of Australia (now Meetings and Events Australia)
MPI Meeting Professionals International
SITE Society of Incentive and Travel Executives
SNA System of National Accounts
STCRC Sustainable Tourism Co-operative Research Centre
TSA Tourism Satellite Account
UIA Union of International Associations
UNWTO World Tourism Organisation