Embed Size (px)
Citation preview
© 2013. Hasnain Manzoor. This is a research/review paper, distributed under the terms of the Creative Commons Attribution-Noncommercial 3.0 Unported License http://creativecommons.org/licenses/by-nc/3.0/), permitting all non-commercial use, distribution, and reproduction in any medium, provided the original work is properly cited.
Global Journal of Management and Business Research Interdisciplinary
Volume 13
Issue 3
Version 1.0 Year
2013
Type: Double Blind Peer Reviewed International Research Journal
Publisher: Global Journals Inc. (USA)
Online ISSN: 2249-4588
& Print ISSN: 0975-5853
Measuring Student Satisfaction in Public and Private Universities in Pakistan
By Hasnain Manzoor
Mohammad Ali Jinnah University, Islamabad
Abstract
-
Purpose -
This specific study is aimed to find the specific factors which affect the satisfaction of the students in universities in Pakistan and to find these factors’ relationship either positive or negative with the satisfaction.
Design/Methodology/Approach -
Different statistical tools were used during the study, which were compatible with our
study such as Reliability analysis, Multiple Regression Analysis and ANOVA. In our questionnaires we used “Likert Scale” to get the more accurate and specific results and views from the respondents.
Findings -
The results of this study suggest that the facilities provided to the students regarding the sports facilities and the transportation facilities have significant effect on the satisfaction of the students in universities, while the accommodation facilities don’t have any significant effect on the satisfaction of the students.
Research implications/limitations –
The limitations of the research are that we only included the non-educational facilities regarding the universities providing to the students.
Keywords : student satisfaction, universities,
service
quality.
GJMBR-G
Classification
: JEL Code: P36
MeasuringStudentSatisfactioninPublicandPrivateUniversitiesinPakistan
Strictly as per the compliance and regulations of:

Measuring Student Satisfaction in Public and Private Universities in Pakistan
Hasnain Manzoor
Author
:
Department of
Management Sciences
Mohammad Ali Jinnah University, Islamabad.
:
Abstract
-
Purpose -
This specific study is aimed to find the specific factors which affect the satisfaction of the students in universities in Pakistan and to find these factors’ relationship either positive or negative with the satisfaction.
Design/Methodology/Approach -
Different statistical tools were used during the study, which were compatible with our study such as Reliability analysis, Multiple Regression Analysis and ANOVA. In our questionnaires we used “Likert Scale” to get the more accurate and specific results and views from the respondents.
Findings -
The results of this study suggest that the facilities provided to the students regarding the sports facilities and the transportation facilities have significant effect on the satisfaction of the students in universities, while the accommodation facilities don’t have any significant effect on the satisfaction of the students.
Research implications/limitations –
The limitations of the research are that we only included the non-educational facilities regarding the universities providing to the students.
Keywords
:
student satisfaction, universities, service quality.
I.
Introduction
ducation plays an important role in the development of any country, in the economic better of that country, upgrading the standards of
living of people etc. In the education higher education is even more necessary as all the professionals are produced by the higher education. Every country tries to develop such institutions which produce high quality professionals in every field. Pakistan is a developing country and also trying to develop its people with respect to their standard of living by delivering more and more education by setting up education institutions especially higher education institutions are focused. The number of institutions delivering higher education in Pakistan has increased in last few years, as well as the enrollment in these institutions has increased very much (HEC Pakistan 2010).
The number of students has increased many
times because high technology sectors and business are now demanding at least a college degree for their jobs. According to Sedgwick (2005) Pakistan has to accommodate about 1.3 m students in the higher education institutions of Pakistan. Higher education institutions are considering their students as customers and treating this service as a genuine business service.
As the satisfying the needs of ultimate customers which are here students of these higher education institutions is the basic goal of these institutions, they are trying to meet the increasing number of expectations and trying to meet the high quality of the students demanded at this higher level of education (DeShields et al, 2005).
The success of these higher education insti-tutions depends upon the satisfaction of their students as well as this satisfaction is used by these institutions to search out their strengths and weaknesses. Student satisfaction does not depend upon only on the teaching but an extensive analysis of the factors which contribute to the satisfaction of the students regarding their institutions as well as their programs. The higher education institutions have become relational services, these services are in which service provider i.e. education institutions and service receiver i.e. students, interact for improving and designing the outputs which satisfy the both parties. These institutions face high national as well as international competition in the field of education so they choose the same strategies which the mostly genuine business firms do (Jarvis, 2000).
There are a lot of higher education institutions in Pakistan. From the 18 billion populations, only 2.6 percent of population is enrolled in the higher education institutions in Pakistan while adult literacy rate is only 43%. Even then besides of having these bleak statistics, there is a tremendous increase in the enrollment of student and so in the number of higher education institutions. There are two set of educational institutions in Pakistan, Public government owned and the Private which are owned locally by different people. These institutions are not only accommodating the huge rush to these institutions but also trying to provide quality educational services to the students enrolled (HEC Pakistan, 2010).
Quality in the educational institutions can’t be achieved unless there is a continuous assessment as well as measures are taken to improve the performance of the teachers. Teachers in higher education institutions especially in the university have the responsibility of delivering quality education through finding the better
ways of delivering knowledge, researches, reviewing and updating their knowledge as well as improving the curriculum to satisfy the students as the students is the customers of the institutions. In Arab, it is found that the current evaluating studies focus on preparation and knowledge of teachers, their training of teaching and a
E
© 2013 Global Journals Inc. (US)
5
Globa
l Jo
urna
l of M
anag
emen
t an
d Bu
siness Resea
rch
Volum
e XIII
Issue
III
Ver
sion
IY
2013
ear
(
)G
bit emphasis on the research knowledge of teachers is given (Said et al, 1979).
The purpose of this study is to have a look on the variables which contributes towards the satisfaction of the students in the universities of Pakistan either they are public or private. We will define what the satisfaction does mean, which are the factors which are important for improving students satisfaction, education as a service, educational institutional as a service business entities etc. The method used in this study for evaluating students’ satisfaction in different universities is Questionnaires. We will take the opinions of different students of different universities through structured questionnaires. Then the results or opinions which will be collected will be put in the SPSS. First of all we check the frequency of respondents, then reliability test and finally regression analysis and conclude results.
II. Literature Review The studies of satisfaction have been
conducted in different countries but main focus of student satisfaction in the higher studies especially in the universities is present in these studies, that’s why we are mentioning here there results and findings in order to support our results and findings. The institutions which are providing higher education services are now realizing that their services of education can be regarded as the services same as the business services, so these institutions are focusing now not only to meet the study requirement of student but are trying to exceed these requirements in order to satisfy their ultimate customers which are definitely the students. This changing trend is identified especially in those countries which are basically following tuition based model of studies, (DeShields et al., 2005). In Germany, there was first time introduction of the tuition fees for universities when a law was passed for the charging of the fees in January 2005. It is now believed that after this law, when universities are charging fees from the students, they will be service provider to the students and will actively react to the needs of the students, (Williams and Cappuccini-Ansfield, 2007). The introduction of tuition fees in Germany will also change the behavior of the students towards education as they will turn from a free recipient of education towards the consumer of these universities because now they are paying fees to these universities, this was said by Rolfe (2002). It is expected that fee paying student now will feel value of money, and will act as the consumers of these education institutions, (Watson, 2003 and Narasimhan, 2001).
Thomas and Gal ambos, (2004) give views, that now when the student are being considered the consumers of higher education institutions, their satisfaction is becoming more important to these institutions especially the institutions which are going to get new students for admissions in them. The
satisfaction of the students as well as learning of these students should be important for the institutions as their outcome, (Applenton-Knapp and Krentler 2006).
From the year 2010, a Bologna process is adopted also in the Germany the purpose of which is to implement the same level of education standards throughout the Europe. The two levels of education bachelors and masters are adopted in Germany also to achieve the purpose of the above mentioned process. So, it is possible for the students in Germany to complete their bachelors and master level education at different universities. This will make the universities to treat their students as customers and try to retain their students because it is far more difficult and expensive than their retention, (Joseph et al, 2005).
Helgesen and Nesset (2007) emphasize the importance of retention the students equal to the recruitment of new students. Higher education can be categorized as a pure service, (Oldfield and Baron 2000). Hennig-Thurau (2001) says that educational services are the field of services marketing. Some authors also differentiated educational services from other services as education plays an important role
in
the life of a student as well as motivational force and intellectual skills are also necessary. There is a basic focus on the perceived quality in services studies. This perceived quality can be measured by comparing the expectations of the customers with actual services, (Zeithaml 1990).
There are many characteristics of services found in educational services such as they are intangible, heterogeneous, and perishable and are consumed at the spot hen produced (Shank 1995). These are the characteristics which make the educational services unique (Zeithaml 1985). These characteristics make the service quality impossible to measure objectively (Patterson and Johnson 1993).
Every participant in the educational services has its own definition of service quality. The result is that the best definition of service quality as well as its way of measuring this quality doesn’t exist (Clewes 2003). As the services are intangible and complex in nature, there is a lot of debate on this issue of measuring the quality from over last 25 years (Prabha 2010). He further said that to measure the quality of the educational services, there also is very much debate and research in the studies and researches conducted. The three variables quality, satisfaction and performance are
in close and
interrelated relationship to each other and are used synonymously (Cornin 2000, Bitner and Hubert 1994).
The satisfaction of the students in the context of educational service can be referred as how the students evaluate their outcomes regarding the education and experiences in the educational institutions (Oliver and Desarbo 1989). Borden (1995) insisted that satisfaction of the students relates to comparison between student
© 2013 Global Journals Inc. (US)
Globa
l Jo
urna
l of M
anag
emen
t an
d Bu
siness Resea
rch
Volum
e XIII
Issue
III
Ver
sion
IY
2013
ear
(
)G
Measuring Student Satisfaction in Public and Private Universities in Pakistan
priorities and the environment which they perceive in the
6
institution. In 2002 Wiers-Jenssen stated that the satisfaction of the students can be used as a main tool to compare the traditional view of improving higher education and market oriented goals.
A study conducted by Mamun and Das (1999) explored some interesting
factors in the satisfaction of
the students in higher education institutions. The factors which they included are facilities of library, facilities of labs. And the factor that how much assistance is provided to the students for their internship programs. A very nice study in the context of educational services and students’ satisfaction was conducted by Zahid, Chowdhry and Sogra (2000). They took different variables for studying the satisfaction of students in higher education institutions. These variables included the system of examination and course i.e. Annual System or Semester System, the quality of teachers and their delivery of knowledge to the students, the medium of teaching either it is English or local language, where the campus is located and its size, accommodating facilities for the students, the facilities which are provided to the students in the campus such as auditorium, parking facilities, canteen etc. They considered these variables as key factors for measuring students’ satisfaction.
In a different study regarding student satisfaction, same factors and variables were used which are mentioned above as well as in this study quality of teaching, method used for teaching, teachers support to the students in their studies and the facilities
provide to the students were considered as the basic factors of satisfaction (Majid, Mamun and Siddique 2000). The curriculum which adds skills in the students and the quality of teaching are the two main factors, should be considered in students satisfaction (Ahmad and Anwar 2000). Satisfaction of the customer can be treated as the feeling or attitude which the customer has after using the service or product (Metawa and Almossawi 1998).
Some researchers treat customer satisfaction related to the variables
like quality of service provided
and the facilities associated with the service such as convenience and the location of the service. Higher education can be treated as a professional service with the features of the intangibility, inseparability and variability (Bateson 1989, Lovelock 1983). Service performance due to its variability may be varying daily, according to change in location or even several times in a day. So this variability of service makes the measuring students satisfaction difficult. Sapri, Kaka and Finch (2009) said that the institutions dealing in higher education should have proper infrastructure as buildings, facilities, recreation centers etc. Students are generally satisfied if the quality and facilities provided meet their expectations otherwise, they are dissatisfied from the educations as well as the institutions providing them the services (Petruzzellis, Uggento and Romanazzi, 2006). The students, who have got
satisfaction, comment positively and recommend the new students to get admissions in these institutions.
Service quality may be stated as a form of
attitude, evaluation on long term basis but the service satisfaction is specific to a transaction (Parasuraman 1988). Due to this way of definition, perceived service quality was said to be a global measure and satisfaction to service quality was the direction of the causality. There is a need of measuring the existing relationship between all the three factors, customers, service quality and ultimately the satisfaction at three different levels of measurements. These levels are Cognitive, affective and behavioral (Oliver 1997, Parasuraman 1985).
Satisfaction related to service has an apparent
dimension of transactions which is related to perception and hence emotional side (Iacobucci 1994), while the quality of service process is resulted from the rational or cognitive process, and hence referred to sensing and evaluating the external stimuli (Bitner 1990 and Christou 2001). The consumer and organization satisfaction emphasizing concept of marketing, in different studies are applied to higher education institutions such as universities (Amyx and Bristow 1999, Zafiropoulos 2005). As there is growing competition among different universities, they are using marketing concepts for attracting as well as retaining the students. Due to close resembles with services (Cherubini 1996, Pellicelli 1997 Zeithaml and Bitner 2002), higher education is being applied on, the concepts of service quality and the satisfaction of ultimate customer. As the
new students are becoming more aware and have knowledge about the institution as well as quality of the education, they are more interactive as well as selective to their future, so it is becoming more difficult for the institutions to attract them (Sigala and Baum 2003).
Due to the increasing demands and
expectations of the students to education as well as institutions has led the educational systems to change from the traditional system towards a customer based market of education (Sigala2002, 2004). If the teacher is more competent, students get more satisfaction. Lunenberg and Ornstein (2004) described the competency of teacher as the knowledge and the ability a teacher possesses. Teacher competency is the skill, ability and knowledge of the teacher (Mondy and Noe 2005). Competency of a teacher is not only knowledge, ability and skill but also complex mental ability of processing as well as mobilization (Oliva 2009). The performance of a teacher is directly affected by his knowledge as well as ability of
the teacher (Cheng 1995). As the competency of teachers have direct effect on the satisfaction of students, so we defined competency by different writers and researchers. In many studies students’ satisfaction is described as the
© 2013 Global Journals Inc. (US)
7
Globa
l Jo
urna
l of M
anag
emen
t an
d Bu
siness Resea
rch
Volum
e XIII
Issue
III
Ver
sion
IY
2013
ear
(
)G
Measuring Student Satisfaction in Public and Private Universities in Pakistan
positive feelings of the student towards his program and institution (Sum et al., 2010; Qui et al., 2010).
Lo (2010) described the students’ satisfaction as their perception about the environment in which they

are getting education and it closely relates the role of both teachers and students. Student satisfaction can be described as how students perceive and evaluate the services and facilities provided in the institutions (Qi et al 2010). Student satisfaction can be described as the feedback which students give towards the campus
and program (Gibson, 2010). Student satisfaction and their positive feelings are contingent to the experiences and academic performance in the institution (Sum et al, 2010).
Students’ satisfaction is directly affected by the how much the teachers are competent, the institutional or campus environment and attitude and the curriculum of the program (Qi et al, 2010). Palmer and Holt (2009) considered that the relationship and the interaction between the students and teachers have positive relationship towards the satisfaction of the students.
III.
Data
and
Methodology
a)
Data
The study is conducted using both type of data, Primary and Secondary. Primary data is used for the basic study about the perception of students regarding the facilities provided them in the
higher education institutions in Pakistan either they are satisfied or not while the Secondary data is used to build the study framework and analysis system.
b)
Primary Sources of Data
Questionnaires are being used as a primary source to collect the data regarding the satisfaction of students about the facilities provided to them in universities.
c)
Questionnaires
A sample of 300 students was distributed among 300 well structured questionnaires to collect their perception views about the facilities provided to them in universities. Students from different departments and different universities were selected as a sample and they were given questionnaires to give their perception about the facilities of the universities provided to them and were asked if they were satisfied from them or other. The response from the students of sample was appreciable and they supported in giving their fair views and perceptions about the facilities.
d)
Sampling
As we know that it is impossible for any researcher to collect the responses from a whole population, so he selects a sample which justifies and represents the whole population. In this research study, we selected a sample of 300 students from 6 private and public universities.
These 6 universities University of Sargodha, Punjab University Lahore, University of Engineering and Technology Faisalabad, University of Lahore, Hajvery University Lahore and NFC University Multan. From
these universities 300 respondents were selected from different level of education, Bachelors, Masters and others which have passed at least 1 year in that university.
e)
Methodology
Different statistical tools were used during the study, which were compatible with our study such as Reliability analysis, Multiple Regression Analysis and ANOVA. In our questionnaires we used “Likert Scale” to get the more accurate and specific results and views from the respondents. I used the questionnaires of ROSLINA BINTI ABDULLAH.
IV.
Conceptual
Framework
The main purpose of conducting this study is to find the affect of different factors the satisfaction of the students in higher education institutions especially in Universities. In order to conduct this study the dependent variable Students’ Satisfaction was selected. The other independent variables which were selected are:
a)
Independent Variables
Recreation
and Sports facilities in the campus for Students
Accommodation facilities for the Students
Transportation Facilities for the Students
© 2013 Global Journals Inc. (US)
8
Globa
l Jo
urna
l of M
anag
emen
t an
d Bu
siness Resea
rch
Volum
e XIII
Issue
III
Ver
sion
IY
2013
ear
(
)G
Measuring Student Satisfaction in Public and Private Universities in Pakistan

Although the main focus of any educational institution is on the basic purpose which is definitely the studies and education of the students but there is also a need to provide the students with extracurricular activities which evokes and polish the students extra skills and knowledge as well as their talent seeks the right direction. These activities include the sports for which the universities provide the required good facilities to the students.
Accommodation facilities, is the second main variable of this study with relationship to the students satisfaction. It is necessary for the universities to provide the accommodation and living facilities for the students who are from the distant areas or from other cities and who have the difficulties in coming to the university daily. This will definitely affect the students’ satisfaction.
Similarly, transportation facilities for the students who live away from the university in the same city are necessary. Each student can’t afford to come to university daily from the distant location so it’s the responsibility of the university to provide them transportation facilities.
b)
Dependent Variable
The only dependent variable in this study is the student satisfaction. We are going to study the factors which affect the satisfaction of the students such as recreation and sports facilities provided to the students in the campus can play an important role for the students’ satisfaction. So, we took the recreation and sports facilities as independent variable and the students’ satisfaction as the dependent variable. Similarly, accommodation and transport facilities provided to the student may play some role to affect the satisfaction of the students, so they are also taken as the independent variables and students’ satisfaction is kept as dependent on them.
c)
Hypothesis
We made three hypotheses regarding the relationship of independent variables to the dependent variables. These hypotheses were as follows.
The null hypotheses of all these hypotheses are that these facilities don’t have any effect on the students’ satisfaction in the universities.
V.
Findings and
Results
a)
Reliability Analysis
The reliability factor of all the variables is following:
i.
Sports Facilities
ii.
Accommodation Facilities
iii.
Transportation Facilities
To measure the reliability, Cronbach’s alpha was calculated. The given table shows different values for different variables we used in the study. The data from Likert Scale was put in the SPSS to calculate the reliability of these scales in the form of Cronbach’s alpha. Values of alpha are between “0” to “1”. The higher the value of alpha, the higher the reliability is. Values of alpha which are greater than “0.70” show more reliability, on the other hand, the values which are less than “0.60” show poor reliability. In our study the values are in the acceptable range and the table shows that.
Sports Facilities
Accommodation Facilities
Transportation Facilities
Overall Satisfaction
© 2013 Global Journals Inc. (US)
9
Globa
l Jo
urna
l of M
anag
emen
t an
d Bu
siness Resea
rch
Volum
e XIII
Issue
III
Ver
sion
IY
2013
ear
(
)G
Measuring Student Satisfaction in Public and Private Universities in Pakistan
H1: Recreation and Sports facilities have significant effect on the students’ satisfaction in the universities.
H2: Accommodation facilities have significant effect on the students’ satisfaction in the universities.
H3: Transportation facilities have significant effect on the students’ satisfaction in the universities.

iv. Reliability Statistics
In this study we used three types of variables which were recreation and sports facilities, accommodation facilities and transportation facilities. The alpha value we calculated from analysis for recreation and sports facilities was “0.832”. The value of alpha calculated for accommodation facilities, was “0.776”. And the last variable transportation facilities have the value of “0.748”. All the values calculated for all the variables we used were above acceptable range, so we can say that our scales were reliable.
v.
Summary of Respondents
The table shows that the frequencies of the respondents and the data collected of 300 respondents in which 177, (300) 59% are male and 123, (300) 41% are females .Most of the students in which 57% are 18 to 25 years, and 26 to 30 years are 35% and 8% are above 30 years. The qualification of the respondents is that mostly students are masters 70% and 25% students are bachelor and few students are M.Phill or relevant to any other degree.
vi.
Results
of
Correlation
Analysis
Correlation analysis is used to find the relationship between two or more sets of variables. It also tells the direction as well as how much relationship exist between these variables.
In this study we used Pearson’s coefficient of correlation which is one of the most popular methods to measure the relationship between variables. The value of the correlation lies between “-1” to “+1”. The positive value of correlation shows that there is a relationship exist and the more the value of coefficient the more the strong relationship is. While negative value shows otherwise.
The table given below shows the correlation values of different variables. The first variable sports facilities in relation to the dependent variable students’ satisfaction has the coefficient of correlation of “0.554” which shows a positive relationship between the sports
facilities and the students’ satisfaction. It means that if more and good sports facilities are provided to students they are more satisfied. Similarly, the second independent variable of accommodation facilities also has a positive correlation of “0.223” with the dependent variable students’ satisfaction.
The third and last independent variable in our study is the transportation facilities provided to students by universities. This variable also has a positive relationship with the dependent variable of students’ satisfaction and the value of coefficient of correlation is “0.230”. All the independent variables used in our study have a positive relationship with dependent variable which shows that they significantly affect positively the dependent variable.
Variables
Cronbach's Alpha
No. of Items
Sports Facilities
.832
10
Accommodation Facilities
.776
10
Transportation Facilities
.748
9
© 2013 Global Journals Inc. (US)
10
Globa
l Jo
urna
l of M
anag
emen
t an
d Bu
siness Resea
rch
Volum
e XIII
Issue
III
Ver
sion
IY
2013
ear
(
)G
Measuring Student Satisfaction in Public and Private Universities in Pakistan
Significance level of all results is at 0.02. It shows that only 0.02 chances are present that our hypothesis may not be accepted or rejected. It can also be said that there are 90% chances of our hypothesis to be accepted.
Type of Respondents
Valid Frequency Percent Valid Percent Cumulative Percent
Gendermale
femaleTotal
177123300
59.041.0
100.0
59.041.0
100.0
59.0100.0
Age18-2526-30
above 30Total
171.0105.024.0
300.0
57.035.08.0
100.0
57.035.08.0
100.0
57.092.0
100.0
QualificationMaster
bachelorotherTotal
2107614300
70.025.04.0
100.0
70.025.04.0
100.0
70.095.0
100.0

vii.
Correlations
Correlation is significant at the 0.01 level (1-tailed).
viii.
Multiple
Regression
Results
The given table shows the Multiple Regression results. (R) In the table shows the value of Multiple Correlation Coefficient. The value of Multiple Correlation Coefficients of all the independent variables is “0.678”. It
explains that the overall variance from calculated satisfaction may vary 46% which is the squared value of the “R”. Generally R2
shows the future predictive value of the related information.
a)
Model Summary
Variable Title
Student
Satisfaction
Sport
Facilities
Accommodation
Facilities
Transportation
Facilities
Pearson
Correlation
Student Satisfaction
1.000
.554
.223
.230**
Sport Facilities
.554**
1.000
.810*
.564
Accommodation Facilities
.223
.810
1.000
.667*
Transportation Facilities
.230*
.564**
.667
1.000
Sig. (1-tailed)
Student Satisfaction
.
.000
.000
.000
Sport Facilities
.000
.
.000
.000
Accommodation Facilities
.000
.000
.
.000
Transportation Facilities
.000
.000
.000
.
N
Student Satisfaction
300
300
300
300
Sport Facilities
300
300
300
300
Accommodation Facilities
300
300
300
300
Transportation Facilities
300
300
300
300
Model
R
R Square
Adjusted R Square
Std. Error of the Estimate
Change Statistics
Durbin-Watson
R Square Change
F Change
df1
df2
Sig. F Change
1
.678a
.460
.455
.73084
.460
84.138
3
296
.000
1.988
a. Predictors: (Constant), Transportation Facilities, Sport Facilities, Accommodation Facilities
b. Dependent Variable: Student Satisfaction
© 2013 Global Journals Inc. (US)
11
Globa
l Jo
urna
l of M
anag
emen
t an
d Bu
siness Resea
rch
Volum
e XIII
Issue
III
Ver
sion
IY
2013
ear
(
)G
Measuring Student Satisfaction in Public and Private Universities in Pakistan
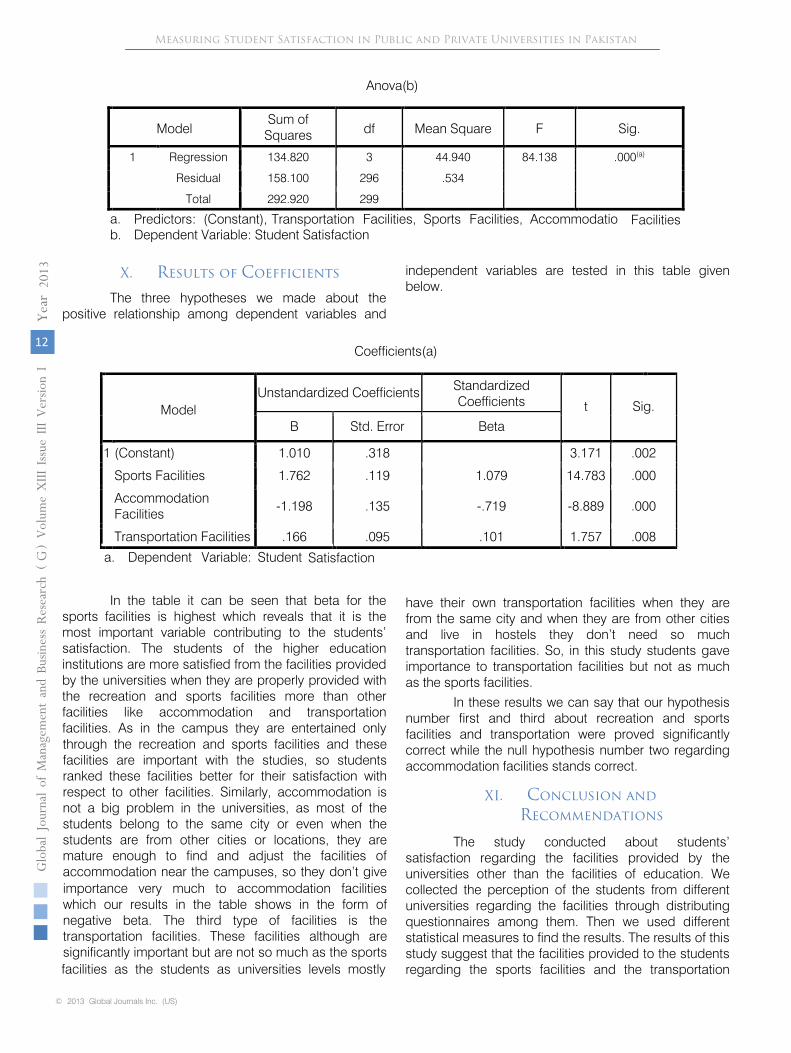
ANOVA is the analysis of variance. The cell “df” shows the degree of freedom which means the number of independent variables which are three. The number 296 shows the total number of cases minus 3 minus one i.e. (N-3-1). The value of F is 84.138 at 0.0001 levels which show that the dependent variable student satisfaction is significantly influences and predicted by the independent variables (sports facilities, accommo-
dation facilities and transportation facilities). The results of ANOVA support our hypothesis.
IX. Analysis of Variance (Anova)
Anova(b)
Model
Sum of Squares
df
Mean Square
F
Sig.
1
Regression
134.820
3
44.940
84.138
.000(a)
Residual
158.100
296
.534
Total
292.920
299
a.
Facilities
b.
Dependent Variable: Student Satisfaction
X.
Results
of
Coefficients
The three hypotheses we made about the positive relationship among dependent variables and
independent variables are tested in this table given below.
Coefficients(a)
Model
Unstandardized Coefficients
Standardized Coefficients
t
Sig.
B
Std. Error
Beta
1
(Constant)
1.010
.318
3.171
.002
Sports Facilities
1.762
.119
1.079
14.783
.000
Accommodation Facilities
-1.198
.135
-.719
-8.889
.000
Transportation Facilities
.166
.095
.101
1.757
.008
a.
Satisfaction
In the table it can be seen that beta for the sports facilities is highest which reveals that it is the most important variable contributing to the students’ satisfaction. The students of the higher education institutions are more satisfied from the facilities provided by the universities when they are properly provided with the recreation and sports facilities more than other facilities like accommodation and transportation facilities. As in the campus they are entertained only through the recreation and sports facilities and these facilities are important with the studies, so students ranked these facilities better for their satisfaction with respect to other facilities. Similarly, accommodation is not a big problem in the universities, as most of the students belong to the same city or even when the students are from other cities or locations, they are mature enough to find and adjust the facilities of accommodation near the campuses, so they don’t give
© 2013 Global Journals Inc. (US)
12
Globa
l Jo
urna
l of M
anag
emen
t an
d Bu
siness Resea
rch
Volum
e XIII
Issue
III
Ver
sion
IY
2013
ear
(
)G
Measuring Student Satisfaction in Public and Private Universities in Pakistan
importance very much to accommodation facilities which our results in the table shows in the form of negative beta. The third type of facilities is the transportation facilities. These facilities although are significantly important but are not so much as the sports facilities as the students as universities levels mostly
have their own transportation facilities when they are from the same city and when they are from other cities and live in hostels they don’t need so much transportation facilities. So, in this study students gave importance to transportation facilities but not as much as the sports facilities.
In these results we can say that our hypothesis number first and third about recreation and sports facilities and transportation were proved significantly correct while the null hypothesis number two regarding accommodation facilities stands correct.
XI. Conclusion andRecommendations
The study conducted about students’ satisfaction regarding the facilities provided by the universities other than the facilities of education. We collected the perception of the students from different universities regarding the facilities through distributing questionnaires among them. Then we used different statistical measures to find the results. The results of this study suggest that the facilities provided to the students regarding the sports facilities and the transportation
Predictors: (Constant), Transportation Facilities, Sports Facilities, Accommodatio
Dependent Variable: Student
This study recommends the universities to provide some facilities to satisfy their customers, the students to provide them the good and undifferentiated facilities which are helpful in satisfying them. They universities should focus to provide the students the recreation and sports facilities so that they are more satisfy with the institutions. Moreover, transportation facilities also help in satisfying the students. The recommendations are based only on the basis of the nature of the study, and of course the basic purpose of the universities is education and if they fulfill their responsibility, definitely students are satisfied to them.
XII.
Limitations
The main limitation of this research study it the shortage of time, due to which a huge sample could not be taken. Secondly, questionnaire instrument has its own limitations which cannot be overruled. Research biasness is also a problem which was tried to be minimized by instructing students related to research purpose and questionnaire. Cost factor is also very important because researchers have to face huge cost for conducting research survey.
References
Références Referencias
1.
Ahmed, M. Ahmed, M. and Anwar, S. F.: “Bridging the Gap between Expectations of the Business Community and Delivery of the Business Schools in Bangladesh”, Journal of Business Administration,
26, pp. 47-66, 2000.
2.
Amyx, D. and Bristow, D.N. (1999), “The marketing concept
in an academic setting: assessing and comparing the needs of Asian/Pacific Islander and Anglo consumers of the educational product”, Journal of Customer
Service in
Marketing and Management, Vol. 5 No. 4, pp. 65-80.
3.
Appleton- Knapp, S.L and Krentler, K.A (2006), “Measuring student expectations and their effect on satisfaction: the importance of managing student expectations”,
journal of Marketing Education,
Vol.28 No.
3, pp. 254-64.
4.
Bateson, J.E.G (1989) Managing Services Marketing, The Dryden Press.
5.
Lovelock, C (1983) “Classifying services to gain strategic marketing insights”, Journal of Marketing,
47.
6.
Bitner, M.J. (1990), “Evaluating service encounters: the effect
of physical
surroundings and employee respon-ses”, Journal of Marketing,
Vol. 54, pp. 69-82.
7.
Borden, V. M. (1995), “Segmenting student markets with a student satisfaction and
priorities survey”, Research in Higher Education,
36(1), pp. 73–88.
8.
Cheng Y. C. (1995), “Function and effectiveness of education”, Wide Angel Press,
Hong Kong.
9.
Cherubini, S. (1996), Marketing dei servizi,
Franco Angeli, Milano.
10.
Christou, E. (2001), “Exploring the definitions of service quality in tourism: a conceptual
approach”, The Tourism Review,
Vol. 56 No. 2, pp. 120-35.
11.
Cronin, J., Brady, M. and Hult, T. (2000), “Assessing the effects of quality, value and customer satisfaction on consumer
behavioral
intentions in service
environ-ments”, Journal
of
Retailing,
Vol. 76
No. 2, pp. 193-218.
12.
DeShields, O., Kara, A. and Kaynak, E. (2005), “Determinants of business student satisfaction and retention in Higher education: applying Herzberg’s two factor theory”, international
journal of Educational Management, Vol, 19 No.2
pp.128-39.
13.
Gibson Allen (2010), Measuring business student satisfaction:
a
review and summary
of
the major predictors”, Journal of Higher Education Policy and Management, Vol. 32, No. 3, pp. 251 – 259.
14.
Helgesen, O. and Nesset, E. (2007), “What accounts for student loyalty?
Some
field study evidence”, international Journal of Educational Management,
Vol. 21
No. 2 pp.126-43.
15.
Henning-Thurau, T., Langer, M.F and Hansen, U. (2001), “Modeling and managing student loyalty
© 2013 Global Journals Inc. (US)
13
Globa
l Jo
urna
l of M
anag
emen
t an
d Bu
siness Resea
rch
Volum
e XIII
Issue
III
Ver
sion
IY
2013
ear
(
)G
Measuring Student Satisfaction in Public and Private Universities in Pakistan
facilities have significant effect on the satisfaction of the students in universities, while the accommodation facilities don’t have any significant effect on the satisfaction of the students.
review of the literature on higher education marketing”, International journal of Public sectorManagement.Vol. 19 No. pp.316-38.
16. Iacobucci, D., Grayson, K.A. and Ostrom, A. (1994), “The calculus of service quality and customer satisfaction: theoretical and empirical differentiation and integration”, Advances in Service Marketing and Management, Vol. 5, pp. 1-44.
17. Lovelock, C (1983) “Classifying services to gain
18. Lo C. Celia (2010), “How student satisfaction factors affect perceived learning”, Journal of Scholarship of Teaching and Learning, Vol. 10, No. 1, pp. 47 – 54.
19. Majid A. K. M. S., Mamun, M. Z. and Siddique, S. R.: “Practices of Teaching Methods, Aids and Students’ Performance Evaluation”, International Journal, 2000.
20. Mamun, M. Z. and Das,S.: “Total Quality Management for Non-Government Universities of Bangladesh”, Proceedings of Annual Convention of Bangladesh Society for Total Quality Management in Association with Department of Industrial and Production Engineering, BUET, Dhaka, December 3-4, 1999, pp. 23-29, 1999.
21. Metawa, S. A. and Almossawi, M.: “Banking behaviorof Islamic bank customers: perspectivesand implications”, International Journal of Bank Marketing, 16 (7), 299-313, 1998.
strategic marketing insights”, Journal of Marketing, 47.
22.
Mondy R. W. and Noe R. A. (2005), “Human Resource Management”, 9th
edition,
Pearson Prentice Hall.
23.
Narasimhan, K. (2001), “Improving the climate of teaching session: the use of evaluation by students and instructors”, Quality in Higher Education,
Vol. 7 No. 3, pp. 179-90.
24.
Oliver, R.L. (1997), satisfaction: A behavioral perspective on the consumer,
McGraw.Hill Education, New York, NY.
25.
Oliver, R and Desarbo, W. S. (1997), “Processing of the satisfaction response in a suggested framework and research proposition”, Journal of Consumer Satisfaction, Dissatisfaction and Complaining Behavior,
2, pp. 1-16.
26.
Parasuraman, A., Berry, L. and Zeithaml, V. (1985), “A conceptual model
of
service
quality and its implications for future research”, Journal of Marketing, Vol. 49, pp. 41-50.
27.
Parasuraman, A., Zeithaml, V. A. & Berry, L. L. (1988). "SERVQUAL: A Multiple-Item Scale for Measuring Consumer Perceptions of Service Quality," Journal of Retailing,
vol.
64, 12-40.
28.
Parasuraman, A., Zeithaml, V.A. and Berry, L.L., ‘SERVQUAL: A Multiple-Item Scale
for Measuring Customer Perceptions of Service Quality’, 1988, Journal of
Retailing,
vol. 64, no. 1, pp. 12-24.
29.
Patterson, P.G. and Johnson, L.W. (1993), “Disconfirmation of expectation and the gap model of service quality: an integrated paradigm”, Journal of satisfaction,
Dissatisfaction and Complaining Behaviour,
Vol. 6, pp. 90-9.
30.
Palmer R. S. and Holt M. D. (2009), “Examining student satisfaction with wholly
online learning”, Journal of Computer Assisted Learning, Vol. 25, pp. 101 – 113.
31.
Pellicelli, G. (1997), Marketing dei servizi,
Utet, Torino.
32.
Petruzzellis, L., D’Uggento, A. M. & Romanazzi, S. (2006). Student Satisfaction and Quality of Service in Italian Universities, Managing Service Quality,
16 (4). 349-364.
33.
Prabha Ramseook-Munhurrun, Perunjodi Naidoo, Pushpa Nundlall (2010), “A proposed model for measuring service quality in secondary education”, International
Journal of Quality and Service Sciences,
Vol. 2 No. 3, pp. 335-351.
34.
Qi Guosheng, Chen Meifeng, Liu Xiao and Ding Bangyou (2010), “An empirical
study of student satisfaction and its influencing factors – School of Continuing Education of Guangzhou University”, International Journal of Continuing Education and Lifelong Learning, Vol. 2, No.2, pp. 29 – 40.
35.
Sapri, M., Kaka, A. & Finch, E. (2009). 'Factors that Influence Student’s Level of Satisfaction with
Regards to Higher Educational Facilities Services,' Malaysian
Journal of Real Estate, 4 (1). 34:51.
36.
Sedgwick, R. (2005), Private Universities in Pakistan, World Education News and Reviews, 18(1).
37.
Sigala, M. (2002), “The evolution of internet pedagogy: benefits
for tourism and hospitality education”, Journal of Hospitality, Leisure, Sports and Tourism Education,
Vol. 1 No. 2, pp. 29-45.
38.
Sigala, M. and Baum, T. (2003), “Trends and issues in tourism and hospitality higher
education: visioning the future”, Tourism and Hospitality Research. The Surrey Quarterly Review,
Vol. 4 No. 4, pp. 367-76.
39.
Sigala, M. (2004a), “Investigating the factors determining e-learning effectiveness in tourism and hospitality education”, Journal of Hospitality & Tourism Education, Vol. 16 No. 2, pp. 11-21.
40.
Sigala, M. (2004b), “The ASP-Qual model: measuring ASP service quality in Greece”, Managing Service Quality,
Vol. 14 No. 1, pp. 103-14.
41.
Shan, M.D., Walker, M. and Hayes, T. (1995), “Understanding professional service
expectations: do we regression and decision tree analysis”, Research in Higher Education,
Vol. 45 No.
3, pp. 251-69.
42.
Shank, M.D., Walker, M. and Hayas, T. (1995), “Understanding professional service expectations: do we know what our students expect in a quality
© 2013 Global Journals Inc. (US)
14
Globa
l Jo
urna
l of M
anag
emen
t an
d Bu
siness Resea
rch
Volum
e XIII
Issue
III
Ver
sion
IY
2013
ear
(
)G
Measuring Student Satisfaction in Public and Private Universities in Pakistan
education?”, journal of professional Services Marketing, Vol. 13 No. 1 pp.71-83.
43. Sum Vichet, McCaskey J. Stephen and Kyeyune Catherine (2010), “A survey Research of satisfaction levels of graduate students enrolled in a nationally ranked top-10 program at a mid-western university”, Research in Higher Education.
44. Thomas, E.H. and Galambos, N. (2004), “What satisfies students? Mining students-opinion data with regression and decision tree analysis”, Research in Higher Education, Vol. 45 No.3, pp. 251-69.
45. Watson, S. (2003), “Closing the feedback loop: ensuring effective action from student feedback”, Tertiary education and Management, Vol.9, pp. 145-57.
46. Zafiropoulos, C., Fragidis, G., Kehris, E., Dimitriadis, S. and Paschaloudis, D. (2005), “Service Quality Assessment in Higher Education: the Case of Technological Educational Institute of Serres”, paper presented at the 9th International Conference on Marketing and Development (ICMD), Thess-aloniki, 8-11 June.
47. Zahid, J. R., Chowdhury G. M. and Sogra. J.: “Present Status and Future Direction of Business Education in Bangladesh”, Journal of Business Administration, 26, pp.11-24, 2000.
48.
Zeithaml, V.A., Parasuraman, A and Berry, L.L (1985), “Problems and Strategies in services marketing”, Journal of Marketing,
Vol. 49 No. 2, pp, 33-46.
49.
Zeithaml, V.A., Parasuraman, A. and Berry, L.L. (1990), “Delivering Quality Service: Balancing Customer Perception and Expectations,
The Fress Press, NewYork, NY.
© 2013 Global Journals Inc. (US)
15
Globa
l Jo
urna
l of M
anag
emen
t an
d Bu
siness Resea
rch
Volum
e XIII
Issue
III
Ver
sion
IY
2013
ear
(
)G
Measuring Student Satisfaction in Public and Private Universities in Pakistan

This page is intentionally left blank
© 2013 Global Journals Inc. (US)
16
Globa
l Jo
urna
l of M
anag
emen
t an
d Bu
siness Resea
rch
Volum
e XIII
Issue
III
Ver
sion
IY
2013
ear
(
)G
Measuring Student Satisfaction in Public and Private Universities in Pakistan