Embed Size (px)
Citation preview
PAN07136
Measuring scientific understanding:
A pedagogical problem and its potential solution?
Debra Panizzon1 & Trevor Bond
2
1Flinders Centre for Science Education in the 21
st Century
Flinders University
Adelaide, South Australia
2Educational Psychology, Counselling and Learning Needs
Hong Kong Institute of Education
New Territories, Hong Kong
ABSTRACT
The application of measurement principles to qualitative data around scientific
understanding not only reveals important problems for teachers and curriculum
design; it highlights a pedagogical solution. Panizzon & Bond (2006)
demonstrated that students’ understandings of diffusion and osmosis remained
similar across the high school–university transition, in spite of obvious differences
in coursework and pedagogy. In another study, Stanbridge (2001) used Rasch-
scaled SOLO-based measures to reveal that while constructivist teaching
improved Year 9 students’ understandings of particle theory, learners’ levels of
cognitive development placed a ceiling on their conceptual growth in chemistry.
The mismatch between high school and university science curricula and the
capacity of students to make personal meaning of scientific concepts creates a
pedagogical impasse. A possible solution was identified in the research of Endler
and Bond (2001a,b; 2006) where measurably important gains in achievement and
cognitive development were demonstrated for high school students experiencing
the Thinking Science program. This paper provides a summary of these three case
studies with particular attention to the pedagogical implications of these findings
for science teaching.
AARE Conference 25th – 29
th November 2007 2
INTRODUCTION
Developing scientific understanding requires students to ‘construct’ concepts using their own
existing mental structures (Driver 1983; Fensham, Gunstone, & White, 1994). In science this
has the potential of being time-consuming given that there are an enormous number of
concepts to be understood in any secondary curriculum. Traditionally, science teachers have
tackled this issue by implementing a content-based curriculum with a heavy emphasis on rote-
learning and memorisation strategies on the part of the student. However, constructivist
approaches to learning have discouraged these practises and the reliance around the
accumulation of facts and figures in preference to students developing their own meanings
within a learning context (Driver, 1989; Hand, Treagust, & Vance, 1997). As summarised by
Wittrock (1985: 261), constructivism has encouraged the construction of “(n)ew and better
understandings of scientific phenomena by assimilating new concepts to old frameworks (a
type of evolutionary learning) or by accommodating new frameworks from old ones (a type
of revolutionary learning).”
The greater emphasis around students developing ‘understanding’ raises the difficulty of
quantifying understanding in a manner that goes beyond the traditional assessment tasks used
in science. Frequently, these encourage “superficial rote learning, concentrating on recall of
isolated details, usually items of knowledge which pupils soon forget” (Black & Wiliam,
1998:17) and fail to target higher-order thinking processes (Lai & Griffin, 2001). To address
this apparent gap between assessment practices and gauging what students actually know and
can do, Wilson and Sloane (2000) developed an assessment program that included a
developmental perspective of student learning. In their view, this directed attention back to
the students’ progress forcing teachers to move away from single-testing situations to a cross-
sectional approach to monitoring student achievement. However, the difficulty with this
approach is that it requires considerable professional development to support teachers in
changing their pedagogical and assessment practices (Panizzon & Pegg, in press).
To investigate students’ scientific understanding using a developmental perspective three case
studies (Table 1) that share complementary, overlapping designs are presented. While the
conventional research approaches have been qualitative, the binding force behind the case
studies is the application of a Rasch measurement framework for quantifying the qualitative
indicators expounded by the proponents of the SOLO model (Biggs & Collis, 1982; 1991)
and its predecessor, the Genevan account of cognitive development (Inhelder & Piaget, 1958).
Table 1. Overview of case studies: Theoretical frameworks, topics, instruments
Case Study Sample
N
SOLO Model
Piaget School Achievement
Results
1. Panizzon 241 Osmosis & diffusion
2. Stanbridge 258 Particle theory BLOT – 1 semester
3. Endler 658 BLOT – 3 years Oregon State Scores
The appropriateness of applying the Rasch model to the qualitative data that emerges from the
application of the SOLO Model and Piagetian cognitive developmental theory has been
canvassed in the literature (e.g. Bond & Fox, 2007). Wilson and Iventosch (1988) reported
one of the earliest applications of the Rasch measurement model to outcomes qualitatively
scored using the SOLO model. With Ray Adams (Wilson & Adams, 1995), Wilson
implemented their more advanced development of the Rasch model to deal with the potential
AARE Conference 25th – 29
th November 2007 3
problem of a lack of independence of SOLO-based structured response test items. Similarly,
application of the Rasch model to Piagetian measures of stages of thinking has been endorsed
by Hautämaki (1989), Bond (1995a, b), Bond and Fox (2001; 2007), and King & Bond, 1996.
In the following paper, a summary of each case study is presented including an overview of
the research design along with a synthesis of the major findings from the Rasch analyses. This
is followed by a discussion of the pedagogical issues and implications emerging from these
studies and a possible solution for addressing these in the classroom context.
CASE STUDY ONE: DIFFUSION AND OSMOSIS
Diffusion and osmosis are fundamental biological concepts that explain the process by which
substances are exchanged between an organism or cell and its environment (LaBarbera &
Vogel, 1982). Given that they are essential for life they are usually introduced in the early
stages of biology courses in high school and university science degrees. However, previous
research suggests that students at a range of educational levels struggle with developing an
understanding of these concepts (Marek, 1986; Zuckerman, 1993). In part this occurs because
an understanding of diffusion and osmosis requires knowledge of a number of subordinate
concepts including: solubility; concentrations; the particulate nature of matter; and, random
motion (Odom, 1992; Zuckerman, 1993). This suggests that students must be able to link and
incorporate these underlying concepts within their existing conceptual frameworks to gain a
thorough understanding of the two concepts (Marek, Cowan, & Cavallo, 1994). However,
missing from the literature was a developmental learning trajectory for diffusion and osmosis
based on a theoretical framework that facilitated reliable coding to produced quantitative data
for assessing student understanding.
Overview of study design
The purpose of the first case study presented here was to explore students’ conceptual
understandings of diffusion and osmosis using the Structure of the Observed Learning
Outcome (SOLO) model (Biggs & Collis, 1982; 1991) with the aim of identifying a trajectory
of learning for each concept. This model shares commonalities with other neo-Piagetian
frameworks including those of Case (1992), and Fischer and Knight (1990). SOLO has been
used to investigate a range of scientific concepts including evaporation and photosynthesis
(Levins & Pegg, 1994), air pressure (Tytler, 1993), sight (Collis, Jones, Sprod, Watson, &
Fraser, 1998), and magnetism (Guth & Pegg, 1994).
Two key elements comprise the SOLO model. The first refers to the abstractness of the
responses termed modes of thinking with each having an idiosyncratic character. These are
referred to as the sensori-motor, ikonic, concrete symbolic, formal and post formal modes.
The second relates to the ability of the individual to handle relevant cues with increased
sophistication. These are known as levels of complexity and are termed unistructural (U),
multistructural (M), and relational (R). The three levels form a cycle of learning within a
mode. Research over the last decade has identified that a single learning cycle within a mode
does not sufficiently explain the development of concepts or the diversity of understanding
evident within a mode. This has resulted in the addition of a second learning cycle of
understanding in the concrete-symbolic and formal modes. Subsequently, two cycles of
development U1-M1-R1, U2-M2-R2 have been incorporated into the model (see Collis et al.,
1998; Panizzon, 2003; Pegg & Davey, 1998).
AARE Conference 25th – 29
th November 2007 4
To explore students’ understandings of diffusion and osmosis using the SOLO model a cross-
sectional convenience sample of students undertaking senior high school science and first-
year university science and nursing degrees were incorporated into the study (Table 2). This
wide range was deemed critical to provide the breadth of learning contexts and range of
educational experiences required to explore conceptual development.
Table 2. Participants by educational level (N = 241)
High School Students First-year University Students
Educational
Level
Year 11
Integrated
Science
Year 11
Biology
Year 12
Biology
Bachelor of
Nursing
Bachelor of
Natural
Resources
Bachelor of
Rural
Science
Bachelor of
Science
Number
14
18
28
61
37
35
48
Of interest with the first-year university science students was that 50% of them had not
undertaken biology in Years 11 or 12 of high school. During their university first-year, all
students were expected to undertake compulsory, full-year courses in biology, chemistry and
physics. Diffusion and osmosis concepts were taught in each of the three areas. As well, many
of the nursing students had not completed any science subjects in Years 11 and 12 and
reported a lack of confidence in relation to scientific content knowledge. They were expected
to complete two biology courses at university - based on the human body with a strong
practical component. The high school students were either completing their final year (i.e.,
Year 12) of the Higher School Certificate (HSC) in NSW or undertaking their preliminary
studies (i.e., Year 11) for this certification. Diffusion and osmosis concepts are included in the
syllabi for each of the high school groups included in the research sample.
One month prior to data collection, all students received lessons or lectures about diffusion
and osmosis and completed a practical session based on the two concepts as part of their
normal course of studies. Subsequently, students were invited to complete a series of five,
extended-response questions (2 diffusion, 3 osmosis) under the direction of their teachers or
demonstrators. Two of the questions (Qs 1, 2) required definitions while the remaining
questions required students to apply their knowledge to the biological context (i.e., Qs 3, 4,
5). Students’ responses were coded by comparing their explanations with responses from
‘experts’ in the field. This produced a series of categories of likeness that were interpreted
using the descriptors of modes and levels of the SOLO model. Codes 0-9 were used to
correspond to the increasing complex structures of students’ responses with blank=0, U1=1,
M1=2 etc. Inter-rater reliability was determined using independent rankings from two
researchers familiar with the model with an overall agreement of 95-98% obtained. The lists
of rankings was used to calculate a Spearman rho correlation with a coefficient of between
0.96-0.98 determined. Subsequently, because the responses to each question represented
polytomous ordered responses, the Partial Credit Rasch Model (Wright & Masters, 1982) was
used to analyse the data.
Results
A summary of student responses coded into the various modes and levels of the SOLO model
is provided in Table 3. Clearly, the greatest proportion of responses was demonstrative of the
two learning cycles in the concrete symbolic mode (i.e., U1-M1-R1, U2-M2-R2) with few
responses representative of the formal mode (i.e., U1F-M1F-R1F). In relation to particular
questions, students demonstrated higher levels of understanding in defining diffusion and
osmosis (Qs 1, 2) while the application of their knowledge for the two concepts was less
AARE Conference 25th – 29
th November 2007 5
successful (Qs 3, 4, 5). Osmosis appeared to be the more difficult concept with the fewer
higher-level responses provided for these questions (Qs 2, 4, 5).
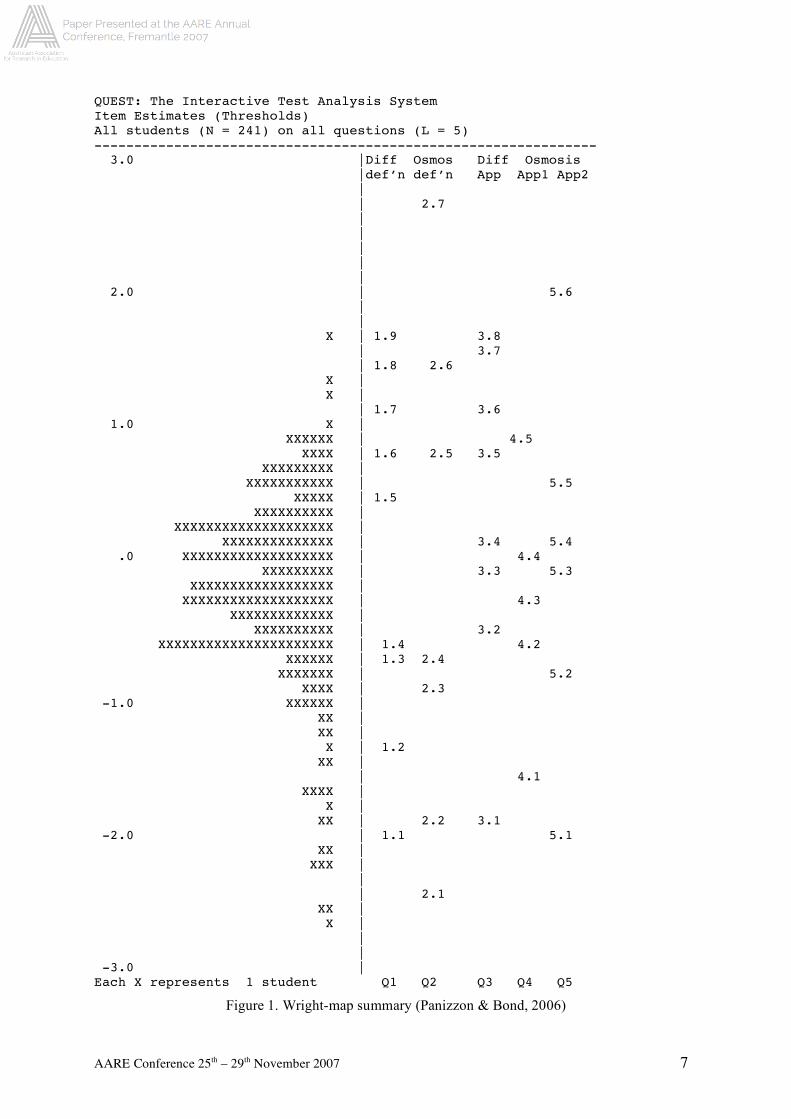
To explore the student performances across the different educational levels and questions,
these results were analysed using the Partial Credit Rasch Model (Wright & Masters, 1982).
This produced a Wright-Map summary (Figure 1). With student performances clumped
between -1.0 and +1.0 logits and a tail of lower performances stretching down to -2.5 logits;
each X on the Wright map represents the location of a single student on the five-item
questionnaire. Students located at the bottom end of the scale are likely to have given U1 and
M1 responses (i.e., categories 1 and 2) to the questions with very few students at the top of the
scale. This suggests that giving U1F, M1F and R1F (i.e., categories 7, 8 and 9) responses to
questions 4 and 5 is so far beyond this sample of high school and first-year university students
that the difficulty levels of those SOLO response levels are not even estimated on the map.
These findings corroborated those in Table 3 with the Wright map identifying clearly that
scientifically viable understandings of diffusion and osmosis are beyond the present grasp of a
large proportion of this sample of high school and first-year university science and nursing
students.
Table 3. Overview of students’ responses for each of the SOLO categories
Categories of Responses
0
U1
1
M1
2
R1
3
U2
4
M2
5
R2
6
U1F
7
M1F
8
R1F
9
Total
Attempts
Q1 6 9 3 6 104 31 13 6 1 2 208
% 2.9 4.3 14.4 2.9 50 14.9 6.3 2.9 0.5 1.0
Q2 3 4 29 11 112 22 10 1 192
% 1.6 2.1 15.1 5.7 58.3 11.5 5.2 0.5
Q3 16 52 36 21 42 14 7 1 2 191
% 8.4 27.2 18.8 11.0 22 7.3 3.7 0.5 1
Q4 23 45 28 22 61 35 214
% 10.7 21 13.1 10.3 28.5 16.4
Q5 14 40 68 19 28 39 7 215
% 6.5 18.6 31.6 8.8 13 18.1 3.3
Blank = 0 Concrete-symbolic mode = U1,M1,R1, U2,M2,R2 Formal mode = U2F,M2F,R2F
The summary statistics from the analysis, shown in Table 4, also provides some worthwhile
observations to be made. The mean difficulty of items (0.01 logits; SD 0.25) and mean ability
of persons (-0.22 logits; SD 0.73) are closely matched; the cases SD (0.73) confirms the
earlier observation from the Wright map in that over two-thirds of the cases are contained in
the 1.5 logit area around the mean.
Table 4. Rasch analysis summary statistics for items and cases
N Mean SD Infit
Mean Sq
(SD)
Outfit
Mean Sq
(SD)
Infit t
(SD)
Outfit t
(SD)
Items 5 .01 .25 .97
(.07)
1.00
(.11)
-.21
(.72)
-.01
(.85)
Cases 241 -.22 .73 .94
(.79)
.98
(.93)
-.15
(1.20)
0.00
(.97)
AARE Conference 25th – 29
th November 2007 6
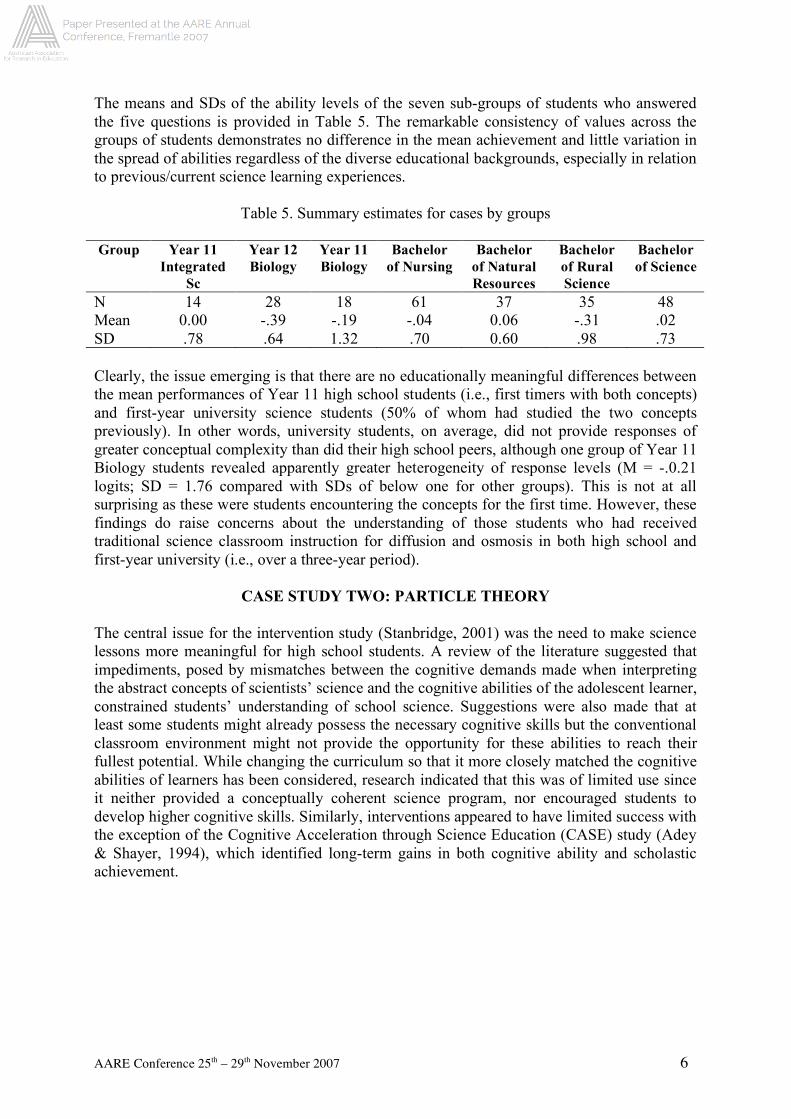
The means and SDs of the ability levels of the seven sub-groups of students who answered
the five questions is provided in Table 5. The remarkable consistency of values across the
groups of students demonstrates no difference in the mean achievement and little variation in
the spread of abilities regardless of the diverse educational backgrounds, especially in relation
to previous/current science learning experiences.
Table 5. Summary estimates for cases by groups
Group Year 11
Integrated
Sc
Year 12
Biology
Year 11
Biology
Bachelor
of Nursing
Bachelor
of Natural
Resources
Bachelor
of Rural
Science
Bachelor
of Science
N 14 28 18 61 37 35 48
Mean 0.00 -.39 -.19 -.04 0.06 -.31 .02
SD .78 .64 1.32 .70 0.60 .98 .73
Clearly, the issue emerging is that there are no educationally meaningful differences between
the mean performances of Year 11 high school students (i.e., first timers with both concepts)
and first-year university science students (50% of whom had studied the two concepts
previously). In other words, university students, on average, did not provide responses of
greater conceptual complexity than did their high school peers, although one group of Year 11
Biology students revealed apparently greater heterogeneity of response levels (M = -.0.21
logits; SD = 1.76 compared with SDs of below one for other groups). This is not at all
surprising as these were students encountering the concepts for the first time. However, these
findings do raise concerns about the understanding of those students who had received
traditional science classroom instruction for diffusion and osmosis in both high school and
first-year university (i.e., over a three-year period).
CASE STUDY TWO: PARTICLE THEORY
The central issue for the intervention study (Stanbridge, 2001) was the need to make science
lessons more meaningful for high school students. A review of the literature suggested that
impediments, posed by mismatches between the cognitive demands made when interpreting
the abstract concepts of scientists’ science and the cognitive abilities of the adolescent learner,
constrained students’ understanding of school science. Suggestions were also made that at
least some students might already possess the necessary cognitive skills but the conventional
classroom environment might not provide the opportunity for these abilities to reach their
fullest potential. While changing the curriculum so that it more closely matched the cognitive
abilities of learners has been considered, research indicated that this was of limited use since
it neither provided a conceptually coherent science program, nor encouraged students to
develop higher cognitive skills. Similarly, interventions appeared to have limited success with
the exception of the Cognitive Acceleration through Science Education (CASE) study (Adey
& Shayer, 1994), which identified long-term gains in both cognitive ability and scholastic
achievement.
AARE Conference 25th – 29
th November 2007 7
QUEST: The Interactive Test Analysis System Item Estimates (Thresholds) All students (N = 241) on all questions (L = 5) --------------------------------------------------------------- 3.0 |Diff Osmos Diff Osmosis |def’n def’n App App1 App2 | | 2.7 | | | | | 2.0 | 5.6 | | X | 1.9 3.8 | 3.7 | 1.8 2.6 X | X | | 1.7 3.6 1.0 X | XXXXXX | 4.5 XXXX | 1.6 2.5 3.5 XXXXXXXXX | XXXXXXXXXXX | 5.5 XXXXX | 1.5 XXXXXXXXXX | XXXXXXXXXXXXXXXXXXXX | XXXXXXXXXXXXXX | 3.4 5.4 .0 XXXXXXXXXXXXXXXXXXX | 4.4 XXXXXXXXX | 3.3 5.3 XXXXXXXXXXXXXXXXXX | XXXXXXXXXXXXXXXXXXX | 4.3 XXXXXXXXXXXXX | XXXXXXXXXX | 3.2 XXXXXXXXXXXXXXXXXXXXXX | 1.4 4.2 XXXXXX | 1.3 2.4 XXXXXXX | 5.2 XXXX | 2.3 -1.0 XXXXXX | XX | XX | X | 1.2 XX | | 4.1 XXXX | X | XX | 2.2 3.1 -2.0 | 1.1 5.1 XX | XXX | | | 2.1 XX | X | | | -3.0 | Each X represents 1 student Q1 Q2 Q3 Q4 Q5
Figure 1. Wright-map summary (Panizzon & Bond, 2006)
AARE Conference 25th – 29
th November 2007 8
Overview of study design
The study was designed with two principles in mind: the first was to measure year nine
students’ understanding of particle theory, while the second was to attempt to increase levels
of understanding by implementing a constructivist approach to science teaching. The
cognitive abilities and performances of an experimental and control group of students were
determined using a SOLO-based approach similar to the first case study with a written
science test (scored using the Conceptual Performance Taxonomy- CPT) and Bond’s Logical
Operations Test [BLOT]).
An analysis of data from earlier trials identified the following three distinct SOLO-based
ordered levels of abstraction that could be used to discriminate between the levels of
conceptual sophistication of year nine science students' responses.
• Primary abstractions: are direct descriptions of phenomena or experiences, with no
apparent mental processing of the abstracted data.
• Secondary abstractions: are conceptual interpretations which have been constructed
directly from primary abstractions as a result of some form of mental processing. The
resulting construct is not directly observable, but is rather a symbolically represented
cause-effect model.
• Tertiary abstractions: are concepts derived from secondary abstractions by further
mental processing, resulting in hypothetico-deductive constructs or theoretical models
which are only indirectly related to the empirical world
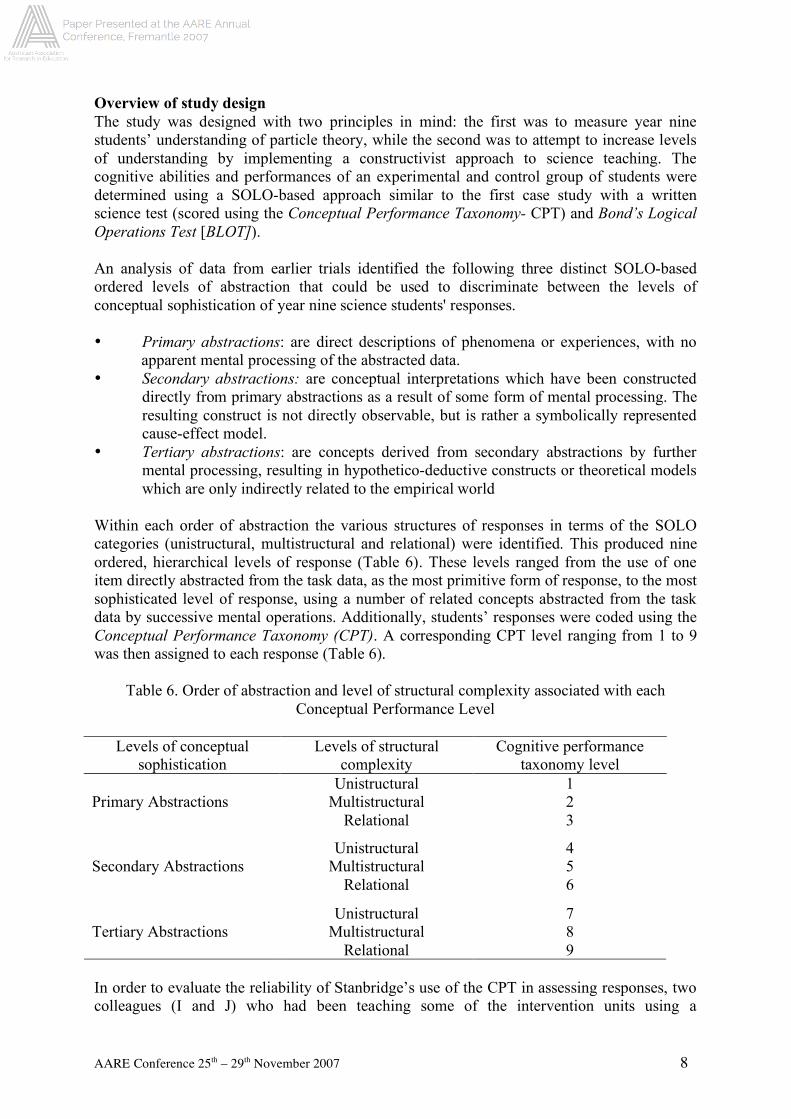
Within each order of abstraction the various structures of responses in terms of the SOLO
categories (unistructural, multistructural and relational) were identified. This produced nine
ordered, hierarchical levels of response (Table 6). These levels ranged from the use of one
item directly abstracted from the task data, as the most primitive form of response, to the most
sophisticated level of response, using a number of related concepts abstracted from the task
data by successive mental operations. Additionally, students’ responses were coded using the
Conceptual Performance Taxonomy (CPT). A corresponding CPT level ranging from 1 to 9
was then assigned to each response (Table 6).
Table 6. Order of abstraction and level of structural complexity associated with each
Conceptual Performance Level
Levels of conceptual
sophistication
Levels of structural
complexity
Cognitive performance
taxonomy level
Unistructural 1
Multistructural 2
Primary Abstractions
Relational 3
Unistructural 4
Multistructural 5
Secondary Abstractions
Relational 6
Unistructural 7
Multistructural 8
Tertiary Abstractions
Relational 9
In order to evaluate the reliability of Stanbridge’s use of the CPT in assessing responses, two
colleagues (I and J) who had been teaching some of the intervention units using a
AARE Conference 25th – 29
th November 2007 9
constructivist approach, participated in instruction in the use of the taxonomy. These teachers
analysed their classes' responses for the end-of-unit science test using the taxonomy.
Stanbridge also assigned CPT levels to unmarked copies of responses made by 15 students
from each of these classes. Table 7 summarises the extent to which these ratings were in
agreement. Of the 150 responses dually assessed there was complete agreement on 131
responses (i.e. agreement of 87% of the total responses). It was noted that agreement was
considerably better between the investigator and one of the teachers (94%) than with the other
teacher (80%).
Table 7. Inter-rater agreement using the CPT
Teachers Identical
allocations
Adjacent
allocations
Allocations not
with 1 category
N
I N = 70
94%
N = 4
5%
N = 1
1%
75
J N = 60
80%
N = 3
4%
N = 12*
16%
75
* Teacher J frequently had difficulties in distinguishing between primary and secondary levels of abstraction and
tended to assume that a response, which demonstrated minimal interpretation of the task data was indicative of
the primary level of abstraction.
The BLOT test is a thirty-five-item multiple choice test used to estimate the Piagetian level of
children's cognitive development (Bond, 1976, 1995a). The items in the test are drawn
directly from the 16 binary operations and the INRC four-group of operations, described in
Inhelder and Piaget (1958). The results from the BLOT are directly quantifiable, the test also
lends itself to statistical analysis and evaluation. The validity of BLOT has been confirmed by
Bond (1976, 1995b), Christiansson (1983), and Smith and Knight (1992). Typically, BLOT
has poorer powers of discrimination at the top end of the cognitive development scale,
although it is particularly discriminating over the period where children unusual develop
formal operational thinking. The problems associated with the “ceiling effect” of BLOT are
well acknowledged (Bond & Fox, 2001, 2007). That BLOT discriminates well across the
range of scores for children who are making the transition from concrete to formal operational
thinking helps to make BLOT an ideal instrument for use in CASE studies because the
purpose of the CASE intervention is to change children's level of thinking from the concrete
to the formal operational level. Further, the retest effect appears to be minimal, about one-
quarter of a standard deviation (mean test = 27.34 [SD 6.37]; mean retest = 28.9 [SD 5.81])
(Bond, 1976).
With trialing completed experimental groups of Year 9 students were given a written science
test (CPT) and BLOT prior to undertaking an intervention. The pre-intervention science test
assessed their performances on tasks relating to the last unit studied in Year 8, whilst the post-
intervention test assessed students' performances on questions relating to the second unit of
the intervention program (i.e., chemistry unit). The questions asked were open-ended to allow
students to respond using their own constructed ideas, rather than recording rote-learnt facts.
The tasks in some questions placed students in cognitive conflict situations: on being
presented with opposing explanations for situations, students were asked to come to some
conclusions about the validity of the explanations given in the task texts. Tasks of this nature
investigated whether students had developed the ability to recognise instances where
information given conflicted with their constructed explanations of situations.
These data were compared with those obtained in a similar manner from a control group of
generally comparable students from the same school who had not experienced the
AARE Conference 25th – 29
th November 2007 10
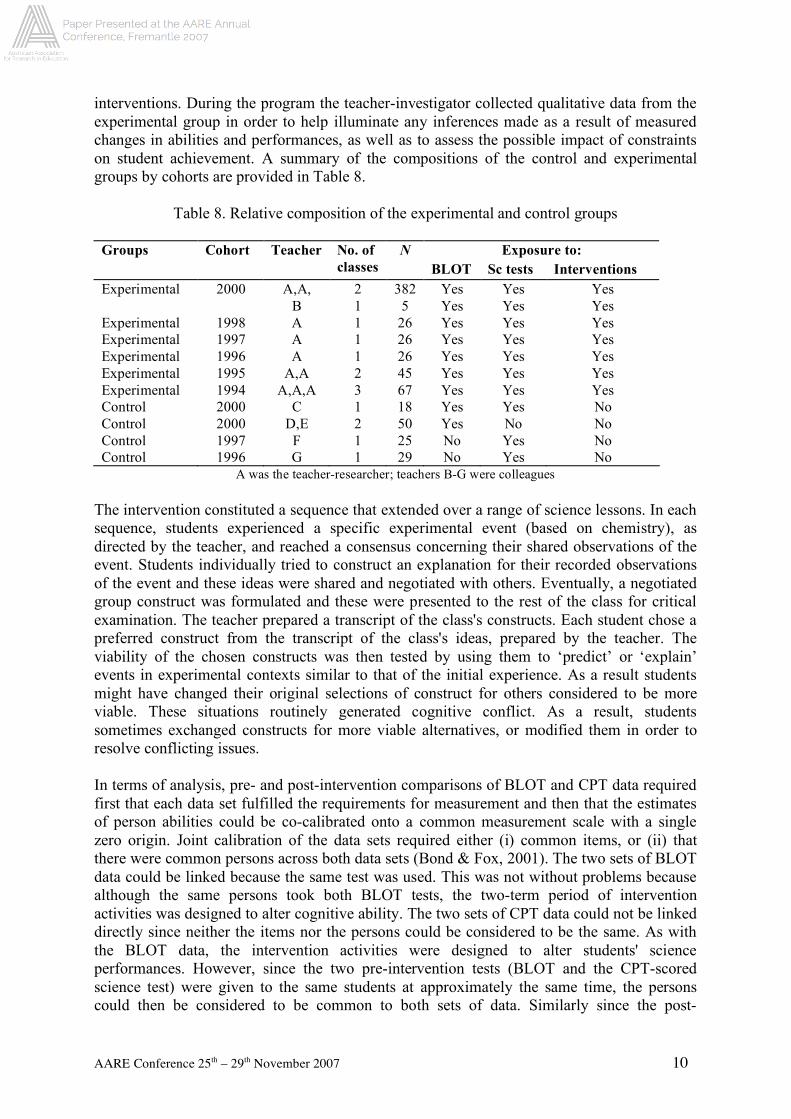
interventions. During the program the teacher-investigator collected qualitative data from the
experimental group in order to help illuminate any inferences made as a result of measured
changes in abilities and performances, as well as to assess the possible impact of constraints
on student achievement. A summary of the compositions of the control and experimental
groups by cohorts are provided in Table 8.
Table 8. Relative composition of the experimental and control groups
Exposure to: Groups Cohort Teacher No. of
classes
N
BLOT Sc tests Interventions
Experimental 2000 A,A,
B
2
1
382
5
Yes
Yes
Yes
Yes
Yes
Yes
Experimental 1998 A 1 26 Yes Yes Yes
Experimental 1997 A 1 26 Yes Yes Yes
Experimental 1996 A 1 26 Yes Yes Yes
Experimental 1995 A,A 2 45 Yes Yes Yes
Experimental 1994 A,A,A 3 67 Yes Yes Yes
Control 2000 C 1 18 Yes Yes No
Control 2000 D,E 2 50 Yes No No
Control 1997 F 1 25 No Yes No
Control 1996 G 1 29 No Yes No
A was the teacher-researcher; teachers B-G were colleagues
The intervention constituted a sequence that extended over a range of science lessons. In each
sequence, students experienced a specific experimental event (based on chemistry), as
directed by the teacher, and reached a consensus concerning their shared observations of the
event. Students individually tried to construct an explanation for their recorded observations
of the event and these ideas were shared and negotiated with others. Eventually, a negotiated
group construct was formulated and these were presented to the rest of the class for critical
examination. The teacher prepared a transcript of the class's constructs. Each student chose a
preferred construct from the transcript of the class's ideas, prepared by the teacher. The
viability of the chosen constructs was then tested by using them to ‘predict’ or ‘explain’
events in experimental contexts similar to that of the initial experience. As a result students
might have changed their original selections of construct for others considered to be more
viable. These situations routinely generated cognitive conflict. As a result, students
sometimes exchanged constructs for more viable alternatives, or modified them in order to
resolve conflicting issues.
In terms of analysis, pre- and post-intervention comparisons of BLOT and CPT data required
first that each data set fulfilled the requirements for measurement and then that the estimates
of person abilities could be co-calibrated onto a common measurement scale with a single
zero origin. Joint calibration of the data sets required either (i) common items, or (ii) that
there were common persons across both data sets (Bond & Fox, 2001). The two sets of BLOT
data could be linked because the same test was used. This was not without problems because
although the same persons took both BLOT tests, the two-term period of intervention
activities was designed to alter cognitive ability. The two sets of CPT data could not be linked
directly since neither the items nor the persons could be considered to be the same. As with
the BLOT data, the intervention activities were designed to alter students' science
performances. However, since the two pre-intervention tests (BLOT and the CPT-scored
science test) were given to the same students at approximately the same time, the persons
could then be considered to be common to both sets of data. Similarly since the post-
AARE Conference 25th – 29
th November 2007 11
intervention BLOT and CPT generated data were collected from the same student, at the same
time, the person could again be considered to be common to each data set.
Results
Rasch analysis of the combined data sets
The combined pre-intervention BLOT and CPT data sets were analysed together in order to
determine whether they may be estimated as a common scale, with the same scale zero as the
pre-intervention BLOT. This procedure also assisted in establishing estimates for the CPT
data since the low density of person responses at some item levels meant that the analysis of
CPT data alone would have led to much less precise results. Fit statistics identified only two
misfitting items. The remaining items fitted the Rasch model well, thus providing sufficient
evidence for the unidimensionality of the combined data set, which legitimised locating all of
the item difficulty estimates on a single common scale.
Similarly, analysis of the post-intervention data sets together helped to determine whether
they may be estimated on a common scale, with the same scale zero as the post-intervention
BLOT. Again combining data sets facilitated analysis of the post-intervention CPT data,
which owing to low response density for some of the item levels could not have been
adequately analysed separately. The infit data for the individual items showed that BLOT
items 30 (t = 3.3) and 21 (t = 8.3) were misfitting, and items 11 (t = -2.8) and 20 (t = -2.3)
were more deterministic than allowed by the Rasch model. Infit data for the remaining 56
items indicated a good fit with the Rasch model, again providing prima facie evidence for the
unidimensional nature of the combined post-intervention BLOT and CPT data sets.
Rasch analysis of the CPT data
The results generated by the analysis of pre- and post-intervention CPT item estimates were
based on a sub-scale of the CPT items derived from the analysis of the combined pre-
intervention BLOT and CPT data together. The CPT item estimates were anchored to pre-
intervention BLOT item estimates, so the CPT person performances are estimated on the
same scale, with the same zero origin as the original pre-intervention BLOT analysis.
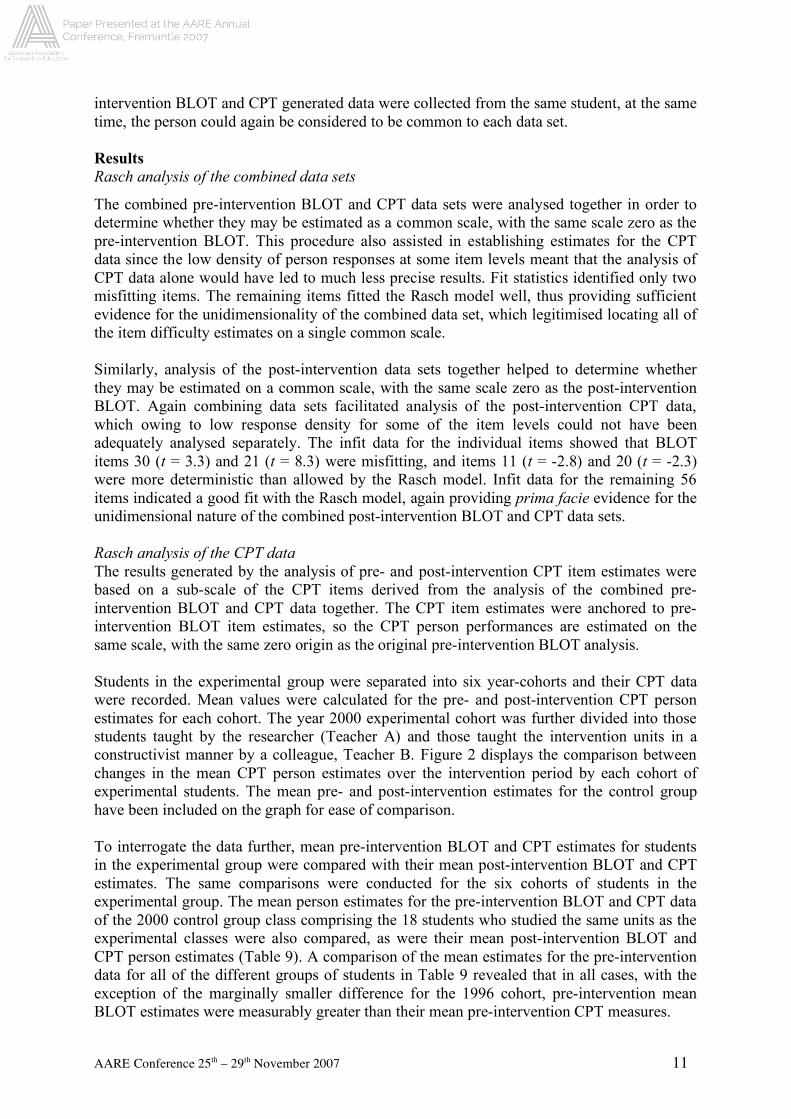
Students in the experimental group were separated into six year-cohorts and their CPT data
were recorded. Mean values were calculated for the pre- and post-intervention CPT person
estimates for each cohort. The year 2000 experimental cohort was further divided into those
students taught by the researcher (Teacher A) and those taught the intervention units in a
constructivist manner by a colleague, Teacher B. Figure 2 displays the comparison between
changes in the mean CPT person estimates over the intervention period by each cohort of
experimental students. The mean pre- and post-intervention estimates for the control group
have been included on the graph for ease of comparison.
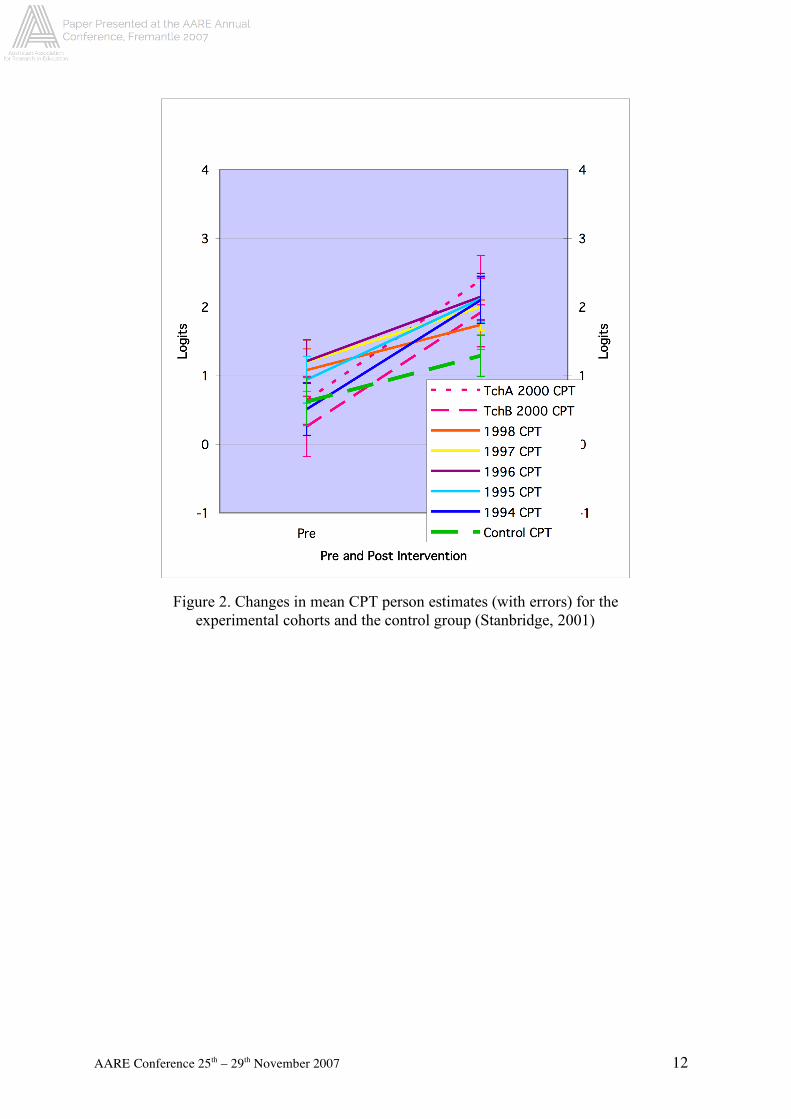
To interrogate the data further, mean pre-intervention BLOT and CPT estimates for students
in the experimental group were compared with their mean post-intervention BLOT and CPT
estimates. The same comparisons were conducted for the six cohorts of students in the
experimental group. The mean person estimates for the pre-intervention BLOT and CPT data
of the 2000 control group class comprising the 18 students who studied the same units as the
experimental classes were also compared, as were their mean post-intervention BLOT and
CPT person estimates (Table 9). A comparison of the mean estimates for the pre-intervention
data for all of the different groups of students in Table 9 revealed that in all cases, with the
exception of the marginally smaller difference for the 1996 cohort, pre-intervention mean
BLOT estimates were measurably greater than their mean pre-intervention CPT measures.
AARE Conference 25th – 29
th November 2007 12
Figure 2. Changes in mean CPT person estimates (with errors) for the
experimental cohorts and the control group (Stanbridge, 2001)
AARE Conference 25th – 29
th November 2007 13
Table 9. Mean pre-and post-intervention BLOT and CPT person estimates for the
experimental group, the six experimental cohorts and one class of control students
Mean pre-intervention person
estimates (Err.)
Mean post-intervention person
estimates (Err.)
Students
BLOT CPT BLOT CPT
Experimental group
2.09
(+0.50)
0.84
(+0.34)
2.55
(+0.63)
2.10
(+0.30)
2000 cohort
Teacher A
Teacher B
1.87
(+0.47)
1.67
(+0.44)
0.64
(+0.35)
0.26
(+0.44)
2.66
(+0.63)
2.60
(+0.63)
2.39
(+0.36)
1.92
(+0.30)
1998 cohort
2.21
(+0.55)
1.08
(+0.31)
2.76
(+0.63)
1.74
(+0.36)
1997 cohort
2.17
(+0.55)
1.20
(+0.31)
2.52
(+0.63)
2.00
(+0.34)
1996 cohort
2.05
(+0.55)
1.21
(+0.31)
2.49
(+0.55)
2.15
(+0.34)
1995 cohort
2.01
(+0.50)
0.94
(+0.34)
2.58
(+0.63)
2.12
(+0.34)
1994 cohort
2.38
(+0.55)
0.51
(+0.38)
2.42
(+0.55)
2.10
(+0.34)
2000 control class
1.49
(+0.43)
-0.88
(+0.74)
2.38
(+0.55)
-0.83
(+1.05)
However, in the case of the post-intervention mean estimates there were no cases where
BLOT mean estimates were measurably greater than CPT mean estimates, with the exception
of the control class whose mean post-intervention-BLOT estimate of 2.38 (+0.55) was
measurably greater than its mean post-intervention CPT estimate of -0.83 (+1.05). There were
no instances in which students' mean CPT estimates exceeded their mean BLOT estimates.
An inspection of the pre-intervention BLOT and CPT estimates for the 231 individual
students in the experimental groups for whom these data were available confirmed the finding
above, with the exception of only the following five students, whose CPT estimates
measurably exceeded their BLOT estimates. When the post-intervention estimates for each
student were similarly examined, it was found that in all but eighteen cases, students' BLOT
estimates exceeded their CPT estimates. In all, only 23 out of a possible 462 estimate
comparisons for the experimental students displayed performances on science tasks that
exceeded cognitive ability estimates. This number can be considered to be insignificant at p<
0.05.
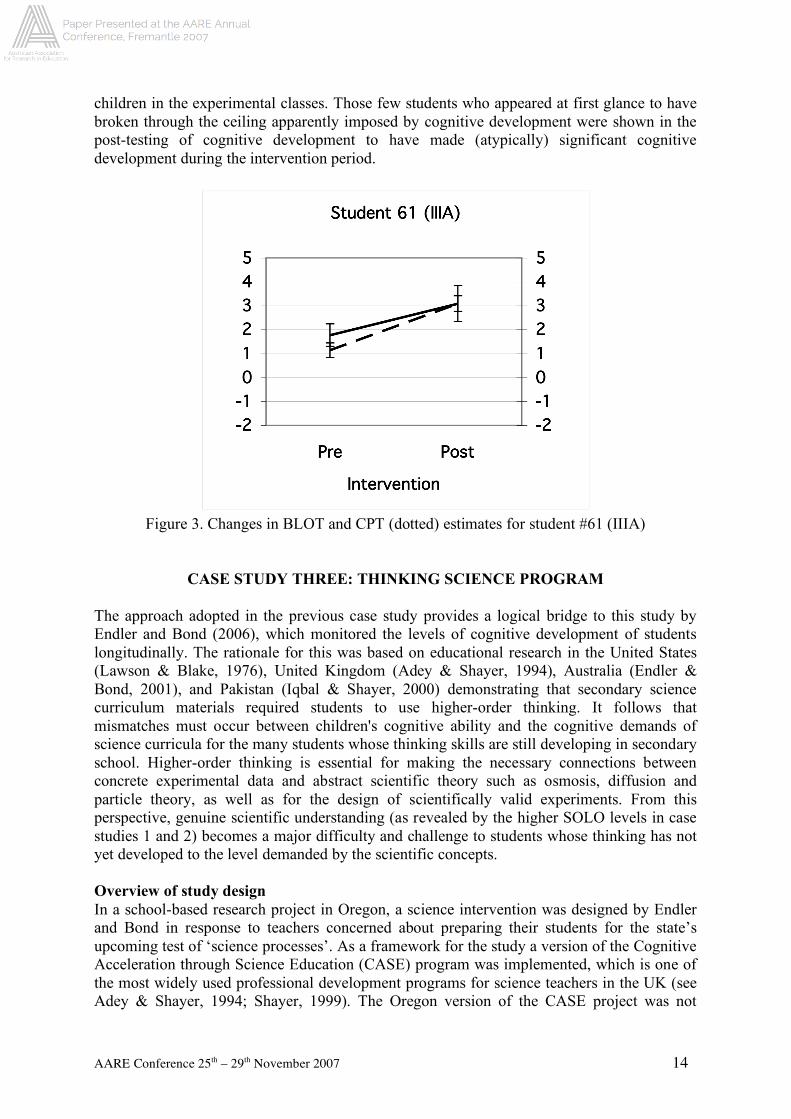
The crucial finding of this research (Stanbridge, 2001) for the current paper is that cognitive
development placed a ceiling on the understanding science achievement gains. The
constructivist learning intervention was able to raise achievement to the level commensurate
with students’ levels of cognitive development – but not beyond them. The pre- and post-
intervention profiles for student 61 in (Figure 3) are typical for those of the vast majority of
AARE Conference 25th – 29
th November 2007 14
children in the experimental classes. Those few students who appeared at first glance to have
broken through the ceiling apparently imposed by cognitive development were shown in the
post-testing of cognitive development to have made (atypically) significant cognitive
development during the intervention period.
Figure 3. Changes in BLOT and CPT (dotted) estimates for student #61 (IIIA)
CASE STUDY THREE: THINKING SCIENCE PROGRAM
The approach adopted in the previous case study provides a logical bridge to this study by
Endler and Bond (2006), which monitored the levels of cognitive development of students
longitudinally. The rationale for this was based on educational research in the United States
(Lawson & Blake, 1976), United Kingdom (Adey & Shayer, 1994), Australia (Endler &
Bond, 2001), and Pakistan (Iqbal & Shayer, 2000) demonstrating that secondary science
curriculum materials required students to use higher-order thinking. It follows that
mismatches must occur between children's cognitive ability and the cognitive demands of
science curricula for the many students whose thinking skills are still developing in secondary
school. Higher-order thinking is essential for making the necessary connections between
concrete experimental data and abstract scientific theory such as osmosis, diffusion and
particle theory, as well as for the design of scientifically valid experiments. From this
perspective, genuine scientific understanding (as revealed by the higher SOLO levels in case
studies 1 and 2) becomes a major difficulty and challenge to students whose thinking has not
yet developed to the level demanded by the scientific concepts.
Overview of study design
In a school-based research project in Oregon, a science intervention was designed by Endler
and Bond in response to teachers concerned about preparing their students for the state’s
upcoming test of ‘science processes’. As a framework for the study a version of the Cognitive
Acceleration through Science Education (CASE) program was implemented, which is one of
the most widely used professional development programs for science teachers in the UK (see
Adey & Shayer, 1994; Shayer, 1999). The Oregon version of the CASE project was not
AARE Conference 25th – 29
th November 2007 15
merely a replication of the British CASE research in that the two instruments employed as
indicators of cognitive level (Bond’s Logical Operations Test [BLOT]) (Bond, 1976) and
Oregon student achievement scores (OSS) were Rasch-calibrated measures.
Data from the Oregon state-mandated annual Mathematics and Reading and Literature tests
(known as OSS, 2005) were used to follow the achievement of all students tested with BLOT
(Table 10). These tests provided scaled scores that are computed using the Rasch
measurement model (Ingebo, 1997). Students received a scaled scores ranging from 150 RITs
to about 300 RITs. The RIT scale is based on the convention that 10 RITs equal one logit
(Rasch log odds unit). Benchmarks have been set for student results that meet and exceed the
state standard for each subject and grade level.
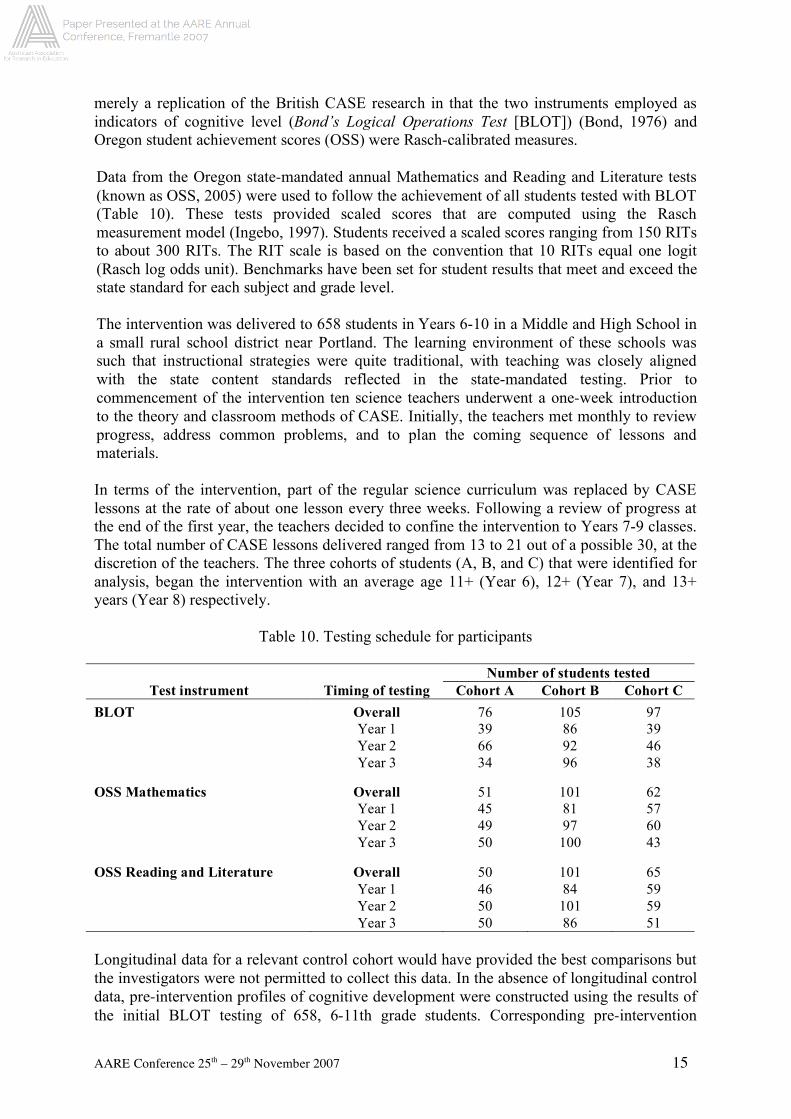
The intervention was delivered to 658 students in Years 6-10 in a Middle and High School in
a small rural school district near Portland. The learning environment of these schools was
such that instructional strategies were quite traditional, with teaching was closely aligned
with the state content standards reflected in the state-mandated testing. Prior to
commencement of the intervention ten science teachers underwent a one-week introduction
to the theory and classroom methods of CASE. Initially, the teachers met monthly to review
progress, address common problems, and to plan the coming sequence of lessons and
materials.
In terms of the intervention, part of the regular science curriculum was replaced by CASE
lessons at the rate of about one lesson every three weeks. Following a review of progress at
the end of the first year, the teachers decided to confine the intervention to Years 7-9 classes.
The total number of CASE lessons delivered ranged from 13 to 21 out of a possible 30, at the
discretion of the teachers. The three cohorts of students (A, B, and C) that were identified for
analysis, began the intervention with an average age 11+ (Year 6), 12+ (Year 7), and 13+
years (Year 8) respectively.
Table 10. Testing schedule for participants
Number of students tested
Test instrument Timing of testing Cohort A Cohort B Cohort C
BLOT Overall 76 105 97
Year 1 39 86 39
Year 2 66 92 46
Year 3 34 96 38
OSS Mathematics Overall 51 101 62
Year 1 45 81 57
Year 2 49 97 60
Year 3 50 100 43
OSS Reading and Literature Overall 50 101 65
Year 1 46 84 59
Year 2 50 101 59
Year 3 50 86 51
Longitudinal data for a relevant control cohort would have provided the best comparisons but
the investigators were not permitted to collect this data. In the absence of longitudinal control
data, pre-intervention profiles of cognitive development were constructed using the results of
the initial BLOT testing of 658, 6-11th grade students. Corresponding pre-intervention
AARE Conference 25th – 29
th November 2007 16
profiles for OSS Mathematics and Reading and Literature achievement were constructed from
the results of the state-mandated tests. Subsequently, these cross-sectional control profiles
represent baselines before the school district engaged in the intervention program.
Results
An innovative feature of the Oregon CASE study is that data from both the cognitive tests
and the state achievement tests are Rasch-scaled. The raw scores from BLOT were subjected
to Rasch analysis using the Quest software package (Adams & Khoo, 1996). In order to
maintain the invariance of the measuring scale over time, the results of all subsequent BLOT
test analyses were anchored to the item values for the first year of the intervention. This
ensured that the level of difficulty of the items used in subsequent years could be anchored to
the values generated by the pre-test, and ensured that the same ‘ruler’ was used to measure
cognitive development on each occasion.
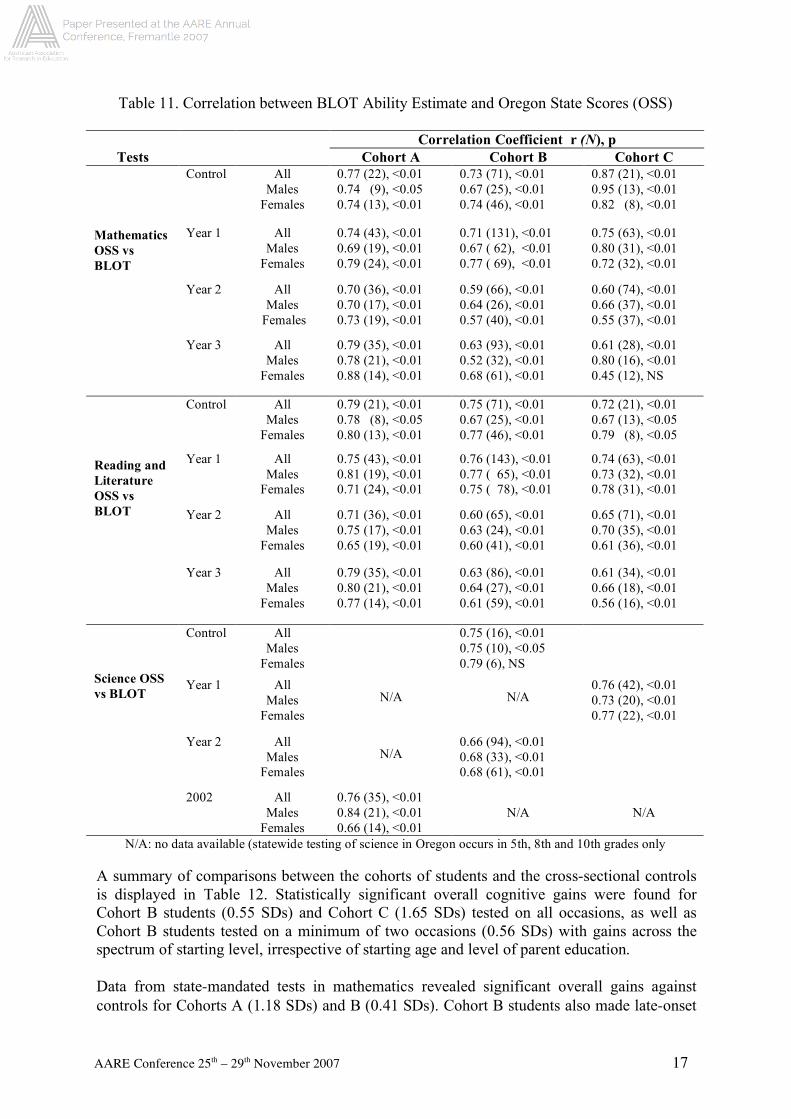
Correlations were calculated between the OSS and the BLOT ability estimates for control
students and for students who experienced the intervention. The results of these correlation
tests are shown in Table 11. Of the 84 correlations performed, 77 were found to be significant
at p < 0.01. The exceptions had sample sizes of 13 or fewer students. There appear to be
consistent, broad and strong correlations between the cognitive level of these students, as
estimated by the BLOT, and their achievement in the Oregon state-mandated Mathematics,
Reading and Literature, and Science tests. No statistically significant differences were found
between the correlation coefficients of the control and any cohort when tests for
heterogeneity among two or more correlation coefficients were applied to the data in Table
11.
It could be argued that the high correlation between cognitive ability and scholastic
achievement seen in Table 11 might be influenced by the similarity of format (multiple
choice) of the BLOT and Oregon state mandated tests. However, comparable correlations (p
<0.01) were found between BLOT ability estimates and achievement scores of Year 12
students in the Queensland Core Skills (QCS) Test in our Australian CASE study (Endler &
Bond, 2001). Therefore, the relationship between the level of cognitive development and a
broad raft of school achievement indicators seems to persist independent of the country, year
level, curriculum content as well as style and content of teaching. Of course there can be no
direct evidence of a causal link between cognition and achievement or between the enhanced
cognitive abilities and subsequent achievement gains reported in CASE research. However,
the claim that CASE activities stimulate cognitive development directly, and then school
achievement indirectly, is at the heart of the experiences in the US and UK.
There was remarkable heterogeneity in cognitive development in the students, although a
late-onset growth spurt in the last year of the intervention was evident for many students in
Cohorts B and C. To investigate changes during the 32-months, the overall slope (change in
BLOT ability estimate/OSS over time in months) was calculated for each student and used in
the subsequent analysis. The mean and standard deviations of these slopes were the
calculated. The mean slope for each cohort equivalent of the control was used as a parameter
in t-tests for the difference between the overall slopes of experimental and control samples.
AARE Conference 25th – 29
th November 2007 17
Table 11. Correlation between BLOT Ability Estimate and Oregon State Scores (OSS)
Correlation Coefficient r (N), p
Tests Cohort A Cohort B Cohort C
Control All
Males
Females
0.77 (22), <0.01
0.74 (9), <0.05
0.74 (13), <0.01
0.73 (71), <0.01
0.67 (25), <0.01
0.74 (46), <0.01
0.87 (21), <0.01
0.95 (13), <0.01
0.82 (8), <0.01
Year 1 All
Males
Females
0.74 (43), <0.01
0.69 (19), <0.01
0.79 (24), <0.01
0.71 (131), <0.01
0.67 ( 62), <0.01
0.77 ( 69), <0.01
0.75 (63), <0.01
0.80 (31), <0.01
0.72 (32), <0.01
Year 2 All
Males
Females
0.70 (36), <0.01
0.70 (17), <0.01
0.73 (19), <0.01
0.59 (66), <0.01
0.64 (26), <0.01
0.57 (40), <0.01
0.60 (74), <0.01
0.66 (37), <0.01
0.55 (37), <0.01
Mathematics
OSS vs
BLOT
Year 3 All
Males
Females
0.79 (35), <0.01
0.78 (21), <0.01
0.88 (14), <0.01
0.63 (93), <0.01
0.52 (32), <0.01
0.68 (61), <0.01
0.61 (28), <0.01
0.80 (16), <0.01
0.45 (12), NS
Control All
Males
Females
0.79 (21), <0.01
0.78 (8), <0.05
0.80 (13), <0.01
0.75 (71), <0.01
0.67 (25), <0.01
0.77 (46), <0.01
0.72 (21), <0.01
0.67 (13), <0.05
0.79 (8), <0.05
Year 1 All
Males
Females
0.75 (43), <0.01
0.81 (19), <0.01
0.71 (24), <0.01
0.76 (143), <0.01
0.77 ( 65), <0.01
0.75 ( 78), <0.01
0.74 (63), <0.01
0.73 (32), <0.01
0.78 (31), <0.01
Year 2 All
Males
Females
0.71 (36), <0.01
0.75 (17), <0.01
0.65 (19), <0.01
0.60 (65), <0.01
0.63 (24), <0.01
0.60 (41), <0.01
0.65 (71), <0.01
0.70 (35), <0.01
0.61 (36), <0.01
Reading and
Literature
OSS vs
BLOT
Year 3 All
Males
Females
0.79 (35), <0.01
0.80 (21), <0.01
0.77 (14), <0.01
0.63 (86), <0.01
0.64 (27), <0.01
0.61 (59), <0.01
0.61 (34), <0.01
0.66 (18), <0.01
0.56 (16), <0.01
Control All
Males
Females
0.75 (16), <0.01
0.75 (10), <0.05
0.79 (6), NS
Year 1 All
Males
Females
N/A
N/A
0.76 (42), <0.01
0.73 (20), <0.01
0.77 (22), <0.01
Year 2 All
Males
Females
N/A
0.66 (94), <0.01
0.68 (33), <0.01
0.68 (61), <0.01
Science OSS
vs BLOT
2002 All
Males
Females
0.76 (35), <0.01
0.84 (21), <0.01
0.66 (14), <0.01
N/A
N/A
N/A: no data available (statewide testing of science in Oregon occurs in 5th, 8th and 10th grades only
A summary of comparisons between the cohorts of students and the cross-sectional controls
is displayed in Table 12. Statistically significant overall cognitive gains were found for
Cohort B students (0.55 SDs) and Cohort C (1.65 SDs) tested on all occasions, as well as
Cohort B students tested on a minimum of two occasions (0.56 SDs) with gains across the
spectrum of starting level, irrespective of starting age and level of parent education.
Data from state-mandated tests in mathematics revealed significant overall gains against
controls for Cohorts A (1.18 SDs) and B (0.41 SDs). Cohort B students also made late-onset
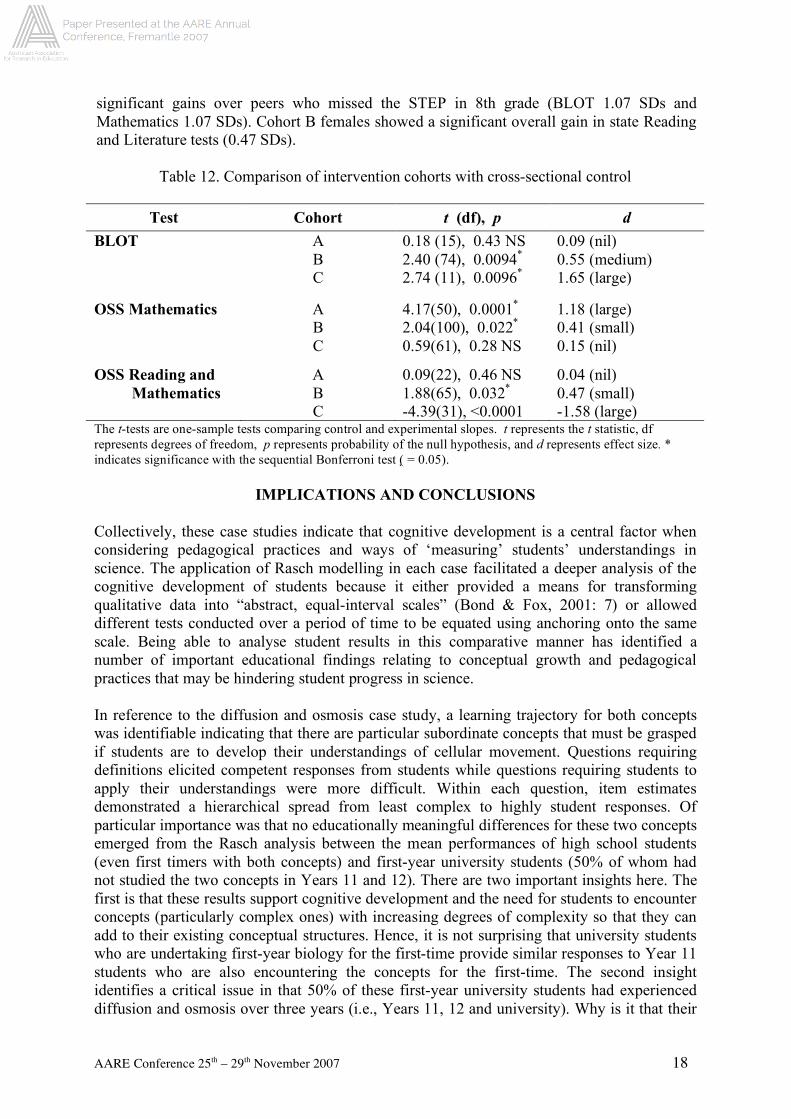
AARE Conference 25th – 29
th November 2007 18
significant gains over peers who missed the STEP in 8th grade (BLOT 1.07 SDs and
Mathematics 1.07 SDs). Cohort B females showed a significant overall gain in state Reading
and Literature tests (0.47 SDs).
Table 12. Comparison of intervention cohorts with cross-sectional control
Test Cohort t (df), p d
BLOT A 0.18 (15), 0.43 NS 0.09 (nil)
B 2.40 (74), 0.0094* 0.55 (medium)
C 2.74 (11), 0.0096* 1.65 (large)
OSS Mathematics A 4.17(50), 0.0001* 1.18 (large)
B 2.04(100), 0.022* 0.41 (small)
C 0.59(61), 0.28 NS 0.15 (nil)
OSS Reading and A 0.09(22), 0.46 NS 0.04 (nil)
Mathematics B 1.88(65), 0.032* 0.47 (small)
C -4.39(31), <0.0001 -1.58 (large) The t-tests are one-sample tests comparing control and experimental slopes. t represents the t statistic, df
represents degrees of freedom, p represents probability of the null hypothesis, and d represents effect size. *
indicates significance with the sequential Bonferroni test ( = 0.05).
IMPLICATIONS AND CONCLUSIONS
Collectively, these case studies indicate that cognitive development is a central factor when
considering pedagogical practices and ways of ‘measuring’ students’ understandings in
science. The application of Rasch modelling in each case facilitated a deeper analysis of the
cognitive development of students because it either provided a means for transforming
qualitative data into “abstract, equal-interval scales” (Bond & Fox, 2001: 7) or allowed
different tests conducted over a period of time to be equated using anchoring onto the same
scale. Being able to analyse student results in this comparative manner has identified a
number of important educational findings relating to conceptual growth and pedagogical
practices that may be hindering student progress in science.
In reference to the diffusion and osmosis case study, a learning trajectory for both concepts
was identifiable indicating that there are particular subordinate concepts that must be grasped
if students are to develop their understandings of cellular movement. Questions requiring
definitions elicited competent responses from students while questions requiring students to
apply their understandings were more difficult. Within each question, item estimates
demonstrated a hierarchical spread from least complex to highly student responses. Of
particular importance was that no educationally meaningful differences for these two concepts
emerged from the Rasch analysis between the mean performances of high school students
(even first timers with both concepts) and first-year university students (50% of whom had
not studied the two concepts in Years 11 and 12). There are two important insights here. The
first is that these results support cognitive development and the need for students to encounter
concepts (particularly complex ones) with increasing degrees of complexity so that they can
add to their existing conceptual structures. Hence, it is not surprising that university students
who are undertaking first-year biology for the first-time provide similar responses to Year 11
students who are also encountering the concepts for the first-time. The second insight
identifies a critical issue in that 50% of these first-year university students had experienced
diffusion and osmosis over three years (i.e., Years 11, 12 and university). Why is it that their
AARE Conference 25th – 29
th November 2007 19
responses do not demonstrate a higher degree of abstractness or greater structural complexity
than first-time students?
This issue is often raised by university academics in Faculties of Sciences who report
disappointing student performance, particularly in first-year (Akerlind & Jenkins, 1998).
However, part of this may be due to pedagogical practices including (i) restricted scientific
experiences that do not extend those students who are cognitively more capable, and (ii)
utilisation of questions in assignments, practical sessions, and lectures that do not engage and
challenge students to develop skills requiring higher-order thinking. The result is that students
adopt surface learning approaches to efficiently meet the demands of their courses of study
(Biggs, 1999; Prosser & Trigwell, 1999). So, two possible influences require further
examination. The first is the possibility of using non-traditional science teaching/learning
strategies that focus directly on the enhancement of genuine scientific understanding; the
second is the role played by the cognitive capacity of students.
The second case study (Stanbridge, 2001) focussed on the pedagogical issue: Can a radical
constructivist approach to science learning actually improve secondary school students’
understanding of core scientific concepts? It explored the relationship between the students’
understanding of science tasks and their cognitive abilities in a pre- and post-test intervention
program. The results suggested that apart from a few exceptions, the levels of students’
conceptual understanding of science tasks, as measured by CPT estimates of their exam
answers, did not exceed their cognitive abilities, as measured by their BLOT estimates. This
was the case both prior to, and at the end of, the intervention program. In general students’
pre-intervention cognitive ability estimates were measurably greater than their pre-
intervention conceptual performances. However, by the end of the intervention period there
was on average no measurable difference between the levels of experimental students’
cognitive abilities and their conceptual performances on science tasks. In general the rates at
which students' cognitive abilities and performances on science tasks progressed during the
intervention period did not appear to display close similarities. These results suggest that
teaching for increased understanding in high school science lessons is possible, but that a
“glass ceiling” to those increases might be imposed by the cognitive capacity of the students.
This interpretation is not only internally consistent with the results from case study two, but
could explain the flat profile of understanding revealed by case study one.
A possible solution to these findings can be inferred from the CASE project of Shayer (1999)
in the UK. This involved a rather different strategy for a science-based intervention; instead
of focussing teaching of science in order to improve science understanding – attack the glass
ceiling on achievement evident in studies one and two by using an intervention design to
provoke the higher-order thinking skills described in Piaget’s model of formal operational
thinking. Case study three provides the empirical evidence of the success of that approach
even in sub-optimal settings. Not only was the CASE-based intervention in Oregon successful
in raising the cognitive developmental profiles of the high school students, the consequent
increase in externally mandated state achievement tests of language and mathematics is also
evident. One might reasonably infer that when the ceiling of cognitive development is raised
(through special ‘science’ lessons), students are better able to learn from the ‘not so special’
everyday lessons they encounter in secondary school. Is the answer to the disappointing
profiles of science understanding (case study one), not about how to teach science (case study
two) but how to teach thinking (case study three)?
AARE Conference 25th – 29
th November 2007 20
Is it possible that teachers of the physical sciences might remain resistant to pedagogical
change in the face of such empirical evidence? In the case study suite outlined above, many of
the features of physical science investigations have been instantiated. Indeed, one common
element has been the methodological issue of developing genuine interval-level measures for
processes and outcomes; the Rasch model provides the most stringent requirements for the
measurement of human science variables.
REFERENCES
Adams, R.J., & Khoo, S-T. (1996). Quest: The Interactive Test Analysis System, (Version
2.1). Victoria: Australian Council for Educational Research (software program).
Adey, P. & Shayer, M. (1994). Really raising standards: Cognitive intervention and
academic achievement. London: Routledge.
Akerlind, G. S., & Jenkins, S. (1998). Academics’ views of the relative roles and
responsibilities of teachers and learners in a first-year university course. Higher
Education Research and Development, 17(3), 277-289.
Biggs, J.B., & Collis, K.F. (1982). Evaluating the quality of learning: The SOLO Taxonomy.
New York: Academic Press.
Biggs, J.B., & Collis, K.F. (1991). Multimodal learning and the quality of intelligent
behaviour. In H. Rowe (Ed.), Intelligence reconceptualisation and environment (pp.
57-76). Hillsdale, NJ: Lawrence Erlbaum Associates.
Biggs, J. B. (1999). What the student does: Teaching for enhanced learning. Higher
Education Research and Development, 18(1), 57-75.
Black, P. & Wiliam, D. (1998). Assessment and classroom learning. Assessment in Education,
5(1), 7-74.
Bond, T. G. (1976) Bond's Logical Operations Test. Townsville: T.C.A.E.
Bond, T. G. (1995a). Piaget and measurement I: The twain really do meet. Archives de
Psychologie, 63, 71-87.
Bond, T. G. (1995b). Piaget and measurement II: Empirical validation of the Piagetian model.
Archives de Psychologie, 63, 155-185.
Bond, T.G., & Fox, C. M. (2001). Applying the Rasch model: Fundamental measurement in
the human sciences. New Jersey: Lawrence Erlbaum Associates.
Bond, T.G., & Fox, C. M. (2007). Applying the Rasch model: Fundamental measurement in
the human sciences, 2nd
Edition. New Jersey: Lawrence Erlbaum Associates.
Case, R. (1992). The Mind's Staircase: Exploring the conceptual underpinnings of children's
thought and knowledge. Hillsdale, NJ: Laurence Erlbaum Associates.
Christiansson, D. J. (1983). An investigation of the relationship between cognitive
developmental stage and quantitative skills in college students. Unpublished thesis,
University of the South Pacific, Fiji.
Collis, K.F., Jones, B.L., Sprod, T., Watson, J.M., & Fraser, S.P. (1998). Mapping
development in students’ understanding of vision using a cognitive structural model.
International Journal of Science Education, 20(1), 45-66.
Driver, R. (1983). The pupil as scientist? Milton Keynes, UK: Open University Press.
Driver, R. (1989). Changing conceptions. In P. Adey (Ed.), Adolescent development and
school science (pp. 79-104). Lewes, UK: The Falmer Press.
Endler, L C. & Bond, T. G. (2001a). Changing science outcomes: Cognitive acceleration in a
US setting. Research in Science Education, Springer-Kluwer online.
Endler, L C. & Bond, T. G. (2001b). Cognitive development in a secondary science. Research
in Science Education, 30(4), 403-416.
Endler, L C. & Bond, T. G. (2006). Tracking cognitive development with the rasch model:
Empirical evidence of growth and heterogeneity. In In X. Liu & W. J. Boone (Eds.),
AARE Conference 25th – 29
th November 2007 21
Applications of Rasch Measurement in Science Education (pp. 74-110). Maple Grove,
MN: JAM Press.
Fensham, P.J., Gunstone, R.F., & White, R.T. (1994). Science content and constructivist
views of learning and teaching. In P.J. Fensham, R.F. Gunstone, & R.T. White (Eds.),
The content of science: A constructivist approach to its teaching and learning (pp. 1-
8). London, UK: The Falmer Press.
Fischer, K.W. & Knight, C.C. (1990). Cognitive development in real children: Levels and
variations. In B. Presseisen (Ed.), Learning and thinking styles: Classroom interaction
(pp. 43-67). Washington, DC: National Education Association.
Guth, J., & Pegg, J. (1994). First-year tertiary students’ understandings of iron filing patterns
around a magnet. Research in Science Education, 24, 137-146.
Hand, B., Treagust, D.F., & Vance, K. (1997). Student perceptions of the social constructivist
classroom. Science Education, 81(5), 561-575.
Hautämaki, J. (1989). The application of a Rasch model on Piagetian measures of stages of
thinking. In P. Adey, J. Bliss, J. Head, & M. Shayer (Eds.), Adolescent development
and school science (pp. 342-349). London, UK: Falmer Press
Ingebo, G. S. (1997). Probability in the measure of achievement. Chicago: MESA Press.
Inhelder, B., & Piaget, J. (1958). The growth of logical thinking from childhood to
adolescence. London: Routledge and Kegan Paul.
Iqbal, H. M. & Shayer, M. (2000). Accelerating the development of formal thinking in
Pakistan secondary school pupils: Achievement effects and professional development
issues. Journal of Research in Science Teaching, 37(3), 259-274.
King, J. & Bond, T. (1996). A Rasch analysis of a measure of computer anxiety. Journal of
Educational Computing Research, 14, 49-65.
LaBarbera, M., & Vogel, S. (1982). The design of fluid transport systems in organisms.
American Scientist, 70(1), 54-60.
Lai K. & Griffin, P. (2001). Linking cognitive psychology and item response models. Paper
presented at the Australian Association for Research in Education Annual Conference,
Brisbane, Queensland. Retrieved 6th
February, 2007 from
http://www.aare.edu.au/01pap/lai01487.htm
Lawson, A. E. & Blake, A. J. D. (1976). Concrete and formal thinking abilities in high school
biology students as measured by three separate instruments. Journal of Research in
Science Teaching, 13, 3, 227-235.
Levins, L., & Pegg, J. (1994). An exploration of the notion of cycles of levels within modes of
the SOLO Taxonomy. Paper presented at the Australian Association for Research in
Education (AARE) Conference, University of Newcastle, NSW.
Marek, E.A. (1986). Understandings and misunderstandings of biology concepts. American
Biology Teacher, 48(1), 37-40.
Marek, E.A., Cowan C.C., & Cavallo, A.M.L. (1994). Students’ misconceptions about
diffusion: How can they be eliminated? The American Biology Teacher, 56(2), 74-77.
Odom, A.L. (1992). The development and validation of a two-tier diagnostic test measuring
college biology students’ understanding of diffusion and osmosis. Unpublished
dissertation for PhD, University of Missouri, Columbia.
Oregon Department of Education (2005). Oregon assessment system. Retrieved
on November 29, 2005, at http://www.ode.state.or.us
Panizzon, D. (2003). Using a cognitive structural model to provide new insights into students’
understandings of diffusion. International Journal of Science Education, 25(12),
1427-1450.
Panizzon, D. & Bond, T. (2006). Exploring Conceptual Understandings of Diffusion and
Osmosis by Senior High School and Undergraduate University Science Students. In
AARE Conference 25th – 29
th November 2007 22
X. Liu & W. J. Boone (Eds.), Applications of Rasch Measurement in Science
Education (pp. 137-164). Maple Grove, MN: JAM Press.
Panizzon, D. & Pegg, J. (in press). Assessment practices: Empowering mathematics and
science teachers in rural secondary schools to enhance student learning. International
Journal of Science and Mathematics Education.
Pegg, J., & Davey, G. (1998) A synthesis of two models: Interpreting Student Understanding
in Geometry. In R. Lehrer & C. Chazan, (Eds.), Designing Learning Environments for
Developing Understanding of Geometry and Space (pp. 109-135). New Jersey:
Lawrence Erlbaum.
Prosser, M., & Trigwell, K. (1999). Understanding learning and teaching: The experience in
higher education. Buckingham, UK: The Society of Research into Higher Education
and Open University Press.
Shayer, M. (1999). Cognitive acceleration through science education II: Its effect and scope.
International Journal of Science Education, 21(8), 883-902.
Smith, L. & Knight, P. (1992). Adolescent reasoning tests with history content. Archives de
Psychologie, 60, 225-242
Stafford, E. (2004) What the pendulum can tell educators about children’s scientific
reasoning. Science & Education, 13, 757–790.
Stanbridge, B. (2001). A radical constructivist approach to high school science teaching.
Unpublished PhD Thesis, James Cook University, Townsville, Queensland.
Tytler, R. (1993). Developmental aspects of primary school children’s construction of
explanations of air pressure: the nature of conceptual change. Research in Science
Education, 23, 308-316.
Wilson, M. & Adams (1995). Rasch models for item bundles. Psychometrika, 60, 181-198.
Wilson, M. & Iventosch, L. (1988). Using the partial credit model to investigate responses to
structured subtests. Applied Measurement in Education, 1(4), 319-334.
Wilson, M. & Sloane, K. (2000). From principles to practice: An embedded assessment
system. Applied Measurement in Education, 13(2), 181-208.
Wittrock, M.C. (1985). Learning science by generating new conceptions from old ideas. In
L.H.T West & L.A. Pines (Eds.), Cognitive structure and conceptual change (pp. 259-
266). Orlando, Florida: Academic Press.
Wright, B.D., & Masters, G.N. (1982). Rating scale analysis. Chicago, IL: MESA Press.
Zuckerman, J.T. (1993). Accurate and inaccurate conceptions about osmosis that
accompanied meaningful problem solving. Paper presented at the Annual Meeting of
the National Association for Research in Science Teaching (NARST), Atlanta,
Georgia.


![What is pedagogical linguistics? - dickhudson.com€¦ · Web view[For Pedagogical Linguistics, vol 1] Towards a pedagogical linguistics. Richard Hudson. Abstract. Pedagogical linguistics](https://img.pdfslide.us/doc/110x75/5e21169c6214331e050a7d69/what-is-pedagogical-linguistics-web-viewfor-pedagogical-linguistics-vol-1.jpg)