Embed Size (px)
Citation preview
NCES 2018-098 U.S. DEPARTMENT OF EDUCATION
Measuring School Climate Using the 2015 School Crime Supplement Technical Report
Measuring School Climate Using the 2015 School Crime Supplement Technical Report
OCTOBER 2018
Deborah Lessne Christina Yanez Synergy Enterprises, Inc.
Michael Sinclair Mathematica Policy Research
Rachel Hansen Project Officer National Center for Education Statistics
NCES 2018-098 U.S. DEPARTMENT OF EDUCATION
U.S. Department of Education Betsy DeVos Secretary
Institute of Education Sciences Mark Schneider Director
National Center for Education Statistics James L. Woodworth Commissioner
The National Center for Education Statistics (NCES) is the primary federal entity responsible for collecting, analyzing, and reporting data related to education in the United States and other nations. It fulfills a congressional mandate to collect, collate, analyze, and report full and complete statistics on the condition of education in the United States; conduct and publish reports and specialized analyses of the meaning and significance of such statistics; assist state and local education agencies in improving their statistical systems; and review and report on education activities in foreign countries.
NCES activities are designed to address high-priority education data needs; provide consistent, reliable, complete, and accurate indicators of education status and trends; and report timely, useful, and high-quality data to the U.S. Department of Education, the Congress, the states, other education policymakers, practitioners, data users, and the general public. Unless specifically noted, all information contained herein is in the public domain.
We strive to make our products available in a variety of formats and in language that is appropriate to a variety of audiences. You, as our customer, are the best judge of our success in communicating information effectively. If you have any comments or suggestions about this or any other NCES product or report, we would like to hear from you. Please direct your comments to:
NCES, IES, U.S. Department of Education Potomac Center Plaza 550 12th Street SW Washington, DC 20202
October 2018
The NCES Home Page address is http://nces.ed.gov. The NCES Publications and Products address is http://nces.ed.gov/pubsearch.
This publication is only available online. To download, view, and print the report as a PDF file, go to the NCES Publications and Products address shown above.
This report was prepared for the National Center for Education Statistics under Contract No. ED-IES-12D-0010/0004 with Synergy Enterprises, Inc. Mention of trade names, commercial products, or organizations does not imply endorsement by the U.S. Government.
Suggested Citation Lessne, D., Yanez, C., and Sinclair, M. (2018). Measuring School Climate Using the 2015 School Crime Supplement: Technical Report (NCES 2018-098). U.S. Department of Education. Washington, DC: National Center for Education Statistics. Retrieved [date] from http://nces.ed.gov/pubsearch.
Content Contact Rachel Hansen (202) 245-7082 [email protected]
iii
Executive Summary This report focuses on the construction, assessment, and analysis of school climate scores using items from the 2015 School Crime Supplement (SCS) to the National Crime Victimization Survey (NCVS). Since 1989, the student-reported data from the SCS have been used to generate national estimates of criminal and bullying victimization in schools and to evaluate differences in the prevalence of victimization over time and among different student groups. However, there also is a wide array of questions in the SCS that address student perceptions of school climate, including indicators of safety and disorder (e.g., presence of security guards, presence of gangs), quality of relationships at school (e.g., feeling that an adult or peer at school really cares about you), and student engagement in school (e.g., participation in extracurricular activities, future plans for education). Because the SCS is a primary source of national information on student criminal and bullying victimization, it is a unique resource for studying the relationships between school victimization and school climate.
The National School Climate Council reports that school climate is a multifaceted construct, which “is based on patterns of people’s experiences of school life and reflects norms, goals, values, interpersonal relationships, teaching and learning practices, and organizational structures.”1 It is often assessed using a composite of multiple measures of a school’s environment and students’ experiences within it. Therefore, to obtain a comprehensive indicator of school climate from the SCS, survey variables were used that encompass students’ perceptions of various aspects of their school experiences to develop a composite score representative of overall school climate.
Development of the school climate scores documented in this report proceeded in three steps. First, items in the SCS were selected that relate to aspects of school climate based on a review of the literature or that were aligned with similar questions used in previous research on school climate measurement. Some SCS items were changed into categorical variables or rescaled. Afterward, some items were combined into a single score for that group.
Next, item analysis was performed using polyserial correlations, along with exploratory factor analysis, to assess how well the SCS items2 mapped to underlying climate factors and substantiate the mapping of the factors to established school climate domains. As expected, three domains were identified, with a set of SCS items mapped to each. These domains logically aligned with the three-domain model of school climate—Engagement, Environment, and Safety—which is described on the website of the U.S. Department of Education (ED) Office of Safe and Healthy Students’ National Center on Safe Supportive Learning Environments (NCSSLE).3 During the mapping, some SCS items were dropped, as they did not correlate well with the other SCS items in their domains. In total, 21 items were mapped to the three domains, and a final scale score for each domain and total school climate score were calculated.
After score development, and as the third and final step in this research, we identified differences in the scores across student subgroups (including whether the student reported victimization or bullying in school) for each of the three climate domains and for the total climate score. The observed differences are discussed in the Conclusions section of this report. Based on this information, we explored whether the school climate scores developed from SCS items differed in expected ways among students from various subgroups. We found that,
1 See the National School Climate Council 2007 publication The School Climate Challenge: Narrowing the Gap Between School Climate Research and School Climate Policy, Practice Guidelines and Teacher Education Policy, which can be found at http://www.schoolclimate.org/climate/advocacy.php. 2 Some SCS items were combined as noted in the prior step. 3 For more information on the NCSSLE model’s measures and development, go to https://safesupportivelearning.ed.gov/.
iv
consistent with the literature, students who had been bullied or criminally victimized at school rated school climate lower (less favorably) in some domains. Asian students tended to have higher overall school climate ratings, while Black students rated school climate significantly lower than Whites. Middle grade students (6th through 8th grades) had higher ratings for overall school climate than high school students (9th through 12th grades). Students from higher income families produced higher climate scores.
Based on the alignment of the final domains with NCSSLE school climate model and composite scale ratings, as well as the fact that differences among groups of students followed expected patterns, we concluded that the school climate measures developed from the SCS can be used as indicators among 12- to 18-year-old students in the United States. These measures may be useful in tracking national trends in the same way that student victimization has been evaluated from the NCVS/SCS.
v
Contents Page
Executive Summary........................................................................................................................ iii
Introduction ................................................................................................................................... 1
Students Included in the Analysis ....................................................................................................................... 2
Development of a School Climate Scale Score From NCVS/SCS Items ............................................... 3
Item Mapping and Scoring .................................................................................................................................. 3
Factor Analysis of Domains ............................................................................................................................... 12
Analysis of School Climate in the 2015 School Crime Supplement .................................................. 16
Student Characteristics ..................................................................................................................................... 16
Student-Reported School Victimization ............................................................................................................ 22
Conclusions................................................................................................................................... 28
Technical Notes ............................................................................................................................ 31
NCVS/SCS Sample Design and Data Collection ................................................................................................. 31
Variables Used ................................................................................................................................................... 33
Statistical Procedures ........................................................................................................................................ 34
References .................................................................................................................................... 31
Appendix A. Tables ..................................................................................................................... A-1
vi
List of Tables Table Page
1. Items from the 2015 SCS evaluated for inclusion in the school climate scale score ....................................... 4
2. Variables flagged due to low factor loading ................................................................................................... 12
3. Variables flagged due to low polyserial correlation ....................................................................................... 13
4. Primary factor analysis of scale items and factor loading .............................................................................. 13
5. Cronbach’s alpha by individual item removed for the Safety domain of school climate ............................... 14
6. School climate and domain descriptive statistics ........................................................................................... 15
List of Figures Figure Page
1. School climate domains and topics (NCSSLE) ................................................................................................... 1
2. Mean school Engagement domain scores reported by students ages 12 through 18, by selected student characteristics: School year 2014–15 ................................................................................................ 13
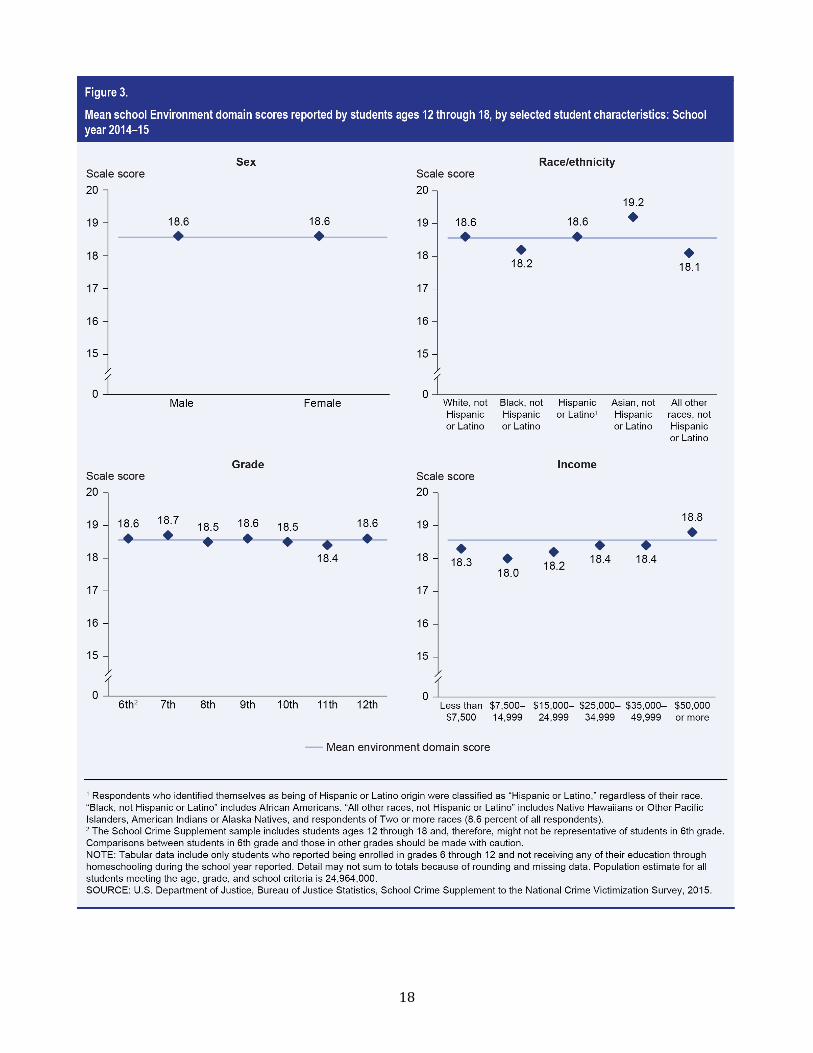
3. Mean school Environment domain scores reported by students ages 12 through 18, by selected student characteristics: School year 2014–15 ................................................................................................ 14
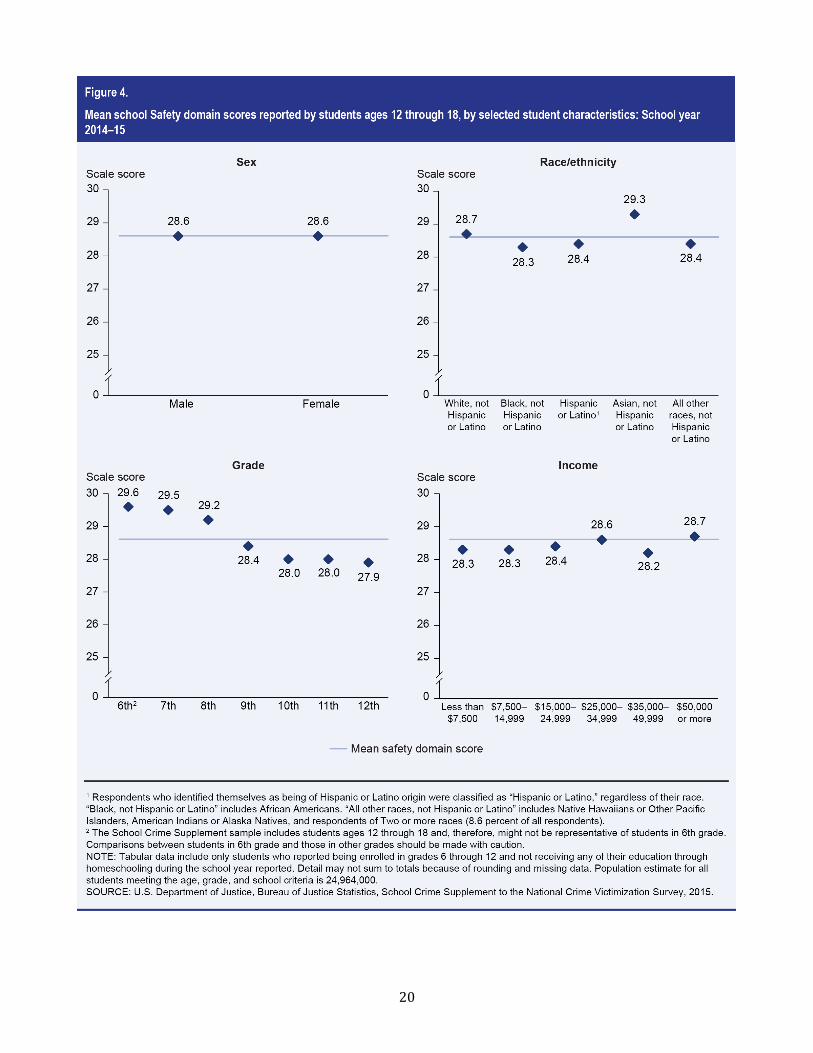
4. Mean school Safety domain scores reported by students ages 12 through 18, by selected student characteristics: School year 2014–15 ............................................................................................................. 15
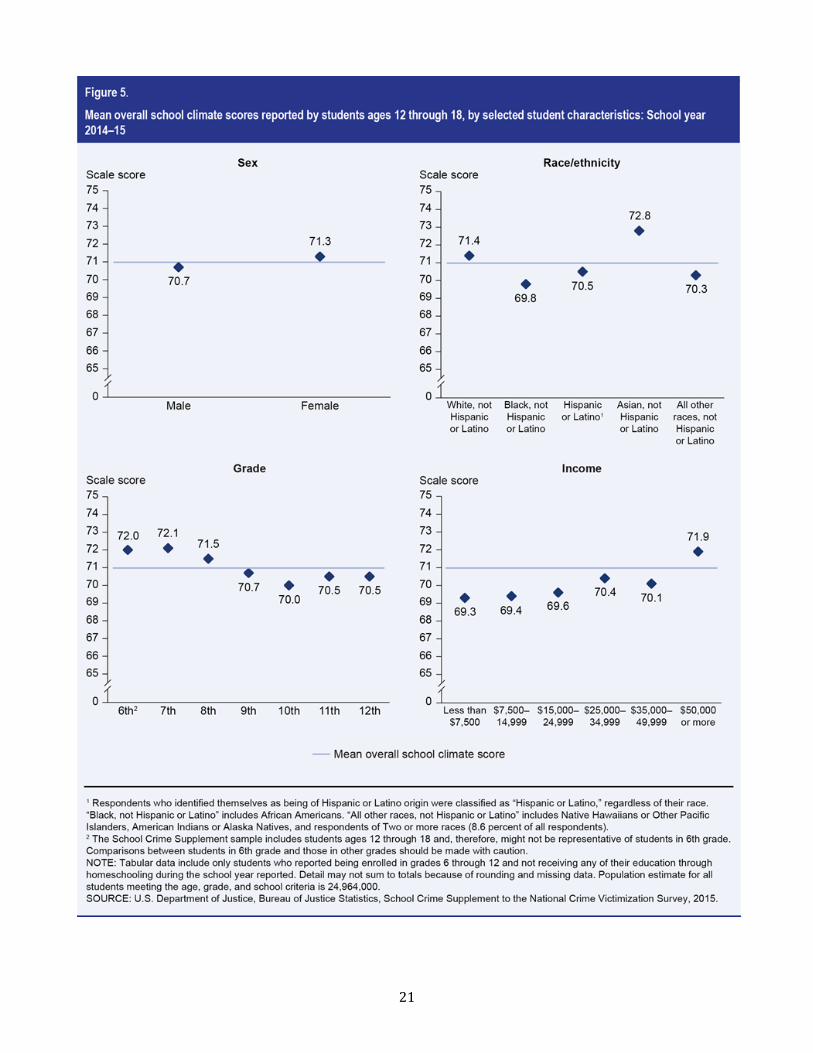
5. Mean overall school climate scores reported by students ages 12 through 18, by selected student characteristics: School year 2014–15 ............................................................................................................. 16
6. Mean and range of school climate domain scores reported by students ages 12 through 18, by reports of being bullied at school: School year 2014–15 ............................................................................... 19
7. Mean and range of overall school climate scale scores reported by students ages 12 through 18, by reports of being bullied at school: School year 2014–15 .......................................................................... 20
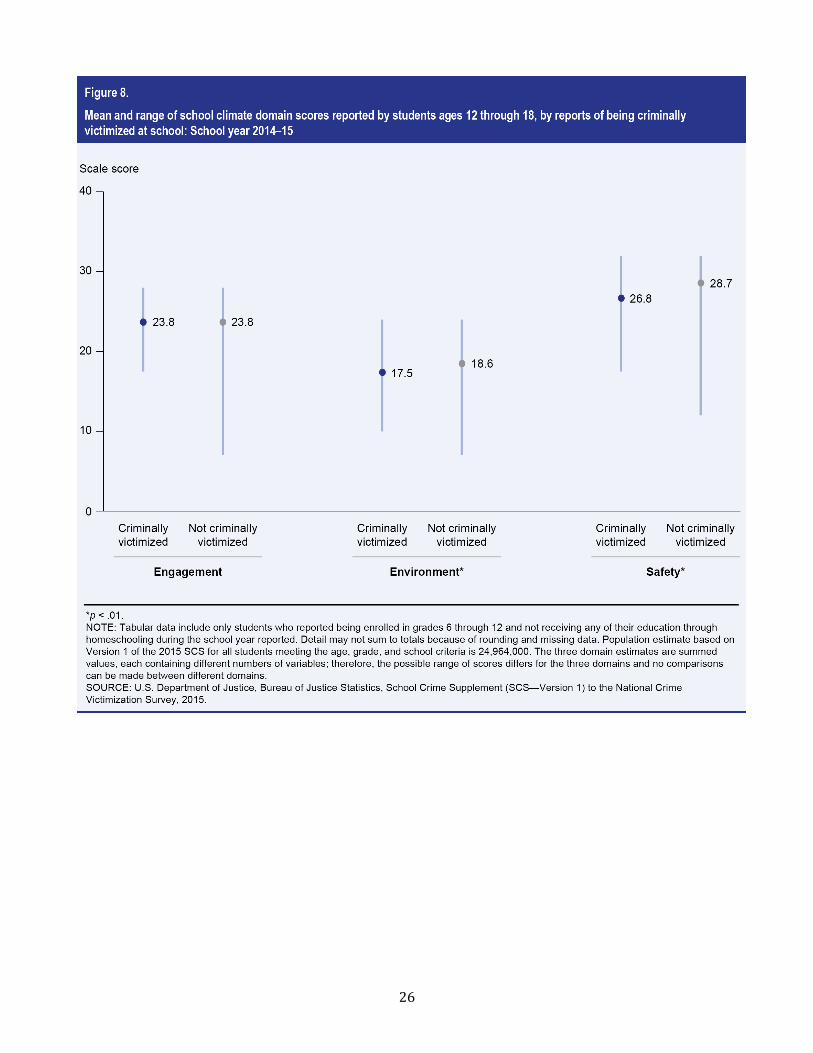
8. Mean and range of school climate domain scores reported by students ages 12 through 18, by reports of being criminally victimized at school: School year 2014–15 ......................................................... 21
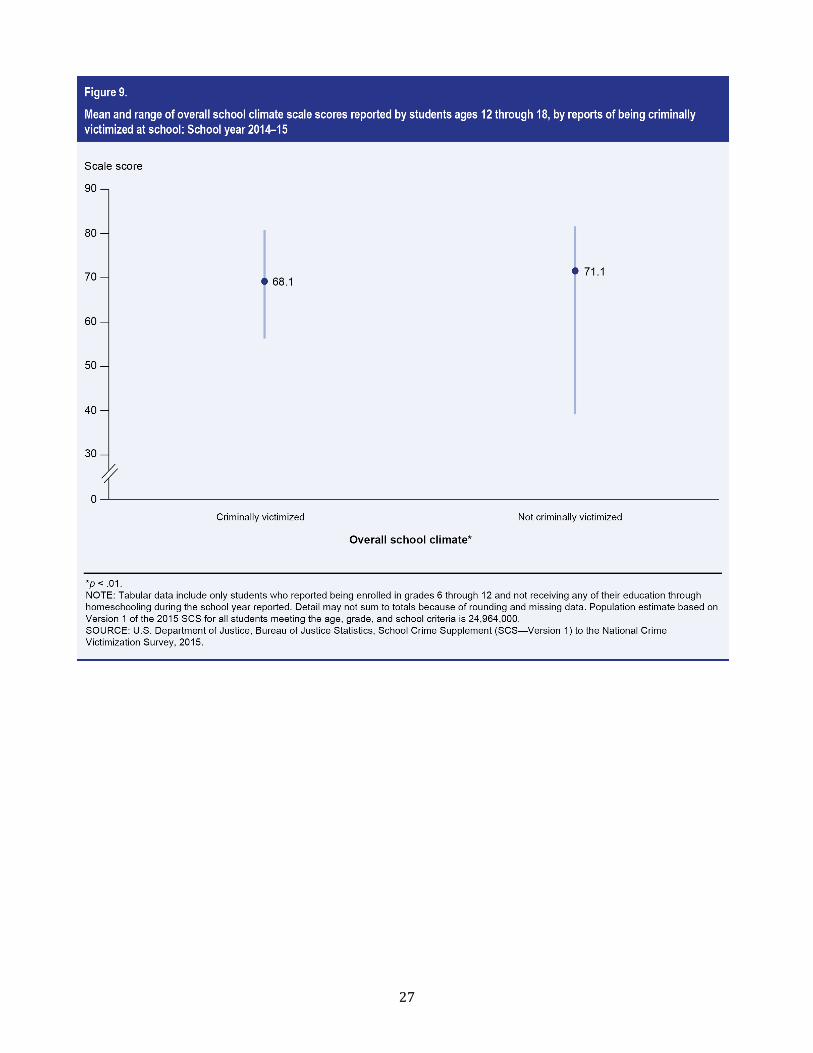
9. Mean and range of overall school climate scale scores reported by students ages 12 through 18, by reports of being criminally victimized at school: School year 2014–15 .................................................... 22
List of Exhibits Exhibit Page
1. Variables from the 2015 School Crime Supplement included in the report ..................................................... 34
1
Introduction The concept of school climate appears in the education literature as early as 1908, and theories about its relationship to academic and social outcomes for students have been tested since the 1970s (Thapa et al. 2013). Areas that have recently been studied within the larger construct of school climate include supportive relationships and behavioral norms in school (Hopson, Schiller, and Lawson 2014); school connectedness (LaSalle et al. 2016); school leadership, accountability, safety, and respect (McCormick et al. 2015); and security, discipline, disorder, student–teacher relationships, and procedural justice (Peguero and Bracy 2014). These areas identified within the larger construct of school climate are often referred to as “domains.”
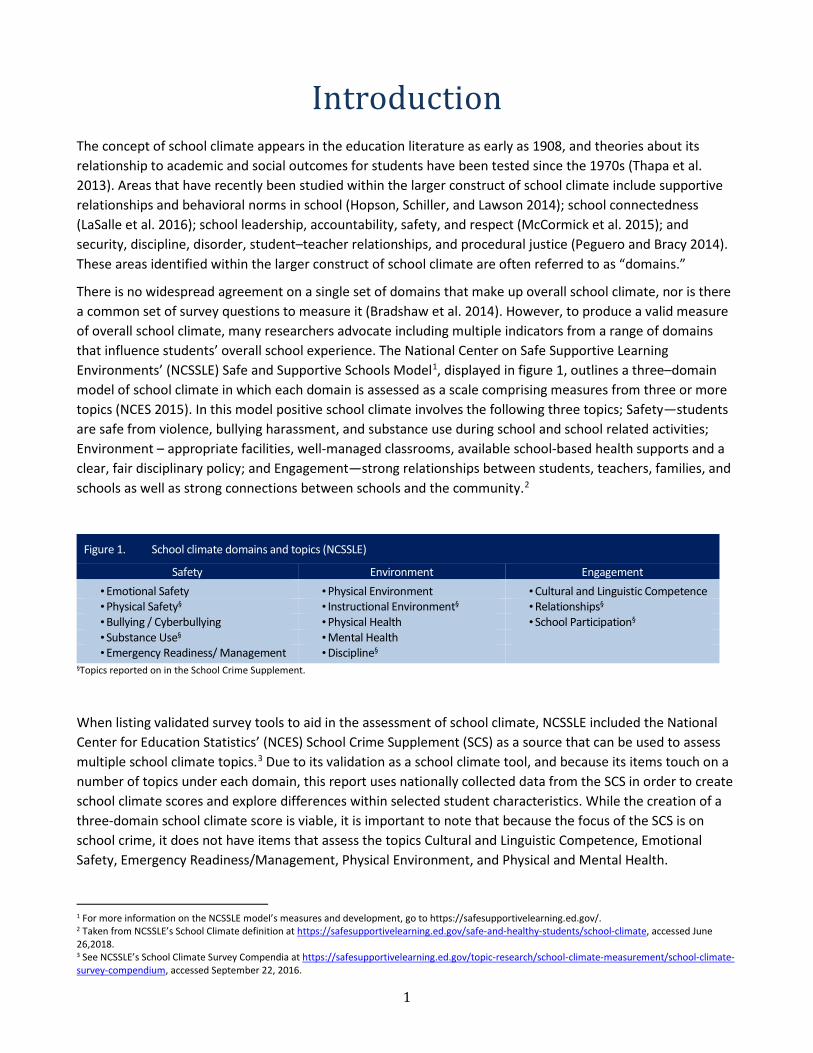
There is no widespread agreement on a single set of domains that make up overall school climate, nor is there a common set of survey questions to measure it (Bradshaw et al. 2014). However, to produce a valid measure of overall school climate, many researchers advocate including multiple indicators from a range of domains that influence students’ overall school experience. The National Center on Safe Supportive Learning Environments’ (NCSSLE) Safe and Supportive Schools Model1, displayed in figure 1, outlines a three–domain model of school climate in which each domain is assessed as a scale comprising measures from three or more topics (NCES 2015). In this model positive school climate involves the following three topics; Safety—students are safe from violence, bullying harassment, and substance use during school and school related activities; Environment – appropriate facilities, well-managed classrooms, available school-based health supports and a clear, fair disciplinary policy; and Engagement—strong relationships between students, teachers, families, and schools as well as strong connections between schools and the community.2
Figure 1. School climate domains and topics (NCSSLE)
Safety Environment Engagement • Emotional Safety • Physical Environment • Cultural and Linguistic Competence • Physical Safety§ • Instructional Environment§ • Relationships§ • Bullying / Cyberbullying • Physical Health • School Participation§ • Substance Use§ • Mental Health • Emergency Readiness/ Management • Discipline§
§Topics reported on in the School Crime Supplement.
When listing validated survey tools to aid in the assessment of school climate, NCSSLE included the National Center for Education Statistics’ (NCES) School Crime Supplement (SCS) as a source that can be used to assess multiple school climate topics.3 Due to its validation as a school climate tool, and because its items touch on a number of topics under each domain, this report uses nationally collected data from the SCS in order to create school climate scores and explore differences within selected student characteristics. While the creation of a three-domain school climate score is viable, it is important to note that because the focus of the SCS is on school crime, it does not have items that assess the topics Cultural and Linguistic Competence, Emotional Safety, Emergency Readiness/Management, Physical Environment, and Physical and Mental Health.
1 For more information on the NCSSLE model’s measures and development, go to https://safesupportivelearning.ed.gov/. 2 Taken from NCSSLE’s School Climate definition at https://safesupportivelearning.ed.gov/safe-and-healthy-students/school-climate, accessed June 26,2018. 3 See NCSSLE’s School Climate Survey Compendia at https://safesupportivelearning.ed.gov/topic-research/school-climate-measurement/school-climate-survey-compendium, accessed September 22, 2016.
2
Additionally, items from the SCS on bullying and cyberbullying were not included in the creation of the school climate scores since they measure individual student victimization rather than overall school safety. While NCSSLE collects school climate data on how bullying and cyberbullying are viewed by teachers, students, and the school as a whole, the SCS collects information only about students’ personal experiences of being bullied or victimized. Because of this, SCS bullying and NCVS victimization items were used to examine if school climate scores developed from the SCS vary in expected ways with the experience of bullying or other criminal victimization reported by students as predicted by previous research.
Students Included in the Analysis
The SCS has been administered 11 times since 1989 to youth ages 12 through 18 attending grades 6 through 12.4 All the data presented in this report come from respondents who completed the 2015 SCS survey between January and June of 2015. Therefore, the report data file represents a weighted population of 24,964,000 students ages 12 through 18 who attended 6th through 12th grades in public and private schools in the United States during the 2014–15 school year. Students in ungraded classrooms and those who were partially homeschooled, although included in survey administration, were excluded from the analyses in this report, as they are excluded from published estimates of reported bullying victimization and criminal victimization in schools that are generated from the SCS data.5
The 2015 administration of the SCS included an embedded split-half experiment to test a new version of the question series on bullying.6 For the analysis of reported bullying, only responses from Version 1 of the 2015 SCS survey are included in this report. Version 1 maintains compatibility with previous administrations of the SCS regarding estimated bullying victimization. When using only Version 1, population weights were doubled to approximate the same overall population. The total weighted population for Version 1 only is 24,622,000. All comparisons of estimates were tested for statistical significance using the Student’s t statistic, which tests the difference between two sample estimates. All differences cited are statistically significant at the p < .05 level. Apparently large differences between estimates may not be significant due to large standard errors.
4 For a full description of the SCS and links to reports and downloadable data files from each administration, go to https://nces.ed.gov/programs/crime/surveys.asp. 5 See the NCES publications Web Tables–Student Reports of Bullying: Results From the 2015 School Crime Supplement to the National Crime Victimization Survey (NCES 2017-015) and Statistics in Brief–Student Victimization in U.S. Schools: Results From the 2015 School Crime Supplement to the National Crime Victimization Survey (NCES 2017-106), which can be found at http://nces.ed.gov/pubsearch. 6 For a complete discussion of the split-half methodology and results, see Lessne, D., and Cidade, M. (2017). Methodology Report: Split-Half Administration of the 2015 School Crime Supplement to the National Crime Victimization Survey (NCES 2017-004). U.S. Department of Education. Washington, DC: National Center for Education Statistics.
3
Development of a School Climate Scale Score From NCVS/SCS Items
Item analysis was performed using polyserial correlations, along with exploratory factor analysis, to determine how to best map the SCS items to underlying climate factors, substantiate the mapping of the factors to established school climate domains, and create scale scores for each domain. The mapping occurred in several steps. First, after performing some data recoding, we conducted a polyserial correlation analysis and a factor analysis of the SCS items to determine how many underlying themes or factors were encompassed by the SCS items. The analysis identified four factors that were covered by the SCS items. It also was found that three SCS items should be removed from the analysis, as they did not fit well within any of the four identified factor structures. Next, the four factors were collapsed into three factors that, analytically and sensibly, appeared to be directly associated with the three school climate domains of interest. For the last step, the final set of variables was evaluated for scale reliability in each domain using Cronbach’s alpha. The variables mapped to each domain were summed to create scale scores for each domain and a single score for overall school climate.
As in most surveys, some individuals did not respond to every item. However, individual item response rates for the 2015 SCS were high. For most items, the response rate was 95 percent or higher. There was only one item used in the initial factor analysis that had a response rate below 85 percent. VS0131 (“Have you actually seen another student with a gun at school during this school year?”) had a response rate of 72.2 percent. The mean weighted item response rates for all respondents on all items retained in the final analysis of school climate factors exceeded 85 percent.
Because the SCS is based on student self-reported information, all measures developed from the SCS are subjective. Additionally, readers should be aware of the limitations of the survey design and the analytical approach used with regard to causality. Conclusions about causality between school or student characteristics and school climate cannot be made due to the cross-sectional, nonexperimental design of the SCS.
Item Mapping and Scoring
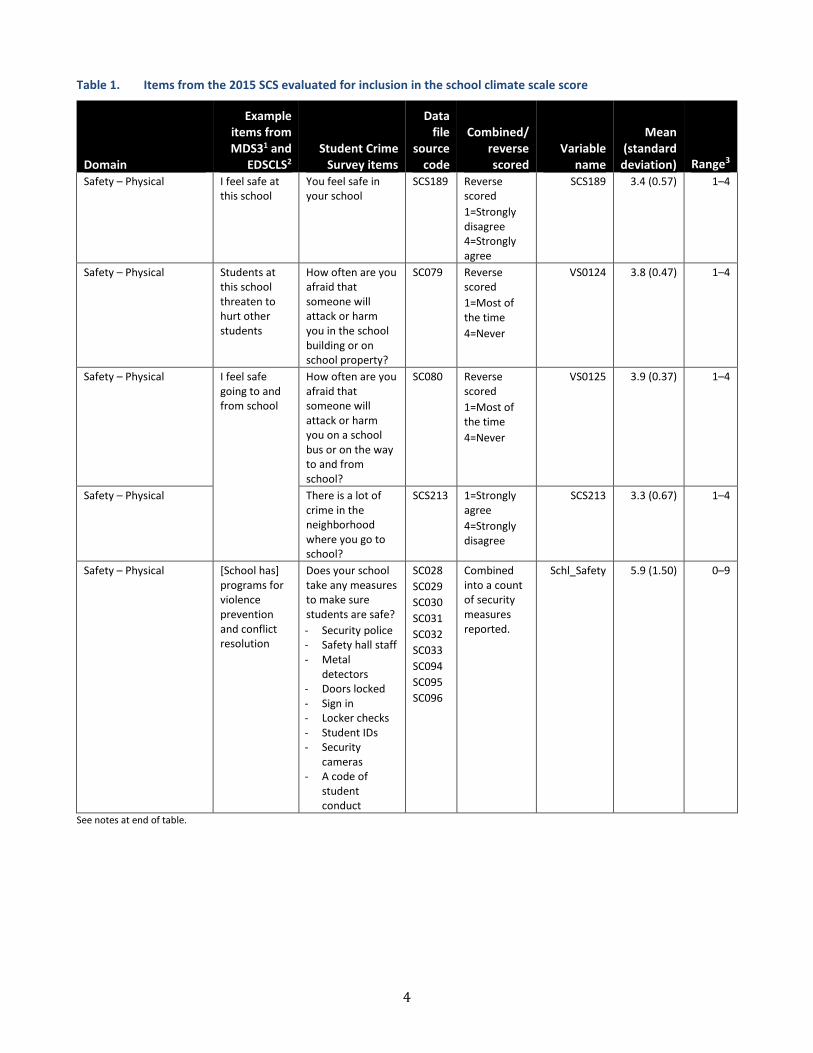
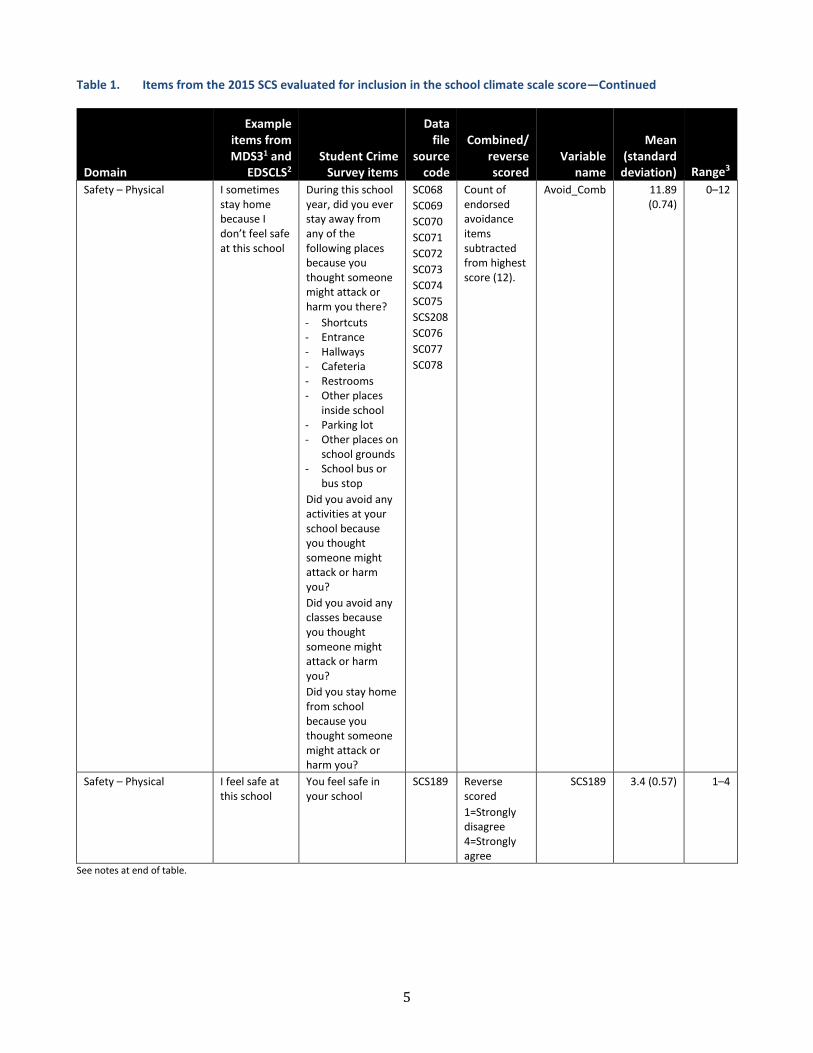
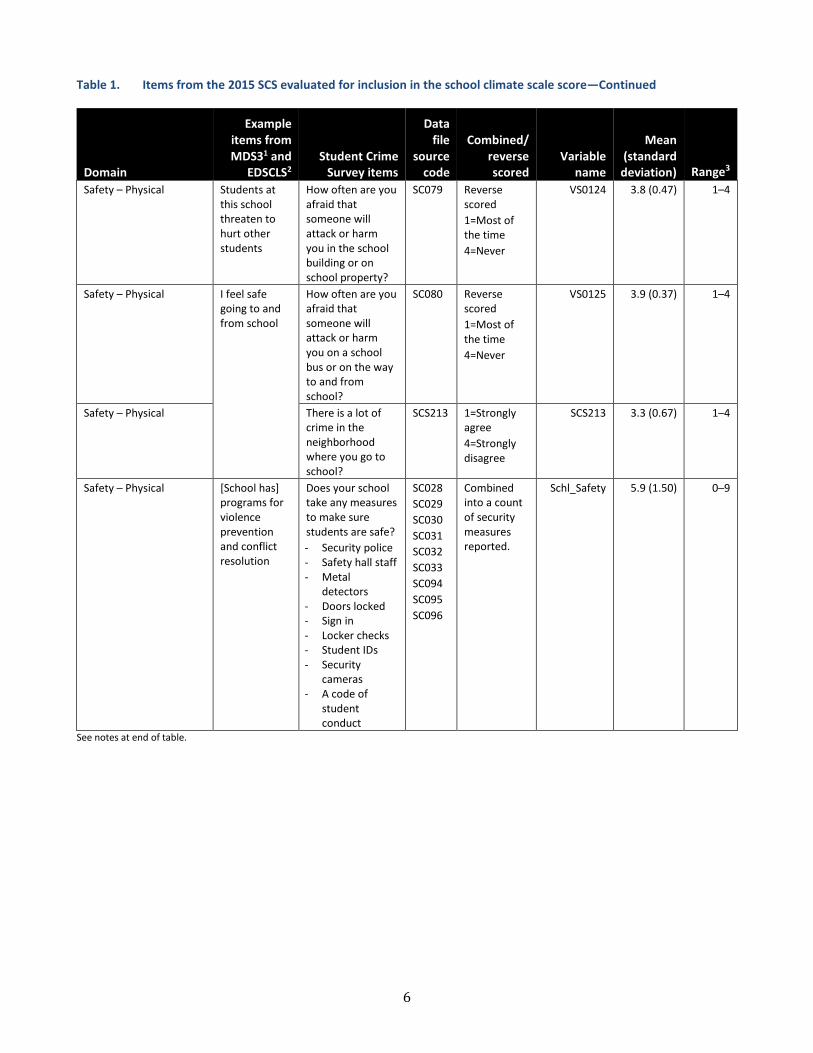
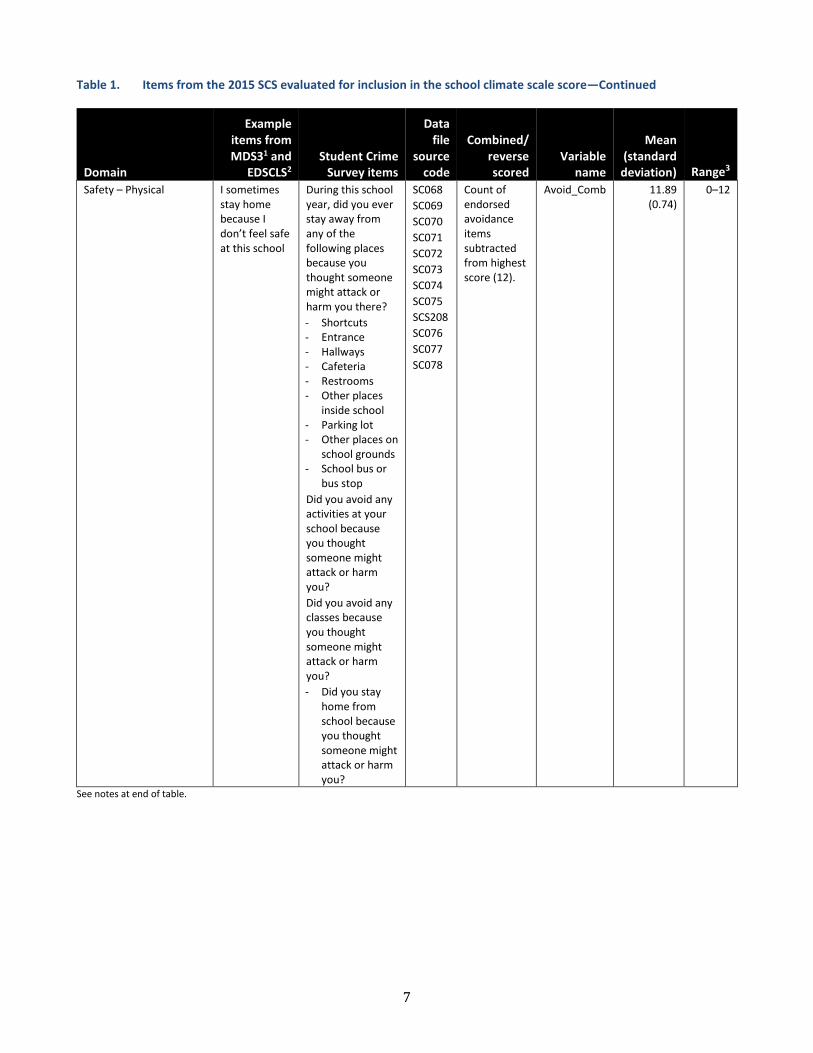
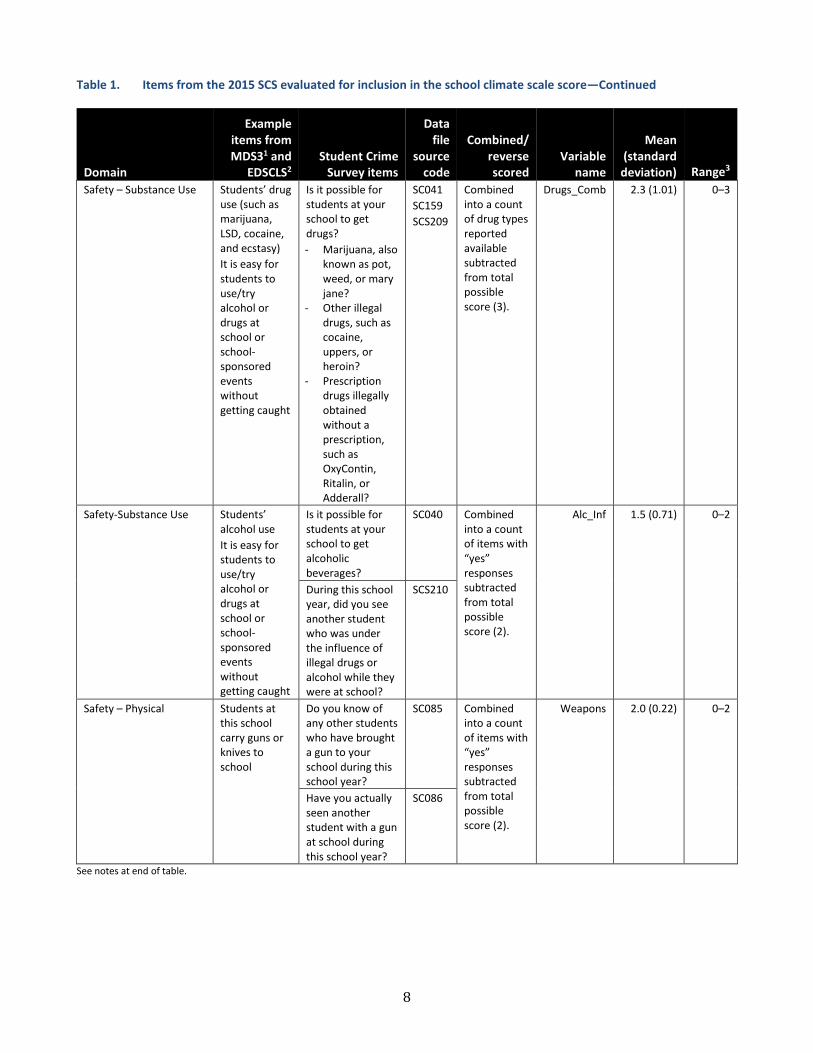
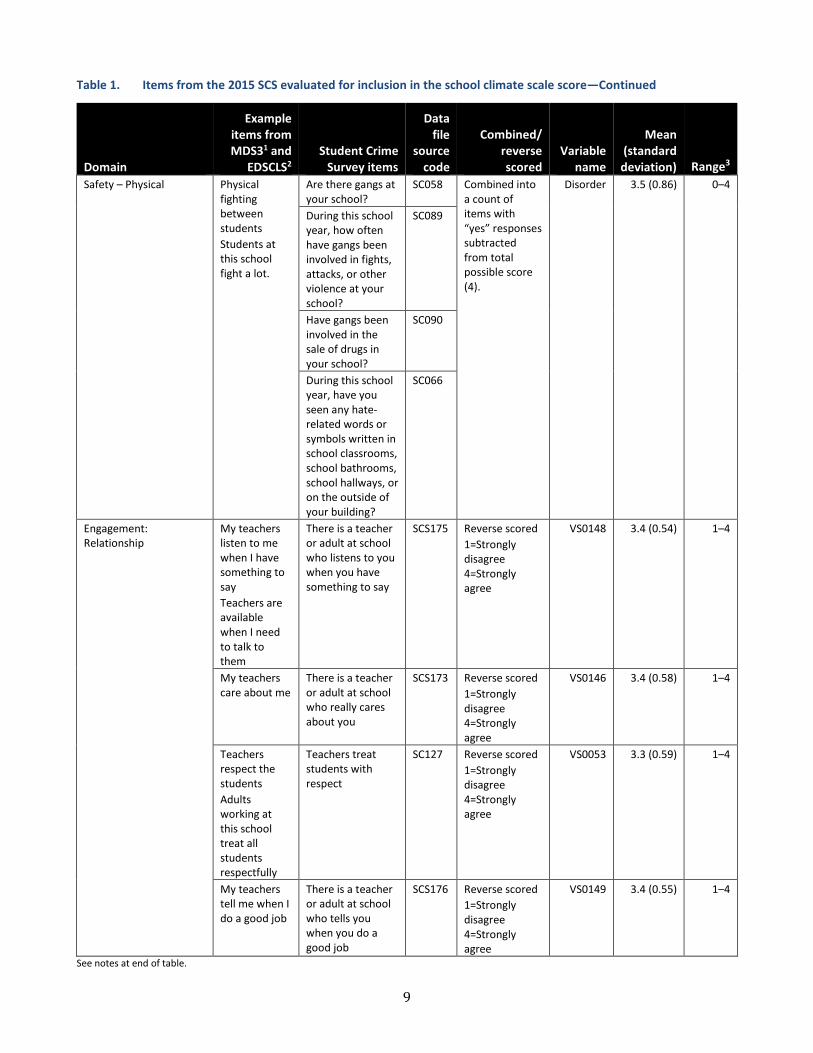
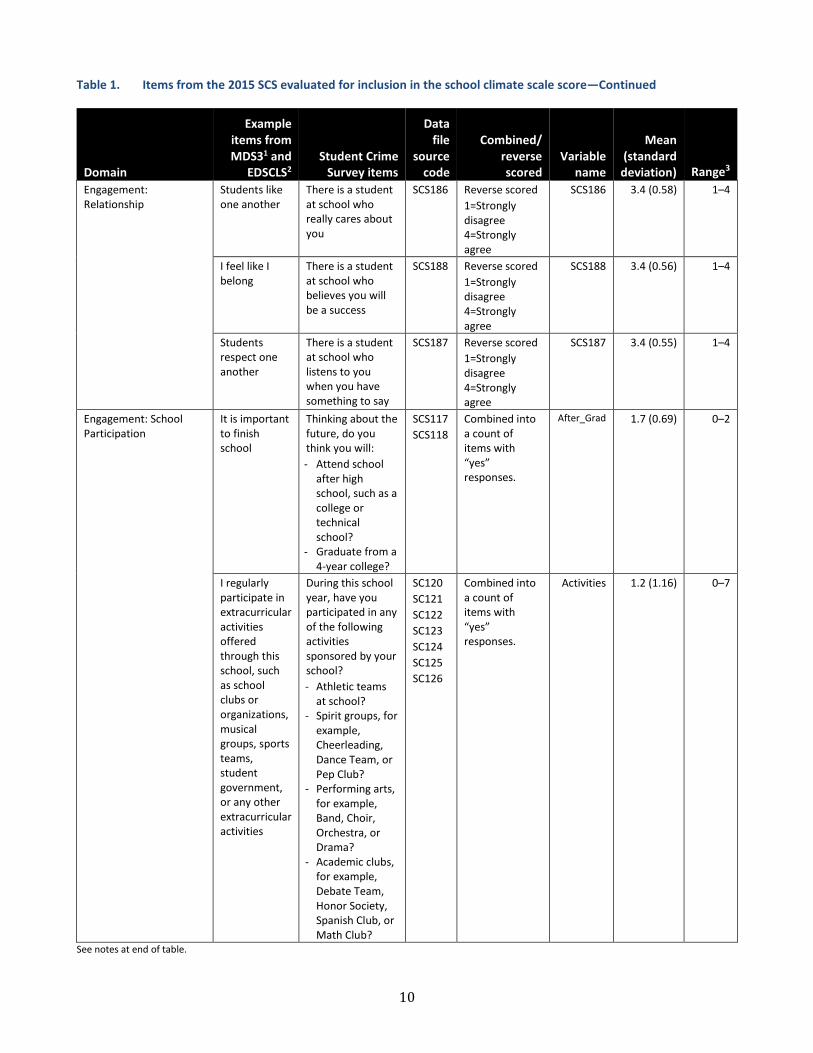
Fifty-seven items from the SCS were selected as indicators of student perceptions and reported experiences with school climate. This process was guided by a visual comparison of items used in the Maryland Safe and Supportive Schools (MDS3) Initiative (Bradshaw et al. 2014), and the student survey module from the ED School Climate Surveys (EDSCLS) (NCES 2015).7 Certain constructs assessed by using multiple items in the SCS have, on other surveys, been assessed using single items; therefore some items in the SCS were combined prior to analysis to facilitate factor analysis8 and maintain comparability with previous empirical work. For example, “drug availability” was assessed in the SCS using three separate questions on marijuana, illegal drug, and prescription drug availability. Also, some items needed to be reverse-scored to ensure that on all items, higher scores corresponded to more positive perceptions of school climate (see table 1). This resulted in 24 individual and combined SCS variables included for further analysis.
7 This resource is available from the NCSSLE at https://safesupportivelearning.ed.gov/. 8 The purpose of combining the individual items and turning the dichotomous variables into count variables is to facilitate the factor analysis. The number of response options may affect the factorial validity. Greater categorization of binary items implies a greater loss of information, and, in turn, a greater attenuation of the relationships between items for both CFA and EFA.
4
Table 1. Items from the 2015 SCS evaluated for inclusion in the school climate scale score
Domain
Example items from MDS31 and
EDSCLS2 Student Crime Survey items
Data file
source code
Combined/ reverse scored
Variable name
Mean (standard deviation) Range3
Safety – Physical
I feel safe at this school
You feel safe in your school
SCS189 Reverse scored 1=Strongly disagree 4=Strongly agree
SCS189 3.4 (0.57) 1–4
Safety – Physical
Students at this school threaten to hurt other students
How often are you afraid that someone will attack or harm you in the school building or on school property?
SC079 Reverse scored 1=Most of the time 4=Never
VS0124 3.8 (0.47) 1–4
Safety – Physical
I feel safe going to and from school
How often are you afraid that someone will attack or harm you on a school bus or on the way to and from school?
SC080 Reverse scored 1=Most of the time 4=Never
VS0125 3.9 (0.37) 1–4
Safety – Physical
There is a lot of crime in the neighborhood where you go to school?
SCS213 1=Strongly agree 4=Strongly disagree
SCS213 3.3 (0.67) 1–4
Safety – Physical
[School has] programs for violence prevention and conflict resolution
Does your school take any measures to make sure students are safe? - Security police - Safety hall staff - Metal
detectors - Doors locked - Sign in - Locker checks - Student IDs - Security
cameras - A code of
student conduct
SC028 SC029 SC030 SC031 SC032 SC033 SC094 SC095 SC096
Combined into a count of security measures reported.
Schl_Safety 5.9 (1.50) 0–9
See notes at end of table.
5
Table 1. Items from the 2015 SCS evaluated for inclusion in the school climate scale score—Continued
Domain
Example items from MDS31 and
EDSCLS2 Student Crime Survey items
Data file
source code
Combined/ reverse scored
Variable name
Mean (standard deviation) Range3
Safety – Physical
I sometimes stay home because I don’t feel safe at this school
During this school year, did you ever stay away from any of the following places because you thought someone might attack or harm you there? - Shortcuts - Entrance - Hallways - Cafeteria - Restrooms - Other places
inside school - Parking lot - Other places on
school grounds - School bus or
bus stop Did you avoid any activities at your school because you thought someone might attack or harm you? Did you avoid any classes because you thought someone might attack or harm you? Did you stay home from school because you thought someone might attack or harm you?
SC068 SC069 SC070 SC071 SC072 SC073 SC074 SC075 SCS208 SC076 SC077 SC078
Count of endorsed avoidance items subtracted from highest score (12).
Avoid_Comb 11.89 (0.74)
0–12
Safety – Physical
I feel safe at this school
You feel safe in your school
SCS189 Reverse scored 1=Strongly disagree 4=Strongly agree
SCS189 3.4 (0.57) 1–4
See notes at end of table.
6
Table 1. Items from the 2015 SCS evaluated for inclusion in the school climate scale score—Continued
Domain
Example items from MDS31 and
EDSCLS2 Student Crime Survey items
Data file
source code
Combined/ reverse scored
Variable name
Mean (standard deviation) Range3
Safety – Physical
Students at this school threaten to hurt other students
How often are you afraid that someone will attack or harm you in the school building or on school property?
SC079 Reverse scored 1=Most of the time 4=Never
VS0124 3.8 (0.47) 1–4
Safety – Physical
I feel safe going to and from school
How often are you afraid that someone will attack or harm you on a school bus or on the way to and from school?
SC080 Reverse scored 1=Most of the time 4=Never
VS0125 3.9 (0.37) 1–4
Safety – Physical
There is a lot of crime in the neighborhood where you go to school?
SCS213 1=Strongly agree 4=Strongly disagree
SCS213 3.3 (0.67) 1–4
Safety – Physical
[School has] programs for violence prevention and conflict resolution
Does your school take any measures to make sure students are safe? - Security police - Safety hall staff - Metal
detectors - Doors locked - Sign in - Locker checks - Student IDs - Security
cameras - A code of
student conduct
SC028 SC029 SC030 SC031 SC032 SC033 SC094 SC095 SC096
Combined into a count of security measures reported.
Schl_Safety 5.9 (1.50) 0–9
See notes at end of table.
7
Table 1. Items from the 2015 SCS evaluated for inclusion in the school climate scale score—Continued
Domain
Example items from MDS31 and
EDSCLS2 Student Crime Survey items
Data file
source code
Combined/ reverse scored
Variable name
Mean (standard deviation) Range3
Safety – Physical
I sometimes stay home because I don’t feel safe at this school
During this school year, did you ever stay away from any of the following places because you thought someone might attack or harm you there? - Shortcuts - Entrance - Hallways - Cafeteria - Restrooms - Other places
inside school - Parking lot - Other places on
school grounds - School bus or
bus stop Did you avoid any activities at your school because you thought someone might attack or harm you? Did you avoid any classes because you thought someone might attack or harm you? - Did you stay
home from school because you thought someone might attack or harm you?
SC068 SC069 SC070 SC071 SC072 SC073 SC074 SC075 SCS208 SC076 SC077 SC078
Count of endorsed avoidance items subtracted from highest score (12).
Avoid_Comb 11.89 (0.74)
0–12
See notes at end of table.
8
Table 1. Items from the 2015 SCS evaluated for inclusion in the school climate scale score—Continued
Domain
Example items from MDS31 and
EDSCLS2 Student Crime Survey items
Data file
source code
Combined/ reverse scored
Variable name
Mean (standard deviation) Range3
Safety – Substance Use Students’ drug use (such as marijuana, LSD, cocaine, and ecstasy) It is easy for students to use/try alcohol or drugs at school or school-sponsored events without getting caught
Is it possible for students at your school to get drugs? - Marijuana, also
known as pot, weed, or mary jane?
- Other illegal drugs, such as cocaine, uppers, or heroin?
- Prescription drugs illegally obtained without a prescription, such as OxyContin, Ritalin, or Adderall?
SC041 SC159 SCS209
Combined into a count of drug types reported available subtracted from total possible score (3).
Drugs_Comb 2.3 (1.01) 0–3
Safety-Substance Use Students’ alcohol use It is easy for students to use/try alcohol or drugs at school or school-sponsored events without getting caught
Is it possible for students at your school to get alcoholic beverages?
SC040 Combined into a count of items with “yes” responses subtracted from total possible score (2).
Alc_Inf 1.5 (0.71) 0–2
During this school year, did you see another student who was under the influence of illegal drugs or alcohol while they were at school?
SCS210
Safety – Physical
Students at this school carry guns or knives to school
Do you know of any other students who have brought a gun to your school during this school year?
SC085 Combined into a count of items with “yes” responses subtracted from total possible score (2).
Weapons 2.0 (0.22) 0–2
Have you actually seen another student with a gun at school during this school year?
SC086
See notes at end of table.
9
Table 1. Items from the 2015 SCS evaluated for inclusion in the school climate scale score—Continued
Domain
Example items from MDS31 and
EDSCLS2 Student Crime Survey items
Data file
source code
Combined/ reverse scored
Variable name
Mean (standard deviation) Range3
Safety – Physical
Physical fighting between students Students at this school fight a lot.
Are there gangs at your school?
SC058 Combined into a count of items with “yes” responses subtracted from total possible score (4).
Disorder 3.5 (0.86) 0–4
During this school year, how often have gangs been involved in fights, attacks, or other violence at your school?
SC089
Have gangs been involved in the sale of drugs in your school?
SC090
During this school year, have you seen any hate-related words or symbols written in school classrooms, school bathrooms, school hallways, or on the outside of your building?
SC066
Engagement: Relationship
My teachers listen to me when I have something to say Teachers are available when I need to talk to them
There is a teacher or adult at school who listens to you when you have something to say
SCS175 Reverse scored 1=Strongly disagree 4=Strongly agree
VS0148 3.4 (0.54) 1–4
My teachers care about me
There is a teacher or adult at school who really cares about you
SCS173 Reverse scored 1=Strongly disagree 4=Strongly agree
VS0146 3.4 (0.58) 1–4
Teachers respect the students Adults working at this school treat all students respectfully
Teachers treat students with respect
SC127 Reverse scored 1=Strongly disagree 4=Strongly agree
VS0053 3.3 (0.59) 1–4
My teachers tell me when I do a good job
There is a teacher or adult at school who tells you when you do a good job
SCS176 Reverse scored 1=Strongly disagree 4=Strongly agree
VS0149 3.4 (0.55) 1–4
See notes at end of table.
10
Table 1. Items from the 2015 SCS evaluated for inclusion in the school climate scale score—Continued
Domain
Example items from MDS31 and
EDSCLS2 Student Crime Survey items
Data file
source code
Combined/ reverse scored
Variable name
Mean (standard deviation) Range3
Engagement: Relationship
Students like one another
There is a student at school who really cares about you
SCS186 Reverse scored 1=Strongly disagree 4=Strongly agree
SCS186 3.4 (0.58) 1–4
I feel like I belong
There is a student at school who believes you will be a success
SCS188 Reverse scored 1=Strongly disagree 4=Strongly agree
SCS188 3.4 (0.56) 1–4
Students respect one another
There is a student at school who listens to you when you have something to say
SCS187 Reverse scored 1=Strongly disagree 4=Strongly agree
SCS187 3.4 (0.55) 1–4
Engagement: School Participation
It is important to finish school
Thinking about the future, do you think you will: - Attend school
after high school, such as a college or technical school?
- Graduate from a 4-year college?
SCS117 SCS118
Combined into a count of items with “yes” responses.
After_Grad 1.7 (0.69) 0–2
I regularly participate in extracurricular activities offered through this school, such as school clubs or organizations, musical groups, sports teams, student government, or any other extracurricular activities
During this school year, have you participated in any of the following activities sponsored by your school? - Athletic teams
at school? - Spirit groups, for
example, Cheerleading, Dance Team, or Pep Club?
- Performing arts, for example, Band, Choir, Orchestra, or Drama?
- Academic clubs, for example, Debate Team, Honor Society, Spanish Club, or Math Club?
SC120 SC121 SC122 SC123 SC124 SC125 SC126
Combined into a count of items with “yes” responses.
Activities 1.2 (1.16) 0–7
See notes at end of table.
11
Table 1. Items from the 2015 SCS evaluated for inclusion in the school climate scale score—Continued
Domain
Example items from MDS31 and
EDSCLS2 Student Crime Survey items
Data file
source code
Combined/ reverse scored
Variable name
Mean (standard deviation) Range3
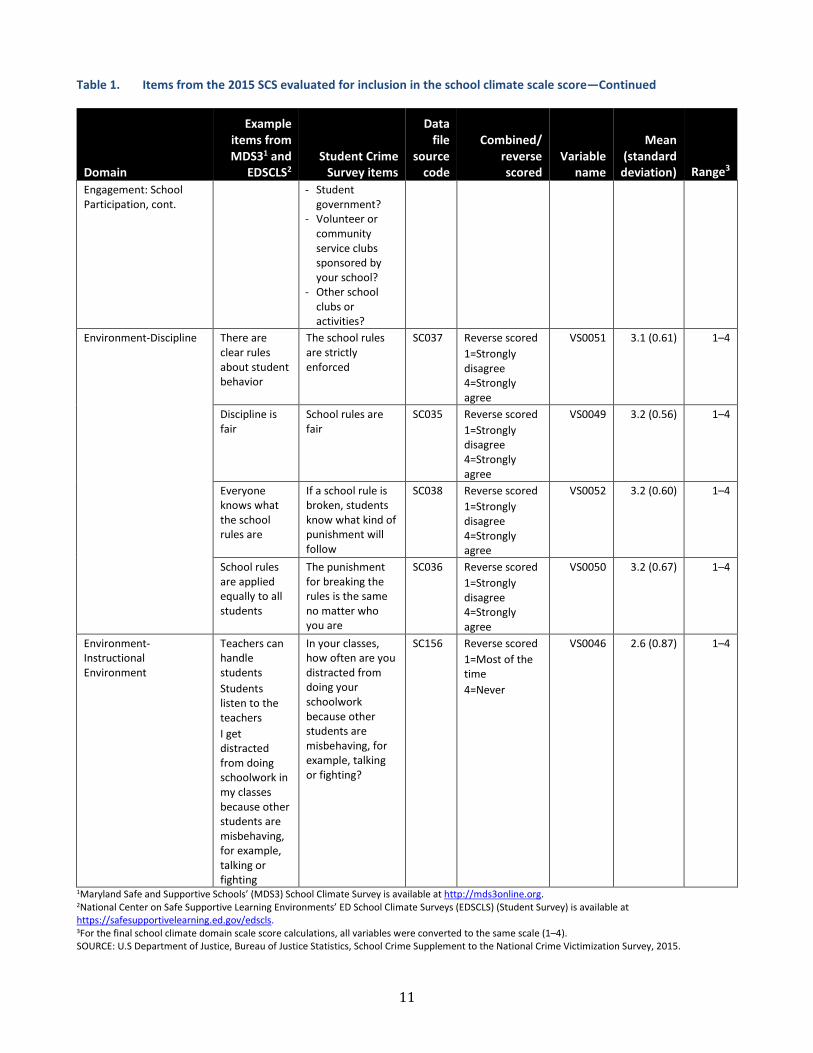
Engagement: School Participation, cont.
- Student government?
- Volunteer or community service clubs sponsored by your school?
- Other school clubs or activities?
Environment-Discipline
There are clear rules about student behavior
The school rules are strictly enforced
SC037 Reverse scored 1=Strongly disagree 4=Strongly agree
VS0051 3.1 (0.61) 1–4
Discipline is fair
School rules are fair
SC035 Reverse scored 1=Strongly disagree 4=Strongly agree
VS0049 3.2 (0.56) 1–4
Everyone knows what the school rules are
If a school rule is broken, students know what kind of punishment will follow
SC038 Reverse scored 1=Strongly disagree 4=Strongly agree
VS0052 3.2 (0.60) 1–4
School rules are applied equally to all students
The punishment for breaking the rules is the same no matter who you are
SC036 Reverse scored 1=Strongly disagree 4=Strongly agree
VS0050 3.2 (0.67) 1–4
Environment-Instructional Environment
Teachers can handle students Students listen to the teachers I get distracted from doing schoolwork in my classes because other students are misbehaving, for example, talking or fighting
In your classes, how often are you distracted from doing your schoolwork because other students are misbehaving, for example, talking or fighting?
SC156 Reverse scored 1=Most of the time 4=Never
VS0046 2.6 (0.87) 1–4
1Maryland Safe and Supportive Schools’ (MDS3) School Climate Survey is available at http://mds3online.org. 2National Center on Safe Supportive Learning Environments’ ED School Climate Surveys (EDSCLS) (Student Survey) is available at https://safesupportivelearning.ed.gov/edscls. 3For the final school climate domain scale score calculations, all variables were converted to the same scale (1–4). SOURCE: U.S Department of Justice, Bureau of Justice Statistics, School Crime Supplement to the National Crime Victimization Survey, 2015.
12
Because not all item responses were on the same response scale, all variables were converted to a common scale (minimum value of 1; maximum value of 4) prior to additional analysis.9 While having items on different scales does not significantly impact factor analysis based on values derived from a correlation matrix (see next section), the ultimate goal of the factor analysis is to define a set of items whose values can be summed to create school climate scale scores. Having all items on the same scale assigns equal weight to each component of the scale score.
Factor Analysis of Domains
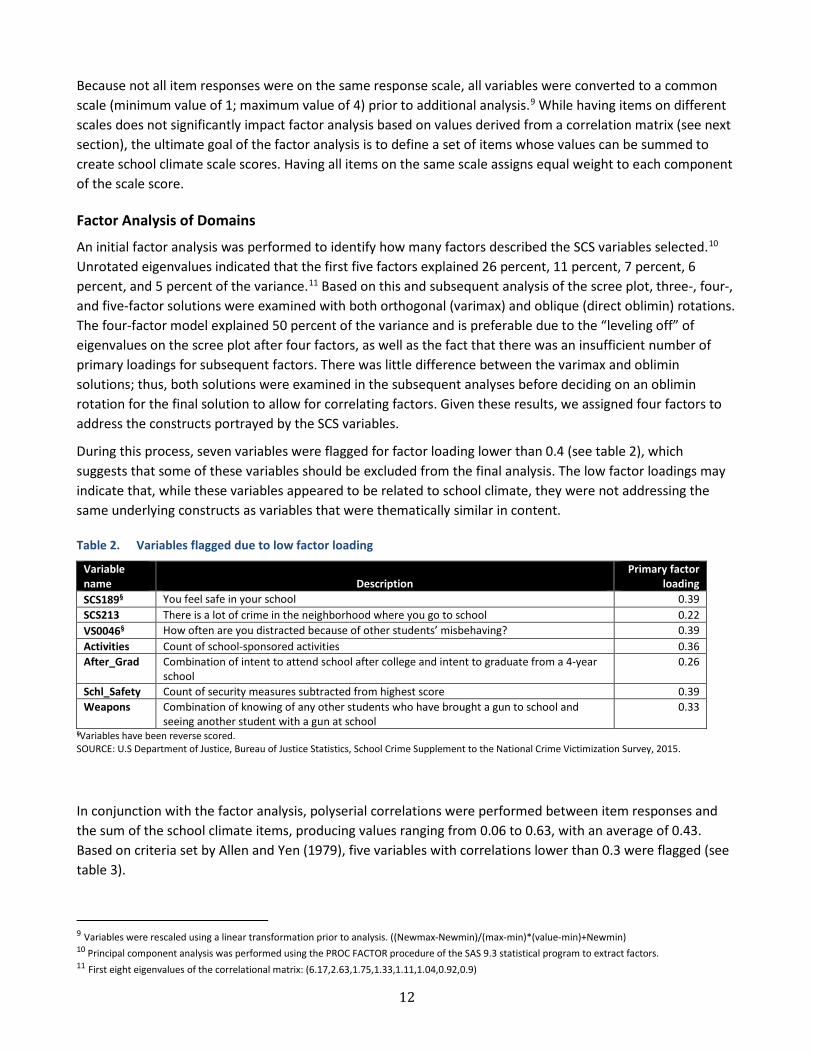
An initial factor analysis was performed to identify how many factors described the SCS variables selected.10 Unrotated eigenvalues indicated that the first five factors explained 26 percent, 11 percent, 7 percent, 6 percent, and 5 percent of the variance.11 Based on this and subsequent analysis of the scree plot, three-, four-, and five-factor solutions were examined with both orthogonal (varimax) and oblique (direct oblimin) rotations. The four-factor model explained 50 percent of the variance and is preferable due to the “leveling off” of eigenvalues on the scree plot after four factors, as well as the fact that there was an insufficient number of primary loadings for subsequent factors. There was little difference between the varimax and oblimin solutions; thus, both solutions were examined in the subsequent analyses before deciding on an oblimin rotation for the final solution to allow for correlating factors. Given these results, we assigned four factors to address the constructs portrayed by the SCS variables.
During this process, seven variables were flagged for factor loading lower than 0.4 (see table 2), which suggests that some of these variables should be excluded from the final analysis. The low factor loadings may indicate that, while these variables appeared to be related to school climate, they were not addressing the same underlying constructs as variables that were thematically similar in content.
Table 2. Variables flagged due to low factor loading
Variable name Description
Primary factor loading
SCS189§ You feel safe in your school 0.39 SCS213 There is a lot of crime in the neighborhood where you go to school 0.22 VS0046§ How often are you distracted because of other students’ misbehaving? 0.39 Activities Count of school-sponsored activities 0.36 After_Grad Combination of intent to attend school after college and intent to graduate from a 4-year
school 0.26
Schl_Safety Count of security measures subtracted from highest score 0.39 Weapons Combination of knowing of any other students who have brought a gun to school and
seeing another student with a gun at school 0.33
§Variables have been reverse scored. SOURCE: U.S Department of Justice, Bureau of Justice Statistics, School Crime Supplement to the National Crime Victimization Survey, 2015.
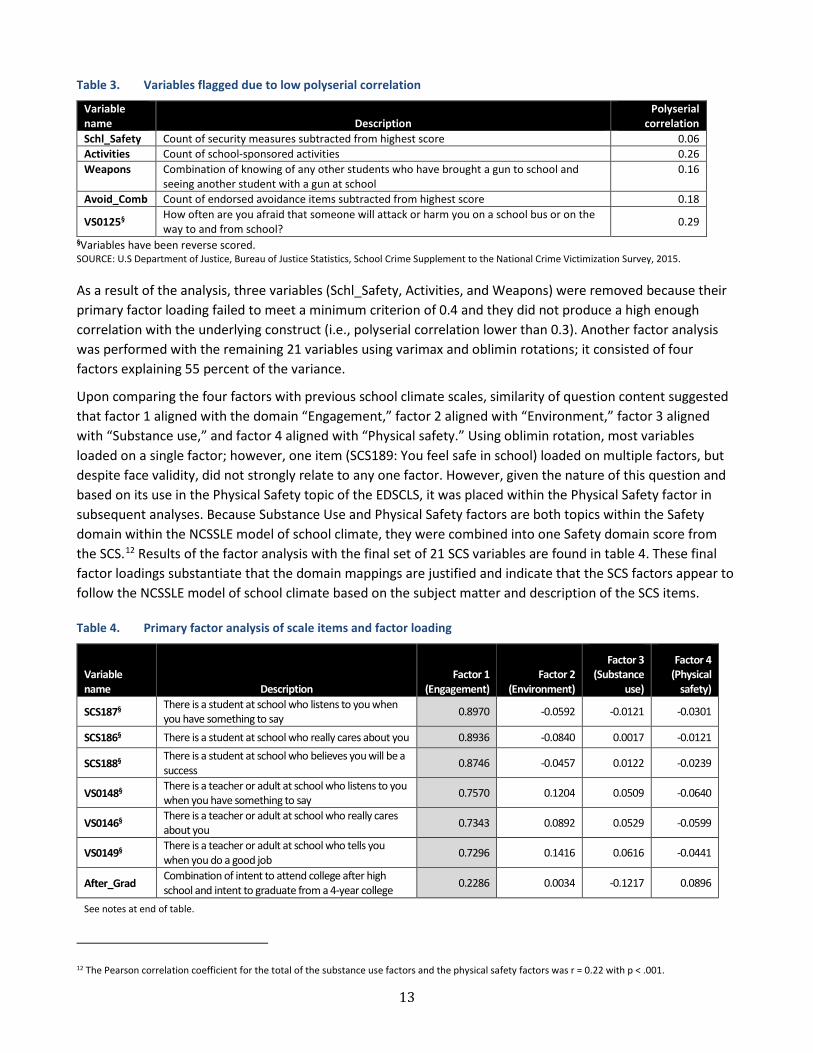
In conjunction with the factor analysis, polyserial correlations were performed between item responses and the sum of the school climate items, producing values ranging from 0.06 to 0.63, with an average of 0.43. Based on criteria set by Allen and Yen (1979), five variables with correlations lower than 0.3 were flagged (see table 3).
9 Variables were rescaled using a linear transformation prior to analysis. ((Newmax-Newmin)/(max-min)*(value-min)+Newmin) 10 Principal component analysis was performed using the PROC FACTOR procedure of the SAS 9.3 statistical program to extract factors. 11 First eight eigenvalues of the correlational matrix: (6.17,2.63,1.75,1.33,1.11,1.04,0.92,0.9)
13
Table 3. Variables flagged due to low polyserial correlation
Variable name Description
Polyserial correlation
Schl_Safety Count of security measures subtracted from highest score 0.06 Activities Count of school-sponsored activities 0.26 Weapons Combination of knowing of any other students who have brought a gun to school and
seeing another student with a gun at school 0.16
Avoid_Comb Count of endorsed avoidance items subtracted from highest score 0.18
VS0125§ How often are you afraid that someone will attack or harm you on a school bus or on the way to and from school? 0.29
§Variables have been reverse scored. SOURCE: U.S Department of Justice, Bureau of Justice Statistics, School Crime Supplement to the National Crime Victimization Survey, 2015.
As a result of the analysis, three variables (Schl_Safety, Activities, and Weapons) were removed because their primary factor loading failed to meet a minimum criterion of 0.4 and they did not produce a high enough correlation with the underlying construct (i.e., polyserial correlation lower than 0.3). Another factor analysis was performed with the remaining 21 variables using varimax and oblimin rotations; it consisted of four factors explaining 55 percent of the variance.
Upon comparing the four factors with previous school climate scales, similarity of question content suggested that factor 1 aligned with the domain “Engagement,” factor 2 aligned with “Environment,” factor 3 aligned with “Substance use,” and factor 4 aligned with “Physical safety.” Using oblimin rotation, most variables loaded on a single factor; however, one item (SCS189: You feel safe in school) loaded on multiple factors, but despite face validity, did not strongly relate to any one factor. However, given the nature of this question and based on its use in the Physical Safety topic of the EDSCLS, it was placed within the Physical Safety factor in subsequent analyses. Because Substance Use and Physical Safety factors are both topics within the Safety domain within the NCSSLE model of school climate, they were combined into one Safety domain score from the SCS.12 Results of the factor analysis with the final set of 21 SCS variables are found in table 4. These final factor loadings substantiate that the domain mappings are justified and indicate that the SCS factors appear to follow the NCSSLE model of school climate based on the subject matter and description of the SCS items.
Table 4. Primary factor analysis of scale items and factor loading
Variable name Description
Factor 1 (Engagement)
Factor 2 (Environment)
Factor 3 (Substance
use)
Factor 4 (Physical
safety)
SCS187§ There is a student at school who listens to you when you have something to say 0.8970 -0.0592 -0.0121 -0.0301
SCS186§ There is a student at school who really cares about you 0.8936 -0.0840 0.0017 -0.0121
SCS188§ There is a student at school who believes you will be a success 0.8746 -0.0457 0.0122 -0.0239
VS0148§ There is a teacher or adult at school who listens to you when you have something to say 0.7570 0.1204 0.0509 -0.0640
VS0146§ There is a teacher or adult at school who really cares about you 0.7343 0.0892 0.0529 -0.0599
VS0149§ There is a teacher or adult at school who tells you when you do a good job 0.7296 0.1416 0.0616 -0.0441
After_Grad Combination of intent to attend college after high school and intent to graduate from a 4-year college 0.2286 0.0034 -0.1217 0.0896
See notes at end of table.
12 The Pearson correlation coefficient for the total of the substance use factors and the physical safety factors was r = 0.22 with p < .001.
14
Table 4. Primary factor analysis of scale items and factor loading—Continued
Variable name Description
Factor 1 (Engagement)
Factor 2 (Environment)
Factor 3 (Substance
use)
Factor 4 (Physical
safety)
VS0050§ The punishment for breaking the rules is the same no matter who you are -0.0293 0.8046 -0.0019 -0.0578
VS0051§ The school rules are strictly enforced -0.0356 0.7720 -0.0382 -0.0374
VS0049§ School rules are fair 0.0475 0.7471 -0.0364 -0.0018
VS0052§ If a school rule is broken, students know what kind of punishment will follow 0.0607 0.7009 -0.0738 -0.0203
VS0053§ Teachers treat students with respect 0.2507 0.5360 0.0995 0.0378
VS0046§ How often are you distracted because of other students’ misbehaving -0.1051 0.3519 0.2233 0.1766
Alc_Inf Combination of availability of alcohol to students and seeing students under the influence at school 0.0056 0.0119 0.8910 -0.0956
Drugs_Comb Count of endorsed drug items subtracted from highest score 0.0102 -0.0158 0.8883 -0.0869
Disorder Combination of presence of gangs in your school, gangs involved in drug sales, gangs involved in fights, and hate-related graffiti in school
0.0332 -0.0414 0.6285 0.2204
SCS189§ You feel safe in your school 0.3733 0.2767 0.1091 0.1869
VS0124§ How often are you afraid that someone will attack or harm you in the school building or on school property? -0.0069 0.0068 -0.0136 0.8425
VS0125§ How often are you afraid that someone will attack or harm you on a school bus or on the way to and from school?
0.0065 0.0042 -0.0758 0.7954
Avoid_Comb Count of endorsed avoidance items subtracted from highest score -0.0638 -0.0548 0.0472 0.6802
SCS213 There is a lot of crime in the neighborhood where you go to school 0.2098 0.0903 0.1788 0.2258
§Variables have been reverse scored. SOURCE: U.S Department of Justice, Bureau of Justice Statistics, School Crime Supplement to the National Crime Victimization Survey, 2015.
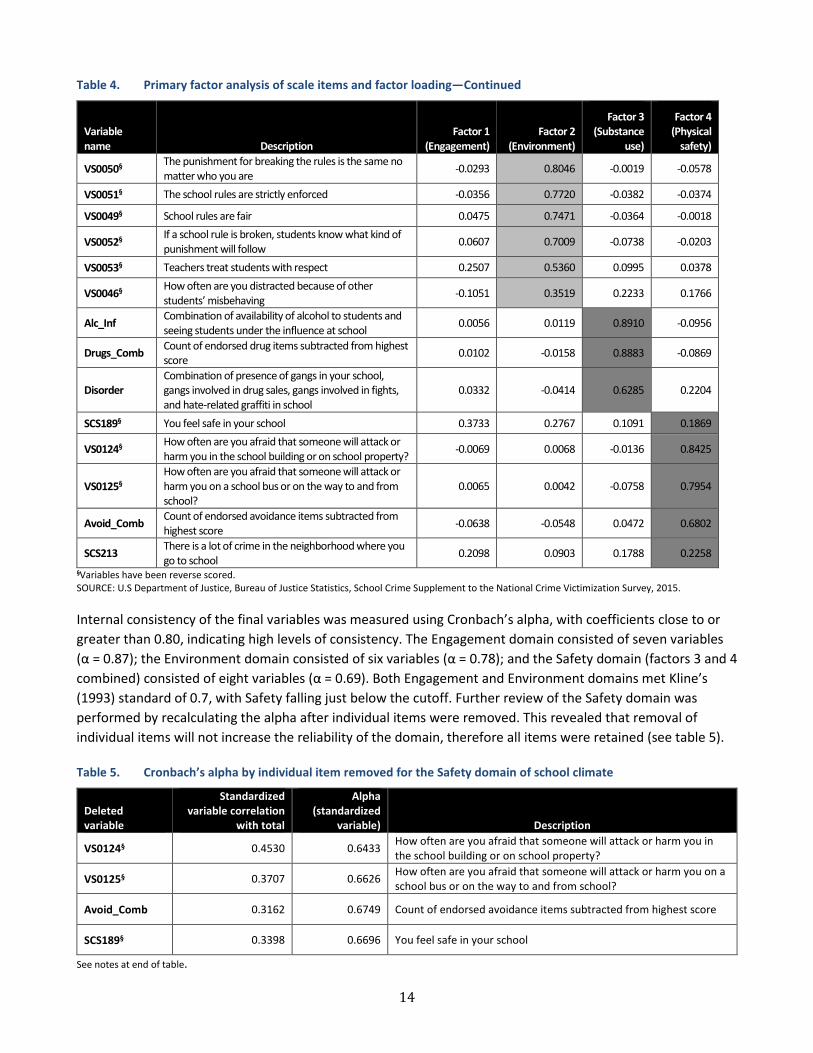
Internal consistency of the final variables was measured using Cronbach’s alpha, with coefficients close to or greater than 0.80, indicating high levels of consistency. The Engagement domain consisted of seven variables (α = 0.87); the Environment domain consisted of six variables (α = 0.78); and the Safety domain (factors 3 and 4 combined) consisted of eight variables (α = 0.69). Both Engagement and Environment domains met Kline’s (1993) standard of 0.7, with Safety falling just below the cutoff. Further review of the Safety domain was performed by recalculating the alpha after individual items were removed. This revealed that removal of individual items will not increase the reliability of the domain, therefore all items were retained (see table 5).
Table 5. Cronbach’s alpha by individual item removed for the Safety domain of school climate
Deleted variable
Standardized variable correlation
with total
Alpha (standardized
variable) Description
VS0124§ 0.4530 0.6433 How often are you afraid that someone will attack or harm you in the school building or on school property?
VS0125§ 0.3707 0.6626 How often are you afraid that someone will attack or harm you on a school bus or on the way to and from school?
Avoid_Comb 0.3162 0.6749 Count of endorsed avoidance items subtracted from highest score
SCS189§ 0.3398 0.6696 You feel safe in your school
See notes at end of table.
15
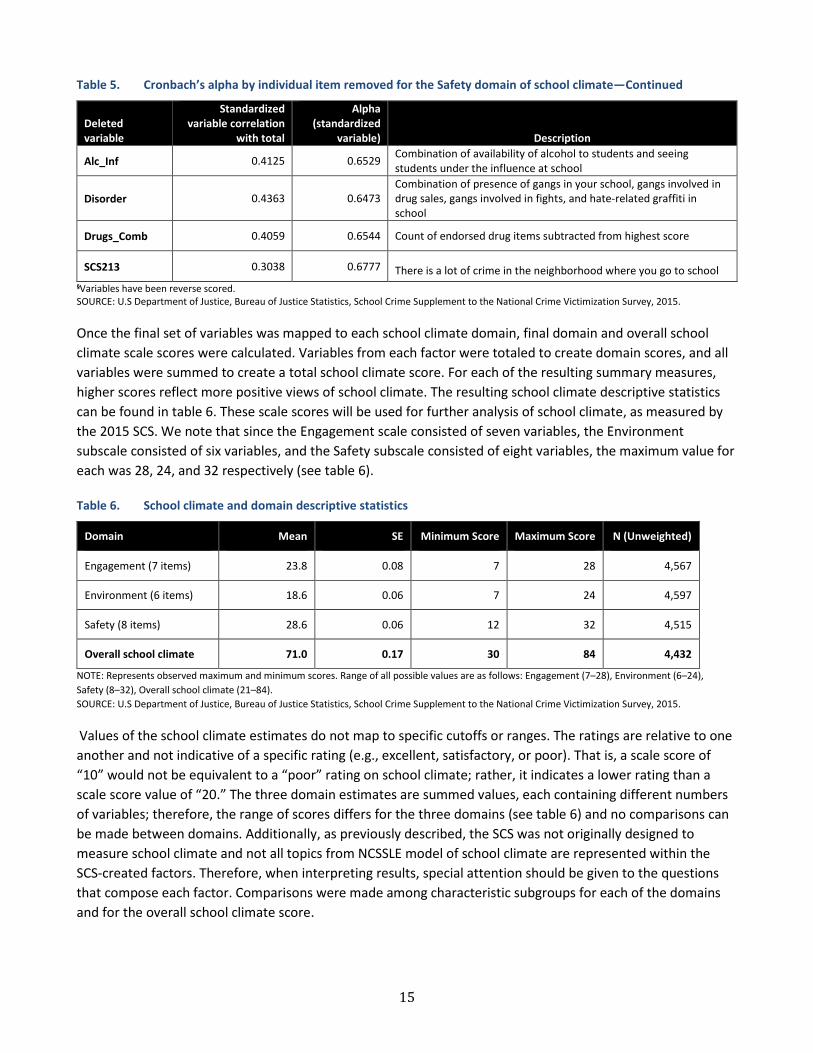
Table 5. Cronbach’s alpha by individual item removed for the Safety domain of school climate—Continued
Deleted variable
Standardized variable correlation
with total
Alpha (standardized
variable) Description
Alc_Inf 0.4125 0.6529 Combination of availability of alcohol to students and seeing students under the influence at school
Disorder 0.4363 0.6473 Combination of presence of gangs in your school, gangs involved in drug sales, gangs involved in fights, and hate-related graffiti in school
Drugs_Comb 0.4059 0.6544 Count of endorsed drug items subtracted from highest score
SCS213 0.3038 0.6777 There is a lot of crime in the neighborhood where you go to school §Variables have been reverse scored. SOURCE: U.S Department of Justice, Bureau of Justice Statistics, School Crime Supplement to the National Crime Victimization Survey, 2015.
Once the final set of variables was mapped to each school climate domain, final domain and overall school climate scale scores were calculated. Variables from each factor were totaled to create domain scores, and all variables were summed to create a total school climate score. For each of the resulting summary measures, higher scores reflect more positive views of school climate. The resulting school climate descriptive statistics can be found in table 6. These scale scores will be used for further analysis of school climate, as measured by the 2015 SCS. We note that since the Engagement scale consisted of seven variables, the Environment subscale consisted of six variables, and the Safety subscale consisted of eight variables, the maximum value for each was 28, 24, and 32 respectively (see table 6).
Table 6. School climate and domain descriptive statistics
Domain Mean SE Minimum Score Maximum Score N (Unweighted)
Engagement (7 items) 23.8 0.08 7 28 4,567
Environment (6 items) 18.6 0.06 7 24 4,597
Safety (8 items) 28.6 0.06 12 32 4,515
Overall school climate 71.0 0.17 30 84 4,432
NOTE: Represents observed maximum and minimum scores. Range of all possible values are as follows: Engagement (7–28), Environment (6–24), Safety (8–32), Overall school climate (21–84). SOURCE: U.S Department of Justice, Bureau of Justice Statistics, School Crime Supplement to the National Crime Victimization Survey, 2015.
Values of the school climate estimates do not map to specific cutoffs or ranges. The ratings are relative to one another and not indicative of a specific rating (e.g., excellent, satisfactory, or poor). That is, a scale score of “10” would not be equivalent to a “poor” rating on school climate; rather, it indicates a lower rating than a scale score value of “20.” The three domain estimates are summed values, each containing different numbers of variables; therefore, the range of scores differs for the three domains (see table 6) and no comparisons can be made between domains. Additionally, as previously described, the SCS was not originally designed to measure school climate and not all topics from NCSSLE model of school climate are represented within the SCS-created factors. Therefore, when interpreting results, special attention should be given to the questions that compose each factor. Comparisons were made among characteristic subgroups for each of the domains and for the overall school climate score.
16
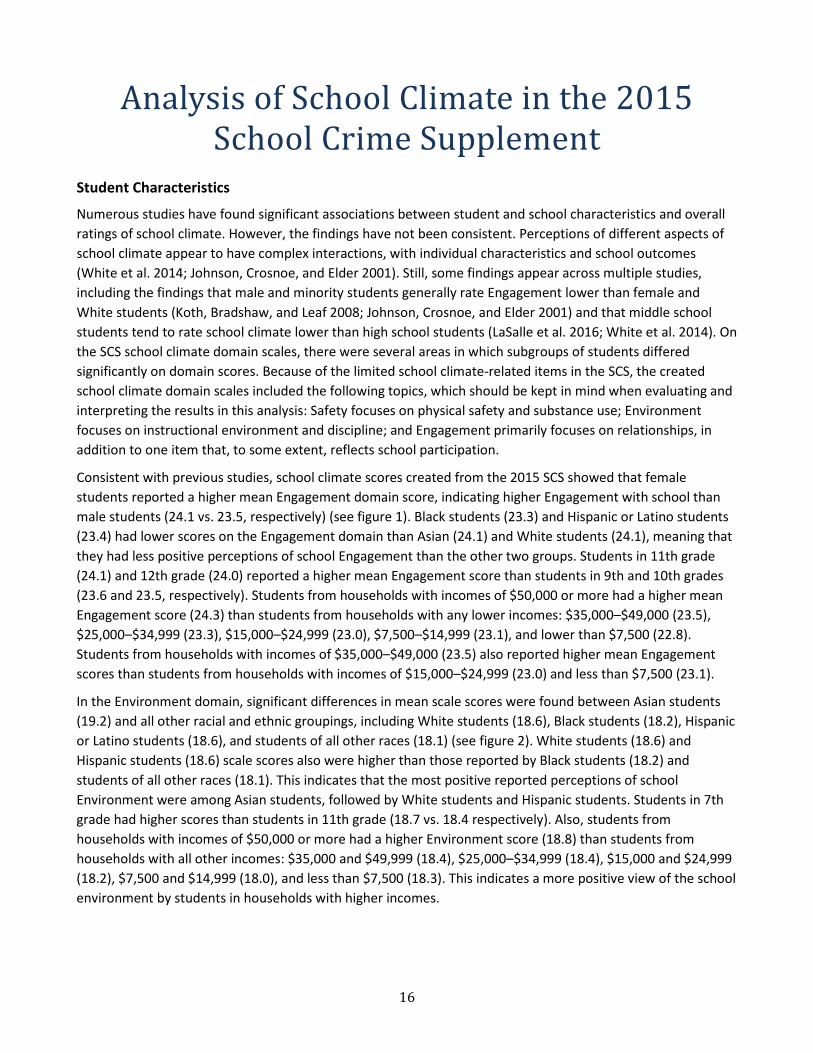
Analysis of School Climate in the 2015 School Crime Supplement
Student Characteristics
Numerous studies have found significant associations between student and school characteristics and overall ratings of school climate. However, the findings have not been consistent. Perceptions of different aspects of school climate appear to have complex interactions, with individual characteristics and school outcomes (White et al. 2014; Johnson, Crosnoe, and Elder 2001). Still, some findings appear across multiple studies, including the findings that male and minority students generally rate Engagement lower than female and White students (Koth, Bradshaw, and Leaf 2008; Johnson, Crosnoe, and Elder 2001) and that middle school students tend to rate school climate lower than high school students (LaSalle et al. 2016; White et al. 2014). On the SCS school climate domain scales, there were several areas in which subgroups of students differed significantly on domain scores. Because of the limited school climate-related items in the SCS, the created school climate domain scales included the following topics, which should be kept in mind when evaluating and interpreting the results in this analysis: Safety focuses on physical safety and substance use; Environment focuses on instructional environment and discipline; and Engagement primarily focuses on relationships, in addition to one item that, to some extent, reflects school participation.
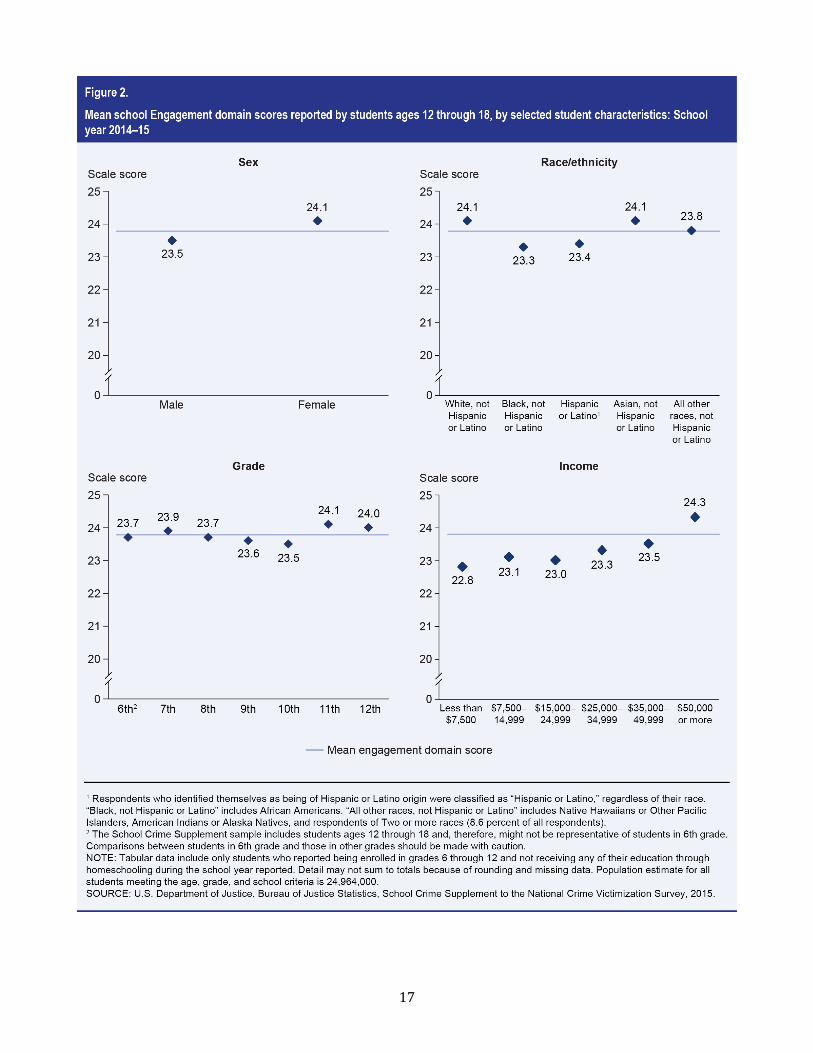
Consistent with previous studies, school climate scores created from the 2015 SCS showed that female students reported a higher mean Engagement domain score, indicating higher Engagement with school than male students (24.1 vs. 23.5, respectively) (see figure 1). Black students (23.3) and Hispanic or Latino students (23.4) had lower scores on the Engagement domain than Asian (24.1) and White students (24.1), meaning that they had less positive perceptions of school Engagement than the other two groups. Students in 11th grade (24.1) and 12th grade (24.0) reported a higher mean Engagement score than students in 9th and 10th grades (23.6 and 23.5, respectively). Students from households with incomes of $50,000 or more had a higher mean Engagement score (24.3) than students from households with any lower incomes: $35,000–$49,000 (23.5), $25,000–$34,999 (23.3), $15,000–$24,999 (23.0), $7,500–$14,999 (23.1), and lower than $7,500 (22.8). Students from households with incomes of $35,000–$49,000 (23.5) also reported higher mean Engagement scores than students from households with incomes of $15,000–$24,999 (23.0) and less than $7,500 (23.1).
In the Environment domain, significant differences in mean scale scores were found between Asian students (19.2) and all other racial and ethnic groupings, including White students (18.6), Black students (18.2), Hispanic or Latino students (18.6), and students of all other races (18.1) (see figure 2). White students (18.6) and Hispanic students (18.6) scale scores also were higher than those reported by Black students (18.2) and students of all other races (18.1). This indicates that the most positive reported perceptions of school Environment were among Asian students, followed by White students and Hispanic students. Students in 7th grade had higher scores than students in 11th grade (18.7 vs. 18.4 respectively). Also, students from households with incomes of $50,000 or more had a higher Environment score (18.8) than students from households with all other incomes: $35,000 and $49,999 (18.4), $25,000–$34,999 (18.4), $15,000 and $24,999 (18.2), $7,500 and $14,999 (18.0), and less than $7,500 (18.3). This indicates a more positive view of the school environment by students in households with higher incomes.
17
18
19
In the Safety domain, significant differences were again found between Asian students (29.2) and all other racial and ethnic groupings, including White students (28.7), Black students (28.3), Hispanic or Latino students (28.4), and students of all other races (28.4). There also were significant differences among grades and school levels. Students in 6th (29.6) and 7th grades (29.5) reported higher scores than students in 8th grade (29.2), while students from all these grades (6th–8th) each reported higher mean Safety scores than students in 9th
(28.4), 10th (28.0), 11th (28.0), and 12th (27.9) grades (see figure 3). In addition, the average Safety domain score reported by students in 9th grade (28.4) also was higher than the average score reported by students in 10th (28.0), 11th (28.0), and 12th (27.9) grades. Sixth through 8th grades are considered primary or middle school level, while 9th through 12th grades are considered secondary school level; middle school students perceived their schools as safer than high school students. Furthermore, students who were starting middle or high school felt significantly safer than students in later years at the same school level.
Looking at overall school climate ratings, female students reported a more positive view of school climate than male students (71.3 vs. 70.7, respectively). Additionally, as with the Environment and Safety subscales, the mean overall school climate score reported by Asian students (72.8) was significantly higher than the mean scores given by White students (71.4), Black students (69.8), Hispanic or Latino students (70.5), and students of all other races (70.3) (figure 4). Therefore, Asian students had a more positive perception of overall school climate than all other racial and ethnic groupings. White students’ mean overall school climate score (71.4) also was significantly higher than the mean score given by Black students (69.8) and Hispanic students (70.5). Students in 6th grade (72.0), 7th grade (72.1), and 8th grade (71.5) had higher mean overall school climate scores than students in all high school grades: 9th grade (70.7), 10th grade (70.0), 11th grade (70.5), and 12th grade (70.5). Students from households with incomes over $50,000 also had a higher average score (71.9) for overall school climate than did students from households in all other income ranges: $35,000–$49,999 (70.1), $25,000–$34,999 (70.4), $15,000–$24,999 (69.6), $7,500–$14,999 (69.4), and less than $7,500 (69.3).
20
21
22
Student-Reported School Victimization
The relationships between school climate and victimization in schools have been studied in several ways. Some recent reports have looked at the effect of victimization on students’ views of school climate. Nickerson et al. (2014) observed that students who reported frequent or worsening bullying victimization reported the lowest scores on all school climate aspects being measured, as compared to students who reported infrequent or no bullying victimization. Using student self- and peer-report instruments, Baly, Cornell, and Lovegrove (2014) reported similar results in a longitudinal study of middle school students, finding that higher rates of victimization during middle school predicted negative perceptions of school climate, along with lower academic achievement and higher levels of risk behaviors.
Other researchers have looked at bullying in school in relation to school climate characteristics, finding that students who feel teachers care about and respect them report that they are more often willing to seek help when witnessing or experiencing bullying and that students reporting positive school climates less often report being bullied (Eliot et al. 2010; Lee and Song 2012). In addition to overall school climate, a similar construct related to the domain of Engagement, school connectedness, is defined as including the sense of attachment and commitment a student feels as a result of perceived caring from teachers and peers, and has been associated with lower levels of student aggression and bullying in several studies that are based on student-reported data (Klein, Cornell, and Konold 2012, pp. 164–165; Mann et al. 2015, p. 482; Petrie 2014; Wilson 2004). School connectedness was also found to work alongside other experiences as a
The NCVS/SCS surveys examine several dimensions of student victimization, including bullying, criminal victimization, and hate speech. For all types of victimization in the SCS, “at school” was defined for respondents as including the inside of school buildings, the school grounds, the school bus, and going to or from school. This report includes estimates of criminal and bullying victimization at school.
Criminal Victimization: The NCVS “type of crime” variable is the basis for defining criminal victimization. Although the NCVS collects information on all criminal victimizations reported by a respondent during the period of review, for the purposes of this analysis, only victimizations that occurred at school are included. Two additional variables from the NCVS Crime Incident Report (NCVS-2), “activity at time of incident” and “location at time of incident,” are used to determine where each reported crime happened. Students who were considered to have been criminally victimized at school reported that at least one instance of theft or violent victimization happened “on the way to or from school” (activity) or “on school property” (location).
Bullying Victimization: In Version 1 of the 2015 SCS, bullying is characterized as something another student does at school that makes the respondent feel bad or is hurtful to him or her. Students were asked whether another student had made fun of them, called them names, or insulted them; spread rumors about them; threatened them with harm; pushed or shoved them; forced them to do something they did not want to do; excluded them from activities; or destroyed their property on purpose. Students who indicated they were victimized in one or more of these ways were considered to have been bullied at school.
During data collection for the NCVS, interviewers presented the definition of criminal victimization. Subsequently, during the data collection for the SCS, the definition of bullying victimization was given. It is possible that students reported some of the same incidents of victimization as criminal incidents on the NCVS and as bullying incidents on the SCS; this most likely occurred in instances where bullying incidents included overt physical attacks.
23
protective factor for individuals, buffering the effects of exposure to violence or violent behavior in students (Brookmeyer, Fanti, and Henrich 2006).
A consistent finding among these analyses is the negative relationship between student-reported victimization and perceptions of various aspects of school climate. When reports of school victimization are recorded at higher rates, student-reported school climate measures are also rated as less positive.
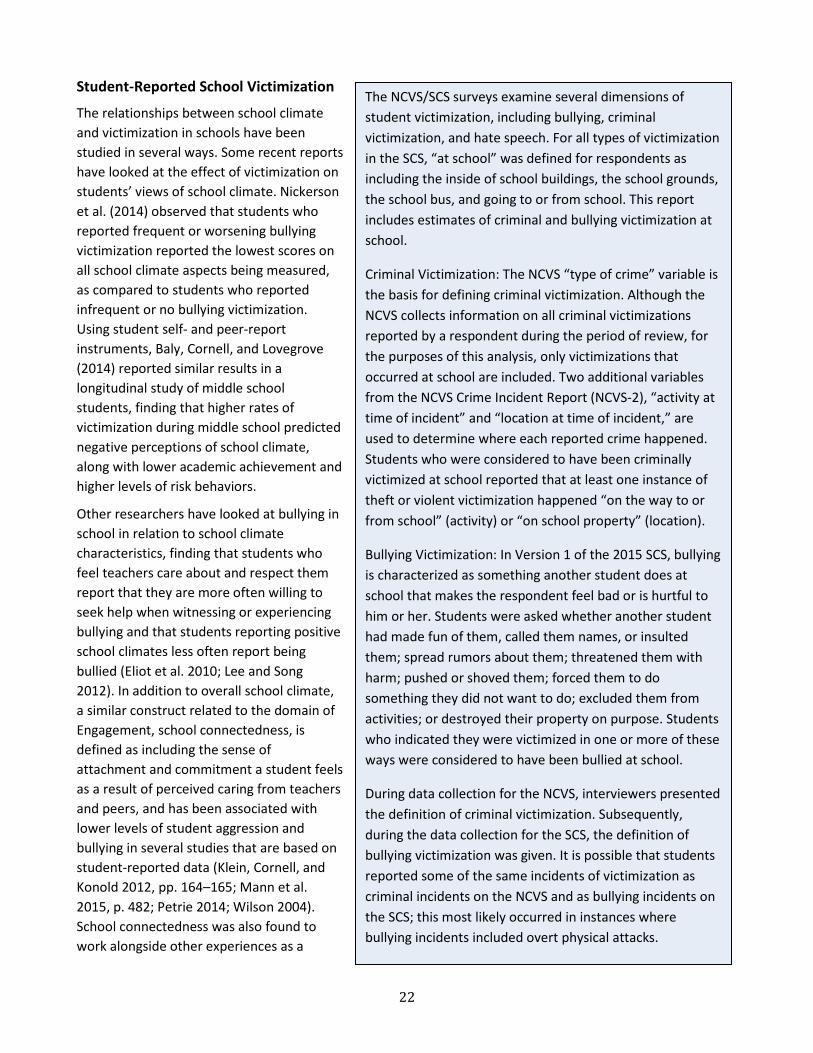
As expected, students who reported being bullied at school gave a lower average rating on the domains of Environment and Safety than students who did not report being bullied at school (see figure 6), so that students who reported being bullied felt less safe and had less positive perceptions of the school environment than those who did not report being bullied. However, there was no significant difference between students reporting bullying and those not reporting bullying on the domain of Engagement.
24
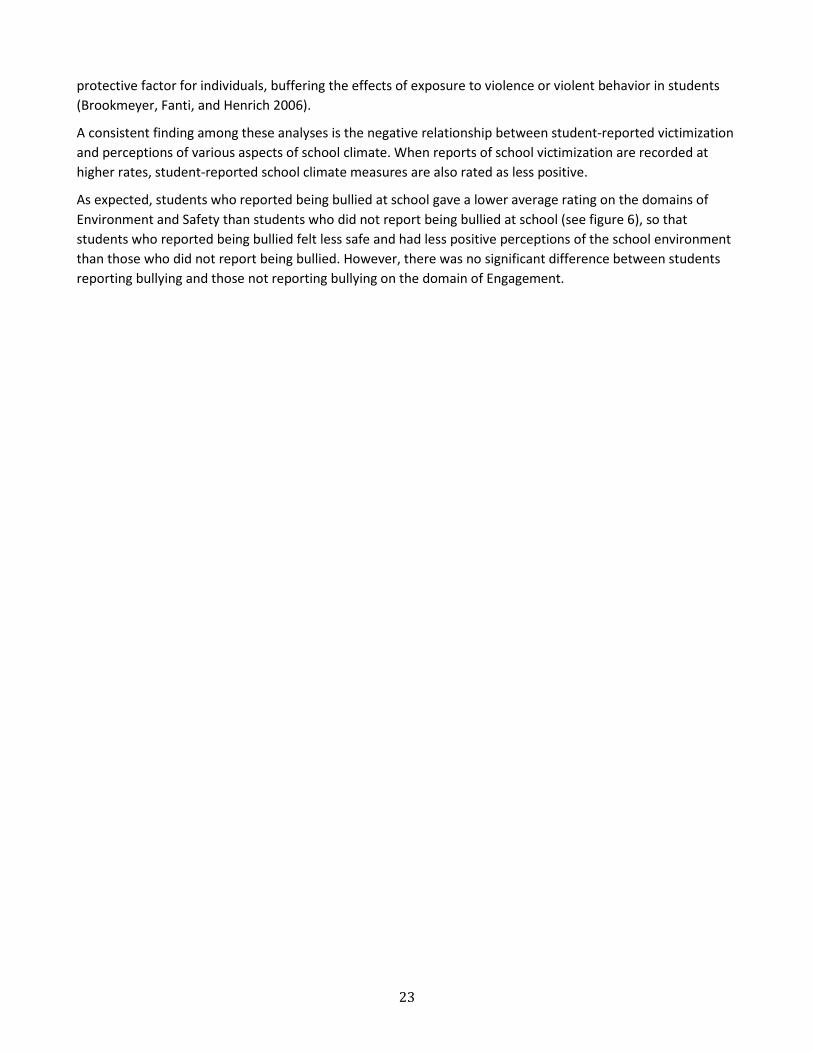
On average, overall school climate (figure 7) was also rated lower by students who reported being bullied than students who did not report being bullied.
25
Differences in mean scale climate scores among students who reported criminal victimization in school and those who did not report criminal victimization (figures 8 and 9) are similar to differences found for bullying victimization. Students who reported being criminally victimized at school also reported lower average scores for Environment, Safety, and overall school climate as compared to students who did not report being criminally victimized at school. Therefore, the responses of students who reported criminal victimization translate into less positive perceptions of school climate overall, lower perceptions of personal safety, and lower perceptions of the environment in school concerning rules, punishment, and disorder. Engagement scores did not differ based on reported criminal victimization.
26
27
28
Conclusions To construct school climate scores from the SCS, we compared items in the 2015 questionnaire to items used in previous studies to examine the various domains of school climate. The school climate factors created during the factor analysis, while not intended to replicate all topics represented in NCSSLE’s Model,13 did broadly coincide with the three domains included in the model and commonly used to measure school climate (Safety, Engagement, and Environment) though some items had relatively low factor loadings. Additionally, within our analysis of the 2015 NCVS/SCS survey, there were significant differences in perceptions of school climate across domains when analyzed by student characteristics and reported victimization in school. These findings are congruent with those found in similar studies, providing support for the idea that the factors created from the SCS are useful for analyses on school climate.
Key findings for student characteristics were as follows:
• Overall school climate (summation of total scores on the Engagement, Environment, and Safety domains) was scored higher by Asian students in comparison to all other racial subgroups. Asian students, overall, reported more positively on the items making up each domain, resulting in a higher overall school climate score in comparison to the other subgroups. Black students’ overall scores were lower than White students and Hispanic students, indicating a less positive perception of overall student climate. Overall school climate also was rated higher by students in middle school than by high school students and by students whose family income exceeded $50,000 compared to students with lower family incomes.
• The Engagement domain of school climate was the only subscale with a gender difference, where females expressed higher scores than males. White and Asian students reported higher Engagement scores than Black and Hispanic students. In addition, 11th and 12th graders had a higher Engagement score than 9th and 10th graders, and students whose family income exceeded $50,000 scored higher than all other income groups, translating into more feelings of Engagement by these groups.
• In the Environment domain, Asian students reported the highest scores among all race categories, as did students whose family income exceeded $50,000, indicating that these students had more positive perceptions of the school environment (primarily for the Discipline and Instructional Environment topic) than other student groupings. White students as well as Hispanic students reported higher scores than Black students or students of all other races. The only difference found between grades was that students in 7th grade reported higher scores than those in 11th grade.
• In the Safety domain, middle school students reported a higher score and felt safer at school and in the surrounding areas than high school students. Furthermore, lower Safety domain ratings were found between 7th and 8th, 8th and 9th, and 9th and 10th grades, which indicate a decline in school Safety domain ratings between 7th and 10th grades.
With regard to school climate and criminal victimization in schools, students who experienced bullying or criminal victimization gave lower scores to the overall school climate and the Environment and Safety domains than students who did not report experiencing bullying or criminal victimization. For bullying victimization, the differences in school climate scores between students who experienced bullying and those who did not was largest on the Safety and overall school climate scales. For criminal victimization, the largest differences also were on the Safety and overall school climate scales. In short, students who reported being bullied or criminally victimized felt that they were less safe (as indicated by ratings of physical safety and substance use), that they were in a less supportive school environment (as indicated by ratings of discipline and instruction), and that their schools had a less positive overall school climate. There were no significant differences in
13 Topics not represented include: Cultural and Linguistic Competence, Emotional Safety, Emergency Readiness/Management, Physical Environment, and Physical and Mental Health.
29
Engagement scores between students who reported being bullied and those who did not, or between students who reported being criminally victimized and those who did not.
The study of students’ perceptions of school climate is continuing to prove instrumental in assessing the safety and quality of schools. These research results suggest that items from the SCS can be used to measure elements of school climate among 12- to 18-year-old students in the United States, similar in structure to some of the topics found in NCSSLE’s school climate model; including Physical Safety, Substance Use, Instructional Environment, Discipline, Relationships, and School Participation. Additional studies should be conducted to solidify the accuracy and reliability of the SCS school climate domain scores and to explore the relationships between the measures of school climate and school characteristics. Further research also is needed to obtain a more in-depth exploration of the relationship between school climate and student criminal victimization in schools.
30
Find Out More
For questions about content or to view this report online, go to http://nces.ed.gov/pubsearch/pubsinfo.asp?pubid=2018098.
More detailed information on estimates from the 2015 School Crime Supplement to the National Crime Victimization Survey can be found in Web Tables produced by the National Center for Education Statistics (NCES).
There are additional NCES products related to the topic of this Technical Report:
Web Tables—Student Reports of Bullying: Results From the 2015 School Crime Supplement to the National Crime Victimization Survey (NCES 2017-015) http://nces.ed.gov/pubs2017/2017015.pdf.
Statistics in Brief–Student Victimization in U.S. Schools: Results From the 2015 School Crime Supplement to the National Crime Victimization Survey (NCES 2017-106) http://nces.ed.gov/pubs2017/2017106.pdf.
Lessne, D., and Cidade, M. (2017). Methodology Report: Split-Half Administration of the 2015 School Crime Supplement to the National Crime Victimization Survey (NCES 2017-004). U.S. Department of Education. Washington, DC: National Center for Education Statistics.
Zhang, A., Musu-Gillette, L., and Oudekerk, B.A. (2016). Indicators of School Crime and Safety: 2015 (NCES 2016-079/NCJ 249758). National Center for Education Statistics, U.S. Department of Education, and Bureau of Justice Statistics, Office of Justice Programs, U.S. Department of Justice. Washington, DC.
For more information on the SCS and the data products available for download, go to the NCES Crime and Safety Surveys website at http://nces.ed.gov/programs/crime/index.asp.
31
Technical Notes NCVS/SCS Sample Design and Data Collection
The estimates provided in this report are based on data collected through the 2015 SCS to the NCVS. The National Center for Education Statistics (NCES) collects data on student victimization in school through its sponsorship of the SCS. The U.S. Department of Justice, Bureau of Justice Statistics (BJS) administers both the NCVS and the SCS. The SCS is included as a supplement to the NCVS every 2 years. All the survey components are presented to respondents by U.S. Census Bureau (Census) trained field representatives using computer-assisted personal interviewing either in-person or by telephone.
Census selects a representative sample of households within the United States for the NCVS on an ongoing basis.14 All persons in the sample households ages 12 and over are asked to complete the NCVS every 6 months over a period of 3 years to determine whether they have been criminally victimized during the 6 months preceding the interview. The SCS collects additional information on school victimization not reported in the NCVS, including bullying and being called hate-related words, and on characteristics of the school environment related to criminal victimization such as the presence of gangs and the availability of drugs. Every 2 years, the SCS is administered to eligible household members after they complete the NCVS. Respondents to the SCS must be between the ages of 12 and 18 and attending grades 6 through 12 in public or private schools during the reference school year (fall 2014–spring 2015 for the 2015 administration). Students who are exclusively homeschooled or participating in General Educational Development [GED] programs do not participate in the SCS portion of the interview.
In 2015, there were approximately 57,227 households with members ages 12 through 18 in the NCVS sample. Among the 9,372 NCVS household members who were eligible to complete the SCS,15 5,469 students participated in an SCS interview. Because an SCS interview could only be completed after households had responded to the NCVS, the unit response rate for the SCS reflects both the household interview response rate and the student interview response rate. The NCVS weighting process, adjusts for region, age, race, and sex, producing a weighted household response rate on the 2015 NCVS of 82.5 percent, and a weighted student response rate of 57.8 percent. The overall weighted SCS unit response rate (calculated by multiplying the household response rate by the student response rate) was 47.7 percent.
As in most surveys, some individuals did not give a response to every item. However, individual item response rates for the 2015 SCS were high—the unweighted item response rates for all respondents on all items included in the analyses for this report exceeded 85 percent. On most items, the response rate was 95 percent or higher.
NCES Statistical Standard 4-4-1 requires that any survey stage of data collection with a unit or item response less than 85 percent must be evaluated for potential nonresponse bias. Census completed a unit nonresponse bias analysis to determine the extent to which there might be bias in the estimates produced using SCS data.16 The analysis of unit nonresponse bias found evidence of potential bias for both the NCVS and the SCS portions of the interview. The unit nonresponse bias analysis considers nonresponses on both the NCVS and the SCS.
14 For more information on the NCVS sample design and survey methodology, see http://www.bjs.gov/index.cfm?ty=dcdetail&iid=245. 15 To be eligible for the SCS, students ages 12 through 18 must first complete the NCVS interview; be currently enrolled in a primary or secondary education program leading to a high school diploma or enrolled sometime during the school year of the interview; not enrolled in fifth grade or under; and have attended a school outside their home sometime during the school year. 16 Memorandum for Michael Planty and Rachel Hansen from James B. Treat, Subject: National Crime Victimization Survey: Nonresponse Bias Report for the 2015 School Crime Supplement, March 24, 2016.
32
For the 2015 NCVS interview, Census found evidence of unit nonresponse bias within Hispanic origin, urbanicity, region, and age subgroups. Within the SCS portion of the interview, race, urbanicity, region, and age subgroups showed significant unit nonresponse bias. Further analysis indicated that respondents in the age 14 and the rural categories had significantly higher nonresponse bias estimates compared to other age and urbanicity subgroups, while respondents who were Asian and from the northeast had significantly lower response bias estimates compared to other race and region subgroups. Based on the analysis, Census concluded that there are significant nonresponse biases in the 2015 SCS data. In the SCS weighting process, adjustments are applied based on region, age, race, Hispanic origin, and sex, which should mitigate some bias in the response data.
This report utilizes a subset of data from the 2015 SCS response file, which includes items from the 2015 NCVS Basic Screener (NCVS-1), the NCVS Crime Incident Report (NCVS-2), SCS questionnaires, and data elements that Census appended from the Private School Universe and Common Core Data sets related to characteristics of the schools attended by the SCS respondents. It also includes weights developed by Census for the data file. The weights account for both household- and person-level noninterviews and reduce the variance of the estimate by correcting for the differences between the sample distributions of age, race/ethnicity, and sex and the known U.S. population distributions of these characteristics. The estimated population of students ages 12 through 18 attending public or private schools in classroom grades 6 through 12 during the 2014–15 school year represented in this report is 24,694,000.
The 2015 SCS included an embedded split-half experiment, which varied the questions presented to students about whether they were bullied. Where bullying victimization is referred to in this report, estimates include only students who were administered Version 1 of the survey. Version 1 used a similar series of questions about bullying victimization as the 2005–13 SCS surveys, to present the most comparable data. Analysis of the split-half populations found no statistically significant differences in the student characteristics represented.17 When using only the Version 1 data for bullying estimates, the estimated population of students represented in the 2015 SCS is 24,622,000.
Two broad categories of error may occur in estimates generated from surveys: sampling and nonsampling errors. Sampling errors occur when observations are based on samples rather than entire populations. The standard error of a sample statistic is a measure of the variation due to sampling and indicates the precision of the statistic. The complex sampling design used in the 2015 NCVS/SCS must be considered when calculating variance estimates such as standard errors. The statistical programs used in the estimates for this report were SAS 9.3 and SAS-callable SUDAAN Release 11.0. The model applied to adjust variance estimations for the complex sample was the Taylor series method with replacement and clustering (using NEST variables PSEUDOSTRATUM and SEUCODE).
Nonsampling errors in survey data can be attributed to several sources: incomplete information about respondents, differences among respondents in question interpretation, inability or unwillingness to give correct information, and errors in collecting and processing data. Another limitation of the NCVS/SCS is the effect of unbounded interviews. Respondents are asked about criminal victimization during the 6 months preceding the interviews. Sixteen percent of SCS respondent interviews were new to the NCVS panel in 2015 (the incoming rotation interviews). An additional 4 percent did not complete an interview in the previous rotation. Because there is no prior interview for these respondents to use as a point of reference when reporting victimization, their reports may include victimizations that occurred before the desired reference
17 For a complete discussion of the split-half methodology and results, see Lessne, D., and Cidade, M. (2017). Methodology Report: Split-Half Administration of the 2015 School Crime Supplement to the National Crime Victimization Survey (NCES 2017-004). U.S. Department of Education. Washington, DC: National Center for Education Statistics. Available at https://nces.ed.gov/pubsearch.
33
period. To the extent that these earlier victimizations are included, criminal victimization rates are overreported.
Variables Used
The variables from the 2015 SCS data file used in this report are listed in exhibit 1 along with the SCS data file source code for each variable. Recoding and additional calculations are also indicated for the student and school characteristic variables. How the items included in the school climate domains were selected and used in the development of scale scores is discussed in the item scoring and factor mapping section of this report. Please refer to the codebook for additional information about variable values. The data and codebook are available for download from the Inter-University Consortium for Political and Social Research via the Student Surveys link at NCES’s Crime and Safety Surveys portal located at: http://nces.ed.gov/programs/crime/surveys.asp.
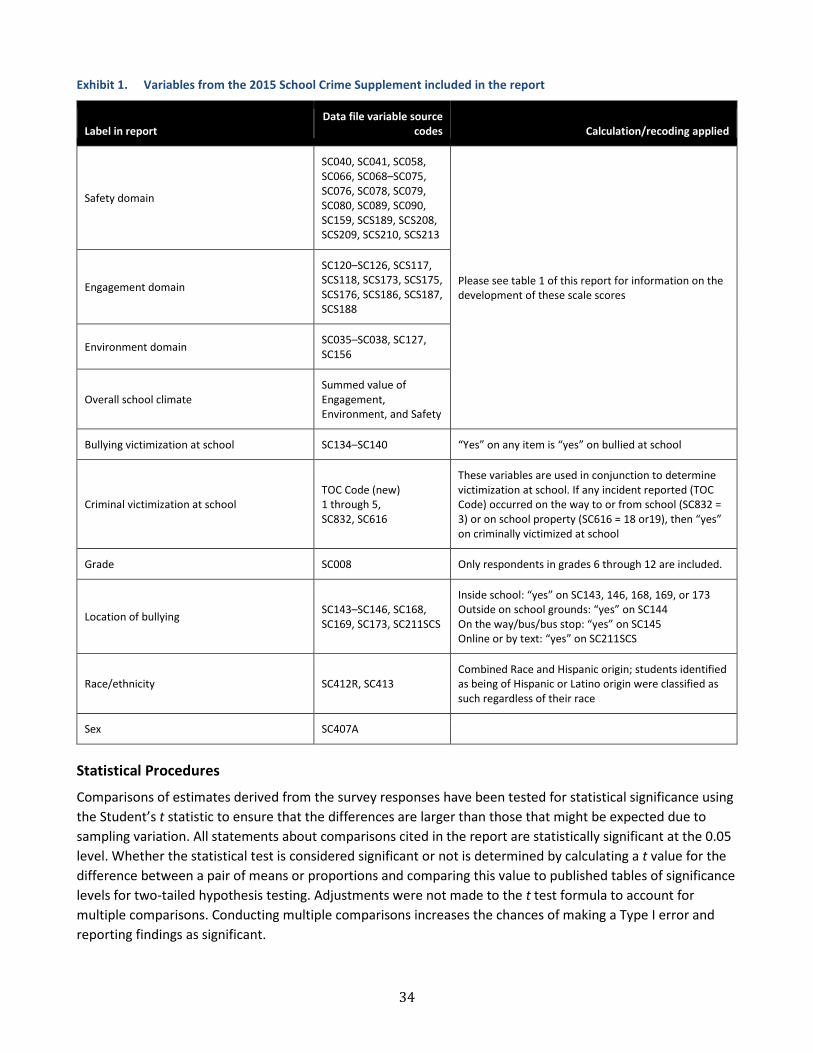
34
Exhibit 1. Variables from the 2015 School Crime Supplement included in the report
Label in report Data file variable source
codes Calculation/recoding applied
Safety domain
SC040, SC041, SC058, SC066, SC068–SC075, SC076, SC078, SC079, SC080, SC089, SC090, SC159, SCS189, SCS208, SCS209, SCS210, SCS213
Please see table 1 of this report for information on the development of these scale scores
Engagement domain
SC120–SC126, SCS117, SCS118, SCS173, SCS175, SCS176, SCS186, SCS187, SCS188
Environment domain SC035–SC038, SC127, SC156
Overall school climate Summed value of Engagement, Environment, and Safety
Bullying victimization at school SC134–SC140 “Yes” on any item is “yes” on bullied at school
Criminal victimization at school TOC Code (new) 1 through 5, SC832, SC616
These variables are used in conjunction to determine victimization at school. If any incident reported (TOC Code) occurred on the way to or from school (SC832 = 3) or on school property (SC616 = 18 or19), then “yes” on criminally victimized at school
Grade SC008 Only respondents in grades 6 through 12 are included.
Location of bullying SC143–SC146, SC168, SC169, SC173, SC211SCS
Inside school: “yes” on SC143, 146, 168, 169, or 173 Outside on school grounds: “yes” on SC144 On the way/bus/bus stop: “yes” on SC145 Online or by text: “yes” on SC211SCS
Race/ethnicity SC412R, SC413 Combined Race and Hispanic origin; students identified as being of Hispanic or Latino origin were classified as such regardless of their race
Sex SC407A
Statistical Procedures
Comparisons of estimates derived from the survey responses have been tested for statistical significance using the Student’s t statistic to ensure that the differences are larger than those that might be expected due to sampling variation. All statements about comparisons cited in the report are statistically significant at the 0.05 level. Whether the statistical test is considered significant or not is determined by calculating a t value for the difference between a pair of means or proportions and comparing this value to published tables of significance levels for two-tailed hypothesis testing. Adjustments were not made to the t test formula to account for multiple comparisons. Conducting multiple comparisons increases the chances of making a Type I error and reporting findings as significant.
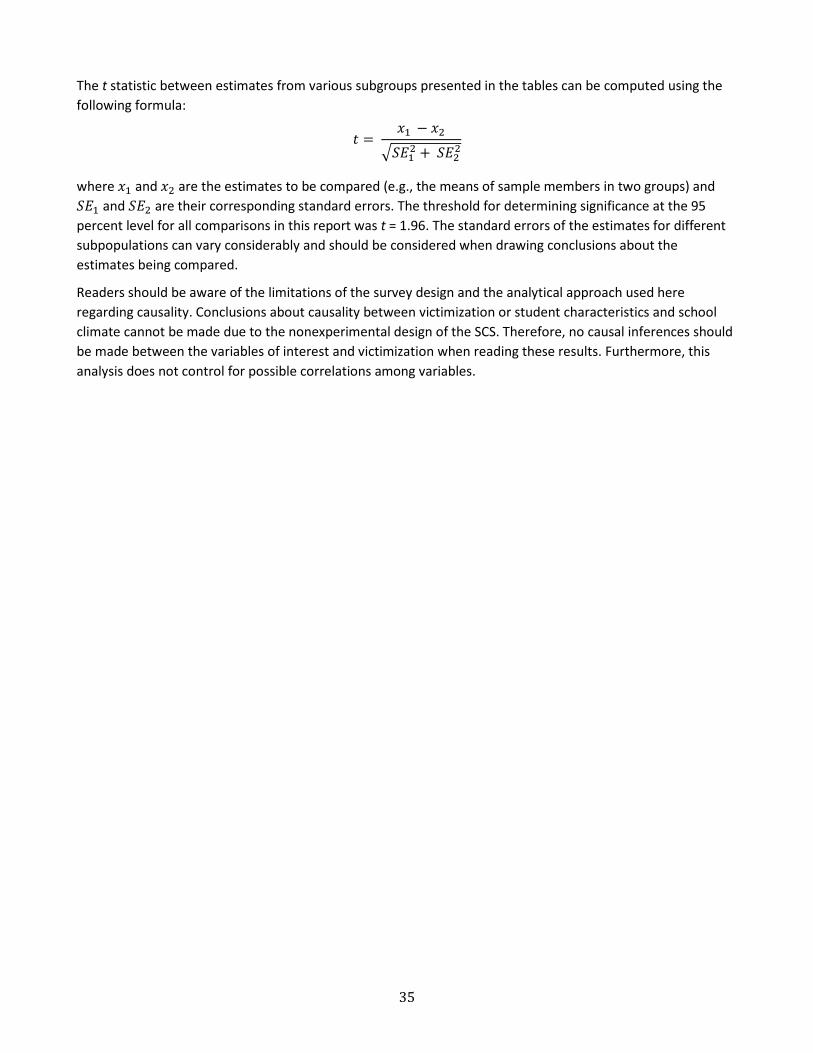
35
The t statistic between estimates from various subgroups presented in the tables can be computed using the following formula:
𝑡𝑡 = 𝑥𝑥1 − 𝑥𝑥2
�𝑆𝑆𝑆𝑆12 + 𝑆𝑆𝑆𝑆22
where 𝑥𝑥1 and 𝑥𝑥2 are the estimates to be compared (e.g., the means of sample members in two groups) and 𝑆𝑆𝑆𝑆1 and 𝑆𝑆𝑆𝑆2 are their corresponding standard errors. The threshold for determining significance at the 95 percent level for all comparisons in this report was t = 1.96. The standard errors of the estimates for different subpopulations can vary considerably and should be considered when drawing conclusions about the estimates being compared.
Readers should be aware of the limitations of the survey design and the analytical approach used here regarding causality. Conclusions about causality between victimization or student characteristics and school climate cannot be made due to the nonexperimental design of the SCS. Therefore, no causal inferences should be made between the variables of interest and victimization when reading these results. Furthermore, this analysis does not control for possible correlations among variables.
36
References Allen, M.J., and Yen, W.M. (1979). Introduction to Measurement Theory. Monterey, CA: Brooks/Cole.
Baly, M.W., Cornell, D.G., and Lovegrove, P. (2014). A Longitudinal Investigation of Self- and Peer Reports of Bullying Victimization Across Middle School. Psychology in the Schools, 51(3): 217–240.
Bradshaw, C.P., Waasdorp, T.E., Debnam, K.J., and Lindstrom Johnson, S. (2014). Measuring School Climate in High Schools: A Focus on Safety, Engagement, and the Environment. Journal of School Health, 84(9): 593–604.
Brookmeyer, K.A., Fanti, K.A., and Henrich, C.C. (2006). Schools, Parents, and Youth Violence: A Multilevel, Ecological Analysis. Journal of Clinical Child and Adolescent Psychology, 35(4): 504.
Eliot, M., Cornell, D., Gregory, A., and Fan, X. (2010). Supportive School Climate and Student Willingness to Seek Help for Bullying and Threats of Violence. Journal of School Psychology, 48(6): 533–553.
Hopson, L.M., Schiller, K.S., and Lawson, H.A. (2014). Exploring Linkages Between School Climate, Behavior Norms, Social Supports, and Academic Success. Social Work Research, 38(4): 197–209.
Johnson, M.K., Crosnoe, R., and Elder, G.H. (2001). Students’ Attachment and Academic Engagement: The Role of Race and Ethnicity. Sociology of Education, 74(4): 318–340.
Klein, J., Cornell, D., and Konold, T. (2012). Relationships Between Bullying, School Climate, and Student Risk Behaviors. School Psychology Quarterly, 27(3): 154–169.
Kline, P. (1993). The Handbook of Psychological Testing. London: Routledge.
Koth, C.W., Bradshaw, C.P., and Leaf, P.J. (2008). A Multilevel Study of Predictors of Student Perceptions of School Climate: The Effect of Classroom-Level Factors. Journal of Educational Psychology, 100(1): 96–104.
La Salle, T.P., Parris, L., Morin, M., and Meyers, J. (2016). Deconstructing Peer Victimization: Relationships With Connectedness, Gender, Grade and Race/Ethnicity. School Psychology Forum: Research in Practice, 10(1): 41–54.
Lee, C.H., and Song, J. (2012). Functions of Parental Involvement and Effects of School Climate on Bullying Behaviors Among South Korean Middle School Students. Journal of Interpersonal Violence, 0886260511433508.
Mann, M.J., Kristjansson, A.L., Sigfusdottir, I.D., and Smith, M.L. (2015). The Role of Community, Family, Peer, and School Factors in Group Bullying: Implications for School-Based Intervention. Journal of School Health, 85(7): 477–486.
McCormick, M.P., Cappella, E., O’Connor, E.E., and McClowry, S.G. (2015). Context Matters for Social-Emotional Learning: Examining Variations in Program Impact by Dimensions of School Climate. American Journal of Community Psychology, 56(1/2): 101–119.
National Center for Education Statistics. (2015). ED School Climate Surveys (EDSCLS) National Benchmark Study 2016, Appendix D: EDSCLS Pilot Test 2015 Report. Retrieved January 31, 2017, from https://safesupportivelearning.ed.gov/sites/default/files/Appendix_D_2015_EDSCLS_Pilot_Test_Report%20%281%29.pdf.
Nickerson, A.B., Singleton, D., Schnurr, B., and Collen, M.H. (2014). Perceptions of School Climate as a Function of Bullying Involvement. Journal of Applied School Psychology, 30(2): 157–181.
Peguero, A.A., and Bracy, N.L. (2014). School Order, Justice, and Education: Climate, Discipline Practices, and Dropping Out. Journal of Research on Adolescence, 25(3): 412–416.
37
Petrie, K. (2014). The Relationship Between School Climate and Student Bullying. TEACH Journal of Christian Education, 8(1): 26–35.
Thapa, A., Cohen, J., Guffey, S., and Higgins-D’Alessandro, A. (2013). A Review of School Climate Research. Review of Educational Research, 83(3): 357–385.
White, N., LaSalle, T., Ashby, J.S., and Meyers, J. (2014). A Brief Measure of Adolescent Perceptions of School Climate. School Psychology Quarterly, 20(3): 349–359.
Wilson, D. (2004). The Interface of School Climate and School Connectedness and Relationships With Aggression and Victimization. Journal of School Health, 74(7): 293–299.
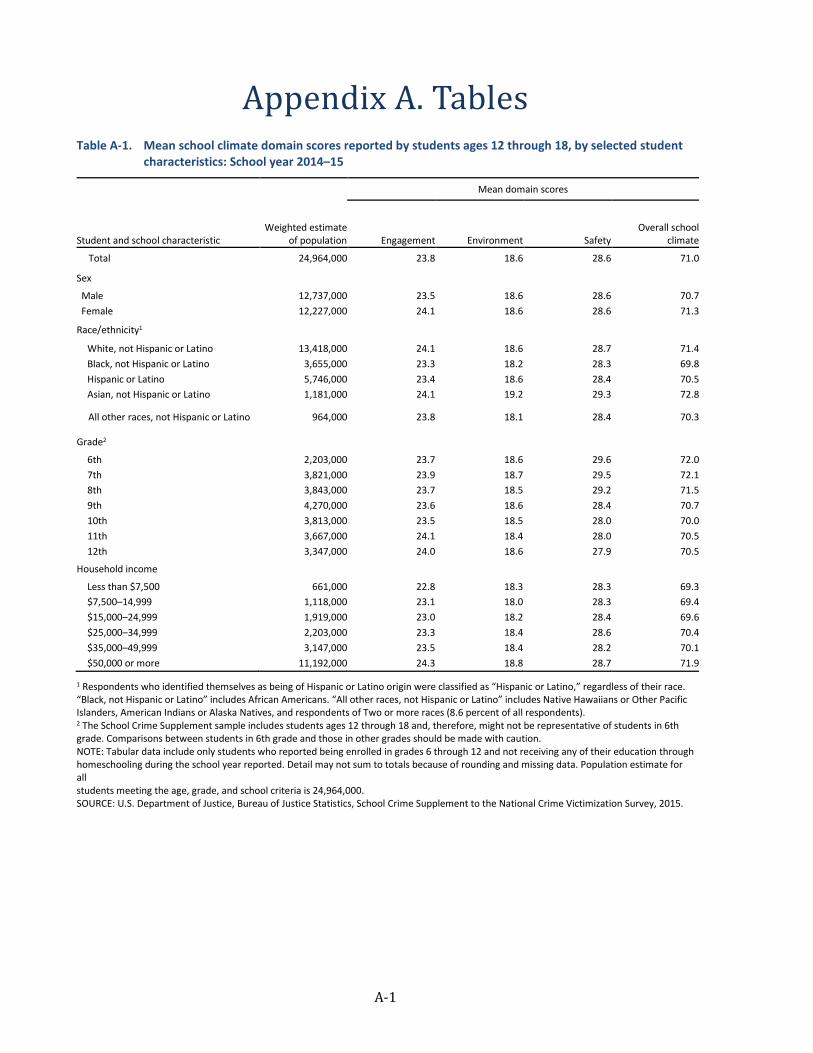
A-1
Appendix A. Tables Table A-1. Mean school climate domain scores reported by students ages 12 through 18, by selected student
characteristics: School year 2014–15
Mean domain scores
Student and school characteristic Weighted estimate
of population Engagement Environment Safety Overall school
climate
Total 24,964,000 23.8 18.6 28.6 71.0
Sex Male 12,737,000 23.5 18.6 28.6 70.7 Female 12,227,000 24.1 18.6 28.6 71.3
Race/ethnicity1
White, not Hispanic or Latino 13,418,000 24.1 18.6 28.7 71.4 Black, not Hispanic or Latino 3,655,000 23.3 18.2 28.3 69.8 Hispanic or Latino 5,746,000 23.4 18.6 28.4 70.5 Asian, not Hispanic or Latino 1,181,000 24.1 19.2 29.3 72.8
All other races, not Hispanic or Latino 964,000 23.8 18.1 28.4 70.3
Grade2 6th 2,203,000 23.7 18.6 29.6 72.0 7th 3,821,000 23.9 18.7 29.5 72.1 8th 3,843,000 23.7 18.5 29.2 71.5 9th 4,270,000 23.6 18.6 28.4 70.7 10th 3,813,000 23.5 18.5 28.0 70.0 11th 3,667,000 24.1 18.4 28.0 70.5 12th 3,347,000 24.0 18.6 27.9 70.5
Household income
Less than $7,500 661,000 22.8 18.3 28.3 69.3 $7,500–14,999 1,118,000 23.1 18.0 28.3 69.4 $15,000–24,999 1,919,000 23.0 18.2 28.4 69.6 $25,000–34,999 2,203,000 23.3 18.4 28.6 70.4 $35,000–49,999 3,147,000 23.5 18.4 28.2 70.1 $50,000 or more 11,192,000 24.3 18.8 28.7 71.9
1 Respondents who identified themselves as being of Hispanic or Latino origin were classified as “Hispanic or Latino,” regardless of their race. “Black, not Hispanic or Latino” includes African Americans. “All other races, not Hispanic or Latino” includes Native Hawaiians or Other Pacific Islanders, American Indians or Alaska Natives, and respondents of Two or more races (8.6 percent of all respondents). 2 The School Crime Supplement sample includes students ages 12 through 18 and, therefore, might not be representative of students in 6th grade. Comparisons between students in 6th grade and those in other grades should be made with caution. NOTE: Tabular data include only students who reported being enrolled in grades 6 through 12 and not receiving any of their education through homeschooling during the school year reported. Detail may not sum to totals because of rounding and missing data. Population estimate for all students meeting the age, grade, and school criteria is 24,964,000. SOURCE: U.S. Department of Justice, Bureau of Justice Statistics, School Crime Supplement to the National Crime Victimization Survey, 2015.
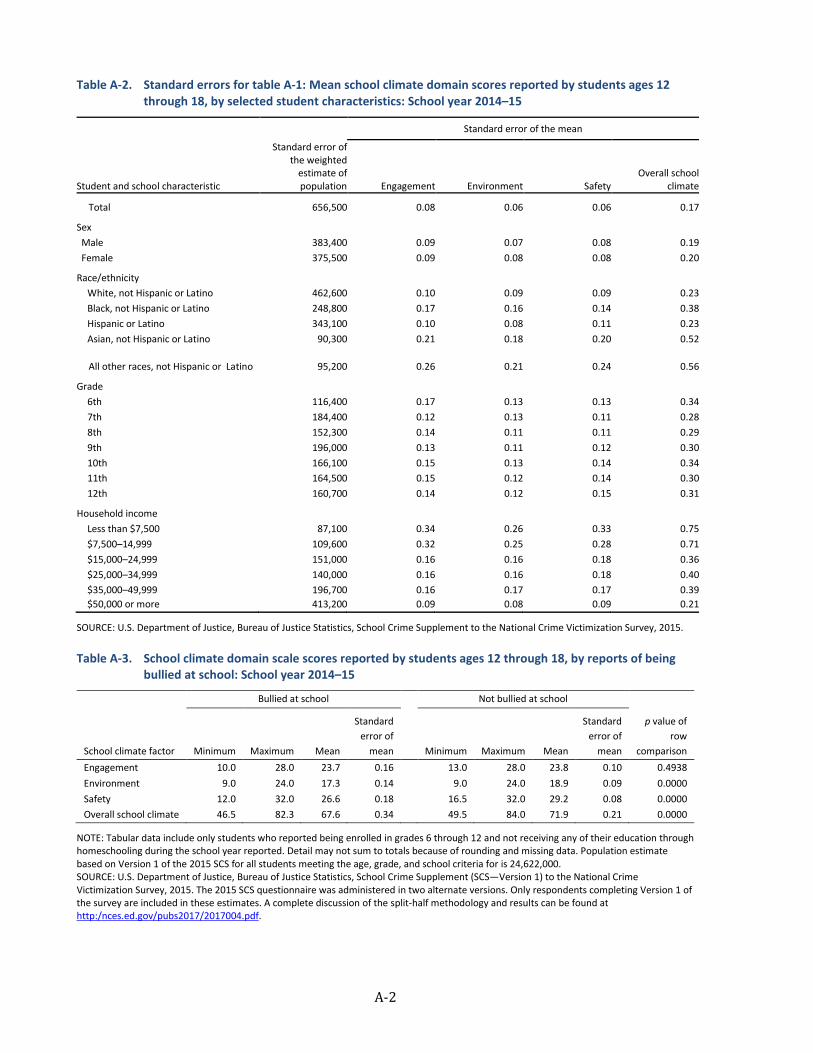
A-2
Table A-2. Standard errors for table A-1: Mean school climate domain scores reported by students ages 12 through 18, by selected student characteristics: School year 2014–15
Standard error of the mean
Student and school characteristic
Standard error of the weighted
estimate of population Engagement Environment Safety
Overall school climate
Total 656,500 0.08 0.06 0.06 0.17
Sex Male 383,400 0.09 0.07 0.08 0.19 Female 375,500 0.09 0.08 0.08 0.20
Race/ethnicity White, not Hispanic or Latino 462,600 0.10 0.09 0.09 0.23 Black, not Hispanic or Latino 248,800 0.17 0.16 0.14 0.38 Hispanic or Latino 343,100 0.10 0.08 0.11 0.23 Asian, not Hispanic or Latino 90,300 0.21 0.18 0.20 0.52
All other races, not Hispanic or Latino 95,200 0.26 0.21 0.24 0.56
Grade 6th 116,400 0.17 0.13 0.13 0.34 7th 184,400 0.12 0.13 0.11 0.28 8th 152,300 0.14 0.11 0.11 0.29 9th 196,000 0.13 0.11 0.12 0.30 10th 166,100 0.15 0.13 0.14 0.34 11th 164,500 0.15 0.12 0.14 0.30 12th 160,700 0.14 0.12 0.15 0.31
Household income Less than $7,500 87,100 0.34 0.26 0.33 0.75 $7,500–14,999 109,600 0.32 0.25 0.28 0.71 $15,000–24,999 151,000 0.16 0.16 0.18 0.36 $25,000–34,999 140,000 0.16 0.16 0.18 0.40 $35,000–49,999 196,700 0.16 0.17 0.17 0.39 $50,000 or more 413,200 0.09 0.08 0.09 0.21
SOURCE: U.S. Department of Justice, Bureau of Justice Statistics, School Crime Supplement to the National Crime Victimization Survey, 2015.
Table A-3. School climate domain scale scores reported by students ages 12 through 18, by reports of being bullied at school: School year 2014–15
Bullied at school Not bullied at school
p value of row
comparison School climate factor Minimum Maximum Mean
Standard error of
mean Minimum Maximum Mean
Standard error of
mean Engagement 10.0 28.0 23.7 0.16 13.0 28.0 23.8 0.10 0.4938 Environment 9.0 24.0 17.3 0.14 9.0 24.0 18.9 0.09 0.0000 Safety 12.0 32.0 26.6 0.18 16.5 32.0 29.2 0.08 0.0000 Overall school climate 46.5 82.3 67.6 0.34 49.5 84.0 71.9 0.21 0.0000
NOTE: Tabular data include only students who reported being enrolled in grades 6 through 12 and not receiving any of their education through homeschooling during the school year reported. Detail may not sum to totals because of rounding and missing data. Population estimate based on Version 1 of the 2015 SCS for all students meeting the age, grade, and school criteria for is 24,622,000. SOURCE: U.S. Department of Justice, Bureau of Justice Statistics, School Crime Supplement (SCS—Version 1) to the National Crime Victimization Survey, 2015. The 2015 SCS questionnaire was administered in two alternate versions. Only respondents completing Version 1 of the survey are included in these estimates. A complete discussion of the split-half methodology and results can be found at http:/nces.ed.gov/pubs2017/2017004.pdf.
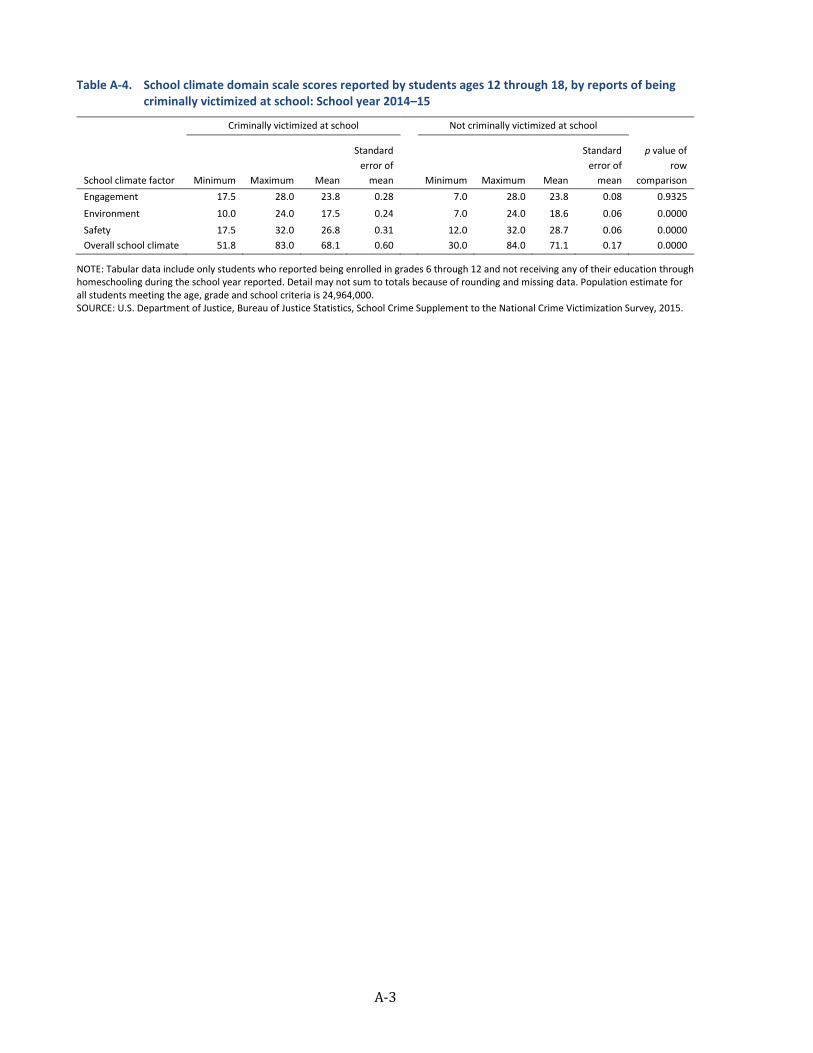
A-3
Table A-4. School climate domain scale scores reported by students ages 12 through 18, by reports of being criminally victimized at school: School year 2014–15
Criminally victimized at school Not criminally victimized at school
p value of row
comparison School climate factor Minimum Maximum Mean
Standard error of
mean Minimum Maximum Mean
Standard error of
mean Engagement 17.5 28.0 23.8 0.28 7.0 28.0 23.8 0.08 0.9325
Environment 10.0 24.0 17.5 0.24 7.0 24.0 18.6 0.06 0.0000 Safety 17.5 32.0 26.8 0.31 12.0 32.0 28.7 0.06 0.0000 Overall school climate 51.8 83.0 68.1 0.60 30.0 84.0 71.1 0.17 0.0000
NOTE: Tabular data include only students who reported being enrolled in grades 6 through 12 and not receiving any of their education through homeschooling during the school year reported. Detail may not sum to totals because of rounding and missing data. Population estimate for all students meeting the age, grade and school criteria is 24,964,000. SOURCE: U.S. Department of Justice, Bureau of Justice Statistics, School Crime Supplement to the National Crime Victimization Survey, 2015.