Embed Size (px)
Citation preview

Measuring Resilience at USAID
Tiffany M. Griffin, PhD
TOPS Knowledge Sharing Meeting Washington DC July 10, 2014

Defining and Conceptualizing
Resilience
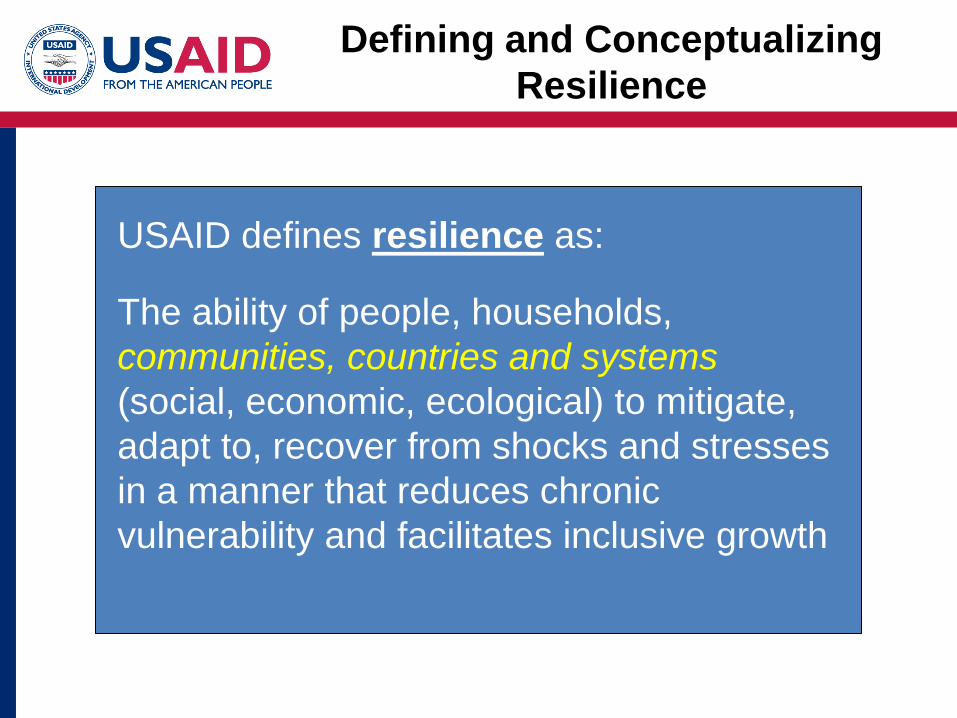
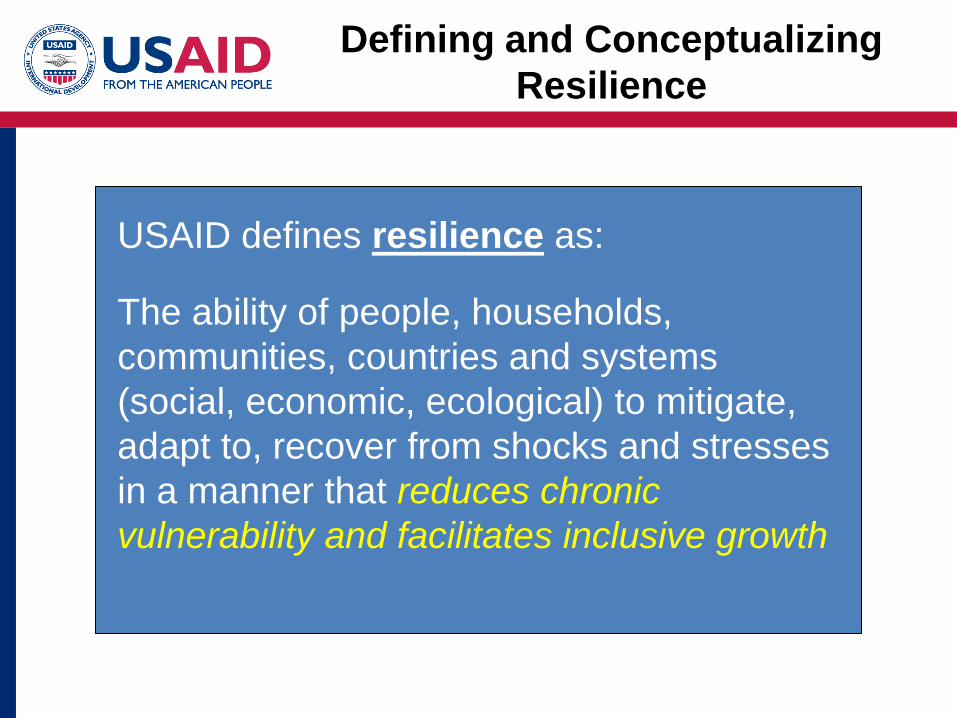
USAID defines resilience as:
The ability of people, households,
communities, countries and systems
(social, economic, ecological) to mitigate,
adapt to, recover from shocks and stresses
in a manner that reduces chronic
vulnerability and facilitates inclusive growth

Defining and Conceptualizing
Resilience
USAID defines resilience as:
The ability of people, households,
communities, countries and systems
(social, economic, ecological) to mitigate,
adapt to, recover from shocks and stresses
in a manner that reduces chronic
vulnerability and facilitates inclusive growth
Measuring Resilience: Topline
Outcome Indicators
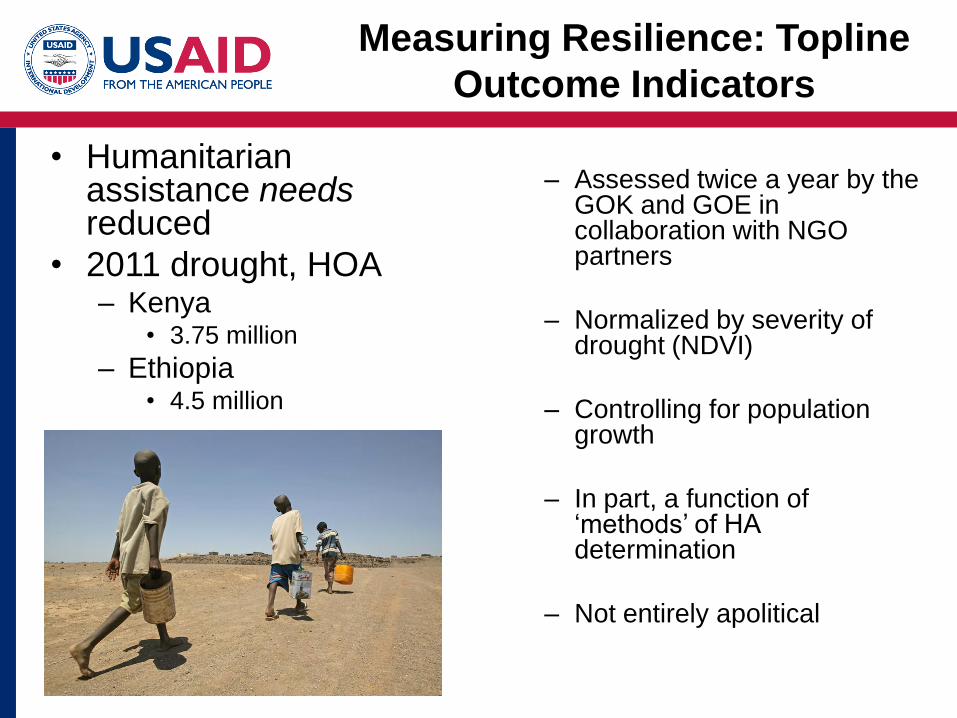
• Humanitarian assistance needs reduced
Measuring Resilience: Topline
Outcome Indicators
• Humanitarian assistance needs reduced
• 2011 drought, HOA – Kenya
• 3.75 million
– Ethiopia • 4.5 million
– Assessed twice a year by the GOK and GOE in collaboration with NGO partners
– Normalized by severity of drought (NDVI)
– Controlling for population growth
– In part, a function of ‘methods’ of HA determination
– Not entirely apolitical

Measuring Resilience: Topline
Outcome Indicators
• Humanitarian assistance needs
– Normalized by severity of drought (NDVI)
– Controlling for population growth
– In part, a function of ‘methods’ of HA determination
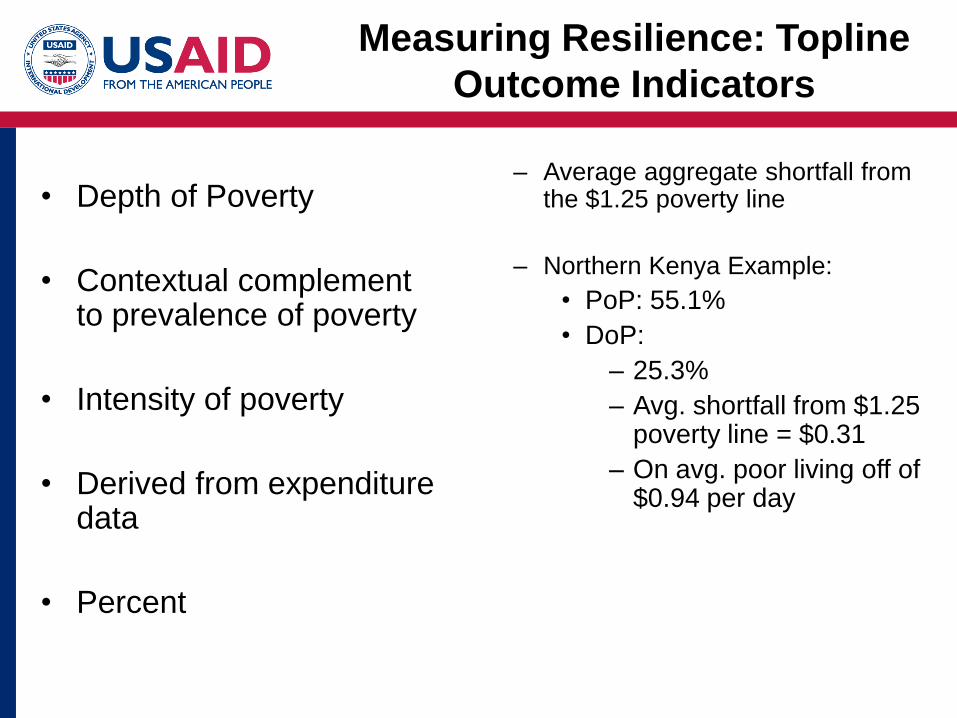
• Depth of Poverty (DoP)
Measuring Resilience: Topline
Outcome Indicators
• Depth of Poverty
• Contextual complement to prevalence of poverty
• Intensity of poverty
• Derived from expenditure data
• Percent
– Average aggregate shortfall from the $1.25 poverty line
– Northern Kenya Example:
• PoP: 55.1%
• DoP:
– 25.3%
– Avg. shortfall from $1.25 poverty line = $0.31
– On avg. poor living off of $0.94 per day
Measuring Resilience: Topline
Outcome Indicators
• Humanitarian assistance needs
– Normalized by severity of drought (NDVI)
– Controlling for population growth
– In part, a function of ‘methods’ of HA determination
• Depth of Poverty (DoP)
– Contextual complement to Poverty Prevalence
• Global Acute Malnutrition (GAM)
Measuring Resilience: Topline
Outcome Indicators
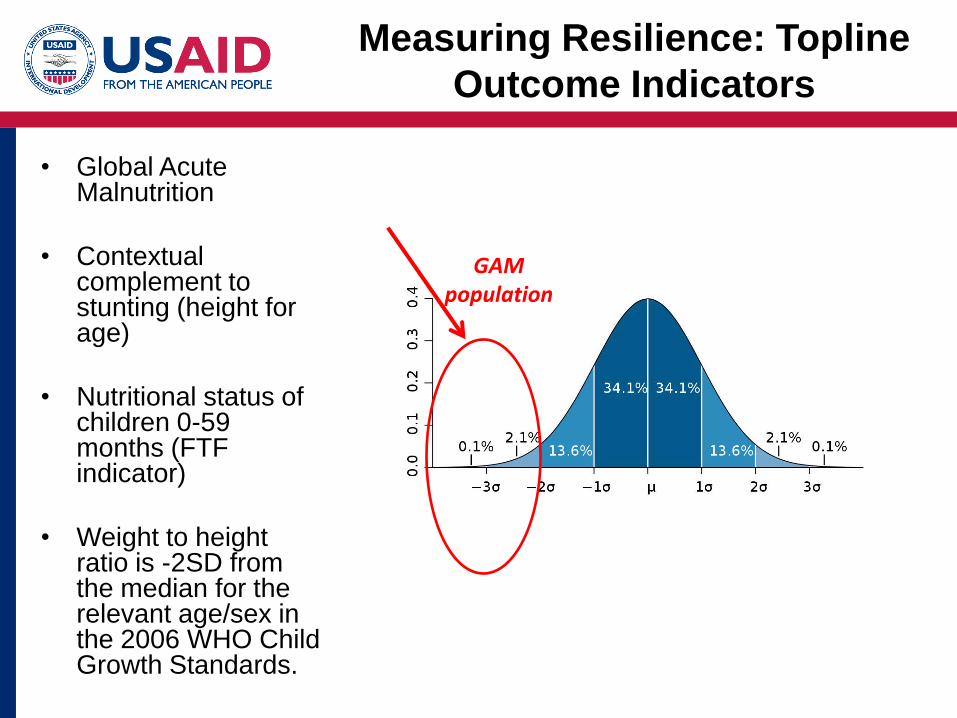
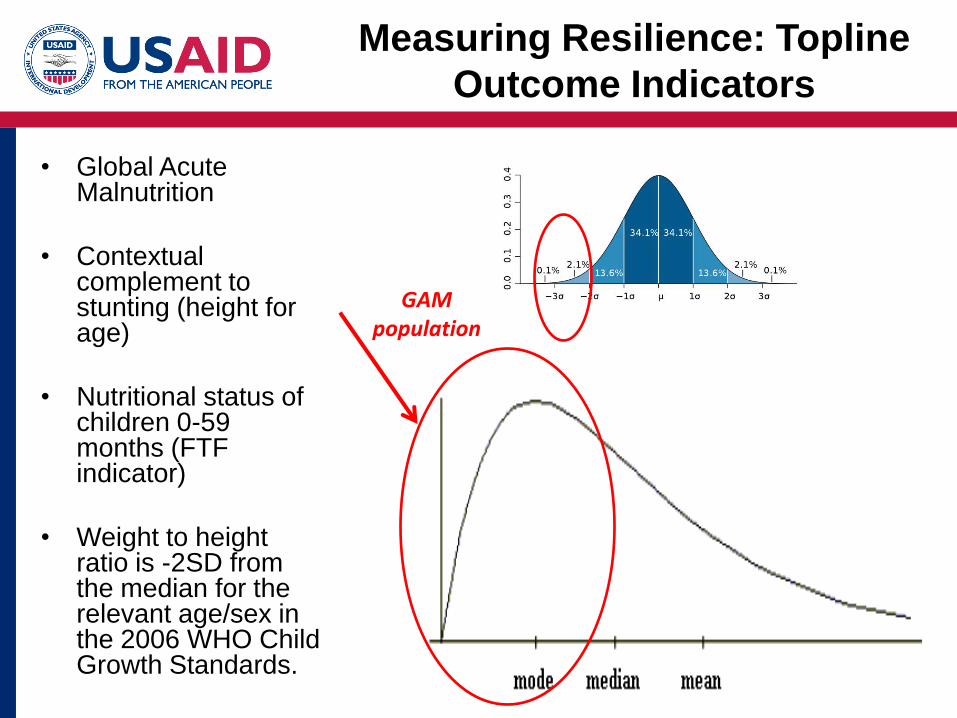
• Global Acute Malnutrition
• Contextual complement to stunting (height for age)
• Nutritional status of children 0-59 months (FTF indicator)
• Weight to height ratio is -2SD from the median for the relevant age/sex in the 2006 WHO Child Growth Standards.
GAM population
Measuring Resilience: Topline
Outcome Indicators
GAM population
• Global Acute Malnutrition
• Contextual complement to stunting (height for age)
• Nutritional status of children 0-59 months (FTF indicator)
• Weight to height ratio is -2SD from the median for the relevant age/sex in the 2006 WHO Child Growth Standards.
Measuring Resilience: Topline
Outcome Indicators
• Humanitarian assistance needs
– Normalized by severity of drought (NDVI)
– Controlling for population growth
– In part, a function of ‘methods’ of HA determination
• Depth of Poverty (DoP)
– Contextual complement to Poverty Prevalence
• Global Acute Malnutrition (GAM)
– Contextual complement to Stunting
• Moderate to Severe Hunger (HHS)
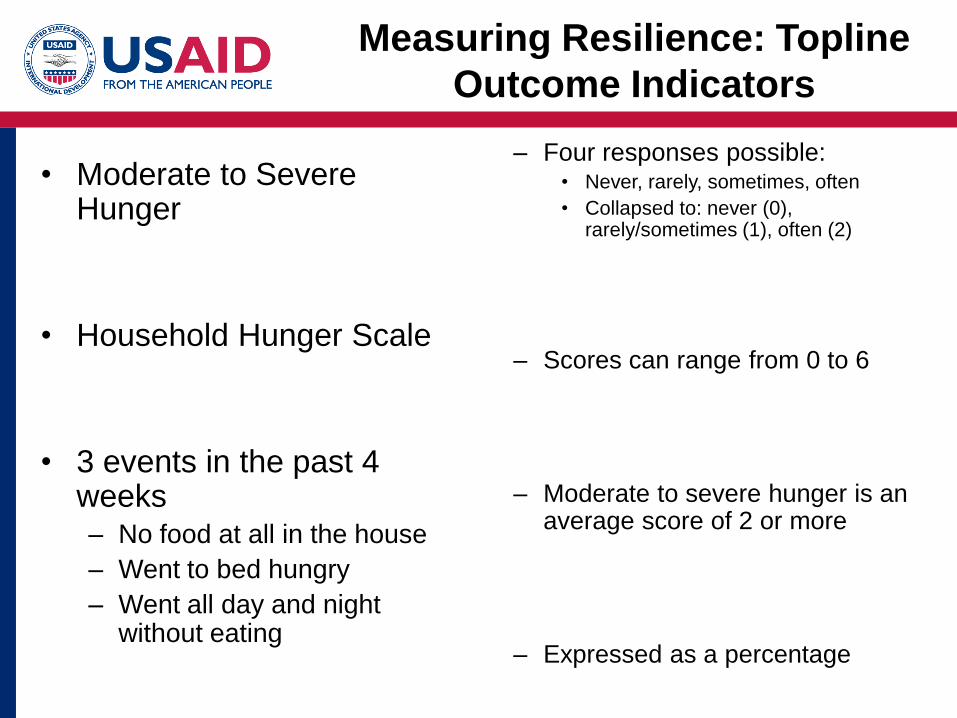
Measuring Resilience: Topline
Outcome Indicators
• Moderate to Severe Hunger
• Household Hunger Scale
• 3 events in the past 4 weeks – No food at all in the house
– Went to bed hungry
– Went all day and night without eating
– Four responses possible: • Never, rarely, sometimes, often
• Collapsed to: never (0), rarely/sometimes (1), often (2)
– Scores can range from 0 to 6
– Moderate to severe hunger is an average score of 2 or more
– Expressed as a percentage
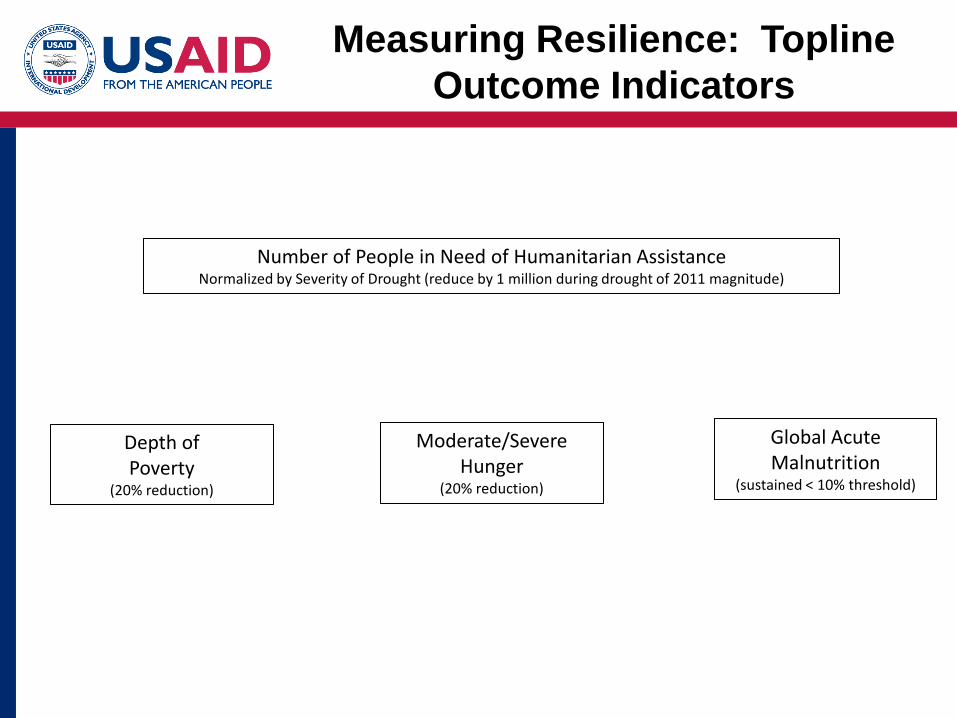
Depth of Poverty
(20% reduction)
Moderate/Severe Hunger
(20% reduction)
Global Acute Malnutrition
(sustained < 10% threshold)
Number of People in Need of Humanitarian Assistance Normalized by Severity of Drought (reduce by 1 million during drought of 2011 magnitude)
Measuring Resilience: Topline
Outcome Indicators

Measuring Resilience
Fundamental Question: How do you
measure “resilience” in the absence of a
shock or stressor?

Measuring Resilience: Capacities
Through Capacities

Measuring Resilience: Capacities
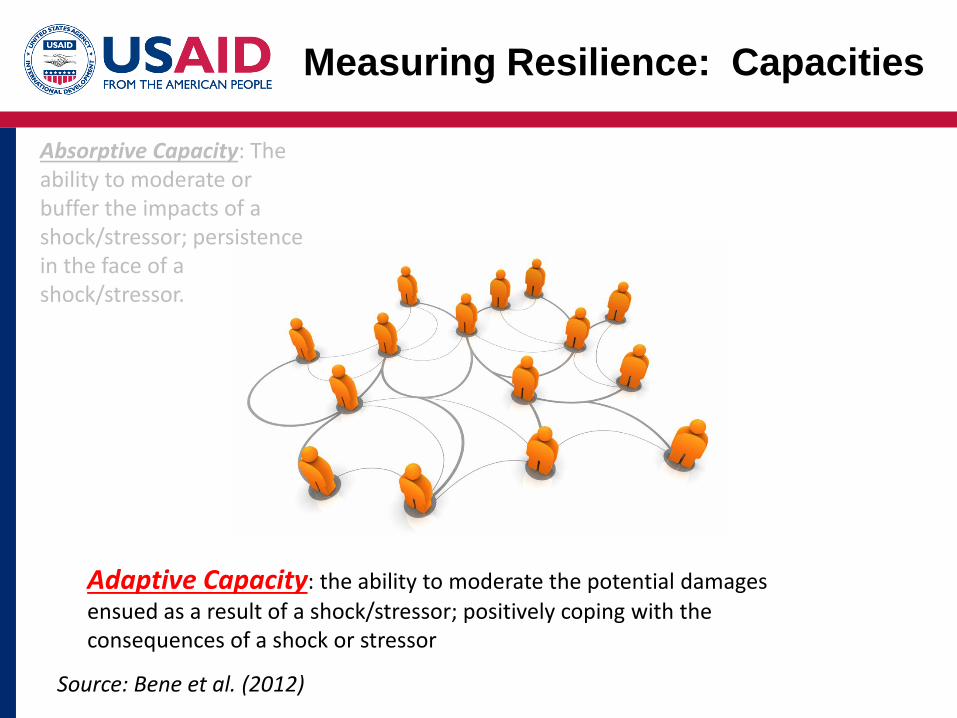
Absorptive Capacity:
the ability to moderate or buffer the impacts of a shock/stressor; persistence in the face of a shock/stressor.
Source: Bene et al. (2012)
Measuring Resilience: Capacities
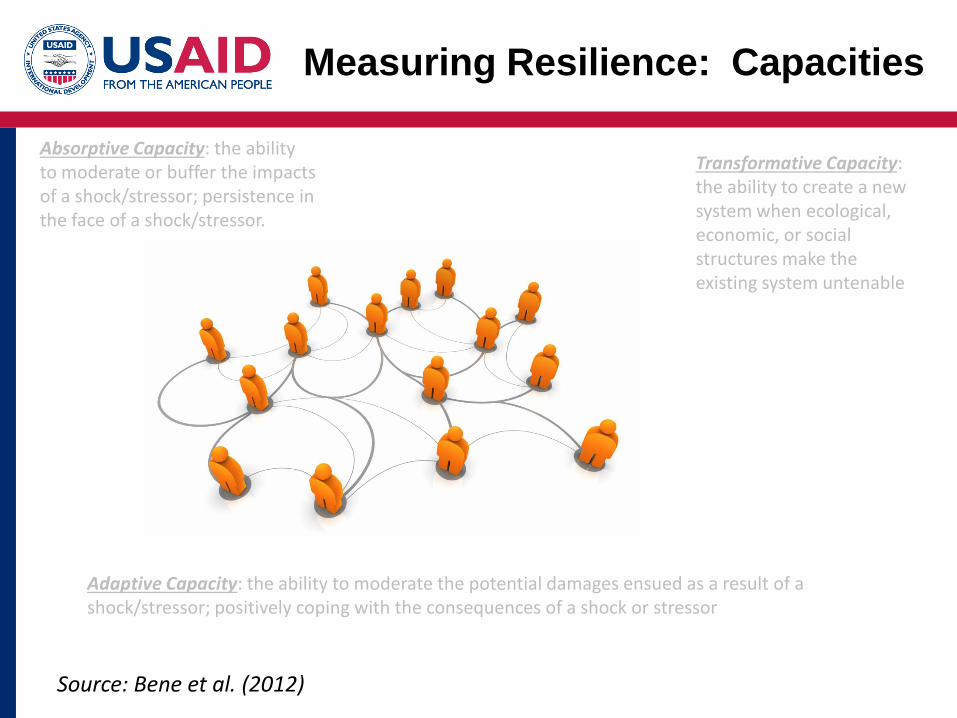
Absorptive Capacity: The ability to moderate or buffer the impacts of a shock/stressor; persistence in the face of a shock/stressor.
Adaptive Capacity: the ability to moderate the potential damages
ensued as a result of a shock/stressor; positively coping with the consequences of a shock or stressor
Source: Bene et al. (2012)

Measuring Resilience: Capacities
Absorptive Capacity: the ability to moderate or buffer the impacts of a shock/stressor; persistence in the face of a shock/stressor.
Adaptive Capacity: the ability to moderate the potential damages ensued as a result of a shock/stressor; positively coping with the consequences of a shock or stressor
Source: Bene et al. (2012)
Transformative Capacity: the
ability to create a new system when ecological, economic, or social structures make the existing system untenable
Measuring Resilience: Capacities
Absorptive Capacity: the ability to moderate or buffer the impacts of a shock/stressor; persistence in the face of a shock/stressor.
Adaptive Capacity: the ability to moderate the potential damages ensued as a result of a shock/stressor; positively coping with the consequences of a shock or stressor
Source: Bene et al. (2012)
Transformative Capacity: the ability to create a new system when ecological, economic, or social structures make the existing system untenable
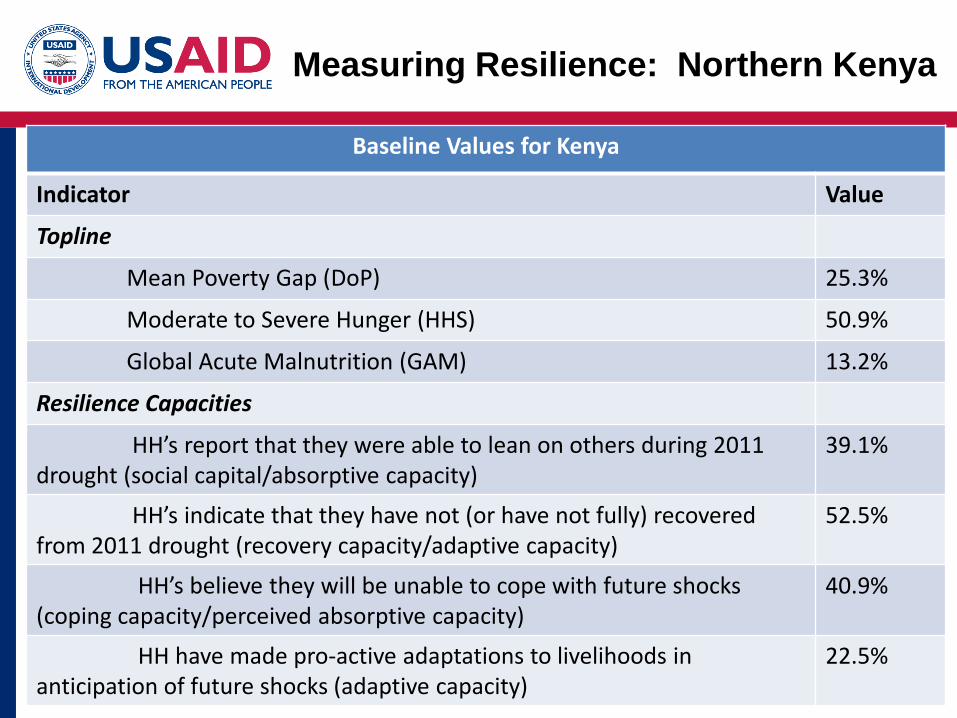
Baseline Values for Kenya
Indicator Value
Topline
Mean Poverty Gap (DoP) 25.3%
Moderate to Severe Hunger (HHS) 50.9%
Global Acute Malnutrition (GAM) 13.2%
Resilience Capacities
HH’s report that they were able to lean on others during 2011 drought (social capital/absorptive capacity)
39.1%
HH’s indicate that they have not (or have not fully) recovered from 2011 drought (recovery capacity/adaptive capacity)
52.5%
HH’s believe they will be unable to cope with future shocks (coping capacity/perceived absorptive capacity)
40.9%
HH have made pro-active adaptations to livelihoods in anticipation of future shocks (adaptive capacity)
22.5%
Measuring Resilience: Northern Kenya
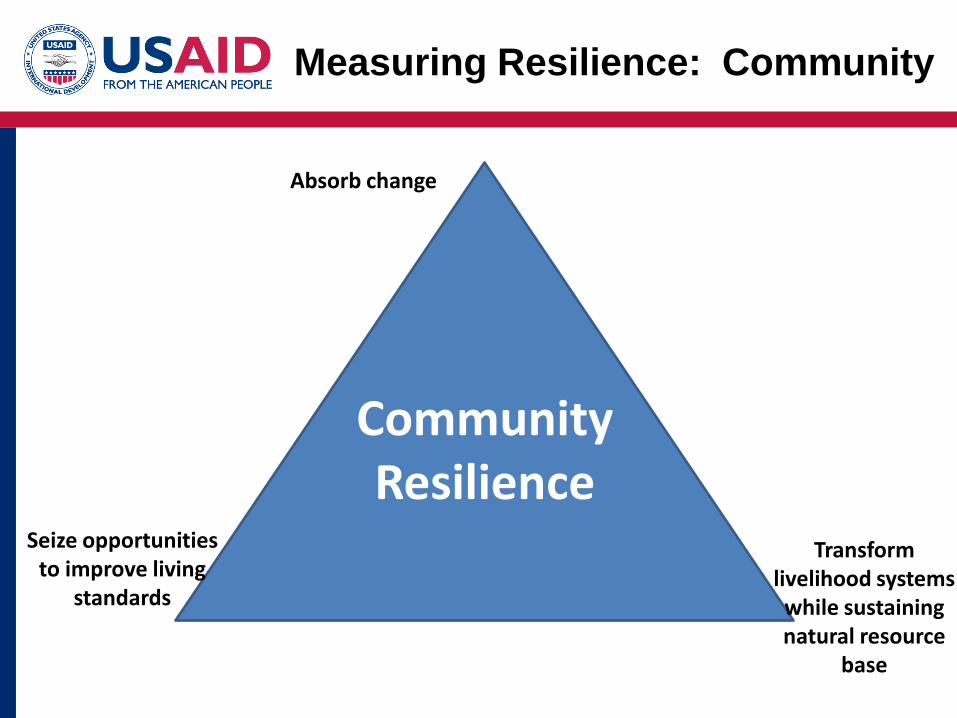
Measuring Resilience: Community
Community Resilience
Absorb change
Seize opportunities to improve living
standards
Transform livelihood systems
while sustaining natural resource
base
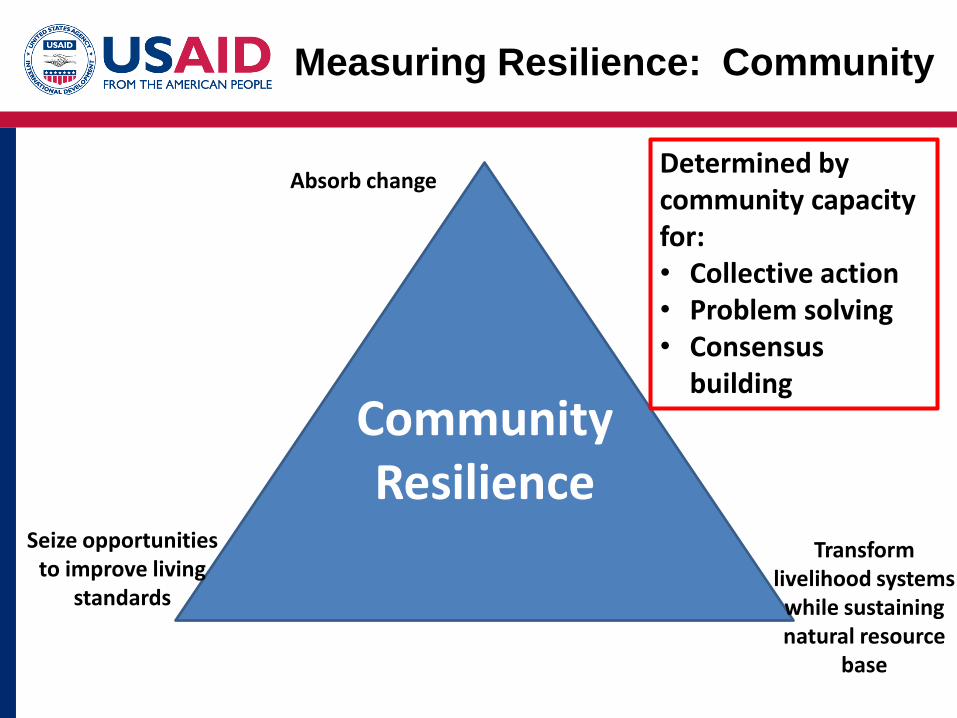
Measuring Resilience: Community
Community Resilience
Absorb change
Seize opportunities to improve living
standards
Transform livelihood systems
while sustaining natural resource
base
Determined by community capacity for: • Collective action • Problem solving • Consensus
building

Measuring Resilience: Community
Community Resilience
• Examples from PRIME Impact Evaluation
– Community characteristics
• Population size, ethnic group make up, number of
cropping seasons, livestock water sources
– Community infrastructure, services, and access
• Water, electricity, telephone, roads, transportation,
housing, schools, health services, vet/animal services,
ag-extension, markets, security, credit
– Community organizations
• Group activity, group participation
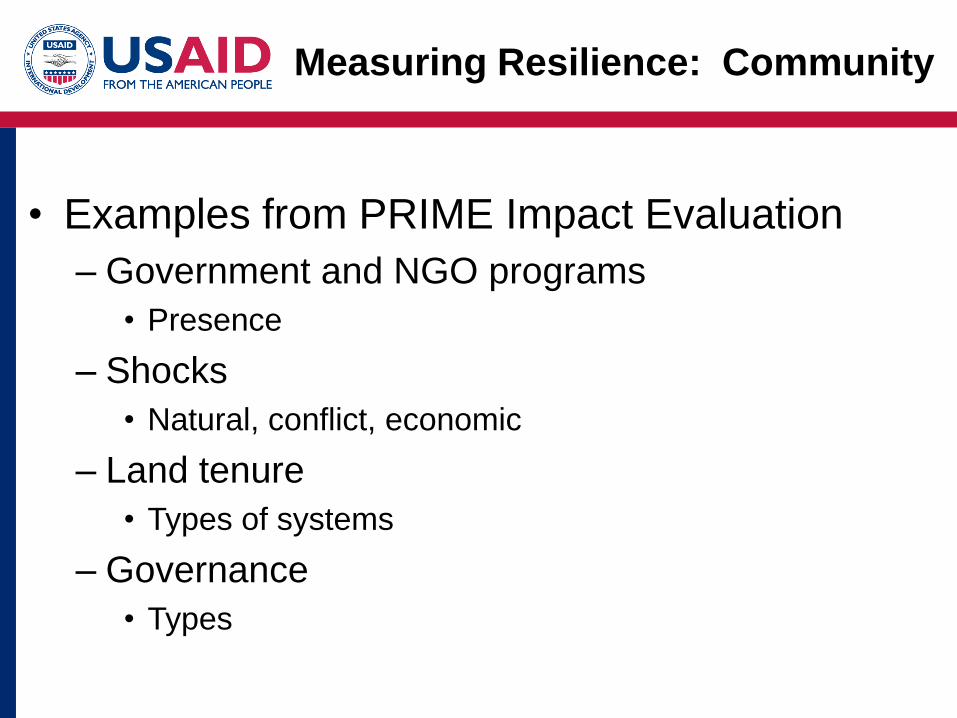
Measuring Resilience: Community
Community Resilience
• Examples from PRIME Impact Evaluation
– Government and NGO programs
• Presence
– Shocks
• Natural, conflict, economic
– Land tenure
• Types of systems
– Governance
• Types

• Northern Kenya Baseline Report
• Topline Indicator Baseline Values for Ethiopia are Being Calculated
• PRIME Impact Evaluation Baseline Report
• Multi-level PRIME Impact Evaluation Analysis
• Identification of Intermediate Outcome Indicators
• Horn of Africa JPC Baseline Analysis
• Measurement in the SAHEL
29
Measuring Resilience: Next Steps

30
Measuring Resilience: Some Resources
• Food Security Information Network (FSIN) Resilience Measurement TWG: a forum for thought leadership and consensus building: http: //www.fsincop.net
• Resilience Measurement Principles Technical Paper: http://www.fsincop.net/resource-centre/detail/en/c/213177/
• Enhancing Resilience to Food Security Shocks in Africa: http://www.fsnnetwork.org/sites/default/files/discussion_paper_usaid_dfid_wb_nov._8_2012.pdf
• Resilience IDS Working Paper: https://www.ids.ac.uk/files/dmfile/Wp405.pdf
• Agrilinks: – Community Resilience Measurement Paper:
http://agrilinks.org/sites/default/files/resource/files/FTF%20Learning_Agenda_Community_Resilience_Oct%202013.pdf
– It’s All About M & E Blog
• Psychosocial Measures: http://agrilinks.org/blog/expanding-our-monitoring-and-evaluation-measures
• Nested Models: http://agrilinks.org/blog/applying-more-rigor-resilience-nested-models
• Mixed Methods: http://agrilinks.org/blog/kindred-spirits-talk-resilience-measurement
• Depth of Poverty: http://agrilinks.org/blog/making-greatest-pro-poor-impact-let%E2%80%99s-go-beyond-counting-heads
• Resilience Measurement Principles: http://agrilinks.org/blog/why-evidence-based-resilience-measurement-more-important-ever

32
3. INDICATOR: Depth of poverty
REQUIRED FOR ALL TITLE II DEVELOPMENT FOOD ASSISTANCE PROGRAMS; REQUIRED IF APPLICABLE FOR ECONOMIC RESILIENCE PROGRAMS
SPS LOCATION: Objective 4: Economic Growth
INITIATIVE AFFILIATION: FTF – IR 5: Increased Resilience of Vulnerable Communities and Households
INDICATOR TITLE: Depth of Poverty: The mean aggregate consumption shortfall relative to the $1.25 poverty line.
DEFINITION:
This indicator measures the depth of poverty in relation to the $1.25 expenditures per person per day poverty threshold. The depth of
poverty variable is calculated by subtracting each household’s per capita expenditure value from the poverty threshold of $1.25 to obtain
the household shortfall from the poverty line. Households that have per capita expenditure values that are above the poverty threshold are
assigned a shortfall of zero. The household shortfall is then multiplied by the number of household members to obtain the total shortfall
for all household members. The total shortfall for all household members are summed across all households, and then divided by the total
number of household members in the sample household. This value is divided by the $1.25 poverty threshold and multiplied by 100 to
obtain the depth of poverty for the targeted project area expressed as a percent of the $1.25 per person per day poverty line.
When calculating this indicator, the applicable poverty line is $1.25 dollars per person per day, converted into local currency at 2005
“Purchasing Power Parity” (PPP) exchange rates then inflated to the equivalent local currency value at the time of the population-based
survey. The use of PPP exchange rates ensures that the poverty line applied in each country has the same purchasing power.
Note: The depth of poverty indicator is a complement to the prevalence of poverty indicator. Both indicators are necessary to obtain a
complete picture of the poverty situation in geographic area. Because many food assistance beneficiaries are likely to be below the poverty
threshold following an intervention, the prevalence of poverty might remain high following the program intervention. However, the
intensity of poverty may decrease for many beneficiaries over the course of program implementation. To help assess such changes among
the poor, the depth of poverty gives an indication of severity or intensity of poverty at a given point in time.
Depth of Poverty PIRS (I)

33
UNIT: Percent
DISAGGREGATE BY:
Gendered Household Type:
1. Male and Female Adults (M&F)
2. Adult Female no Adult Male (FNM)
3. Adult Male no Adult Female Adult (MNF)
4. Child no Adults (CNA)
TYPE (OUTCOME/IMPACT):
Impact
DIRECTION OF CHANGE:
Lower is better
DATA SOURCE:
Population-based survey (see “Measurement Notes”).
FOREIGN ASSISTANCE STANDARDIZED PROGRAM STRUCTURE (SPS): n/a
MEASUREMENT NOTES:
LEVEL of COLLECTION? This indicator should be collected in the FTF Zone of Influence for countries with FFP program areas through
household surveys or via secondary data sources. Economic resilience projects should use project-level data.
WHO COLLECTS DATA FOR THIS INDICATOR? M & E contractors will collect these data in the project target area.
HOW SHOULD THEY BE COLLECTED? M & E contractors will conduct population-based surveys in the targeted project area using the
LSMS methodology and Module E. Household Consumption Expenditure from the Feed the Future M&E Guidance Series Volume 8:
Population-Based Survey Instrument.
FREQUENCY OF COLLECTION? Indicator data will be collected in baseline and final evaluations via a population-based survey.
Depth of Poverty PIRS (II)
34
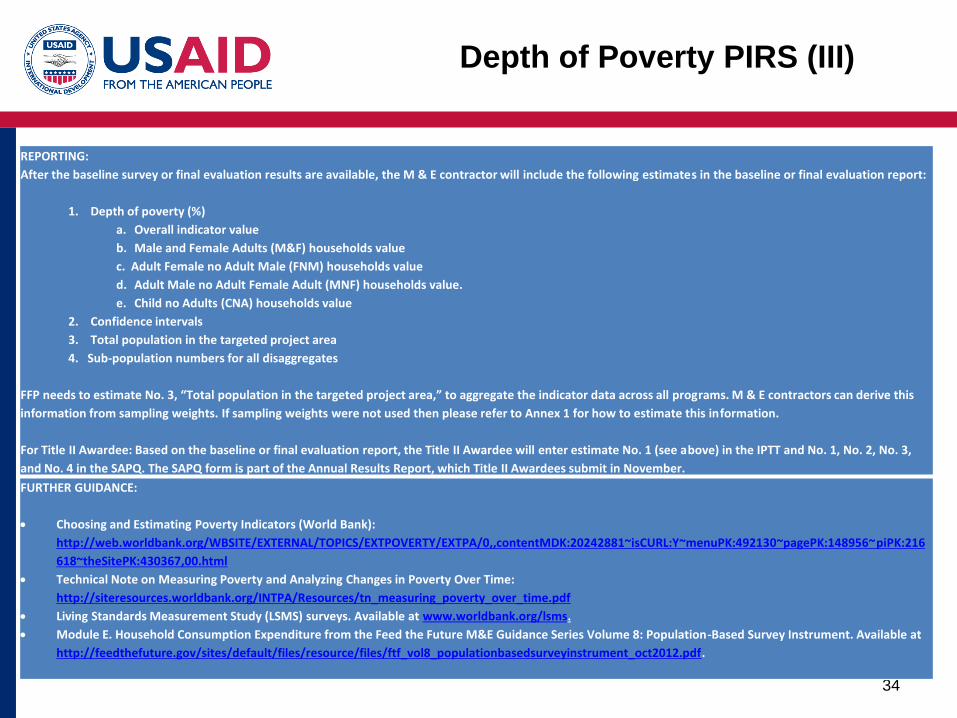
Depth of Poverty PIRS (III)
REPORTING:
After the baseline survey or final evaluation results are available, the M & E contractor will include the following estimates in the baseline or final evaluation report:
1. Depth of poverty (%)
a. Overall indicator value
b. Male and Female Adults (M&F) households value
c. Adult Female no Adult Male (FNM) households value
d. Adult Male no Adult Female Adult (MNF) households value.
e. Child no Adults (CNA) households value
2. Confidence intervals
3. Total population in the targeted project area
4. Sub-population numbers for all disaggregates
FFP needs to estimate No. 3, “Total population in the targeted project area,” to aggregate the indicator data across all programs. M & E contractors can derive this
information from sampling weights. If sampling weights were not used then please refer to Annex 1 for how to estimate this information.
For Title II Awardee: Based on the baseline or final evaluation report, the Title II Awardee will enter estimate No. 1 (see above) in the IPTT and No. 1, No. 2, No. 3,
and No. 4 in the SAPQ. The SAPQ form is part of the Annual Results Report, which Title II Awardees submit in November.
FURTHER GUIDANCE:
Choosing and Estimating Poverty Indicators (World Bank):
http://web.worldbank.org/WBSITE/EXTERNAL/TOPICS/EXTPOVERTY/EXTPA/0,,contentMDK:20242881~isCURL:Y~menuPK:492130~pagePK:148956~piPK:216
618~theSitePK:430367,00.html
Technical Note on Measuring Poverty and Analyzing Changes in Poverty Over Time:
http://siteresources.worldbank.org/INTPA/Resources/tn_measuring_poverty_over_time.pdf
Living Standards Measurement Study (LSMS) surveys. Available at www.worldbank.org/lsms.
Module E. Household Consumption Expenditure from the Feed the Future M&E Guidance Series Volume 8: Population-Based Survey Instrument. Available at
http://feedthefuture.gov/sites/default/files/resource/files/ftf_vol8_populationbasedsurveyinstrument_oct2012.pdf.

35
Household Hunger Scale PIRS (I)
SPS LOCATION: Objective 3: Investing in People
INITIATIVE AFFILIATION: FTF - IR 5: Increased resilience of vulnerable communities and households
INDICATOR TITLE: 3.1.9.1-3 and 4.7-4 Prevalence of households with moderate or severe hunger (RiA)
DEFINITION:
This indicator measures the percent of households experiencing moderate or severe hunger, as indicated by a score of 2 or more on the household hunger scale
(HHS). To collect data for this indicator, respondents are asked about the frequency with which three events were experienced by household members in the last four
weeks: 1. no food at all in the house; 2. went to bed hungry, 3. went all day and night without eating. For each question, four responses are possible (never, rarely,
sometimes or often), which are collapsed into the follow three responses: never (value=0), rarely or sometimes (value=1), often (value=2). Values for the three
questions are summed for each household, producing a HHS score ranging from 0 to 6.
The numerator for this indicator is the total number of households in the sample with a score of 2 or more on the HHS. The denominator is the total number of
households in the sample with HHS data.
RATIONALE:
Measurement of household hunger provides a tool to monitor global progress of USG supported food security initiatives. A decrease in household hunger is also a
reflection of improved household resilience. The indicator has been validated to be meaningful for cross-cultural use using data sets from seven diverse sites.
UNIT:
Please enter these two data points for the overall indicator and for
each disaggregate category. Enter the total number of households
covered by the indicator under the overall indicator, and enter the
number of households covered by each disaggregate for the
disaggregate categories:
1. percent of households in sample with moderate to severe
hunger
2. total number of households in zone of influence
DISAGGREGATE BY:
Gendered Household type: Adult Female no Adult Male (FNM), Adult Male no Adult Female
(MNF), Male and Female Adults (M&F), Child No Adults (CNA)
TYPE:
Impact
DIRECTION OF CHANGE:
Lower is better
36
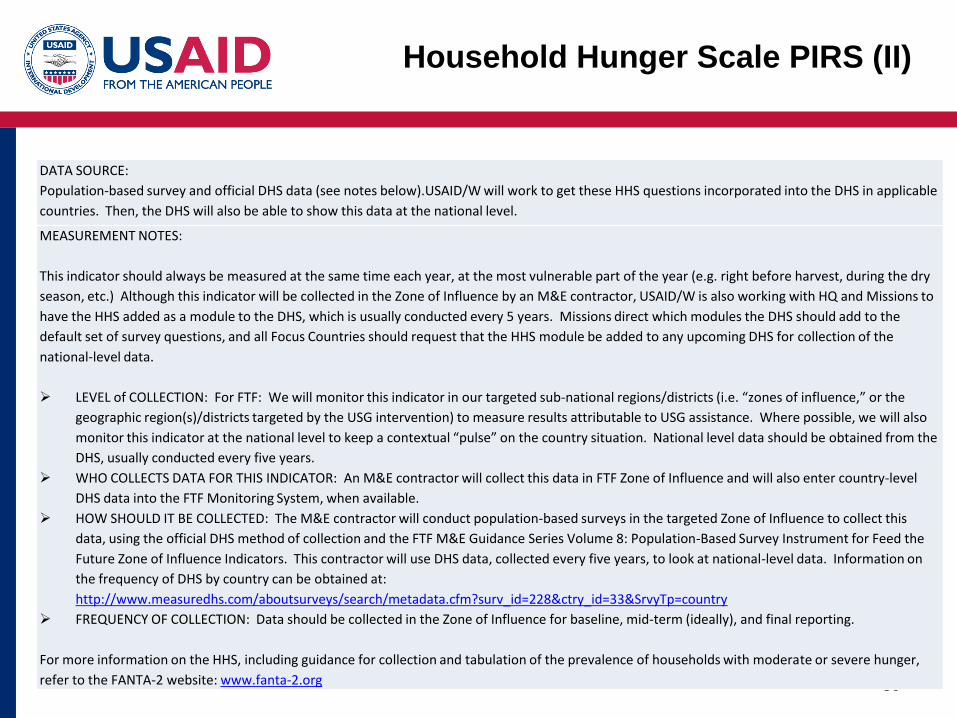
Household Hunger Scale PIRS (II)
DATA SOURCE:
Population-based survey and official DHS data (see notes below).USAID/W will work to get these HHS questions incorporated into the DHS in applicable
countries. Then, the DHS will also be able to show this data at the national level.
MEASUREMENT NOTES:
This indicator should always be measured at the same time each year, at the most vulnerable part of the year (e.g. right before harvest, during the dry
season, etc.) Although this indicator will be collected in the Zone of Influence by an M&E contractor, USAID/W is also working with HQ and Missions to
have the HHS added as a module to the DHS, which is usually conducted every 5 years. Missions direct which modules the DHS should add to the
default set of survey questions, and all Focus Countries should request that the HHS module be added to any upcoming DHS for collection of the
national-level data.
LEVEL of COLLECTION: For FTF: We will monitor this indicator in our targeted sub-national regions/districts (i.e. “zones of influence,” or the
geographic region(s)/districts targeted by the USG intervention) to measure results attributable to USG assistance. Where possible, we will also
monitor this indicator at the national level to keep a contextual “pulse” on the country situation. National level data should be obtained from the
DHS, usually conducted every five years.
WHO COLLECTS DATA FOR THIS INDICATOR: An M&E contractor will collect this data in FTF Zone of Influence and will also enter country-level
DHS data into the FTF Monitoring System, when available.
HOW SHOULD IT BE COLLECTED: The M&E contractor will conduct population-based surveys in the targeted Zone of Influence to collect this
data, using the official DHS method of collection and the FTF M&E Guidance Series Volume 8: Population-Based Survey Instrument for Feed the
Future Zone of Influence Indicators. This contractor will use DHS data, collected every five years, to look at national-level data. Information on
the frequency of DHS by country can be obtained at:
http://www.measuredhs.com/aboutsurveys/search/metadata.cfm?surv_id=228&ctry_id=33&SrvyTp=country
FREQUENCY OF COLLECTION: Data should be collected in the Zone of Influence for baseline, mid-term (ideally), and final reporting.
For more information on the HHS, including guidance for collection and tabulation of the prevalence of households with moderate or severe hunger,
refer to the FANTA-2 website: www.fanta-2.org