Embed Size (px)
Citation preview

Measuring quality & health outcomes in
medical schemes:
Methodology, Criterion and Technical
specification
Research & Monitoring Unit
Table of Contents
Abbreviations ................................................................................................................................................. 4
1.1 Introduction ........................................................................................................................................ 2
1.2 Conceptual Framework: Quality Health Outcomes ............................................................................ 2
1.3 Objectives of measuring Quality Health Outcomes in Medical Schemes .......................................... 3
1.4 Legislative requirement ..................................................................................................................... 3
2. Objectives of the study ........................................................................................................................... 4
3. Methodology ........................................................................................................................................... 4
3.1 Literature review and expert consultation ...................................................................................... 4
3.2 Criterion for selecting ideal quality and health outcomes indicators .............................................. 4
4. Adjustments for case- mix ..................................................................................................................... 5
5. Limitations of quality and clinical health outcomes indicators .............................................................. 5
6. References .............................................................................................................................................. 7
7. Annexure A .......................................................................................................................................... 12
Abbreviations
PMBs: Prescribe minimum benefits
CMS: Council for Medical Schemes
CDL: Chronic Disease List
MSA: Medical Schemes Act
DSP: Designated Service Provider
BMI: Body Mass Index
NDoH: National Department of Health
WHO: World Health Organisation
OECD: Organisation for Economic Co-operation and Development
CDCP: Disease Control and Prevention
IQ: Intelligence Quotient
HQA: Health Quality Assessment
NEPAD: New Partnership for Africa`s Development
R&M: Research and Monitoring
MDG: Millennium Development Goals
HIV/Aids: Human Immunodeficiency Virus/Acquired Immune Deficiency
UNICEF: United Nations Children's Fund
NHI: National Health Insurance
1.1 Introduction
There are a number of policy initiatives of the Department of Health that increase the need for
some form of independent measurement of the quality of health care received by members of
medical schemes. Also medical scheme need to demonstrate their value within private health care
including efficient and effective management of patient disease leading to better health care
outcomes.
1.2 Conceptual Framework: Quality Health Outcomes
Quality measures cover a large range of indicators, these indicators range from crude measures
(such as unadjusted mortality rates) to more refined measures (such as readmission rates or
proportion of the population using asthma medications to achieve better asthma control etc.).
Although a full range of measures is essential for a complete picture of health care quality
afforded to the population, specific process measures are also needed to guide the health care
team in improving quality of care.
For example, the number of deaths related to asthma at a hospital can suggest poor quality of
treatment at that hospital, but knowing the number of deaths alone does not tell the entire story
which is why process measures are as important as outcome measures in determining quality of
care.
Process measures: often reflect evidence-based guidelines of care for specific conditions. They
are generally considered to be within the control of the provider and, therefore, are performance
indicators. Also process measures are more likely to reveal actions that can be taken to improve
quality. Whilst outcome measures frequently relate to patient health status. Better outcomes are
the ultimate objective of quality improvement, for example, lowers mortality, lower
hospitalization rates, or better test results. The indicators listed in this document combine both
process and outcome measures. Please refer to annexure A for the definition and technical
specification of the select list of indicators.
1.3 Objectives of measuring Quality Health Outcomes in Medical Schemes
Health quality and outcomes measurement enables proper judgements to be made about the
performance of a health system. Quality and health outcome measurements are some of the
central components in any attempts to effectively ascertain the contribution made by medical
schemes into national health policy objectives. The absence of quality and health outcomes
measures creates a gap in understanding the health financing and health care provision roles of
medical schemes.
Presenting data on quality and health outcomes achieves the following key objectives:
Consumers would be better empowered to make comparisons between different medical
scheme products and choose appropriately
Medical schemes and other purchasers of health care services would be able to assess the
performance of different providers who serve their members
Health provider facility managers would have information that would assist in
benchmarking performance relative to other similar providers
It would enable policy makers to monitor performance of the health system and intervene
in a timely manner should there be a need to do so.
The absence of measures for quality and health outcomes in the medical schemes environment
also implies that there is no mechanism to track the effect of treatments that might have adverse
results on beneficiaries. As a result, it may be difficult to monitor medical errors, in-hospital
infections, disease outbreaks and other epidemiological trends that may require intervention.
1.4 Legislative requirement
Section 7 (c) of the Medical Schemes Act outlines the function of the Council to also include “
...making recommendations to the Minister on criteria for the measurement of quality and
outcomes of the relevant health services provided for by medical schemes....” Furthermore
Section 7 (e) mandates “collection and dissemination information about performance of private
health care”.
It is therefore envisaged that the health and quality outcomes framework will enable realisation
of the sections mentioned above.
2. Objectives of the study
The specific objective of the project is as follows:
To develop am framework for measuring quality and health outcomes in the medical
schemes industry
To identify a select list of indicators to measure quality and outcomes in medical schemes
3. Methodology
3.1 Literature review and expert consultation
The study is mainly literature review and expert consultation based on the select list of quality
and outcomes indicators. Literature review is be based on bibliographic database search of
relevant sources for the selected indicators and thereafter a consultative process to get experts
opinion to complement the knowledge of quality and outcomes indicators obtained from the
literature review. For the consultative process, a research methodology known as the Delphi
Method will be employed (Goodman CM, 1987; Linstone & Turrof, 1975). The Delphi Method
requires the formation of an interactive panel of experts. These experts will be selected on the
basis of their background in the industry and their willingness to share their expertise and work
towards a resolution to select few ideal quality and outcomes indicators. We assume that the
process of collecting quality and outcomes indicators for the private sector to be a collaborative,
iterative, developmental program for progressing towards a routine collection of consistent set of
quality of care and health outcome indicators.
3.2 Criterion for selecting ideal quality and health outcomes indicators
This section seeks to address key aspects of selecting quality and health outcomes indicators; the
purpose is to use these criterions when selecting the indicators. It is of great importance to
conceptualise what is that is being measured. For the purpose of this section we address the
following two principles.
The question of what dimension of quality to measure
The how dimension of measuring such indicators
Kelly & Hurst states that the how principles of measuring quality should address both the process
and outcome measures. They further states that the indicators should address the following three
criterions (Kelly and Hurst, 2006):
The importance of what is being measured
o The measure should have an impact of disease or risk on health/ expenditure
o The measure should also have relevance to policy, i.e. policy makers should be
able to make decisions on such measure in order to improve health systems.
The scientific soundness of the measure
o Validity: The quality measure should make sense logically and clinically (face
validity), it should also correlate well with other measures of the same aspects of
the quality of care (construct validity) and lastly should capture meaningful aspects
of the quality of care (content validity) (Carmines and Zeller, 1991).
o Reliability: The measure should produce consistent results when repeated in the
same population and settings.
o Explicitness of the evidence base: There should be a clearly documented scientific
foundation for the measure in the literature.
The feasibility/cost of obtaining the data
o International comparative measure should exist and characteristics differences
between medical schemes/ providers should be taken into account international
comparative figures
Thus, the select set of quality and outcomes indicators were subject based on the above three
criterion.
4. Adjustments for case- mix
In ensuring that the data is comparable, prognostic factors will be identified in relation to the
defined standards and indicators. The prognostic factors will be used as underlying factors or
explanatory variables to adjust for case-mix. This is critical to evaluate whether the outcome,
either favourable or not is due to health systems or due to the mix of diseases and conditions.
5. Limitations of quality and clinical health outcomes indicators
The complexity underlying the process collecting and interpreting quality indicators should not be
underestimated. Even apparently simple indicators require in-depth analysis of competing
operational definitions and generation of an agreed, detailed operational definition preferably
supported by written, clarification and problem-solving guides (Boyce et al., 1997). Clinical
outcome indicators can provide insights into quality of care and highlight variations in outcome
worthy of further investigation. Limitations thereof are that the information that can be drawn
from some indicators does not always include the beneficiary’s views about outcome. Other
limitations of clinical outcomes are that they do not necessary provide definitive proof about

performance or quality of care (Minnion et al., 2001). Outcomes data should be used as a
guideline or standards and should also be a relative measure assessing the perceived ill-practice
by a provider, they need to be interpreted with cautions as they may be influenced by multi-
underlying factors that are not necessarily explained by the data.
6. References
Boyce N., McNeil J., Graves D. and Dunt D. 1997. Quality and Outcome Indicators for Acute
Healthcare Services. Australian Government Publishing Service, Canberra.
Council for Medical Schemes, 2003. Final document recommendations of the committee on
standardisation of data and billing practices. Council for medical schemes, 2003
Courtney, Mary D., O'Reilly, Maria T., Edwards, Helen E., & Hassall, Stacey L. (2010)
Benchmarking clinical indicators of quality for Australian residential aged care facilities.
Australian Health Review, 34(1), pp. 93‐100.
Garber, A.M. Evidence-based guidelines as a foundation for performance incentives. Health
Affairs 24:174–179, 2005.
Kane, Robert L. 2005. Understanding health care outcomes research. 2d ed. Sudbury, MA: Jones
and Bartlett
Mannion R, Goddard M, Smith P (2001). On the limitations and drawbacks of performance
measurement systems in health care. In: Quality in Health Care: Strategic Issues in Health Care
Management. Davies H et al, Ashgate: Aldershot.
Republic of South Africa. Medical Schemes Act (No. 131 of 1998), as amended.
Annual Performance Plan,2011. National Department of Health, 2011/2012.
http://www.doh.gov.za/docs/reports/annual/2011-12/statement.pdf
Edward Kelly and Jeremy Hurst, 2006: Health care Quality Indicators Project Conceptual
Framework paper: OECD Working papers.
Patel R, Wadee H, Pearmain D. Development of an Essential Healthcare Package (EHP) proposal
for Medical Aid Schemes in South Africa’s transition towards SHI. Draft Prepared for Board of
Healthcare Funders of Southern Africa; Feb 2007.
Carmines, E.G., & Zeller, R. A. (1991). "Reliability and viability assessment." Thousand Oaks,
CA: Sage.
O’Meara, P. A generic performance framework for ambulance services: an Australian health
services perspective. Journal of Emergency Primary Health Care. 2005; 3(3). Available online
from: http://www.jephc.com/uploads/990132WebVersion.pdf.
Chopra M, et al. Saving the lives of South Africa's mothers, babies and children: can the health
system deliver? Published online in The Lancet, 25 August 2009: DOI: 10.1016/S0 140-
6736(09)61123-5
Mqoqi N, Kellet P, Sitas F, Jula M. Incidence of histologically diagnosed cancer in South Africa,
1998-1999. National cancer registry of South Africa 2004: 21-22.
Risk Equalisation Technical Advisory Panel. Methodology for the Determination of the Risk
Equalisation Fund Contribution Table 2007 [Base 2005, Use 2007]. Vol Report No. 9. Pretoria:
Recommendations to the Council for Medical Schemes; 2007. URL:
http://www.medicalschemes.com/publications/publications.aspx?
Innovative Medicines South Africa (IMSA), 2010. The Impact of Chronic Disease on a Future
NHI. National Health Insurance Policy Brief 3.
Health Quality Assessment Report (HQA), 2010 Health Quality Assessment. Deloitte & Touche.
South Africa
Goodman NC. The Delphi technique: A critique. J Adv Nurs 1987;12:729-34
Linstone H, Turofff M,editors. The Delphi method techniques and applications. Wellesley (MA):
Addison-Wesley: 1975.
National Obesity Forum (NOF). 2006. Impact of Obesity. United Kingdom
Center of Disease Control and Prevention (CDC). (2010). Overweight and Obesity. Retrieved
from http://www.cdc.gov/obesity/index.html
Goedecke, J.H., Jennings, C.L., Lambert, E.V. Obesity in South Africa. 2006. In: Steyn K,
Fourie, J., Temple, N. (eds). Chronic Diseases of Lifestyle in South Africa: 1995-2005. Medical
Research Council –
Technical Report. Tygerberg, W Cape: Medical Research Council (MRC): 65-79.
Wolvaardt G, van Niftrik J, Beira B, Mapham W, Stander T. The role of private and other
nongovernmental organisations in primary health care. In: Barron P, Roma-Reardon J, eds. South
African Health Review 2008. Durban: Health Systems Trust, 2008.
Romero-Corral, A.; Somers, V. K.; Sierra-Johnson, J.; Thomas, R. J.; Collazo-Clavell, M. L.;
Korinek, J.; Allison, T. G.; Batsis, J. A. et al. (June 2008). "Accuracy of body mass index in
diagnosing obesity in the adult general population". International Journal of Obesity 32 (6): 959–
966.
Centers for Disease Control and Prevention (CDCP). Prevention and control of meningococcal
disease recommendations of the Advisory Committee on Immunization Practices (ACIP).
MMWR. 2005;54(No.RR-7).
Centers for Disease Control & Prevention (CDCP). WISQARS 10 leading causes of death, United
States (2005). Available at: http://webappa.cdc.gov/sasweb/ncipc/leadcaus10.html.
GCIS - Government Communication and Information System. Pocket Guide to South Africa
2010/11 HEALTH. Government Communication and Information System. Pretoria
Uthman OA. 2008. Effect of low birth weight on infant mortality: Analysis Using Weibull Hazard
Model . The Internet Journal of Epidemiology. 2008 Volume 6 Number 1
AHRQ Quality Indicators. 2001. Agency for Healthcare Research and Quality (AHRQ). Guide
to Prevention Quality Indicators: Hospital Admission for Ambulatory Care Sensitive Conditions
UNICEF (2001) A league table of teenage births in rich nations. UNICEF Innocenti Research
Centre.
UNICEF, WHO, Low Birth Weight Country, Regional and Global estimates
National Department of Health. Saving mothers 2002-2004. National Department of Health.
Pretoria
Bulatao, Rodolfo, A., and John A. Ross. 2002. “Rating Maternal and Neonatal Health Services in
Developing Countries.” Bulletin of the World Health Organization 80: 721–727.
Ross, John A., Oona Campbell, and Rodolfo Bulatao. 2001. “The Maternal and Neonatal
Programme Effort Index (MNPI).” Tropical
Norman R, Bradshaw D, Schneider M, Pieterse D, Groenwald P. Revised Burden of Disease
Estimates for the Comparative Risk Factor Assessment, South Africa 2000. Cape Town: Medical
Research Council; 2006, revised by D Bradshaw to distinguish deaths in the neonatal period.
Saving Babies 2003-2005: Fifth perinatal care survey of South Africa. Pretoria: University of
Pretoria, Medical Research Council of South Africa, Centres for Disease Control; 2007.
UN Interagency group for mortality estimation. National Department of Health, Saving Mothers:
third report on confidential inquiries into maternal deaths in South Africa, 2002-2004
OECD Health Data 2010. How Does South Africa Compare with OECD Countries. Available at
http://www.oecd.org/dataoecd/20/40/45703998.pdf.
Robert L. Kane et. al, 2003: Total Knee Replacement Evidence Report/Technology Assessment.
Number 86. AHRQ Publication No. 04-E006-2
Tracey O'Neill 2007, Decision-making regarding total knee replacement surgery: A qualitative
meta-synthesis. BMC Health Services Research 2007, 7:52
Dieppe P, Basler D, Chard J, Croft P,Dixon J, Hurley S, Lohmander , Raspe H 1999. Knee
replacement surgery for osteoarthritis: effectiveness, practice variations, indications and possible
determinants of utilization. Rheumatology 1999;38:73–83
Ju¨ni P, Dieppe, Donovan, Peters, Eachus, Pearson, Greenwood, Frankel 2003. Population
requirement for primary knee replacement surgery: a cross-sectional study. Rheumatology
2003;42:516–521
Jeffrey N. Katz, John Wright, Elizabeth A. Wright, Elena Los ina 2004. Failures of Tot al Hip
Replacement: A Population-Based Perspective. NIH P60 AR 47782.
Natasha D, Anaesthesia for Hip replacement. Update in Anaesthesia
Mahomed NN, Barrett JA, Katz JN, Phillips CB, Losina E, Lew RA, Guadagnoli E, Harris WH,
Poss R, Baron JA. Rates and outcomes of primary and revision total hip replacement in the
United States Medicare population. J Bone Joint Surg Am 2003; 85-A: 27-32.
Ekelund A, Rydell N, Nilsson OS. Total hip arthroplasty in patients 80 years of age and older.
Clin Orthop Relat Res. 1992; 281:101–106.
JNC VI (Joint National Committee, 1997)
World Health Organisation - International Society of Hypertension Guidelines for the
management of Hypertension (Guidelines Subcommittee, 1999)
World Health Organisation, 2004. Low Birth Weight: Country , Regional & Global Estimates
www.njrcentre.org.uk
www.nice.org.uk
www.hqip.org.uk
www.ahrq.gov

7. Annexure A

1 Note: analysis of data will consider all the factors listed
Obesity prevalence (1)
Indicator Name Prevalence obesity
Indicator Definition Obesity is calculated based on self reported weight and height and defined as body mass index (weight [kg] / height [m]2) ≥30.
Detailed Description Body mass index (BMI) is a measure of weight adjusted for height, and is calculated by dividing weight in kilograms by height in
metres squared (kg/m2). For all adults aged 18 years and over, the World Health Organization defines obesity as having a BMI
greater than or equal to 30 kg/m2 (WHO 2000).
For participants under 18 years, BMI cut-off points developed by the International Taskforce on Obesity (IOTF) have been used
to define obesity (Cole et al 2000). The IOTF BMI cut-off points are sex and age-specific, and have been designed to coincide
with the WHO BMI cut-off points for overweight and obesity.
Objective Determine the prevalence of obesity amongst beneficiaries in the medical scheme industry
Rationale Over the past decade, obesity has become recognized as a national health threat and a major public health challenge. WHO
estimates that by 2015 the number of overweight people worldwide will increase to 2.3 billion, while more than 700 million will
be obese.
Obesity is a costly condition that can reduce quality of life and increase the risk for many serious chronic diseases and premature
death. Obesity should be addressed through a comprehensive approach across multiple settings and sectors that can change
individual nutrition and physical activity behaviours and the environments and policies that affect these behaviours
Technical note1 Adjustment data to consider the following factors:-
- Age: studies have shown an increase in BMI in older people than in younger people
- Gender: In the South African context, black women turn to be more obese than their counterparts, while urban women were
found to have significantly higher BMI than their rural counterparts. A different pattern is seen in men were prevalence of

obesity is highest amongst white men.
- Environment: urbanisation is associated with obese due to the change in dietary intake which is westernised
- Socioeconomic status (SES): level of education , employment status associated with improvements in general health and
lower disease incidence
- Socio-cultural factors: Cultural diversity can influence the perception of body image. For example in the black community,
overweight body symbolizes happiness, beauty, affluence, health and negative HIV/Aids status (Andriam et al, 2008)
- Genetics: Studies have shown that approximately 75% of the variation in percent body fat and total fat mass is determined by
culture and lifestyle, whereas 25% can be attributed to genetic factors
- Dietary intake: High-fat diets promote fat accumulation significantly more than high-carbohydrate diets because of the high
energy density, metabolic efficiency, palatability, poor regulation and weak satiating effect of fat
- Physical activity: has a high impact on energy expenditure, body composition, and substrate oxidation and metabolism
- Parity: is associated with obesity in women
- Stress: high levels of stress are associated with increased weight gain
Risk factors:
Lack of physical activity, parity, stress, incorrect dietary intake, urbanisation
Complications:-
Type 2 diabetes, Coronary heart disease, Hypertension, Cancer, Psychological implications, Osteoarthritis, Morbidities in
children,
Limitations:-
- BMI cut-offs are intended to identify populations at increased risk of poor health conditions associated with excess body fat,
not to measure body fatness as such.
Sub-indicators Type 2 diabetes, CHD, Hypertension, Osteoarthritis
Methodology Screening of BMI in Medical Aid beneficiaries
Sources of Data Medical schemes data
Reference period 2010-2011 financial year

Immunisation coverage of children 12-23 months (2)
Indicator Name Immunisation coverage of children aged 12 months -23 months (%)
Indicator Definition Proportion of children aged 12 to 23 months who had received BCG, 3 doses of DTP and polio, and Measles
vaccine, but not necessarily Hepatitis B.
Detailed Description The indicator is calculated as the total number of children under one year old that have received all their
vaccinations up to the first measles, divided by the target population of children under one year old.
Objective To establish baseline data this will be used to monitor health outcomes related to immunisation coverage.
Rationale Children below the age of five years are at risk of fatal acute infectious diseases resulting in infant and child
mortality. Control of these infectious diseases is important to the reduction of childhood mortality and could
make a significant contribution towards the achievement of Millennium Development Goal.
In South Africa this goal aims to reduce child mortality by two thirds by the year 2015 and the National DoH
target for full immunisation coverage of 90%.
Technical note This indicator measures the percentage of children under one year old who have received the following
immunisations:
- At birth: TOPV (0), BCG
- 6 weeks: TOPV (1), DTP-HiB (1), Hep B (1)
- 10 weeks: TOPV (2), DTP-HiB (2), Hep B (2)
- 14 weeks: TOPV (3), DTP-HiB (3), Hep B (3)
- 9 months: Measles (1).
Limitation:-
Immunisation coverage indicators are dependent on accuracy of the population estimates, which are used in the
denominator.
It is important to avoid over-counting and under counting of the number immunised children since this can give a
misleading conclusion.
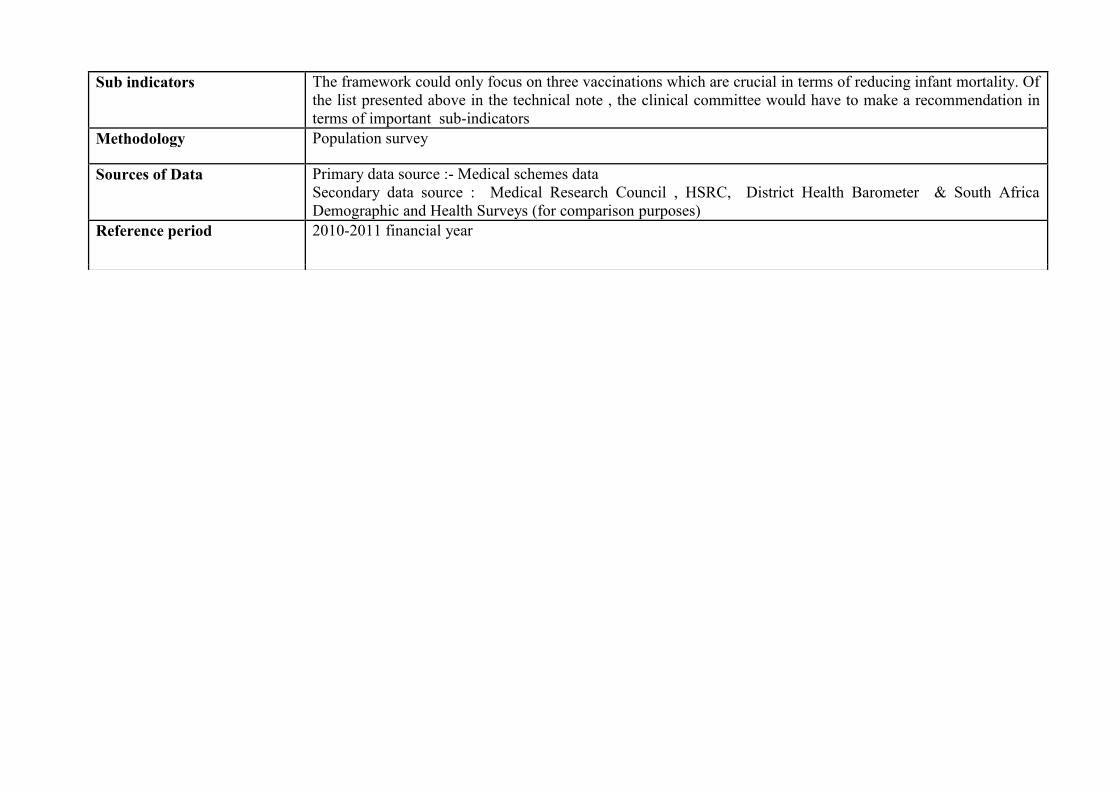
Sub indicators The framework could only focus on three vaccinations which are crucial in terms of reducing infant mortality. Of
the list presented above in the technical note , the clinical committee would have to make a recommendation in
terms of important sub-indicators
Methodology Population survey
Sources of Data Primary data source :- Medical schemes data
Secondary data source : Medical Research Council , HSRC, District Health Barometer & South Africa
Demographic and Health Surveys (for comparison purposes)
Reference period 2010-2011 financial year

Infant mortality (3)
Indicator Name Infant mortality rate (deaths under 1 year per 1 000 live births)
Indicator Definition The number of children less than one year old who die in a year, per 1 000 live births during that year.
Detailed Description This indicators outlines the probability of dying before age 1 year
Objective It will be used to establish baseline data which will be used to monitor health outcomes in relation to child
health care
Rationale One of the most important MDG indicator of health for any developing country is the number of children
who die within the first year of life. The infant mortality rate also plays a role in reflecting health status in the
general community. Given the wealth disparities within the South African society, monitoring the infant
mortality rate is critical to track inequalities in child health.
Technical note This indicator is usually calculated for a given year (i.e. on an annual basis), and out of 1,000 live births
Caution:-
Common errors that occur in the collection of retrospective data include omission of births and deaths which
then lead to biased estimates (Sullivan, 1990). Such omissions are especially common for infants who die
shortly after birth. Other problems may include misreporting of the date of birth and age at death which can
distort both the level and trends in child mortality
Sub indicators The clinical committee would have to make a recommendation in terms of important sub-indicators
Methodology Survey & retrospective review of claims data
Sources of Data Primary data source :- Medical schemes data
Secondary data source : Medical Research Council , HSRC, District Health Barometer & South Africa
Demographic and Health Surveys (for comparison purposes)
Reference period 2010-2011 financial year
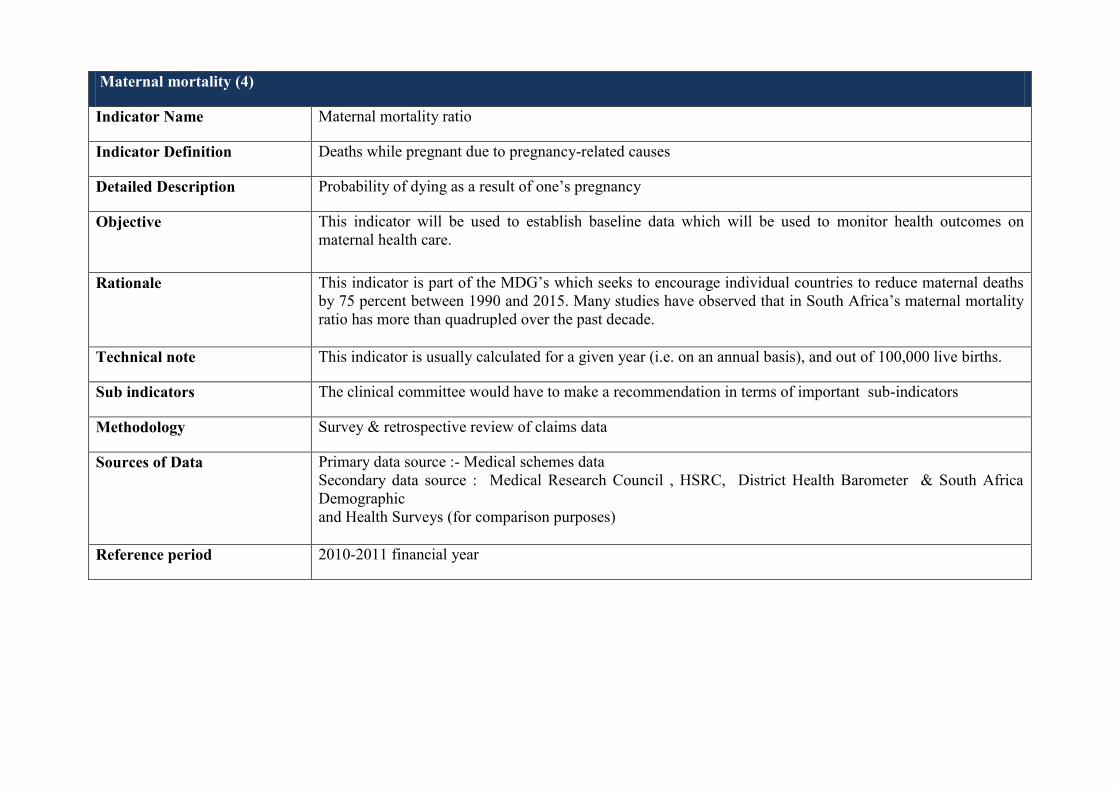
Maternal mortality (4)
Indicator Name Maternal mortality ratio
Indicator Definition Deaths while pregnant due to pregnancy-related causes
Detailed Description Probability of dying as a result of one’s pregnancy
Objective This indicator will be used to establish baseline data which will be used to monitor health outcomes on
maternal health care.
Rationale This indicator is part of the MDG’s which seeks to encourage individual countries to reduce maternal deaths
by 75 percent between 1990 and 2015. Many studies have observed that in South Africa’s maternal mortality
ratio has more than quadrupled over the past decade.
Technical note This indicator is usually calculated for a given year (i.e. on an annual basis), and out of 100,000 live births.
Sub indicators The clinical committee would have to make a recommendation in terms of important sub-indicators
Methodology Survey & retrospective review of claims data
Sources of Data Primary data source :- Medical schemes data
Secondary data source : Medical Research Council , HSRC, District Health Barometer & South Africa
Demographic
and Health Surveys (for comparison purposes)
Reference period 2010-2011 financial year
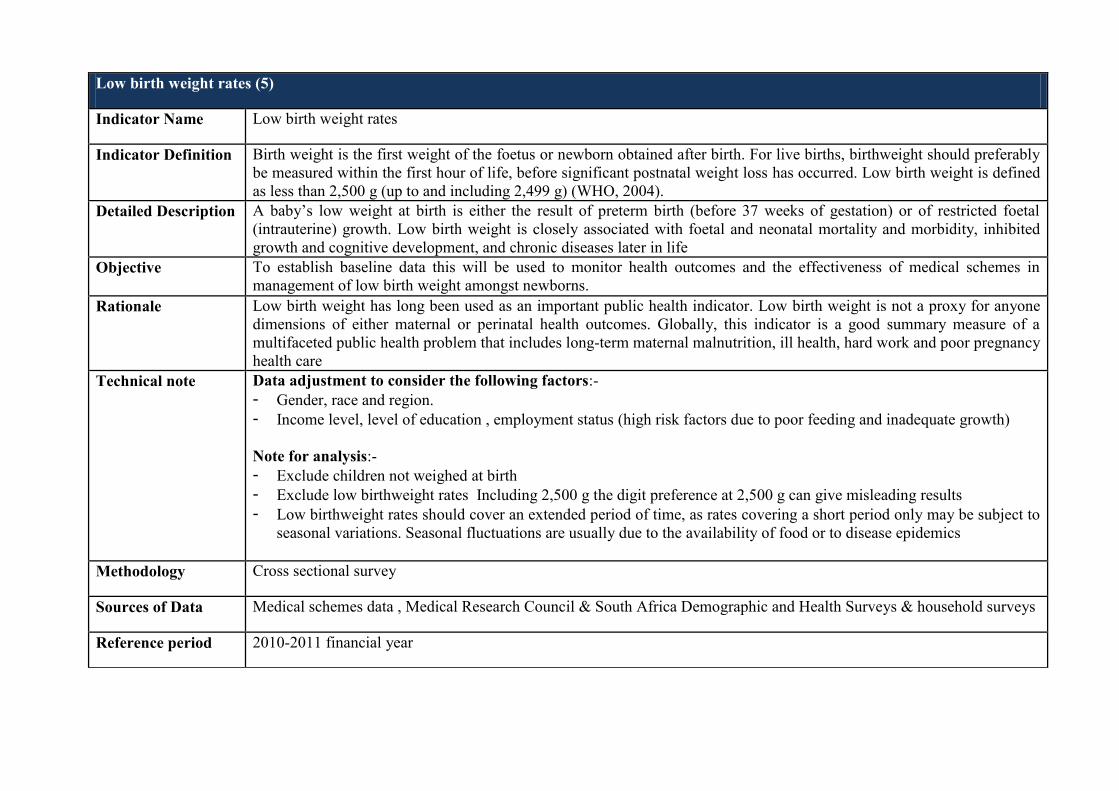
Low birth weight rates (5)
Indicator Name Low birth weight rates
Indicator Definition Birth weight is the first weight of the foetus or newborn obtained after birth. For live births, birthweight should preferably
be measured within the first hour of life, before significant postnatal weight loss has occurred. Low birth weight is defined
as less than 2,500 g (up to and including 2,499 g) (WHO, 2004).
Detailed Description A baby’s low weight at birth is either the result of preterm birth (before 37 weeks of gestation) or of restricted foetal
(intrauterine) growth. Low birth weight is closely associated with foetal and neonatal mortality and morbidity, inhibited
growth and cognitive development, and chronic diseases later in life
Objective To establish baseline data this will be used to monitor health outcomes and the effectiveness of medical schemes in
management of low birth weight amongst newborns.
Rationale Low birth weight has long been used as an important public health indicator. Low birth weight is not a proxy for anyone
dimensions of either maternal or perinatal health outcomes. Globally, this indicator is a good summary measure of a
multifaceted public health problem that includes long-term maternal malnutrition, ill health, hard work and poor pregnancy
health care
Technical note Data adjustment to consider the following factors:-
- Gender, race and region.
- Income level, level of education , employment status (high risk factors due to poor feeding and inadequate growth)
Note for analysis:-
- Exclude children not weighed at birth
- Exclude low birthweight rates Including 2,500 g the digit preference at 2,500 g can give misleading results
- Low birthweight rates should cover an extended period of time, as rates covering a short period only may be subject to
seasonal variations. Seasonal fluctuations are usually due to the availability of food or to disease epidemics
Methodology Cross sectional survey
Sources of Data Medical schemes data , Medical Research Council & South Africa Demographic and Health Surveys & household surveys
Reference period 2010-2011 financial year
2 Note: analysis of data will consider all the factors listed
*Results from SAHDS
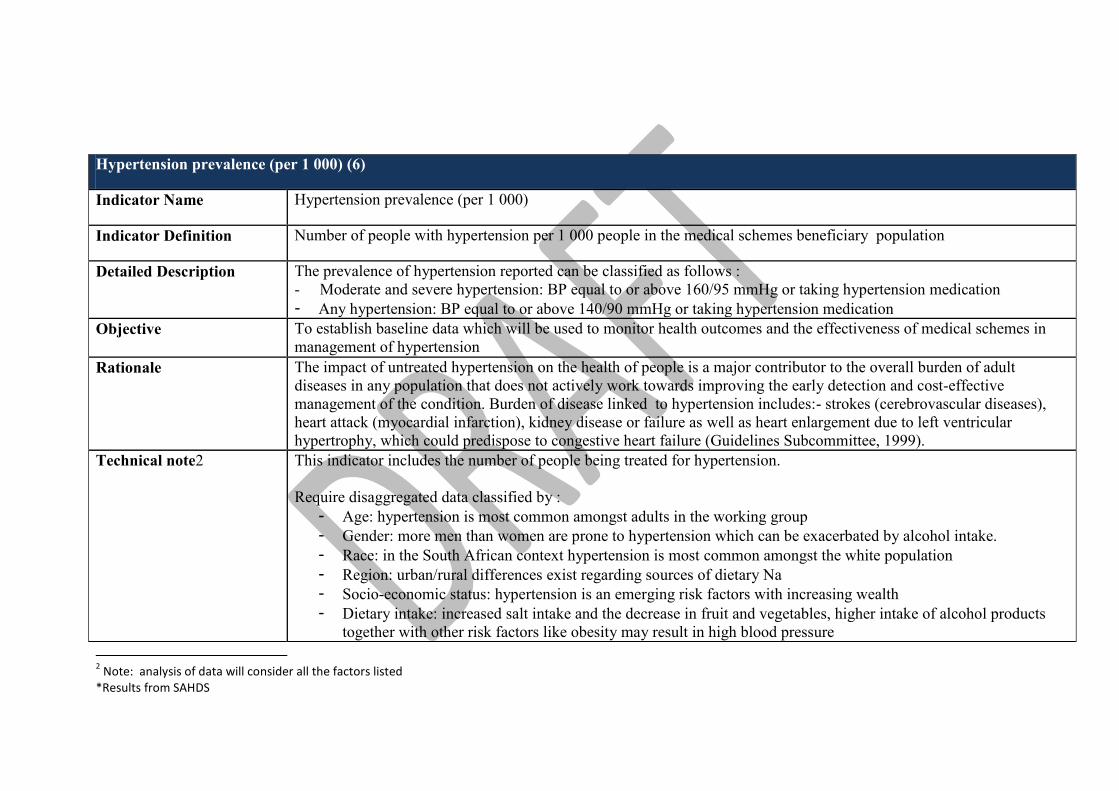
Hypertension prevalence (per 1 000) (6)
Indicator Name Hypertension prevalence (per 1 000)
Indicator Definition Number of people with hypertension per 1 000 people in the medical schemes beneficiary population
Detailed Description The prevalence of hypertension reported can be classified as follows :
- Moderate and severe hypertension: BP equal to or above 160/95 mmHg or taking hypertension medication
- Any hypertension: BP equal to or above 140/90 mmHg or taking hypertension medication
Objective To establish baseline data which will be used to monitor health outcomes and the effectiveness of medical schemes in
management of hypertension
Rationale The impact of untreated hypertension on the health of people is a major contributor to the overall burden of adult
diseases in any population that does not actively work towards improving the early detection and cost-effective
management of the condition. Burden of disease linked to hypertension includes:- strokes (cerebrovascular diseases),
heart attack (myocardial infarction), kidney disease or failure as well as heart enlargement due to left ventricular
hypertrophy, which could predispose to congestive heart failure (Guidelines Subcommittee, 1999).
Technical note2 This indicator includes the number of people being treated for hypertension.
Require disaggregated data classified by :
- Age: hypertension is most common amongst adults in the working group
- Gender: more men than women are prone to hypertension which can be exacerbated by alcohol intake.
- Race: in the South African context hypertension is most common amongst the white population
- Region: urban/rural differences exist regarding sources of dietary Na
- Socio-economic status: hypertension is an emerging risk factors with increasing wealth
- Dietary intake: increased salt intake and the decrease in fruit and vegetables, higher intake of alcohol products
together with other risk factors like obesity may result in high blood pressure

Define the inclusion and exclusion criteria:-
As part of independent variables researchers need to define parameters leading to a compliance score
Risk factors
Important to correlate body mass index (BMI) /lifestyle
Cholesterol levels
Complication
Heart attacks, stroke, left ventricular hypertrophy, renal disease, blindness
Cardiovascular disease risks are often classified according to low, medium, high and very high risk.
Each range of the risk is determined by severity and the number of risk factors.
Co-morbidity
Diabetes, obesity
Note:
Standard treatment guidelines are important so as to establish whether or not appropriate treatment was afforded to the
patient.
Caution:
Poor fieldwork measurement of BP can result in low/high estimates
Sub indicators Hospitalisation rate - due to inadequate management hypertension
Mortality rate - due to inadequate management of hypertension
Methodology Monitoring blood pressure levels and co-morbidities of beneficiaries in the Medical Scheme industry
Sources of Data Medical schemes data , Medical Research Council & South Africa Demographic and Health Surveys
Reference period 2010-2011 financial year

Total number of asthma cases (7)
Indicator Name Total number of asthma cases
Indicator Definition Total number of asthma cases in the medical schemes beneficiary population
Detailed Description Asthma is a chronic obstructive lung disease caused by inflammation and increased reaction of the airways to various triggers.
Symptoms can include wheezing, coughing, chest tightness and shortness of breath. Asthma can be a life-threatening disease if
not managed properly. Indoor environments and poor indoor air quality (IAQ) appear to play a key role in the development
and/or exacerbation of this disease
Objective To establish baseline data which will be used to monitor health outcomes and the effectiveness of medical schemes in
management of asthma cases
Rationale In South Africa, asthma is one of the most common chronic respiratory diseases. This diseases is recorded as being responsible
for one percent of DALYs lost (comparable to diabetes) and 0.4% of all deaths. Within the medical schemes population, asthma
is ranked as the 4th most prevalent chronic condition.
Technical note Collect base line data to include:-
- Age
- Gender
- Race
- Educational status
- Income
- Geographic location
Risk factors
Smoking , Environmental tobacco smoke, depression etc
Complication
An adequate assessment of severity is a key in determining appropriate management and treatment plans for patients with
asthma. Each indicator should be linked to the standards of care and treatment of patients.
Co-morbidity
Depression, diabetes, cardiac disease, hypertension, cerebrovascular disease, musculoskeletal disorders, malignancies etc.

Sub-indicators Hospitalisation rate - due to inadequate management asthma
Mortality rate - due to inadequate management of hypertension asthma
Methodology Depending on the selected indicators. Cross-sectional and prospective/Retrospective survey
Sources of Data Medical schemes data , Medical Research Council & South Africa Demographic and Health Surveys
Reference period 2010-2011 financial year

Total number of type 1 and Type 2 Diabetes cases (8)
Indicator Name Total number of type 1 and Type 2 Diabetes cases
Indicator Definition Total number of type 1 and Type 2 Diabetes cases in the medical schemes beneficiary population
Detailed Description Diabetes is caused by a failure of the pancreas to produce insulin (type 1) or to produce enough adequately
functioning insulin (type 2) to enable the glucose from food to enter the body cells and be used as a source of
energy. As a result, in both types the glucose level in the blood remains too high.
Good glycemic control of diabetes prevents micro-vascular complications and reduces the risk of macro-vascular
disease
Objective To establish baseline data which will be used to monitor health outcomes and the effectiveness of medical schemes
in management of diabetes
Rationale Over 12 million people in sub-Saharan Africa are estimated to have diabetes, and 330,000 people will die from
diabetes-related conditions. Type 2 diabetes accounts for well over 90-95% of diabetes in Sub-Saharan Africa.
Technical note Collect base line data such as the following variables so as to understand the characteristics of the population being
studied. Population dynamics have an impact on analysis and interpretation of data:-
- Age : type 1 diabetes often common amongst children under age of 15 , whilst type 2 diabetes is common
amongst adults)
- Gender : sometimes high admission rate in males may be attributed to uncontrolled blood pressures or
differences in health seeking behaviour between males and females)
- Race : In Sub –Sahara Africa , the highest diabetes prevalence is in people of Indian origin, followed by
native Africans
- Educational status
- Income
- Geographic location
Define the inclusion and exclusion criteria. This criterion will inform sampling of the participants in the study.
- Examples of inclusion criteria: - patients, who have been diagnosed with diabetes on the basis of blood

glucose estimation, include both type 1 and type 2 diabetes, as well as the variables listed above.
- Exclusion criteria :- type 1 diabetes requiring continua’s treatment or hospital admission > 1 week ( linked to
the
analytic horizon)
As part of independent variables researchers need to define parameters leading to a compliance score. Variables
such as testing of blood glucose, eye examination, electro cardiogram; visits to health facility (linked to the analytic
horizon of the study), taking SMBG, Taking OHA’s and insulin etc could be included in the compliance score. The
decision to include or exclude variables in the compliance score should also be informed by the treatment care
pathways/protocols/guidelines
Risk factors
Identify risk factors such as obesity , lack of physical activity, smoking & alcohol use
Complications:
People with diabetes are already at a significantly increased risk of developing one or more of the complications of
diabetes such as heart attack, stroke, blindness, kidney failure and neural problems that often lead to amputation.
A number of these complications develop, usually after a number of years and particularly if diabetes is not
managed or treated properly
Co -morbidity data
Co-morbidity data is required in-order to properly assess health outcomes. This data is available from patient’s
health record.
Appropriate care for complications can also affect health outcomes. Treatment sometimes includes medication,
kidney dialysis and transplant, eye surgery and lower-limb amputation. To look at diabetes health outcomes, it is
ideal to correlate diabetes rates to complications and how far do patients receive recommended care as per care path
way.
Sub-indicators Hospital admission: - due to inadequate management of diabetes.
A study undertaken in Canada showed that patients who consulted specialist had worse health outcomes compared
to GP consultations. This conclusion drawn in cognisance of the fact those specialists also see serious health
problems compared to GP’s. Severity of illness and other patient characteristics can also be linked to specialist’s
consultations/admission to the hospitals.

Mortality /Case fatality rate : proportion of patients with a primary diagnosis of diabetes mellitus who die within
30 days of their admission
Reduced risk of complications: this sub-indicator relates to risk factors associated with the development of
complications, metabolic control markers of late complications & symptoms.
Methodology Cross sectional survey triangulated with longitudinal cohort survey
Sources of Data Medical schemes data , Medical Research Council & South Africa Demographic and Health Surveys
Reference period 2010-2011 financial year