Embed Size (px)
Citation preview
Version 1.0 12-31-2004 Page 1 of 51 All rights reserved, The Leapfrog Group, Bridges To Excellence
Measuring Provider Efficiency Version 1.0
A collaborative multi-stakeholder effort
Sponsored by The Leapfrog Group & Bridges To Excellence
Supported in part by a grant from the Commonwealth Fund
Francois de Brantes (Editor)
Version 1.0 12-31-2004 Page 2 of 51 All rights reserved, The Leapfrog Group, Bridges To Excellence
Measuring Provider Efficiency A collaborative multi-stakeholder effort
Sponsored by The Leapfrog Group & Bridges To Excellence Supported in part by a grant from the Commonwealth Fund
Table of Contents
1) Executive Summary 2) Overview
a) The Need b) Scope and Purpose of this Effort c) Meeting Customer and Stakeholder Needs d) Program Attributes e) Key Recommendations f) Conclusions
3) Table of Recommendations 4) Discussion
a) Limitations on Individual and Group Measurement b) Limitations on Using Episodes as Basis for Calculating Efficiency c) Limitations on Sample Size and Age of Data d) Limitations on Use of Any Single Methodology e) Limitations on Using Medical Claims Only
5) Appendices
a) About the Processes i) Design for Six Sigma (DFSS) ii) Quality Functional Deployment (QFD)
b) About the Sponsors and Supporters of this Effort c) About the Multi-Stakeholder Team
i) Stakeholder Representation ii) Member Biographies and Affiliations
d) About Attribution Rules i) Advantages and Disadvantages of Various Methods ii) Analysis of Impact of % Claims Threshold on Attribution
e) About Pharmacy Data i) Analysis of Impact of Inclusion or Exclusion of Pharmacy Data ii) Conclusions and Implications
f) About Sample Sizes i) Analysis of Impact of Sample Sizes on Reliability of Measure ii) Conclusions and Implications
g) About Hospital Mission Adjustments

Version 1.0 12-31-2004 Page 3 of 51 All rights reserved, The Leapfrog Group, Bridges To Excellence
Foreword The work contained in this White Paper reflects the efforts from health plans, employers, consultants, and providers to define a set of recommendations – Best Practices – that have the potential to improve the measurement of provider efficiency and the science behind it. While the paper focuses on efficiency, all the contributors acknowledge that measuring efficiency should be done in conjunction with measuring effectiveness of care, so that consumers, purchasers and payers can better understand and identify the value of the services being delivered, and providers can better understand the steps they need to take to improve the value of services offered. None of the parties would suggest that these are the final (or the only) word in provider efficiency measurement, quite the contrary, which is why we have referred to this paper as Version 1.0. Nor do we suggest that all recommendations should be adhered to strictly. In fact, we recognize that many readers of this paper will struggle with how to implement some of the recommendations, or with how it will impact their organization. In doing so, they should recognize that, as an industry, we are still in the early stages of developing adequate universally accepted rules on how to measure the efficiency with which doctors, hospitals and other care providers deliver services. As such, it will be extremely important as we go forward to closely collaborate and create a community of continuous learning, understanding better the power of analysis when some of the recommendations are not applied as opposed to being applied. Continuing the experimentation will allow all of us to arrive at a better model, and we are committed to updating the recommendations periodically to reflect new findings. This continuous learning should be approached in the same spirit as the development of the Linux software code – anyone can take what we have, but contribute back any improvements you can make. It is only through this sort of collaboration, where best practices will be shared openly, that we can advance the science, reduce the barriers to implementation and jointly create a better health care system. To that end, an on-line forum has been set-up at www.regence.com/research where the discussion we have started here can be continued. The Leapfrog Group Bridges To Excellence With the participation of: NCQA The Pacific Business Group on Health Partners Healthcare System The Regence Group

Version 1.0 12-31-2004 Page 4 of 51 All rights reserved, The Leapfrog Group, Bridges To Excellence
Acknowledgments
We’d like to acknowledge all the reviewers and contributors to this paper including: Ray Herschman and Arnie Milstein of Mercer Human Resources Consulting; Mark Rattray, Jim Andrianos and Dorothy Stam of the Regence Group; Carmella Bocchino and Debbie Wheeler of America’s Health Insurance Plans, as well as some of its member organizations; Joachim Roski of the NCQA; Tom Lee, Kelly Hall and Jeff Levin-Scherz of Partners Healthcare System; David Hopkins of the Pacific Business Group on Health; Gil Omenn of the University of Michigan; Russ Robbins of Ingenix; Marilyn Kramer of DxCG, Inc.; Jon Conklin and Dennis Bush of Medstat; David Wennberg of HealthDialog;
Version 1.0 12-31-2004 Page 5 of 51 All rights reserved, The Leapfrog Group, Bridges To Excellence
1) Executive Summary A decade of escalating health care costs combined with a growing focus by the
Institute of Medicine (IOM) and others on the deficiencies in the safety and quality of patient care have created considerable momentum around the concept of measuring both provider clinical quality and provider cost efficiency (cost efficiency from the payer’s perspective). The science of measuring physician and hospital quality has advanced considerably in recent years. Organizations like the Joint Commission for the Accreditation of Healthcare Organizations (JCAHO) and the National Committee for Quality Assurance (NCQA) have developed standard measures that are now widely used throughout health care. Many of those measures have been reviewed through the National Quality Forum’s consensus-based process and adopted by health plans and rating agencies. As a result, there is good understanding within the industry on how to measure health care quality at various levels (in particular health plan and hospital levels), even if, regrettably, there is not complete uniformity in the application of those measures, or universal achievement of high performance on these measures.
The same cannot be said of efforts to measure efficiency. Until now, there lacked
a systematic, empirically informed and consensus-based process to understand how best to measure cost efficiency. Instead, each individual stakeholder has had a tendency to approach this effort separately, which has decreased the industry’s ability to learn from natural experiments, understand and catalog best practices, and collaborate on relevant research. As a result, organizations that have introduced efficiency measurement initiatives have often been met with resistance from doctors and hospitals on (a) the meaningfulness and validity of the results, and (b) the lack of transparency in the underlying measurement methodologies. However, the need for valid, reliable, and actionable information on provider efficiency remains very high. Payers and purchasers/employers (and increasingly consumers as a result of changed health benefits designs) have understandably had a keen interest in identifying doctors and hospitals that consistently deliver good clinical outcomes without wasting resources, and using that information to support benefit designs, network management and public report cards that, together or separately, might induce patients to choose more efficient providers.
The goal of this White Paper is to launch an ongoing process that will provide
guidance to all stakeholders based on available knowledge about efficiency measurement. The guidance is provided in the form of principles and recommendations that are believed to be acceptable to – if not necessarily embraced wholesale by – multiple stakeholders. These recommendations are not intended to represent the “last word” on provider efficiency, as both the art and science of efficiency measurement are still in their infancy and we expect them to grow. Rather, they are intended to create a framework that is sound enough to use as a basis for measurement today, and to act as a catalyst for stimulating the evolution of measurement as our knowledge and understanding of this field grows. To that end, an online learning community has been established at www.regence.com/research to facilitate the continued sharing of knowledge.
Version 1.0 12-31-2004 Page 6 of 51 All rights reserved, The Leapfrog Group, Bridges To Excellence
Furthermore, during the next few years, the NCQA, a key collaborator in this effort, will develop evaluation methods that will help determine the extent to which health care organizations measure physician and hospital performance following principles set forth in this paper. NCQA is currently working with many national experts and stakeholder representatives in order to publish a first set of evaluation methods (standards) by July 2005. It is expected that NCQA will be able to evaluate health care organizations wanting to demonstrate their adherence to these standards by the latter half of 2005.
NCQA’s efforts in this area, referred to as the Quality Plus Initiative, are part of
its overall work to refine its evaluation methods to focus on critical areas where health care organizations (managed care organizations and preferred provider organizations) can be expected to significantly add value for their members. For a more detailed discussion of NCQA’s methods and implementation timetable see www.ncqa.org/Programs/Qualityplus. Until the NCQA’s work is complete, the White Paper will be periodically updated to reflect new knowledge and understanding from real world applications in this field through the continued work of many organizations.
Our underlying belief is that for hospital or physician efficiency measurements to
be widely accepted in the market, they should be feasible to implement for health plans, credible and reliable for consumers, and fair, equitable and actionable for providers. That requires certain conditions to be met.
First, it is important to incorporate enough recent data to develop a statistically
reliable determination of provider efficiency. If some data elements are unavailable, they should be omitted uniformly to ensure the comparability of diverse data sources. However, some empirical evidence suggests that pharmacy data is important for measuring physician efficiency. Reports should only be issued for physicians or hospitals with substantial reportable cases; we offer suggestions regarding reporting thresholds and evidence supporting the recommendation.
Second, we recommend analyzing the data using industry standard episode
grouping methodologies, and applying robust case mix and severity of illness adjustments. Even with standard episode groupings and risk adjustment, it is still important to restrict comparison groups to truly comparable facilities or physicians. To that end, we are publishing a separate study that analyzes potential adjustment factors that should be applied to certain types of hospitals when comparing them to non-pure peers using a price-sensitive efficiency index.
Third, we recommend attributing episodes only to providers who have a
substantial impact on the episode of care. We suggest a threshold of at least 25% of total professional costs, and believe that it would be acceptable to attribute cases to multiple providers if they each had a substantial impact on the episode of care. We offer some evidence in support of that threshold and methodology.

Version 1.0 12-31-2004 Page 7 of 51 All rights reserved, The Leapfrog Group, Bridges To Excellence
Finally, we recommend that provider performance reporting should distinguish
between differences in utilization and cost per unit. All performance should be reported in valid statistical groupings to reflect the relative performance of the provider, avoiding strict numerical rankings where the risk of misclassification is high. Generally, reporting performance on efficiency should be linked to reporting performance on quality to better understand, measure and communicate the value that is delivered by physicians and hospitals.
We recognize that not all organizations will, or can, apply all the
recommendations listed in this paper. We also recognize that the science, experimentation and research on measuring efficiency should continue in earnest in an open learning community. To that end, we recommend that any organization measuring provider efficiency (1) clearly communicate to all stakeholders (in particular providers and purchasers) the specific methodology used in arriving at the results and any rationale for varying from the recommendations in this paper, (2) publish the confidence interval around the results, and (3) participate in an on-line learning forum at www.regence.com/research to share the results of their work and advance the science in this field.
We also greatly encourage the developers of models and methodologies that
measure provider efficiency to make their models available to researchers at very low or no cost, and to develop “freeware” versions of their products that can be used by providers and others to help improve their performance.
Version 1.0 12-31-2004 Page 8 of 51 All rights reserved, The Leapfrog Group, Bridges To Excellence
2) Overview a) The Need The science of measuring physician and hospital care effectiveness has advanced
considerably in the past decade. Organizations like the Joint Commission on Healthcare Organizations (JCAHO) and the National Committee for Quality Assurance (NCQA) have developed standardized performance measures that are now widely used throughout health care. Many of those measures have been reviewed through the National Quality Forum’s consensus-based process and adopted, and are now widely accepted by multiple stakeholders. However, the same is not true when it comes to measuring physician or hospital efficiency. The Institute of Medicine, in Crossing the Quality Chasm, defined efficiency as avoiding waste1. In economic theory, efficiency is defined as the physical relation between resources and health outcome “…when the maximum set of possible improvements is obtained from a set of resource inputs” (Palmer & Torgerson, BMJ 1999).
Throughout this document the term efficiency is defined as a relative level of
resource consumption, and associated costs, in the production of health care services – cost-efficiency (without an explicit link to the clinical outcomes of those services), form the payer’s perspective. While we recognize that economists may consider this definition inappropriate, we will use it here to reflect the current terminology used by hundreds of health plans and purchasers.
When judging the relative efficiency of health plans “total cost per member per
month (PMPM)” has been widely used as a relevant performance metric (splitting out the administrative cost portion from the medical cost portion). However, while there is broad consensus that the unit price of individual physician or hospital services is grossly inadequate and flawed in measuring efficiency, an equivalent metric to PMPM in monitoring physician or hospital efficiency has been elusive. At the same time, widespread implementation and dissemination of standardized measures of provider efficiency are key to enabling providers to focus their process improvement efforts as well as allowing consumers and purchasers to select physicians, hospitals and other health care professionals based on considerations of both effectiveness and efficiency. In turn, consumers’ and purchasers’ ability to seek out and reward high-performing providers may foster substantial improvements in the value of health care services by encouraging physicians and hospitals to improve their efficiency.
Despite the lack of consensus on how to measure provider efficiency, several
methods and associated software applications are available today to better understand the efficiency of physicians and hospitals. These applications have been developed for use with administrative claims databases that are comprised of medical, pharmacy, laboratory, and ancillary services. While administrative claims databases have substantial shortcomings, they are mostly standardized and ubiquitous, and are very often the only available source of information on resource utilization. The claims filed for these services
1 Institute of Medicine Committee on Quality of Health Care in America. Crossing the Quality Chasm: A New Health System for the 21st Century. Washington, D.C.: National Academy Press, 2001, page 6.

Version 1.0 12-31-2004 Page 9 of 51 All rights reserved, The Leapfrog Group, Bridges To Excellence
represent both the nature and volume of services provided in the treatment of specified diseases and conditions. In general, the results generated from these applications have typically been limited to uses focused on health plan network design and management functions. More recently, these results have also been tied to benefit designs and public reporting.
Over the years, these methods have identified a common “unit of measure” for
comparing provider efficiency, the episode of care – an event that is part of a patient’s total care, but forms a separate unit within that whole – and in this Paper we will use the term episode in a generic way, not referring to any specific methodology. However, the underlying methods, including required data sources and data elements, needed statistical adjustments, and other application rules can vary substantially. Reducing the variation in methods will make information on provider efficiency more actionable by all stakeholders. And improving the reliability of the results from these analyses will reduce the potential for misclassifying providers and leading consumers and purchasers to inaccurate conclusions with respect to a provider’s efficiency.
b) Scope and Purpose of This Effort In response to the need for purchasers and health plans to share and consistently
use good practices in measuring provider efficiency, the Leapfrog Group and Bridges To Excellence assembled a group of industry stakeholders and experts to identify, endorse and, wherever possible, field test a set of principles for measuring hospital and physician efficiency at the most useful granular level.
These principles and their associated measures of efficiency are intended to
support the concept of value-based purchasing and promote the judicious use of healthcare resources. In designing these principles, this team of experts has
1) Taken steps to ensure that the principles consider the perspectives of payers/purchasers, providers and consumers
2) Created a set of recommendations that are not unduly burdensome to adopt
3) Made strong effort to coordinate and synchronize with other similar efforts2
The scope of the project is limited to defining principles and guidelines for using
existing methods, rather than defining new or different methods, or defining specific efficiency measures3. Furthermore, we are not advancing specific recommendations on how purchasers and plans should use efficiency measures to promote improvement, for the management of provider networks, pay-for-performance initiatives, or consumer decision support. However, we strongly suggest (1) that measurement results and methodologies used in generating the results be shared with the physicians and hospitals being measured; (2) that efforts be taken to understand the variances in efficiency
2 Multiple purchaser initiatives, including Care Focused Purchasing, the Human Resource Policy Association’s Affordable initiative, the Leapfrog Group’s National Reward Program, have agreed to adopt the recommendations of the White Paper 3 Existing methods include (but are not limited to) Symmetry’s Episode Treatment Groups, DxCG’s Risk-Adjusted Episodes, Medstat Episode Grouper, 3M’s Clinical Risk Grouper
Version 1.0 12-31-2004 Page 10 of 51 All rights reserved, The Leapfrog Group, Bridges To Excellence
performance and, where possible, how improvements may be made to improve performance in a timely manner; and (3) that measuring efficiency without understanding the clinical output fails to measure the value of services provided, and that, as a consequence, the two should be linked.
c) Meeting Customer and Stakeholder Needs In order to structure our approach to this effort, to identify the most important
product attributes (principles of measurement), and to ensure that all relevant stakeholders’ perspectives are considered in an appropriate fashion we followed an approach referred to as Design For Six Sigma (DFSS). (See Appendix (a)(i) for details on the DFSS process and its output with respect to this project, including designation of customers and stakeholders, expression of customer and stakeholder needs, and outlining of key processes for recommendations).
As part of the DFSS process we identified purchasers/payers (including health
plans) and consumers as customers, while providers, accrediting organization, and benefit consultants were considered stakeholders. While the distinction is important because customer needs take precedence over stakeholder needs, the recommendations outlined in this paper reflect the perspectives and needs of both customers and stakeholders.
Customer and stakeholder needs were gathered through key informant interviews
and focus groups, conducted either as part of this or related efforts4, and were then consolidated and translated into a core set of product attributes.
d) Program Attributes At every step, specific recommendations were evaluated according to their
potential impact on a set of critical program attributes. The higher the potential impact, the stronger the recommendation. The attributes are:
• Actionable: The output from the applications used to measure efficiency should be actionable by plans and providers, enabling them to identify opportunities for improvement and their relative performance when compared to others
• Operational and feasible: Recommendations have to be operationally focused and feasible for plans/benefit administrators and providers to implement without creating undue burden on staff and resources
• Fair: The methods used in calculating efficiency and the application of those methods should reflect the overall, true cost of care and the appropriate locus of control (e.g. providers should not be held accountable for the impact of benefit design/cost sharing). The methods should allow for appropriate risk-adjustment, peer to peer comparisons, the ability to understand the influence of unit price relative to resource use, and account for the value of care coordination and other care management processes
• Credible and reliable: All methods used should be sound, evidence-based, valid, and produce timely results
4 de Brantes, F.S., Galvin, R.S., M.D., Lee, T., M.D., Bridges to Excellence – A Business Case for Quality: Journal of Clinical Outcomes Management, August 2003
Version 1.0 12-31-2004 Page 11 of 51 All rights reserved, The Leapfrog Group, Bridges To Excellence
• Equitable: The use of efficiency measures to evaluate providers should be reasonable, avoid gaming by any party, and the publication of these data should lead to overall improvements benefiting purchasers/plans, providers and consumers
e) Key Recommendations The recommendations are categorized in three areas of focus that include the main
process steps used in creating episodes of care and then using those episodes to determine a provider’s relative level of performance:
• Data input, or needed data elements: This is the stage during which critical data elements are gathered
• Application rule sets, or required statistical adjustments: These are the rules that are applied to the data in measuring the care that patients experience during the course of a year and constructing a valid episode
• Data output, or generating valid information: This is the stage during which episodes of care are attributed to specific providers, providers are then included in peer groups, and their relative level of efficiency is determined and reported
Using a DFSS tool referred to as the “Quality Functional Deployment” or QFD
(see Appendix (a)(ii)), the team identified a series of product requirements in each of these process steps that could significantly impact critical product attributes. We focused on the requirements most likely to make the assessment of hospital or physician efficiency actionable, operational and feasible, fair, credible and reliable, and equitable. These key recommendations are summarized on the following page.
Version 1.0 12-31-2004 Page 12 of 51 All rights reserved, The Leapfrog Group, Bridges To Excellence
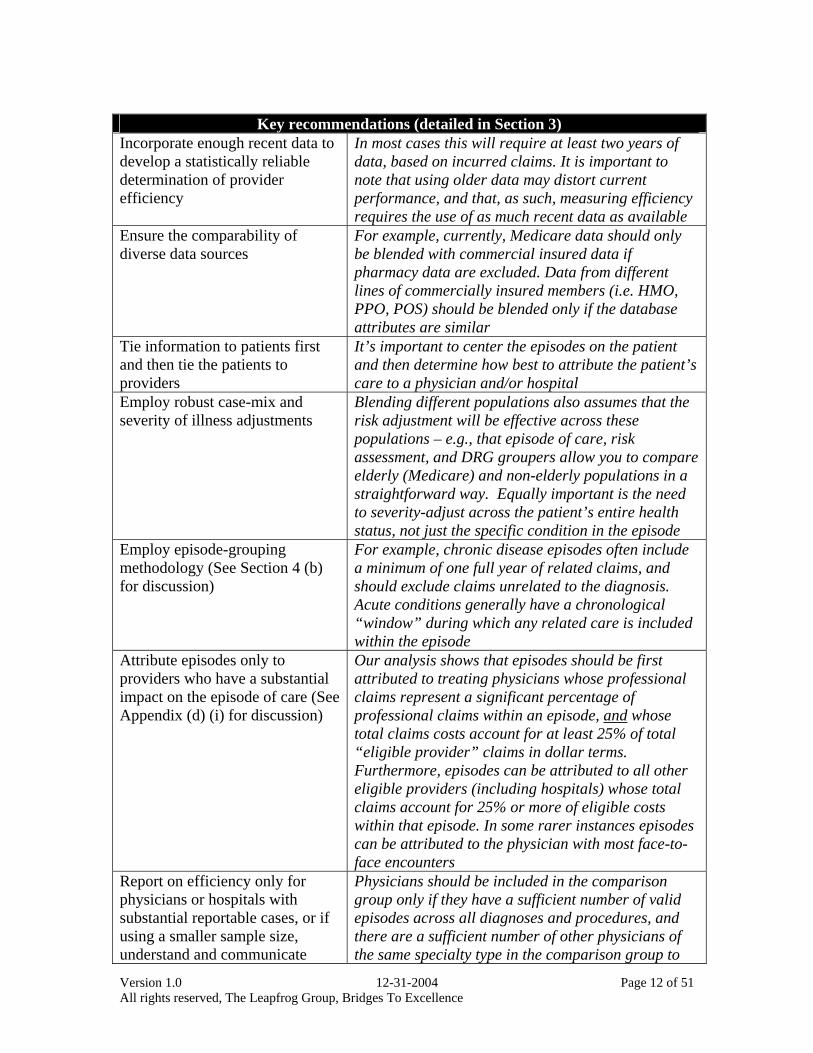
Key recommendations (detailed in Section 3)
Incorporate enough recent data to develop a statistically reliable determination of provider efficiency
In most cases this will require at least two years of data, based on incurred claims. It is important to note that using older data may distort current performance, and that, as such, measuring efficiency requires the use of as much recent data as available
Ensure the comparability of diverse data sources
For example, currently, Medicare data should only be blended with commercial insured data if pharmacy data are excluded. Data from different lines of commercially insured members (i.e. HMO, PPO, POS) should be blended only if the database attributes are similar
Tie information to patients first and then tie the patients to providers
It’s important to center the episodes on the patient and then determine how best to attribute the patient’s care to a physician and/or hospital
Employ robust case-mix and severity of illness adjustments
Blending different populations also assumes that the risk adjustment will be effective across these populations – e.g., that episode of care, risk assessment, and DRG groupers allow you to compare elderly (Medicare) and non-elderly populations in a straightforward way. Equally important is the need to severity-adjust across the patient’s entire health status, not just the specific condition in the episode
Employ episode-grouping methodology (See Section 4 (b) for discussion)
For example, chronic disease episodes often include a minimum of one full year of related claims, and should exclude claims unrelated to the diagnosis. Acute conditions generally have a chronological “window” during which any related care is included within the episode
Attribute episodes only to providers who have a substantial impact on the episode of care (See Appendix (d) (i) for discussion)
Our analysis shows that episodes should be first attributed to treating physicians whose professional claims represent a significant percentage of professional claims within an episode, and whose total claims costs account for at least 25% of total “eligible provider” claims in dollar terms. Furthermore, episodes can be attributed to all other eligible providers (including hospitals) whose total claims account for 25% or more of eligible costs within that episode. In some rarer instances episodes can be attributed to the physician with most face-to-face encounters
Report on efficiency only for physicians or hospitals with substantial reportable cases, or if using a smaller sample size, understand and communicate
Physicians should be included in the comparison group only if they have a sufficient number of valid episodes across all diagnoses and procedures, and there are a sufficient number of other physicians of the same specialty type in the comparison group to
Version 1.0 12-31-2004 Page 13 of 51 All rights reserved, The Leapfrog Group, Bridges To Excellence
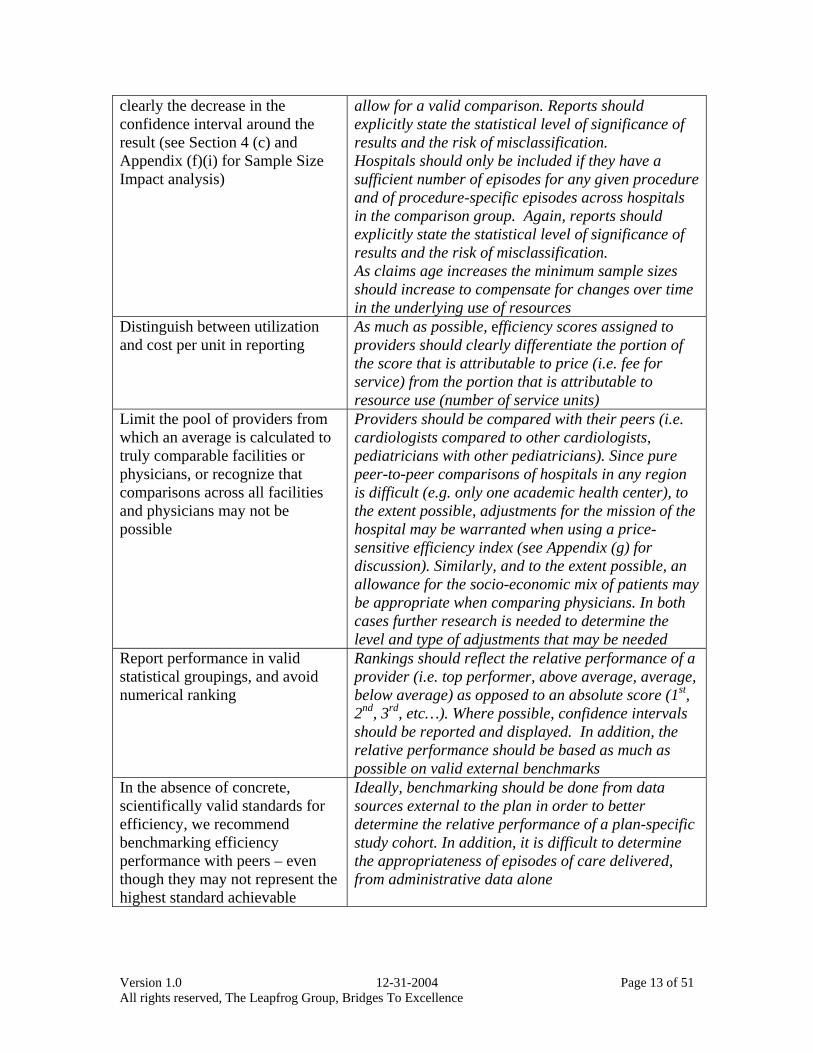
clearly the decrease in the confidence interval around the result (see Section 4 (c) and Appendix (f)(i) for Sample Size Impact analysis)
allow for a valid comparison. Reports should explicitly state the statistical level of significance of results and the risk of misclassification. Hospitals should only be included if they have a sufficient number of episodes for any given procedure and of procedure-specific episodes across hospitals in the comparison group. Again, reports should explicitly state the statistical level of significance of results and the risk of misclassification. As claims age increases the minimum sample sizes should increase to compensate for changes over time in the underlying use of resources
Distinguish between utilization and cost per unit in reporting
As much as possible, efficiency scores assigned to providers should clearly differentiate the portion of the score that is attributable to price (i.e. fee for service) from the portion that is attributable to resource use (number of service units)
Limit the pool of providers from which an average is calculated to truly comparable facilities or physicians, or recognize that comparisons across all facilities and physicians may not be possible
Providers should be compared with their peers (i.e. cardiologists compared to other cardiologists, pediatricians with other pediatricians). Since pure peer-to-peer comparisons of hospitals in any region is difficult (e.g. only one academic health center), to the extent possible, adjustments for the mission of the hospital may be warranted when using a price-sensitive efficiency index (see Appendix (g) for discussion). Similarly, and to the extent possible, an allowance for the socio-economic mix of patients may be appropriate when comparing physicians. In both cases further research is needed to determine the level and type of adjustments that may be needed
Report performance in valid statistical groupings, and avoid numerical ranking
Rankings should reflect the relative performance of a provider (i.e. top performer, above average, average, below average) as opposed to an absolute score (1st, 2nd, 3rd, etc…). Where possible, confidence intervals should be reported and displayed. In addition, the relative performance should be based as much as possible on valid external benchmarks
In the absence of concrete, scientifically valid standards for efficiency, we recommend benchmarking efficiency performance with peers – even though they may not represent the highest standard achievable
Ideally, benchmarking should be done from data sources external to the plan in order to better determine the relative performance of a plan-specific study cohort. In addition, it is difficult to determine the appropriateness of episodes of care delivered, from administrative data alone
Version 1.0 12-31-2004 Page 14 of 51 All rights reserved, The Leapfrog Group, Bridges To Excellence
f) Conclusions To address the legitimate concerns of stakeholders, it was necessary to make
some compromises and trade-offs in order to reach a result that was fair, reliable and actionable. For example, some stakeholders suggested that we focus on assessing efficiency at a more aggregated level for physicians, arguing that teams deliver care. However, even within integrated groups, the performance of individual physicians has a substantial impact on overall efficiency, and reporting on only group performance would likely obscure opportunities for improvement in efficiency of individual members of the group. As such, our recommendations focus on reporting at the lowest unit of measure possible, ideally the individual physician.
We note further that our recommendation to require an attribution threshold implies that some episodes of care not be evaluated. Similarly, our recommendation to require a minimum number of episodes for any provider will prevent the profiling of many providers; however, for most health plans the providers on whom a profile can be established are those with higher volumes and who represent a large portion of the total care delivered to covered members. We also note that health plans that are smaller or in more fragmented markets can enhance their opportunity to do meaningful efficiency profiling with data aggregated across a geographic region. A practical implication is that health plans will need to increasingly improve the richness of data collected (beyond the strict limits of what is needed to pay providers), and providers will have to improve the accuracy of their claims submission.
This White Paper, through the efforts of the stakeholders that have contributed to
it, has gathered the best available knowledge about efficiency measurement to formulate a set of principles and standards acceptable to – if not necessarily embraced wholesale by – multiple stakeholders. We believe that these principles and standards should yield valid, fair, reliable and actionable information on providers’ efficiency in delivering health care services
These standards are not intended to represent the “last word” on provider
efficiency, as both the art and science of efficiency measurement are still in their infancy and we expect them to grow. Rather, they are intended to create a framework that is sound enough to use as a basis for measurement today, and to act as a catalyst for stimulating the evolution of measurement as our knowledge and understanding of this field grows.
The NCQA, a key collaborator in this effort, will develop evaluation methods that
will allow a determination of the extent health care organizations measure physician and hospital performance following principles set forth in this paper. NCQA is currently working with many national experts and stakeholder representatives in order to publish a first set of evaluation methods (standards) by July 2005. It is expected that NCQA will be able to evaluate health care organizations wanting to demonstrate their adherence to these standards by the latter half of 2005.

Version 1.0 12-31-2004 Page 15 of 51 All rights reserved, The Leapfrog Group, Bridges To Excellence
NCQA’s efforts in this area, referred to as the Quality Plus Initiative, are part of its overall work to refine its evaluation methods to focus on critical areas where health care organizations (managed care organizations and preferred provider organizations) can be expected to significantly add value for their members. For a more detailed discussion of NCQA’s methods and implementation timetable see www.ncqa.org/Programs/Qualityplus.
Until the NCQA’s work is complete, the White Paper will be updated regularly to
reflect new knowledge and understanding from real world applications in this field through the continued work of many organizations.
The hope is that the recommendations in this White Paper will be widely adopted
throughout the industry, and that a continuous learning community will be created where results from more experimentation can be shared and the science improved. At the very least, the two sponsoring organizations have agreed to incorporate the recommendations into their initiatives. In addition, the Regence Group has agreed to host an on-line learning community at www.regence.com/research where the discussions started by the paper can continue, and where researchers and other users of efficiency data or methodologies can contribute their experiences and findings.
Version 1.0 12-31-2004 Page 16 of 51 All rights reserved, The Leapfrog Group, Bridges To Excellence
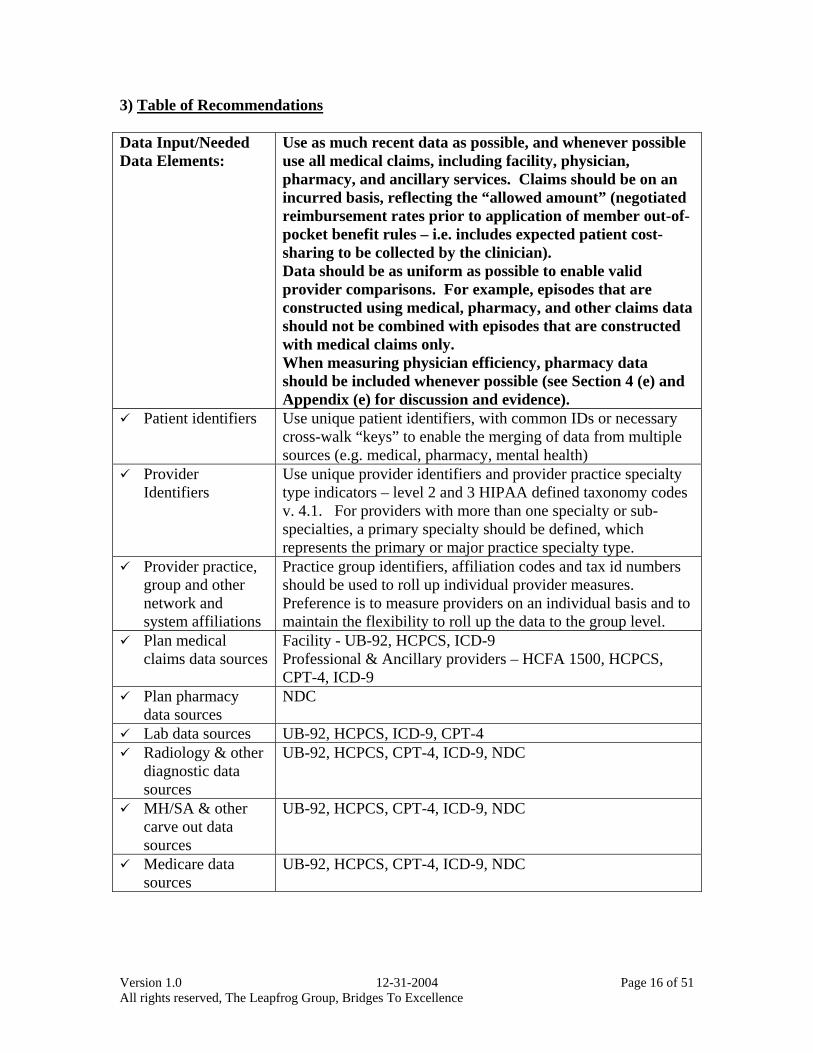
3) Table of Recommendations Data Input/Needed Data Elements:
Use as much recent data as possible, and whenever possible use all medical claims, including facility, physician, pharmacy, and ancillary services. Claims should be on an incurred basis, reflecting the “allowed amount” (negotiated reimbursement rates prior to application of member out-of-pocket benefit rules – i.e. includes expected patient cost-sharing to be collected by the clinician). Data should be as uniform as possible to enable valid provider comparisons. For example, episodes that are constructed using medical, pharmacy, and other claims data should not be combined with episodes that are constructed with medical claims only. When measuring physician efficiency, pharmacy data should be included whenever possible (see Section 4 (e) and Appendix (e) for discussion and evidence).
Patient identifiers Use unique patient identifiers, with common IDs or necessary cross-walk “keys” to enable the merging of data from multiple sources (e.g. medical, pharmacy, mental health)
Provider Identifiers
Use unique provider identifiers and provider practice specialty type indicators – level 2 and 3 HIPAA defined taxonomy codes v. 4.1. For providers with more than one specialty or sub-specialties, a primary specialty should be defined, which represents the primary or major practice specialty type.
Provider practice, group and other network and system affiliations
Practice group identifiers, affiliation codes and tax id numbers should be used to roll up individual provider measures. Preference is to measure providers on an individual basis and to maintain the flexibility to roll up the data to the group level.
Plan medical claims data sources
Facility - UB-92, HCPCS, ICD-9 Professional & Ancillary providers – HCFA 1500, HCPCS, CPT-4, ICD-9
Plan pharmacy data sources
NDC
Lab data sources UB-92, HCPCS, ICD-9, CPT-4 Radiology & other
diagnostic data sources
UB-92, HCPCS, CPT-4, ICD-9, NDC
MH/SA & other carve out data sources
UB-92, HCPCS, CPT-4, ICD-9, NDC
Medicare data sources
UB-92, HCPCS, CPT-4, ICD-9, NDC
Version 1.0 12-31-2004 Page 17 of 51 All rights reserved, The Leapfrog Group, Bridges To Excellence
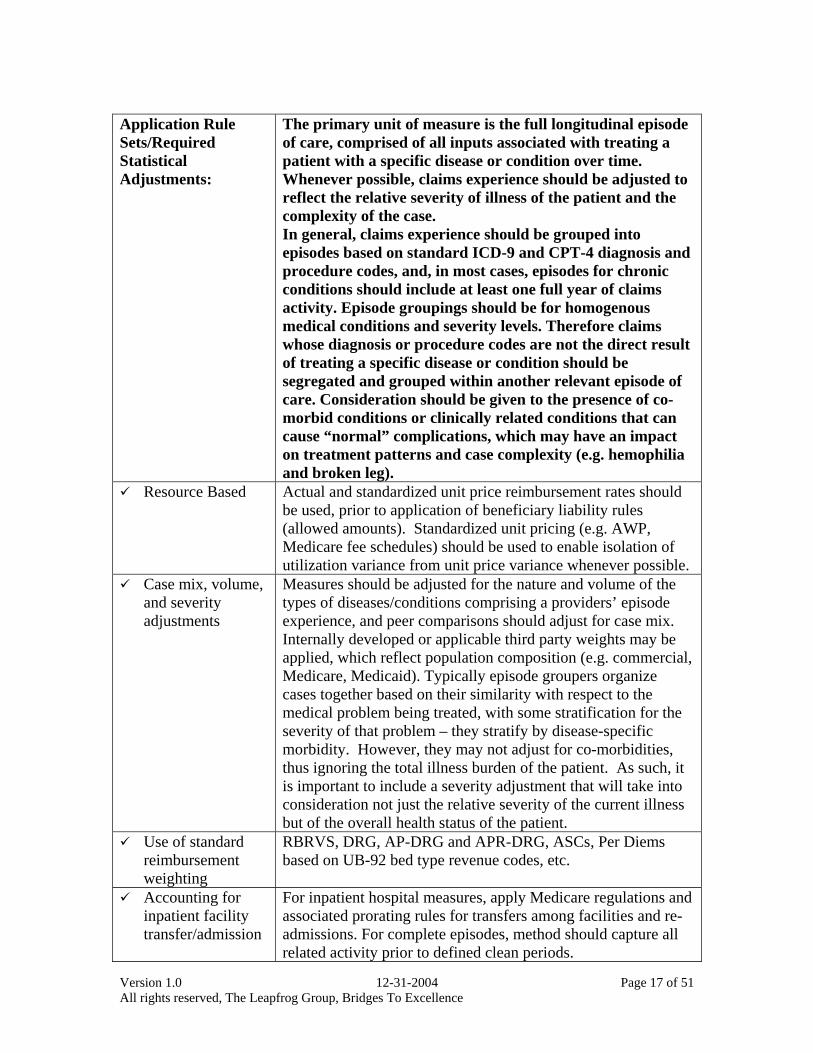
Application Rule Sets/Required Statistical Adjustments:
The primary unit of measure is the full longitudinal episode of care, comprised of all inputs associated with treating a patient with a specific disease or condition over time. Whenever possible, claims experience should be adjusted to reflect the relative severity of illness of the patient and the complexity of the case. In general, claims experience should be grouped into episodes based on standard ICD-9 and CPT-4 diagnosis and procedure codes, and, in most cases, episodes for chronic conditions should include at least one full year of claims activity. Episode groupings should be for homogenous medical conditions and severity levels. Therefore claims whose diagnosis or procedure codes are not the direct result of treating a specific disease or condition should be segregated and grouped within another relevant episode of care. Consideration should be given to the presence of co-morbid conditions or clinically related conditions that can cause “normal” complications, which may have an impact on treatment patterns and case complexity (e.g. hemophilia and broken leg).
Resource Based Actual and standardized unit price reimbursement rates should be used, prior to application of beneficiary liability rules (allowed amounts). Standardized unit pricing (e.g. AWP, Medicare fee schedules) should be used to enable isolation of utilization variance from unit price variance whenever possible.
Case mix, volume, and severity adjustments
Measures should be adjusted for the nature and volume of the types of diseases/conditions comprising a providers’ episode experience, and peer comparisons should adjust for case mix. Internally developed or applicable third party weights may be applied, which reflect population composition (e.g. commercial, Medicare, Medicaid). Typically episode groupers organize cases together based on their similarity with respect to the medical problem being treated, with some stratification for the severity of that problem – they stratify by disease-specific morbidity. However, they may not adjust for co-morbidities, thus ignoring the total illness burden of the patient. As such, it is important to include a severity adjustment that will take into consideration not just the relative severity of the current illness but of the overall health status of the patient.
Use of standard reimbursement weighting
RBRVS, DRG, AP-DRG and APR-DRG, ASCs, Per Diems based on UB-92 bed type revenue codes, etc.
Accounting for inpatient facility transfer/admission
For inpatient hospital measures, apply Medicare regulations and associated prorating rules for transfers among facilities and re-admissions. For complete episodes, method should capture all related activity prior to defined clean periods.
Version 1.0 12-31-2004 Page 18 of 51 All rights reserved, The Leapfrog Group, Bridges To Excellence
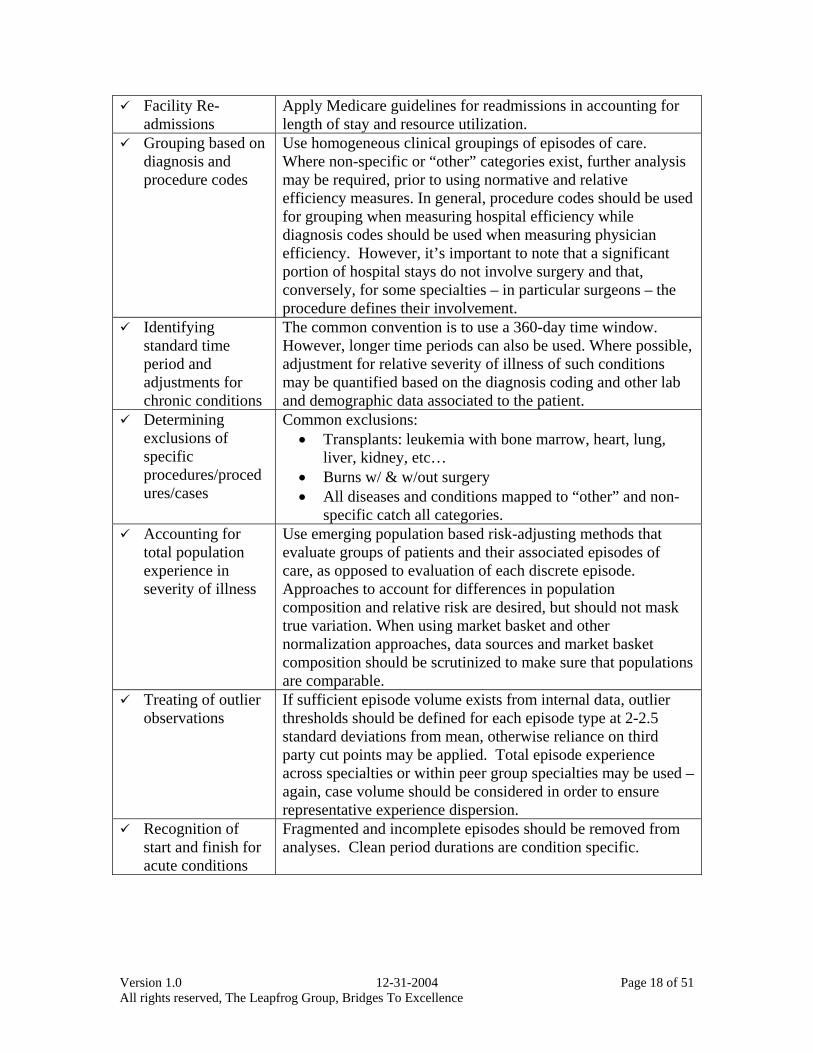
Facility Re-admissions
Apply Medicare guidelines for readmissions in accounting for length of stay and resource utilization.
Grouping based on diagnosis and procedure codes
Use homogeneous clinical groupings of episodes of care. Where non-specific or “other” categories exist, further analysis may be required, prior to using normative and relative efficiency measures. In general, procedure codes should be used for grouping when measuring hospital efficiency while diagnosis codes should be used when measuring physician efficiency. However, it’s important to note that a significant portion of hospital stays do not involve surgery and that, conversely, for some specialties – in particular surgeons – the procedure defines their involvement.
Identifying standard time period and adjustments for chronic conditions
The common convention is to use a 360-day time window. However, longer time periods can also be used. Where possible, adjustment for relative severity of illness of such conditions may be quantified based on the diagnosis coding and other lab and demographic data associated to the patient.
Determining exclusions of specific procedures/procedures/cases
Common exclusions: • Transplants: leukemia with bone marrow, heart, lung,
liver, kidney, etc… • Burns w/ & w/out surgery • All diseases and conditions mapped to “other” and non-
specific catch all categories. Accounting for
total population experience in severity of illness
Use emerging population based risk-adjusting methods that evaluate groups of patients and their associated episodes of care, as opposed to evaluation of each discrete episode. Approaches to account for differences in population composition and relative risk are desired, but should not mask true variation. When using market basket and other normalization approaches, data sources and market basket composition should be scrutinized to make sure that populations are comparable.
Treating of outlier observations
If sufficient episode volume exists from internal data, outlier thresholds should be defined for each episode type at 2-2.5 standard deviations from mean, otherwise reliance on third party cut points may be applied. Total episode experience across specialties or within peer group specialties may be used – again, case volume should be considered in order to ensure representative experience dispersion.
Recognition of start and finish for acute conditions
Fragmented and incomplete episodes should be removed from analyses. Clean period durations are condition specific.
Version 1.0 12-31-2004 Page 19 of 51 All rights reserved, The Leapfrog Group, Bridges To Excellence
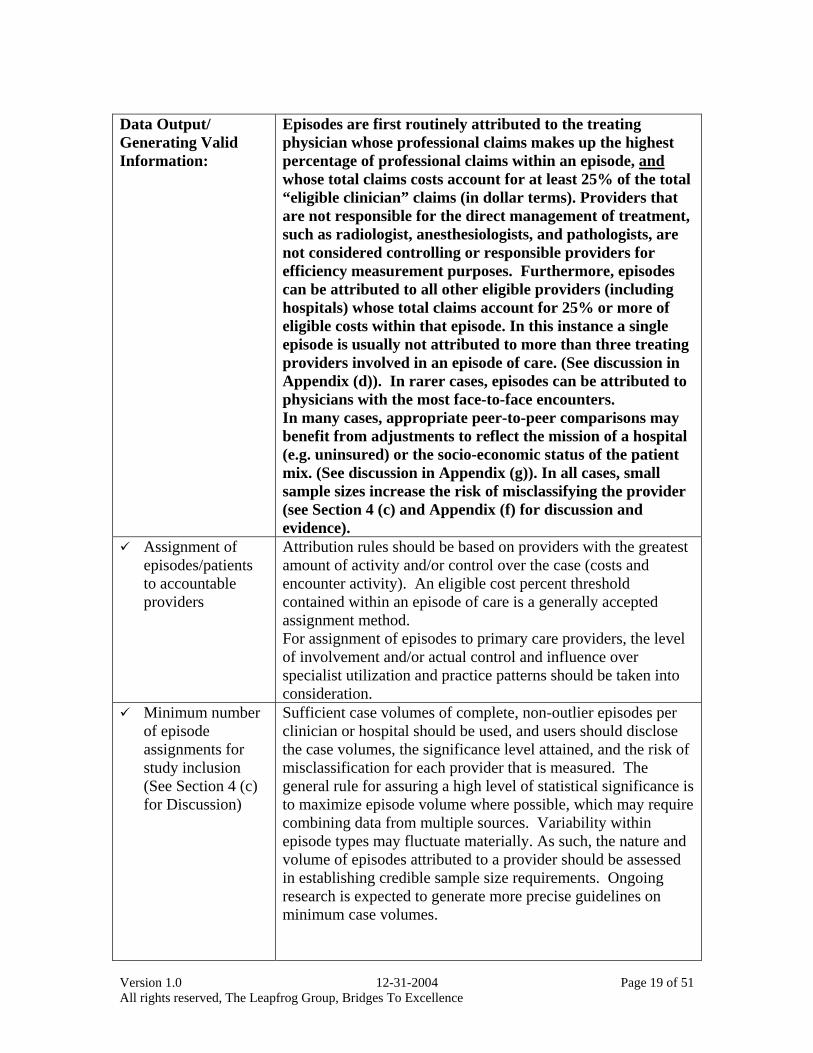
Data Output/ Generating Valid Information:
Episodes are first routinely attributed to the treating physician whose professional claims makes up the highest percentage of professional claims within an episode, and whose total claims costs account for at least 25% of the total “eligible clinician” claims (in dollar terms). Providers that are not responsible for the direct management of treatment, such as radiologist, anesthesiologists, and pathologists, are not considered controlling or responsible providers for efficiency measurement purposes. Furthermore, episodes can be attributed to all other eligible providers (including hospitals) whose total claims account for 25% or more of eligible costs within that episode. In this instance a single episode is usually not attributed to more than three treating providers involved in an episode of care. (See discussion in Appendix (d)). In rarer cases, episodes can be attributed to physicians with the most face-to-face encounters. In many cases, appropriate peer-to-peer comparisons may benefit from adjustments to reflect the mission of a hospital (e.g. uninsured) or the socio-economic status of the patient mix. (See discussion in Appendix (g)). In all cases, small sample sizes increase the risk of misclassifying the provider (see Section 4 (c) and Appendix (f) for discussion and evidence).
Assignment of episodes/patients to accountable providers
Attribution rules should be based on providers with the greatest amount of activity and/or control over the case (costs and encounter activity). An eligible cost percent threshold contained within an episode of care is a generally accepted assignment method. For assignment of episodes to primary care providers, the level of involvement and/or actual control and influence over specialist utilization and practice patterns should be taken into consideration.
Minimum number of episode assignments for study inclusion (See Section 4 (c) for Discussion)
Sufficient case volumes of complete, non-outlier episodes per clinician or hospital should be used, and users should disclose the case volumes, the significance level attained, and the risk of misclassification for each provider that is measured. The general rule for assuring a high level of statistical significance is to maximize episode volume where possible, which may require combining data from multiple sources. Variability within episode types may fluctuate materially. As such, the nature and volume of episodes attributed to a provider should be assessed in establishing credible sample size requirements. Ongoing research is expected to generate more precise guidelines on minimum case volumes.
Version 1.0 12-31-2004 Page 20 of 51 All rights reserved, The Leapfrog Group, Bridges To Excellence
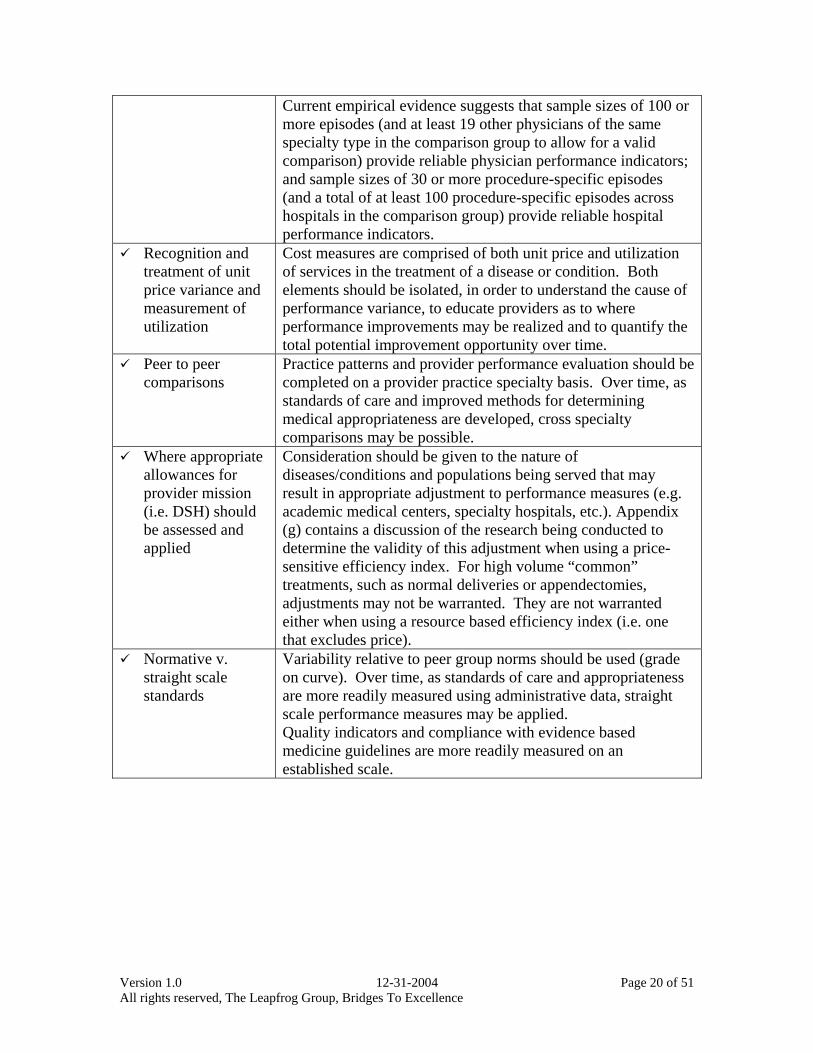
Current empirical evidence suggests that sample sizes of 100 or more episodes (and at least 19 other physicians of the same specialty type in the comparison group to allow for a valid comparison) provide reliable physician performance indicators; and sample sizes of 30 or more procedure-specific episodes (and a total of at least 100 procedure-specific episodes across hospitals in the comparison group) provide reliable hospital performance indicators.
Recognition and treatment of unit price variance and measurement of utilization
Cost measures are comprised of both unit price and utilization of services in the treatment of a disease or condition. Both elements should be isolated, in order to understand the cause of performance variance, to educate providers as to where performance improvements may be realized and to quantify the total potential improvement opportunity over time.
Peer to peer comparisons
Practice patterns and provider performance evaluation should be completed on a provider practice specialty basis. Over time, as standards of care and improved methods for determining medical appropriateness are developed, cross specialty comparisons may be possible.
Where appropriate allowances for provider mission (i.e. DSH) should be assessed and applied
Consideration should be given to the nature of diseases/conditions and populations being served that may result in appropriate adjustment to performance measures (e.g. academic medical centers, specialty hospitals, etc.). Appendix (g) contains a discussion of the research being conducted to determine the validity of this adjustment when using a price-sensitive efficiency index. For high volume “common” treatments, such as normal deliveries or appendectomies, adjustments may not be warranted. They are not warranted either when using a resource based efficiency index (i.e. one that excludes price).
Normative v. straight scale standards
Variability relative to peer group norms should be used (grade on curve). Over time, as standards of care and appropriateness are more readily measured using administrative data, straight scale performance measures may be applied. Quality indicators and compliance with evidence based medicine guidelines are more readily measured on an established scale.
Version 1.0 12-31-2004 Page 21 of 51 All rights reserved, The Leapfrog Group, Bridges To Excellence
4) Discussion
Measurement entails comparisons, and comparisons lead to differentiation, and that’s always uncomfortable for those that are being compared. In today’s environment, comparisons have ramifications on income, and that creates an even greater demand for the best possible rigor to be applied in the measurement effort.
Almost universally, when asked what is most important in designing measures,
those being measured will respond that the measures (or measurement system) must be fair, lead to valid conclusions, and create an actionable result. As this Paper has already described, multiple stakeholders put these same attributes forth, and that is what has guided our recommendations.
During the process of outlining these recommendations, the team had many
discussions during which the advantages and disadvantages of any individual recommendation were advanced and debated. Below are the results of a few of those discussions, and we invite readers of this paper to continue the discussion at www.regence.com/research:
a) Limitations on Individual and Group Measurement Limitations in measurement at both the individual and group level should
be highlighted. In some cases, care is delivered by a group of physicians rather than a single physician, and it’s important to understand the relationship between the providers and their impact on the patient’s outcomes in cost and quality. Conversely, in many cases, measurement at the individual level limits the availability of adequate sample sizes, which means some metrics may only be measurable on a group level. Of course, the major limitation of measuring at the group level is that the more the data is rolled up from individuals to group the more you lose in terms of finding opportunity for improvement.
The more data are aggregated across procedures or across physicians, the more the results will have a tendency to cluster around the mean. Whenever variation at the provider or procedure level gets masked, interpreting the results becomes more challenging, and acting on those results very difficult.
b) Limitations on Using Episodes as Basis for Calculating Efficiency Grouping claims into clusters around standard diagnosis and procedure
codes to form episodes is a common way of comparing the relative level of efficiency from one provider to another. However, since procedures inherently reflect higher resource utilization, the severity of the episode may be inappropriately weighted higher and, post severity-adjustment, inadvertently rate a physician more efficient when the procedure may not have been indicated or inappropriately used. For example, a physician who performs a high rate of procedures may be ranked as more efficient, after severity adjustment, when, in fact, that physician may represent less efficient practice patterns by performing more procedures than otherwise
Version 1.0 12-31-2004 Page 22 of 51 All rights reserved, The Leapfrog Group, Bridges To Excellence
appropriate. Removing procedures from the definition of episodes that measure physician efficiency will alleviate this issue.
Since there is an ex ante assumption that delivering the episode is appropriate, any analysis should use national (or other “best-in-class”) benchmarks to compare not only the relative level of efficiency, but also the average quantity of episodes. Health Plans, as a matter of normal network management, should be aware of this limitation and understand how to minimize its impact, in particular by always grouping cases that are clinically similar.
However, it is appropriate to measure hospital efficiency using procedures as the central event around which other claims are grouped into episodes, understanding that external benchmarks should also be used to determine the overall appropriateness of the rate of procedures performed. Information from the Dartmouth Atlas should be particularly useful in that respect.
Over the years, episodes are not the only way health plans have measured provider performance. In fact, population-based metrics were more the norm before the introduction of solid episode-based methodologies and continue to be used. An episode of care approach is an important component of any performance measurement strategy. This is particularly true for assessing specialist performance and the performance of PCPs in non-gatekeeper model insurance products (where the PCP role is not administratively assigned). However, this recommendation completely ignores the potential value of a population-based approach to efficiency, where a provider is assessed using the experience of their entire population of patients – not just the patients who required care and triggered one or more episodes. Such a population-based approach is most useful for assessing PCP performance, where performance for treating a panel of patients is compared. In addition, it could have use when comparing health systems and different components of networks, where total population experience has importance.
In general, a population-based approach would involve PMPM or utilization per 1,000 type measures and use population-based rather than episode-based risk adjusters. Population-based risk adjusters used most widely in the industry for measuring provider performance include (in alphabetical order) -- Adjusted Clinical Groups (ACGs), Diagnostic Cost Groups (DCGs), and Episode Risk Groups (ERGs).
Population-based measures do have some advantages, including measuring overall performance for a population – not just patients with one or more episodes. A provider that keeps their population generally healthy, where acute and some chronic care is only initiated when the patient is relatively sick, could experience more costly episodes, on average.
A related point is the use of population-based measures for patients with systemic, chronic conditions such as diabetes. Assessing how well a provider manages the overall care of these patients – on a population basis – has some value.

Version 1.0 12-31-2004 Page 23 of 51 All rights reserved, The Leapfrog Group, Bridges To Excellence
c) Limitations on Sample Size & Age of Data The empirical analysis contained in this Paper, as well as work done by
other statisticians, continues to point to the need for large sample sizes in analyzing provider efficiency. The confidence interval around the scores created with small sample sizes is large. As a result, only significant outliers can be identified, with all others arrayed around the mean. However, most health plans or third party administrators will find it difficult to accumulate enough valid episodes to meet the sample size requirements for all their providers, thus decreasing their ability to measure efficiency.
In general, the threshold will depend on two factors: (1) some asymptotic relationship between sample size and standard error – at what point does additional sample size produce only a modest increase in precision, and (2) the “taste” for variation – what confidence interval size is acceptable to all parties involved in the measurement exercise.
There are two strategies that plans can adopt to mitigate small sample sizes. The first is to only measure the providers that it can. By definition, these will be a plan’s top volume providers, those that see the majority of the plan’s members, and therefore those whose performance it is most important to measure. However, plans using this strategy should find external benchmarks against which to assess the relative performance of their providers to ensure that providers deemed efficient are, in fact, efficient. The second strategy is to pool data across payers. There are a number of initiatives of this type that are being developed around the country and that offer all the plans an equal ability to measure the relative level of efficiency of all their network providers.
There is another option available, namely to go back in time as far as needed to accumulate the necessary amount of episodes to reach the minimum sample size. There is a risk in doing so of missing any improvements that the provider may have realized more recently, and it also creates a risk of lack of comparability – based on changes in service pricing (contracts and fee schedules) and changes in technology.
d) Limitations on any Single Methodology Using any episode-based methodology alone to calculate efficiency will
have limitations because of its design. For example, and as discussed above, calculating a physician or group’s overall efficiency would likely require more of a population based comparison as opposed to an individual episode comparison. Similarly DCGs, which are widely used by Medicare, are more appropriate to establish a population based case mix risk classification.
Comprehensive analyses of provider efficiency at different levels of the value chain require different sets of tools to be applied appropriately, and most likely a combination of tools.
Version 1.0 12-31-2004 Page 24 of 51 All rights reserved, The Leapfrog Group, Bridges To Excellence
e) Limitations on using Medical Claims only Some physician efficiency performance measures may be materially
impacted by inclusion/exclusion of pharmacy claims experience. Some empirical evidence suggests that, in a commercially insured
population, the range in variation and the number of providers whose performance measures change from efficient to inefficient/inefficient to efficient can be significant when analyzing data using one common method. However, further analysis and research is needed to determine if this finding holds true using different methodology, or on different types of populations (i.e. Medicare).
The magnitude of variance and impact on efficiency results appears to affect all provider specialty types, though to varying degrees, although more research is needed to determine the magnitude of the impact when using different minimum number of episodes assigned to each provider.
Commercial carriers should rely on efficiency measures that include both medical and pharmacy claims experience whenever possible. “False positives and negatives” may result from efficiency analyses that exclude pharmacy experience.

Version 1.0 12-31-2004 Page 25 of 51 All rights reserved, The Leapfrog Group, Bridges To Excellence
5) Appendices
a) About the Processes i) Design for Six Sigma (DFSS) ii) Quality Functional Deployment (QFD)
b) About the Sponsors and Supporters of this Effort c) About the Multi-Stakeholder Team
i) Stakeholder Representation ii) Member Biographies and Affiliations
d) About Attribution Rules i) Advantages and Disadvantages of Various Methods ii) Analysis of Impact of % Claims Threshold on Attribution
e) About Pharmacy Data i) Analysis of Impact of Inclusion or Exclusion of Pharmacy Data ii) Conclusions and Implications
f) About Sample Sizes i) Analysis of Impact of Sample Sizes on Reliability of Measure ii) Conclusions and Implications
g) About Hospital Mission Adjustments
Version 1.0 12-31-2004 Page 26 of 51 All rights reserved, The Leapfrog Group, Bridges To Excellence
a) About the Processes
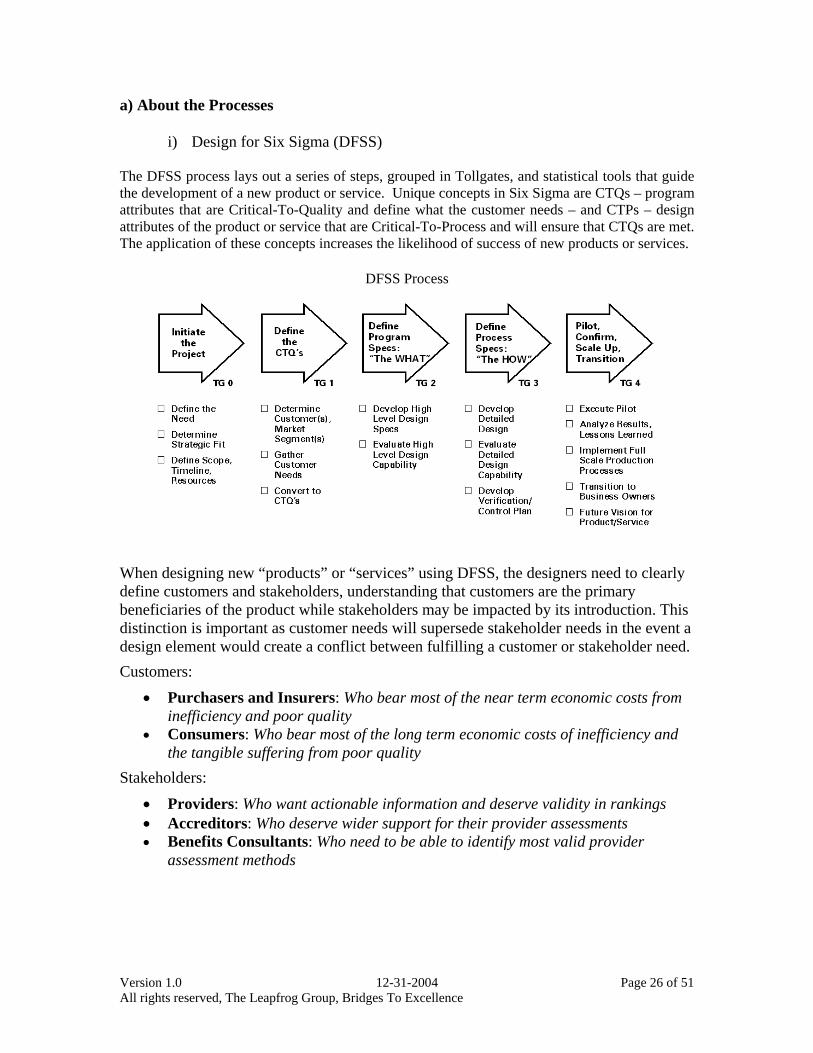
i) Design for Six Sigma (DFSS) The DFSS process lays out a series of steps, grouped in Tollgates, and statistical tools that guide the development of a new product or service. Unique concepts in Six Sigma are CTQs – program attributes that are Critical-To-Quality and define what the customer needs – and CTPs – design attributes of the product or service that are Critical-To-Process and will ensure that CTQs are met. The application of these concepts increases the likelihood of success of new products or services.
DFSS Process
When designing new “products” or “services” using DFSS, the designers need to clearly define customers and stakeholders, understanding that customers are the primary beneficiaries of the product while stakeholders may be impacted by its introduction. This distinction is important as customer needs will supersede stakeholder needs in the event a design element would create a conflict between fulfilling a customer or stakeholder need. Customers:
• Purchasers and Insurers: Who bear most of the near term economic costs from inefficiency and poor quality
• Consumers: Who bear most of the long term economic costs of inefficiency and the tangible suffering from poor quality
Stakeholders: • Providers: Who want actionable information and deserve validity in rankings • Accreditors: Who deserve wider support for their provider assessments • Benefits Consultants: Who need to be able to identify most valid provider
assessment methods
Version 1.0 12-31-2004 Page 27 of 51 All rights reserved, The Leapfrog Group, Bridges To Excellence
Customer Needs: Health plans stated that efficiency measures must be operational and feasible to implement and able to be incorporated into existing processes and systems. In addition plans articulated challenges of data collection, in particular the costs of collecting chart data, which need to be addressed. However, they also felt that the principles should be validated, specific, measurable, and actionable. To the extent possible, measures of care efficiency and effectiveness should recognize a plan’s ability to help manage patient care. Finally, methods used in measuring efficiency should be fair to plans of all sizes. Purchasers need measures to be validated and standardized to enable valid comparisons across plans and networks. Efficiency has to reflect the overall cost of providing care services to a patient over time. Efficiency measures should be married to quality measurement to avoid sacrificing one for the other. Measures have to provide the greatest possible impact, be feasible and enable fair, reliable and reproducible evaluation of providers, plans and networks. The measures must be adoptable by all plans without increasing plan-related costs. Consumers want information that is: credible, reliable, understandable, actionable, expert-based, timely and easy to access. Consumers want their plan sponsor to act as an information hub, giving them the knowledge to make informed choices. Consumers want an employer or plan to remind them periodically about where they can find the information they need. Consumers want access to providers of their choice, even if these providers are not of high quality.
Stakeholder Needs:
Providers want any methods used in measuring efficiency to be valid, fair and equitable when reflecting performance, differentiating between unit price and resource use/practice pattern, mindful of patient health status, sample sizes and appropriateness of peer-to-peer comparisons. The measures have to provide valid comparisons to help evaluate a physician or medical group practice and differentiate it from others when the data shows meaningful differences. Performance measures have to enable greater efficiency and an associated increase in the bottom line. Measures have to recognize creativity, leadership and organizational effectiveness. Finally, measures should not create a burden on office or staff, or create conflicts with patients. Accreditors want the adoption of scientifically valid methods in formulating measures. Measures should have a reasonable scoring methodology, as well as result in wide provider, purchaser and plan support to adopt these methods in future accreditation. Benefits consultants want consistent methodology that is applied industry wide for measuring provider performance. They also want the methodology to allow for aggregation of results among health plans. Rules should be objective with neutral measures, which mitigate “gaming” risk by providers and payors. Finally, efficiency analyses, which are based today mainly on administrative data, should evolve over time to include meaningful clinical data from patients’ medical records.
Version 1.0 12-31-2004 Page 28 of 51 All rights reserved, The Leapfrog Group, Bridges To Excellence
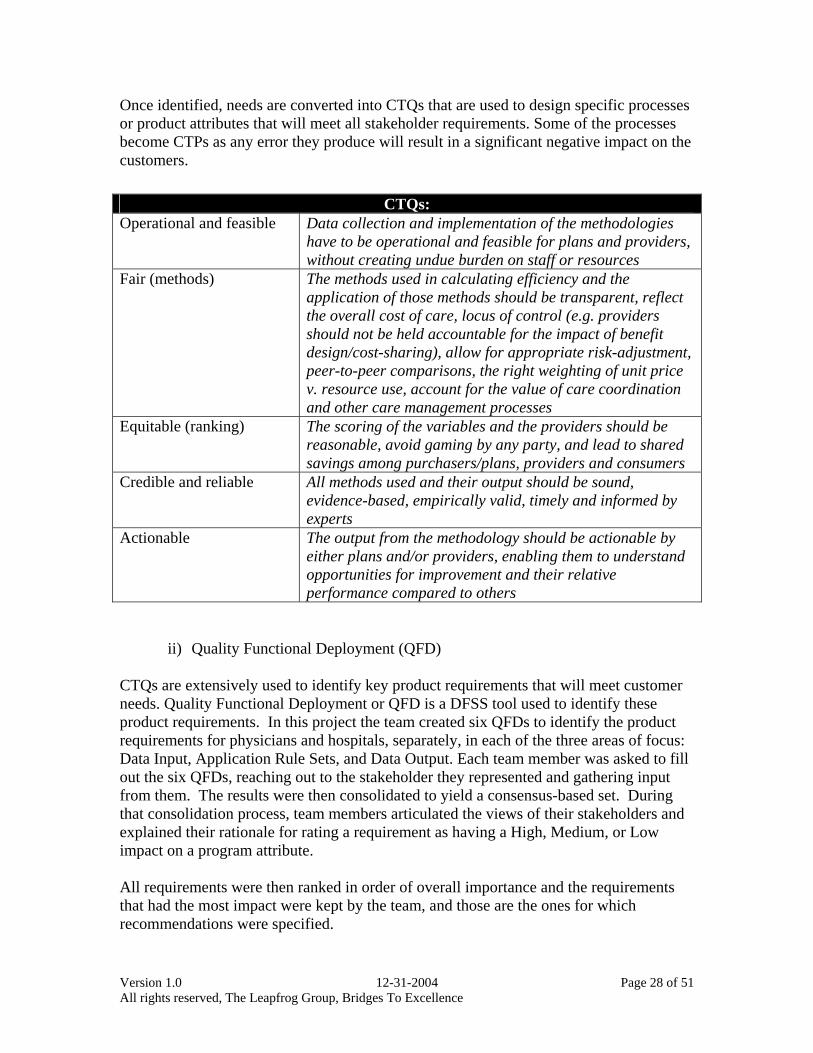
Once identified, needs are converted into CTQs that are used to design specific processes or product attributes that will meet all stakeholder requirements. Some of the processes become CTPs as any error they produce will result in a significant negative impact on the customers.
CTQs: Operational and feasible Data collection and implementation of the methodologies
have to be operational and feasible for plans and providers, without creating undue burden on staff or resources
Fair (methods) The methods used in calculating efficiency and the application of those methods should be transparent, reflect the overall cost of care, locus of control (e.g. providers should not be held accountable for the impact of benefit design/cost-sharing), allow for appropriate risk-adjustment, peer-to-peer comparisons, the right weighting of unit price v. resource use, account for the value of care coordination and other care management processes
Equitable (ranking) The scoring of the variables and the providers should be reasonable, avoid gaming by any party, and lead to shared savings among purchasers/plans, providers and consumers
Credible and reliable All methods used and their output should be sound, evidence-based, empirically valid, timely and informed by experts
Actionable The output from the methodology should be actionable by either plans and/or providers, enabling them to understand opportunities for improvement and their relative performance compared to others
ii) Quality Functional Deployment (QFD)
CTQs are extensively used to identify key product requirements that will meet customer needs. Quality Functional Deployment or QFD is a DFSS tool used to identify these product requirements. In this project the team created six QFDs to identify the product requirements for physicians and hospitals, separately, in each of the three areas of focus: Data Input, Application Rule Sets, and Data Output. Each team member was asked to fill out the six QFDs, reaching out to the stakeholder they represented and gathering input from them. The results were then consolidated to yield a consensus-based set. During that consolidation process, team members articulated the views of their stakeholders and explained their rationale for rating a requirement as having a High, Medium, or Low impact on a program attribute. All requirements were then ranked in order of overall importance and the requirements that had the most impact were kept by the team, and those are the ones for which recommendations were specified.
Version 1.0 12-31-2004 Page 29 of 51 All rights reserved, The Leapfrog Group, Bridges To Excellence
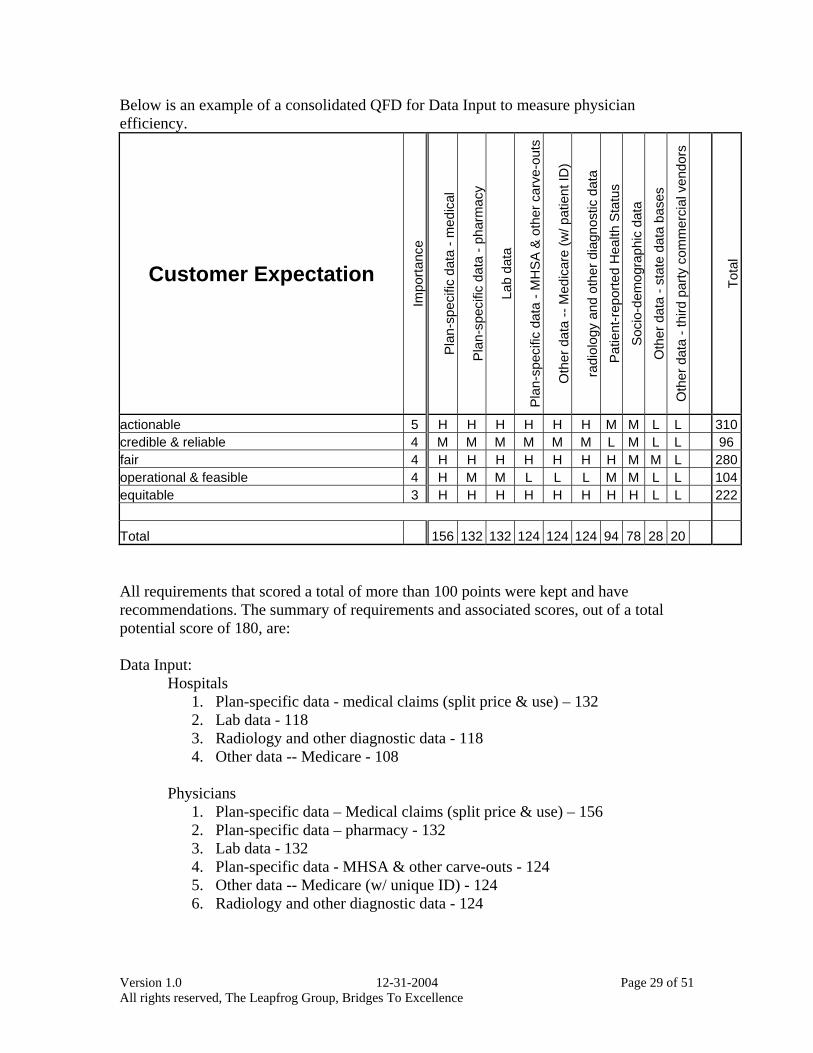
Below is an example of a consolidated QFD for Data Input to measure physician efficiency.
Customer Expectation
Impo
rtanc
e
Pla
n-sp
ecifi
c da
ta -
med
ical
Pla
n-sp
ecifi
c da
ta -
phar
mac
y
Lab
data
Pla
n-sp
ecifi
c da
ta -
MH
SA
& o
ther
car
ve-o
uts
Oth
er d
ata
-- M
edic
are
(w/ p
atie
nt ID
)
radi
olog
y an
d ot
her d
iagn
ostic
dat
a
Pat
ient
-rep
orte
d H
ealth
Sta
tus
Soc
io-d
emog
raph
ic d
ata
Oth
er d
ata
- sta
te d
ata
base
s
Oth
er d
ata
- thi
rd p
arty
com
mer
cial
ven
dors
Tota
l
actionable 5 H H H H H H M M L L 310credible & reliable 4 M M M M M M L M L L 96fair 4 H H H H H H H M M L 280operational & feasible 4 H M M L L L M M L L 104equitable 3 H H H H H H H H L L 222
Total 156 132 132 124 124 124 94 78 28 20 All requirements that scored a total of more than 100 points were kept and have recommendations. The summary of requirements and associated scores, out of a total potential score of 180, are: Data Input:
Hospitals 1. Plan-specific data - medical claims (split price & use) – 132 2. Lab data - 118 3. Radiology and other diagnostic data - 118 4. Other data -- Medicare - 108
Physicians
1. Plan-specific data – Medical claims (split price & use) – 156 2. Plan-specific data – pharmacy - 132 3. Lab data - 132 4. Plan-specific data - MHSA & other carve-outs - 124 5. Other data -- Medicare (w/ unique ID) - 124 6. Radiology and other diagnostic data - 124
Version 1.0 12-31-2004 Page 30 of 51 All rights reserved, The Leapfrog Group, Bridges To Excellence
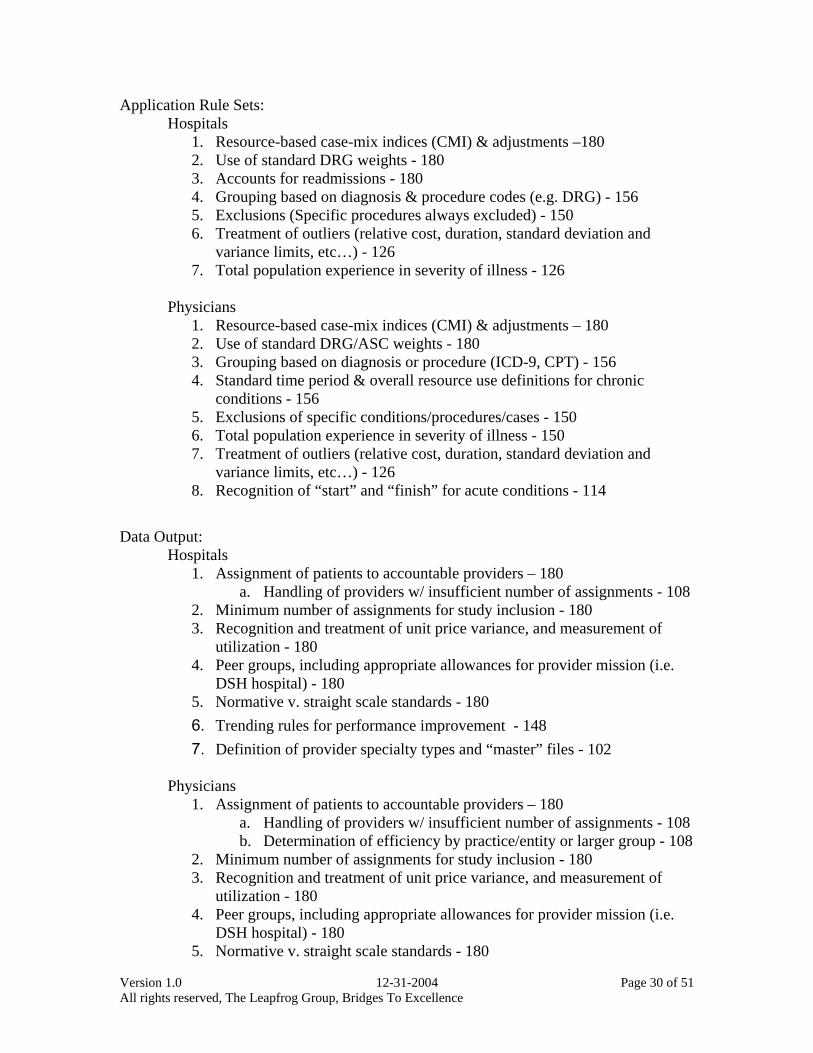
Application Rule Sets: Hospitals
1. Resource-based case-mix indices (CMI) & adjustments –180 2. Use of standard DRG weights - 180 3. Accounts for readmissions - 180 4. Grouping based on diagnosis & procedure codes (e.g. DRG) - 156 5. Exclusions (Specific procedures always excluded) - 150 6. Treatment of outliers (relative cost, duration, standard deviation and
variance limits, etc…) - 126 7. Total population experience in severity of illness - 126
Physicians
1. Resource-based case-mix indices (CMI) & adjustments – 180 2. Use of standard DRG/ASC weights - 180 3. Grouping based on diagnosis or procedure (ICD-9, CPT) - 156 4. Standard time period & overall resource use definitions for chronic
conditions - 156 5. Exclusions of specific conditions/procedures/cases - 150 6. Total population experience in severity of illness - 150 7. Treatment of outliers (relative cost, duration, standard deviation and
variance limits, etc…) - 126 8. Recognition of “start” and “finish” for acute conditions - 114
Data Output:
Hospitals 1. Assignment of patients to accountable providers – 180
a. Handling of providers w/ insufficient number of assignments - 108 2. Minimum number of assignments for study inclusion - 180 3. Recognition and treatment of unit price variance, and measurement of
utilization - 180 4. Peer groups, including appropriate allowances for provider mission (i.e.
DSH hospital) - 180 5. Normative v. straight scale standards - 180 6. Trending rules for performance improvement - 148 7. Definition of provider specialty types and “master” files - 102
Physicians
1. Assignment of patients to accountable providers – 180 a. Handling of providers w/ insufficient number of assignments - 108 b. Determination of efficiency by practice/entity or larger group - 108
2. Minimum number of assignments for study inclusion - 180 3. Recognition and treatment of unit price variance, and measurement of
utilization - 180 4. Peer groups, including appropriate allowances for provider mission (i.e.
DSH hospital) - 180 5. Normative v. straight scale standards - 180

Version 1.0 12-31-2004 Page 31 of 51 All rights reserved, The Leapfrog Group, Bridges To Excellence
6. Trending rules for performance improvement - 148 7. Definition of provider specialty types and “master” files - 102
The relative importance of the requirements outlined above underscores the importance of the third step in current methods of measuring provider efficiency: the data output, or ability to generate valid information. As such, the recommendations made in this area are considered to be the strongest, and need to be applied as closely as possible by payers and purchasers to ensure that results are valid.

Version 1.0 12-31-2004 Page 32 of 51 All rights reserved, The Leapfrog Group, Bridges To Excellence
b) About the Sponsors and Supporters of this Effort
i) The Leapfrog Group: The Leapfrog Group is an initiative driven by organizations that buy health care who are working to initiate breakthrough improvements in the safety, quality and affordability of healthcare for Americans. It is a voluntary program aimed at mobilizing employer purchasing power to alert America’s health industry that big leaps in health care safety, quality and customer value will be recognized and rewarded.
ii) Bridges To Excellence: Bridges to Excellence is a not-for-profit organization with a Board composed of representatives from employers, providers and plans. The Corporation is not formed for pecuniary profit or financial gain. The Corporation is organized to create significant advances in the quality of health care by:
1. Providing tools, information and support to consumers of health care services, 2. Conducting research with respect to existing health care provider reimbursement
models, 3. Developing reimbursement models that encourage the recognition of health care
providers who demonstrate that they have implemented comprehensive solutions in the management of patients and deliver safe, timely, effective, efficient, equitable and patient-centered care, which is based on adherence to quality guidelines and outcomes achievement.

Version 1.0 12-31-2004 Page 33 of 51 All rights reserved, The Leapfrog Group, Bridges To Excellence
c) About the Multi-Stakeholder Team i) Stakeholder Representation
Physicians and representatives of provider organizations, health plans, purchasers, benefit consultants, Accreditors, and subject matter experts were all represented in this effort. On the core team (with members listed below) stakeholder representatives were tasked to consistently and continuously seek input from their peers to gather as broad a base of comments and perspectives as possible. Consumers were not directly represented in this effort, nor were consumers sought for input on the recommendations contained in this paper due to its highly technical nature. However, consumer input was brought in based on prior research conducted by several team members.
ii) Member Biographies and Affiliations Mark Rattray, MD, is Vice President of The Regence Group and Chief Medical Officer for Regence BlueShield, a 1.1 million-member health plan in Washington State. His previous activities include Regional Medical Director for PacifiCare of California, clinical informatics development at CareScience, Inc., and a six year career with Health Net, Inc. as medical director, divisional chief medical officer, and plan president of its Washington and Oregon subsidiaries. He is Board Certified in Obstetrics and Gynecology and was in private practice for 12 years in the Seattle area. He is a faculty member of the University of Washington School of Medicine. Dr. Rattray serves on NCQA’s Efficiency Measurement Advisory Panel, the National Forum on Performance Benchmarking of Physician Offices and Organizations, The Leapfrog Group / Bridges to Excellence core team on clinician efficiency and private expert panels on clinical performance measurement and improvement. Arnold Milstein, MD, is the Medical Director of the Pacific Business Group on Health (PBGH) and a Worldwide Partner at Mercer Human Resource Consulting. PBGH is the largest health care purchasers coalition in the U.S. His work and publications focus on health care purchasing strategy, clinical performance measurement, and the psychology of clinical performance improvement. He co-founded both the Leapfrog Group and the Consumer-Purchaser Disclosure Project. He heads performance measurement activities for both initiatives. Previously a Rosenthal Lecturer at the Institute of Medicine, the New England Journal of Medicine’s series on employer sponsored health insurance described him as a “pioneer” in efforts to advance quality of care. Educated at Harvard (BA-Economics), Tufts (MD) and UC-Berkeley (MPH-Health Services Evaluation and Planning), he is an associate clinical professor at the University of California at San Francisco.

Version 1.0 12-31-2004 Page 34 of 51 All rights reserved, The Leapfrog Group, Bridges To Excellence
Ray Herschman is a Senior Consultant and Principal with Mercer Human Resource Consulting, in their Health and Group Benefits practice based in Chicago and Cleveland. He is Mercer’s national practice leader for consumer driven health care strategy, specializing in the areas of eHealth, consumer decision support, provider cost and quality profiling and health care public policy. Ray works with employers, providers and carriers to support their efforts in improving service and enhancing the value of employer sponsored group healthcare benefits. Ray has been a guest speaker on the topics of health care market reform, public policy, provider performance measurement and the concepts of consumer driven health care for the Robert Wood Johnson Foundation, The Center for Health Systems Change, the Washington Business Group on Health, the US Chamber of Commerce, CMS and many other national health symposiums. Ray is a graduate of the University of Wisconsin – Madison with a bachelor’s degree in Chemistry and a Masters of Science degree in Accounting and Health Care Finance. He is currently a research associate at the Harvard Business School and an advisory board member at the Case Western Reserve University graduate school of business. Joachim Roski, PhD, MPH, serves as Vice-President, Performance Measurement for the National Committee for Quality Assurance (NCQA) in Washington, DC. NCQA is a private, not-for-profit organization committed to assessing, reporting on and improving the quality of health care. Dr. Roski joined NCQA in 2000 and currently oversees the organization’s activities pertaining to performance measure development, research, analysis, and public and private sector contracting. He currently serves as Principal Investigator or co-investigator on several research or demonstration projects in the area of health care quality evaluation and provider-level performance measurement. Many of these efforts have been funded by the US Department of Health and Human Services/Centers for Medicare and Medicaid Services, the Robert-Wood-Johnson Foundation, the Commonwealth Fund, the US Agency of Healthcare Quality and Research, and others. He is a frequent speaker at national and international conferences and is the author of numerous articles in the area of health care quality and health improvement. Prior to joining NCQA, Dr. Roski served as Director of Quality and Performance Effectiveness for Allina Health System in Minneapolis, MN and as Research Director in the Division of Epidemiology, School of Public Health, University of Minnesota. He has served on the Board of Examiners for the Baldrige National Quality Program – US Department of Commerce, grant review committees for the US Agency for Healthcare Quality and Research, and as a lecturer on health care quality for the US State Department. He currently holds an adjunct faculty appointment at the Ludwig-Maximilian University, Munich, Germany (Department of Public Health).

Version 1.0 12-31-2004 Page 35 of 51 All rights reserved, The Leapfrog Group, Bridges To Excellence
Suzanne Delbanco, PhD, MPH, is the first Executive Director of The Leapfrog Group. Founded by the Business Roundtable, The Leapfrog Group's goal is to mobilize employer purchasing power to initiate breakthrough improvements in the safety and overall value of healthcare for American consumers. The Group’s growing consortium of more than 145 Fortune 500 companies and other large private and public health care purchasers provides health benefits to more than 34 million Americans, and spends more than $60 billion on health care annually. Suzanne is a member of the NCQA Purchaser Advisory Council and the National Quality Forum’s Safe Practices Advisory Panel. Before joining The Leapfrog Group, she was a senior manager at the Pacific Business Group on Health where she worked on the Quality Team. Prior to joining PBGH, Suzanne worked on reproductive health policy and the changing healthcare marketplace initiative at the Henry J. Kaiser Family Foundation. She has also consulted on health insurance coverage in the temporary employment industry, the first statewide survey in California of Medi-Cal beneficiaries, and worked as a community liaison for Kaiser Permanente during the establishment of one of California’s first County Organized Health Systems. Suzanne holds a Ph.D. in Public Policy from the Goldman School of Public Policy and a M.P.H. from the School of Public Health at the University of California, Berkeley. Kelly Hall plays a dual role in strategic planning and business development for Partners HealthCare System, the Boston-based integrated delivery system founded by Massachusetts General Hospital and Brigham and Women’s Hospital. As Director of Strategic Planning for Partners Community Healthcare, Inc. (PCHI), the physician network for Partners HealthCare System, she has led a range of strategic initiatives aimed at improving the quality and efficiency of health services delivered to PCHI patients. They have ranged from evaluating opportunities in pharmacy management, to working with local employers to improve effectiveness and efficiency of care, to leading a major collaboration between PCHI and a large health plan with the goal of achieving transformational improvements in the way care is delivered to plan members. As Senior Manager in Partners Business Planning, Kelly plays a leadership role in identifying and assessing business development opportunities for both Partners hospitals and PCHI physicians, including ambulatory ventures and other clinical collaborations. In addition, she plays a key role in formulating provider network development strategy. Ms. Hall has over 14 years of experience in for-profit and not-for-profit health care delivery, with particular emphasis on delivery system development and health system strategy. Prior to joining PCHI, Ms. Hall was the Director of Delivery System Development for the Motion Picture and Television Fund in Southern California. She is a member of the New England Society for Healthcare Strategy.

Version 1.0 12-31-2004 Page 36 of 51 All rights reserved, The Leapfrog Group, Bridges To Excellence
Jeff Levin-Scherz is the Chief Medical Officer of Partners Community HealthCare, Inc, the division of Partners HealthCare System which owns community physician practices, negotiates managed care contracts on behalf of integrated and affiliated hospitals and 1100 primary care doctors and 4500 specialists, and arranges programs to further clinical integration among Partners constituencies. He was previously a senior consultant with Reden & Anders, a national health care consulting and actuarial firm, where he served as clinical lead on clinical, operational, analytic and strategic projects for health plans, providers, and employers. He led the Medical Cost Trend Management initiative, and evaluation of return on investment from medical management programs. Prior to that, he was Vice President and Corporate Medical Director at Tufts Health Plan, where he led the department responsible for physician utilization management, health programs and disease management, and measurement of clinical quality, and co-chaired the plan’s Provider Strategy Team. He spearheaded clinical efforts to control health care premium inflation and efforts and overhaul case management. Previously, he was the President of the Mount Auburn Cambridge Independent Practice Association, comprised at the time of 350 physicians at three community teaching hospitals caring for 40,000 patients under managed care contracts. He practiced primary care internal medicine for nine years in the Boston area. Dr. Levin-Scherz is a Clinical Instructor at Harvard Medical School and an Assistant Clinical Professor of Public Health and Family Medicine at Tufts University School of Medicine. He is an Adjunct Lecturer at the Harvard School of Public Health, and an Associate Medical Director of Tufts Health Care Institute. He graduated from Boston University School of Medicine and completed his residency at Mount Auburn Hospital in Cambridge, MA. He is board certified in Internal Medicine, and a Fellow of the American College of Physicians. He completed his MBA at Columbia University. Francois de Brantes, is the Program Leader for various healthcare initiatives in GE’s Corporate Health Care department. Francois is responsible for developing the conceptual framework and the implementation of key strategic programs, in particular GE's Active Consumer strategy. He attended the University of Paris IX - Dauphine where he earned a Masters in Finance and Taxation. After completing his military service as a platoon leader in a Light Cavalry Regiment, he attended the Tuck School of Business Administration at Dartmouth College, where he graduated with an MBA. Upon graduation, he started a small asset management company with a partner, focused primarily on real estate. The business grew to managing a portfolio valued at several hundred million dollars and 30 employees. He subsequently joined McDougall Associates, a Marketing Communications firm, as VP of Strategic Initiatives. In that capacity, he became a consultant to GE's Corporate Healthcare team.

Version 1.0 12-31-2004 Page 37 of 51 All rights reserved, The Leapfrog Group, Bridges To Excellence
He was then hired by GE to take a broad role focusing on many strategic initiatives, especially creating, connecting and supporting Active Consumers, and defining market mechanisms to reward providers for better performance. As part of this new role, Francois launched a nationally recognized program, Bridges To Excellence, which received a grant from the Robert Wood Johnson Foundation. Bridges To Excellence is designed to align incentives between patients, providers and purchasers around better quality care and the adoption of system of care that will reduce errors in medicine. He is also the leader of the incentives and rewards Lily Pad, a group that is designing pilots around the country to create incentives for hospitals to adopt the Leapfrog safe practices. In addition Francois is on an advisory committee for CMS’s Doctor Office Quality demonstration program, the purpose of which is to design measures to assess high performance in physician practices, and is a member of the eHealthInitiative’s Board of Directors and Leadership Council.
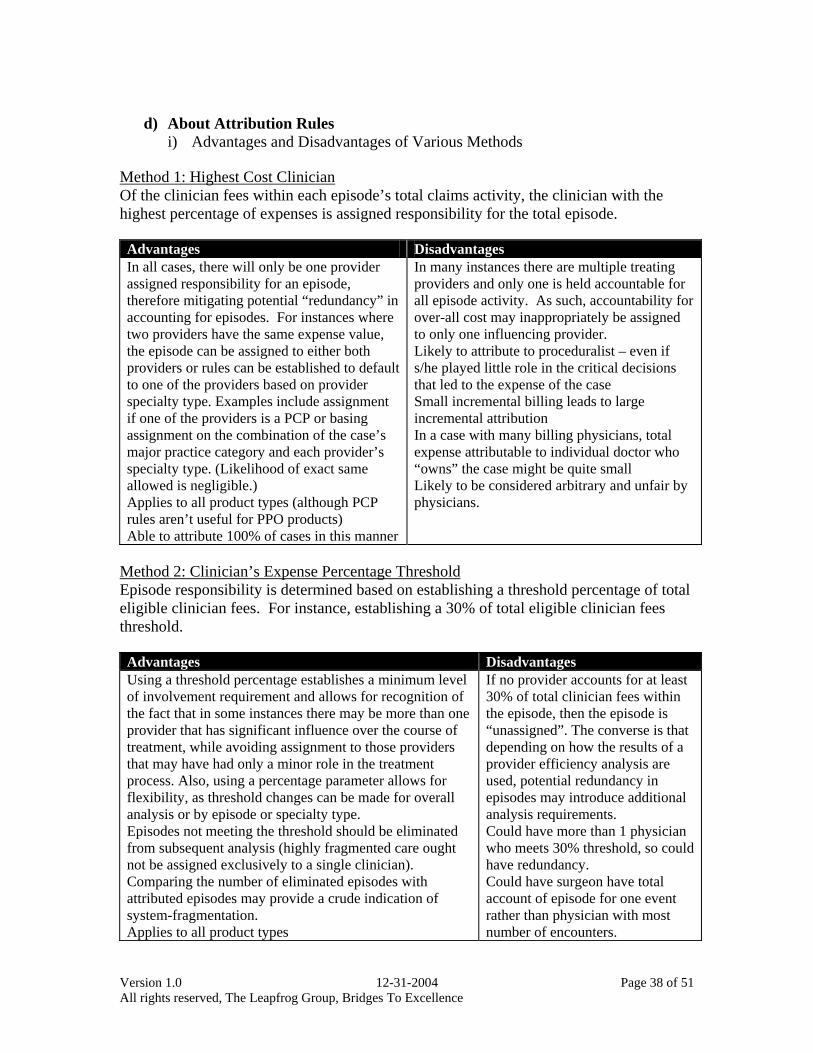
Version 1.0 12-31-2004 Page 38 of 51 All rights reserved, The Leapfrog Group, Bridges To Excellence
d) About Attribution Rules
i) Advantages and Disadvantages of Various Methods Method 1: Highest Cost Clinician Of the clinician fees within each episode’s total claims activity, the clinician with the highest percentage of expenses is assigned responsibility for the total episode. Advantages Disadvantages In all cases, there will only be one provider assigned responsibility for an episode, therefore mitigating potential “redundancy” in accounting for episodes. For instances where two providers have the same expense value, the episode can be assigned to either both providers or rules can be established to default to one of the providers based on provider specialty type. Examples include assignment if one of the providers is a PCP or basing assignment on the combination of the case’s major practice category and each provider’s specialty type. (Likelihood of exact same allowed is negligible.) Applies to all product types (although PCP rules aren’t useful for PPO products) Able to attribute 100% of cases in this manner
In many instances there are multiple treating providers and only one is held accountable for all episode activity. As such, accountability for over-all cost may inappropriately be assigned to only one influencing provider. Likely to attribute to proceduralist – even if s/he played little role in the critical decisions that led to the expense of the case Small incremental billing leads to large incremental attribution In a case with many billing physicians, total expense attributable to individual doctor who “owns” the case might be quite small Likely to be considered arbitrary and unfair by physicians.
Method 2: Clinician’s Expense Percentage Threshold Episode responsibility is determined based on establishing a threshold percentage of total eligible clinician fees. For instance, establishing a 30% of total eligible clinician fees threshold. Advantages Disadvantages Using a threshold percentage establishes a minimum level of involvement requirement and allows for recognition of the fact that in some instances there may be more than one provider that has significant influence over the course of treatment, while avoiding assignment to those providers that may have had only a minor role in the treatment process. Also, using a percentage parameter allows for flexibility, as threshold changes can be made for overall analysis or by episode or specialty type. Episodes not meeting the threshold should be eliminated from subsequent analysis (highly fragmented care ought not be assigned exclusively to a single clinician). Comparing the number of eliminated episodes with attributed episodes may provide a crude indication of system-fragmentation. Applies to all product types
If no provider accounts for at least 30% of total clinician fees within the episode, then the episode is “unassigned”. The converse is that depending on how the results of a provider efficiency analysis are used, potential redundancy in episodes may introduce additional analysis requirements. Could have more than 1 physician who meets 30% threshold, so could have redundancy. Could have surgeon have total account of episode for one event rather than physician with most number of encounters.
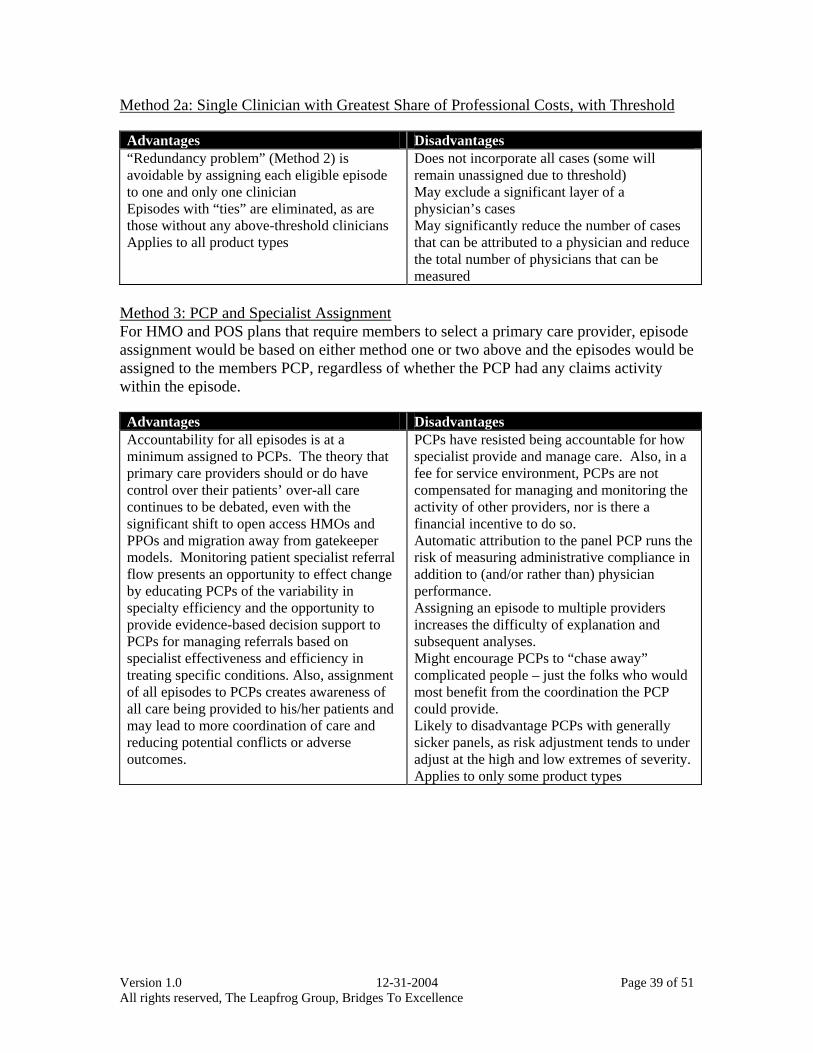
Version 1.0 12-31-2004 Page 39 of 51 All rights reserved, The Leapfrog Group, Bridges To Excellence
Method 2a: Single Clinician with Greatest Share of Professional Costs, with Threshold Advantages Disadvantages “Redundancy problem” (Method 2) is avoidable by assigning each eligible episode to one and only one clinician Episodes with “ties” are eliminated, as are those without any above-threshold clinicians Applies to all product types
Does not incorporate all cases (some will remain unassigned due to threshold) May exclude a significant layer of a physician’s cases May significantly reduce the number of cases that can be attributed to a physician and reduce the total number of physicians that can be measured
Method 3: PCP and Specialist Assignment For HMO and POS plans that require members to select a primary care provider, episode assignment would be based on either method one or two above and the episodes would be assigned to the members PCP, regardless of whether the PCP had any claims activity within the episode. Advantages Disadvantages Accountability for all episodes is at a minimum assigned to PCPs. The theory that primary care providers should or do have control over their patients’ over-all care continues to be debated, even with the significant shift to open access HMOs and PPOs and migration away from gatekeeper models. Monitoring patient specialist referral flow presents an opportunity to effect change by educating PCPs of the variability in specialty efficiency and the opportunity to provide evidence-based decision support to PCPs for managing referrals based on specialist effectiveness and efficiency in treating specific conditions. Also, assignment of all episodes to PCPs creates awareness of all care being provided to his/her patients and may lead to more coordination of care and reducing potential conflicts or adverse outcomes.
PCPs have resisted being accountable for how specialist provide and manage care. Also, in a fee for service environment, PCPs are not compensated for managing and monitoring the activity of other providers, nor is there a financial incentive to do so. Automatic attribution to the panel PCP runs the risk of measuring administrative compliance in addition to (and/or rather than) physician performance. Assigning an episode to multiple providers increases the difficulty of explanation and subsequent analyses. Might encourage PCPs to “chase away” complicated people – just the folks who would most benefit from the coordination the PCP could provide. Likely to disadvantage PCPs with generally sicker panels, as risk adjustment tends to under adjust at the high and low extremes of severity. Applies to only some product types
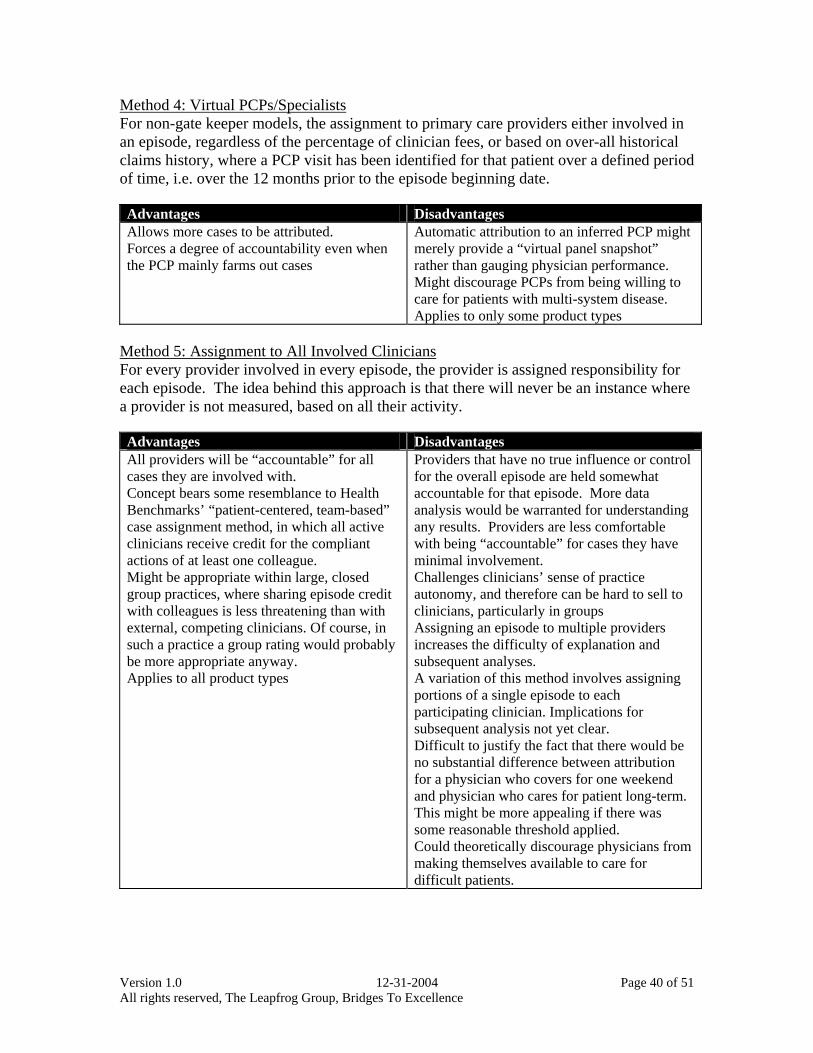
Version 1.0 12-31-2004 Page 40 of 51 All rights reserved, The Leapfrog Group, Bridges To Excellence
Method 4: Virtual PCPs/Specialists For non-gate keeper models, the assignment to primary care providers either involved in an episode, regardless of the percentage of clinician fees, or based on over-all historical claims history, where a PCP visit has been identified for that patient over a defined period of time, i.e. over the 12 months prior to the episode beginning date. Advantages Disadvantages Allows more cases to be attributed. Forces a degree of accountability even when the PCP mainly farms out cases
Automatic attribution to an inferred PCP might merely provide a “virtual panel snapshot” rather than gauging physician performance. Might discourage PCPs from being willing to care for patients with multi-system disease. Applies to only some product types
Method 5: Assignment to All Involved Clinicians For every provider involved in every episode, the provider is assigned responsibility for each episode. The idea behind this approach is that there will never be an instance where a provider is not measured, based on all their activity. Advantages Disadvantages All providers will be “accountable” for all cases they are involved with. Concept bears some resemblance to Health Benchmarks’ “patient-centered, team-based” case assignment method, in which all active clinicians receive credit for the compliant actions of at least one colleague. Might be appropriate within large, closed group practices, where sharing episode credit with colleagues is less threatening than with external, competing clinicians. Of course, in such a practice a group rating would probably be more appropriate anyway. Applies to all product types
Providers that have no true influence or control for the overall episode are held somewhat accountable for that episode. More data analysis would be warranted for understanding any results. Providers are less comfortable with being “accountable” for cases they have minimal involvement. Challenges clinicians’ sense of practice autonomy, and therefore can be hard to sell to clinicians, particularly in groups Assigning an episode to multiple providers increases the difficulty of explanation and subsequent analyses. A variation of this method involves assigning portions of a single episode to each participating clinician. Implications for subsequent analysis not yet clear. Difficult to justify the fact that there would be no substantial difference between attribution for a physician who covers for one weekend and physician who cares for patient long-term. This might be more appealing if there was some reasonable threshold applied. Could theoretically discourage physicians from making themselves available to care for difficult patients.

Version 1.0 12-31-2004 Page 41 of 51 All rights reserved, The Leapfrog Group, Bridges To Excellence
Method 6: Major Procedure Provider For cases where a “significant” procedure occurs within the case, such as of an inpatient surgical case e.g. hip replacement or appendectomy, the provider that renders the service is assigned responsibility for the episode, regardless of the level of involvement of other clinicians. The idea behind this approach is that based on the nature of the procedure, a specific individual provider is in control of and therefore fully responsible for the entire episode. Advantages Disadvantages A single “accountable” provider is established for all such cases. Applies to all product types
Only applies to surgical episode types. Also requires that for each type of surgical episode, that logic be developed to recognize the eligible cases and specific procedures are identified for provider assignment. In some cases, providers may be held accountable for a case that other providers may have direct influence over how the case was treated and whether surgical procedures were warranted. Usually, major procedures dominate episode professional costs. This approach may already be represented in Methods 1 and 2.
Method 7: Most Face-to-Face Encounters Advantages Disadvantages Avoids using dollars, which can be influenced by contracting differences Eligible E&M codes can be tailored to include/exclude/weight emergency room, hospital rounding, nursing home and office visits. Single-procedure but costly surgical episodes could still be assigned to primary care clinicians, making referral decisions more critical to efficiency scores. Applies to all product types
Single-procedure but costly surgical episodes may still be assigned to primary care clinician, reducing episode volume for evaluating surgical specialty efficiency. As a practical matter, little ranking of surgical specialists will be possible with this method.
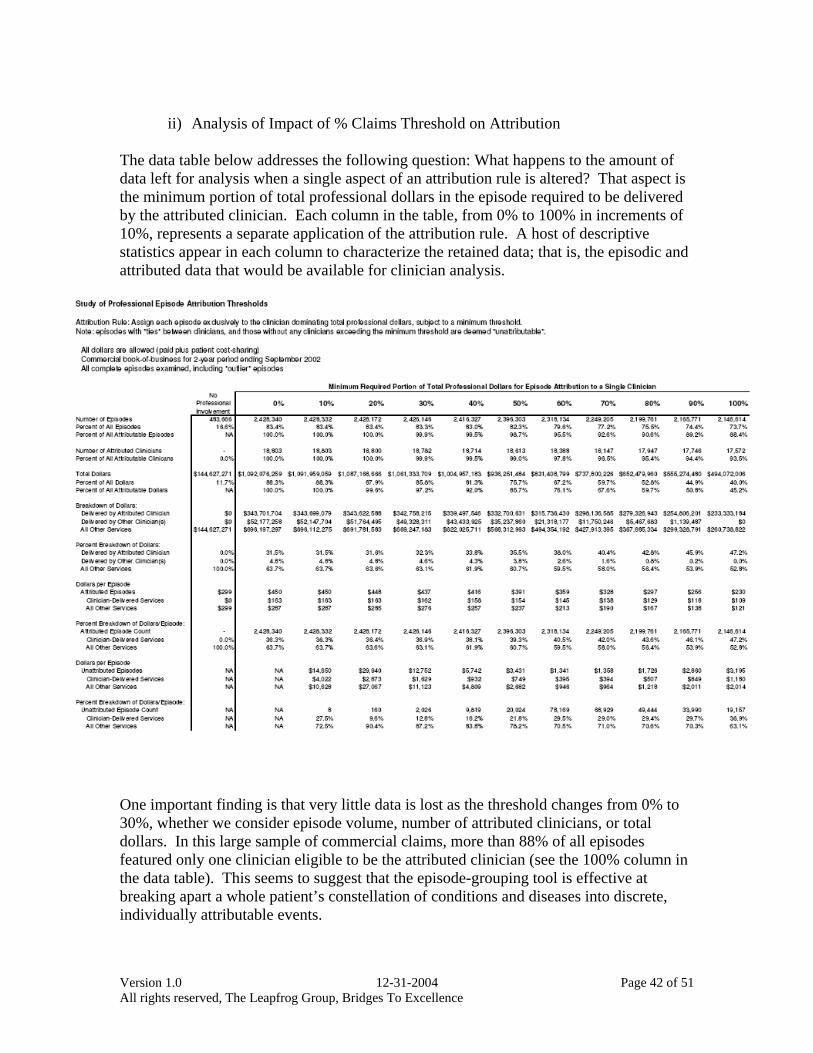
Version 1.0 12-31-2004 Page 42 of 51 All rights reserved, The Leapfrog Group, Bridges To Excellence
ii) Analysis of Impact of % Claims Threshold on Attribution
The data table below addresses the following question: What happens to the amount of data left for analysis when a single aspect of an attribution rule is altered? That aspect is the minimum portion of total professional dollars in the episode required to be delivered by the attributed clinician. Each column in the table, from 0% to 100% in increments of 10%, represents a separate application of the attribution rule. A host of descriptive statistics appear in each column to characterize the retained data; that is, the episodic and attributed data that would be available for clinician analysis.
One important finding is that very little data is lost as the threshold changes from 0% to 30%, whether we consider episode volume, number of attributed clinicians, or total dollars. In this large sample of commercial claims, more than 88% of all episodes featured only one clinician eligible to be the attributed clinician (see the 100% column in the data table). This seems to suggest that the episode-grouping tool is effective at breaking apart a whole patient’s constellation of conditions and diseases into discrete, individually attributable events.
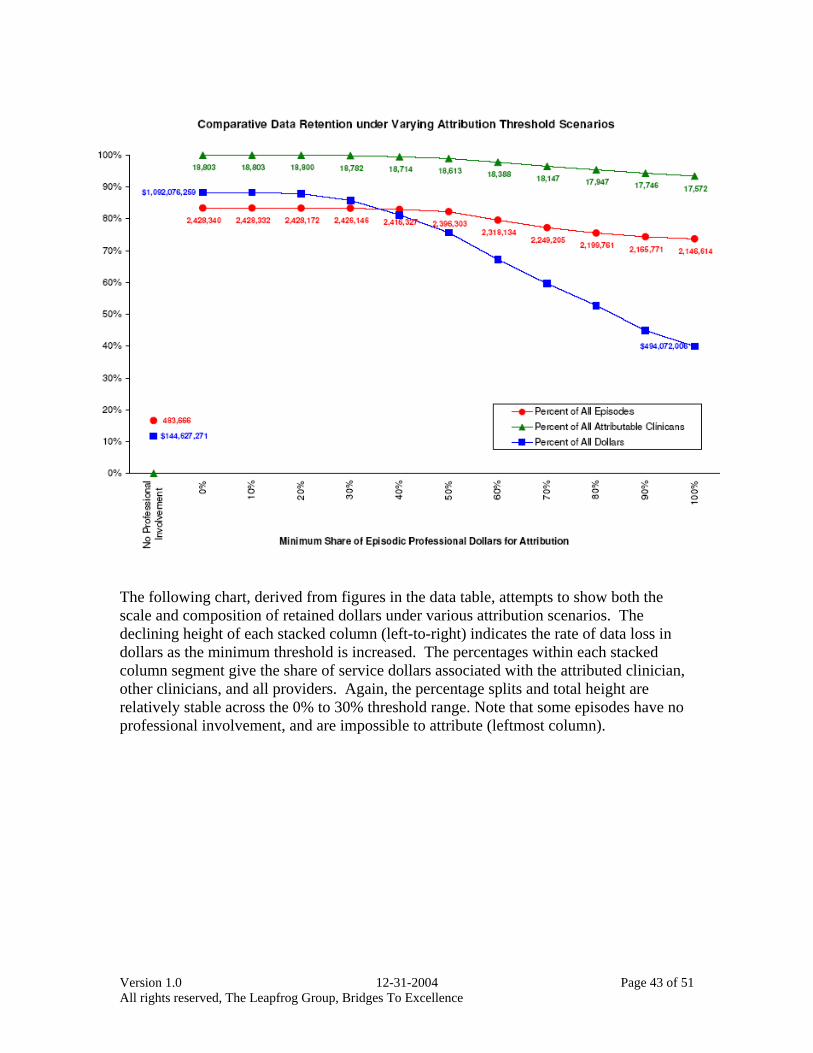
Version 1.0 12-31-2004 Page 43 of 51 All rights reserved, The Leapfrog Group, Bridges To Excellence
The following chart, derived from figures in the data table, attempts to show both the scale and composition of retained dollars under various attribution scenarios. The declining height of each stacked column (left-to-right) indicates the rate of data loss in dollars as the minimum threshold is increased. The percentages within each stacked column segment give the share of service dollars associated with the attributed clinician, other clinicians, and all providers. Again, the percentage splits and total height are relatively stable across the 0% to 30% threshold range. Note that some episodes have no professional involvement, and are impossible to attribute (leftmost column).
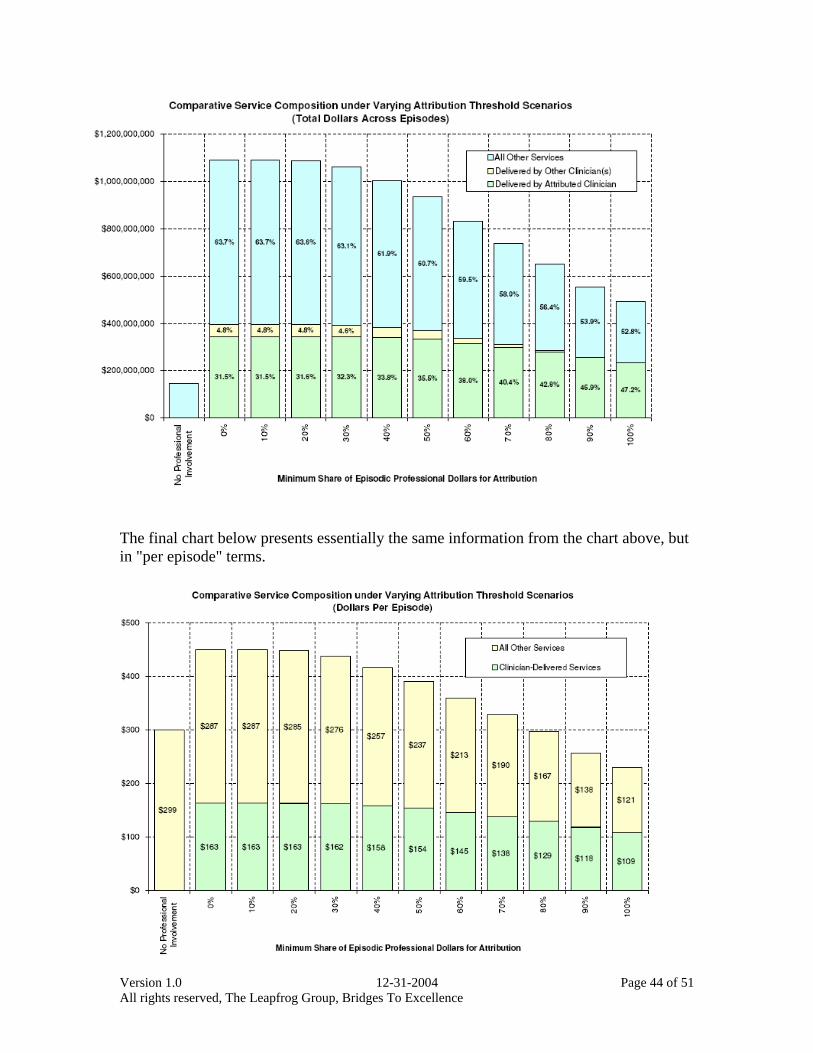
Version 1.0 12-31-2004 Page 44 of 51 All rights reserved, The Leapfrog Group, Bridges To Excellence
The final chart below presents essentially the same information from the chart above, but in "per episode" terms.
Version 1.0 12-31-2004 Page 45 of 51 All rights reserved, The Leapfrog Group, Bridges To Excellence
e) About Pharmacy Data i) Analysis of Impact of Inclusion or Exclusion of Pharmacy Data
While this is an area that requires much more research before making broad-based conclusions, there is some empirical evidence that suggests that including pharmacy data has an impact on the efficiency score given to a physician. The research study described below was performed on a commercially insured population. Since the results were not compared to actual physician performance, the conclusions mainly focus on the potential for misclassification when pharmacy data are excluded, to the extent they are available. Study Design: Efficiency performance measures were completed for 2,728 unique providers, across multiple specialty types, for members with both medical and pharmacy claims experience. Efficiency performance measures were completed for the same 2,728
providers, using the same medical claims experience, excluding pharmacy experience.
Using the medical + pharmacy based performance scores, providers were segregated into efficient (<1) and inefficient (>1), regardless of whether or not they were different from the mean. Providers were then categorized into efficient and inefficient based on medical only performance scores.
Variances in provider status were analyzed by analyzing the number of providers that changed status (efficient to inefficient and inefficient to efficient.
Compute the percentage change in performance scores of all providers We chose to examine all providers that had at least 30 complete non-
outlier episodes, reflecting the current average level of episodes that are routinely used by payers in measuring provider efficiency.
Episodes were attributed to providers who had the highest professional claims within an episode, exceeding a minimum threshold for 25% of eligible clinician fees (eligible clinician fees included all professional fees, excluding hospital based physicians).
Expected episode costs were based on peer group norms for each episode treatment group.
Efficiency performance indices were based on the variance between actual and expected episode costs, on a weighted average, case mix adjusted basis.
ii) Conclusions and Implications: Some provider efficiency performance measures may be materially
impacted by inclusion/exclusion of pharmacy claims experience. It is not known whether these findings would be replicated when using
larger minimum number of episodes

Version 1.0 12-31-2004 Page 46 of 51 All rights reserved, The Leapfrog Group, Bridges To Excellence
The range in variation and the number of providers whose performance measures change from efficient to inefficient/inefficient to efficient is significant.
The magnitude of variance and impact on efficiency results appears to affect all provider specialty types.
Whenever possible, carriers should rely on efficiency measures that include both medical and pharmacy claims experience. “False positives and negatives” may result from efficiency analyses that exclude pharmacy experience.
Further analysis is warranted to assess the impact on a condition specific basis, on different population types, and using different methodologies for assessing provider efficiency.

Version 1.0 12-31-2004 Page 47 of 51 All rights reserved, The Leapfrog Group, Bridges To Excellence
f) About Sample Sizes
i) Analysis of Impact of Sample Sizes on Reliability of Measure Study Design: We began by selecting 5 specialties to study. These are specialties that are
frequently profiled and tend to comprise a significant amount of the health care experience, both in terms of dollars and episodes.
o Cardiovascular Disease o Internal Medicine o Obstetrics/Gynecology o Orthopedic Surgery o Pediatrics
Within each of the 5 specialties, we randomly selected 10 physicians to study from the subset of physicians with at least 100 episodes overall.
The experience that we relied on covers episodes incurred from 2001 through 2003 (36 months) by members residing in Northeast Ohio.
We chose to examine the changes in performance score for each physician at 5 different thresholds:
o n = 20 episodes of care overall o n = 30 o n = 50 o n = 75 o n = 100
For each n, a random number generator selected the n episodes from the pool of actual episodes. The only episodes that were considered for the study were both complete/full-year and non-outlier. After selecting the n episodes, a new performance score was calculated (PI=actual $ /expected $). This process was repeated 200 times for each n, for each provider.
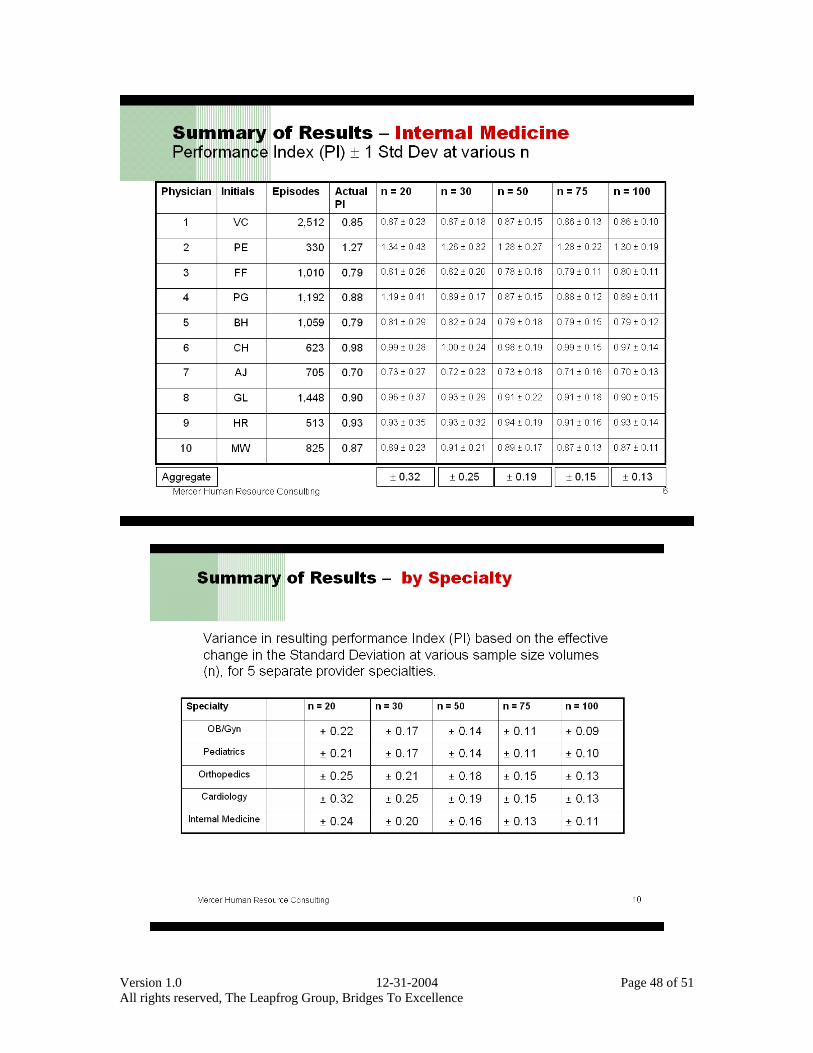
Version 1.0 12-31-2004 Page 48 of 51 All rights reserved, The Leapfrog Group, Bridges To Excellence
Version 1.0 12-31-2004 Page 49 of 51 All rights reserved, The Leapfrog Group, Bridges To Excellence
ii) Conclusions and Implications:
The volume of episodes used in determining a provider’s episodic efficiency has a significant impact on the overall credibility of the resulting performance index (PI).
Conventional sample size thresholds currently being utilized may result in inappropriate classification of a provider’s actual efficiency performance.
The nature of episodes that make up a provider’s practice experience materially affects the volume of episodes necessary to establish a credible performance score.
The observed coefficient of variance by episode varies significantly, contributing to the measured variability by provider specialty type. The required minimum number of episodes needed for a credible efficiency performance index, may need to vary by episode and provider specialty type.
Increasing the minimum episode volume for measuring a provider efficiency performance index will result in a lower number of providers having sufficient volume of cases for measurement.
Most carriers have limitations in data volume required to develop credible measures of provider efficiency performance for the majority of providers in their networks.
Measuring change in provider performance over time may require longer experience periods in order to obtain sufficient volumes of new episodes for effectively quantifying true changes in practice patterns.
Increasing the aggregate claims experience data set size will increase episode volumes by provider and correspondingly decrease the experience period required to complete measures.
Further analysis is warranted to assess volume requirements by specific disease or condition being treated, and also to determine if the findings change when using different methodologies for measuring provider efficiency.

Version 1.0 12-31-2004 Page 50 of 51 All rights reserved, The Leapfrog Group, Bridges To Excellence
g) About Hospital Mission Adjustments
Hospitals differ in fundamental ways that affect their cost structures and financial
status. For example, it is well established that patient care costs at teaching hospitals are higher than costs at non-teaching hospitals, even after adjusting for observed severity of illness. Another example is the disproportionate provision of care by certain hospitals to indigent populations who do not have the resources to cover the cost of their care. These hospitals attempt to cover the cost of uncompensated care through higher reimbursements from private payers, a phenomenon know as cost shifting. Such examples do not necessarily suggest inefficiencies or poor performance on the part of hospitals, but, instead, represent the provision of costly services that benefit their communities. Other examples include: Hospitals with readiness to serve capacity, or special units (burn, trauma, etc.) that
cater to the needs of the community have higher base costs than hospitals without these units.
Other facilities have a very high level of uncompensated care and/or disproportionate share of Medicaid patients. These facilities have much higher variable costs than like facilities without a disfavorable patient mix. In both cases, these facilities have tended to inflate their prices in order to
compensate for higher base costs and/or higher variable costs and still accomplish their mission.
Third-party payers (TPPs) and administrators (TPAs) are increasingly focused on hospital costs, without necessarily recognizing the societal value and associated costs of hospital mission-related activities. In these instances, hospitals’ costs are compared on a case-mix adjusted basis only to establish tiered hospital payment models and/or preferred hospital networks. These payment behaviors have the potential to challenge the ability of teaching hospitals to pursue their missions of teaching, research, and the provision of sophisticated clinical services as well as the potential to impact hospitals that serve the uninsured as part of the hospital safety-net system in place in communities. As reviewed in this White Paper, there are two components of an efficiency index: Resource-based component Looks at actual resources used such as LOS Neutralizes price Includes appropriate severity adjustment Should reflect efficiency without the need for mission adjustments
Price-sensitive based component Includes costs/case actually paid to hospitals Widely used by plans because it reflects actual cost of care Mission-adjustments in addition to severity adjustments may be warranted

Version 1.0 12-31-2004 Page 51 of 51 All rights reserved, The Leapfrog Group, Bridges To Excellence
Mission adjustments may be important in order to enable more equitable peer-to-peer comparisons when using price-sensitive efficiency indices. The Lewin Group was commissioned by Bridges to Excellence to determine whether variations in hospital pricing reflect variations in the following five hospital characteristics:
1. AHC status 2. Teaching intensity (i.e., intern and residents to bed ratio) 3. Disproportionate share levels 4. Specialty facility status (for cardiac surgery) 5. Payer mix (as an indicator for need to cost shift)
The study conducted by the Lewin Group will determine the relationship of these variables to pricing, and will construct potential adjustment factors and then apply them to commercial claims databases to test their validity. If validated, these adjustments will be published and incorporated as part of this paper’s recommendations. It is expected that the study will be completed by the end of the first quarter in 2005. We acknowledge that similar research needs to be conducted on physicians. The decision to start with hospitals was based on the existence of prior research in this area and the greater ability, at this point, to measure the impact of a mission on a hospital than on a physician.