Embed Size (px)
Citation preview

Australia’s experience with
energy provider obligations
Margaret Sniffin
General Manager, NSW Independent Pricing and Regulatory Tribunal
April 18 2012
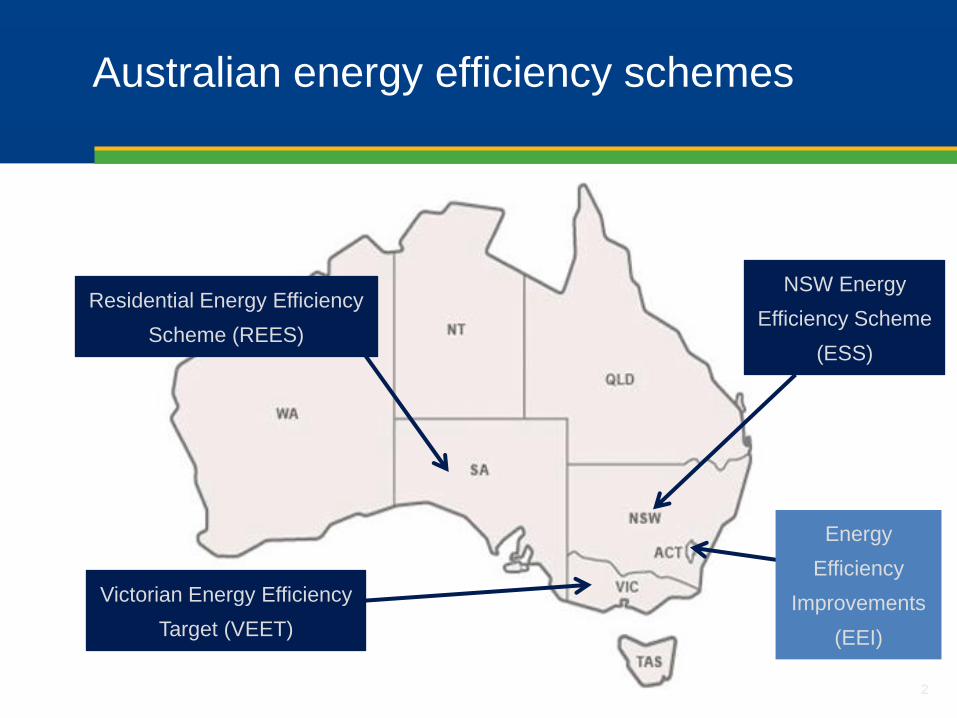
Australian energy efficiency schemes
2 2
NSW Energy
Efficiency Scheme
(ESS)
Residential Energy Efficiency
Scheme (REES)
Victorian Energy Efficiency
Target (VEET)
Energy
Efficiency
Improvements
(EEI)
3
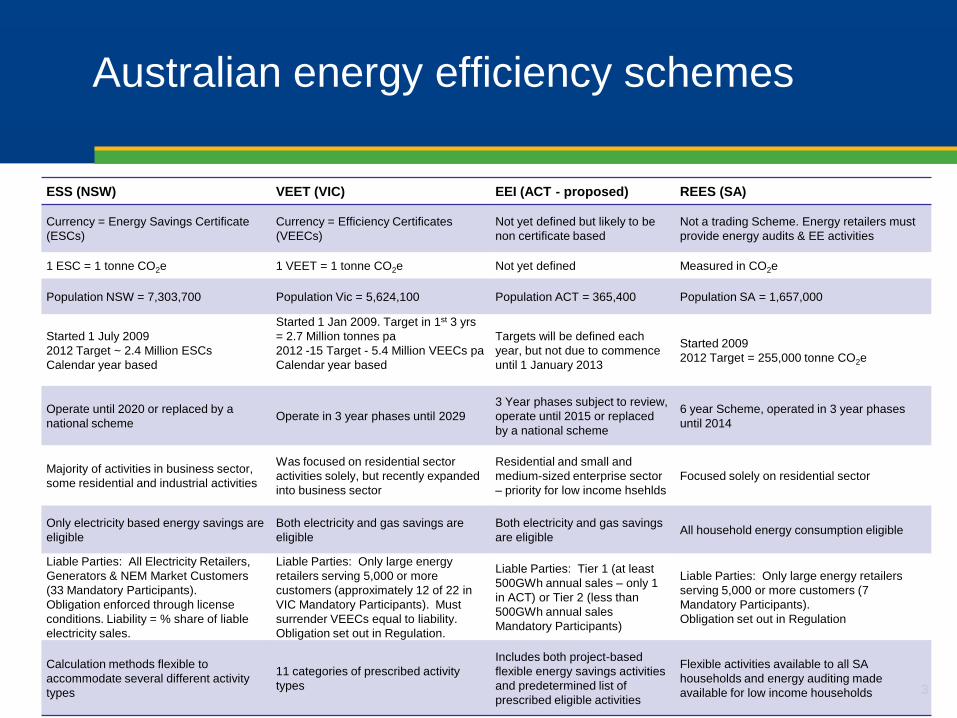
ESS (NSW) VEET (VIC) EEI (ACT - proposed) REES (SA)
Currency = Energy Savings Certificate
(ESCs)
Currency = Efficiency Certificates
(VEECs)
Not yet defined but likely to be
non certificate based
Not a trading Scheme. Energy retailers must
provide energy audits & EE activities
1 ESC = 1 tonne CO2e 1 VEET = 1 tonne CO2e Not yet defined Measured in CO2e
Population NSW = 7,303,700 Population Vic = 5,624,100 Population ACT = 365,400 Population SA = 1,657,000
Started 1 July 2009
2012 Target ~ 2.4 Million ESCs
Calendar year based
Started 1 Jan 2009. Target in 1st 3 yrs
= 2.7 Million tonnes pa
2012 -15 Target - 5.4 Million VEECs pa
Calendar year based
Targets will be defined each
year, but not due to commence
until 1 January 2013
Started 2009
2012 Target = 255,000 tonne CO2e
Operate until 2020 or replaced by a
national scheme Operate in 3 year phases until 2029
3 Year phases subject to review,
operate until 2015 or replaced
by a national scheme
6 year Scheme, operated in 3 year phases
until 2014
Majority of activities in business sector,
some residential and industrial activities
Was focused on residential sector
activities solely, but recently expanded
into business sector
Residential and small and
medium-sized enterprise sector
– priority for low income hsehlds
Focused solely on residential sector
Only electricity based energy savings are
eligible
Both electricity and gas savings are
eligible
Both electricity and gas savings
are eligible All household energy consumption eligible
Liable Parties: All Electricity Retailers,
Generators & NEM Market Customers
(33 Mandatory Participants).
Obligation enforced through license
conditions. Liability = % share of liable
electricity sales.
Liable Parties: Only large energy
retailers serving 5,000 or more
customers (approximately 12 of 22 in
VIC Mandatory Participants). Must
surrender VEECs equal to liability.
Obligation set out in Regulation.
Liable Parties: Tier 1 (at least
500GWh annual sales – only 1
in ACT) or Tier 2 (less than
500GWh annual sales
Mandatory Participants)
Liable Parties: Only large energy retailers
serving 5,000 or more customers (7
Mandatory Participants).
Obligation set out in Regulation
Calculation methods flexible to
accommodate several different activity
types
11 categories of prescribed activity
types
Includes both project-based
flexible energy savings activities
and predetermined list of
prescribed eligible activities
Flexible activities available to all SA
households and energy auditing made
available for low income households
Australian energy efficiency schemes

NSW Energy Savings Scheme (ESS)
ESS commenced on 1 July 2009 – in NSW only
Mandatory scheme – established by legislation Electricity retailers are the liable parties
Market based mechanism that involves the creation and trading of Energy Savings Certificates (ESCs)
Not a funding or grants program – a trading scheme
IPART is both Scheme Administrator and Regulator
we accredit companies to create certificates
we monitor compliance by obligated parties

5
Administrative Structure of ESS
5
Legislation:
Electricity Supply Act
1995 (the Act)
Electricity Supply
Regulation 2001
(the Regulation)
Energy Savings
Scheme Rule
(ESS Rule) – define
eligible activities
Will run to end 2020
unless replaced by a
national scheme

How the Scheme works
Obligation placed on electricity retailers to acquire energy
savings. Can do this by:
carrying out energy savings activities themselves and have
these recognised by IPART to create ESCs, or
buying ESCs from other accredited providers
ESCs are created from activities in the residential, commercial
and industrial sectors
must apply to IPART to be accredited to create ESCs
ESCs trade for around $31 per certificate on spot market
Retailers surrender ESCs against their individual target (based
on their share of total electricity sales in NSW), or pay a penalty

Characteristics of the ESS
Encourages least cost energy efficiency solutions
Uses tradeable certificates – price set by market
1 ESC = 1 tonne of CO2-e; bankable, transferable
Has broad coverage – residential, commercial and industrial
sectors
Broad range of eligible activities with scope to expand
HVAC, pumps, lighting, appliances, refrigeration etc
Broad range of methodologies to calculate savings
Deeming, upfront calculations, on-going assessment
Robust audit and compliance regime
Use of 3rd party independent auditors; risk based approach
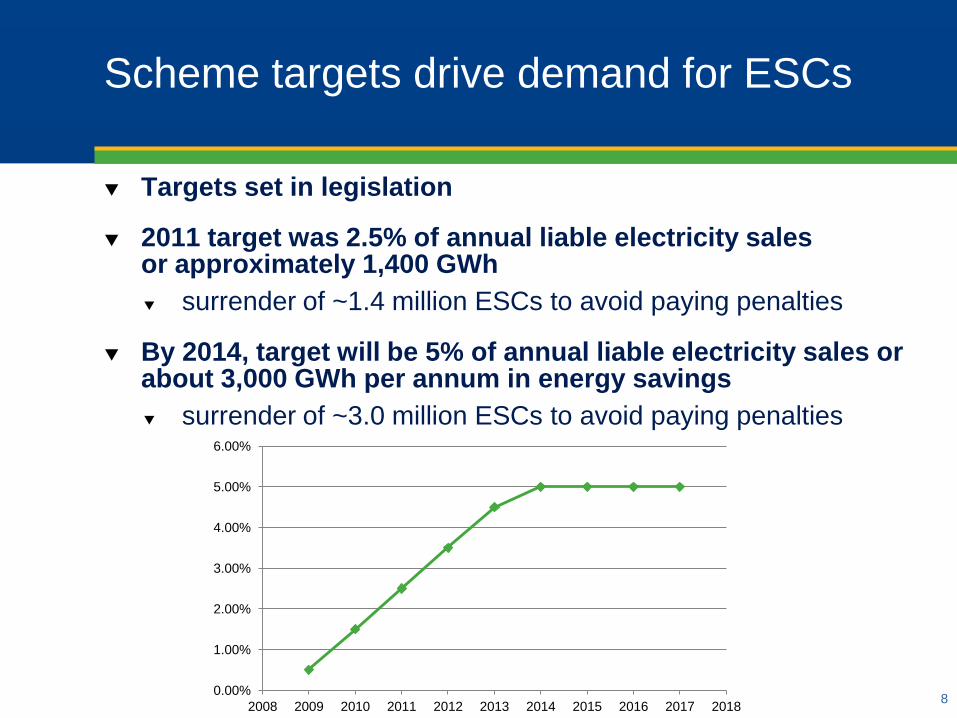
Scheme targets drive demand for ESCs
Targets set in legislation
2011 target was 2.5% of annual liable electricity sales or approximately 1,400 GWh
surrender of ~1.4 million ESCs to avoid paying penalties
By 2014, target will be 5% of annual liable electricity sales or about 3,000 GWh per annum in energy savings
surrender of ~3.0 million ESCs to avoid paying penalties
0.00%
1.00%
2.00%
3.00%
4.00%
5.00%
6.00%
2008 2009 2010 2011 2012 2013 2014 2015 2016 2017 2018 8

Compliance with ESS (electricity retailers)
31 Scheme Participants
Compliance deadline – 18 March
Annual Energy Savings Statements must be signed by auditor unless an exemption has been granted
If no electricity purchases in NSW, then nil return
Scheme Participants can request an amendment and have until June to complete surrenders or pay a penalty. Can carry forward up to 10% of liability
Most Scheme Participants enter into forward contracts for certificates
9

0
20
40
60
80
100
% o
f A
nn
ual
Tar
get
Time
CY2010 ESCcreation
CY2011 ESCcreation to date
CY2011 ESCsto come
CY2011 Targetwith 10% carryforward
ESC Supply & Demand for CY2010 & 11
ESC registered as % of Annual Target. CY2011 includes un-
surrendered prior vintage ESCs
30 June 1 July 31 December

The lifecycle of a ESC
Registration, transfer and surrender of ESCs is done via the Registry at www.ess.nsw.gov.au 11

Cost effectiveness of ESS
Databuild Research & Solutions prepared report “Cost Effectiveness Analysis of ESS”
Covered first 18 months of scheme
Investigated how scheme participants and project providers (ACPs) were delivering the scheme
Quantified costs associated with delivery of projects
Showed that business costs of ACPs for 2009 and 2010 was significantly lower than the selling price for ESCs
Concluded ESS makes both financial and environmental sense

Cost effectiveness of ESS
Costs to participants and businesses small compared to ESC
value
Average cost for each ESC created was $15
Value of energy saved was conservatively $40
Total net benefit of ~$24.50 per ESC
13
ACP Costs ACP Benefits Costs toretailers
Benefits toretailers
Costs toGovernment
Benefits toGovernment
Energysavingsbenefits
Net costbenefit
$/E
SC

Costs and obligations to participate
$500 Application Fee – once off
Annual Reporting – pro forma statement
Report future creation and any changes to project
Not required for small projects with one-off creation of ESCs
Audits - based on risk assessment
Nature of project, ESC volume, compliance history
Costs range from $8,000 - $25,000 per audit
ESC registration fee - $0.70 per certificate
Penalties enforced for contraventions
14
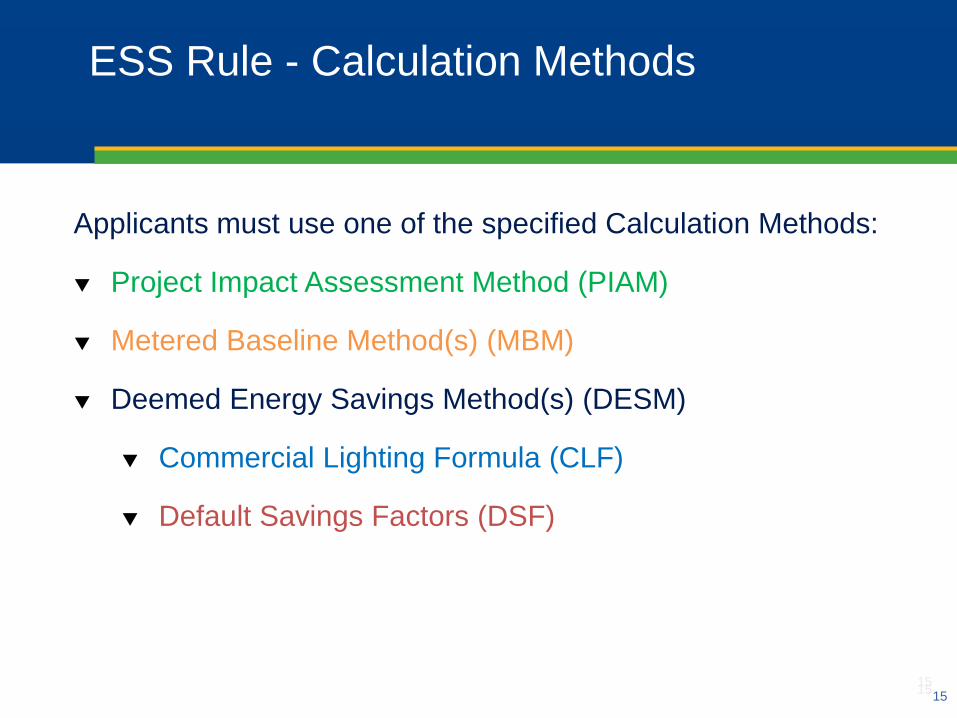
Applicants must use one of the specified Calculation Methods:
Project Impact Assessment Method (PIAM)
Metered Baseline Method(s) (MBM)
Deemed Energy Savings Method(s) (DESM)
Commercial Lighting Formula (CLF)
Default Savings Factors (DSF)
15 15
ESS Rule - Calculation Methods
15

Equipment types and calculation methods
Activity PIAM MBM DESM
CLF
DESM
DSF
Residential Lighting Yes
Commercial Lighting Yes Yes Yes Yes
Whitegoods Sales & Removals Yes
Showerhead Replacement No
Improved NABERS ratings Yes
Commercial equipment Yes Yes
Industrial equipment Yes Yes
Industrial sites & processes Yes Yes
Air
Compressors
HVAC Chillers
Refrigeration
16

Certificates created by methodology
17
4%
14%
0%
32%
1%
49%
20099%
58%
0%
19%
2%
12%
2010
43%
26%
0%
17%
4%
10%
2011
95%
5%
20129%
58%
0%
19%
0%
2%
12%
Commercial Lighting Formula
Default Savings Factors
Power Factor Correction
Baseline per unit of output
Baseline unaffected by output
Normalised by NABERS scheme
Project Impact Assessment Method

Certificates created by project group
18
0
50,000
100,000
150,000
200,000
250,000
300,000
350,000
400,000
450,000
500,000
Pro
cess
Ch
ange
/Co
ntr
ol S
yste
ms
Ligh
tin
g (P
IAM
)
Sho
wer
hea
ds
Ligh
tin
g (C
LF)
Mu
ltip
le a
ctiv
itie
s
Fan
s/P
um
ps
Co
mp
ress
ed
Air
Bu
ildin
g U
pgr
ade
Sho
wer
hea
ds
Pro
cess
Ch
ange
/Co
ntr
ol S
yste
ms
Ligh
tin
g (C
LF)
Ligh
tin
g (P
IAM
)
Co
mp
ress
ed
Air
HV
AC
/Ch
iller
Bu
ildin
g U
pgr
ade
Mu
ltip
le a
ctiv
itie
s
Fan
s/P
um
ps
Re
frig
erat
ion
Ligh
tin
g (D
SF)
Ligh
tin
g (C
LF)
Sho
wer
hea
ds
Pro
cess
Ch
ange
/Co
ntr
ol S
yste
ms
Bu
ildin
g U
pgr
ade
HV
AC
/Ch
iller
Co
mp
ress
ed
Air
Ligh
tin
g (P
IAM
)
Mu
ltip
le a
ctiv
itie
s
Fan
s/P
um
ps
Re
frig
erat
ion
Mu
ltip
le a
ctiv
itie
s
Ligh
tin
g (D
SF)
2009 2010 2011

19
Independent audits used for validation and
verification
Audits conducted by auditors on ESS Audit Panel
Audits check ESC creation & record keeping
Audit regimes based on risk matrix
Consequence – quantum of invalidly created ESCs
Minor Moderate Severe
High Medium Risk High Risk Extreme Risk
Medium Low Risk Medium Risk High Risk
Lik
elih
ood
of
invalid
ESC
cre
ati
on
occu
rrin
g
Low Low Risk Medium Risk Medium Risk

How has ESS performed?
Data as at 5 April 2012
*Note: Certificates forfeited include certificates incorrectly created when registering
^2010 total forfeits largely due to showerhead over-creation
20
Vintage Certificates
created
Certificates
forfeited*
Forfeit rate
2009 277,042 1,137 0.41%
2010 802,022 114,950^ 12.54%^
2011 887,204 3,392 0.38%
2012 44,478 0 0.00%

21
Lessons learned
Balance between upfront assessment & ongoing compliance audits
Encouraging applications from long-term / sustainable businesses – especially industrial sector
Tailoring audit regime to project risk e.g. phone surveys for 3rd party business models
Importance of clear Scheme documentation – new website, new application documents
Improving efficiency of application assessment process - pre-application workshops
Being responsive to changes in market (ie growth in commercial lighting)
21

Thank you
www.ess.nsw.gov.au


![2011. Computer – Big Picture Inside the Big Box [Cabinet] ◦ Energy Provider SMPS ◦ Energy Transmitter Power Cables Data Cables ◦ Energy Consumer](https://img.pdfslide.us/doc/110x75/56649dbc5503460f94aade0a/2011-computer-big-picture-inside-the-big-box-cabinet-energy.jpg)