Embed Size (px)
Citation preview

Measuring Output from Primary Medical Care, with Quality Adjustment
Workshop on measuring Education and Health Volume Output OECD, Paris 6-7 June 2007
Session 4.4
Aileen Simkins, Director, UK Centre for the Measurement of Government Activity
UK Centre for the Measurement of Government Activity

Summary
• Problem, concepts, terminology• Improvements to index of consultations• Measuring impact of primary medical care on
health outcomes• Quality adjusted index of consultations

Problem: Data Sources
• Spending is measured by organisational unit – money paid to general medical practices
• Main data sources are based on administrative mechanisms of payment
• Output of general practice is part of wider healthcare – but hard to track overall pathway
• Unit of activity from general practice is a consultation with a doctor or nurse
• NHS does not count consultations: use household survey (recall bias?)

Concepts: Unit of Output
• Measure output as activity with results – attributable incremental impact on outcome
• Outcome of consultation – information, reassurance, improvement in health status...
• Seek data source to link measures of health status to actions of general practice
• ‘Make me better’ – short term, long term? Compare with initial symptoms, or counterfactual?

Terminology: UK Developments
• 2004 new general practice payment system: Quality and Outcomes Framework (QOF)
• Points for reaching defined indicators – many process, some outcome
• National data from 2004 forwards• QRESEARCH separate system linking GP
records, historic series, more flexible for analysis – large sample, quite representative
Index of Consultations
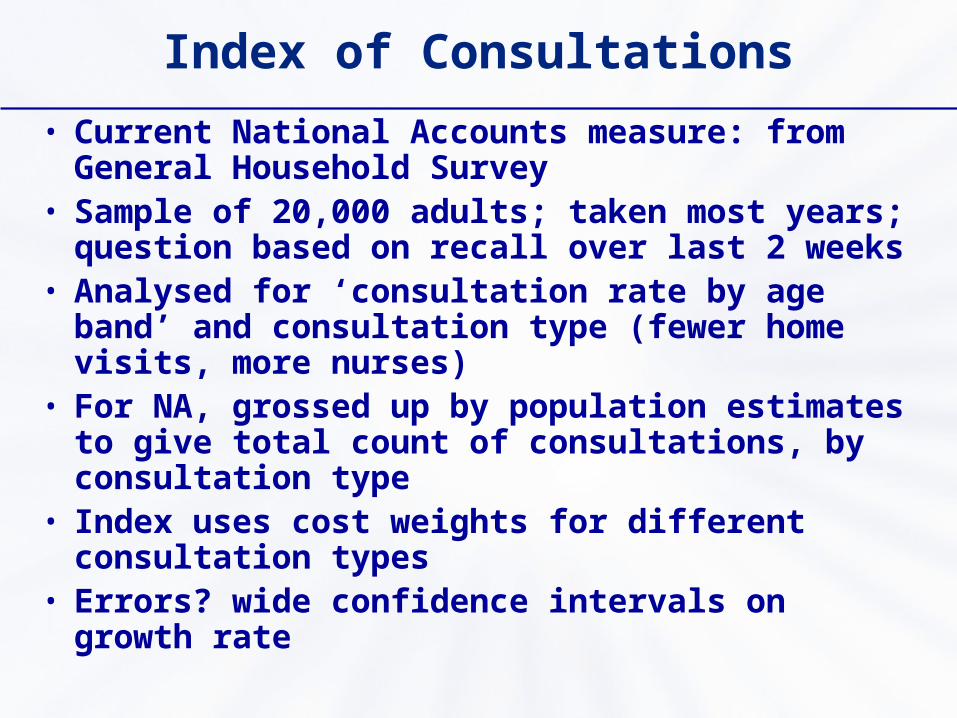
• Current National Accounts measure: from General Household Survey
• Sample of 20,000 adults; taken most years; question based on recall over last 2 weeks
• Analysed for ‘consultation rate by age band’ and consultation type (fewer home visits, more nurses)
• For NA, grossed up by population estimates to give total count of consultations, by consultation type
• Index uses cost weights for different consultation types
• Errors? wide confidence intervals on growth rate

Consultations Measured from Household Survey
0
50,000,000
100,000,000
150,000,000
200,000,000
250,000,000
300,000,000
1995
/96
1996
/97
1997
/98
1998
/99
1999
/00
2000
/01
2001
/02
2002
/03
2003
/04
2004
/05
2005
/06
2006
/07
No
. of
Co
ns
ult
ati
on
s
GHS GPs Practice Nurses

Project: Improve Consultation Series
• ONS, DH, Health and Social Care Information Centre, QRESEARCH, University of York
• Count of consultations from QRESEARCH practices, by type, grossed up
• Grossing up uses regression model which corrects for under-representation
• Based on 489 out of 8,750 practices, not 20,000 out of 50,000,000 people – smaller confidence intervals

New Consultation Series
0
50,000,000
100,000,000
150,000,000
200,000,000
1995
/96
1996
/97
1997
/98
1998
/99
1999
/00
2000
/01
2001
/02
2002
/03
2003
/04
2004
/05
2005
/06
2006
/07
No
. of
Co
ns
ult
ati
on
s
QRESEARCH GPs Practice Nurses

Advantages of QRES over GHS
• Uncertainty in the activity growth is halved• Data are more timely• Calendar & financial year and quarterly data
available• Information available on quality of treatment• Longer Practice Nurse series• Smoother trends in consultation numbers• Full year’s data (not 2 week sampling)• Based on stored information (not respondents'
memories)

Measuring the Impact of Primary Medical Care on Health Outcomes
• Selected indicators defined by QOF• 5 years data from QRESEARCH – quarterly,
April 2001–6• Considered: hypertension, coronary heart
disease, stroke, diabetes, chronic kidney disease, epilepsy
• Indicators mainly on measured blood pressure and cholesterol – within target range
• Data defects in some series – changing clinical definitions, changing recording practice
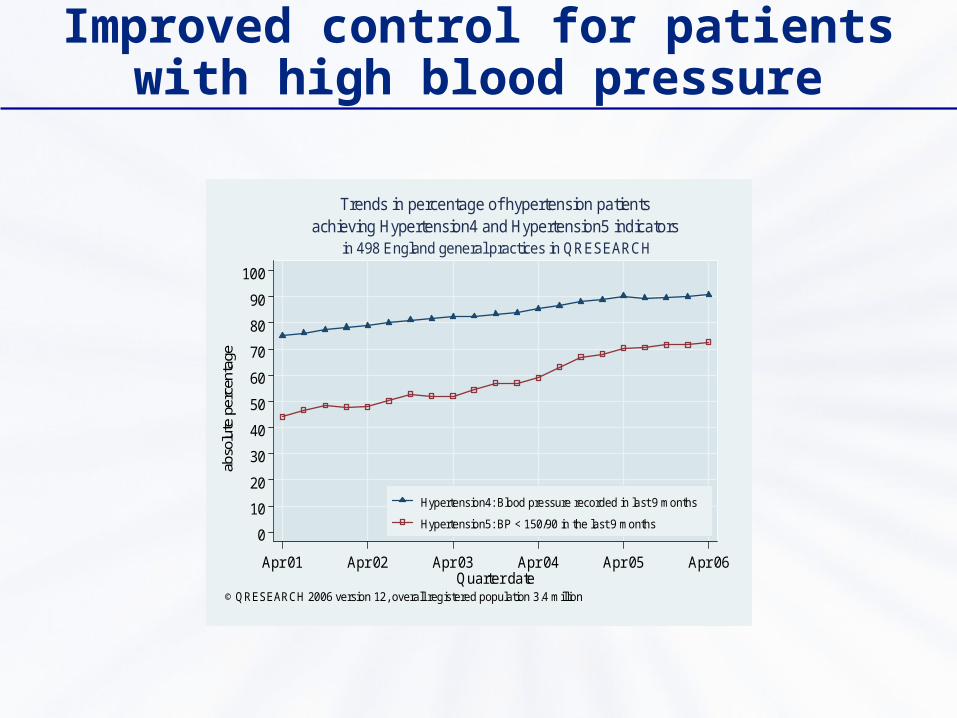
Improved control for patients with high blood pressure
0
10
20
30
40
50
60
70
80
90
100
abso
lute
per
cent
age
Apr 01 Apr 02 Apr 03 Apr 04 Apr 05 Apr 06Quarter date
Hypertension4: Blood pressure recorded in last 9 months
Hypertension5: BP < 150/90 in the last 9 months
in 498 England general practices in QRESEARCH
© QRESEARCH 2006 version 12, overall registered population 3.4 million
achieving Hypertension4 and Hypertension5 indicatorsTrends in percentage of hypertension patients

Improved blood pressure and cholesterol control: heart disease
0
10
20
30
40
50
60
70
80
90
100
abso
lute
per
cent
age
Apr 01 Apr 02 Apr 03 Apr 04 Apr 05 Apr 06Quarter date
CHD6: BP < 150/90 in last 15 months
CHD8: Cholesterol < 5 mmo/l in last 15 months
in 498 England general practices in QRESEARCH
© QRESEARCH 2006 version 12, overall registered population 3.4 million
achieving CHD6 and CHD8 indicatorsTrends in percentage of coronary heart disease patients
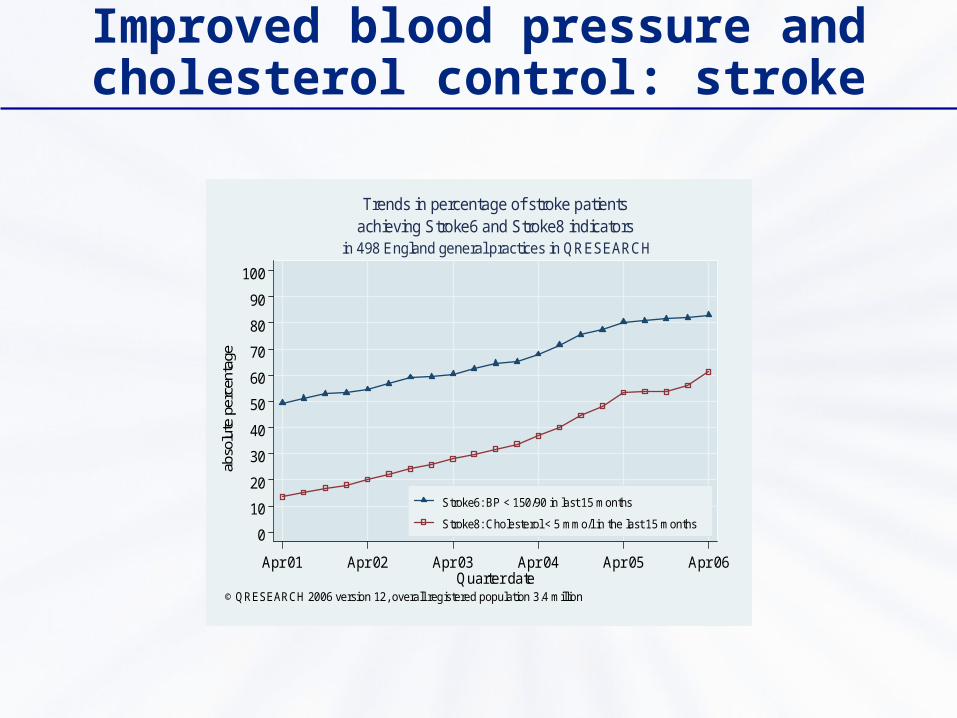
Improved blood pressure and cholesterol control: stroke
0
10
20
30
40
50
60
70
80
90
100
abso
lute
per
cent
age
Apr 01 Apr 02 Apr 03 Apr 04 Apr 05 Apr 06Quarter date
Stroke6: BP < 150/90 in last 15 months
Stroke8: Cholesterol < 5 mmo/l in the last 15 months
in 498 England general practices in QRESEARCH
© QRESEARCH 2006 version 12, overall registered population 3.4 million
achieving Stroke6 and Stroke8 indicatorsTrends in percentage of stroke patients

Significance and Causality
• Results predict future extended lives, less disability, fewer hospital admissions, better for individuals and families
• Established medical good practice to reduce high blood pressure, cholesterol
• Wider public awareness – diet, exercise• Payment incentives: have other areas of health
got worse?
Quality Adjusted Consultation Index
• Weight together the 5 time series • Allow for what is not known• Multiply quality index into consultation index
Weightings for Aggregate Quality Index
• Where a condition has more than one outcome indicator, they are each given equal weight;
• Indicators for different conditions are combined in proportion to their prevalence;
• The indicators are assumed to account for either one third or one half of potential ‘quality’ , with other aspects assumed to remain constant
• Patients with none of these conditions are assumed to have received constant quality of care.

Quality Index
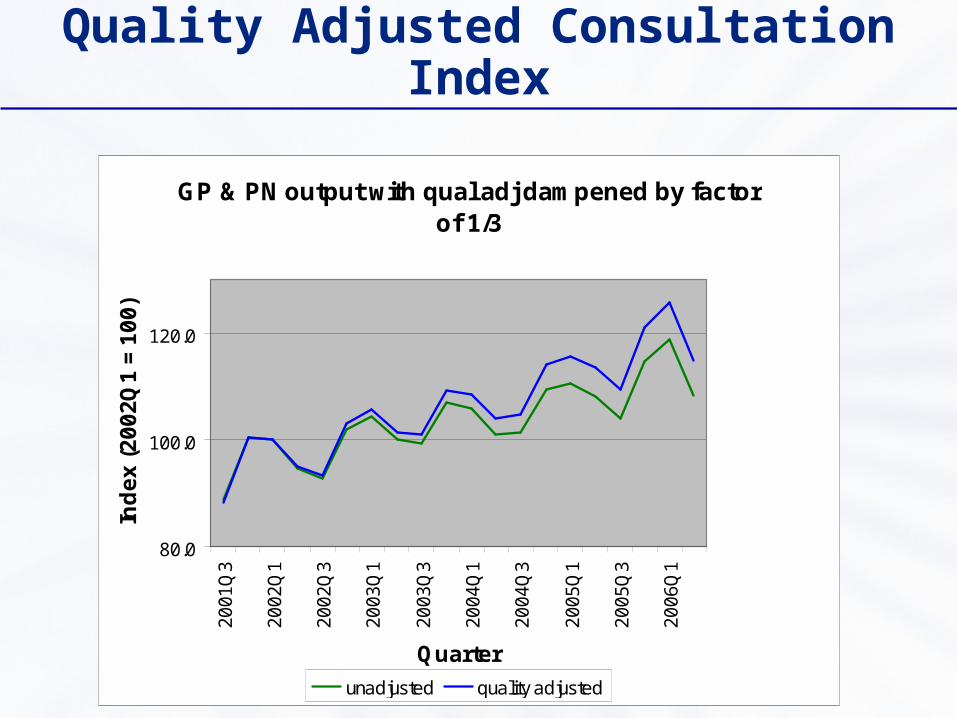
Quality Adjusted Consultation Index
GP & PN output with qual adj dampened by factor of 1/3
80.0
100.0
120.0
20
01
Q3
20
02
Q1
20
02
Q3
20
03
Q1
20
03
Q3
20
04
Q1
20
04
Q3
20
05
Q1
20
05
Q3
20
06
Q1
Quarter
Ind
ex
(2
00
2Q
1 =
10
0)
unadjusted quality adjusted

Next Steps
• Consultation index (no quality) into National Accounts June 2007, including revisions
• Paper on quality index to be published by DH, July 2007, then discussed in ONS productivity article Sept 2007
• Link outputs to inputs – productivity change• Improve epidemiological assumptions?• Wider range of clinical conditions?

Measuring Output from Primary Medical Care, with Quality Adjustment
Workshop on measuring Education and Health Volume Output OECD, Paris 6-7 June 2007
Session 4.4
Aileen Simkins, Director, UK Centre for the Measurement of Government Activity
UK Centre for the Measurement of Government Activity