Embed Size (px)
Citation preview
CORVINUS UNIVERSITY OF BUDAPEST
DOCTORAL SCHOOL OF LANDSCAPE ARCHITECTURE AND
LANDSCAPE ECOLOGY
THESIS OF DOCTORAL (PhD) DISSERTATION
MEASURING MARKETINGCOMMUNICATION AND ITS
FINANCIAL EFFECTIVENESS AMONG HUNGARIAN
WINERIES
ARNOLD TÓTH
SUPERVISOR:
GÉZA SZÉKELY, CSc
BUDAPEST, 2014.
Doctoral school: Corvinus University of Budapest
Landscape Architecture and Landscape Ecology
Field: Agricultural Technology
Head of PhD school: Dr. Attila Csemez, DSc.
Supervisor: Dr. Géza Székely, CSs.
Corvinus University of Budapest
The applicant met the requirement of the PhD regulations of Corvinus
University of Budapest and theses are accpeted for the defence process.
.............................................…… ……........................................
Head of PhD School Supervisor
1. INTRODUCTION AND RESEARCH OBJECTIVES
The main objective of my research is the effectiveness of marketing
communication and the associated financial costs in the Hungarian wine sector.
The operators in the wine sector rationalize and choose a marketing
communication channel correlates to their income and scale. There are many
players in the domestic wine industry and small and medium-sized businesses
dominate. During rationalization of expenditure small family farm businesses
are trying to find the advertising opportunities which ensure the maximum
efficiency in addition to the minimum expenditure for their business. If we do
not take into consideration the opportunity cost, the cheapest means of
communication are Internet marketing, event promotion, personal selling
through the wine dinners and wine tasting and the local sales, collective
marketing programs and newspaper advertisements. My topic was strengthened
by the fact that the Hungarian wine industry is fragmented and wine businesses
face many competitors. Due to the high degree of competition in the market
none of the wineries increase marketing expenses significantly to impair the its
effectiveness. The integration of marketing spending in prices is limited due to
the competition in that market. External factors and market fragmentation
directed the producers and traders in the Hungarian wine industry towards the
low-cost but effective marketing communication, which further increased the
relevance of the topic.
In my primary research using questionnaire survey I examined if the Hungarian
wine sector operates a measuring system for the effectiveness of marketing
communication and I was looking for a group of factors of marketing
communications tools. In my dissertation I wish to examine the impact of
marketing communication expenditures on entrepreneurial profit. The sample of
questionnaire survey contained 200 Hungarian wineries, the sampling was
stratified sampling.
The compilation aspect of questionnaire was to assess the economic aspect of
wineries operating in Hungary concerning the forms of business and terms of
volume. My research goal was to gain information about the marketing
communication tools of the Hungarian wineries, and how often these tools are
applied to retain or to win customers. According to the main theme of my thesis
the questionnaire analyzed what financial methods are used to examine the
return on investment of marketing communications among the respondig
wineries. In addition to the investigation of corporate marketing structure I
asked whether controlling system is used to track their income and expenses. I
collected information collected to what extent the marketing communication is
considered important in terms of business results by wineries surveyed.
Using the results of the questionnaire survey I analyzed the marketing acitivity
and its effect on revenue of three Hungarian wineries taking into account the
financial and accounting data. In the field of marketing communication I
analyzed through at least five economic years how the revenue, the balance
sheet and profit and loss statement changed. Concerning the marketing
communication activities I analyzed the number of types of marketing
communication tools and the related costs. Between the examined marketing
expenditures and the profit, annual report of the company (balance sheet,
income statement) regression and correlation analyzes were performed based on
data from accounting statements made available to me by the wineries. Based
on the calculation formula of three different regression trend lines I intended to
provide a common trend line that defines the approximate nature of the
relationship between marketing communication and sales. Using the trend line
the relationship between marketing communication expenditure and revenue
can be expressed, and I intended to prove the existence of the optimum point
assumed by Scolansky and Simberova at which a given marketing
communication expenditure ensures the maximum revenue.
2. MATERIAL AND METHOD
2.1. The range of primary survey research
In my thesis I examined the financial effectiveness of marketing communication
through quantitative research activity. The research methods and the statistical
analysis have allowed to get new conclusions to examine the hypotheses. The
dissertation is unique in that the wine industry is examined on the financial and
marketing approach. In addition to data collection by questionnaire the research
was carried out by examining marketing and financiel data of three Hungarian
wineries. The wineries requested anonymity, so I refer to them as "A" and "B"
and "C" in my thesis.
2.2. Circumstances and method of the survey
The questionnaire data collection was in consideration of the 100 laregest
companies in Hungarian wine industry, in which 200 questionnaires were sent.
Both on the questionnaire and the collection of detailed financial analysis that
examined the wineries I tried to preserve representativeness. I received
accounting data for the period between 2003 and 2011 for the winery "A". The
winery operates as ltd. and it is a small-and medium-sized enterprise. The
winery "A" formed in 1996 and does grape cultivation activities on nearly 60
hectares. The average number of employees was 42 people. The winery "B"
supported me with costs related to marketing communication and types of
marketing communication back to 2005. The company contiunues its economic
activity in ltd. form. The winery "B" was founded in 2003 and carried out 40
hectares of grape cultivation activities. The average number of employees was
30 people. The winery "C" operates on12 hectares and the average number of
employees was 7 people.
2.3. Major topics covered by the survey
In case of these three wineries mentioned above I examine the net sales and
expenses related to marketing communication. By stochastic analysis I wanted
to prove the existance of optimum point in case of all three wineries that
Scolansky Simberova assumed. In addition the study will examine the partial
correlation coefficient, which measures what kind of correation between
marketing spending and each line of the report of wineries orerating in ltd. form
can be found. I wish to measure directly the impact on the financial result of
marketing expenses at the "A", "B" and "C" wineries, including ROI
assessment.
2.4. The methods of measurement
During the processing of questionnaires factor, correlation, and regression
analysis were used. Before the factor analysis I examined the multicollinearity
between the variables and I tested the existence of correlation by correlation
matrix, before performing the research I calculated Kaiser-Meyer-Olkin index,
Bartlett's test was performed by Anti-Image Matrix, which demonstrated that
the factor analysis can be performed or not. Using the questions in the survey I
do variance analysis (ANOVA) within which I checked the relationship
between the standard deviaton of tested samples. During the test I tried to find
an answer to what trend-like connection exists between marketing
communication and measurement of financial effectiveness of marketing
communication, I examined the relationship with the help of correlation matrix.
2.5. The data collection and processing method
The detailed analysis was carried out with retrospective, cross-sectional
research, while the questionnaire type of research was prospective and cross-
sectional. The processing of questionnaires has occured by using MS Excel and
SPSS 16.0 software. In case of responses form the questionnaire after the
decimal encoding I examined the occurrence and distribution of individual
replies by absolute and relative frequency and statistical situation indicators
(modus, median, standard deviation, quartiles).
2.6. The statistical methods used, justification of selecting the specific
method
I organized a separate table for each marketing communication elements and the
related marketing expenses related to measure their marketing activity.
In addition to the marketing communicaton sales and turnover data also were
picked from the studied companies. By the quarterly data aggregation marketing
communication frequency and intensity is comparable to the lines of balance
sheet and income statement in financial report. By comparing the correlation
between the frequency of marketing communication and the balance sheet I
analyzed the effect on assets and liabilities. The studies were performed at the
three wineries in prallel. With the help of regression functions for the three
wineries a common trend line can be formed, which expresses how the
frequency of marketing communication and marketing expenditure contributes
to the financial success of the enterprise.
3. RESULTS
3.1. The statistical results of the questionnaire survey
Meanwhile the questionnaire collection 102 from the 200 questionnaires were
evaluated. During the questionnaires transmission attention was paid to the fact
that all wine regions would be reached.
In my dissertation with the help of quantitative questionnaire survey I examined
what kind of marketing communication tools were used by the respondign
wineries in their economic activity. It was assumed that the respondent wineries
had limited used marketing communication tools as TV and radio, which was
explained by the high investment needs. The assumption was proved because
only 10.8% of businesses participating in the questionnaire survey used TV /
radio advertising communication tools. Advertising in the form of flyers was
more popular among Hungarian wine businesses which can be explained by low
cost investment. 20.6% of wineries surveyed used printed advertising technique.
13.7% of the businesses surveyes used newspapers as a marketing
communication tool. In Hungarian wine sector personal sales is outsanding,
which is usually combined with wine tasting. 88.2% of the wineries suveyed
used personal selling practices that provide opportunities to communicate and
build up trust between the producer and the consumer. The questionnaire survey
found that 39.2% of the surveyed wineries used sales promotion as marketing
communication tool. The quantitative survey found that 87.3% of the
respondents used internet in their marketing communication practice. 49% of
the wineries surveyed supported a variety of programs, community events.
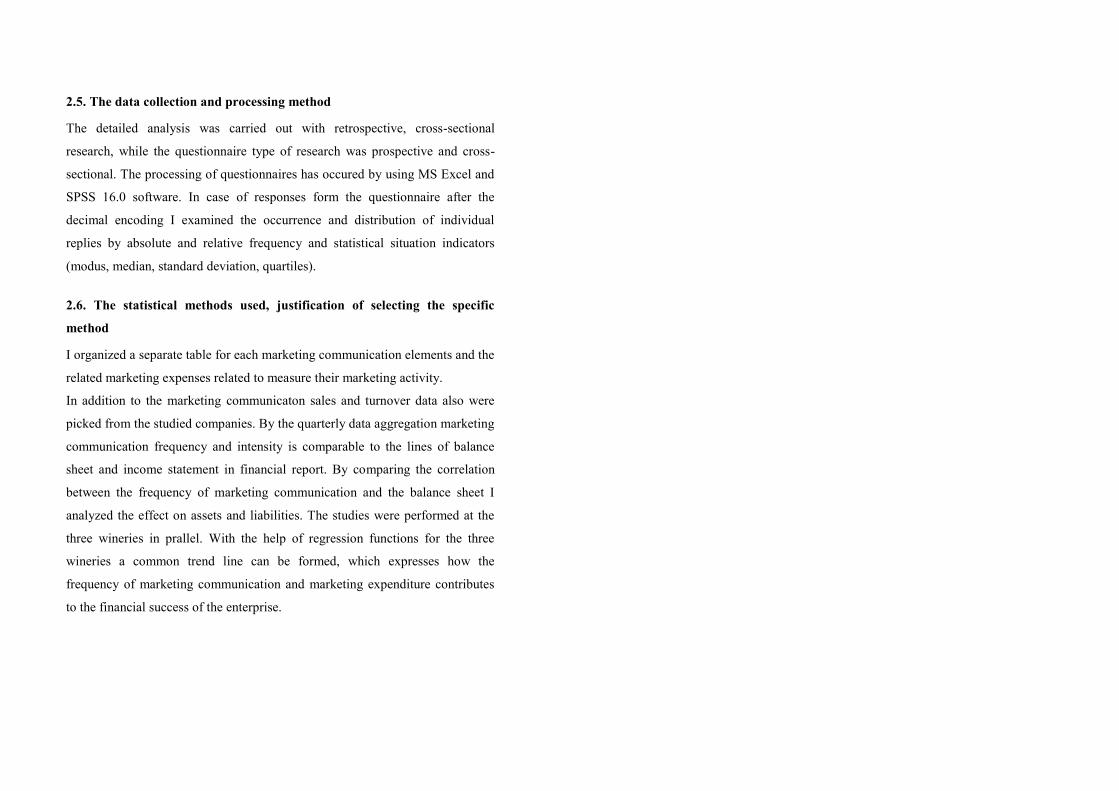
I studied how much money the surveyed wineries spend on marketing activities
in a month on average. 74.5% of winemakers participated in survey, 76
wineries, said that they spend on marketing 0 – 50 000 HUF on average.
Figure 1. Marketing expenditures of the interviewed wineries in an average
month
Source: Own construction based on data obtained from the questionnaire
survey
The main topic of my thesis was to examine the financial return on marketing
communication. I asked before the alternative response options in the
questionnaire whether the companies measure or not the financial return on
marketing investment.
0
20
40
60
80
0-50 000 Ft 50 001- 300
000 Ft
300 001- 500
000 Ft
500 001- 1
000 000 Ft
How much is spent on marketing activities on
average a month?
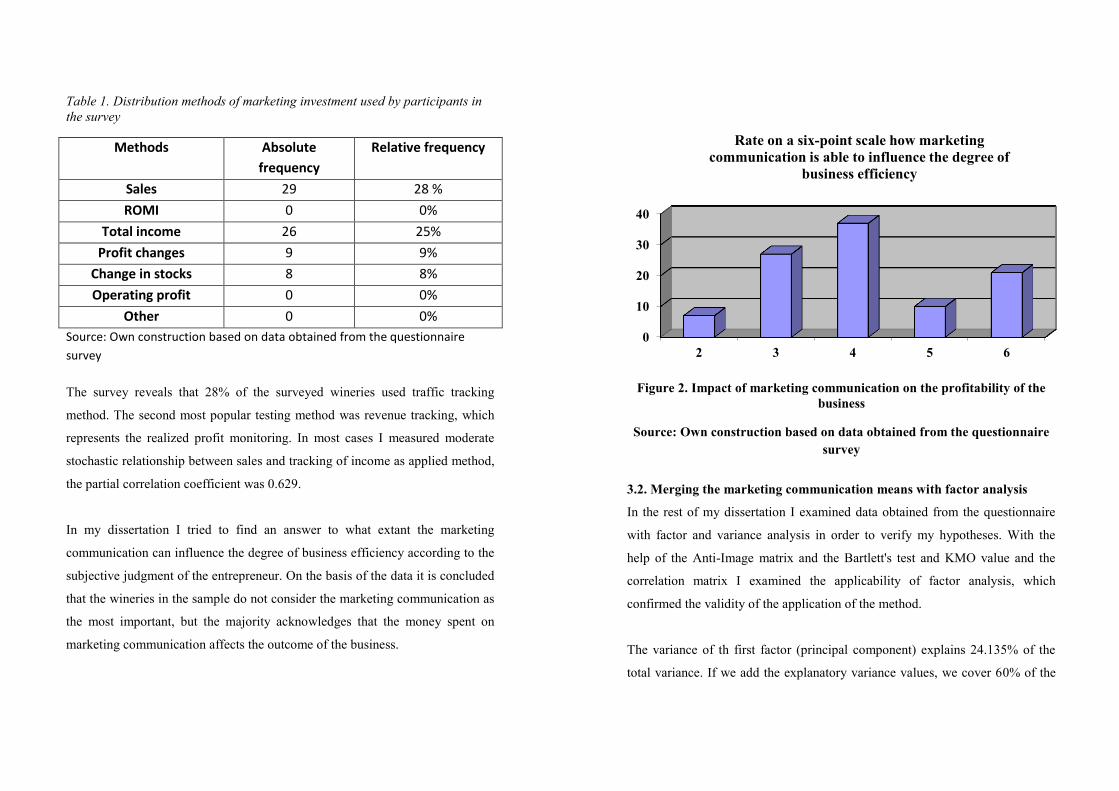
Table 1. Distribution methods of marketing investment used by participants in
the survey
Methods Absolute
frequency
Relative frequency
Sales 29 28 %
ROMI 0 0%
Total income 26 25%
Profit changes 9 9%
Change in stocks 8 8%
Operating profit 0 0%
Other 0 0%
Source: Own construction based on data obtained from the questionnaire
survey
The survey reveals that 28% of the surveyed wineries used traffic tracking
method. The second most popular testing method was revenue tracking, which
represents the realized profit monitoring. In most cases I measured moderate
stochastic relationship between sales and tracking of income as applied method,
the partial correlation coefficient was 0.629.
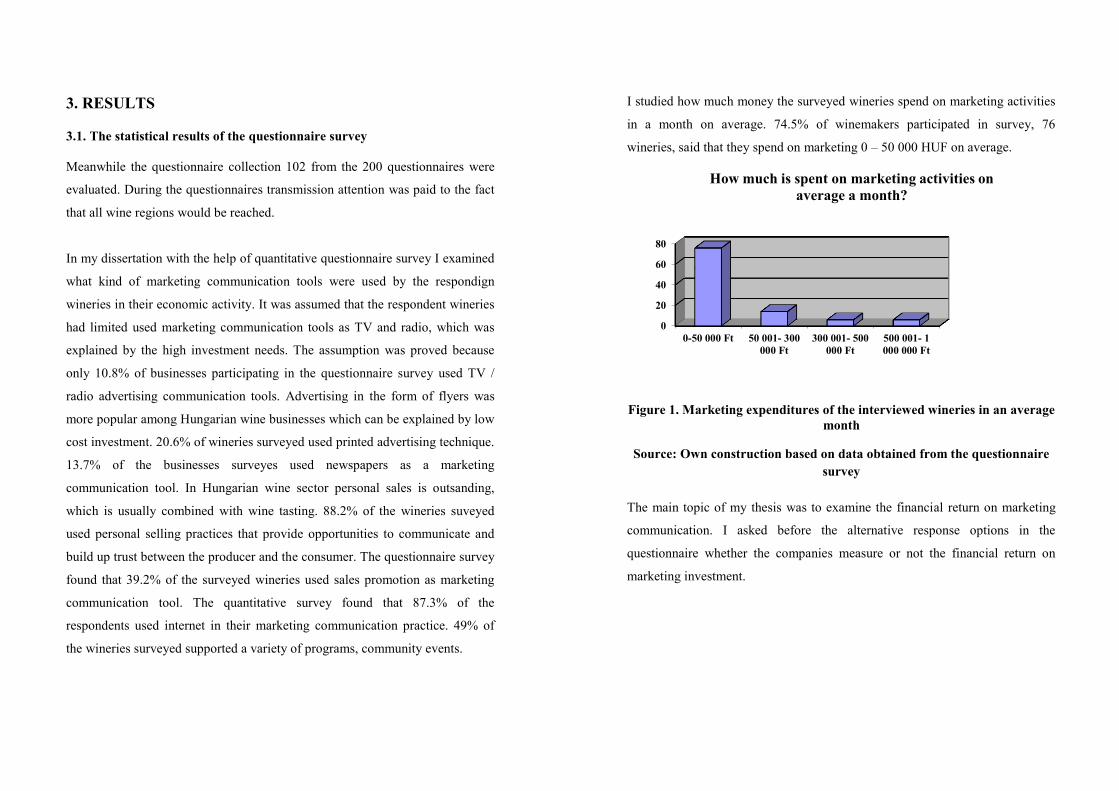
In my dissertation I tried to find an answer to what extant the marketing
communication can influence the degree of business efficiency according to the
subjective judgment of the entrepreneur. On the basis of the data it is concluded
that the wineries in the sample do not consider the marketing communication as
the most important, but the majority acknowledges that the money spent on
marketing communication affects the outcome of the business.
Figure 2. Impact of marketing communication on the profitability of the
business
Source: Own construction based on data obtained from the questionnaire
survey
3.2. Merging the marketing communication means with factor analysis
In the rest of my dissertation I examined data obtained from the questionnaire
with factor and variance analysis in order to verify my hypotheses. With the
help of the Anti-Image matrix and the Bartlett's test and KMO value and the
correlation matrix I examined the applicability of factor analysis, which
confirmed the validity of the application of the method.
The variance of th first factor (principal component) explains 24.135% of the
total variance. If we add the explanatory variance values, we cover 60% of the
0
10
20
30
40
2 3 4 5 6
Rate on a six-point scale how marketing
communication is able to influence the degree of
business efficiency
variance by using four factors. The variance method suggests the use of four
factors in the factor analysis. In case of three factors this value is 55.985 that
approximates the 60% rule.
Table 2. Rotated component matrix
Components
1 2 3
6.1 Tv/ Radio ads ,715 ,180 -,108
6.2 Flyers ,858 -,044 ,127
6.3 Newspaper ads ,799 -,095 ,063
6.4 Personal selling
(wine tasting)
-,032 -,122 ,670
6.5 Sales
promotion
,099 ,053 ,695
6.6 Internet -,042 ,750 ,297
6.7 Event
summport
,132 ,626 -,245
6.8 Other ,044 -,654 ,087
Source: Own construction based on data obtained from the questionnaire
survey
The table shows that marketing communication tools used by wineries in the
study can be divided into three groups of factors. In the first factor group TV /
radio ads and flyers, as well as a combination of newspaper ads can be
combined, as the main properties of those who prefer media. The second factor
group prefers the Internet and event support in addition to other tools such as
marketing communication tool (PR group communicats on the Internet). The
third factor prefer personal sales (wine tasting) and sales promotion (tasting
group).
3.3. Cluster analysis of marketing communication tools
I checked whether the surveyed wineries can be arranged to groups on the basis
of factor analysis along the assumed properties.
Figure 3. Representation of the coefficients depending on the merging steps
Source: Own construction based on data obtained from the questionnaire
survey
In my dissertation I choosed the hierarchical cluster analysis, in which I
preferred the Ward method. A consolidated aggregate increase of cluster
coefficients was graphically depicted.
In the figure, the horizontal axis indicates the sequence number of the merge
steps. It can be observed that higher refractive is located which can be used as
an elbow criterion. After 99. merging the cluster coefficient value rises sharply,
so the cluster analysis confirms the existence of allaged three groups based on
the factor analysis.
3.4. ANOVA analysis between marketing communication and the
effectiveness of the company
In my dissertation I studied with analysis of variance (ANOVA) what extant
marketing communication can influence the business efficiency according to the
wineries interviewed by the survey.
In my dissertation it was a research question that those wineries participating in
quastionnaire survey attach more importance to the impact of marketing
communication on business results, probably examine the financial return on
marketing investment to a greater extent. The two questions were compared by
analysis of variance at 5% significance level. Analysis of variance as a
hypothesis testing requires to know the specific problem and the null and
alternative hypotheses.
H0 (null-hypotesis): those wineries participating in quastionnaire survey attach
more importance to the impact of marketing communication on business results,
probably examine the financial return on marketing investment not to a greater
extent.
H1 (alternative-hypotesis): those wineries participating in quastionnaire
survey attach more importance to the impact of marketing communication on
business results, probably examine the financial return on marketing investment
to a greater extent.
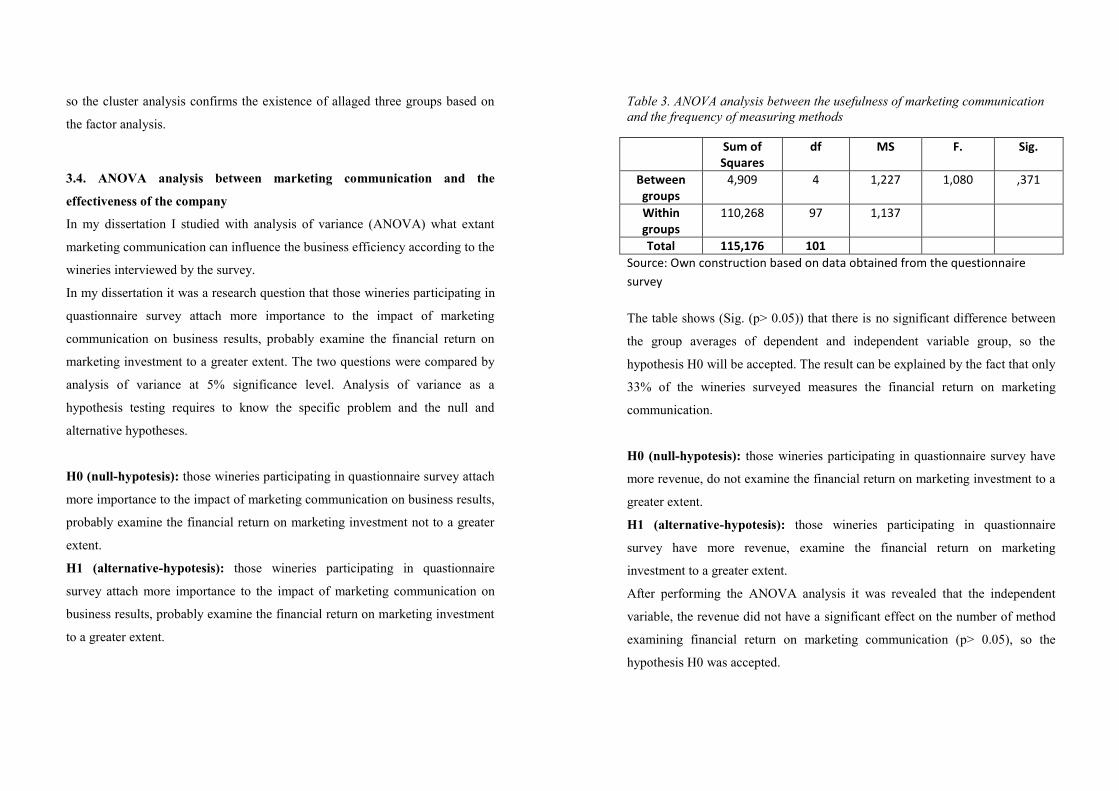
Table 3. ANOVA analysis between the usefulness of marketing communication
and the frequency of measuring methods
Sum of Squares
df MS F. Sig.
Between groups
4,909 4 1,227 1,080 ,371
Within groups
110,268 97 1,137
Total 115,176 101
Source: Own construction based on data obtained from the questionnaire
survey
The table shows (Sig. (p> 0.05)) that there is no significant difference between
the group averages of dependent and independent variable group, so the
hypothesis H0 will be accepted. The result can be explained by the fact that only
33% of the wineries surveyed measures the financial return on marketing
communication.
H0 (null-hypotesis): those wineries participating in quastionnaire survey have
more revenue, do not examine the financial return on marketing investment to a
greater extent.
H1 (alternative-hypotesis): those wineries participating in quastionnaire
survey have more revenue, examine the financial return on marketing
investment to a greater extent.
After performing the ANOVA analysis it was revealed that the independent
variable, the revenue did not have a significant effect on the number of method
examining financial return on marketing communication (p> 0.05), so the
hypothesis H0 was accepted.
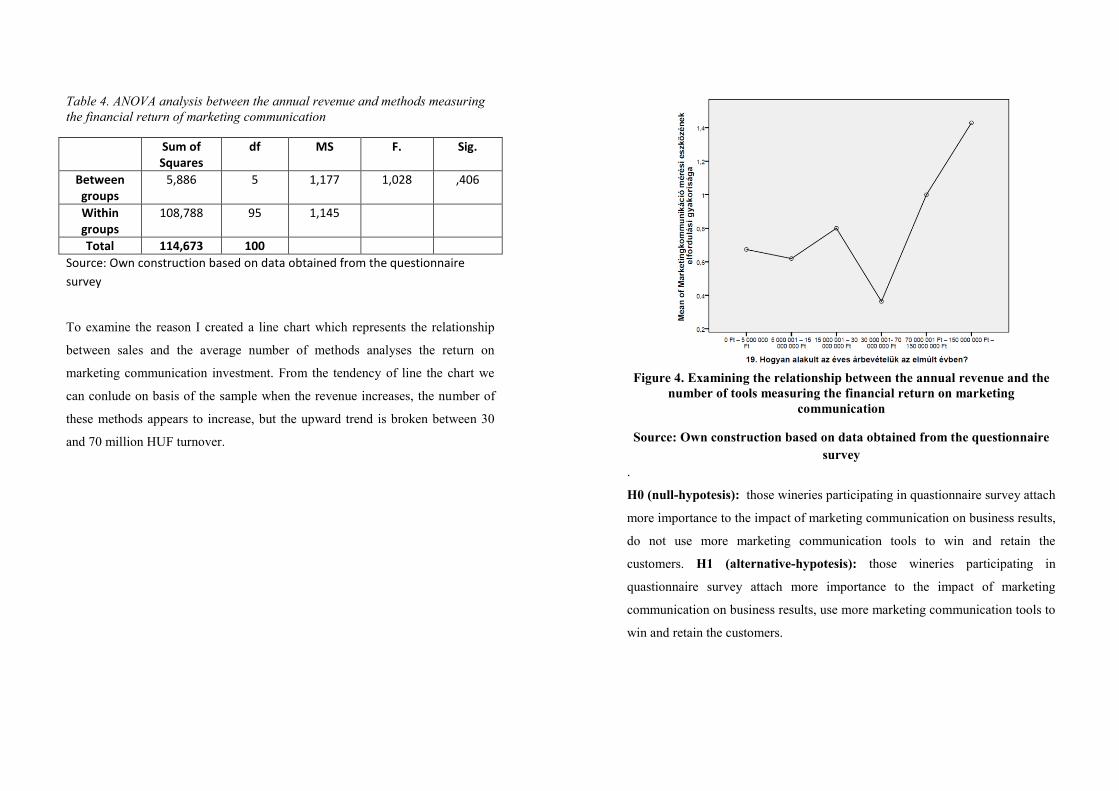
Table 4. ANOVA analysis between the annual revenue and methods measuring
the financial return of marketing communication
Sum of Squares
df MS F. Sig.
Between groups
5,886 5 1,177 1,028 ,406
Within groups
108,788 95 1,145
Total 114,673 100
Source: Own construction based on data obtained from the questionnaire
survey
To examine the reason I created a line chart which represents the relationship
between sales and the average number of methods analyses the return on
marketing communication investment. From the tendency of line the chart we
can conlude on basis of the sample when the revenue increases, the number of
these methods appears to increase, but the upward trend is broken between 30
and 70 million HUF turnover.
Figure 4. Examining the relationship between the annual revenue and the
number of tools measuring the financial return on marketing
communication
Source: Own construction based on data obtained from the questionnaire
survey
.
H0 (null-hypotesis): those wineries participating in quastionnaire survey attach
more importance to the impact of marketing communication on business results,
do not use more marketing communication tools to win and retain the
customers. H1 (alternative-hypotesis): those wineries participating in
quastionnaire survey attach more importance to the impact of marketing
communication on business results, use more marketing communication tools to
win and retain the customers.
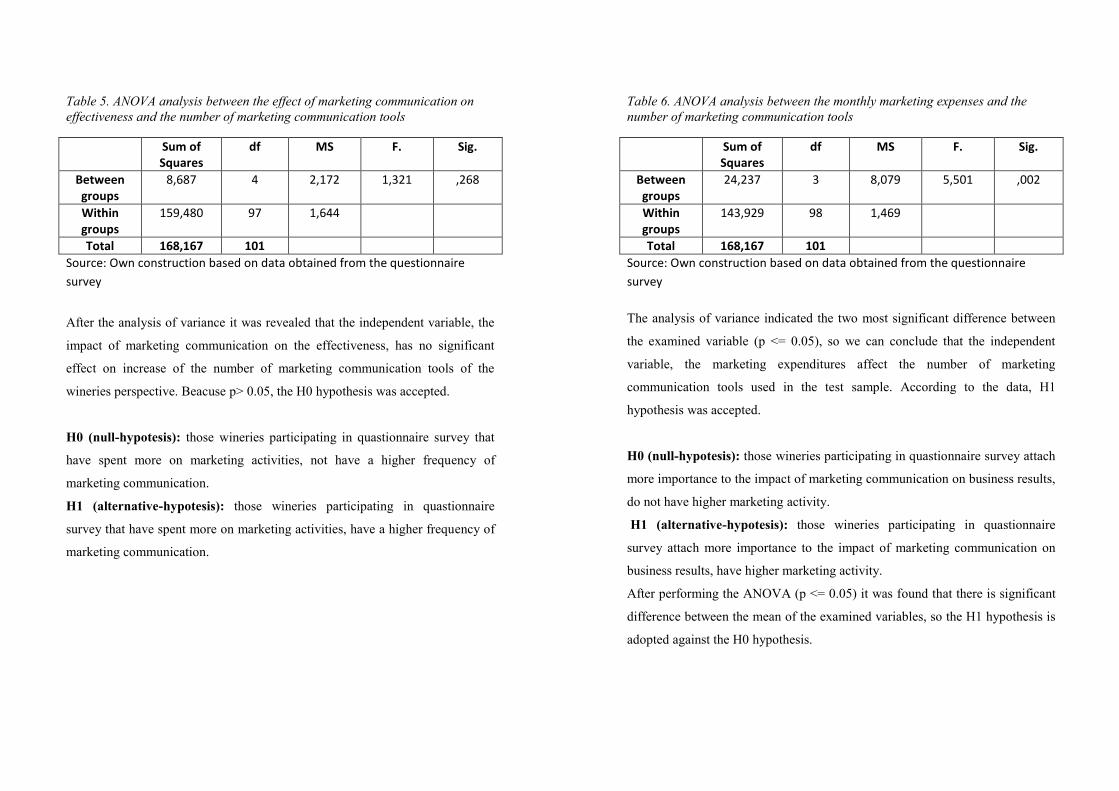
Table 5. ANOVA analysis between the effect of marketing communication on
effectiveness and the number of marketing communication tools
Sum of Squares
df MS F. Sig.
Between groups
8,687 4 2,172 1,321 ,268
Within groups
159,480 97 1,644
Total 168,167 101
Source: Own construction based on data obtained from the questionnaire
survey
After the analysis of variance it was revealed that the independent variable, the
impact of marketing communication on the effectiveness, has no significant
effect on increase of the number of marketing communication tools of the
wineries perspective. Beacuse p> 0.05, the H0 hypothesis was accepted.
H0 (null-hypotesis): those wineries participating in quastionnaire survey that
have spent more on marketing activities, not have a higher frequency of
marketing communication.
H1 (alternative-hypotesis): those wineries participating in quastionnaire
survey that have spent more on marketing activities, have a higher frequency of
marketing communication.
Table 6. ANOVA analysis between the monthly marketing expenses and the
number of marketing communication tools
Sum of Squares
df MS F. Sig.
Between groups
24,237 3 8,079 5,501 ,002
Within groups
143,929 98 1,469
Total 168,167 101
Source: Own construction based on data obtained from the questionnaire
survey
The analysis of variance indicated the two most significant difference between
the examined variable (p <= 0.05), so we can conclude that the independent
variable, the marketing expenditures affect the number of marketing
communication tools used in the test sample. According to the data, H1
hypothesis was accepted.
H0 (null-hypotesis): those wineries participating in quastionnaire survey attach
more importance to the impact of marketing communication on business results,
do not have higher marketing activity.
H1 (alternative-hypotesis): those wineries participating in quastionnaire
survey attach more importance to the impact of marketing communication on
business results, have higher marketing activity.
After performing the ANOVA (p <= 0.05) it was found that there is significant
difference between the mean of the examined variables, so the H1 hypothesis is
adopted against the H0 hypothesis.
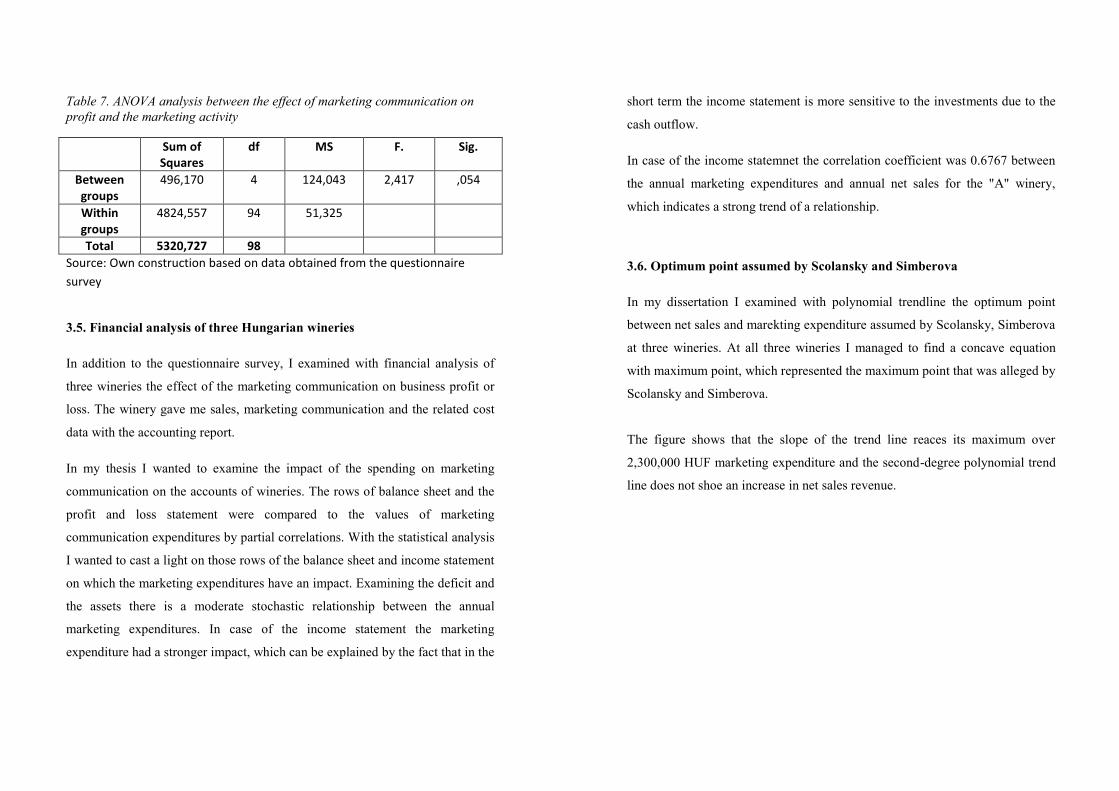
Table 7. ANOVA analysis between the effect of marketing communication on
profit and the marketing activity
Sum of Squares
df MS F. Sig.
Between groups
496,170 4 124,043 2,417 ,054
Within groups
4824,557 94 51,325
Total 5320,727 98
Source: Own construction based on data obtained from the questionnaire
survey
3.5. Financial analysis of three Hungarian wineries
In addition to the questionnaire survey, I examined with financial analysis of
three wineries the effect of the marketing communication on business profit or
loss. The winery gave me sales, marketing communication and the related cost
data with the accounting report.
In my thesis I wanted to examine the impact of the spending on marketing
communication on the accounts of wineries. The rows of balance sheet and the
profit and loss statement were compared to the values of marketing
communication expenditures by partial correlations. With the statistical analysis
I wanted to cast a light on those rows of the balance sheet and income statement
on which the marketing expenditures have an impact. Examining the deficit and
the assets there is a moderate stochastic relationship between the annual
marketing expenditures. In case of the income statement the marketing
expenditure had a stronger impact, which can be explained by the fact that in the
short term the income statement is more sensitive to the investments due to the
cash outflow.
In case of the income statemnet the correlation coefficient was 0.6767 between
the annual marketing expenditures and annual net sales for the "A" winery,
which indicates a strong trend of a relationship.
3.6. Optimum point assumed by Scolansky and Simberova
In my dissertation I examined with polynomial trendline the optimum point
between net sales and marekting expenditure assumed by Scolansky, Simberova
at three wineries. At all three wineries I managed to find a concave equation
with maximum point, which represented the maximum point that was alleged by
Scolansky and Simberova.
The figure shows that the slope of the trend line reaces its maximum over
2,300,000 HUF marketing expenditure and the second-degree polynomial trend
line does not shoe an increase in net sales revenue.
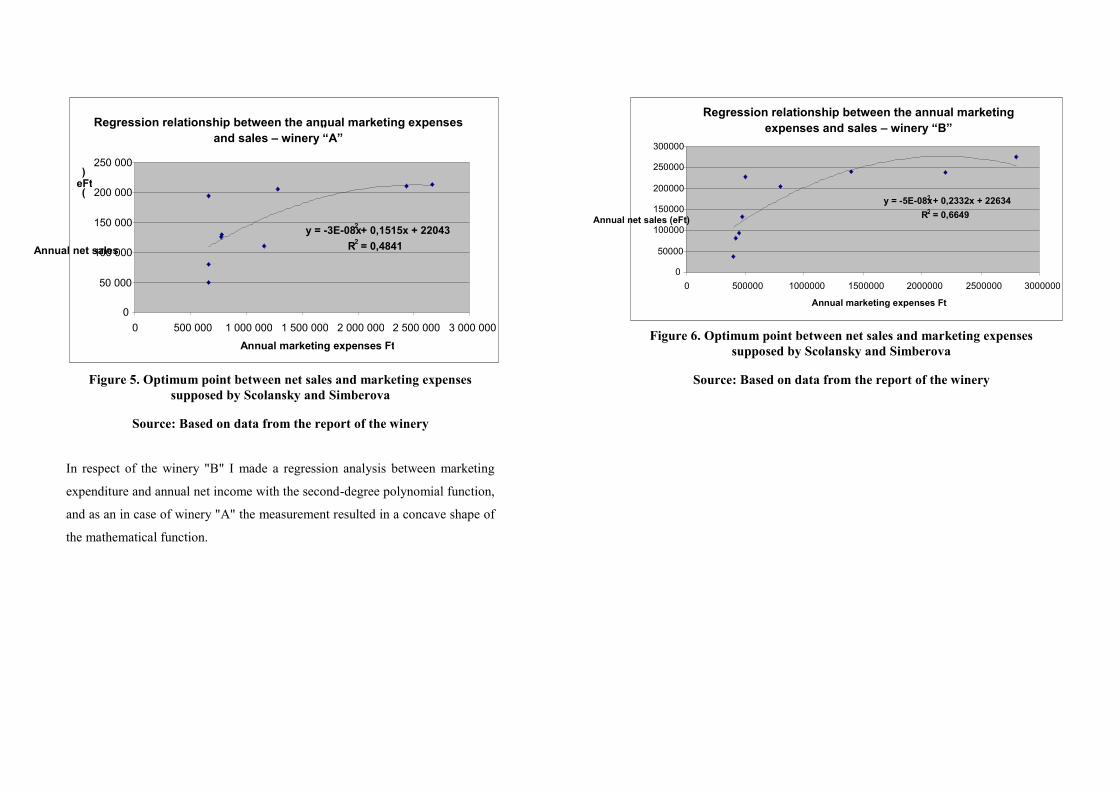
Figure 5. Optimum point between net sales and marketing expenses
supposed by Scolansky and Simberova
Source: Based on data from the report of the winery
In respect of the winery "B" I made a regression analysis between marketing
expenditure and annual net income with the second-degree polynomial function,
and as an in case of winery "A" the measurement resulted in a concave shape of
the mathematical function.
Figure 6. Optimum point between net sales and marketing expenses
supposed by Scolansky and Simberova
Source: Based on data from the report of the winery
Regression relationship between the annual marketing expenses
and sales – winery “A”
Regression relationship between the annual marketing
expenses and sales – winery “B”
y = -5E-08x
"
2
y = -3E-08x
+ 0,2332x + 22634
2 R
+ 0,1515x + 22043
2
R
= 0,6649
2
0
= 0,4841 50000
0
100000
50 000
150000
100 000
200000
150 000
250000
200 000
300000 250 000
0
0
500000
500 000
1000000
1 000 000
1500000
1 500 000
2000000
2 000 000
2500000
2 500 000
3000000
3 000 000
Annual marketing expenses Ft
Annual marketing expenses Ft
Annual net sales (eFt)
Annual net sales
( eFt )
4. NEW SCIENTIFIC RESULTS, CONCLUSIONS
In my research I was wondering with what kind of methods and how the
Hungarian wine sector measured the financial return on marketing
communication. Those Hungarian wineries which filled the questionnaire were
from 22 wine regions, thus ensuring that the surveyed wineries authentically
represent the Hungarian market. In the questionnaire survey I took care beside
the stratified sampling that there shouldobe at least 50% of the corporations in
the test sample. The questionnaire survey found that the majoroty of the
wineries in the sample were founded after the change of economic and political
system. The average number of employees was 10.18 and an average of 10
types of wines were produced by the wineries in the test sample. The
interviewed wineries farmed on an average of 19 hectares and marketing
expenses accounted for 2.44% of total expenditures. 49% of the surveyed firms
operate as private enterprise. 51% of the sample are joint venture. In case of the
interviewed sample the supreme leader has over the marketing expenses and the
marketing strategy of the firm. 95.1% of the examined wineries do not use
controlling method to follow up the costs and revenues. The impact of
marketing communication on profit is important for 69.6% of the surveyed
enterprises, but the majority of the surveyed wineries do not examine the return
on investment of marketing communication. 3.2 out of 10 examined the return
on investment of marketing communication, and among the methods used
monitoring traffic and revenues were the most popular methods of analysis.
Based on the questionnaires we can say that in respect of the marketing
communication tools the use of less expensive methods of marketing
communication is more common in the test sample (wine tastings, Internet,
promotion events). I examined within the framework of factor analysis based on
the sample what type of marketing communication tools combined are used
among the Hungarian wineries. I wanted to determine the type of tools used in
marketing communications as factor groups. After the factor rotation (Varimax
method) three factors were found in the test sample. Wineries in the first factor-
group use the combination of TV / radio ads and flyers, newspaper ads (media
preferring group). The second factor group prefers the Internet and event
promotion, as a marketing communication tools (PR group communicates on
Internet). The third factor group prefers personal sales team (wine tasting) and
sales promotion (tasting group).
In addition to a comprehensive analysis of the Hungarian wine industry I
examined the impact of marketing communication expenditures on the income,
the lines of the balance sheet and income statement with detailed financial and
marketing analysis of three wineries ("A", "B" winery "C"). I was able to
compare the lines of report to the marketing communication expenditures in
case of winery „A” and „B”. In both case I measured a moderate correlation
between marketing communication expenditure and the value of assets and
deficit in the balance sheet.
The analysis of the three wineries allowed me to compare the costs of marketing
communication to the revenue with the help of scatter plot and regression
function. I could conclude for all three wineries that stochastic positive
correlation exists between marketing expenditures and revenue growth because
of the positive slope of linear regression line. In their research Scolansky and
Simberova assumed an optimal point between marketing spending and
revenues, which can be described by a mathematical function. During my
research a second-degree polynomial regression function was used between the
marketing communication expenditures and revenues. The second-degree
polynomial function resulted in a concave shaped curve for each of the three
which had maximum point.
It can be concluded from the measurement data that an overall function for over
all Hungarian wineries cannot be done, because the regression relationship is
based on historical data and experience. In case of the three different wineries
the relationship between marketing communication spending and the revenue
was different. The correlation determined only the strength of the relationship
with similar results in all three wineries. The rate of change resulted in different
parameters for the two variables of the test wineries, so a universal function for
the sector cannot be formed, but the method is suited that every winery
determines the optimum size of the marketing expenditures based on past sales
and marketing communication data. The regression function, as I mentioned,
based on correlation of past data, so finding the optimum point can be projected
to a given time, which in my opinion should be determined each year in order to
increase the financial efficiency of marketing communication.
In my thesis the results of the hypotheses tested were as follows:
H1: those wineries participating in quastionnaire survey attach more importance
to the impact of marketing communication on business results, probably
examine the financial return on marketing investment to a greater extent. The
hypothesis was rejected.
H2: those wineries participating in quastionnaire survey have more revenue,
examine the financial return on marketing investment to a greater extent. The
hypothesis was rejected.
H3: those wineries participating in quastionnaire survey attach more importance
to the impact of marketing communication on business results, use more
marketing communication tools to win and retain the customers. The hypothesis
was rejected.
H4: the marketing communication tools, as features, can be divided into groups
of factors. The hypothesis was accepted.
H5: those surveyed wineries that have been spent more on marketing activities,
used more marketing communication tools to win and retain the customers. The
hypothesis was accepted.
H6: those wineries participating in quastionnaire survey have attached more
importance to the impact of marketing communication on business results, had
higher marketing activity. The hypothesis was accepted.
H7: in case of wineries analyzed with financial and accounting data, including
sales and marketing communication, an optimal point can be found, which
ensures the highest possible revenue for the business. The hypothesis was
accepted.
5. RELATED PUBLICATIONS
Tóth, Arnold: A marketingkommunikáció és a pénzügyi eredményesség.
Tapasztalatok hazai borászok körében végzett vizsgálat alapján (2013), Selye
János Egyetem, Gazdaságtudományi Kar, Komárom, elektronikus kiadvány
V. Losó, A. Tóth, A. Gere, J. Heszberger, G. Székely, Z. Kóka, L. Sipos:
Methodology Problems of the Industrial Preference Mapping. (2012) Acta
Alimentaria. Vol. 41. pp. 110-120
Tóth, Arnold: Corporate Profitability and Marketing (2010), Development and
Finance, (1) pp. 50-58., Budapest HU ISSN 1589 3820
Tóth, Arnold: Cost or investment? Evaluating marketing media and investment.
Tradition and Innovation, International ScientificConference (Nemzetközi
Tudományos Konferencia) (2007) Konferencia kiadvány, Szent István Egyetem,
Gödöllő ISBN 978-963-9483-84-2
Tóth Arnold: A marketingteljesítmény értékelésének és mérésének stratégiai
aspektusai (2007), Marketing & Menedzsment (1) pp. 32-36., Budapest INDEX
25545 HU ISSN 1219-03-49
Sipos, László – Tóth, Arnold: Rational approach in Hungarian mineral water
market. Hungarian Electrical Journal of Sciences (2007), Széchenyi István
Egyetem, Győr, http://heja.szif.hu/ECO/ECO-070330-A/eco070330a.pdf HU
ISSN 1418-7108
Tóth Arnold: A marketing, illetve kommunikációs célú kiadások
megtérülésének mérési lehetőségei (2007), Tudományos Közlemények (2) pp.
89-93., Heller Farkas Gazdasági és Turisztikai Szolgáltatások Főiskolája,
Budapest ISSN 1789-4174
Tóth Arnold: Hatékony kommunikáció a köztéren (2007), Tudományos
Közlemények (17) pp. 243-248., Általános Vállalkozási Főiskola, Budapest
ISSN 1585-8960
Tóth Arnold: A reklámkommunikációhoz kapcsolódó modellek tartalma és
fejlődése (2007), Kodolányi János Főiskola, Székesfehérvár, www.szabad-
part.hu ISSN 1588-094X
Sipos László – Tóth Arnold: A klasszikus racionalitáson alapuló döntéshozás az
ásványvízpiacon (2006), Marketing & Menedzsment (2-3) pp. 9-17., Budapest
INDEX 25545 HU ISSN 1219-03-49
Tóth Arnold: A kültéri hirdetések hatékonysága. Marketing & Menedzsment (2-
3) pp. 39-44., Budapest INDEX 25545 HU ISSN 1219-03-49
Tóth Arnold: Módszerek és technikák - a kültéri hirdetési felületek
hatékonyságának vizsgálata (2006), Tudományos Évkönyv pp. 234-241.,
Budapesti Gazdasági Főiskola, Budapest ISSN 1558-8401
Sipos László – Tóth Arnold: Racionalitás a magyar ásványvízpiacon. MÉTE,
2005, Ásványvíz, üdítőital, gyümölcslé, alkoholmentes italok, 2006. III.
negyedév, VII. évfolyam 3., pp. 57-62.
Sipos László – Tóth Arnold: A közgazdasági értelemben irracionálisnak
tekintett döntések kognitív okai (2006), Marketing & Menedzsment (1) pp. 22-
30., Budapest INDEX 25545 HU ISSN 1219-03-49
Dr. Kerepesi Katalin – Dr. Opitz Éva – Tóth Arnold: Változások a magyar kis
és közepes vállalkozások nemzetközi versenyképességének kritériumaiban és
gazdálkodásának külső feltételeiben (2006), Tudományos Közlemények (14-15)
pp. 21-30., Általános Vállalkozási Főiskola, Budapest ISSN 1585-8960
Sipos László – Tóth Arnold: A fogyasztói döntés közgazdasági megközelítése
(2005), Marketing & Menedzsment (6) pp. 4-11., Budapest INDEX 25545 HU
ISSN 1219-03-49