Embed Size (px)
Citation preview

Measuring Information Management in the Oil and Gas E&P Industry
The need for change
Paul [email protected] SolutionsOctober 2003

Agenda
• Setting the scene
• What areas of IM are being measured today?
• Business drivers for change and the need for improved metrics
• A new approach to measure and manage IM

What is Information Management?
Information Management is a collaborative and integrated approach
to the creation, capture, organisation, preservation, access and use
of knowledge, information and data.
Information Management and Business Management are twisted in a spiral of
inter-dependency
Information Management and Business Management are twisted in a spiral of
inter-dependency
DocumentManagement
Physical RecordsManagement, OffsiteStorage and Library
InformationTechnology/
Systems
Business Process
InformationManagement
Data Management(inc spatial)
IM ServiceProvision by
support departments
IM Activitiesperformed by the
business
Culture and behaviours
IM Framework and standards
Human Resources
Electronic
Improvement
Knowledge Management
Explicit
Tacit
Organisational informationProcesses, best practices
experiences and lessons learnt

Introduction
• What are metrics?• Standard indicators of success• Help us measure the impact of strategies on our business objectives • The second most important thing to a metric is the ability to forecast it
• What Types are there?• Lag and Lead• Quantative, Qualitative• Internal and External Benchmarks
• What can they measure?• Financial/Risk; Process; Learning; Customer
• Why do we need them?• You can’t manage what you can’t measure• Raise the visibility of the important things happening in an organisation from a
number of different perspectives• Enable targets to be set to drive performance improvement• Helps communicate with senior management

What areas of IM are being measured
today?

E&P IM Metrics Industry Survey 2003
BG Group
Canadian Natural Resources (CNR)
ChevronTexaco
ConocoPhillips
Kerr McGee
Maersk Oil & Gas
Marathon Oil
Nexen
PetroCanada
Premier Oil
Santos
Shell
Statoil
Total
43%
50%
7%EuropeanNorth AmericanAustralian
14 International E&P Companies

Survey Results - Summary
• 86% of companies surveyed (12) had no formal process for measuring IM
• 79% of companies surveyed (11) stated there was increased management attention for IM than there was 3 years ago
• There is a lack of consistency within (and between) companies around definitions for collecting metrics
• Only 14% of companies surveyed (2) had a reasonably balanced approach, measuring IM from a number of perspectives. Even this was limited and gained only from user satisfaction questionnaires
• Very simple (or no) tools generally used to collect metrics
• 79% of companies surveyed (11) are going to improve their approach towards measuring IM over the next 12months and are seeking a mandate for change

Current areas of measurement
Number of companies measuring within these areasMeasurement areasIM Perspectives210 543 876 9
IM Support v User Ratio and Cost
Cost of rework/duplication
Total Opex/Capex savings through IM
10
Information quality and completeness
Customer
Info. Accessibility, Manipulation & Retrieval
Information Discovery
Information Sharing and Exchange
Information Integration
Corporate Memory Growth and Usage
Learning & Growth
Flexibility for Change
IM Process Controls (inc security)
Bus Processes
IM Process Efficiency and Effectiveness
IM Process Understanding and Adherence
Risked Exposure Value Mitigated by IM
Financial/Risk/Value
IM Incidents Index
Linking IM to production and Reserve-add
IM RoACE
11
General lack of a balanced approach to measuring IMGeneral lack of a balanced approach to measuring IM
Benchmarking IM Measurement practices
Not reallyusing
IM metrics
Collecting &monitoring some
IM metrics
Correct andimprove
Predict andprevent
Business sophistication of reporting and using IM Metrics(which best characterises company approach)
Bal
ance
d n
atu
re o
f IM
met
rics
(ext
ent
to
whi
ch I
M is
me
as
ure
d fr
om
an
um
ber
of
diff
ere
nt p
ers
pect
ive
s)
Me
diu
mH
igh
Lo
w
A
BC
D
G
F
E
HI
JK
M
LN
NorthAmerican E&P
Companies
European andAustralasian
E&P Companies
Key
Huge potential to improve practices in this area to derive business benefitHuge potential to improve practices in this area to derive business benefit

Selected examples from published literature
and surveys
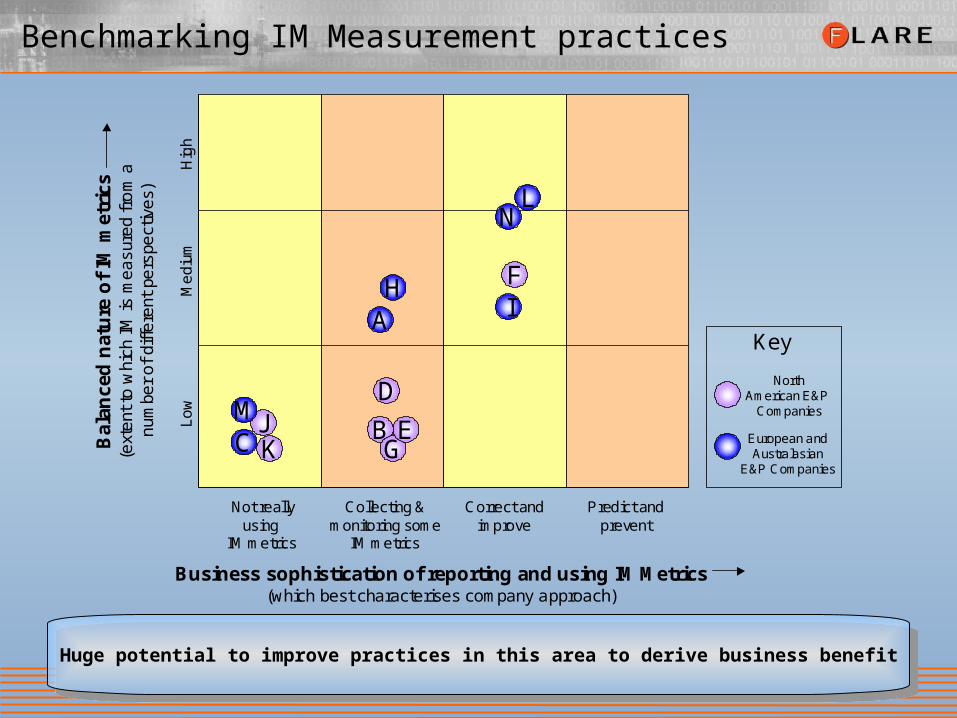
Examples - IM user satisfaction and data quality
According to a survey of 14 international E&P Companies (Flare 2001), 57% (8) performing
some type of IM Survey and 57% (8) performing some type of data quality checking using scripts
According to a survey of 14 international E&P Companies (Flare 2001), 57% (8) performing
some type of IM Survey and 57% (8) performing some type of data quality checking using scripts
Data Management Assessment Form
Customer:
Assessor:
Data Type:
RangeAccuracy 0 = none … 5 = all 3 3 15.00%Clarity 0 = no … 1 = yes 3 0 0.00%Completeness 0 = none … 5 = all 2 2 6.67%Consistency 0 = not … 5 = highly 2 3 10.00%Timeliness 0 = not … 5 = highly 2 3 10.00%
Total Quality 41.67%
Accessibility 0 = no … 5 = highly 3 3 12.86%0 = no … 1 = yes 3 1 21.43%0 = no … 1 = yes 3 1 21.43%
Master Source 0 = no … 1 = yes 2 1 14.29%Recoverability 0 = no … 1 = yes 1 1 7.14%Security 0 = no … 1 = yes 2 1 14.29%
Total Accessibility 91.43%
Communication 0 = no … 1 = yes 3 0 0.00%0 = no … 1 = yes 3 0 0.00%0 = no … 1 = yes 3 0 0.00%0 = no … 1 = yes 3 0 0.00%0 = no … 1 = yes 3 0 0.00%0 = no … 1 = yes 3 0 0.00%0 = no … 1 = yes 3 0 0.00%0 = no … 1 = yes 3 0 0.00%0 = no … 1 = yes 3 0 0.00%
Total DM System 0.00%
Attitudes & Behaviours 0 = poor … 5 = excellent 3 3 11.25%Costs 0 = none … 5 = high 1 2 2.50%Criticality & Relevance 0 = low … 5 = high 3 4 15.00%
0 = no … 1 = yes 2 1 12.50%0 = no … 1 = yes 2 1 12.50%
Resources 0 = none … 5 = sufficient 3 2 7.50%Value 0 = none … 5 = high 2 4 10.00%
Total Miscellaneous 71.25%
The Users
An Assessor
J oined and Calculated Curves (Geoscene/Recall)
What is the value of this data type to your business processes?
Are there sufficient resources in place to manage this data type effectively?
Have data management standards and conventions been defined for this data type?
Are these data management standards and conventions being adhered to?
What are the attitudes and behaviours towards managing this data type?
How much would it cost to purchase /create data values for this type?
Have data management procedures been defined for this data type?
Life Expectancy
How critical or relevant is this data type to your business processes?
I s there a retention schedule in place for this data type?
I s the retention schedule being used?
Are these data management procedures being used?
Have data management roles and responsibilities been defined for this data type?
Have these data management roles and responsibilities been implemented?
I s access to the data values restricted to those who are entitled to use them?
I s there regular communication with customers about this data type?
I s there an agreed system of data management indicators for this data type?
Are these data management indicators being used?
Has a Corporate store been identified for this data type?
I s this Corporate store being used actively to store this data type?
I s there a clearly identified master source or producer for this data type?
Are backup procedures in place for this data type?
Import
ance
Score
Rela
tive
Perc
enta
ge
Corporate Store
Are the data values correct and within the agreed uncertainty boundaries?
I s there an accepted definition for this data type?
How many of the data types that should be present are actually present?
How compatible are data values for this data type from different sources?
Are the data values sufficiently up-to-date and available when needed?
Are the data values available when and where needed?
Performance Indicators
Procedures
Roles & Responsibilities
Standards & Conventions
Quality
Accessib
ilit
yD
ata
Managem
ent
Syste
mM
iscellaneous
Know ledge
Data
Information
FrequencyNever Always
0.0 0.2 0.4 0.6 0.8 1.0
All 36
Harstad 5
Trondheim 11
Bergen 4
Stavanger 16
All 36
Harstad 5
Trondheim 11
Bergen 4
Stavanger 16
58.0%
54.0%
20.9%
78.2%
75.0%
21.3%
27.5%
54.1%
Do you always locate ALL data you need?
How often do you work with incomplete data because you did not have time to carry on looking?
Binomial test, related to size of populationTest of each site is different within 95% confidence level
64.3%
28.5%
Significant different, greater or lessRepresented by “all”
55.0% 73.5%
20.4% 36.5%
95% confidence lever for Mean (actually My – the through population’s mean)
Reference: Shell Expro
Reference: Statoil
IM User Questionnaires
1. Automated database integrity/quality metrics (SQL Type)
2. Monitoring disk space and application usage (Scripts)
Automated Data Quality Tools

Examples - Return on Investment justification models
• Back-office cycle time reductions• Loading seismic/log data• Reducing IM cycle times, accelerating production (increase revenue)
• User focused cycle time reductions• Time users spend looking for/reformatting information• Reducing interpretation cycle time, accelerating production
• Better decisions• Faster more accurate information
• Storage/retrieval cost reduction• Loading into on-line systems• Removal of duplicates
• IT Infrastructure cost reductions• Application Service Provision models
• Resource cost reduction• Moving of staff to higher value activities• Redution in technical staff through better IM

Organisational Culture
Source: Tanner 2003 (30 E&P Companies)
55% of respondents thought their E&P Company had a restrictive culture55% of respondents thought their E&P Company had a restrictive culture

E&P Data Management Maturity Model
1
2
3
4
5
Level
Base - capable people, heroic efforts, IM not treated as a corporate responsibility
Managed - individuals develop and follow processes useful for them. Un-integrated point solutions
Corporate Competency - standard processes, capabilities institutionalised
Predictable Risk - statistically stable processes, ability to routinely reduce risk
Fully optimised - emphasis on risk overshadows pure productivity
According to D’Angelo AAPG Explorer 2000 “Most North American companies are at level 2,
elsewhere in the world companies are mainly level 1”
According to D’Angelo AAPG Explorer 2000 “Most North American companies are at level 2,
elsewhere in the world companies are mainly level 1”

Examples - industry IT and IM surveys
0
20
40
60
80
100
120
140
0 100 200 300 400
Number of Technical Users
Nu
mb
er o
f IM
re
late
d s
taff
Oil Company
Average User/Support ratio = 3:1Average User/Support ratio = 3:1
Flare 2001 (E&P Technical IM Survey)
Ave Time spent looking for info = 20%
Ave Time spent re-working = 13%
Rose (2001) IT E&P Benchmarking Survey
Average $/Desktop in E&P = $14KAverage $/Desktop in E&P = $14K
IT TCO per Technical User = $100K+DM (Pohlman 2000)
IT TCO per Technical User = $100K (Landmark 2003)
Significant evidence from both inside and outside E&P Industry to suggest there
is no linkage between IT and profitability
Significant evidence from both inside and outside E&P Industry to suggest there
is no linkage between IT and profitability
Strassman 1997 - A study of 200 US Industrial Corporations

Current Situation
The measurement of IM is not recognised as
being part of a company’s E&P Business Model
The measurement of IM is not recognised as
being part of a company’s E&P Business Model
Business Management do not understand the
value of their corporate ‘IM system’ seen
primarily as an overhead cost
Business Management do not understand the
value of their corporate ‘IM system’ seen
primarily as an overhead cost
Business and Executive Management do not treat
IM as a corporate risk domain
Business and Executive Management do not treat
IM as a corporate risk domain
User satisfaction surveys and database quality
metrics rule
User satisfaction surveys and database quality
metrics rule
Lack of understanding between IM and IT and
between IM ‘the function’ and IM ‘the department’
Lack of understanding between IM and IT and
between IM ‘the function’ and IM ‘the department’
Observations

Drivers for change
Globalisation,
distributed teams
working together
Globalisation,
distributed teams
working together
Group standardisation
Minimum standards
Accountability
Compliance
Group standardisation
Minimum standards
Accountability
Compliance
Rise of knowledge as a key economic resource
Rise of knowledge as a key economic resource
Better investment decision
Better investment decision
Cost reductionCost reduction
Drivers for
change
A new approach to measure IM:
Selected examples from industry sponsored project
(combining survey findings, literature review and new thinking)

Introducing the E&P IM Measurement Model
Implement
(2) Q
ua
lity o
f IM F
ram
ew
ork
,c
om
plia
nc
e &
cu
lture
Corporate
Com
plianceC
orporateC
ompliance
IMF
ramew
orkC
ulture andB
ehavioursC
ulture andB
ehaviours
True
Investment in
E&P Information
Management
(1) IM Investmentstake
(3) E
ffec
tive
ne
ss
of th
e IM
sy
ste
mInform
ationQ
uality &C
ompleteness
Information
Quality &
Com
pleteness
User
Satisfaction
User
Satisfaction
IM
Architecture
Information
Overload
Operate
IM cost
savingsV
alue Creation
and Risk R
eduction
Enable
Aspirational
Objectives
(4) R
etu
rn o
n In
ve
stm
en
t (RO
I)
Benefit
Justify
Can industry benchmark at any level in the model - some more appropriate that othersCan industry benchmark at any level in the model - some more appropriate that others

The goal: A balanced IM Scorecard
PoorLevel o f compliance11
Activity based IM costing (Strassman, modified)$52.4 MillionTotal annual cost of IM (Activity based)1
PoorInformation Overload Rating16
Industry Benchmark
Benchmarks exist for IT spent but not for IM value or effectiveness today
50 percentileOveral industry ranking17
$15MillionResidual IM Risk Exposure7
Applies a consistent treatment to al l forms of information, data, documents, records & process
Poor Informa tion Quality & Completeness14
For the first time, explicitly measures how well the IM system is architected ra ther than by perception. Differentiates 2 fundamentally different types of information.
AverageIM Architecture Quality13
Includes finding, accessing, i ntegrating and sharing information. Drill down available for specific score.
AverageEnd-user perception 12
Customer
Value
AverageInforma tion Accessibility15
AverageIM Culture11
ExcellentQuality of IM framework10
IM Processes and culture
Measures the abili ty of an IM system to support corporate aspirational objectives
PoorSupport to aspiration objecti ves Index-learning organisation
9
Promotes the IM System as an IC Item1.245IM Intellectual Capital (IC) Rating8
Treats IM as a corporate risk domain. Drill down to risks in particular functions e.g. exploration
$205MillionIM Risk Exposure being mitigated6
1:3IM Support Staff / No of end-users5
Excludes some technology which is not IM related1.54Cost of IM / Technology IM cost4
22.3%Cost of IM / profit3
$45,000Cost of IM per employee2
Investment cost
Key Approach Differences to traditional methodsScore TrendIM AreaNo
Information Management Scorecard

IM Investment Stake
• Activity Based Costing (ABC) approach, modified from Strassman 97
• Include cost of all IM activities, regardless of where they occur in the business
• Do not associate all IT costs with IM (some are clearly process based e.g. seismic interpretation, reservoir simulation)
• Include ratio’s (IM staff to end users)
(5) Industry benchmarking - how we compare (direct comparison and trends)
Implement
IM co
st sa
vings
Value C
reationand R
isk Reduction
Enab
leA
spirational
Obje
ctives
(4) R
etu
rn o
n In
ve
stm
en
t (RO
I)
(2) Q
ua
lity o
f IM F
ram
ew
ork
,c
om
plia
nc
e &
cu
lture
Corpo
rateC
omplia
nce
Corpo
rateC
omplia
nce
IMF
rame
wo
rkC
ulture and
Beha
viours
Cultu
re andB
ehaviou
rs
(3) E
ffec
tive
ne
ss
of th
e IM
sy
ste
mInform
ationQ
uality &C
omp
leteness
Information
Quality &
Com
pleteness
User
Satis
factionU
serS
atisfaction
IM
Arch
itecture
Information
Overload
Investmentin Data
Management
Investmentin traditionalE&P Data
Management
Investmentin Upstream IT
(pure technology)
Investment inE&P Information
Management
(1) IM Investmentstake
Operate Benefit
Justify
(6) Technologies for automating, collecting, presenting and anal ysing metrics
Does Executive Management understand that by increasing investment in IM services,
there is potential to reduce the overall corporate spend on IM?
Does Executive Management understand that by increasing investment in IM services,
there is potential to reduce the overall corporate spend on IM?

Quality of IM Framework, Compliance & Culture
• Measure against high-level industry best practice IM Framework Model for a points score
• Measure compliance of the Framework Model for a points score
• Use a simple 3-level model for culture (Open, Neutral, Restrictive)
Adopting quantifiable metrics can support consultancy/audit judgements, enable targets to be
set and improvements seen. Traffic lights used to summarise points scores
Adopting quantifiable metrics can support consultancy/audit judgements, enable targets to be
set and improvements seen. Traffic lights used to summarise points scores
(5) Industry benchmarking - how we compare (direct comparison and trends)
Implement
IM cost
savings
Value C
reationand R
isk Reduction
Enable
Aspirational
Objectives
(4) R
etu
rn o
n In
ve
stm
en
t (RO
I)
(2) Q
ua
lity o
f IM F
ram
ew
ork
,c
om
plia
nc
e &
cu
lture
Corpo
rateC
ompliance
Corpo
rateC
ompliance
IMF
rame
wo
rkC
ulture andB
ehaviou
rsC
ulture andB
ehaviou
rs
(3) E
ffec
tive
ne
ss
of th
e IM
sy
ste
mInform
ationQ
uality &C
omp
leteness
Information
Quality &
Com
pleteness
User
Satisfaction
User
Satisfaction
IM
Architecture
Information
Overload
Investmentin Data
Management
Investmentin traditionalE&P Data
Management
Investmentin Upstream IT
(pure technology)
Investment inE&P Information
Management
(1) IM Investmentstake
Operate Benefit
Justify
(6) Technologies for automating, collecting, presenting and anal ysing metrics
74
87
0
0
IM Framework Quality
IM Compliance
20
IM Culture/Behaviours
2003Indicator
2003Indicator
2003Indicator
2004Target
2004Target
2004Target

Effectiveness of IM System
• Industry Best Practice IM User Questionnaire
• IM Architecture Test
• Information Quality & Completeness• Quality based on US Defense Categorisation
• Information Overload (Based on email)
(5) Industry benchmarking - how we compare (direct comparison and trends)
Implement
IM cost
savings
Value C
reationand R
isk Reduction
Enable
Aspirational
Objectives
(4) Retu
rn o
n In
vestmen
t (RO
I)
(2) Qu
ality of IM
Fram
ewo
rk,co
mp
lian
ce & cu
lture
Corpo
rateC
ompliance
Corpo
rateC
ompliance
IMF
rame
wo
rkC
ulture andB
ehaviou
rsC
ulture andB
ehaviou
rs
(3) Effectiven
esso
f the IM
systemInform
ationQ
uality &C
omp
leteness
Information
Quality &
Com
pleteness
User
Satisfaction
User
Satisfaction
IM
Architecture
Information
Overload
Investmentin Data
Management
Investmentin traditionalE&P Data
Management
Investmentin Upstream IT
(pure technology)
Investment inE&P Information
Management
(1) IM Investmentstake
Operate Benefit
Justify
(6) Technologies for automating, collecting, presenting and anal ysing metrics

Assessing user perceptions
A. Average time spent on information activities (%) 1 Looking for information __% Chance not found __% 2 Information Quality Control __% Comment:__________ 3 Loading data __% Comment:__________ 4 Reformatting/Manipulating __% Comment:__________ 5 Ordering/Accessing information once found __% Comment:__________ 6 Publishing/Archiving final interpretations and analyses __% Comment:__________ 7 Reworking information that exists but cannot find it __% Comment:__________ 8 Time spent in meetings __% Unnecessary time _% B. Finding, accessing and integrating information (x in box) 1.V.Easy 2 3 4 5V.Hard 9 How “easy” is it to find information you need? 10 How “easy” is to find knowledge about the data? 11 How “easy” is it to access/order/retrieve info once found? 12 How “easy” is it to access info from a single machine? 13 How “easy” is it to access info at home/other offices? 14 How “easy” is it to transfer data from one application to
another in the same discipline?
15 How “easy” is it to transfer data from one application to another application in different disciplines
16 How “easy” is it to integrate information spatially? 17 How “easy” is it to view what information is available in
context regardless of whether it is digital data, documents, hardcopy or physical or about people, process or app?
C. Knowledge capture, learning and sharing (place x in box) Always 1 2 3 4 5Never 18 Final interpretations (documents, and info in databases)
are always published/archived so others can use them
19 I/We perform peer-assists & lessons learnt processes 20 Lessons learnt are documented and published 21 I/We participate in on-line discussion forums, communities
of practice and publish ad-hoc thoughts and insights into the corporate memory
22 We check the corporate memory (index/data/doc stores etc) for what’s been done, before starting a project
23 We repeat successes and avoid mistakes
24 I feel overloaded with information D. Quality, completeness and currency of information (x in box)
Excellent 80-100%
2 3 4 V. Poor <20%
25 Accuracy of information in our corporate stores is: 26 Completeness of our corporate stores is: 27 Timeliness of information from operations is: 28 The management of multiple versions and duplicates is: E. Project working and collaboration (place x in box) 29 The ease with which I can share project related
information (data, documents, emails) internally is:
30 And the ease with which I can share externally is: F. Impact on the business (successes and risks) 31 How many examples can you give where good IM has
contributed to business improvmt/success in past 1 yr? ____No List examples:
32 How many examples can you give where poor IM has contributed to poor business performance in past 1 year?
____No List examples:
No Rating Definition 1 V. Easy Little knowledge required to operate intuitive systems and structures;
new starters would find it easy with light instruction. Can do it myself quickly, few barriers between myself and information - do not need to
Levels such as ‘Very Easy’ to ‘Very Hard’
can be characterised by a series of statements
to enable people to make an informed assessment.
Similarly to how an essay may be marked by an examiner
they typically have 5 levels and examine a number of
attributes.
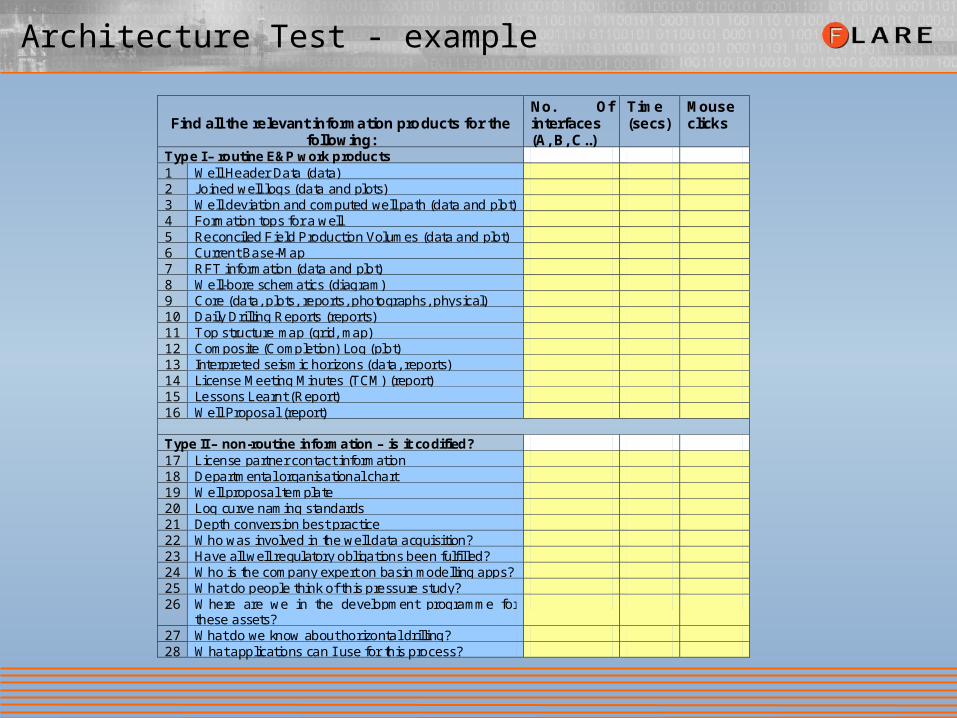
Architecture Test - example
Find all the relevant information products for the
following:
No. Of interfaces (A, B, C..)
Time (secs)
Mouse clicks
Type I – routine E&P work products 1 Well Header Data (data) 2 Joined well logs (data and plots) 3 Well deviation and computed well path (data and plot) 4 Formation tops for a well 5 Reconciled Field Production Volumes (data and plot) 6 Current Base-Map 7 RFT information (data and plot) 8 Well-bore schematics (diagram) 9 Core (data, plots, reports, photographs, physical) 10 Daily Drilling Reports (reports) 11 Top structure map (grid, map) 12 Composite (Completion) Log (plot) 13 Interpreted seismic horizons (data, reports) 14 License Meeting Minutes (TCM) (report) 15 Lessons Learnt (Report) 16 Well Proposal (report) Type II – non-routine information – is it codified? 17 License partner contact information 18 Departmental organisational chart 19 Well proposal template 20 Log curve naming standards 21 Depth conversion best practice 22 Who was involved in the well data acquisition? 23 Have all well regulatory obligations been fulfil led? 24 Who is the company expert on basin modelling apps? 25 What do people think of this pressure study? 26 Where are we in the development programme for
these assets?
27 What do we know about horizontal drilling? 28 What applications can I use for this process?

Using automated intelligent tools for metrics
SyntheticRFT
Well A10
Well A9
Well A8
Well A7
Well A6
Well A5
Well A4
Well A3
Well A2
Well A1
Wellbore
Diagram
Comp Log Plot
CoresWell Picks
Joined Logs
Well Header
SyntheticRFT
Well A10
Well A9
Well A8
Well A7
Well A6
Well A5
Well A4
Well A3
Well A2
Well A1
Wellbore
Diagram
Comp Log Plot
CoresWell Picks
Joined Logs
Well Header
52.345
Lat
18.342
Long
Unknown
Datum
A6
Well name
FlareDry P&A12000-25
etcOperatorStatusTDKBE
52.345
Lat
18.342
Long
Unknown
Datum
A6
Well name
FlareDry P&A12000-25
etcOperatorStatusTDKBE
No data Looks okMinor issues
Serious issues
Key
Select assets
Show by Accuracy
Show by Completeness
Show by Consistency
Show byTimeliness
Show by Duplication
Information Quality and Completeness Metric Tool
Drill Down
Show by Hyperbolic View
Selectinformation types
SelectBy process
Show by usageand volumes
Show by Validity
Scope
Data Quality metric
Display
On-linefeedbackavailable

User feedback - quality assessments
Report: What geoscientists should know about deviation surveys (3)
000Negative Feedback
000Neutral Feedback
012Positive Feedback
>6 MonthsLast 6 MonthsLast Month
000Negative Feedback
000Neutral Feedback
012Positive Feedback
>6 MonthsLast 6 MonthsLast Month
pcleverley “Extremely useful, found out some really important stuff on how deviation surveys can rotateif you get the UTM zone wrong”mwilliams ”Written for geoscientists, well worth a read I can recommend it”rjones ”Helped me identify some problems I had with my wells, some of the top reservoir picks were in thewrong x/y space. A must read for all geoscientists especially those working in international acreage”
Items with a positive feedback from 3 consumers
Items with a positive feedback from 6 consumers
Items with a positive feedback from 10 or more consumers
Avoid the traditional bucket approach for data and documents - just putting items in and taking
them out. Learning from Amazon.comTM and EbayTM, making the corporate IM system a
“living” system which builds the organisational memory and generates new knowledge.
Avoid the traditional bucket approach for data and documents - just putting items in and taking
them out. Learning from Amazon.comTM and EbayTM, making the corporate IM system a
“living” system which builds the organisational memory and generates new knowledge.

Return on Investment (ROI)
• Enable Corporate Aspirations
• Risk Reduction
• Intellectual Capital
• IM Cost Reduction
(5) Industry benchmarking - how we compare (direct comparison and trends)
Implement
IM cost
savings
Value C
reationand R
isk Reduction
Enable
Aspirational
Objectives
(4) R
etu
rn o
n In
ve
stm
en
t (RO
I)
(2) Q
ua
lity o
f IM F
ram
ew
ork
,c
om
plia
nc
e &
cu
lture
Corpo
rateC
ompliance
Corpo
rateC
ompliance
IMF
rame
wo
rkC
ulture andB
ehaviou
rsC
ulture andB
ehaviou
rs
(3) E
ffec
tive
ne
ss
of th
e IM
sy
ste
mInform
ationQ
uality &C
omp
leteness
Information
Quality &
Com
pleteness
User
Satisfaction
User
Satisfaction
IM
Architecture
Information
Overload
Investmentin Data
Management
Investmentin traditionalE&P Data
Management
Investmentin Upstream IT
(pure technology)
Investment inE&P Information
Management
(1) IM Investmentstake
Operate Benefit
Justify
(6) Technologies for automating, collecting, presenting and anal ysing metrics
Return on Investment (ROI) may be a combination of benefits, moving away from the single
number to reflect intangible benefits of IM projects and operations
Return on Investment (ROI) may be a combination of benefits, moving away from the single
number to reflect intangible benefits of IM projects and operations

A Risk Based Approach
Low Medium High
Low
Med
ium
Hig
h
Likelihood of occurrence
Bus
ines
s Im
pact
(Fin
anci
al/N
on F
inan
cial
)
Health, Safety andEnvironment
£100M
£10M
Human ResourcesAbility to attract new
staff
ContractorPerformance
Staff Competency
Legal Contracts
Portfolio/concentration
Technical
Country/Political
Regulatory
Commercial/Economic
Does your company treat IM as a key risk domain? Does it have an IM Framework to support it?
Have you quantified your existing exposure to IM?
Does your company treat IM as a key risk domain? Does it have an IM Framework to support it?
Have you quantified your existing exposure to IM?
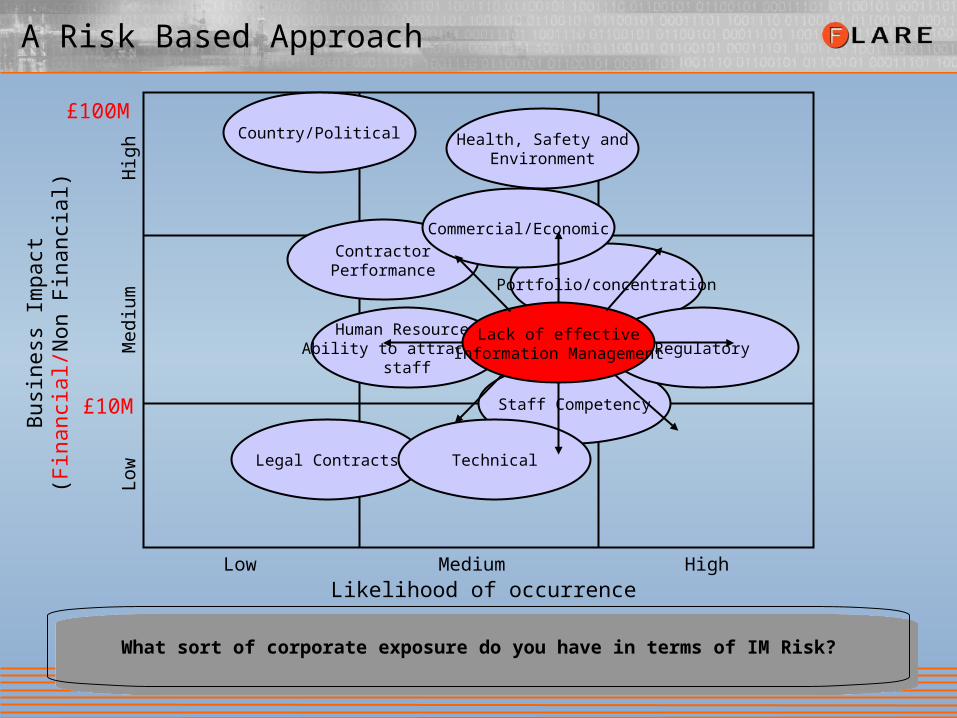
A Risk Based Approach
Low Medium High
Low
Med
ium
Hig
h
Likelihood of occurrence
Bus
ines
s Im
pact
(Fin
anci
al/N
on F
inan
cial
)
Health, Safety andEnvironment
£100M
£10M
Human ResourcesAbility to attract new
staff
ContractorPerformance
Staff Competency
Legal Contracts
Portfolio/concentration
Technical
Country/Political
Regulatory
Commercial/Economic
Lack of effectiveInformation Management
What sort of corporate exposure do you have in terms of IM Risk?What sort of corporate exposure do you have in terms of IM Risk?

A Risk Based Approach
Low Medium High
Low
Med
ium
Hig
h
Likelihood of occurrence
Bus
ines
s Im
pact
(Fin
anci
al/N
on F
inan
cial
)
Health, Safety andEnvironment
£100M
£10M
Human ResourcesAbility to attract new
staff
ContractorPerformance
Staff Competency
Legal Contracts
Portfolio/concentration
Technical
Country/Political
Regulatory
Commercial/Economic
Lack of effectiveInformation Management
Perhaps its current level based on existing controls and business requirements is acceptable?Perhaps its current level based on existing controls and business requirements is acceptable?
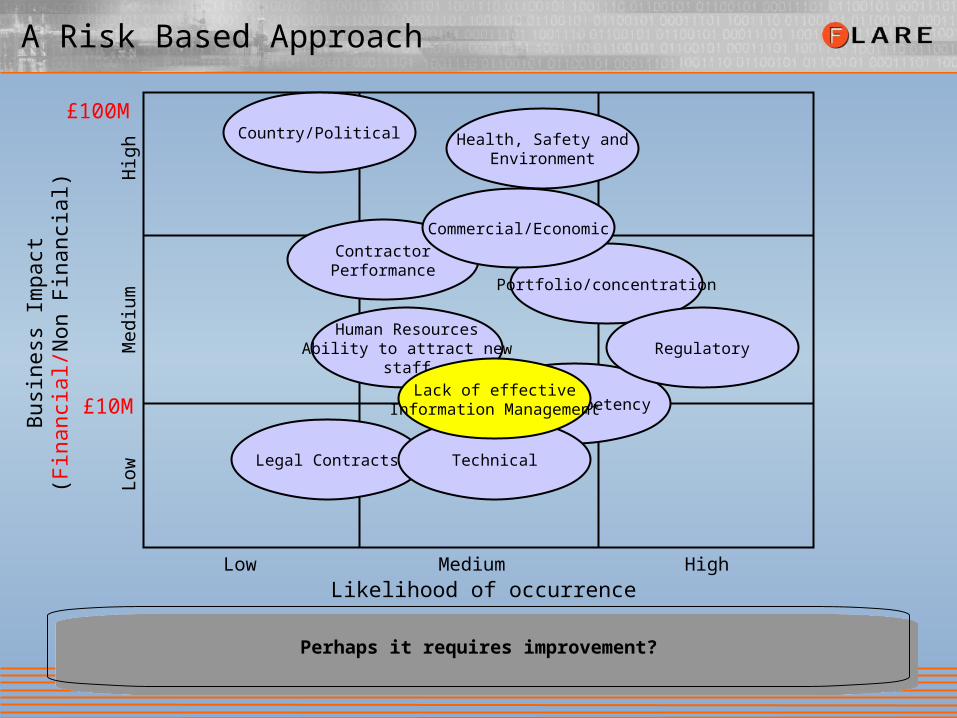
A Risk Based Approach
Low Medium High
Low
Med
ium
Hig
h
Likelihood of occurrence
Bus
ines
s Im
pact
(Fin
anci
al/N
on F
inan
cial
)
Health, Safety andEnvironment
£100M
£10M
Human ResourcesAbility to attract new
staff
ContractorPerformance
Staff Competency
Legal Contracts
Portfolio/concentration
Technical
Country/Political
Regulatory
Commercial/Economic
Lack of effectiveInformation Management
Perhaps it requires improvement?Perhaps it requires improvement?

A Risk Based Approach
Low Medium High
Low
Med
ium
Hig
h
Likelihood of occurrence
Bus
ines
s Im
pact
(Fin
anci
al/N
on F
inan
cial
)
Health, Safety andEnvironment
£100M
£10M
Human ResourcesAbility to attract new
staff
ContractorPerformance
Staff Competency
Legal Contracts
Portfolio/concentration
Technical
Country/Political
Regulatory
Commercial/EconomicLack of effective
Information Management
Or is it unacceptable?Or is it unacceptable?

Types of Generic IM Risk
IM Risk Supporting Metrics described in this report
A. Behaviours 1 Sub-optimal culture for sharing information and collaborating METRIC#2C 2 IM not recognised by mgmt as a strategic resource or
corporate risk domain METRIC#2A
B. IM Framework 3 Standard and processes not well defined METRIC#2A 4 Standards and processes not adhered to, roles and
accountabilities not accepted METRIC#2B
C. Finding information 5 Difficult to find key E&P information METRIC#3A, 3B, 6 Difficult to find ‘knowledge’ related or process info. METRIC#3A, 3C
D. IM Technology 7 Having overly complex/difficult IM tools METRIC#3A, 3B, 3C 8 Not having the right IM tools METRIC#3A 9 Not having the right training for IM tools METRIC#3A
E. Information Usage 10 Poor info. incomplete, wrong version, out of date METRIC#3D,3E,3F,3G,3H 11 Frequency of information too slow Interview question 12 Duplication of critical information METRIC#3A 13 Info. Found but not in a usable format METRIC#3A, 3B, 3C 14 Use of spreadsheets for critical info. Interview question 15 Unable to integrate information effectively METRIC#3A 16 Poor information accessibility METRIC#3A 17 Information Overload METRIC#3A, 3I, 3J, 3K
F. Corporate Memory Loss 18 Not preserving all the information work products we should METRIC#3A, 3G 19 Not capturing the story about the numbers, who to contact,
what people think METRIC#3A, 3C, 3F, 3H
G. Information Security 20 Accidental/malicious unauthorised access Interview question
H. IM Investment/ Resources 21 Insufficient/too much IM investment METRIC#1A, 1B, 1C, 1D 22 Not taking advantage of latest IM cost saving techniques METRIC#4A, 4E
I. Intellectual Capital 23 Not realising the potential or value of the information and
information management system we have. METRIC#4E
J. IM Risk Exposure 24 Unacceptable business risk through poor IM METRIC#4B, 4C

A Risk Based Approach
Low Medium High
Low
Med
ium
Hig
h
Likelihood of occurrence
Bus
ines
s Im
pact
(Fin
anci
al/N
on F
inan
cial
)
Not learning as effectivelyas we could
£10M
£100K
Operations reportingapplication not meetingbusiness expectations
Difficult to accessproduction and finance
systems
Knowledge loss. Corporatememory is incomplete, lack
of auditability andtransparency of info.
Poor quality andincomplete subsurface
data in Subsurface Database
Unable to share the processdocs and information within
the virtual team
Email overload
IT Infrastructure not meetingbusiness expectations
Lack off awareness andsub-optimal behaviours
in IM
Lack of poorprocedures around
deviation data insome areas
Not fulfilling regulatory andpartner reporting obligations
for well data
IM Risk profiles should be co-created between the business and Im functions.
An E&P company recently found its Corporate IM Risk exposure equated to $150Million (Risked)
IM Risk profiles should be co-created between the business and Im functions.
An E&P company recently found its Corporate IM Risk exposure equated to $150Million (Risked)
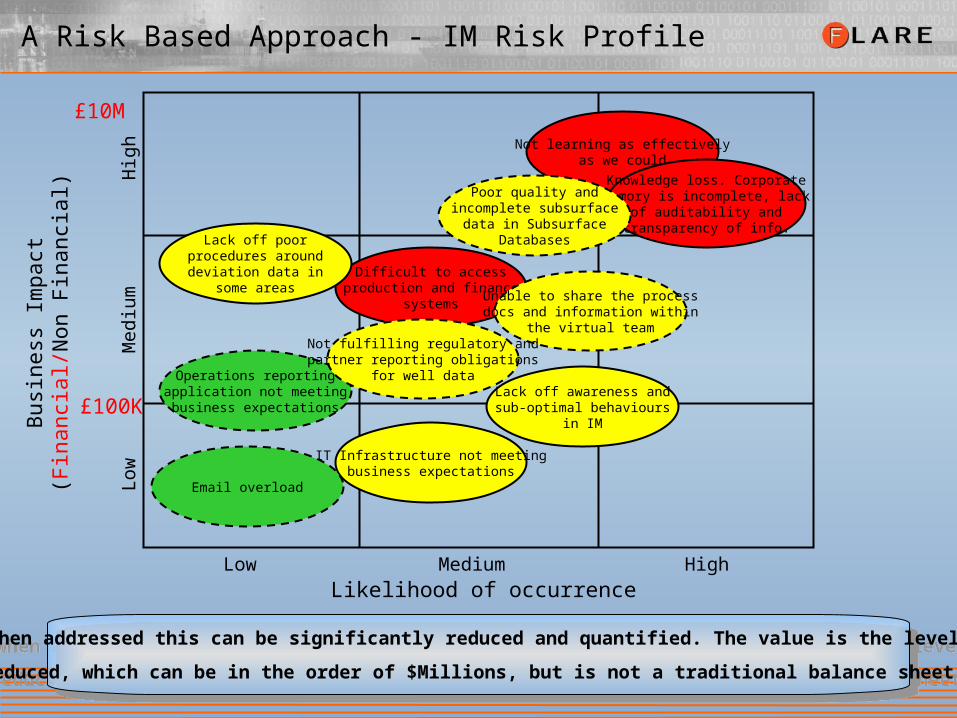
A Risk Based Approach - IM Risk Profile
Low Medium High
Low
Med
ium
Hig
h
Likelihood of occurrence
Bus
ines
s Im
pact
(Fin
anci
al/N
on F
inan
cial
)
Not learning as effectivelyas we could
£10M
£100K
Operations reportingapplication not meetingbusiness expectations
Difficult to accessproduction and finance
systems
Knowledge loss. Corporatememory is incomplete, lack
of auditability andtransparency of info.
Poor quality andincomplete subsurface
data in SubsurfaceDatabases
Unable to share the processdocs and information within
the virtual team
IT Infrastructure not meetingbusiness expectations
Lack off awareness andsub-optimal behaviours
in IM
Lack off poorprocedures around
deviation data insome areas
Not fulfilling regulatory andpartner reporting obligations
for well data
Email overload
..when addressed this can be significantly reduced and quantified. The value is the level of
risk reduced, which can be in the order of $Millions, but is not a traditional balance sheet saving
..when addressed this can be significantly reduced and quantified. The value is the level of
risk reduced, which can be in the order of $Millions, but is not a traditional balance sheet saving

Integrating IM projects into portfolio selection
0 5 10 15 20
Project Cost/Benefit Ratio (CBR) (£)
IM Risk ReductionActivity
Palinspastic ReconstructionStudy
Acquire new geophysical software
Reprocess seismic data
Bring in expertise of play
Prospect Generation with simulated CBR’s for a fictitious play scenario
0 5 10 15 20
Project Cost/Benefit Ratio (CBR) (£)
IM Risk ReductionActivity
Perform a workover
Implementnew valve technology
Fracturereservoir
Field Operations with simulatedCBR’s for a fictitious field scenario
New shift patterns
..a significant number of E&P activities are about reducing risk and uncertainty. Whilst
many IM activities may not be revenue generators, they can significantly reduce risk..
..a significant number of E&P activities are about reducing risk and uncertainty. Whilst
many IM activities may not be revenue generators, they can significantly reduce risk..
Simplified examples to show concept….

Typical Intellectual Capital Elements
Typical Intellectual Capital Elements (Examples)Typical Intellectual Capital Elements (Examples)
Business Strategy
Processes
Business Strategy
Processes
Concept
Formulation
Concept
Formulation
Individual
Differences
Individual
Differences
Management
Enhancement
Processes
Management
Enhancement
ProcessesOrganisational
Structure
Organisational
Structure
Team Dynamics and
Culture
Team Dynamics and
CultureTeam
Psychological
Processes
Team
Psychological
Processes
Technical
Knowledge
Technical
Knowledge
Information
Management
System
Information
Management
System

Intellectual Capital Assessment (ICA)
• Treat the company IM System as an intellectual capital item
• Implement an assessment process to develop the IC Inventory for the IM System
• Level of Knowledge (LoK)• Value Added (VA)• Need to Share More (NTSM)
• Provide IC indicators ($ optional) and also identify potential intellectual capital items
The company information management system is an intellectual capital item
used to derive wealth. Measure it….manage it.
The company information management system is an intellectual capital item
used to derive wealth. Measure it….manage it.

Link between Good IM Practices and Business Success
• Links between companies which adopted decision analysis best practices (but not technologies) and business performance have already been made
• All things being equal, it seems logical that companies who adopt an use IM best practices (not technology) will also perform better than those that do not
Arthur D. Little Carragher AAPG 2000
Can we definitively prove it?Can we definitively prove it?
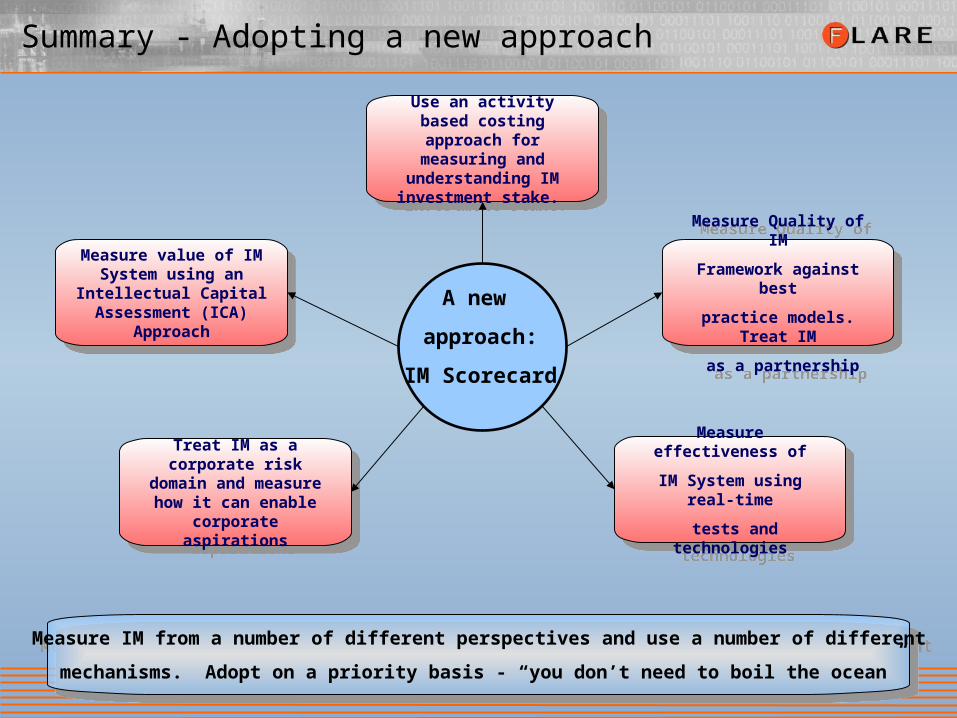
Summary - Adopting a new approach
Use an activity based costing approach for
measuring and understanding IM investment stake.
Use an activity based costing approach for
measuring and understanding IM investment stake.
Measure Quality of IM
Framework against best
practice models. Treat IM
as a partnership
Measure Quality of IM
Framework against best
practice models. Treat IM
as a partnership
Measure effectiveness of
IM System using real-time
tests and technologies
Measure effectiveness of
IM System using real-time
tests and technologies
Measure value of IM System using an
Intellectual Capital Assessment (ICA)
Approach
Measure value of IM System using an
Intellectual Capital Assessment (ICA)
Approach
Treat IM as a corporate risk domain and measure
how it can enable corporate aspirations
Treat IM as a corporate risk domain and measure
how it can enable corporate aspirations
Measure IM from a number of different perspectives and use a number of different
mechanisms. Adopt on a priority basis - “you don’t need to boil the ocean”
Measure IM from a number of different perspectives and use a number of different
mechanisms. Adopt on a priority basis - “you don’t need to boil the ocean”
A new
approach:
IM Scorecard
Thankyou for listening
Any Questions?
“To manage a business well, is to manage the future;
and to the manage the future, is to manage information”Marion Harper, HBS