Embed Size (px)
Citation preview

MEASURING DRIVER INATTENTION
1
The final version of this manuscript was published in:
HUMAN FACTORS, Vol. 57, No. 2, March 2015, pp. 193–207
DOI: 10.1177/0018720814546530
Copyright © 2014, Human Factors and Ergonomics Society.
MEASURING INDIVIDUAL DIFFERENCES IN DRIVER INATTENTION.
FURTHER VALIDATION OF THE ATTENTION-RELATED DRIVING ERRORS
SCALE.
Rubén Daniel Ledesma1, Silvana Andrea Montes
1, Fernando Martín Poó
1 and María
Fernanda López-Ramón2
1Consejo Nacional de Investigaciones Científicas y Técnicas (CONICET) - Universidad
Nacional de Mar del Plata
2Dpto. de Didáctica y Educación, Facultad de Ciencias Humanas y Sociales, Universidad de
Zaragoza, España
Abstract
Objective: The aim of this research was (a) to study driver inattention as a trait-like variable
and (b) to provide new evidence of validity for the Attention-Related Driving Errors Scale
(ARDES).
Background: Driving inattention is approached from an individual differences perspective.
We are interested in how drivers vary in their propensity to experience failures of attention
and in the methods to measure these differences.
Method: In a first sample (n = 301), we tested, via confirmatory factor analysis, a new
theoretical model for the ARDES. In a second sample (n = 201), we evaluated the relationship
between inattention and internal and external sources of distraction and social desirability bias
in ARDES responses. A subsample (n = 65) was reevaluated to study temporal stability of the
ARDES scores.

MEASURING DRIVER INATTENTION
2
Results: Errors measured by the ARDES can be classified according to the driving task level
at which they occur (navigation, maneuvering, or control). Differences in ARDES scores
based on collision history were observed. ARDES was related to internal sources of
distraction and was independent of the level of exposure to distracting activities. Test-retest
showed a high degree of stability in ARDES scores. Low correlations were found with a
social desirability measure.
Conclusion: ARDES appears to measure a personal trait that remains relatively stable over
time and is relatively independent of distracting activities. New evidence of validity emerged
for this self-report.
Application: ARDES can be used to measure individual differences in driving inattention and
to help tailor preventive interventions for inattentive drivers. It can serve as an instrument of
driver self-assessment in educational and training contexts.
Keywords: road safety, driving, driver inattention, measurement, social desirability, temporal
stability, personality traits.
Driver Inattention and Distraction
Driver inattention and distraction are the primary causes of motor vehicle collisions
and incidents (Dingus et al., 2006; Klauer et al., 2006); consequently, these phenomena have
received much attention in the specialized literature, although in a fragmented manner and in
the absence of a unifying theoretical focus and definitions. Regan, Hallet, and Gordon (2011),
following a detailed analysis of definitions and taxonomies, concluded that driving inattention
means: “insufficient, or no attention, to activities critical for safe driving” (p. 1780). The
authors also propose driving inattention sub-types; one such sub-type is “distractions” (Driver
Diverted Attention, according to their taxonomy), in which inattention is due to the presence
of another activity that competes for the driver’s attention (e.g., speaking on a cellphone).

MEASURING DRIVER INATTENTION
3
Generally, research on driving inattention has focused mainly on distractions, and, in
particular, on the effect of certain activities or sources of distraction, such as communication
and driver-assistance technologies (Martens & Brouwer, 2013). Other aspects of the problem
have received less attention. For example, the personal factors that may moderate driving
inattention or predispose one to it have gone relatively unstudied. These factors include
personality and cognitive variables that may be associated with greater inattention (e.g.,
boredom proneness), “internal” sources of distraction (e.g., daydreaming) and the individual’s
manner of managing distractions (e.g., choosing when to engage in distracting tasks and
implementing mechanisms to compensate for the effect of distractions). Ledesma, Montes,
Poó, and López-Ramón (2010) emphasized the need to study some of the factors related to
these phenomena, and developed the Attention-related Driving Errors Scale (ARDES), a self-
reporting instrument that evaluates individual differences in the frequency with which errors
related to a lack of attention while driving are experienced. It is believed that a measure of
this kind could help further research on the personal factors linked to driving inattention, as
well as the interaction of those factors with other factors (environmental, situational, etc.). It
could also serve as an interesting complement in experimental studies on distraction (e.g.,
research on the distraction potential of in-vehicle devices). In such instances, the ARDES
could be included as a covariate to control for individual differences, and to increase the
statistical power of the study’s design.
Individual Differences in Driving Inattention. Theoretical Basis of the ARDES
In a previous work (Ledesma et al., 2010) we focused on driver inattention from the
perspective of individual differences, as a trait-like variable (alluding to the concept of
personality trait). We were interested, therefore, in driving inattention as a tendency or
personal propensity of drivers to experience attentional lapses. It is assumed that this tendency

MEASURING DRIVER INATTENTION
4
can vary from driver to driver, is relatively stable in any one driver, and operates with relative
independence from environmental and situational factors. Below, we define in greater detail
how driving inattention is understood from this perspective.
As authors of the ARDES, we started with the assumption that attentional errors while
driving are present in all human operators due to a variety of personal and environmental
factors, or a combination of them. However, we suggested that there exist inter-individual
differences in terms of the frequency with which these failures are experienced. In other
words, although all drivers have attention-related errors at some point, some are more inclined
to experience them than others. As a trait-like variable, we assume that this disposition tends
to be consistent and stable for any single individual. In the case of the ARDES, although its
items evaluate the presence of errors in very diverse situations, the evidence suggests there is
a common underlying factor in all items (indicators), and a high degree of internal
consistency in the scores (Ledesma et al. 2010; Roca, Padilla, López-Ramón, & Castro,
2013). This evidence allows us to suppose that the ARDES does in fact evaluate an individual
characteristic of a driver that is consistent across situations and contexts.
Obviously, the frequency with which attentional errors while driving are experienced
could be explained by the level of personal exposure to activities or potentially distracting
sources, whether external or internal. We are inclined to believe that ARDES scores are
mainly related to a driver’s personal and internal factors, which configure a more or less
“inattentive” style of driving. Additionally, we believe that greater or lesser exposure to
potentially distracting “external” activities (e.g., frequency of cellphone use) is not necessarily
associated with ARDES scores. Prior results indicated that the ARDES is strongly associated
with measures of attentional functioning, including measures of attention-related errors in
everyday life (Cheyne, Carriere, & Smilek, 2006), present event awareness and attention
(Brown & Ryan, 2003), and dissociative personality traits (Bernstein & Putnam, 1986).
MEASURING DRIVER INATTENTION
5
Further, in a study that combined the evaluation of performance using the Attention Network
Test for Interactions (ANTI) experimental paradigm and the ARDES, it was found that
drivers with higher ARDES scores had less processing speed and less preparation to attend to
high-priority signals (López-Ramón, Castro, Roca, Ledesma, & Lupiañez, 2011). To sum up,
it seems evident that there exist individual variables of personality and cognitive functioning
that play an important role in driving inattention, at least as evaluated by the ARDES.
Another underlying assumption of the ARDES is that the personal tendency to
experience attentional errors can manifest itself at all levels of the driving task, from the most
automatized to those that require greater attentional control. One type of error is found at the
operational or control level (Michon, 1985), the lowest-level driving task, which involves the
execution of basic actions, such as steering, braking and handling other automobile controls.
Examples of ARDES items in this group include “I signal a move but unintentionally make
another” and “I unintentionally shift gears incorrectly or shift to the wrong gear.” They
basically imply coordination between perception and motor actions, and show basic errors in
skill-based behavior (Rasmussen, 1986) that form part of the automatic and effortless routine
of operating a vehicle.
Additionally, a propensity towards driving inattention can manifest itself in
performance errors at the tactical or maneuvering level (Michon, 1985). Examples of ARDES
items at this level include: “At a street corner, I fail to realize that a pedestrian is crossing the
street” and “I fail to realize that the vehicle right in front of me has slowed down, and I have
to brake abruptly to avoid a crash.” This level is more environmental/data-driven, implies
controlled processing and includes driving behaviors such as changing lanes and crossing an
intersection. They generally involve rule-based behaviors (Rasmussen, 1986), which imply
the automatic activation of rules or response patterns in traffic situations. Obviously, errors at
MEASURING DRIVER INATTENTION
6
this level can have more drastic consequences on safe driving performance and increase the
probability of motor vehicle collisions.
Lastly, a tendency toward driving inattention may be manifested by errors at the
strategic or navigation level, which is the top-level driving task and deals with processes such
as route planning and maintenance (Michon, 1985). An example of an ARDES item at this
level is: “When driving somewhere, I make more turns that I have to”. Except when driving
along a routine trajectory, these tasks imply problem solving (e.g, trip-planning and
achievement of goals), controlled processing and knowledge-based behaviors (Rasmussen,
1986).
Another important assumption in the construction of ARDES is that individual
differences in driving inattention can be measured reliably with a self-reporting instrument.
This is an important methodological assumption that is, to some extent, open to debate. On
the one hand, various authors point to the advantages of self-reporting methods in traffic
research, including their low cost and ability to evaluate driving behaviors that are difficult to
study with other methods (e.g., Lajunen & Summala, 2003). Others, conversely, warn about
the limitations and possible validity issues of self-reporting instruments (e.g., af Wahlberg,
2010). One arguable factor is the degree of convergence between self-reporting and other
“objective” sources of information, such as motor vehicle collision data (Arthur et al., 2001;
Boufous et al., 2010; Marottoli, Cooney, & Tinetti, 1997; McGwin, Owsley, & Ball, 1998).
Given that the validity of self-reporting is a controversial issue, it is important to carefully
study its properties and compile evidence of validity through various means. In terms of the
ARDES, some evidence is available of its convergent validity with objective methods of
attentional performance (López-Ramón et al., 2011) and there are also studies that replicate
the questionnaire’s psychometric properties in other cultures (Roca et al., 2013).

MEASURING DRIVER INATTENTION
7
Justification, Objectives and Hypothesis
Although evidence of validity for ARDES has been reported, it remains a novel
instrument and further research to assess its psychometric qualities is needed. One area for
further study is its internal structure. ARDES measures driver inattention as a one-
dimensional construct by assuming that all items are indicators of a single factor. This one-
dimensional assumption was supported by an Exploratory Factor Analysis (EFA) that
revealed a factor structure consisting of a single dimension. Measurement models derived
from an EFA, however, are descriptive in nature. Therefore, alternative statistical analyses are
needed to confirm these results. The first objective of this study was to compare the original
one-dimensional model with an alternative measurement model. In the new alternative model,
ARDES items are grouped in three dimensions according to the level of the driving task in
which they occur: navigation, maneuvering, and control (Michon, 1985). Thus, the new
measurement model supposes three latent and interrelated variables that explain responses to
ARDES items. As part of this first aim, we also analyze the relationship between the three
factors and the drivers’ self-reporting of motor vehicle collisions and traffic tickets for traffic
violations. We hypothesized that subjects who report traffic collisions and tickets will score
higher on the three ARDES factors. We also predict higher effect sizes for the maneuvering-
factor because it involves errors with more catastrophic immediate consequences (e.g., failure
to see a pedestrian or to notice a vehicle braking ahead).
Another important aspect that was not analyzed in the original ARDES validation
study is ARDES’ degree of independence from external sources of inattention. No ARDES
study conducted thus far has tracked an important variable: the subjects’ varying levels of
exposure to distracting activities while driving. Clearly, a high score could be the result of a
driver’s engagement in or exposure to a number of distractor activities rather than a personal
proneness to commit errors. Therefore, a second objective of this study was to determine if
MEASURING DRIVER INATTENTION
8
the errors assessed by ARDES could be the result of exposure to distracting activities rather
than a personal disposition, as originally hypothesized. To determine this, we administered
the Dissociative Experiences Scale - Modified Version (DES-M; Montes, Ledesma, & Poó,
2011) to measure internal sources of inattention (e.g., psychological abstraction) and an ad
hoc index of distracting activities (IDA) to measure external sources of distractions (e.g.,
speaking on a cellphone or eating while driving). The phenomena evaluated with the DES
indicated a personal disposition to experience internally motivated distracting psychological
processes. This is a widely used measure with significant evidence of validity (see for
example, Carlson & Putnam, 1993). We expected that ARDES scores would be better
predicted by DES-M scores rather than IDA scores.
Another unknown aspect of ARDES that is fundamental to its validity is its temporal
stability. Assuming that ARDES provides a relatively consistent measure of personal
propensity, it is reasonable to expect scores to remain stable over time. Thus, the third
objective of this study was to analyze the test-retest correlation following a 6-month period.
Our hypothesis was that there would be a strong positive correlation and an absence of
significant differences between mean scores across time.
Lastly, as a self-reporting instrument, the ARDES is vulnerable to different response
styles and biases, such as social desirability. Previous studies do not address this possibility.
Thus, the fourth objective of this study was to assess ARDES responses for the possible
effects of social desirability bias. Following the example of Lajunen, Corry, Summala and
Hartley (1997), we evaluated the two basic dimensions of social desirability in drivers:
Impression Management (IM) and Self-deception (SD). According to Lajunen and Summala
(2003, pp. 98), “Impression Management refers to the deliberate tendency to give favourable
self-descriptions to others and therefore comes close to lying and falsification. Self-deception
can be defined as a positively biased but subjectively honest self-description”. In

MEASURING DRIVER INATTENTION
9
psychometric terms, the key is to check for IM, which constitutes deliberate bias (Lajunen &
Summala, 2003). Based on previous research (Poó, Ledesma, & Montes, 2010), we expected
a low to moderate correlation with SD, and a low to no correlation with IM.
METHOD
Participants
Sample 1. First, we reanalyzed data from the original ARDES validation study
(Ledesma et al., 2010). The sample consists of 301 drivers drawn from the general population
of the city of Mar del Plata, Argentina. Participants completed the survey using paper and
pencil. The following inclusion criteria were used: (a) must be at least 18 years of age, (b)
must have a valid driver’s license, and (c) must have reported driving at least once a week
during the past 3 months. The age of the subjects ranged from 18 to 79 (Mean=38,
S.D.=13.6); 39 % were in the 18-30 age group, 46 % in the 31-55 age group, and 15 % were
above 55 years of age. Women accounted for 48.8% of the sample. Most participants drove
regularly (70.6 % almost every day; 20.4% some days of the week). On average, prior driving
experience amounted to 18 years (S.D.:13.5). Most participants (86%) had at least completed
high school. No financial compensation was offered for taking part in the study. This sample
was used to specify and test the new measurement model, and to analyze the relationships
with self-reported car crashes (first research objective).
Sample 2. In a second moment, we validated the three factor model with an
independent replication sample that consists of 201 drivers, all residents of the city of Mar del
Plata, Argentina. This new sample also provided the data for the remaining research
objectives. Participants were recruited to participate via email. A series of personal
invitations were sent, followed by a snowball sampling strategy where e-mail recipients
suggested other potential participants. Participants were invited to complete the ARDES

MEASURING DRIVER INATTENTION
10
instrument through a website in which they were briefly informed of the type of research that
was being conducted and the specific purpose of the collected data. The response format was
the same as that of the paper-and-pencil version of the instrument. The age of the drivers
ranged from 19 to 64 (Mean=38, S.D. =12). Women accounted for 52.8% of the sample. Most
participants drove regularly (68.8 % almost everyday), and prior driving experience amounted
to 14 years (S.D.:11). Most participants (91%) had at least completed high school. No
financial compensation was offered for taking part in the study.
A sub-sample of n=65 extracted from the replication sample was used to analyze the
stability of the scores across time. Age range was 20 to 62 years of age (Mean = 34.12; SD =
10.57). The sample had slightly more females (55 %) than males. Most participants drove
almost daily (72%). Most participants (97 %) had an education level of at least high school.
Measures
Attention-related driving error scale (ARDES)
This self-reporting instrument is comprised of 19 items that relate to driving errors
caused entirely or in part by attentional failures (see Table 1). Drivers are asked to read each
item and indicate the frequency with which they experience the described situation by using a
5-point scale, ranging from (1) never or almost never to (5) always or almost always. Sub-
scale scores were calculated by adding up the responses and dividing by the number of items.
The ARDES has both similarities and difference with other existing measures, such as the
lapses scale of the Driving Behaviour Questionnaire (DBQ; Reason, Manstead, Stradling,
Baxter & Campbell, 1990) and the dissociative driving style scale of the Multidimensional
Driving Style Inventory (MDSI; Taubman – Ben-Ari, Mikulincer, & Gillath, 2004). The
ARDES shares the content of some items with these instruments, but differentiates itself by
emphasizing the non-intentional character of the errors and their attentional nature. For a

MEASURING DRIVER INATTENTION
11
more exhaustive comparison, see Ledesma et al. (2010). The original study provided evidence
of reliability and validity for ARDES scores. Results from the validation study indicated high
internal consistency (Cronbach’s alpha=.88), high item-discrimination measures (between .33
and .62), and strong correlation with validation scales (e.g. r=.73 with a measure of
attentional failures in daily life, Cheyne et al. 2006). ARDES was also capable of
discriminating between drivers who reported having been involved in motor vehicle collisions
and participants who reported not having ever been in one. In like manner, it can also identify
drivers who received a traffic ticket for the specific traffic violations that were analyzed.
Table 1. List of items forming the ARDES (Attention-related Driving Errors Scale)

MEASURING DRIVER INATTENTION
12
1. When heading to a known destination, I become distracted and drive a few blocks past it.
2. I signal a move but unintentionally make another (e.g., I turn on the right-turn blinker but turn left
instead).
3. At an intersection, I fail to pay attention and don’t see a car coming the other way.
4. Suddenly, I realize I’ve made a mistake or lost my way to a known destination.
5. At an intersection, instead of looking in the direction of oncoming traffic, I look in the opposite
direction.
6. At a street corner, I fail to realize that a pedestrian is crossing the street.
7. I don’t notice an object or a car behind me, and I unintentionally crash into it.
8. I fail to realize that the vehicle right in front of me has slowed down, and I have to brake abruptly
to avoid a crash.
9. Another driver honks at me because I failed to realize that the traffic light has turned green.
10. I forget that my headlights are on high bean until another motorist flashes his lights at me.
11. For a brief instant, I forget where I’m driving to.
12. When driving somewhere, I make more turns that I have to.
13. Following the car in front of me, I drive through a traffic light that has just turned red.
14. I try to move forward, but then realize I haven’t put the car in gear.
15. I attempt to turn on one of the automobile’s devices, but turn on another instead (for example,
attempting to turn on the windshield wipers, I turn on the lights instead).
16. I head out to a destination and suddenly realize I’m going the wrong way.
17. I realize that I failed to see a traffic light simply because I was not paying attention.
18. I unintentionally make a wrong turn or drive the wrong way down a one-way street.
19. I unintentionally shift gears incorrectly or shift to the wrong gear.
Dissociative Experiences Scale - Modified Version (DES-M)
This scale is a brief version of the original DES (Bernstein & Putnam, 1986),
comprised of 18 items (Montes et al., 2011). DES measures dissociation as a dimensional

MEASURING DRIVER INATTENTION
13
construct which involves experiences ranging from non-pathological manifestations, such as
absorption and daydreaming, to more pathological ones, such as identity disorder symptoms.
Items are answered on a five-point scale, from never or almost never (1) to always or almost
always (5). The scale is composed of three dimensions: (a) Absorption and imaginative
involvement (Cronbach’s Alpha in this sample: .71); (b) Dissociative amnesia and fugues
(Cronbach’s Alpha: .72); and (c) Depersonalization and derealization experiences
(Cronbach’s Alpha: .62).
Index of Distracting Activities (IDA)
Exposure to distractors was measured by a self-reporting of the distracting activities
drivers engaged in over the previous two weeks. The IDA was specifically developed for this
study because, as far as we were aware, a similar measure did not exist. Fourteen distracting
activities were assessed (e.g., speaking on a cellphone while driving, reading or texting
messages, eating, chatting with a passenger, etc.). To simplify analysis, our IDA consisted of
the tally of activities reported (Cronbach’s Alpha= .76).
Driver Social Desirability Scale (DSDS)
The DSDS includes 12-items that evaluate a driver’s tendency to provide positively
biased descriptions of one’s own conduct (Lajunen et al., 1997; Argentine version, Poó et al.
2010). The DSDS is composed by two sub-scales: Driving Impression Management (DIM)
(Cronbach’s Alpha in this study = .80) and Driver Self Deception (DSD) (Cronbach’s Alpha
in this study =.78). Responses are given on a 7-point scale ranging from (1) “not at all true” to
(7) “completely true”.
Driving variables

MEASURING DRIVER INATTENTION
14
A structured questionnaire was used to measure driving variables, including number of
years driving, driving frequency, and motor vehicle collisions and traffic tickets for traffic
violations over the past two years.
Procedure
A series of Confirmatory Factor Analysis (CFA) models were tested using AMOS 16.
Given the ordinal nature of the data, the asymptotically distribution-free estimation procedure
(Browne, 1984) was selected as our first choice. However, frequent estimation problems were
encountered, which led us to switch to the Maximum Likelihood procedure. As is usual in
CFA, we evaluated parameter estimates in relation to model predictions, and assessed the
goodness of fit for each model. The following fit indices were reported: (a) Absolute Fit: root-
mean-square error of approximation (RMSEA), Goodness-of-fit index (GFI), Adjusted
goodness-of-fit index (AGFI), Tucker-Lewis index (TLI), the comparative fit index (CFI),
and the chi-square test statistic; (b) Comparative fit: incremental fit index (IFI), Tucker-Lewis
index (TLI), and Comparative fit index (CFI); and (c) Parsimonious fit: Parsimony normed fit
index (PNFI) and Parsimony normed CFI (PCFI). We also used modification indices to guide
model revision.
Using sample 1, we specified and tested the following models. Model-1 is the one-
factor, one-dimensional model. Model-2 is a first-order oblique model in which three factors
(i.e., Maneuvering, Navigation and Control) are specified as intercorrelated. Strictly for
comparison’s sake, we also specified and evaluated several bidimensional models. Models 3,
4 and 5 are two-factor, first-order oblique models. Each one of these models represents a
different combination of the three primary factors: Model-3 combines Navigation and Control
in the same factor; Model-4 combines the Maneuvering and Navigation factors; and Model-5
unites Maneuvering and Control. Lastly, based on Model-2, we estimated Model 6, a second-

MEASURING DRIVER INATTENTION
15
order model with three lower-order factors (Maneuvering, Navigation and Control) and one
higher-order factor (Driver Inattention).
Additionally, the following analyses were undertaken: multiple logistic regression to
analyze the relationship between ARDES’ factors and the presence/absence of traffic
collisions and tickets (sample 1), multiple regression analysis to estimate the effects of the
DES and IDA (predictor variables) on ARDES scores (sample 2); correlation analysis and
difference of means testing to evaluate ARDES stability over time (sub-sample 2); and
correlation analysis between the ARDES and DSDS to detect the possible effects of social
desirability (sample 2).
RESULTS
Confirmatory Factor Analysis
A first CFA suggested the elimination of item number 18 due to a low factor-loading
(i.e. <.20) in all the tested models. Also, the modification indices suggested adding error
covariance between items 1 and 4, as well as between items 3 and 5. This can be attributed to
the similarity in wording and content of the items. After introducing these minor changes, all
models tended to show better fit indices.
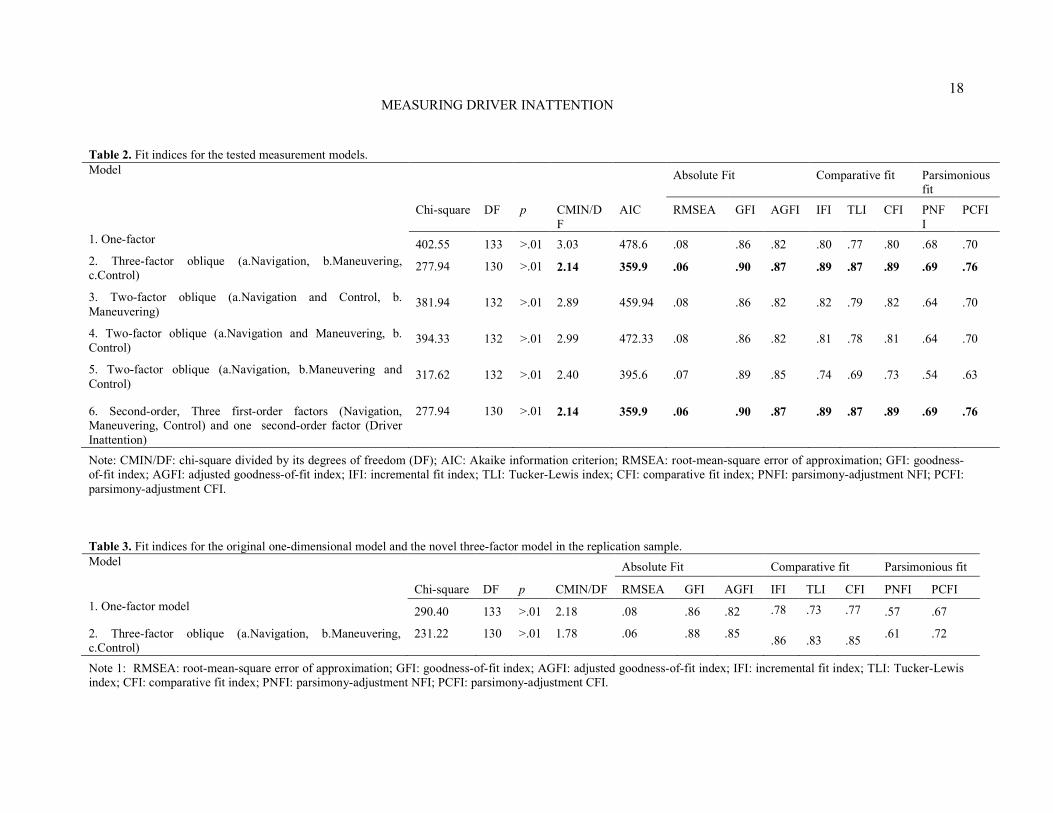
Table 2 shows the fit indices for the one-, two-, and three-factor models. As can be
seen, the three-factor models have the best goodness-of-fit indices when compared to the
other models, particularly to the original one-factor model. In addition, the three-factor model
also revealed good item factor-loadings (standard regression weights) that were all significant
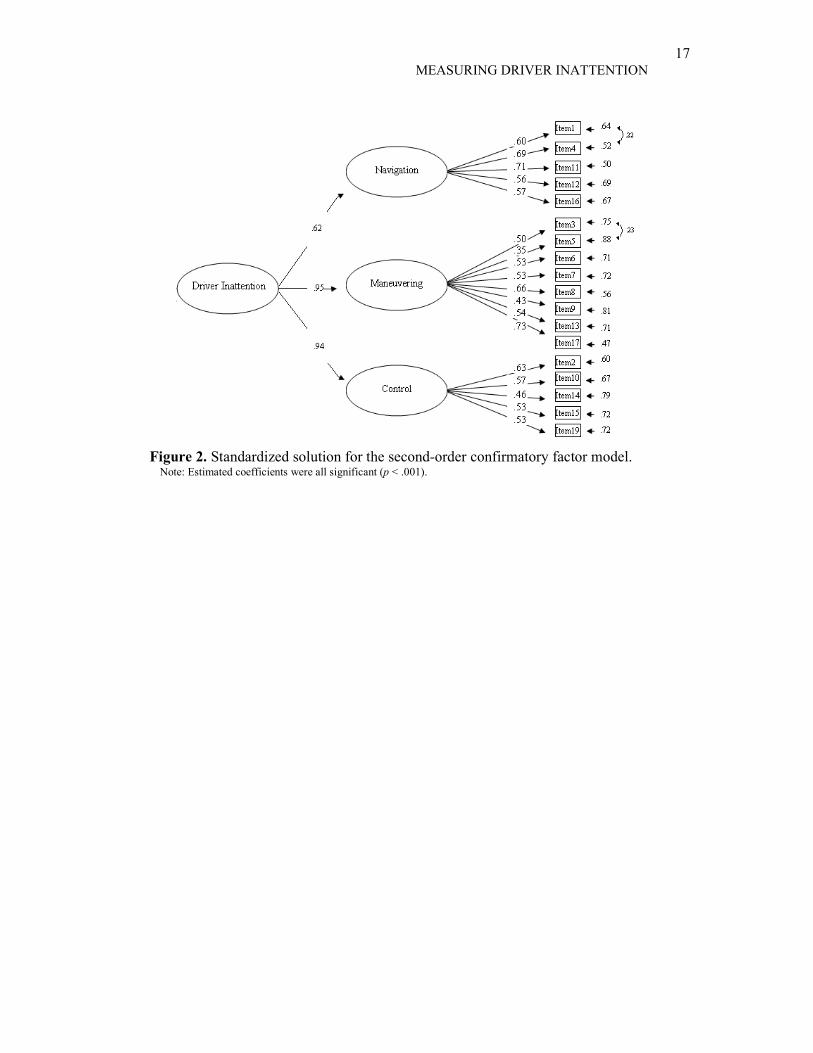
(p < .001). As can be seen in Figure 1, the three factors are strongly inter-related, which leads
to the assumption that a second-order underlying factor exists. We call this second order
factor “Driver Inattention” (see Figure 2).

MEASURING DRIVER INATTENTION
16
The results from models 1 and 2, which are those who have theoretical interest in this
study, were validated with the second sample. Again, the three-factor solution showed good
model-fit in this replication sample (see Table 3).
Figure 1. Standardized solution for the first-order confirmatory factor model.
Note: Correlation among factors and standard regression weights were all statistically significant, p< .001.
MEASURING DRIVER INATTENTION
17
Figure 2. Standardized solution for the second-order confirmatory factor model. Note: Estimated coefficients were all significant (p < .001).
MEASURING DRIVER INATTENTION
18
Table 2. Fit indices for the tested measurement models.
Model Absolute Fit Comparative fit Parsimonious
fit
Chi-square DF p CMIN/D
F
AIC RMSEA GFI AGFI IFI TLI CFI PNF
I
PCFI
1. One-factor 402.55 133 >.01 3.03 478.6 .08 .86 .82 .80 .77 .80 .68 .70
2. Three-factor oblique (a.Navigation, b.Maneuvering,
c.Control) 277.94 130 >.01 2.14 359.9 .06 .90 .87 .89 .87 .89 .69 .76
3. Two-factor oblique (a.Navigation and Control, b.
Maneuvering) 381.94 132 >.01 2.89 459.94 .08 .86 .82 .82 .79 .82 .64 .70
4. Two-factor oblique (a.Navigation and Maneuvering, b.
Control) 394.33 132 >.01 2.99 472.33 .08 .86 .82 .81 .78 .81 .64 .70
5. Two-factor oblique (a.Navigation, b.Maneuvering and
Control) 317.62 132 >.01 2.40 395.6 .07 .89 .85 .74 .69 .73 .54 .63
6. Second-order, Three first-order factors (Navigation,
Maneuvering, Control) and one second-order factor (Driver
Inattention)
277.94 130 >.01 2.14 359.9 .06 .90 .87 .89 .87 .89 .69 .76
Note: CMIN/DF: chi-square divided by its degrees of freedom (DF); AIC: Akaike information criterion; RMSEA: root-mean-square error of approximation; GFI: goodness-
of-fit index; AGFI: adjusted goodness-of-fit index; IFI: incremental fit index; TLI: Tucker-Lewis index; CFI: comparative fit index; PNFI: parsimony-adjustment NFI; PCFI:
parsimony-adjustment CFI.
Table 3. Fit indices for the original one-dimensional model and the novel three-factor model in the replication sample.
Model Absolute Fit Comparative fit Parsimonious fit
Chi-square DF p CMIN/DF RMSEA GFI AGFI IFI TLI CFI PNFI PCFI
1. One-factor model 290.40 133 >.01 2.18 .08 .86 .82 .78 .73 .77 .57 .67
2. Three-factor oblique (a.Navigation, b.Maneuvering,
c.Control)
231.22 130 >.01 1.78 .06 .88 .85 .86 .83 .85
.61 .72
Note 1: RMSEA: root-mean-square error of approximation; GFI: goodness-of-fit index; AGFI: adjusted goodness-of-fit index; IFI: incremental fit index; TLI: Tucker-Lewis
index; CFI: comparative fit index; PNFI: parsimony-adjustment NFI; PCFI: parsimony-adjustment CFI.

MEASURING DRIVER INATTENTION
19
Given the good fit of Model 2 and 6, we computed composite scores for each one of
the three factors. The Cronbach’s Alpha for the resulting scales were: (a) Navigation = .74;
(b) Maneuvering = .75; and (c) Control = .68. All of these values are above or close to the
acceptable values for research purposes.
ARDES and Self-reported Motor Vehicle Collisions and Tickets
Table 4 presents results from the multiple logistic regression models, assessing the
association between the ARDES scores and different types of self-reported motor vehicle
collisions and traffic tickets. Overall, attention-related errors at the maneuvering level tend to
be associated with motor vehicle collisions and traffic tickets, while no significant
associations were observed with the other two factors (navigation and control).
Table 4. ARDES scores and self-reported traffic collisions and tickets
Dependent variable Independent variables
Exp(B) (95%CI), p
ARDES-Control ARDES-Maneuvering ARDES- Navigation
Traffic collision.
Involvement in any type of traffic
collision.
.62(.32- 1.19) p=.15 2.65 (1.19- 5.94), p=.02 1.51(.93-2.44), p=.09
Minor material damages.
Involvement in traffic collision
with only minor material
damages.
.66(.33-1.28), p=.22
2.35(1.04-5.34), p=.04
1.54 (.95-2.5), p=.08
Major material damages.
Involvement in traffic collision
with total or partial vehicle
destruction.
1.97(.42-9.33), p=.39 .84(.10- 7.0), p=.87 1.23(.36- 4.25), p=.74
Traffic Injuries.
Involvement in traffic collision
resulting in injuries.
.70(.23-2.12), p=.52 3.40 (.90- 12.95), p=.07 1.18(.56-2.51), p=.66
Traffic ticket.
Traffic tickets for traffic
violations.
.85(.37- 1.92), p=.69 5.56( 2.04-15.21), p<.001 .58(.30-1.14), p=.12

MEASURING DRIVER INATTENTION
20
Significant effects shown in bold.
ARDES, Dissociative Experiences and Distracting Activities
As shown in Table 5, ARDES total correlated positively and moderately with the
DES-M total (r=.50, p< .01), and weakly with the IDA (r= .16, p<.05). The correlation
between DES-M and IDA was also weak (r= .18, p<.01). A multiple regression analysis
suggested that ARDES scores are significantly associated with DES-M (Standardized
beta=.49, t=7.899, p<.01), but not with IDA (Standardized beta=-.07, t=-1.198, p>.05).
ARDES’ sub-scales moderately correlated with the DES-M (Navigation: r= .38,
p<.01; Maneuvering: r= .47, p<.01; Control: r= .35, p<.01), and weakly with the IDA
(Navigation: r= .18, p<.05; Maneuvering: r= .20, p<.01; Control: r= -.09, p>.05).
Correlations between the ARDES and the DES-M sub-scales were similar to those of the
DES-M overall.
Table 5. Correlations between ARDES’ scores, the DES-M and IDA
ARDES ARDES
-Nav
ARDES
-Man
ARDES
-Cont.
DES-M DES-M
Abs
DES-M
Amn
DES-M
Desp
ARDES
Nav.
.79**
ARDES
Man.
.87** .49
**
ARDES
Cont.
.74** .41
** .54
**
DES-M
.50** .38
** .47
** .35
**
DES-M
Abs.
.44** .32** .39** .33** .84**
DES-M
Amn.
.48** .38
** .43
** .31
** .87
** .55
**
DES-M
Desp.
.31** .22
** .25
** .24
** .75
** .52
** .53
**

MEASURING DRIVER INATTENTION
21
IDA
.16* .18* .20** -.09 .17* .11* .24** .03
* p< 0.05 (unilateral), ** p< 0.01 (unilateral),
Note: ARDES: Attention-related Driving Errors Scale; ARDES-Nav.: Attention-related Driving Errors Scale
Navigation Subscale; ARDES-Man.: Attention-related Driving Errors Scale Maneuvering Subscale; ARDES-Control:
Attention-related Driving Errors Scale Control Subscale; DES-M: Dissociative Experiences Scale Modified Version
(total score); DES-M.Abs: DES-M Absorption subscale; DES-M.Amn: DES-M Amnesia subscale; DES-M.Desp.:
DES-M Depersonalization subscale; IDA: Index of distracting activities.
Temporal Stability of ARDES Scores
Table 6 shows the test-retest means for the ARDES’ scores. There was a significant
but small observable difference in the overall means (t (64) =-2,946, p=.004; d=-0.24). At the
sub-scale level, there was a significant difference in means for Maneuvering (t (64) =-2,419,
p=.018), but not for Navigation (t (64) =-1,952, p=.055), and Control (t (64) =-1,665,
p=.101). Further, a positive significant correlation was found between the scores generated by
the first and second administration of the ARDES (r=.79, p<.01). Correlations were also
positive and high for the sub-scale scores generated at the different moments in time
(Navigation: r= .74, p<.01; Maneuvering: r= .73, p<.01; Control: r= .71, p<.01).
Table 6. Test-Retest Means for the ARDES scores.
ARDES total Navigation Maneuvering Control
M SD M SD M SD M SD
Test 1.49 .32 1.60 .51 1.52 0.36 1.34 0.35
Re-Test 1.60 .31 1.72 .56 1.65 0.35 1.40 0.35
ARDES and Social Desirability
The ARDES and its sub-scales had a low negative correlation with the Impression
Management sub-scale and a moderate negative correlation with the Self Deception sub-scale
(see Table 7). These results suggest a low Impression Management effect, which is the
dimension that can most affect self-reported results (Lajunen & Summala, 2003).

MEASURING DRIVER INATTENTION
22
Table 7. Correlations between ARDES’ scores and the Driver Social Desirability Scale
ARDES
Total Score
ARDES
Navigation
ARDES
Maneuvering
ARDES
Control
DSDS(Impression Management) -.19** -.15* -.28** .02
DSDS(Driver Self Deception) -.40** -.29
** -.38
** -.33
**
Note: DSDS: Driver Social Desirability Scale.
DISCUSSION
The results suggest that driver inattention as measured by the ARDES reflects a
personal variable that tends to be relatively consistent and stable over time. This is reflected in
stable scores for the same individual over time (test-retest at a six-month interval). This is in
line with the idea that ARDES is measuring individual differences in a trait-like variable,
which manifests itself as a greater or lesser tendency to experience attentional failures while
driving (Ledesma et al. 2010). As indicated by Lee (2009), attention-related failures do not
appear to occur randomly, but rather reflect “enduring behavior patterns”. What is even more
interesting is that this tendency is related to personal characteristics and internal sources of
distraction, and not as much with involvement in secondary activities (e.g., level of
engagement in activities like speaking on the telephone). In fact, our results indicate a weak
relationship between the frequency of attentional errors and involvement in distracting
activities.
A possible explanation for the above is that drivers with greater “inattention”
proneness may be aware to some extent of their attentional limitations, and consequently
control the degree to which they expose themselves to distractors as a means of mitigating the
effects of inattention. On the other hand, they seem incapable of adequately “managing” the

MEASURING DRIVER INATTENTION
23
internal sources of distraction (e.g., intrusive or task unrelated thoughts), possibly because
they are associated with psychological characteristics that are more stable and difficult to
control (Smallwood, Baracaia, Lowe, & Obonsawin 2003; McVay, Kane, & Kwapil, 2009).
Another contributing factor is the fact that “internal” distractions are beyond the reach of
enforcement actions and that, unlike with other sources of distraction such as cellphone use,
there isn’t much public awareness as to their effects (NHTSA, 2010; Vermette, 2010).
With respect to the internal structure of the ARDES, the CFA suggests that items can
be empirically grouped according to the task level at which the errors occur (i.e.
Maneuvering, Navigation and Control; Michon, 1985). This differentiation is useful in that
each factor seems to relate differently to driver safety. In fact, only the maneuvering subscale
is consistently associated with involvement in traffic collisions and the incurring of traffic
tickets. Nonetheless, it is also true that these three factors share a strong common basis,
having already been found to be strongly related among each other, and having similar
correlation profiles with respect to other variables that have been studied. This suggests the
plausibility of a second-order factor that measures overall inattention while driving.
In short, the three-factor structure seems adequate and contributes relevant information
in terms of road safety. However, in light of the results, a single total score could also be valid
and, in some cases, more convenient. For example, in studies on the distraction potential of
in-vehicle devices, ARDES could be included as a simple measure to control individual
differences and increase the statistical power of research. In this case, a global score would be
sufficient and would also offer a more reliable measure than the subscales would (the
reliability of the subscales tends to be less than the reliability of the total score due to the
lower number of items).
With respect to reliability, another important factor is that the ARDES is a self-
reporting instrument, and could therefore be sensitive to social desirability bias. For this

MEASURING DRIVER INATTENTION
24
reason it is important to control this possibility. In this regard, our results are in line with the
findings of previous studies. Poó et al. (2010) found the same correlation patterns between the
DSDS and the dissociative driving style subscale of the Multidimensional Driving Style
Inventory (that is, a low correlation with the Impression Management scale and a moderate
correlation with the Self-Deception scale). We believe it is best to be cautious and check for
such bias when possible. We recommend including desirability measures to screen subjects
with high scores and providing response conditions that reduce bias (responder anonymity,
confidentiality, etc.).
We believe this study gives a useful research tool and opens interesting lines of future
work into individual differences in driving inattention. First, it would be interesting to deepen
our understanding of the psychological correlations of driving inattention through
correlational studies on personality and cognitive variables. It would be worthwhile to work
with comprehensive personality models, such as the Big Five (Mc Crae & Costa, 2003) or the
Alternative Five (Zuckerman, 2005) to obtain a fuller understanding of the relationship
between personality and driver inattention. Experimental cognitive psychology research, such
as Lopez-Ramón et al. (2011), would also be essential. These studies are vital to
understanding the individual differences in driving inattention and also to providing evidence
of validity for self-reporting instruments.
In addition to deepening our understanding of the psychological correlations of
inattention, it would also be important to study the manner in which this variable interacts
with other factors. As Reason (1990) and Stanton and Salmon (2009) state, a complete
analysis of human error requires a systematic perspective that includes driver, vehicle and
road environment factors. Besides theoretical questions on the nature of individual differences
in driving inattention, we believe our research also leads to practical questions. For instance,
to what degree is the effectiveness of interventions to address or reduce driving distractions
MEASURING DRIVER INATTENTION
25
moderated by individual differences in driver inattention? Might subjects with a high
propensity toward inattention be more resistant to certain preventive actions? If so, what kind
of actions might be more appropriate for this type of driver? We believe the ARDES is a
useful tool for future research into questions such as these.
In summary, this study clarifies and improves the psychometric basis of ARDES and
provides new evidence supporting its potential use in research. It should be made clear that
we are not inclined to believe that this type of instrument should be used for driver licensing
testing, since the responses can be manipulated by the subjects being evaluated. We do
believe that the ARDES can serve as an instrument of driver self-assessment in educational
and training contexts. In other words, as a tool to help drivers become aware of their personal
tendency towards driver inattention. An example of this type of use is the “Drivers 65 plus” of
the AAA Foundation for Traffic Safety (2010). This is a self-rating instrument designed to
help adult drivers become aware of some age-related changes that can affect safe driving. Of
course, in order to be used for this purpose, additional validation studies and normative data
on target populations are required.
ACKNOWLEDGMENTS
This study was supported by a contribution from the World Bank’s Global Road
Safety Facility and the Global Forum for Health Research through their grant facility to the
Road Traffic Injuries Research Network (Agreements No. RTIRNWB-004d and RTIRNWB-
005d). It also received support from the Universidad Nacional de Mar del Plata and
CONICET (Consejo Nacional de Investigaciones Científicas y Técnicas, Argentina). We
express our gratitude to these institutions for their support.

MEASURING DRIVER INATTENTION
26
KEY-POINTS
• Results reflect a personal tendency toward inattention that appears to be relatively
consistent and stable for each individual driver.
• Individual differences in driver inattention are associated with road traffic collisions.
• Driver inattention can be easy assessed by ARDES (The Attention-related driving errors
scale).
REFERENCES
AAA Foundation for Traffic Safety (2010). Drivers 65 plus: Check your own performance: A self-
rating form of questions, facts and suggestions for safe driving. Washington, DC: Author.
Arthur, W., Tubre, T., Day, E. A., Sheehan, M. K., Sanchez-Ku, M. L., Paul, D., Archuleta, K. (2001).
Motor vehicle crash involvement and moving violations: Convergence of self-report and
archival data. Human Factors, 43, 1–11.
Boufous, S., Ivers, R., Senserrick, T., Stevenson, M., Norton, R., Williamson, A. (2010). Accuracy of
self-report of on road crashes and traffic offences in a cohort of young drivers: the DRIVE
study. Injury Prevention, 16, 275-277.
Bernstein, E. M., & Putnam, F. W. (1986). Development, reliability, and validity of a dissociation
scale. Journal of Nervous and Mental Disease, 174, 727–735.
Brown, K. W., & Ryan, R. M. (2003). The benefits of being present: Mindfulness and its role in
psychological well-being. Journal of Personality and Social Psychology, 84, 822–848.
Browne, M. W. (1984). Asymptotically distribution-free methods for the analysis of covariance
structures. British Journal of Mathematical and Statistical Psychology, 37, 62-83.
Carlson, E., & Putnam, F. (1993). An update on the Dissociative Experience Scale. Dissociation, 6,
16-27.
Cheyne, J. A. Carriere, J. & Smilek, D. (2006). Absent-mindedness: Lapses of conscious awareness
and everyday cognitive failures. Consciousness and Cognition, 15, 578-592.

MEASURING DRIVER INATTENTION
27
Dingus, T.A., Klauer, S.G., Neale, V.L., Petersen, A., Lee, S.E., Sudweeks, J., Perez, M.A., Hankey,
J., Ramsey, D., Gupta, S., Bucher, C., Doerzaph, Z.R., Jermeland, J., & Knipling, R.R. (2006).
The 100-Car Naturalistic Driving Study, Phase II—Results of the 100-car field experiment.
Technical Report No. DOT HS 810 593. Washington, DC.: National Highway Traffic Safety
Administration.
Klauer, S. G., Dingus, T. A., Neale, V. L., Sudweeks, J. D., & Ramsey, D. J. (2006). The impact of
driver inattention on near-crash/crash risk: An analysis using the 100-car naturalistic driving
study data. DOT HS 810 594. Washington, DC: National Highway Traffic Safety
Administration. Recuperado el 08/08/2010 de:
http://www.nsc.org/safety_road/Distracted_Driving/Documents/The%20Impact%20of%20Dri
ver%20Inattention%20on%20Near-Crash.pdf
Lajunen, T., Corry, C., Summala, H. & Hartley, H. (1997). Impression Management and Self-
Deception in traffic behavior inventories. Personality and Individual Differences, 22, 341-
353.
Lajunen, T. & Summala, H. (2003). Can we trust self-reports of driving? Effects of impression
management on driver behavior questionnaire responses. Transportation Research Part F:
Traffic Psychology and Behaviour, 6, 97-107.
Ledesma, R., Montes, S., Poó, F., & López-Ramón, M.F (2010). Individual Differences in Driver
Inattention: The Attention-related Driving Errors Scale. Traffic Injury Prevention, 11, 142-
150.
Lee, J.D. (2009). Engineering. Can technology get your eyes back on the road? Science, 324, 344-346.
López-Ramón, M.F., Castro, C., Roca, J., Ledesma, R., & Lupiañez, J. (2011). Attentional Networks
Functioning, Age, and Attentional Lapses While Driving. Traffic Injury Prevention, 12, 518-
528.
Marottoli, R. A., Cooney, L. M., & Tinetti, M. E. (1997). Selfreport versus state records for
identifying crashes among older drivers. Journal of Gerontology, 52, 184–187.

MEASURING DRIVER INATTENTION
28
Martens, M. H., & Brouwer, R. F. (2013). Measuring being lost in thought: An exploratory driving
simulator study. Transportation Research Part F: Traffic Psychology and Behaviour, 20, 17-
28.
McCrae, R. R., & Costa, P. T., Jr. (2003). Personality in adulthood: A five-factor theory perspective
(2nd ed.). New York: Guilford Press.
McGwin, G., Owsley, C., & Ball, K. (1998). Identifying crash involvement among older drivers:
Agreement between self-report and state records. Accident Analysis & Prevention, 30, 781–
791.
McVay, J.C., Kane, M.J., & Kwapil, T.R. (2009). Tracking the train of thought from the laboratory
into everyday life: An experience-sampling study of mind-wandering across controlled and
ecological contexts. Psychonomic Bulletin & Review, 16, 857-863.
Michon, J A. (1985). A critical review of driver behaviour models: What do we know, what should we
do? In: L. Evans & R. C. Schwing (Eds.). Human behaviour and traffic safety (487-525). New
York: Plenum Press.
Montes, S., Ledesma, R., & Poó, F. (2011). Evaluación psicométrica de una versión modificada de la
Escala de Experiencias Disociativas (DES-M). Revista Argentina de Clínica Psicológica, 20,
67-77.
National Highway Traffic Safety Administration (2010). Overview of the National Highway Traffic
Safety Administration’s. Driver Distraction Program. DOT HS 811 299 Washington, DC:
Autor. Recuperado el 16/06/2012 de:
www.nhtsa.gov/staticfiles/nti/distracted_driving/pdf/811299.pdf
Poó, F., Ledesma, R., & Montes, S. (2011). Propiedades Psicométricas de la Escala de Deseabilidad
Social del Conductor (Versión en Español). [Psychometric properties of the driver
social desirability scale (Spanish version)], Avaliação Psicológica, 9, 299-310.
Rasmussen, J. (1986). Information processing and human machine interaction. An approach to
cognitive engineering. New York: Elsevier Eds.
Reason, J. (1990). Human Error. NY: Cambridge University Press.
MEASURING DRIVER INATTENTION
29
Reason, J.T., Manstead, A., Stradling, S., Baxter, J.S. & Campbell, K. (1990). Errors and violations on
the roads: a real distinction? Ergonomics, 33, 1315-1332.
Regan, M., Hallett, C., & Gordon, C. (2011). Driver distraction and driver inattention: Definition,
relationship and taxonomy. Accident Analysis & Prevention, 43, 1771-1781.
Roca, J. Padilla, J. L., López-Ramón, F. M., & Castro, C. (2013). Assessing individual differences in
driving inattention: Adaptation and validation of the Attention-Related Driving Errors Scale to
Spain. Transportation Research Part F: Traffic Psychology and Behaviour, 21, 43-51.
Smallwood, J. M., Baracaia, S. F., Lowe, M., & Obonsawin, M. (2003). Task unrelated thought whilst
encoding information. Consciousness & Cognition, 12, 452-484.
Stanton, N. & Salmon, P. (2009). Human error taxonomies applied to driving: A generic driver error
taxonomy and its implications for intelligent transport systems. Safety Science, 47, 227–237.
Taubman- Ben-Ari O, Mikulincer M, Gillath O. (2004) The multidimensional driving style inventory-
scale construct and validation. Accident Analysis & Prevention, 36, 323-332.
Vermette, E. (2010). Curbing Distracted Driving: 2010 Survey of State Safety Programs, Governor‘s
Highway Safety Association (GHSA), Washington, D.C.
af Wahlberg, A. (2010). Social desirability effects in driver behaviour inventories. Safety Science, 41,
99-106.
Zuckerman, M (2005). Psychobiology of personality. Cambridge: Cambridge University Press.
BIOGRAPHIES
• Ruben D. Ledesma, PhD Psychologist (Valencia, Spain, 2001), Researcher at CONICET
(Consejo Nacional de Investigaciones Científicas y Técnicas) and Universidad Nacional de
Mar del Plata, Argentina.
• Silvana A. Montes, PhD Psychologist (Mar del Plata, Argentina, 2013), postdoctoral scholar
at CONICET (Consejo Nacional de Investigaciones Científicas y Técnicas), Universidad
Nacional de Mar del Plata, Argentina.
MEASURING DRIVER INATTENTION
30
• Fernando M. Poó, PhD Psychologist (Mar del Plata, Argentina, 2011), Researcher at
CONICET (Consejo Nacional de Investigaciones Científicas y Técnicas) and Universidad
Nacional de Mar del Plata, Argentina.
• María Fernanda López-Ramón, PhD Psychologist (San Luis, Argentina, 2006), Assistant
Professor, Dpto. de Didáctica y Educación, Facultad de Ciencias Humanas y Sociales,
Universidad de Zaragoza, España.


![Individual Differences [Recovered]](https://img.pdfslide.us/doc/110x75/5695d4621a28ab9b02a147e9/individual-differences-recovered.jpg)

