Embed Size (px)
Citation preview
Measuring Human Capital using Global Learning Data
Noam Angrist*, Simeon Djankov, Pinelopi K. Goldberg, and Harry A. Patrinos
*Corresponding author:
Correspondence and requests for materials should be addressed to Noam Angrist (e-mail:
World Bank, 1818 H Street NW, Washington, DC 20433 University of Oxford, Oxford OX1 2JD, United Kingdom Affiliations of non-corresponding authors: Simeon Djankov, London School of Economics, Houghton St, Holborn, London WC2A 2AE, United Kingdom Peterson Institute for International Economics, 1750 Massachusetts Avenue, Washington DC 20036 Pinelopi K. Goldberg Yale University, New Haven, CT 06520, United States Peterson Institute for International Economics, 1750 Massachusetts Avenue, Washington DC 20036 Harry A. Patrinos World Bank, 1818 H Street NW, Washington, DC 20433
2
Summary
To understand and track human capital formation, a critical component of development, one needs globally comparable learning metrics.1-2 The growth of international achievement tests is a significant step in this direction.3 However, such tests are administered primarily in rich countries4, limiting the ability to analyze learning patterns in developing countries which might have the most to gain from human capital formation. We bridge this gap, constructing a globally comparable database of 164 countries from 2000-2017. The data represent 98 percent of the global population and developing economies comprise two-thirds of included countries. Using this new data, we show that global learning progress has been limited, despite rising school enrollments. Based on a development accounting exercise that uses a direct measure of schooling quality, we estimate that the role of human capital in explaining cross-country income differences ranges from a fifth to half – a middle ground in a wide-ranging literature. Moreover, we find that average estimates mask significant heterogeneity by country income grouping and region. This heterogeneity underscores the importance of including countries at varying stages of economic development when analyzing the role of human capital in development. Finally, we show that our database provides a measure of human capital that is more closely associated with economic growth than current measures included in the Penn World Tables 9.05 and Human Development Index.6

3
The notion of human capital – resources imbedded in people – was alluded to as early as 1776 by
Adam Smith7 and formalized two centuries later by Gary Becker.8 Ever since, the literature has
explored the role of human capital in economic development. For decades, this literature proxied
human capital with measures of schooling.9-11 This applies even to the most prominent index of
human capital to date, the United Nation’s Human Development Index (HDI).
However, proxying human capital with schooling assumes that being in school translates into
learning. Evidence suggests that this is often not the case.12 A recent analysis reveals that six out
of ten adolescents worldwide cannot meet basic proficiency levels in math and reading.13 The gap
between schooling and learning is acute in developing countries. In Kenya, Tanzania, and Uganda
three quarters of grade 3 students cannot read a basic sentence such as “the name of the dog is
Puppy.” In rural India, half of grade 3 students cannot solve a two-digit subtraction problem such
as 46 minus 17.1
These stylized facts demonstrate a substantial gap in human capital formation: students are in
school, but do not learn enough. Closing this gap is an important priority for economic
development. Several papers have argued that when human capital is measured by schooling, it
fails to deliver the returns predicted by growth models. However, when measured by learning,
human capital is more strongly associated with growth.3,14,15
To date, much of the effort to measure learning has focused on advanced economies. This
limitation is due to the absence of comparable measures of learning in developing countries.
Existing measures exclude a significant portion of the global distribution, in particular countries
with the most potential to gain from human capital accumulation.
In this paper, we bridge this gap. We introduce a database of globally comparable learning
outcomes for 164 countries covering 98 percent of the global population from 2000 to 2017. This
is the largest and most current global learning database, one of the first to disaggregate learning
results by gender, and to introduce methodological improvements such as the inclusion of standard
errors to quantify uncertainty. The database is available for public use and updates are expected
every 2-3 years as new learning data becomes available (see data availability statement). A large-
scale effort to track human capital formation using this database is the World Bank’s new Human
Capital Index.16
Of note, throughout this paper, we use the term ‘schooling’ when referring to a country’s
average years of schooling or average enrollment rates at specific schooling levels. We use the

4
term ‘learning’ when referring to the stock of basic cognitive skills, including mathematics,
reading and science, as measured by standardized tests conducted in school.
Harmonized Learning Outcomes Database The database was produced through a large-scale effort by the World Bank to identify, collect and
collate student assessment data worldwide. We include seven assessment regimes total: three
international tests, three regional standardized achievement tests, and the Early Grade Reading
Assessment (EGRA), which adds 48 countries to the database with at least one data point in the
past 10 years, including large developing economies such as Bangladesh, Nigeria and Pakistan.
Each test covers between 10 and 72 countries. By combining these assessments and making them
comparable, we cover countries which represent 98 percent of the global population. The methods
section and supplement Section II include a detailed description of the methodology we use to
develop harmonized learning measures as well as all data included in the database.
The database includes mean scores as well as standard errors for each measure, in an attempt to
quantify uncertainty. Scores are disaggregated by schooling level (primary and secondary), subject
(reading, math and science) and gender (male and female). We include year-by-year data. We do
not extend the time series prior to 2000 since data quality is low.
Several statistics demonstrate the coverage and detail of the database in the extended data.
Extended Data Figure 1 shows that the database includes 2023 country-year observations from
2000-2017. Disaggregation by gender is available for 98.5 percent observations. Latin America
and the Caribbean and Sub-Saharan Africa make up 21 percent of all available data. Supplement
Section I.A includes additional descriptive statistics.
Our methodology leverages the growth of international assessments to construct globally
comparable learning outcomes. These tests are derived from assessments conducted in the United
States since the 1960s such as the SAT and the National Assessment of Educational Progress
(NAEP). The tests are psychometrically designed, standardized assessments of cognitive skills.
Since the 1990s, international assessments have been conducted by organizations such as the
OECD. Two high profile examples are the Programme for International Student Assessment
(PISA) and the Trends in International Mathematics and Science Study (TIMSS) which covered
71 and 65 countries respectively in 2015. These assessments enable credible global comparison of

5
learning across countries and over time. However, to date most analyses of these assessments cover
few developing countries.3, 17-20
We include 164 countries, two-thirds of which are developing countries, by linking international
assessments to their regional counterparts. Regional assessments cover much of Sub-Saharan
Africa and Latin America but have often been excluded from international comparisons. We
convert a regional test score to an international test score within subjects and schooling levels
(primary and secondary) and within adjacent years. By including tests across the same testing
round and at the disaggregated schooling and subject level, this method minimizes the likelihood
that test differences are a function of time, proficiency, schooling level or data availability. We
then apply this conversion to a country that participates in a regional test but not an international
test to produce a comparable score (referred to as a Harmonized Learning Outcome (HLO) in the
database). Means are also calculated for disaggregated groups, for example by gender. The detailed
methodology is described in the methods section and in the supplement Section II.
Through construction of a cross-test conversion between international and regional assessments
we quantify the difference between them, adjust for this difference, and place learning outcomes
from regional assessments on a global scale. For a high-performance benchmark, we use the
TIMSS benchmark of 625. For the low-performance benchmark, we use 300, which is the
equivalent on the HLO scale of the minimum benchmarks on regional assessments such as LLECE
and PASEC. This approach enables us to capture performance across the distribution of both
international and regional benchmarks.
Data harmonization efforts such as the one in this paper serve the dual purpose of compiling the
best available data at a given point in time and of motivating additional data collection. Hence,
they set in motion a cycle that can continually improve learning data over time. For example, in
the most recent release of the World Bank Human Capital Index, twenty new countries participated
in learning assessments for the first time, enabling their inclusion in subsequent versions of this
database.
Schooling is not Learning We present a few descriptive trends in a first application of the database. Figure 1 shows average
learning outcomes for 164 countries from 2000-2017. Figure 1 makes the global coverage of the
database immediately apparent with regions typically excluded from international tests such as

6
PISA and TIMSS included in our database. The database covers the vast majority of Sub-Saharan
Africa, Latin America and the Caribbean, and South Asia – economies with significant potential
to close learning gaps.
A few trends emerge: advanced economies far outpace developing economies; Sub-Saharan
African lags behind all regions besides South Asia, with countries such as India performing
similarly to lower-performing Sub-Saharan African countries; within Sub-Saharan Africa, a few
countries such as Kenya and Tanzania lead, on par with many countries in Latin America; within
Latin America, a few countries such as Chile are on par with European counterparts; the Middle
East performs similarly or worse than Latin America; many Asian countries outperform North
American and European counterparts.
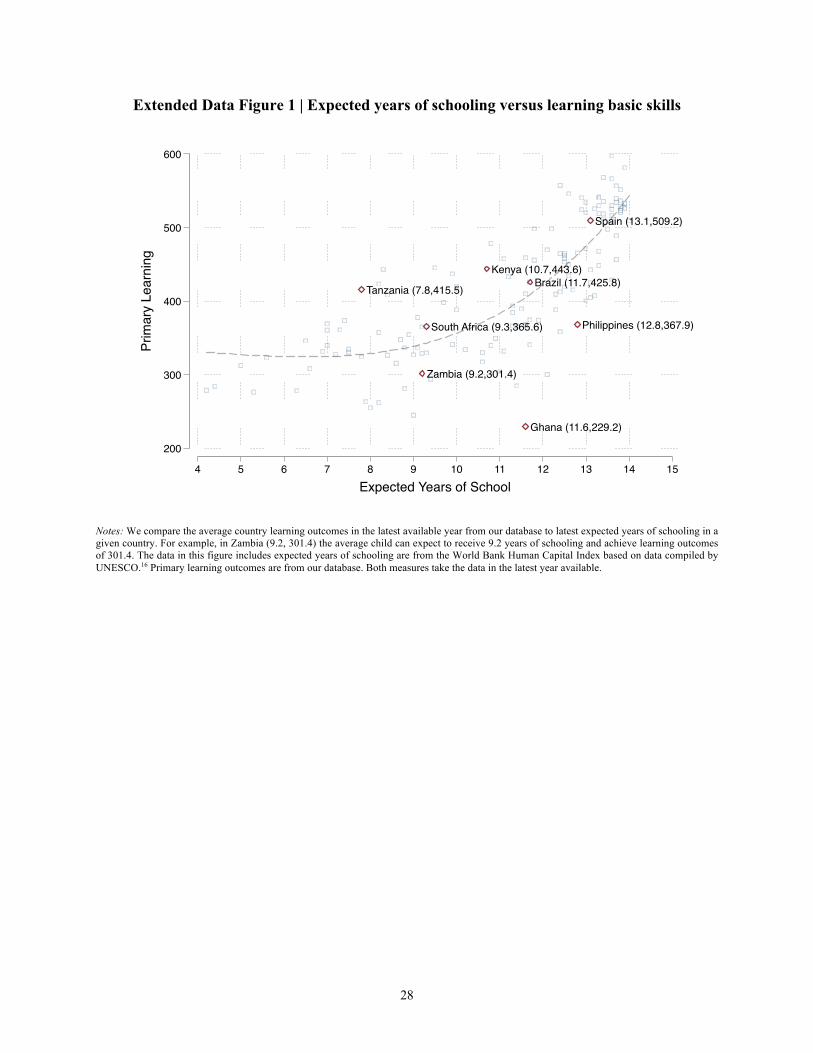
Extended Data Figure 1 shows expected years of schooling and HLO primary learning scores
for the most recent year in which data is available to contrast the quantity and quality of the
education system. The methods section includes detailed variable descriptions and trends analysis.
This graph reveals that while many developing countries have achieved substantial schooling (a
typical education system is expected to deliver 10 to 12 years of schooling), they have not yet
realized high rates of learning (advanced proficiency in international tests is centered around a
score of 625). Two examples with high schooling but low learning are Brazil and Ghana. Brazil
has 11.7 expected years of schooling, yet a learning score of just 426. Ghana has 11.6 years of
expected schooling, yet only a 229 score on learning.
We next explore the contrast between changes in schooling and changes in learning over time.
We measure schooling using adjusted enrollment ratios.20 We compare this measure of schooling
to our measure of learning in primary school for the years 2000-2015. We use data for this period
since it has the most overlap of schooling and learning measures. We restrict our comparison to
countries with data points in at least two time periods for enrollment and learning in primary school
to maximize comparability over the time period. We further condition on country-fixed effects
using multivariate regression for each region (see methods section for details). This accounts for
potential changes in the sample composition of countries with available data in each time period.
In Figure 2 we observe a clear trend towards increased schooling, while learning progress
appears in many cases limited. For example, in the Middle East and North Africa enrollment rates
achieved a high of 99 percent by 2010, increasing from 95 percent in 2000. In contrast, learning
levels stayed low and stagnant around an initial score of 380 from 2000 to 2015. It is possible that
7
in regions such as Sub-Saharan Africa (SSA), as enrollment gets substantially higher and new,
likely lower-performing students, participate in learning assessments, average scores decline due
to a selection effect. However, we observe slow learning progress even in regions where
enrollments are relatively constant and high, such as Latin America and the Caribbean (LAC),
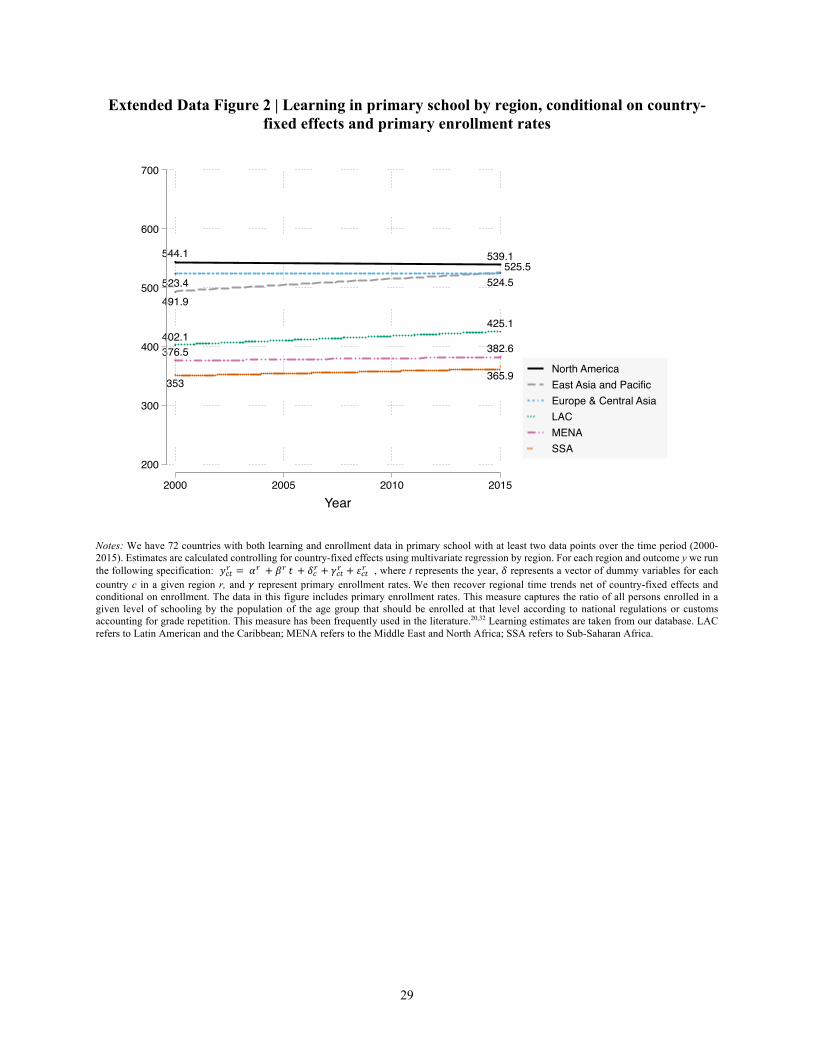
suggesting that there is more to these trends than selection. In Extended Data Figure 2 we explicitly
condition on enrollment and find nearly identical patterns. Moreover, a regression of primary
learning outcomes on primary enrollment rates using a panel of countries between 2000 and 2015
with country-fixed effects yields a negative coefficient on enrollment rates of .247 with a p-value
of .673, further showing that higher school enrollment has no statistically significant association
with better learning outcomes (see methods section for details).
One might be tempted to interpret the patterns in Figure 2 and Extended Data Figure 2 as
indicative of a plateau effect, since at higher learning levels, as in North America or Europe,
making further gains may be difficult. Yet, we also see a relatively flat line where baseline learning
levels are low, i.e., in Latin America and the Caribbean, suggesting that learning progress is slow
regardless of initial learning conditions. Data availability, in particular changing over time country
composition within each region, could in principle affect the patterns we document, but the
robustness of the patterns to the inclusion of country-fixed effects described earlier suggests that
they are not driven by country composition. Country-specific trends are also illustrated in
Extended Data Figure 3.
Altogether, the data reveal that the rapid pace at which schooling improved across education
systems, as well as the success in achieving high enrollment rates, have not been met with similarly
rapid learning progress. This pattern has been referred to in the literature and by the international
education community as ‘the learning crisis.’7,8 Using the Harmonized Learning Outcomes (HLO)
database, we demonstrate that it holds on a global scale.
Human Capital and Economic Development A large development accounting literature has studied the relative contribution of human capital
to cross-country income differences. However, the results have been inconclusive, in part due to
difficulties in measuring human capital. While direct measures of years of schooling exist, the
quality of schooling has been harder to measure.

8
Approaches to estimate the quality of schooling across countries have relied on differences in
Mincerian wage returns21,22, immigrant returns23, and cross-country skill premia.24 However, these
approaches have encountered several challenges, including the need to make assumptions about
the substitutability of skilled and unskilled workers.25 The challenges in measuring quality have
contributed to substantial variation in estimates of the role of human capital in accounting for
cross-country income differences, ranging from nearly all to potentially none.21-29
In this paper, we provide a more direct and reliable measure of the quality of schooling based
on our learning outcome data, which we use to construct measures of human capital stock (see
methods section).
Our results in Table 1 suggest that human capital accounts for between a fifth to around half of
cross-country income differences – a middle ground in a literature which ranges from zero to
nearly all. These results are consistent with models of human capital capturing the role of educated
entrepreneurs and more comprehensive measures of human capital including schooling, learning,
and health.30,31
The average relationship between learning and income masks significant heterogeneity across
countries (see Extended Data Table 2). We find that human capital explains less than two-fifths of
cross-country income differences among low-income countries, but over half among high-income
countries. We find even larger differences across regions. For example, when measured by
schooling, human capital accounts for 54 percent of cross-country income differences in advanced
economies and just 4 percent in Sub-Saharan Africa. When we include learning, this gap widens
to 86 percent in advanced economies but just 10 percent in Sub-Saharan Africa. This substantial
heterogeneity reveals the importance of including a global distribution of countries covering
multiple stages of economic development when examining the role of human capital.
Finally, we compare our measure of human capital to alternatives based on prominent global
databases such as the Penn World Tables (PWT)5, the Barro-Lee dataset32, and the United Nation’s
Human Development Index (HDI).6 In Table 2, we find that our measure of human capital has a
stronger association with growth than alternative human capital measures. This is the case in
univariate regressions that include each measure on its own (columns (1)-(4)). We observe that a
one percent change in learning is associated with a 7.2 percent change in annual growth. In
contrast, a one percent change in the other human capital measures is associated with between a
1.6 to 3.3 percent change in annual growth. We further observe that when we include all measures

9
in the same multivariate regression, the association between our measure of learning and growth
remains high, between 5.9 to 6.9 percent, and statistically significant with p-values of .01 or below,
whereas other human capital variables have a reduced and statistically insignificant association
with growth. We observe the model fit improves only slightly when all measures are included with
an R-squared of .32 relative to our measure of human capital with an R-squared of .30.
Hence, our measure of human capital appears to have a stronger relationship with economic
growth, both individually and jointly. This is likely because alternative human capital measures
rely largely on years of schooling and omit learning. However, the use of these alternative
measures remains standard practice, in part because these data have the broadest coverage. By
constructing learning data across 164 countries, we fill a key gap: broad coverage over nearly two
decades and a measure of human capital with strong links to economic development.
Discussion and Future Directions This database comes at a moment when a series of global efforts have been launched to measure
and track learning on a global scale. While recent modelling suggests the world is on track to
achieve universal primary enrollment by 2030,33 if learning continues to stagnate, this achievement
will mean little. Accordingly, the Sustainable Development Goals (SDGs) include a focus on
learning whereas the Millennium Development Goals focused largely on schooling. Another
notable effort to measure and track learning on a global scale is the World Bank’s Human Capital
Index which compares countries’ levels of human capital around the world.2 This effort aims to
report measures of human capital that will encourage countries to invest in education. The Human
Capital Index includes learning outcomes from this database as one of its core ingredients. The
database in this paper will be updated regularly and made public to enable these large-scale efforts,
and to advance our understanding of human capital formation in developing economies.
10
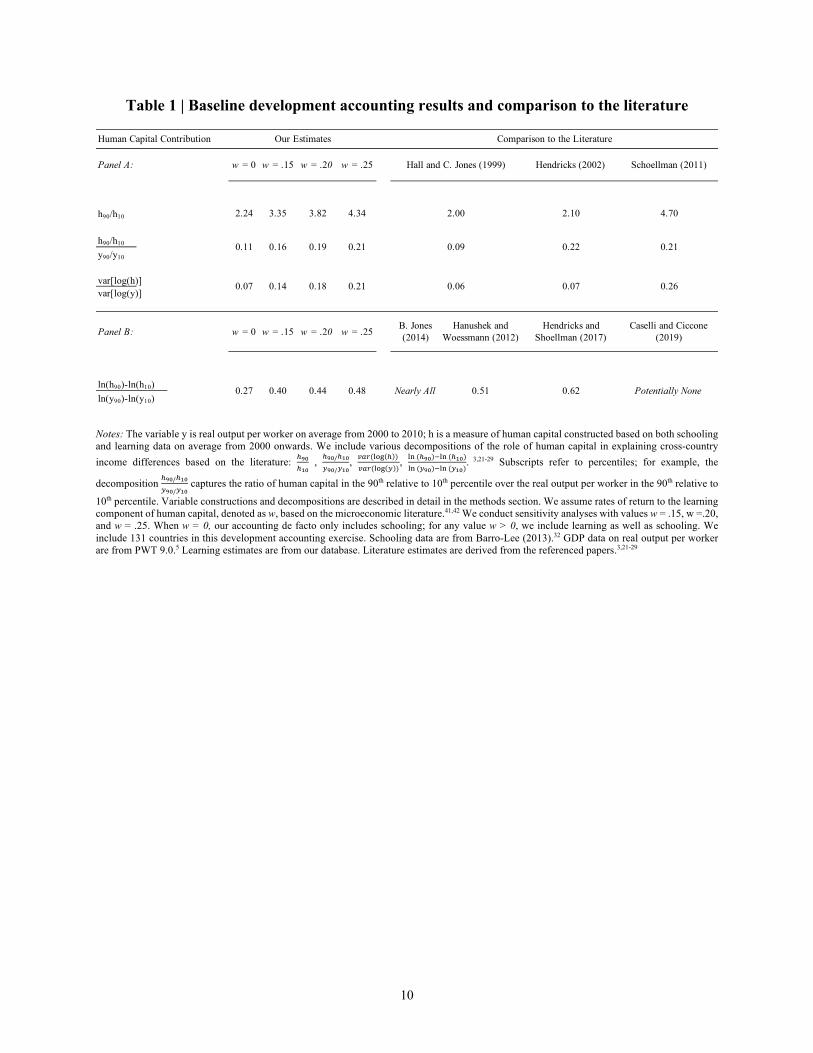
Table 1 | Baseline development accounting results and comparison to the literature
Notes: The variable y is real output per worker on average from 2000 to 2010; h is a measure of human capital constructed based on both schooling and learning data on average from 2000 onwards. We include various decompositions of the role of human capital in explaining cross-country income differences based on the literature: !!"
!#" , !!"/!#"
"!"/"#", #$%('()(!))#$%('()("))
, '+(!!")-'+(!#")'+("!")-'+("#")
. 3,21-29 Subscripts refer to percentiles; for example, the
decomposition !!"/!#""!"/"#"
captures the ratio of human capital in the 90th relative to 10th percentile over the real output per worker in the 90th relative to
10th percentile. Variable constructions and decompositions are described in detail in the methods section. We assume rates of return to the learning component of human capital, denoted as w, based on the microeconomic literature.41,42 We conduct sensitivity analyses with values w = .15, w =.20, and w = .25. When w = 0, our accounting de facto only includes schooling; for any value w > 0, we include learning as well as schooling. We include 131 countries in this development accounting exercise. Schooling data are from Barro-Lee (2013).32 GDP data on real output per worker are from PWT 9.0.5 Learning estimates are from our database. Literature estimates are derived from the referenced papers.3,21-29
Panel A: w = 0 w = .15 w = .20 w = .25 Hendricks (2002) Schoellman (2011)
h90/h10 2.24 3.35 3.82 4.34 2.10 4.70
h90/h10
y90/y10
var[log(h)]var[log(y)]
Panel B: w = 0 w = .15 w = .20 w = .25 B. Jones (2014)
Hanushek and Woessmann (2012)
Hendricks and Shoellman (2017)
Caselli and Ciccone (2019)
ln(h90)-ln(h10) ln(y90)-ln(y10)
0.19 0.21
0.14 0.18 0.21
Human Capital Contribution Our Estimates Comparison to the Literature
0.27 0.40 0.44 0.48 Nearly All 0.51 0.62 Potentially None
Hall and C. Jones (1999)
2.00
0.11
0.07
0.16 0.09 0.22 0.21
0.06 0.07 0.26

11
Table 2 | Human capital and economic growth – comparing measures
Notes: The dependent variable is the annual growth rate averaged across 2000-2010.5 Human Capital – Harmonized Learning Outcomes refers to the measure of human capital in this database averaged from 2000 onwards. Human Capital – Penn World Tables refers to the measure of human capital in the Penn World Tables 9.0.5 Human Capital - Schooling from Barro-Lee refers to estimates in 2000 which is the beginning of our sample period.32 Human Capital – Human Development Index refers to the measure of education included in the United Nation’s Human Development Index in the year 2000.6 Results include 107 countries and exclude countries in civil war, inflation crises and with rents from natural resources above 15 percent. All independent variables are transformed to log units to derive comparable elasticities. We control for the log of initial GDP per capita levels at the beginning of the period in the year 2000 in all specifications following standard practice in the growth literature. We report regression coefficients, standard errors in parentheses, and p-values in square brackets.
(1) (2) (3) (4) (5) (6) (7) (8)
Human Capital - Harmonized Learning Outcomes 0.072 0.059 0.061 0.069 0.066
(0.018) (0.023) (0.022) (0.023) (0.024)
[0.000] [0.011] [0.007] [0.003] [0.006]
Human Capital - Penn World Tables 0.033 0.012 0.019
(0.011) (0.013) (0.035)
[0.003] [0.358] [0.597]
Human Capital - Schooling from Barro-Lee 0.016 0.006 0.014
(0.006) (0.007) (0.020)
[0.004] [0.382] [0.494]
Human Capital - Human Development Index 0.020 0.002 -0.028
(0.008) (0.010) (0.022)
[0.013] [0.844] [0.194]
Control for GDP at Start of Time Period ✓ ✓ ✓ ✓ ✓ ✓ ✓ ✓Observations 107 107 107 107 107 107 107 107
R-Squared 0.300 0.261 0.255 0.240 0.306 0.305 0.301 0.318
Annual Growth Rate (2000-2010)

12
Figure 1 | Average learning (2000-2017) Notes: Learning scores are calculated from our HLO database as averages for a given country across subjects and levels over the time period 2000-2017. The numbers in the legend are the lowest and highest average HLO learning scores when averaged over the time period 2000-2017. Average scores by region are as follows: East Asia & Pacific (445), Europe & Central Asia (489), Latin America & the Caribbean (402), Middle East & North Africa (399), North America (529), Sub-Saharan Africa (342), and South Asia (335). A few trends emerge: Sub-Saharan African lags behind all regions besides South Asia, with countries such as India (368) performing on par with lower-performing Sub-Saharan African countries such as Uganda (369); within Sub-Saharan Africa, a few countries such as Kenya (444) and Tanzania (416) lead, on par with many countries in Latin America such as Mexico (435); within Latin America, a few countries such as Chile (449) lead some European counterparts such as Georgia (437); the Middle East performs similarly or worse than Latin America (as shown in summarized scores by region); many Asian countries outperform North American and European counterparts, such as Japan (553) relative to the United States (521). This map has been produced by the authors and no permissions are required for publication.
245
579No data

13
Figure 2 | Enrollment versus learning by region, conditional on country-fixed effects Notes: We have 72 countries with both learning and enrollment data in primary school with at least two data points over the time period (2000-2015). Estimates are calculated controlling for country-fixed effects using multivariate regression by region. For each region and outcome y (primary enrollment and learning) we estimate the following specification: 𝑦./% = 𝛼% + 𝛽%𝑡 + 𝛿.
% + 𝜀./% where t represents the year and 𝛿 represents a vector of dummy variables for each country c in a given region r.Based on this regression, we recover regional time trends net of country-fixed effects. The data in this figure includes primary enrollment rates. This measure captures the ratio of all persons enrolled in a given level of schooling to the population of the age group that should be enrolled at that level according to national regulations or customs accounting for grade repetition. This measure has been frequently used in the literature.17,20,32 Learning estimates are taken from our database. LAC refers to Latin American and the Caribbean; MENA refers to the Middle East and North Africa; SSA refers to Sub-Saharan Africa.
99.6
98.294.9
80
99.3
98.699
92.3
75
80
85
90
95
100
2000 2005 2010Year
North AmericaEast Asia and PacificEurope & Central AsiaLACMENASSA
Primary Enrollment Rate
542.5
503.7
523.4
404.2378.1
345.1
539527.7
524.4
425.3
380.9
361.8
200
300
400
500
600
700
2000 2005 2010 2015Year
North AmericaEast Asia and PacificEurope & Central AsiaLACMENASSA
Learning in Primary School

14
References
1. World Bank. World Development Report 2018: Learning to Realize Education’s Promise. Washington, DC, 2018.
2. World Bank. World Development Report 2019: The Changing Nature of Work. Washington, DC, 2019.
3. Hanushek, Eric A., and Ludger Woessmann. “Do Better Schools Lead to More Growth? Cognitive Skills, Economic Outcomes, and Causation.” Journal of Economic Growth 17, no.4 (2012): 267-321.
4. OECD. PISA 2015 Technical Report. OECD Publishing, 2015. 5. Feenstra, Robert C., Robert Inklaar and Marcel P. Timmer. “The Next Generation of the
Penn World Table.” American Economic Review, 105 (2015), 3150-3182. 6. United Nations Development Programme (UNDP). Human Development Report Education
Index. Retrieved from http://hdr.undp.org/en/content/education-index. 7. Smith, Adam. An Inquiry into the Nature and Causes of the Wealth of Nations (Volume One).
London: printed for W. Strahan; and T. Cadell, 1776. 8. Becker, Gary S. “Investment in human capital: A theoretical analysis.” Journal of Political
Economy 70, no. 5, Part 2 (1962): 9-49. 9. Mincer, Jacob. “Human Capital and Economic Growth.” Economics of Education Review 3,
no.3 (1984): 195-205. 10. Mankiw, N. Gregory, David Romer and David N. Weil. “A Contribution to the Empirics of
Economic Growth.” Quarterly Journal of Economics 107, no. 2 (1992): 407-437. 11. Lutz, Wolfgang, and K. C. Samir. “Global human capital: Integrating education and
population.” Science 333, no. 6042 (2011): 587-592. 12. Pritchett, Lant. The rebirth of education: Schooling ain’t learning. CGD Books, 2013. 13. UNESCO. More Than One-half of Children and Adolescents are not Learning Worldwide.
UIS Fact Sheet No. 46, 2017. 14. Krueger, Alan B. and Mikael Lindahl. “Education for Growth: Why and For Whom?” Journal
of Economic Literature 39, no.4 (2001): 1101-1136. 15. Pritchett, Lant. “Does Learning to Add Up Add Up? The Returns to Schooling in Aggregate
Data.” Handbook of the Economics of Education 1 (2006): 635-695. 16. Kraay, Aart. “The World Bank Human Capital Index: A Guide.” The World Bank Research
Observer 34, no. 1 (2019): 1-33 17. Barro, Robert J., and Jong-Wha Lee. “International data on educational attainment: updates
and implications.” Oxford Economic Papers 53, no. 3 (2001): 541-563. 18. Hanushek, Eric A. and Dennis D. Kimko. “Schooling, Labor-force Quality, and the Growth of
Nations.” American Economic Review 90, no.5 (2000): 1184-1208. 19. Altinok, Nadir, Noam Angrist, and Harry A. Patrinos. Global Dataset on Education Quality
1965-2015. World Bank Policy Research Working Paper No. 8314, 2018. 20. Lee, Jong-Wha, and Hanol Lee. “Human Capital in the Long Run.” Journal of Development
Economics 122 (2016): 147-169. 21. Hall, Robert E. and Charles I. Jones. “Why Do Some Countries Produce So Much More Output
Per Worker Than Others?” Quarterly Journal of Economics, 114, no.1 (1999): 83-116. 22. Caselli, Francesco. “Accounting for Cross-country Income Differences.” Handbook of
Economic Growth, 1 (2005), pp.679-741.

15
23. Schoellman, Todd. “Education Quality and Development Accounting.” The Review of Economic Studies 79, no. 1 (2011): 388-417.
24. Caselli, Francesco and John Coleman. “The World Technology Frontier.” American Economic Review 96.3 (2006): 499-522.
25. Jones, Benjamin F. “The Human Capital Stock: A Generalized Approach: Reply.” American Economic Review 109, no. 3 (2019): 1175-95.
26. Jones, Benjamin F. “The Human Capital Stock: A Generalized Approach.” American Economic Review 104, no.11 (2014): 3752-77.
27. Caselli, Francesco and Antonio Ciccone. “The Human Capital Stock: A Generalized Approach. Comment.” American Economic Review, 109, no. 3 (2019): 1155-74
28. Hendricks, Lutz. “How Important is Human Capital for Development? Evidence from Immigrant Earnings.” American Economic Review 92, no.1 (2002), 198-219.
29. Hendricks, Lutz. and Todd Schoellman. “Human Capital and Development Accounting: New Evidence from Wage Gains at Migration.” Quarterly Journal of Economics, 133 no. 2 (2017): 665-700.
30. Gennaioli, Nicola, Rafael La Porta, Florencio Lopez-de-Silanes, and Andrei Shleifer. “Human capital and regional development.” The Quarterly Journal of Economics 128, no.1 (2013): 105-164.
31. Campbell, Susanna G., and Murat Üngör. "Revisiting human capital and aggregate income differences." Economic Modelling (2020).
32. Barro, Robert J., and Jong Wha Lee. “A new data set of educational attainment in the world, 1950–2010.” Journal of Development Economics 104 (2013): 184-198.
33. Friedman, Joseph, Hunter York, Nicholas Graetz, Lauren Woyczynski, Joanna Whisnant, Simon I. Hay, and Emmanuela Gakidou. “Measuring and forecasting progress towards the education-related SDG targets.” Nature (2020): 1-4.
16
Methods Test score linking methodology We include 164 countries, two-thirds of which are developing countries, by linking international
assessments to their regional counterparts. Regional assessments cover much of Sub-Saharan
Africa and Latin America but have often been excluded from international comparisons. We
convert a regional test score to an international test score within subjects and schooling levels
(primary and secondary) and within adjacent years. By including tests across the same testing
round and at the disaggregated schooling and subject level, this method minimizes the likelihood
that test differences are a function of time, proficiency, schooling level, or data availability and
maximizes the likelihood that they reflect test difficulty. We then apply this conversion to a country
that participates in a regional test but not an international test to produce a comparable score
(referred to as a Harmonized Learning Outcome (HLO) in the database).
The success of the linking approach hinges on three key assumptions. First, linked tests must
capture the same underlying population. This assumption is satisfied by using sample-based
assessments representative at the national level where a country participated in both a regional and
an international assessment. This ensures that the underlying population tested is the same on
average. Second, tests should measure similar proficiencies. To this end, we link within subjects
(math, reading and science) and schooling levels (primary and secondary) to ensure overlap. Third,
the linking function should capture differences between tests rather than country-specific effects.
This assumption is the more likely to hold the larger the number of countries which participate in
a given pair of tests being linked. To maximize the likelihood that this assumption holds, we
construct the linking function over the entire interval. This step increases the sample size used to
link tests, improving the likelihood that we capture test-specific rather than country-specific
differences. In fixing the linking function, we assume that the relationship between tests stays
constant across rounds. This assumption is reasonable since the mid-1990s when assessments
started to use a standardized approach and to link testing rounds with overlapping test items. A
related advantage of a linking function over a fixed interval is that it guarantees that any changes
in test scores over this interval are due to realized progress in learning rather than changing linking
functions between tests. Of note, every update of the database increases the number of countries

17
participating in a given pair of assessments. Thus, each update expands coverage and enhances the
reliability of all estimates by enabling construction of a more robust linking procedure.
We use multiple methods to link regional to international assessments. Our primary approach
uses regression when multiple countries participate in assessments being compared. When only
one country participates, we use linear linking. Supplement Section II.A describes both methods
and the respective tests used. Both methods adjust test scores by a constant as well as relative
standard deviations across tests. These approaches build on a literature comparing scores across
different tests34 as well as more recent work linking aggregate level scores across states in the
United States.35 In the supplement Section II.B we conduct a series of sensitivity tests, including
conducting the conversion using country-fixed effects or random draws of countries and time
periods. We further explore additional methods in supplement Section II.B, such as mean linking
and ratio conversions, highlighting the tradeoffs of each approach and examining robustness across
them. We find a .99 or higher correlation coefficient for scores and relative ranks across all
robustness tests (see Supplement Figure 7). Supplement Section II.C review limitations.
Supplement Section II.D includes detailed descriptions of all data sources. Supplement Section
II.E describes additional methodological parameters, such as disaggregation of the data.
We compare our data to a smaller database using Item Response Theory (IRT) where tests share
common test items and find a .98 correlation coefficient, shown in Extended Data Figure 4. IRT,
considered one of the most reliable methods to link tests in the psychometric literature, models the
probability a given pupil answers a given test item correctly as a function of pupil and item-specific
characteristics.34,36,37 This methodology is used to construct the underlying tests we use. However,
to use it to compare learning across assessments we need enough overlap in the underlying test
items across assessments. But such overlap does not exist for a large enough set of tests and time
periods needed to create a globally comparable panel data set.38,39 For example, TIMSS 1995 and
SACMEQ 2000 included overlapping math items, but had only 3 test questions that would allow
a comparison. When this overlap is small, standard maximum likelihood estimates will reflect both
true variance and measurement error, overstating the variance in the test score distribution. Das
and Zajonc (2010)38 elaborate on the various challenges of estimating IRT parameters with limited
item-specific overlap. While IRT might not be a reliable approach when there is limited item-by-
item overlap, we conduct comparisons where overlap is larger, with up to 17 common test items
across tests. We compare our results to the Linking International Comparative Student Assessment
18
(LINCS) project which uses IRT methods and has overlap in items for a subset of international
studies focused on reading at primary school.39
Extended Data Figure 4 compares average scores for the same subject (reading), schooling level
(primary) and time period (2000-2010), with a correlation coefficient of .984. This comparison
indicates that even as we expand coverage to 164 countries in our database, we maintain high
consistency with alternative measures for the subset of proficiencies, school levels and subjects
where there is overlap.
Of note, the assessments included in this database are conducted at school. Testing, and hence
learning, data might be affected by enrollment patterns, and we advise users of the data to analyze
learning outcomes alongside enrollment trends. For example, average test scores might be driven
by lower-performing students entering the system rather than learning progress for those who were
already in school. While this is a potential concern when analyzing average scores, there are
several reasons why harmonized learning outcomes are still useful. First, primary enrollment rates
are relatively high in all countries, reaching 90 percent on average. Second, learning measured
with school-based tests is likely to yield a conservative upper bound of learning in a given country.
Since most countries at the bottom of the distribution of measured learning are also those with
relatively low enrollments, it is unlikely new school entrants would alter conclusions related to
cross-country patterns – the lowest preforming countries would likely be revealed to be even worse
performing.
Comparison of trends in schooling and learning
Extended Data Figure 1 – Expected Years of Schooling versus Learning Basic Skills. We define
two key variables for analysis in this figure. First, we define our learning variable. Our measure of
quality is the primary HLO scores, which measure the degree to which students acquire basic skills
in primary school. Second, we define the schooling variable. The expected years of schooling
measure is constructed by UNESCO and is a function of enrollment patterns and the number of
years of schooling a given country formally provides. This measure is often interpreted by the
international education community as a measure of a strong education system in which students
attend many years of school. Since expected years of schooling are partially a function of
enrollment, which we also use as a measure of schooling at times in this paper, these two measures
19
are highly correlated. For countries with data available for both measures, we find an average
correlation coefficient of .72 across them.
Extended Data Figure 1 reveals high variance in learning conditional on years of schooling.
Ghana stands out as a country where schooling is close to 12, yet the learning score is below the
threshold of minimum proficiency of 300. Next, consider the examples of Zambia and South
Africa. In Zambia, the average child is expected to have more than 9 years of schooling yet
achieves a 301 score on primary school learning. In contrast, in South Africa, with similar years
of expected schooling, the average child scores 366. Given that both countries have more than 9
years of expected schooling, the primary school learning scores are unlikely to be driven by
selection. Relatedly, average primary enrollment rates over the 2000 to 2015 time period are high
in both countries, at 98.2 percent in South Africa, and at 92.9 percent in Zambia. Since learning
outcomes are measured using tests taken in grades 4 through 6, primary school enrollment rates
are the relevant measures for schooling comparisons. Typically, large dropouts occur between
schooling levels, such as the transition from primary to secondary school. However, enrollment up
to the last grade within primary school is persistently high. For example, in South Africa, data
from the World Bank show that 90 percent of students are retained until the end of primary school.
This varies across contexts, but in many countries enrollment rates in primary school are relatively
stable through the middle years of primary school when achievement tests are taken.
We further observe an exponential shape of the line of best fit, with a smaller correlation
coefficient between schooling and learning for countries which provide 10 or fewer years of
schooling on average than after this threshold (with a correlation coefficient of .35 relative to .73,
respectively). The exponential curve is suggestive and should be viewed with a few caveats in
mind. For example, it is conceivable that Brazil has higher learning scores than South Africa, not
because the quality of education in Brazil is higher, but because of lower enrollments, which means
that higher-ability students remain in the system at the time of the test. However, this is unlikely
since Brazil has around 12 years of expected schooling and South Africa has around 9, meaning
that most children progress through primary school and thus their primary school learning scores
largely reflect the quality of education rather than selection. The selection concern may be more
pronounced at low levels of expected schooling. Even so, the flat part of the curve between 7 and
10 years of expected schooling is unlikely to reflect selection, given that learning is measured
through tests in primary school, and primary school enrollment in countries with expected
20
schooling of 7 and above, is typically high. Moreover, the fact that for a given point on the x-axis,
learning levels vary substantially reveals substantial heterogeneity in school quality even in
systems where the average student receives a similar number of years of education. These patterns
suggest that schooling does not automatically translate to learning.
Regional Learning and Enrollment Trends
The following section refers to methods used to compare trends in enrollment and learning over
time. We restrict our comparison to countries with data points in at least two time periods for both
enrollment and learning data in primary school to maximize comparability over the time period.
The list of 72 countries included in the following analyses include (by 3-digit ISO country code):
CAN, CHL, CIV, CMR, COL, CRI, CYP, CZE, DEU, DNK, DOM, ECU, ESP, FIN, FRA, GMB,
GTM, HKG, HND, HTI, HUN, IDN, IRL, IRN, ISL, ITA, JOR, JPN, KEN, KOR, KWT, LBR,
LSO, MAR, MEX, MLT, MOZ, MUS, MWI, NER, NIC, NLD, NOR, NZL, PAN, PER, PHL,
POL, PRT, PRY, ROU, RUS, SEN, SWE, SWZ, TGO, TTO, TUN, TUR, TWN, UGA, URY,
USA, ZAF, ZMB, ZWE. We average the HLO data into 5-year intervals to be analogous in
structure to the primary enrollment data from Lee and Lee (2016).20 Since our learning data extends
to 2015 and enrollment data extends to 2010, we make a conservative assumption that enrollment
rates persist through 2015 to enable inclusion of all learning data.
Figure 2 – Regional Learning and Enrollment Trends Conditional on County-Fixed Effects. In
Figure 2, estimates are calculated controlling for country-fixed effects using multivariate
regression by region. For each region and outcome y (primary enrollment and learning) we
estimate the following specification: 𝑦!"# =𝛼# + 𝛽#𝑡 + 𝛿!# + 𝜀!"# where t represents the year and
𝛿 represents a vector of dummy variables for each country c in a given region r.Based on this
regression, we recover regional time trends net of country-fixed effects.
Extended Data Figure 2 – Regional Learning Trends Conditional on County-Fixed Effects and
Enrollment. In Extended Data Figure 2 we further explicitly condition for enrollment effects and
find nearly identical patterns to Figure 2. For each region and outcome y we run the following
specification: 𝑦!"# =𝛼# + 𝛽#𝑡 + 𝛿!# + 𝛾!"# + 𝜀!"# , where t represents the year, 𝛿 represents a
21
vector of dummy variables for each country c in a given region r, and 𝛾 represent primary
enrollment rates.We then recover regional time trends net of country-fixed effects and
conditional on enrollment.
Enrollment and Learning Regression. We run the following regression: 𝑦!" = 𝛼 + 𝛽𝛾!" + 𝛿! +
𝜀!" where c represents a country, t represents a year, 𝛾 represents primary enrollment rates, and 𝛿
represents a vector of dummy variables for each country c. The coefficient of interest
is 𝛽capturing the association between learning and enrollment. As noted in the main text, we find
no statistically significant relationship between schooling and learning with a negative coefficient
on enrollment rates of .247 with a p-value of .673, reinforcing pattens shown in Figures 2 and
Extended Data Figure 2. We also find an R-squared of .96. We omit four countries (Mozambique,
Niger, Cameroon, and Benin) who are outliers above the 95th percentile in enrollment changes
which can bias average cross-country trends. Another way to visualize the absence of an
association between learning and enrollment is a scatter plot of learning and enrollment trends over
time by country. This plot is provided in Supplement Figure 4.
Extended Data Figure 3 – Learning by Country. We illustrate regional patterns by focusing on a
few specific examples from Latin and Central America, Sub-Saharan Africa, and the Middle East
(Brazil, Colombia, Mexico, Uganda, and Kuwait). The figure shows that learning in all these
countries has been consistently low and improved slowly over the past two decades, ranging from
360 to 453, which translates into many students not acquiring basic skills such as being able to
read a simple story, even though all these countries have achieved high enrollment rates above 99
percent in all years. Moreover, in each of the former country examples, since primary enrollment
rates are extremely high and flat, this reinforces that slow learning trends are not a function of
enrollment. Figures 2 and Extended Data Figure 2, that control for country fixed effects, can be
thought of as the generalizations of these patterns to the regional level.

22
Development Accounting
A development accounting literature studies the contribution of human capital to cross-country
income differences. We follow the literature22,40 and begin with a standard aggregate production
function in its per-capita form:
𝑦 = 𝐴ℎ .%&/
!"#!
where y represents output per worker, k denotes the capital-labor ratio, h denotes the level of human
capital per capita, and A captures the residual, typically interpreted as Total Factor Productivity
(TFP). Taking the log on both sides decomposes cross-country income differences into three
sources: capital-output ratio, average human capital, and TFP. Below, we only report the share of
income differences that can be explained by variation in human capital, given that human capital
is the focus of this paper. In Table 1 Panel A, we show decompositions that have used both human
capital measures incorporating education quality and human capital measures capturing only
education quantity.21,23,28 In Table 1 Panel B we include an additional decomposition, '((*$%),'((*"%)'((&$%),'((&"%)
which has been used by a literature that has used human capital measures that
account for quality.3,26,27,29
To measure human capital, we extend the standard Mincer specification that weights education
by its micro labor market returns to include learning in addition to schooling:
(5) ℎ = 𝑒#-./0
where S is the quantity of schooling, L is a measure of learning, and r and w are their respective
returns. For years of schooling, we use Barro-Lee (2013) data.32 For learning measures, we use the
data presented in this paper. We assume rates of return based on the microeconomic literature. We
take the value r = .10 for the rate of return per school year, and w = .20 per standard deviation
increase in learning, based on parameter values used in the literature.41,42 The .20 value is based
on U.S. data. However, we might expect that returns to learning will be higher in developing
countries where the supply of skills is lower, as is the case with the returns to schooling literature.
23
Significant work has been done to identify these parameters. For the purpose of this paper, our
intention is not to provide definitive results, but rather to motivate the use of the data in the
development accounting literature. To this end, we take parameter values as given and conduct
sensitivity analyses with values w = .15 and w = .25. We include 131 countries which have both
Barro-Lee data and learning data.
Panel A in Table 1 shows our results in comparison to Hall and C. Jones (1999)21, Hendricks
(2002)28, and Schoellman (2011).23 We find in our estimates that when the human capital measure
only captures quantity (w = 0) human capital accounts for roughly 7-11 percent of output per
worker differences. However, when we include measures of quality (w > 0), we find that this
contribution goes up to 14–21 percent. These results suggest that measuring human capital taking
into account quality substantially increases the role of human capital in explaining cross-country
output per worker differences. These results are consistent with the literature showing that when
quality is taken into account, such as in Schoellman (2011),23 the role of human capital in
explaining cross-country output per worker differences doubles relative to when only quantity is
taken into account as in Hall and C. Jones (1999).21
In Panel B in Table 1, we show results focusing on '((*$%),'((*"%)'((&$%),'((&"%)
. The literature26,27,29 that has
used this decomposition estimates the contribution of human capital to cross-country income
differences to be from nearly 100 percent to close to zero. We find that when we include our
measure of quality, the share of human capital varies between 40 and 48 percent.
24
Methods References 34. Kolen, Michael J., and Robert L. Brennan. Nonequivalent groups: Linear methods. Test
equating, scaling, and linking. (2014): 103-142. 35. Reardon, Sean F., Demetra Kalogrides, and Andrew D. Ho. “Validation methods for
aggregate-level test scale linking: A case study mapping school district test score distributions to a common scale.” Journal of Educational and Behavioral Statistics (2019).
36. Mislevy, Robert J., Albert E. Beaton, Bruce Kaplan and Kathleen M. Sheehan. “Estimating Population Characteristics from Sparse Matrix Samples of Item Responses.” Journal of Educational Measurement 29, no.2 (1992): 133-161.
37. Holland, Paul W. and Neil J. Dorans. “Linking and Equating.” Educational Measurement 4 (2006): 187-220.
38. Das, Jishnu and Tristan Zajonc. “India Shining and Bharat Drowning: Comparing Two Indian States to the Worldwide Distribution in Mathematics Achievement.” Journal of Development Economics 92, no.2 (2010): 175–187
39. Steinmann, Isa, Rolf Strietholt and Wilfried Bos. Linking International Comparative Student Assessment. LINCS Technical Report, 2014.
40. Klenow, Peter J., and Andres Rodriquez-Clare. The neoclassical revival in growth economics: has it gone too far?” NBER Macroeconomics Annual, MIT Press, Cambridge, MA (1997): 83–103.
41. Psacharopoulos. George and Harry Anthony Patrinos. “Returns to investment in education: a decennial review of the global literature.” Education Economics 26, no. 5 (2018): 445-458.
42. Hanushek, Eric A., and Lei Zhang. “Quality-consistent estimates of international schooling and skill gradients.” Journal of Human Capital 3, no. 2 (2009): 107-143.

25
Data Availability The data will be made available for public use and updated regularly on the World Bank microdata catalog: https://microdata.worldbank.org. The database is expected to be updated every 2-3 years as new learning data becomes available. The database will be updated at the same location on the microdata World Bank website using the methodology and approach in this paper, with accompanying technical notes on additional countries and data sources added. This study used a combination of data sources, including data that are available from online repositories and required straightforward registration and usage agreement. We also collected data from over 48 countries directly in collaboration with the World Bank and USAID. All maps presented in this study have been produced by the authors and no permissions are required for publication. Code Availability The code used to compile and analyze data was written in Stata version 15.1. The code to replicate analysis and tables will be made publicly available on github: https://github.com/measuringhumancapital Acknowledgments We thank the referees and editors for revisions which improved the paper. We are grateful to Syedah Aroob Iqbal and Husein Abdul-Hamid for research support. This work builds on co-authored work with Nadir Altinok. Particular thanks to Aart Kraay for detailed comments and contributions to the methodology. Valuable comments were provided by Eva L. Baker, Felipe Barrera-Osorio, Eduardo Cascallar, Paul Collier, Stefan Dercon, Deon Filmer, Roberta Gatti, Rachel Glennerster, Daniel Koretz, Julien Labonne, Silvia Montoya, George Psacharopoulos, Simon Quinn, Heiner Rindermann, Halsey Rogers, Jaime Saavedra, Shwetlena Sabarwal, and Eduardo Velez. This paper benefited from seminars held at the World Bank, World Congress of Cliometrics, American Economic Association, IDB, Oxford, USAID and FHI360. A great number of individuals and organizations supplied us with data. A special thanks to Rebecca Rhodes for access to the microdata for many EGRA learning assessments. Author Contributions HP oversaw data collection efforts and conceived the study. NA assembled the data, conducted the analysis and wrote the drafts of the manuscripts. NA, SD, PG, and HP provided substantial intellectual inputs and edited drafts of the manuscripts. The views expressed here are those of the authors and should not be attributed to the World Bank. Competing Interests The authors declare no competing financial or non-financial interests.

26
Extended Data Table 1 | Country-year observations by disaggregation and region
Notes: This table presents counts of country-year observations by region and disaggregation (schooling level and subject). The database includes 2023 observations across all countries from 2000-2017.
Total By Gender Math Reading Science Primary SecondaryEast Asia & Pacific 333 331 116 100 116 99 234Europe & Central Asia 951 951 326 299 326 255 696Latin America & Caribbean 247 247 83 88 76 111 136Middle East & North Africa 257 257 99 60 98 90 167North America 56 56 19 18 19 17 39South Asia 11 9 2 8 1 7 4Sub-Saharan Africa 168 142 52 104 12 145 23Total 2023 1993 697 677 648 724 1299

27
Extended Data Table 2 | Human capital share by income status and region
Notes: The variable y is real output per worker on average from 2000 to 2010; h is a measure of human capital constructed based on both schooling and learning estimates on average from 2000 onwards. We include the following decomposition of the role of human capital in explaining cross-country income differences based on the literature21-29: #$%('()(!))
#$%('()(")). Variable constructions and decompositions are described in detail in the methods
section. We assume rates of return to the learning component of human capital, defined as w, based on the microeconomic literature.41,42 We conduct sensitivity analyses with values w = .15, w =.20, and w = .25. When w = 0, our accounting de facto only includes schooling; for any value w > 0, we include learning as well as schooling. We include 131 countries in this development accounting exercise. Schooling data are from Barro-Lee (2013).32 GDP data on real out per worker are from PWT 9.0.5 Learning estimates are from our database.
Schooling
w = 0 w = .15 w = .20 w = .25
Human Capital Contribution
High income 0.19 0.36 0.44 0.53Upper middle income 0.25 0.39 0.46 0.54Lower middle income 0.14 0.23 0.27 0.33Low income 0.13 0.25 0.30 0.35
Advanced Economies 0.54 0.72 0.79 0.86East Asia and the Pacific 0.04 0.09 0.11 0.13Europe and Central Asia 0.02 0.06 0.09 0.11Latin America and the Caribbean 0.10 0.14 0.16 0.18Middle East and North Africa 0.10 0.21 0.25 0.30South Asia 0.15 0.24 0.28 0.32Sub-Saharan Africa 0.04 0.07 0.08 0.10
Schooling and Learning
28
Extended Data Figure 1 | Expected years of schooling versus learning basic skills
Notes: We compare the average country learning outcomes in the latest available year from our database to latest expected years of schooling in a given country. For example, in Zambia (9.2, 301.4) the average child can expect to receive 9.2 years of schooling and achieve learning outcomes of 301.4. The data in this figure includes expected years of schooling are from the World Bank Human Capital Index based on data compiled by UNESCO.16 Primary learning outcomes are from our database. Both measures take the data in the latest year available.
Brazil (11.7,425.8)
Spain (13.1,509.2)
Ghana (11.6,229.2)
Kenya (10.7,443.6)
Philippines (12.8,367.9)
Tanzania (7.8,415.5)
South Africa (9.3,365.6)
Zambia (9.2,301.4)
200
300
400
500
600Pr
imar
y Le
arni
ng
4 5 6 7 8 9 10 11 12 13 14 15Expected Years of School
29
Extended Data Figure 2 | Learning in primary school by region, conditional on country-fixed effects and primary enrollment rates
Notes: We have 72 countries with both learning and enrollment data in primary school with at least two data points over the time period (2000-2015). Estimates are calculated controlling for country-fixed effects using multivariate regression by region. For each region and outcome y we run the following specification: 𝑦./% = 𝛼% + 𝛽%𝑡 + 𝛿.
% + 𝛾./% + 𝜀./% , where t represents the year, 𝛿 represents a vector of dummy variables for each country c in a given region r, and 𝛾 represent primary enrollment rates.We then recover regional time trends net of country-fixed effects and conditional on enrollment. The data in this figure includes primary enrollment rates. This measure captures the ratio of all persons enrolled in a given level of schooling by the population of the age group that should be enrolled at that level according to national regulations or customs accounting for grade repetition. This measure has been frequently used in the literature.20,32 Learning estimates are taken from our database. LAC refers to Latin American and the Caribbean; MENA refers to the Middle East and North Africa; SSA refers to Sub-Saharan Africa.
544.1
491.9523.4
402.1376.5
353
539.1525.5
524.5
425.1
382.6
365.9
200
300
400
500
600
700
2000 2005 2010 2015Year
North AmericaEast Asia and PacificEurope & Central AsiaLACMENASSA

30
Extended Data Figure 3 | Learning by country
Notes: Learning estimates are derived from our database and are plotted using a linear fit for the available data over the time series. Data on learning is available across the time period for Uganda from the source test the Southern African Consortium, for Monitoring Education Quality (SACMEQ). For Kuwait, data are from PIRLS and TIMSS. Data is available Brazil, Mexico and Colombia from The Laboratorio Latinoamericano de Evaluación de la Calidad de la Educación (Latin-American Laboratory for Assessment of the Quality of Education or LLECE) as well as PIRLS for Colombia. Primary enrollment rates data is from Lee and Lee (2016).20
99.4
100.0100.0
50
55
60
65
70
75
80
85
90
95
100
2000 2002 2004 2006 2008 2010Year
MexicoColombiaBrazilUgandaKuwait
Primary Enrollment Rate
422.4
365.9
396.5
453.1435429
390.9
361.2
200
300
400
500
600
2000 2005 2010 2015Year
MexicoColombiaBrazilUgandaKuwait
Learning in Primary School

31
Extended Data Figure 4 | Comparison of Harmonized Learning Outcomes (HLO) to Item Response Theory (IRT)
Notes: We compare average scores per country from our learning data for primary school from 2000-2010 to the Linking International Comparative Student Assessment (LINCS) project which uses Item-Response Theory (IRT) methods to link test score data. IRT methods are used to create scores for the underlying international and regional assessments used. The LINCS project produces scores on a globally comparable scale for primary school scores (Steinmann, Strietholt, and Bos 2014).39
350
400
450
500
550
365
IRT
Scor
e
350 400 450 500 550HLO Score
Correlation 0.984

![Outline Human capital theory by C. Echevarriahomepage.usask.ca/~ece220/econ221/4-HC [Compatibility Mode].pdf · Human capital theory by C. Echevarria ... Human capital Human capital](https://img.pdfslide.us/doc/110x75/5ae0d5467f8b9a6e5c8df29c/outline-human-capital-theory-by-c-ece220econ2214-hc-compatibility-modepdfhuman.jpg)