Embed Size (px)
Citation preview

Advance Access publication December 3, 2009 Political Analysis (2010) 18:1–35doi:10.1093/pan/mpp034
A Bayesian Hierarchical Topic Model for PoliticalTexts: Measuring Expressed Agendas in Senate Press
Releases
Justin Grimmer
Department of Government, Harvard University, 1737 Cambridge Street,
Cambridge, MA 02138
e-mail: [email protected] (corresponding author)
Political scientists lack methods to efficiently measure the priorities political actors
emphasize in statements. To address this limitation, I introduce a statistical model that
attends to the structure of political rhetoric when measuring expressed priorities: statements
are naturally organized by author. The expressed agenda model exploits this structure to
simultaneously estimate the topics in the texts, as well as the attention political actors
allocate to the estimated topics. I apply the method to a collection of over 24,000 press
releases from senators from 2007, which I demonstrate is an ideal medium to measure how
senators explain their work in Washington to constituents. A set of examples validates the
estimated priorities and demonstrates their usefulness for testing theories of how members
of Congress communicate with constituents. The statistical model and its extensions will be
made available in a forthcoming free software package for the R computing language.
1 Introduction
I introduce a statistical model to measure the priorities political actors articulate in texts,which I apply to measure how legislators explain their work to constituents. The expressedagenda model incorporates information about the authors of texts and other covariates tocreate a method explicitly designed to measure how legislators articulate priorities to con-stituents. A Bayesian approach, coupled with the use of a deterministic method for esti-mating complex posteriors, makes estimation and inference straightforward, as well asinference about quantities of interest derived from the priorities. I apply the model toan original collection of over 24,000 Senate press releases, collected from each Senateoffice in 2007, demonstrating that the press release data and statistical model facilitatecomprehensive tests of theories about how legislators communicate with their constituents.
Members of Congress invest substantial resources to communicate with constituents,issuing thousands of statements, press releases, and speeches during each legislative term.
Author’s note: I thank the Center for American Political Studies and the Institute for Quantitative Social Sciencefor financial support. I have benefited from conversations with Ken Benoit, Matt Blackwell, Daniel Carpenter,Jacqueline Chattopadhyay, Andrew Coe, Brian Feinstein, Rob Franzese, Claudine Gay, Jeff Gill, David Hadley,Frank Howland, Emily Hickey, D. Sunshine Hillygus, Daniel Hopkins, Michael Kellerman, Gary King, BurtMonroe, Clayton Nall, Stephen Purpura, Kevin Quinn, Brandon Stewart, seminar participants at HarvardUniversity, participants at the 2008 Summer Political Methodology meeting, and 2009 Southern Political ScienceAssociation meeting.
� The Author 2009. Published by Oxford University Press on behalf of the Society for Political Methodology.All rights reserved. For Permissions, please email: [email protected]
1

In spite of the recognized importance of this communication to understanding politicalrepresentation and legislative behavior (Mayhew 1974; Fenno 1978), political scientistsknow surprisingly little about the content of these statements and how legislators translatetheir activities in Washington into statements to constituents. This is due, in large part, tothe difficultly in collecting and analyzing the multitude of statements from members ofCongress. Most studies of congressional communication employ methods that are too ex-pensive and time consuming to apply to each member of Congress or even large samples ofmembers (Fenno 1978; Lipinski 2004). As a result, much of our knowledge about howlegislators explain their work to constituents is derived from observations made abouta few members of Congress and a small subset of statements made to constituents.
As an alternative to manual coding, political scientists have recently turned to unsuper-vised learning methods to analyze attention in large text corpora: methods that simulta-neously estimate the categories in a collection of texts and sorts documents into theestimated categories (Quinn et al. forthcoming).1
These methods, however, cannot be directly applied to measure the priorities articulatedby representatives. When analyzing the attention senators (or other political actors) ded-icate to issues there is a hierarchical structure: political statements, at the bottom of thehierarchy, are organized according to their author, at the top of the hierarchy. Previouslydeveloped unsupervised learning methods ignore this hierarchy and instead focus uponassigning documents to topics (Banerjee et al. 2005) or introduce structure designed toanswer a different (but still important) question about how attention varies over time inthe whole legislature (Quinn et al. forthcoming).
I accommodate the hierarchical structure when measuring author attention with theexpressed agenda model. The method simultaneously discovers the topics in the data,assigns documents to their likely topic, and measures the attention a set of authors dedicateto the estimated topics. Like other unsupervised learning methods, the expressed agendamodel does not require any pre-read documents, estimating the topics in the press releases.The use of Bayesian inference and a recently developed approach to estimation of complexposteriors, variational inference, makes fully Bayesian inference straightforward, whereasprevious statistical models for political text assume that all estimates are known with cer-tainty (Quinn et al. forthcoming). Using the new data set and statistical model, I demon-strate that the expressed agenda model is able to identify substantively important topics. Aseries of validations also demonstrates that the expressed agenda model provides substan-tively interesting estimates of senators expressed priorities and facilitates tests of importanthypotheses across all members of a legislature—a previously infeasible task.
2 Expressed Agendas in Legislatures and Politics
By measuring how legislators explain their work in Washington to constituents, the modeland data set provide powerful tools for understanding how political representation operatesin America.
Legislators employ the resources of their office to portray how they are responding tothe priorities and concerns of their constituents (and to distract attention from areas where
1There is a burgeoning literature that analyzes communication with supervised methods (Hopkins and King forth-coming; Hillard, Purpura, and Wilkerson 2008). Supervised methods provide hand-coded documents and pre-defined categories to a method in order to teach—supervise—the method how to place documents into categories.This approach is not employed here because there is still substantial uncertainty about the topics legislators couldraise in conversation with constituents.
2 Justin Grimmer

they appear less responsive) (Mayhew 1974; Fenno 1978; Kingdon 1989; Arnold 1992).Understanding the contents of these portrayals are critical to understanding home style andare inherently important to explaining how legislators maintain their connection with con-stituents (Fenno 1978; Kingdon 1989; Arnold 1992; Sulkin 2005), assessing deliberativestandards of democracy (Gutmann and Thompson 1996;Mansbridge 2003), identifying thecauses of the incumbency advantage (Gelman and King 1990), determining how legislatorsclaim credit for resources secured for their state (Mayhew 1974), and understanding howlegislators interact with the media (Arnold 2004). The importance of understanding legis-lators’ statements to constituents is most clearly articulated by Fenno when he remarks‘‘empirical theories of representation will always be incomplete without theories thatexplain explaining’’ (Fenno 1978, 162).
In this paper, I address a critical component of home style (Fenno 1978): the issueslegislators’ emphasize in communication with constituents. This quantity is of theoreticalinterest for studies of Congressional communication, ranging from qualitative studies ofexplanation (Mayhew 1974; Fenno 1978) to quantitative studies of senators’ communi-cated issue priorities (Schiller 2000; Sulkin 2005). Although the expressed priorities oflegislators (and other political actors) appear in numerous studies, it lacks a common nameacross applications. Therefore, I call the attention a senator allocates to issues in publicstatements her expressed agenda. It is an agenda because it measures the priorities of eachsenator, as articulated in press releases. Importantly, it is an expressed agenda because theattention dedicated to issues in communication are the issues that senators express as theirpriorities, not necessarily those issues that receive the most attention from senators while inWashington or from their staff. (But as I demonstrate, a senator’s expressed agenda isclosely tied to other indicators of legislative activity.)
2.1 Substantive Structure and Unsupervised Learning Methods
While intended to measure the priorities legislators and other political actors express inpublic statements, the expressed agenda model is also a new model for document cluster-ing. A large literature in statistics and computer science advocate using clustering methodsas an effective method for grouping together documents of similar content (Ng, Jordan, andWeiss 2002; Blei et al. 2003; Quinn et al. forthcoming; Manning et al. 2008). Althougheach method has performed well on a subset of problems, it is well known that the optimalapplication of any clustering method requires that the method be tuned to a particular sub-stantive problem. The need for problem-specific methods arises because classification isonly possible by making assumptions (a result known as the ‘‘ugly duckling theorem’’[Watanabe 1969]) and because all clustering methods have the same average performanceacross all possible problems (a no-free lunch theorem [Wolpert and Macready 1997]).Therefore, arguments about whether to adopt a statistical or algorithmic approach to clus-tering are misplaced: the debate should focus on whether a specific class of clusteringmethods are well tuned to discover substantively interesting clusters from a particularcollection of documents.
One approach to developing problem-specific clustering methods is to construct a hierar-chical model, where the hierarchy includes additional information about each of the docu-ments (Blei et al. 2003; Blei and Lafferty 2006; Teh et al. 2006; Mimno and McCallum2008).2 A particularly novel example of this approach is advanced in Quinn et al.
2Note, that this is distinct from hierarchical clustering, which creates a dendrogram describing a series of partitionsin the data that obey some organizing rule (Hastie, Tibshirani, and Friedman 2001).
3A Bayesian Hierarchical Topic Model for Political Texts
(forthcoming), which analyzes Senate floor-speeches and includes information about theday a speech was made on the Senate floor. This method is therefore tuned to measurehow attention varies over time in the entire legislature. But this hierarchical structure isill-suited for the quantity of interest in this paper: how attention to issues varies across legis-lators, because it ignores the authors of particular documents.
The expressed agenda model explicitly includes information about the author of thedocuments and therefore is designed to address the priorities legislators articulate to con-stituents. Figure 1 shows the general structure that underlies the model: many statementsfrom each author, with several authors in the collection. While applied to study legislativehome style in press releases here, this same structure is employed anytime the quantities ofinterest are the priorities a set of actors allocate to issues and therefore the expressedagenda model has wide range of applications in political science. This includes examina-tions of issue ownership in political campaigns, where the interest is in comparing theissues Democrat and Republican candidates emphasize during campaigns (Petrocik1996; Simon 2002; Sigelman and Buell 2004). Likewise, scholars of the news mediaask which stories are afforded attention in different newspapers (Armstrong et al.2006). Scholars of the presidency are often interested in the priorities presidents commu-nicate in their public statements (Lee 2008), and deliberative democrats are interested inexploring the explanations are offered for new policies (Gutmann and Thompson 1996).Table 1 highlights these and other potential applications of the expressed agenda model.
3 Press Releases and Measuring Expressed Agendas
Press releases are an ideal medium for measuring how legislators present themselves toconstituents. There are essentially no formal constraints imposed upon a press release’scontent, and they comprise a critical component of how senators explain activities inWashington to constituents (Yiannakis 1982). In contrast, use of media coverage to mea-sure politicians’ issue agenda conflates the issues politicians discuss and the media outlet’schoice to cover an issue (Sulkin 2005). Surveys of Senate staffers require the strong (and
Fig. 1 Hierarchical structure in political texts exploited in expressed agenda model: Documentsorganized by J.G.
Table 1 Potential applications of the expressed agenda model
Question Example study
How do campaigns affect attention in congress? Sulkin (2005)What do senators discuss in floor statements? Hill and Hurley (2002)Do competing candidates emphasize the same issues? Petrocik (1996)What do presidents address in daily speeches? Lee (2008)What reasons are offered to justify policy? Gutmann and Thompson (1996)Do competing political elites discuss the same issues? Gabel and Scheve (2007)What issues receive attention from newspapers? McCombs (2004)
4 Justin Grimmer
often violated) assumption that the staffer is able to offer an unbiased recollection of a pol-itician’s stated priorities (Cook 1988).
Press releases are also ideal because they are regularly used by each Senate office. In2007, the average Senate office released four and a half press releases per week, and theSenate, as a whole, issued an average of 66 press releases per day. The frequency of pressreleases stands in contrast to newsletters legislators send to constituents, which are only sentoccasionally during a legislative session and have extremely limited space (Lipinski 2004).
3.1 Press Releases and Newspaper Coverage
Press releases are also important because their content reaches citizens through local news-papers. Newspapers—particularly local papers—often have only a small budget dedicatedtoward covering what representatives do while in Congress (Vinson 2002). To fill this gap,newspaper editors rely upon wire service stories and press releases from Congressionaloffices (Cook 1989; Arnold 2004; Schaffner 2006).
3.2 ‘‘Ventriloquism’’ and Press Releases
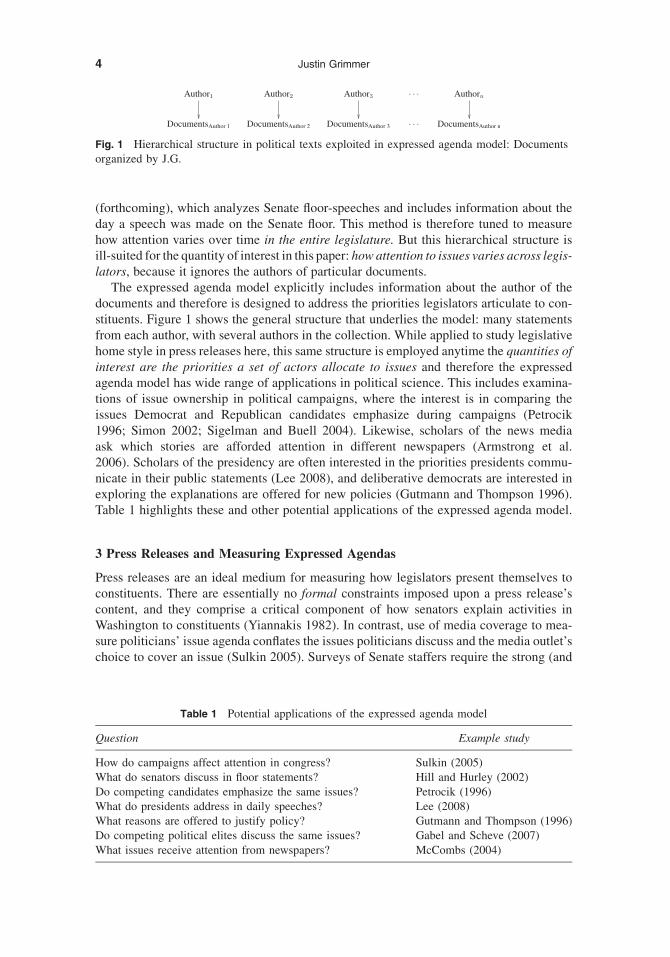
Press secretaries know that they will have high levels of success in generating news cov-erage with press releases (Cook 1989; Schaffner 2006). In fact, some press releases are runalmost verbatim in papers: Table 2 collects three press releases (left-hand column) thatwere subsequently repeated in newspapers (right-hand column) (much like a ventriloquist’sdummy). The italic text in Table 2 identifies the duplicated content. Printing of press re-leases with little modification appears to be common in small-town newspapers. For ex-ample, Richard Lugar (R-IN) issued a press release on July 17, 2007, describing whyReynolds, IN was selected to receive federal funding for alternative fuels research. Hisexplanation was repeated, almost exactly, on July 18, 2007, in The Times—a local news-paper in heavily Democratic northwest Indiana. The repetition of press releases also occursin major metropolitan newspapers. On May 30, 2008, Senator Dick Durbin’s (D-IL) officeissued a press release about funding secured for hybrid buses in Chicago. The ChicagoTribune, which has the fifth largest circulation among American newspapers, used Dur-bin’s release with only slight modification on May 31, 2008 (second row of Table 2). Thethird example shows that a joint press release from Susan Collins (R-ME) and OlympiaSnowe (R-ME) announcing funds secured for laid-off factory workers was reprinted—essentially unchanged—in the Bangor Daily News.
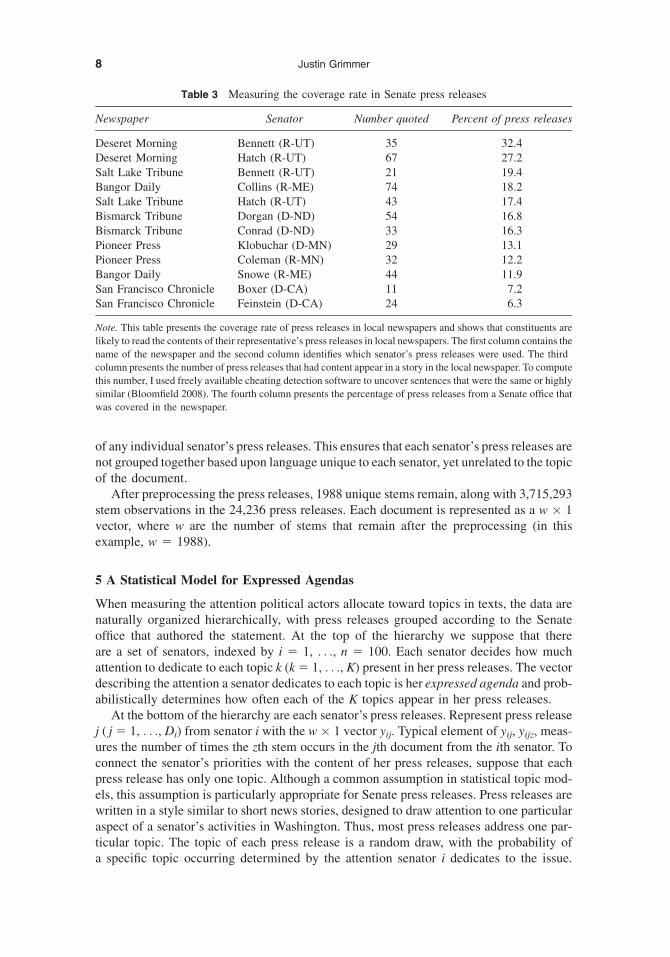
3.3 Measuring the Coverage Rate of Senate Press Releases in Newspapers
Press releases can influence how a newspaper covers a member of Congress without beingplagiarized directly by providing a source for statements on a representative’s position ordrawing attention toward funds secured for a district. To more systematically analyze howoften press releases translate into coverage in local newspapers, I measured the percentageof press releases from 10 Senate offices (identified in column 2, Table 2) that were quoted,paraphrased, or plagiarized in six local newspapers (identified in column 1). The total num-ber of press releases from a senate office that were covered in a given newspaper is con-tained in column 3, whereas column 4 identifies the percentage of a senator’s total pressreleases that a newspaper covered.
5A Bayesian Hierarchical Topic Model for Political Texts

To determine if a press release from a Senate office was used in a newspaper, I firstcollected all newspaper stories from 2007 and January 2008 that contained the relevantsenator’s name.3 I then used publicly available cheating detection software to uncoverpress releases and newspaper stories that had extremely similar content (Bloomfield2008). The software provides an efficient method for searching over the 1,069,430 poten-tial newspaper-press release pairs that must be checked to generate Table 3. I then took thepairs of newspaper stories and press releases that the software identified with similar con-tent and manually validated that the newspaper article contained a quote from the pressrelease.
Overall, Table 3 indicates that press releases are regularly used by local newspapers. Forexample, both Orrin Hatch (R-UT) and Bob Bennett (R-UT) had over a quarter of theirpress releases covered in the Deseret Morning News. This should not be surprising: theDeseret Morning News has a history of financial problems that constrain its ability to coverpolitics, and the editor-in-chief, Joseph Cannon, is the former chair of the Utah Republicanparty. Other newspapers use press releases at a similar rate: Byron Dorgan (D-ND) had 54of his press releases used in the Bismarck Tribune, and 74 press releases from Susan Col-lins (R-ME) were used in the Bangor Daily News. Even the San Francisco Chronicle usedpress releases from both Diane Feinstein (D-CA) and Barbara Boxer (D-CA). The highpercentage of press releases used from each Senate office is particularly striking giventhat Senate offices write press releases for an entire state. Therefore, a sizable portionof press releases from a Senate office is irrelevant to a local paper.
This analysis, although limited to a subset of senators and newspapers, shows that pressreleases are a common source of information for newspapers. Press releases are regularlyquoted in local newspapers—such as the Bismarck Tribune—and are used in major met-ropolitan papers—like the San Francisco Chronicle. This confirms that press releases arean important medium that legislators use to communicate with constituents, as the mes-sages in press releases are likely to reach constituents.
4 Preparing the Texts for Analysis
Using the thousands of press releases from all Senate offices, the expressed agendamodelmeas-ures the priorities senators communicate to their constituents through press releases. To performthis analysis, a set of preprocessing steps are performed on the press releases, all of which arewell established in the literature on the statistical analysis of text (Manning et al. 2008). Thefirst step discards the order of words in the press release, leaving an unordered set ofwords remaining (Hopkins and King forthcoming; Quinn et al. forthcoming). Althoughone might expect the order of words to be crucial to understanding the sentiment expressedin a text, identifying the topic of a press release should be invariant to permutations of wordorder. Certain topics, such as the Iraq war, should result in specific words appearing with
3Stories were collected from the Lexis-Nexis database of newspaper stories. The newspapers selected are nota random sample of papers. I intentionally selected newspapers that I conjectured would display a great dealof variation in their use of press releases. The Deseret Morning News (Salt Lake City, Utah), The BismarckTribune (Bismarck, North Dakota), and the Bangor Daily News (Bangor, Maine) are all local newspapers thatwere likely to be highly reliant on the information senators provided. The Salt Lake Tribune (Salt Lake City,Utah), The Pioneer Press (St Paul, Minnesota), and the San Francisco Chronicle (San Francisco, California) areall large newspapers with greater capacity for covering political news. I also selected a mix of Republican, Dem-ocrat, and split delegations; senators from big and small states; and senators who issued a great deal of pressreleases and senators who issue only a few. Given the nature of the sample selection, inference to a broaderpopulation is inappropriate from these data, but is the subject of future research.
6 Justin Grimmer
high frequency (troop, war, iraqi) irrespective of whether the senator supports or opposesthe war.
Next, all the words are placed into lower case and all punctuations are removed. Then, Iapplied the Porter stemming algorithm to each word (Porter 1980). The stemming algo-rithm takes as an input a word and returns the word’s basic building block, or stem. Forexample, the stemming algorithm takes the words family, families and returns famili.
After stemming the words in each document, I counted the number of occurrences ofeach word in the corpus, the total set of press releases. All words that do not occur in at least0.5% of press releases were removed (Quinn et al. forthcoming). Finally, I removed all stopwords (e.g., around, whereas, why, whether), along with any word that appears in over 90%
Table 2 ‘‘Ventriloquism’’: press releases in local newspapers
Richard Lugar (R-IN), 7/17/2007 The Times (IN), 7/18/07The Town of Reynolds was selected in 2005 to
demonstrate to the nation and the world thata community’s energy needs can be fully metthrough locally produced renewablesources, including electricity, natural gasreplacement, and vehicular fuel (Lugar2007).
Reynolds, located about 20 miles north ofLafayette, was chosen in 2005 todemonstrate that a community’s energyneeds can be fully met through locallyproduced renewable sources, includingelectricity, natural gas replacement, andvehicular fuel (AP 2007).
Dick Durbin (D-IL), 5/30/2008 Chicago Tribune (IL), 5/31/2008U.S. Senator Dick Durbin (D-IL) announcedtoday that the U.S. Department ofTransportation (DOT) has awarded a $9.6million grant to the city of Chicago that willallow the Chicago Transit Authority topurchase approximately 13 additionalarticulated diesel hybrid buses. Hybridbuses are quieter, cleaner, burn less gas, andrun more smoothly than conventional diesel.(Durbin 2008).
U.S. Senator Dick Durbin says the city ofChicago will receive $9.6 million from thefederal government to buy hybrid buses.Durbin said Friday that the grant from theU.S. Department of Transportation willallow the Chicago Transportation Authorityto buy about 13 more articulated dieselhybrid buses. In March, the CTA announcedplans to lease 150 hybrid buses at the cost of$13.4 million a year. Hybrid buses burnless gas than conventional diesel buses(AP 2008).
Susan Collins (R-ME), 11/1/2007 Bangor Daily News (ME), 11/2/2007U.S. Senators Olympia J. Snowe and Susan
Collins today announced that the U.S.Department of Labor has approved theirrequest for $894,918 in National EmergencyGrant funding for Domtar and Fraser Millworkers. Last month Senators Snowe andCollins sent Secretary Chao a letter urgingthe Department of Labor to quickly reviewand approve the NEG funding request for the300 workers who lost their jobs at DomtarIndustries in Baileyville and Fraser Papersof Madawaska. ‘‘This is great news for 300workers in Northern and Eastern Maine wholost their jobs through no fault of their own’’said Senators Snowe and Collins (Collins2007).
U.S. Senators Olympia J. Snowe and SusanCollins Thursday announced that the U.S.Department of Labor has approved theirrequest for $894,918 in National EmergencyGrant funding for Domtar and Fraser Millworkers. Last month, the senators sentSecretary Elaine Chao a letter urging theDepartment of Labor to quickly review andapprove the NEG funding request for the 300workers who lost their jobs at DomtarIndustries in Baileyville and Fraser Papersof Madawaska. ‘‘This is great news for 300workers in Northern and Eastern Maine wholost their jobs through no fault of their own,’’said the senators (Staff 2007).
7A Bayesian Hierarchical Topic Model for Political Texts
of any individual senator’s press releases. This ensures that each senator’s press releases arenot grouped together based upon language unique to each senator, yet unrelated to the topicof the document.
After preprocessing the press releases, 1988 unique stems remain, along with 3,715,293stem observations in the 24,236 press releases. Each document is represented as a w � 1vector, where w are the number of stems that remain after the preprocessing (in thisexample, w 5 1988).
5 A Statistical Model for Expressed Agendas
When measuring the attention political actors allocate toward topics in texts, the data arenaturally organized hierarchically, with press releases grouped according to the Senateoffice that authored the statement. At the top of the hierarchy we suppose that thereare a set of senators, indexed by i 5 1, . . ., n 5 100. Each senator decides how muchattention to dedicate to each topic k (k 5 1, . . ., K) present in her press releases. The vectordescribing the attention a senator dedicates to each topic is her expressed agenda and prob-abilistically determines how often each of the K topics appear in her press releases.
At the bottom of the hierarchy are each senator’s press releases. Represent press releasej ( j 5 1, . . ., Di) from senator i with the w � 1 vector yij. Typical element of yij, yijz, meas-ures the number of times the zth stem occurs in the jth document from the ith senator. Toconnect the senator’s priorities with the content of her press releases, suppose that eachpress release has only one topic. Although a common assumption in statistical topic mod-els, this assumption is particularly appropriate for Senate press releases. Press releases arewritten in a style similar to short news stories, designed to draw attention to one particularaspect of a senator’s activities in Washington. Thus, most press releases address one par-ticular topic. The topic of each press release is a random draw, with the probability ofa specific topic occurring determined by the attention senator i dedicates to the issue.
Table 3 Measuring the coverage rate in Senate press releases
Newspaper Senator Number quoted Percent of press releases
Deseret Morning Bennett (R-UT) 35 32.4Deseret Morning Hatch (R-UT) 67 27.2Salt Lake Tribune Bennett (R-UT) 21 19.4Bangor Daily Collins (R-ME) 74 18.2Salt Lake Tribune Hatch (R-UT) 43 17.4Bismarck Tribune Dorgan (D-ND) 54 16.8Bismarck Tribune Conrad (D-ND) 33 16.3Pioneer Press Klobuchar (D-MN) 29 13.1Pioneer Press Coleman (R-MN) 32 12.2Bangor Daily Snowe (R-ME) 44 11.9San Francisco Chronicle Boxer (D-CA) 11 7.2San Francisco Chronicle Feinstein (D-CA) 24 6.3
Note. This table presents the coverage rate of press releases in local newspapers and shows that constituents are
likely to read the contents of their representative’s press releases in local newspapers. The first column contains the
name of the newspaper and the second column identifies which senator’s press releases were used. The third
column presents the number of press releases that had content appear in a story in the local newspaper. To compute
this number, I used freely available cheating detection software to uncover sentences that were the same or highly
similar (Bloomfield 2008). The fourth column presents the percentage of press releases from a Senate office that
was covered in the newspaper.
8 Justin Grimmer

Conditional upon this sampled topic, a press release’s content is drawn from a distributionthat is specific to each topic. Formally, the expressed agenda model is a hierarchical mix-ture model where the mixture weights (senators’ expressed agendas) are allowed to varyacross senators, but the components of the mixture (topics) are fixed across authors to en-sure that the priorities of senators are comparable (see Section 6 below). To complete ourpreliminary notation, suppose that there are a total of D5
P100i5 1 Di press releases and
collect all the press releases into the D � w matrix Y.
5.1 Senator-Level Parameters: Senators’ Expressed Agendas
The expressed agenda for each senator determines the probability that topics appear indocuments. Call the attention senator i allocates to issue k, pik. Equivalently, pik representsthe expected probability that a press release is generated by the kth topic. Each senator’sexpressed agenda, pi, is then defined as the K � 1 vector describing the attention she ded-icates to each topic, pi 5 ðpi1; pi2; . . . ; piKÞ. In order for pi to be interpreted as the prob-ability of each topic appearing in a press release, its elements must sum to one,PK
k5 1 pik 5 1, and every entry must be greater than zero, pik > 0 for each k 5 1, . . .,K. Substantively, this assumption implies that senators are resource constrained when al-locating attention to issues and cannot distract from an issue any more than not issuinga press release on the issue.
5.2 Document-Level Parameters: Topics and Words
Conditional on a senator’s expressed agenda, pi, we draw the topic of each press release.Represent press release yij’s topic with the K � 1 indicator vector tij: if press release yij wasgenerated by the kth topic, then sijk 5 1 and the other K – 1 elements of tij are equal to 0.
4
The topic of each press release tij is a draw from a multinomial distribution,
tij��pi � Multinomial
�1;pi
�: ð5:1Þ
Equation (5.1) connects the topics of press releases to a senator’s expressed agenda. Theexpected proportion of senator i’s press releases allocated to the kth topic is pik.
Conditional on the sampled topic, tij, we draw the content (words) of each press release.One possibility would be to model the contents of each press release yij directly as a drawfrom a normal distribution (Fraley and Raftery 2002). But using normal distributions tocluster documents will tend to group press releases together based upon the number ofwords used in the document or the length of yij (Banerjee et al. 2005). If the length ofa document does not contain information about the topic of a document, then usingthe normal distribution is inappropriate.
To eliminate the influence of word count when clustering press releases, I normalizeeach press release to have unit length. The unit length representation of yij is given by y�ij,
with y�ij 5yij
jjyijjj where jj � jj is defined as the Euclidean norm,����yij����5�y#ijyij�1=2. y�ij, now
measures the relative rate words, are used in each press release rather than the total numberof times each stem is used in a document.
Afternormalizingeachpress release,wesuppose thaty�ij is adrawfromadistribution that isdefined only the set of unit-length vectors (or a unit hypersphere): the von Mises-Fisher
4Collect the indicator vectors for all of senator i’s press releases into the Di � K matrix ti.
9A Bayesian Hierarchical Topic Model for Political Texts
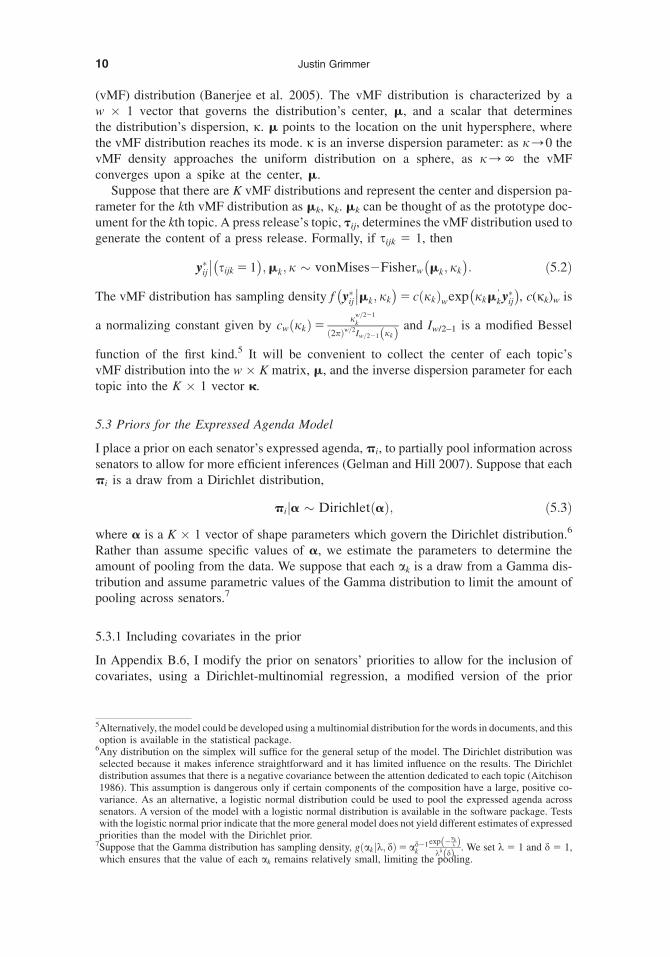
(vMF) distribution (Banerjee et al. 2005). The vMF distribution is characterized by aw � 1 vector that governs the distribution’s center, m, and a scalar that determinesthe distribution’s dispersion, j. m points to the location on the unit hypersphere, wherethe vMF distribution reaches its mode. j is an inverse dispersion parameter: as j/0 thevMF density approaches the uniform distribution on a sphere, as j/N the vMFconverges upon a spike at the center, m.
Suppose that there are K vMF distributions and represent the center and dispersion pa-rameter for the kth vMF distribution as mk, jk. mk can be thought of as the prototype doc-ument for the kth topic. A press release’s topic, tij, determines the vMF distribution used togenerate the content of a press release. Formally, if sijk 5 1, then
y�ij���sijk 5 1
�;mk; j � vonMises2Fisherw
�mk; jk
�: ð5:2Þ
The vMF distribution has sampling density f�y�ij��mk; jk
�5 cðjkÞwexp
�jkm#
ky�ij
�, c(jk)w is
a normalizing constant given by cwðjkÞ5jw=221
k
ð2pÞw=2Iw=221ðjkÞ and Iw/2–1 is a modified Bessel
function of the first kind.5 It will be convenient to collect the center of each topic’svMF distribution into the w � K matrix, m, and the inverse dispersion parameter for eachtopic into the K � 1 vector k.
5.3 Priors for the Expressed Agenda Model
I place a prior on each senator’s expressed agenda, pi, to partially pool information acrosssenators to allow for more efficient inferences (Gelman and Hill 2007). Suppose that eachpi is a draw from a Dirichlet distribution,
pija � DirichletðaÞ; ð5:3Þ
where a is a K � 1 vector of shape parameters which govern the Dirichlet distribution.6
Rather than assume specific values of a, we estimate the parameters to determine theamount of pooling from the data. We suppose that each ak is a draw from a Gamma dis-tribution and assume parametric values of the Gamma distribution to limit the amount ofpooling across senators.7
5.3.1 Including covariates in the prior
In Appendix B.6, I modify the prior on senators’ priorities to allow for the inclusion ofcovariates, using a Dirichlet-multinomial regression, a modified version of the prior
5Alternatively, the model could be developed using a multinomial distribution for the words in documents, and thisoption is available in the statistical package.6Any distribution on the simplex will suffice for the general setup of the model. The Dirichlet distribution wasselected because it makes inference straightforward and it has limited influence on the results. The Dirichletdistribution assumes that there is a negative covariance between the attention dedicated to each topic (Aitchison1986). This assumption is dangerous only if certain components of the composition have a large, positive co-variance. As an alternative, a logistic normal distribution could be used to pool the expressed agenda acrosssenators. A version of the model with a logistic normal distribution is available in the software package. Testswith the logistic normal prior indicate that the more general model does not yield different estimates of expressedpriorities than the model with the Dirichlet prior.7Suppose that the Gamma distribution has sampling density, gðakjk; dÞ5ad21
k
expð2akk Þ
kdðdÞ . We set k 5 1 and d 5 1,which ensures that the value of each ak remains relatively small, limiting the pooling.
10 Justin Grimmer

introduced in Mimno and McCallum (2008). These covariates allow for the inclusion ofadditional information that allows for smoothing across groups of senators who share sim-ilar characteristics—such as a senator’s political party or a dummy variable for a specificsenator who served in different years. For expository purposes, this paper proceeds witha model that does not include additional covariate information, but this model is availablein the software package.8
I fix all K j’s to a single value in the results below, j is set to 100 (Zhong and Ghosh2003).9 Conditional on j we assume a conjugate prior for the center of vMF distributionsmkjj�vMFwðh; jÞ. The center of the prior vMF distribution, h, has typical element 1ffiffiffi
wp .10
5.4 Posterior Distribution for the Expressed Agenda Model
Figure 2 provides a graphical display of the complete expressed agenda model: the directedacyclic graph consistent with the model and priors that comprise the expressed agendamodel. The arrows in the graph depict the parameters that each random variable’s densityis dependent upon. For example, the directed edge a/pi denotes that the sampling den-sity of senator i’s expressed agenda, pi, depends upon a. Notice the hierarchical structure
Fig. 2 Bayesian graph of expressed agenda model. This figure presents the expressed agenda model.We assume that each senator’s expressed agenda pi is a draw from a Senate-wide Dirichletdistribution DirichletðaÞ. Conditional on pi, each press release’s topic is a draw froma Multinomial(1, pi). Conditional upon this draw, we assume that each document is then drawnfrom a vMF distribution, with center mj and inverse dispersion parameter jj. Note, that all senatorsselect from the same set of topics to ensure that their priorities are comparable. Further, noticethe hierarchical structure inherent in the model, with press releases organized according to theirauthor.
8The exclusion of covariates in the model does not introduce omitted variable bias as we might expect when usingregression to make causal inferences. Rather, the inclusion of covariates improves the information that is bor-rowed across senators during smoothing. We might expect additional covariates to improve the performance ofthe model, and therefore, presenting the model with no covariates represents a disadvantage against the expressedagenda model in the evaluations performed below.9Fixing j across clusters is similar to the approach in Zhong and Ghosh (2003) for estimating mixtures of vMFdistributions. The model has been estimated with j ranging from 50 to 500, and the substantive results remainunchanged.10This is the least informative conjugate prior on m that treats all coordinates of the vMF distribution identicallybecause the vMF distribution measures the relative rate at which words occur. To see this, suppose we choose anarbitrarily small quantity e > 0 for each component. The length of e5 ðe; . . . ; eÞ is jjejj5
ffiffiffiffix
p� e. Then the
normalized vector e� 5 ð 1ffiffiffix
p ; . . . ; 1ffiffiffix
p Þ:
11A Bayesian Hierarchical Topic Model for Political Texts

present in the model: press releases organized by their author. Appendix B provides the fullposterior distribution.
5.5 Inference for the Expressed Agenda Model
Due to the large number of components necessary to capture the variety of topics in pressreleases, computationally intensive approaches to inference—such as MCMC—are pro-hibitively slow. Sampling-based methods also face difficulty because permutations ofthe cluster labels result in the same height of the posterior density, greatly complicatingsimulation-based inference. One proposed solution is to constrain the parameter space, butthis hinders the convergence of the Markov chain (McLachlan and Peel 2000). As an al-ternative, current best practice recommends running the chains without constraints andthen post-processing, identifying the same clusters using a clustering algorithm on the out-put. This is a useful approach with a small number of mixture components, but MCMCmethods have difficulty exploring the posterior as the number of mixture componentsincreases.
Alternatively, one could employ the expectation maximization (EM) algorithm to gen-erate maximum a posteriori (MAP) estimates (McLachlan andKrishnan 1997). This is a rea-sonable method for inference when MCMC is infeasible, but generating uncertaintyestimates from the results of an EM algorithm can be computationally challenging in largemixture models, due to the large number of parameters (McLachlan and Peel 2000). Asa result, estimates from an EMmodel are often analyzed under the assumption that there isno uncertainty in the estimates (Quinn et al. forthcoming). This is an unattractive assump-tion for two reasons. First, some uncertainty is always present when measuring senator’sexpressed agendas. Second, the amount of information present about a senator’s prioritiesvaries considerably by Senate office. As a result, uncertainty about a senator’s expressedagenda should vary by senator as well.
To avoid the difficulties associated with sampling methods and to estimate the entireposterior distribution on each senator’s expressed agenda, I use a variational approxima-tion to derive an analytical—rather than computational—approximation to the posteriordistribution for each senator’s expressed agenda (Jordan et al. 1999). Like EM algorithms,variational methods avoid the identification problem because optimization occurs accord-ing to a deterministic algorithm based upon starting values and the posterior distribution.Rather than generating MAP parameter estimates, variational methods analytically esti-mate the entire posterior distribution on each senator’s expressed agenda. To perform thisestimation, we first restrict the model to a simpler family of distributions. Then, we use thecalculus of variations to select the member of this distributional family that is closest tothe true posterior distribution, where proximity between the distributions is measured usingthe Kullback-Leibler (KL) divergence (Bishop 2006). In Appendix B, I derive the updateequations used to estimate the posterior distributions.
5.6 Details of Estimation
The results presented in this paper use the variational algorithm derived in Appendix B andassume there are 43 topics present in the data. I varied the number of assumed topic fromonly five topics, up to 85 different topics. Assuming too few topics resulted in distinct issuebeing lumped together, whereas too many topics results in several clusters referring to thesame issues. During my tests, 43 issues represented a decent middle ground. I corroborated
12 Justin Grimmer
this number of clusters using a nonparametric model for text clustering, based upon theDirichlet process prior. This model identified 40–45 clusters in the data set under a widerange of hyperpriors (Blei and Lafferty 2006). The variational algorithm described inAppendix 12 was randomly restarted 100 times, and the analysis was performed on the‘‘best’’ run.11
6 Comparison to Ad-Hoc Approaches to Measuring Author Priorities
Existing methods for unsupervised learning and text clustering are designed to assigndocuments to topics or to measure the attention in an entire collection of documents—ignoring the information about authors. As a result, these methods are either unable tomeasure author-specific attention or would require ad-hoc modifications that fail to havethe many benefits of the expressed agenda model.
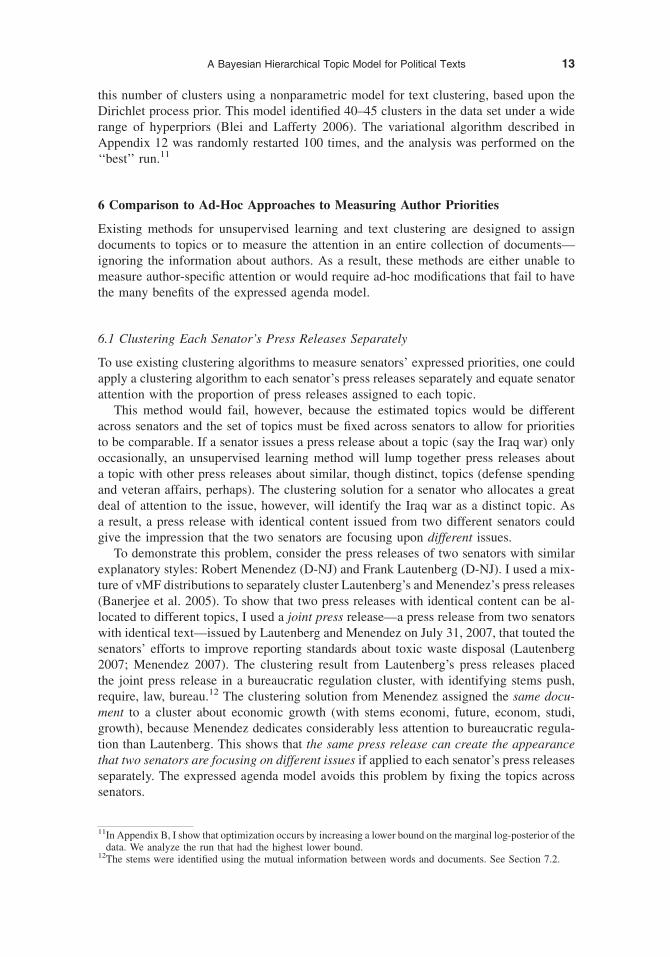
6.1 Clustering Each Senator’s Press Releases Separately
To use existing clustering algorithms to measure senators’ expressed priorities, one couldapply a clustering algorithm to each senator’s press releases separately and equate senatorattention with the proportion of press releases assigned to each topic.
This method would fail, however, because the estimated topics would be differentacross senators and the set of topics must be fixed across senators to allow for prioritiesto be comparable. If a senator issues a press release about a topic (say the Iraq war) onlyoccasionally, an unsupervised learning method will lump together press releases abouta topic with other press releases about similar, though distinct, topics (defense spendingand veteran affairs, perhaps). The clustering solution for a senator who allocates a greatdeal of attention to the issue, however, will identify the Iraq war as a distinct topic. Asa result, a press release with identical content issued from two different senators couldgive the impression that the two senators are focusing upon different issues.
To demonstrate this problem, consider the press releases of two senators with similarexplanatory styles: Robert Menendez (D-NJ) and Frank Lautenberg (D-NJ). I used a mix-ture of vMF distributions to separately cluster Lautenberg’s and Menendez’s press releases(Banerjee et al. 2005). To show that two press releases with identical content can be al-located to different topics, I used a joint press release—a press release from two senatorswith identical text—issued by Lautenberg and Menendez on July 31, 2007, that touted thesenators’ efforts to improve reporting standards about toxic waste disposal (Lautenberg2007; Menendez 2007). The clustering result from Lautenberg’s press releases placedthe joint press release in a bureaucratic regulation cluster, with identifying stems push,require, law, bureau.12 The clustering solution from Menendez assigned the same docu-ment to a cluster about economic growth (with stems economi, future, econom, studi,growth), because Menendez dedicates considerably less attention to bureaucratic regula-tion than Lautenberg. This shows that the same press release can create the appearancethat two senators are focusing on different issues if applied to each senator’s press releasesseparately. The expressed agenda model avoids this problem by fixing the topics acrosssenators.
11In Appendix B, I show that optimization occurs by increasing a lower bound on the marginal log-posterior of thedata. We analyze the run that had the highest lower bound.
12The stems were identified using the mutual information between words and documents. See Section 7.2.
13A Bayesian Hierarchical Topic Model for Political Texts

6.2 The Inadequacy of Ad-Hoc Modifications of Existing Methods
Ad-hoc modifications of existing clustering models could provide estimates of authors’priorities. For example, one could run an off-the-shelf clustering method on the entire col-lection of press releases from each Senate office, then tally the proportion of a senator’spress releases that fall into each of the topics. This would create a measure of author-specific attention where the topics are fixed across senators.
This ad-hoc approach, however, is inadequate for several reasons. Most importantly, ad-hoc modifications are unable to provide uncertainty estimates about author-specific atten-tion and subsequently, uncertainty about auxiliary quantities of interest. In contrast, theexpressed agenda model estimates the posterior distribution on each author’s prioritiesand is easily extended to posterior distributions on other quantities of interests derivedfrom priorities.
An ad-hoc modification of existing methods also fails to exploit the additional infor-mation available to the analyst: the author of each press release. The expressed agendamodel uses this additional information to aide in the discovery of topics, assign documentsto topics, and measure the priorities authors express relative to the topics. A generativestatistical model makes clear the assumptions of the statistical model and how the modelcould be extended to include across senator and over-time dependence. The statisticalmodel also facilitates the borrowing of information across senators, allowing for efficientinference (Gelman and Hill 2007).
7 Labeling and Validating Topics
An advantage of the expressed agenda model is that the analyst does not need to prespecifythe topics in the data. Rather the topics are estimated from the texts. In order to sensiblyinterpret the expressed agenda of each author, we must reliably label each of the topics andalso validate that we are estimating reasonable topics from the data. I use three approachesto perform this evaluation: reading a subset of randomly chosen documents to providea label, automatically generating distinctive stems to label clusters using the mutual in-formation between stems and a topic, and exploiting over time variation in salience tocheck the reasonableness of cluster labels.
7.1 Labeling Clusters through Manual Document Checking
As a first step to assess the validity of the topics and to generate labels for topics, I randomlyselected 10 documents from each topic with a high posterior probability of belonging tothat topic (Quinn et al. forthcoming). I then read each of the 10 documents to generate thelabel found in the first column of Table 4.
On the whole, the clusters seemed to group together documents that referred to the sametopic. For example, one group of texts discussed judicial nominations. Press releases in thiscategory include releases from senate delegations to ‘‘Announce Recommendations forEastern District Federal Judgeships’’ (Webb 2007), from members of the Judiciary com-mitteewho publicize that the ‘‘Senate Approves Kyl-Feinstein Provision Adding Judgeshipto Ninth Circuit’’ (Kyl 2007), or declare that ‘‘The United States Senate unanimously con-firmed Norman Randy Smith today to serve on the Ninth Circuit Court of Appeals’’ (Craig2007). Another randomly chosen set of press releases dealt with energy policy. Among thepress releases selected from this category is an announcement from a group of senators who‘‘introduced legislation that will increase American drivers’ access to ethanol at fuel
14 Justin Grimmer

Table 4 The topics estimated by the expressed agenda model
Description Stems Identifier
FEMA disast,fema,storm,damag,declar,emerg,flood,recoveri,rebuild,recov disastFood safety food,fda,agricultur,contamin,recal,inspect,product,nutrit,drug,consum foodWorker rights worker,employe,wage,employ,labor,workplac,job,minimum,fair,workforc workerAG/Justice gener,justic,gonzal,judiciari,confirm,resign,investig,million,polit,nomine generAgriculture farmer,agricultur,crop,produc,rancher,usda,livestock,nutrit,conserv,food farmerSCHIP children,insur,uninsur,schip,kid,enrol,chip,reauthor,parent,incom childrenPublic land land,forest,manag,fish,wildlif,public,recreat,area,natur,speci landPres. Veto/SOTU presid,bush,veto,depart,iraq,announc,speech,union,democrat,facil presidLoan crisis mortgag,loan,lender,borrow,homeown,lend,bank,crisi,rate,market mortgagBorder security border,homeland,immigr,patrol,secur,cross,agent,mexico,illeg,dh borderIllegal immgr. immigr,border,illeg,reform,legal,debat,enforc,broken,alien,citizenship immigrHonorary honor,provid,rememb,friend,program,celebr,depart,prayer,tribut,legaci honorGlobal warming climat,warm,emiss,greenhous,global,carbon,chang,pollut,reduct,environment climatScience scienc,math,competit,compet,technolog,innov,engin,research,global,edg sciencHigher edu. colleg,higher,graduat,loan,univers,maximum,aid,school,grant,afford collegIraq war iraq,troop,iraqi,war,withdraw,polit,militari,strategi,petraeu,baghdad iraqVeterans’ affairs veteran,affair,medic,mental,wound,war,deserv,traumat,militari,afghanistan veteranTax policy tax,relief,taxpay,deduct,incom,perman,revenu,credit,code,minimum taxPrescrip. drugs drug,prescript,fda,medicin,medicar,food,patient,market,medic,consum drugEnergy policy energi,fuel,oil,renew,sourc,gallon,ethanol,depend,biofuel,effici energiNat/Coast Guard guard,deploy,mission,militari,duti,soldier,defens,coast,command,iraq guardNCLB/School school,teacher,district,classroom,academ,child,elementari,grade,children,teach schoolAir Force air,forc,aircraft,base,wing,mission,airlin,militari,plane,defens airWomen’s issues women,sexual,violenc,woman,assault,victim,domest,awar,prevent,abus womenConsumer sfty. consum,product,recal,commiss,manufactur,store,danger,regul,ban,lead consumJudicial nom. judg,nomin,confirm,nomine,circuit,judici,district,judiciari,appeal,legal judgStem cells/research research,diseas,cure,institut,univers,scientif,scienc,scientist,cell,stem researchIntl. trade trade,china,agreement,market,export,manufactur,unfair,worker,product,intern trade
Continued
15

Table 4 (continued)
Description Stems Identifier
Gov.Reg/Ethics Ref. govern,rule,reform,transpar,democraci,account,program,report,elect,foreign governWounded soldiers militari,defens,soldier,wound,armi,warrior,arm,veteran,men,walter militariApprop: Def. Proj. million,appropri,defens,project,militari,fiscal,navi,research,air,armi millionApprop: Water Proj. water,corp,wrda,engin,project,flood,drink,armi,navig,restor waterApprop: Econ. Dev. econom,develop,grant,announc,growth,invest,job,economi,rural,award economApprop: Home State 000,project,500,univers,appropri,hospit,youth,colleg,labor,human 000Approp: Firefight firefight,homeland,grant,award,volunt,respond,afg,equip,afgp,depart firefightApprop: Airport airport,aviat,faa,transport,dot,tourist,announc,travel,aircraft,air airportApprop: Public Works project,appropri,fiscal,omnibu,approv,transport,hous,announc,signatur,develop projectApprop: DHS secur,homeland,terrorist,dh,threat,attack,terror,11,risk,respond securApprop: School Grants program,school,youth,particip,grant,children,provid,success,reauthor,teach programApprop: Health Care patient,medicar,hospit,medic,qualiti,medicaid,access,doctor,insur,healthcar patientApprop: Crime crime,enforc,justic,law,crimin,polic,violent,prosecut,gang,local crimeApprop: HUD hous,urban,hud,afford,homeless,incom,low,technolog,rehabilit,develop housApprop: Transp. transport,rail,transit,commut,congest,traffic,corridor,infrastructur,railroad,passeng transport
16
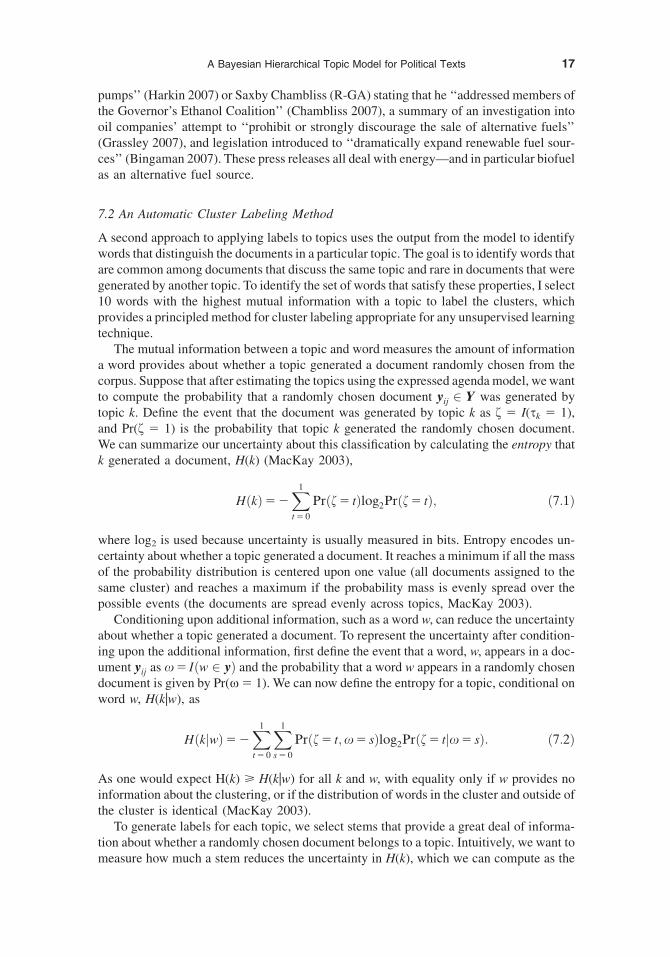
pumps’’ (Harkin 2007) or Saxby Chambliss (R-GA) stating that he ‘‘addressed members ofthe Governor’s Ethanol Coalition’’ (Chambliss 2007), a summary of an investigation intooil companies’ attempt to ‘‘prohibit or strongly discourage the sale of alternative fuels’’(Grassley 2007), and legislation introduced to ‘‘dramatically expand renewable fuel sour-ces’’ (Bingaman 2007). These press releases all deal with energy—and in particular biofuelas an alternative fuel source.
7.2 An Automatic Cluster Labeling Method
A second approach to applying labels to topics uses the output from the model to identifywords that distinguish the documents in a particular topic. The goal is to identify words thatare common among documents that discuss the same topic and rare in documents that weregenerated by another topic. To identify the set of words that satisfy these properties, I select10 words with the highest mutual information with a topic to label the clusters, whichprovides a principled method for cluster labeling appropriate for any unsupervised learningtechnique.
The mutual information between a topic and word measures the amount of informationa word provides about whether a topic generated a document randomly chosen from thecorpus. Suppose that after estimating the topics using the expressed agenda model, wewantto compute the probability that a randomly chosen document yij 2 Y was generated bytopic k. Define the event that the document was generated by topic k as f 5 I(sk 5 1),and Pr(f 5 1) is the probability that topic k generated the randomly chosen document.We can summarize our uncertainty about this classification by calculating the entropy thatk generated a document, H(k) (MacKay 2003),
HðkÞ52X1t5 0
Prðf5 tÞlog2Prðf5 tÞ; ð7:1Þ
where log2 is used because uncertainty is usually measured in bits. Entropy encodes un-certainty about whether a topic generated a document. It reaches a minimum if all the massof the probability distribution is centered upon one value (all documents assigned to thesame cluster) and reaches a maximum if the probability mass is evenly spread over thepossible events (the documents are spread evenly across topics, MacKay 2003).
Conditioning upon additional information, such as a word w, can reduce the uncertaintyabout whether a topic generated a document. To represent the uncertainty after condition-ing upon the additional information, first define the event that a word, w, appears in a doc-ument yij as x5 Iðw 2 yÞ and the probability that a word w appears in a randomly chosendocument is given by Pr(x5 1). We can now define the entropy for a topic, conditional onword w, H(k|w), as
HðkjwÞ52X1t5 0
X1s5 0
Prðf5 t;x5 sÞlog2Prðf5 tjx5 sÞ: ð7:2Þ
As one would expect H(k) > H(k|w) for all k and w, with equality only if w provides noinformation about the clustering, or if the distribution of words in the cluster and outside ofthe cluster is identical (MacKay 2003).
To generate labels for each topic, we select stems that provide a great deal of informa-tion about whether a randomly chosen document belongs to a topic. Intuitively, we want tomeasure how much a stem reduces the uncertainty in H(k), which we can compute as the
17A Bayesian Hierarchical Topic Model for Political Texts

difference between equations (7.1) and (7.2). Define this difference as the mutual infor-mation for topic k with stem w, and denote this quantity with I(k|w) 5 H(k) – H(k|w)(MacKay 2003). If a word w provides no information about whether a topic generateda document, then H(k) 5 H(k|w) and I(k|w) 5 0. But, if word w removes all uncertaintyabout whether a document was generated by topic k, then H(k|w)5 0 and I(k|w) obtain itsmaximum possible value, H(k). Further, as the information a word provides about the prob-ability a document was generated by topic k increases, I(k|w) will increase as well (untilreaching its maximum). Thus, the stems with the highest mutual information with eachtopic provide effective labels for a topic. In Appendix C, I provide the formula used toevaluate the mutual information.
In column 2 of Table 4, I have placed the stems with the 10 largest mutual informationwith each of the 43 categories. The words identified using the mutual information indicatethat the expressed agenda model has uncovered well-defined topics. For example, stemswith a high mutual information with the FEMA topic include disast, FEMA, storm, damag,declar, emerg, flood, recoveri, rebuild, recov. The Veteran Affairs topic has a high mutualinformation with stems veteran, affair, medic, mental, wound, war, deserve, traumat, mil-itari, afghanistan.
In addition to these formal validation methods, a heuristic look at Table 4 suggests themodel was able to identify important issues in press releases from senators. The modelestimated categories of press releases discussing the Walter Reed scandal and the subse-quent Wounded Warrior legislation, the Iraq war, illegal immigration, global warming, themortgage crisis, and a topic for press releases written to honor constituents and historicevents. This suggests that the expressed agenda model was able to recover substantivelyinteresting topics from the data. The final column of Table 4 provides the unique identifierthat will be used for each topic throughout the paper.
7.3 Using Senate Debates and External Events to Validate Topics
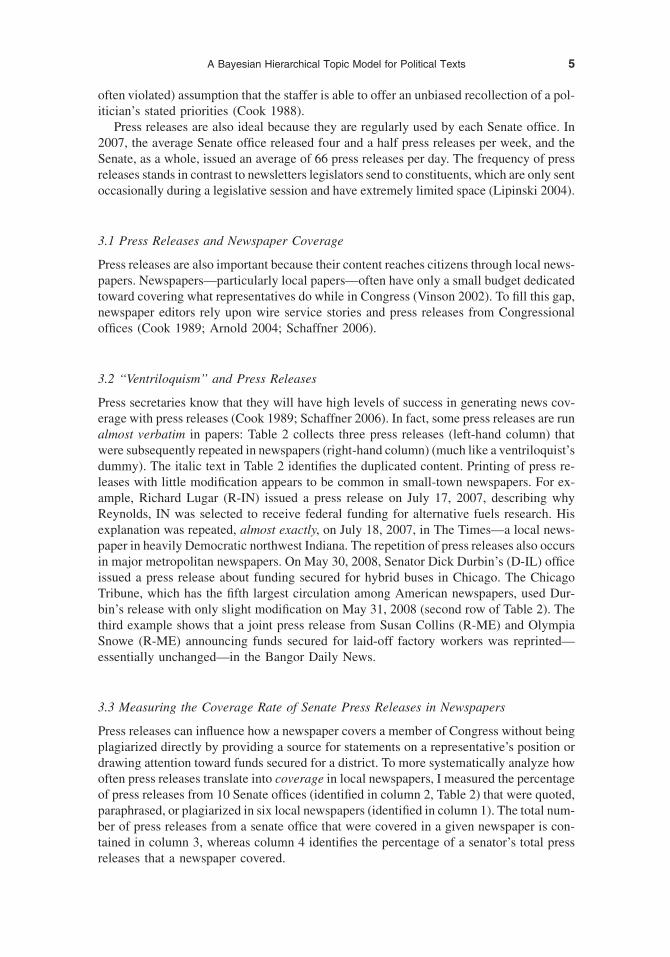
Following a validation outlined in Quinn et al. (forthcoming), we can use the daily numberof press releases generated by each topic as another validity check on the estimated topics.Consider the debate around the Comprehensive Immigration Reform Act of 2007 (S.1348). President Bush’s proposed immigration reforms were met with fierce resistancein the Senate and failed on two separate occasions. Both cloture votes in the Senate werehigh profile events, garnering a large amount of media and public attention. If the expressedagenda model captures meaningful communications from senators, we should expect to seea spike in the number of press releases about immigration around the cloture votes.
The top plot in Fig. 3 shows the number of press releases placed in the immigrationcategory over 2007.13 The two days with largest number of press releases about immigra-tion correspond with the two cloture votes in the Senate. The model also detects the debateabout the Development, Relief and Education for Alien Minors Act (DREAM) act thatwould have allowed the children of illegal immigrants to be eligible for college scholar-ships and enlist in the military. The other two plots in Fig. 3 further illustrate that the modelis accurately capturing the content of press releases. Daily press releases about the Attor-ney General spike during the no-confidence vote for Alberto Gonzales and his subsequentresignation. Honorary press releases—press releases that discuss holidays and honor the
13The topic of press release i from senator j was assumed to be the largest element of tij .
18 Justin Grimmer

recently deceased—also have spikes corresponding to national holidays, unforseen trag-edies, and the death of Senator Craig Thomas (R-WY).
8 Assessing Validity of Estimated Priorities
To validate the estimated expressed agendas from Senate press releases, I use a set of well-established facts about legislative behavior that also have intuitive appeal. If the expressed
010
2030
4050
Immigration Press Releases
Date
Cou
nts
3Feb2007 14May2007 22Aug2007 30Nov2007
Cloture Vote1
Cloture Vote2
DREAM Act
05
1015
2025
30
Honorary Press Releases
Date
Cou
nts
3Feb2007 14May2007 22Aug2007 30Nov2007
MLK
Pres.Day
Tuskegee
Va. TechMem.Day
Thomas Death
June. Indep
Sep. 11th
Attorney General Press Releases
Date
Cou
nts
3Feb2007 14May2007 22Aug2007 30Nov2007
Preserving US Atty. Indep. ActNo Conf. Vote
Gonzales Resigns
Mukasey Confirmed
010
2030
Fig. 3 Senate debates and external events explain spikes in the daily press releases from each topic.
19A Bayesian Hierarchical Topic Model for Political Texts

agenda model agrees with these patterns first observed in smaller scale qualitative studies,we can have more confidence in applying the results of the model to test more contentioustheories of legislative home style. These examples also demonstrate how easily theexpressed agenda model can be used to assess how political actors explain work to con-stituents by incorporating information from every member of a legislature.
8.1 Validation 1: Committee Leaders Focus on their Committee’s Issues
Members of Congress have strong incentives to emphasize their positions of power withinthe legislature. Fenno explains, ‘‘House members explain their use of power in Congressbecause they believe it will help them win renomination and reelection’’ (1978, 139). Elec-ted officials also portray themselves as powerful to be perceived as creating effective policy(Fenno 1978), and legislators are likely to have strong personal interest in the issues thatcome before committees they lead (Fenno 1973). An implication of Fenno’s (1978) argu-ment is that we should observe leaders of Senate committees—chairmen and rankingmembers—allocate more attention to issues that fall under the jurisdiction of their com-mittee than other senators. This straightforward explanation provides an ideal test of thevalidity of the estimated expressed agenda model.
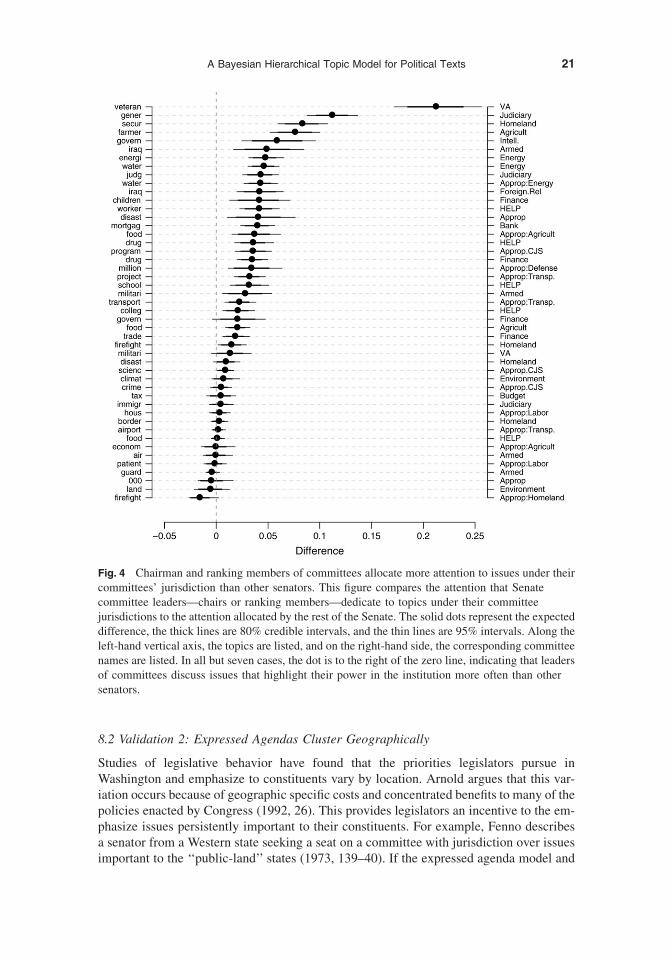
Employing the results from the expressed agenda model, Fig. 4 carries out the com-parison between prominent committee leaders and the rest of the Senate.14 In Fig. 4, com-mittee leaders’ average attention dedicated to an issue under their committee’s jurisdictionis compared with the average attention among the other 98 senators for 47 committee-topicpairs.15 The left-hand vertical axis denotes the topics that were used for the comparison,and the right-hand vertical axis contains an abbreviated committee or appropriations sub-committee name. The solid dot represents the expected difference between committeeleaders and the rest of the Senate, the thick lines are 80% and 95% highest posterior density(HPD) intervals, respectively. If committee leaders discuss issues related to their commit-tee more often, then the estimates should be to the right of the vertical dotted line at zero.
Figure 4 shows that committee leaders allocate more attention to issues under their com-mittee’s jurisdiction than the average senator. In all but seven instances committee leadersallocate more attention to the issues under their committee’s jurisdiction than other sen-ators, and in some instances, leaders of Senate committees allocate substantially more at-tention to issues under their jurisdiction than other senators. For example, JosephLieberman (ID-CT) and Susan Collins (R-ME), chair and ranking member of the Home-land Security and Governmental Affairs committee, each allocate almost 10 percentagepoints more attention to Homeland Security issues than other senators, on average.The largest difference between committee leaders and the rest of the Senate correspondsto the Veterans’ Affairs committee whose chairman, Daniel Akaka (D-HI), discusses Vet-erans’ issues in 36% of his press releases—20 percentage points more than the closestsenator. This example demonstrates that the Expressed Agenda Model is able to retrieveFenno’s (1978) observation that legislators will attempt to highlight their position of powerin communications.
14In addition to committee leaders on standing committees, I also included subcommittee chairs on the Appro-priations committee, due to the prominence of committee membership and the large and diverse nature of thelegislation considered by this committee.
15Veterans’ affairs were calculated with Richard Burr (R-NC) as the ranking member and not Larry Craig (R-ID);the results remain unchanged if Craig is used in place of Burr.
20 Justin Grimmer
8.2 Validation 2: Expressed Agendas Cluster Geographically
Studies of legislative behavior have found that the priorities legislators pursue inWashington and emphasize to constituents vary by location. Arnold argues that this var-iation occurs because of geographic specific costs and concentrated benefits to many of thepolicies enacted by Congress (1992, 26). This provides legislators an incentive to the em-phasize issues persistently important to their constituents. For example, Fenno describesa senator from a Western state seeking a seat on a committee with jurisdiction over issuesimportant to the ‘‘public-land’’ states (1973, 139–40). If the expressed agenda model and
Fig. 4 Chairman and ranking members of committees allocate more attention to issues under theircommittees’ jurisdiction than other senators. This figure compares the attention that Senatecommittee leaders—chairs or ranking members—dedicate to topics under their committeejurisdictions to the attention allocated by the rest of the Senate. The solid dots represent the expecteddifference, the thick lines are 80% credible intervals, and the thin lines are 95% intervals. Along theleft-hand vertical axis, the topics are listed, and on the right-hand side, the corresponding committeenames are listed. In all but seven cases, the dot is to the right of the zero line, indicating that leadersof committees discuss issues that highlight their power in the institution more often than othersenators.
21A Bayesian Hierarchical Topic Model for Political Texts

press release data are recovering valid estimates of legislative behavior, then we shouldobserve this geographic clustering along some issues in the estimated expressed agendas.
The left-hand plot in Fig. 5 shows that this clustering is found in expressed agendas. Thisplot demonstrates that senators from Western states allocate substantial attention towardpublic-land topics—indicating a concern with this issue similar to the Western senator inFenno (1973). The color of each state represents the average expected attention the state’sdelegation allocated to public land issues. The darker the state, the more attention to theissue and we see that the Western states are nearly black. A manual check shows that west-ern delegations allocate substantial attention to public land. Wyoming’s Senate delegation(John Barasso [R-WY] and Mike Enzi [R-WY]) dedicate an average of 18% of their re-leases to discussions of public land issues and Colorado’s delegation (Ken Salazar [D-CO]and Wayne Allard [R-CO]) allocate 14.3% of their releases to land.
The center plot of Fig. 5 carries out the comparison between the attention western andnon-western delegations allocate to public-land directly, along with two other geographiccomparisons. This plot exhibits the geographic clustering wewould intuitively expect fromqualitative studies. The top-point represents the expected difference between the attention
Fig. 5 Attention to issues follows expected geographic patterns. this figure demonstrates thatsenators’ expressed agendas are grouped geographically. The left-hand plot shows that senators fromwestern states allocate substantial attention to public-land issues. Darker shades indicate that theaverage expected attention from the state’s delegation to public-land issues is larger. The center plotcarries out a comparison of three different regional issues: public-land and western states (topestimate), hurricanes and gulf coast states (middle estimate), and border-security and states that sharean international border (bottom estimate). The point in each plot represents the expected differencebetween the attention to senators in a geographic area allocate to an issue and the attention senatorsfrom other areas of the country dedicate to the same issue. The thick and thin lines are 80% and 95%HPD intervals for this difference. Each point is to the right of the zero, indicating that the issuesreceive more attention in the geographic areas we would expect. The right-hand plot shows thatsenators from states with a large number of farms per person also tend to allocate more attention toagriculture issues. The horizontal axis represents the number of farms per resident of the state (onemeasure of agriculture’s importance to a state), and the vertical axis indicates the proportion of pressreleases allocated to agricultural issues. The gray lines are lowess curves indicates the relationshipbetween the number of farms per capita and the attention to agriculture, whereas the black line is theaverage relationship.
22 Justin Grimmer
to public-land issues for Western senators and the attention to public-land issues amongother senators, whereas the thick and thin lines are 80% and 95% HPD intervals for thedifference.16 This shows that there is a very high-posterior probability that senators fromWestern states allocate more attention to public-land issues than senators from other partsof the country, corroborating an expected geographic comparison. The next two pointsindicate two other kinds of geographic clustering: senators from the Gulf coast states al-locate more attention to disaster (hurricane)-related issues than other senators, and senatorsfrom states that share a border with Canada and Mexico issue a larger proportion of pressreleases about Border security (separate from immigration).
States that do not share borders may bear similar costs or receive similar benefits frompolicies. As a result, senators from these states with similar interests should attend to sim-ilar issues. For example, numerous states have a high-density of farms, but these states arenot necessarily grouped in one location. Nonetheless, senators from the high-density ag-riculture states may be expected to address farm-related issues more than other senators.The right-hand plot shows that this is the case: senators from agricultural states allocatemore attention to farming than other senators. The horizontal axis represents the number offarms per resident of the state (one measure of agriculture’s importance to a state), and thevertical axis indicates the proportion of press releases allocated to agricultural issues.17 Thelight gray lines are lowess curves indicating the relationship between the number of farmsper capita and the attention to agriculture. Each gray line represents this relationship forone draw from each senators expressed agenda, whereas the solid black line indicates theaverage relationship between farms per capita and the proportion of press releases allo-cated to agriculture.18 The gray lines slope upwards quickly, demonstrating that senatorsfrom states with a high concentration of farms also tend to invest attention in highlightingagricultural issues.
Taken together, the three plots in Fig. 5 demonstrate that the expressed agenda model isable to retrieve geographic and interest-based clustering in expressed agendas: an intuitiveproperty of explanations well established in the qualitative literature on Congressionalcommunication.
8.3 Validation 3: Attention to Appropriations Predicts Opposition to Earmark Reform
Senators who rely upon appropriations secured for their state in press releases have strongincentive to support institutions that allow them to continue to secure particularistic goods(Mayhew 1974). Senators who regularly tout appropriations secured for a state are likelyto view these appropriations as essential to their electoral security (Fenno 1978; Cain,Ferejohn, and Fiorina 1987; King 1991). Senators may also feel pressure to ensure thattheir actions in Washington are consistent with the priorities emphasized to constituents,lest the legislator be portrayed as a hypocrite in future elections (Fenno 1978). In thissection, I use a unique vote in the US Senate to show that the results of the expressedagenda model predict aspects of legislative behavior beyond ideal points.
On March 13, 2008, the Senate voted on the Demint-McCain amendment: a proposalintroduced by Jim Demint (R-SC) and John McCain (R-AZ) to place a 1-year moratoriumon earmarks in senate appropriations bills. Given the incentives to support institutions
16Western senators were identified using the region classification from the census bureau.17The numbers of farms per state were obtained from the U.S. Department of Agriculture.18The gray points in the background represent each senator’s expected attention to farming, whereas the thick andthin lines are 50% and 90% HPD intervals for this quantity.
23A Bayesian Hierarchical Topic Model for Political Texts

essential to maintaining their incumbency advantage and to remain constistent, senatorswho allocate a large proportion of their press releases toward discussions of appropria-tions secured for the home state should be more likely to oppose the Demint-McCainamendment.
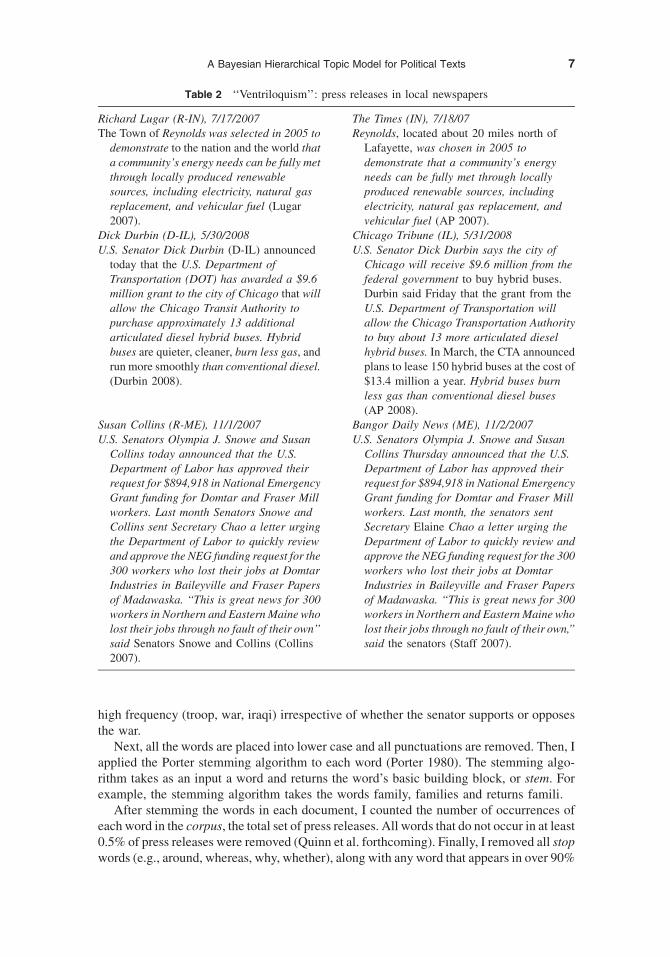
Figure 6 displays the relationship between senators’ vote on the Demint-McCainamendment and two components of the expressed agenda: the proportion of press releasesallocated to discussing fire department grants (left-hand plot) and a composite measure ofappropriations (center- and right-hand plots). In the left-hand plot in Fig. 6, each senator’svote on the Demint-McCain amendment is predicted using the proportion of press releasesdedicated to discussing grants secured for local fire departments—one measure of howoften a senator discusses appropriations with constituents.19 The vertical axis plots thevote on the amendment, and the horizontal axis represents the expected proportion of pressreleases discussing fire department grants. The gray lines account for the uncertainty in-herent in measuring the legislators’ priorities by taking 100 draws from each senator’sposterior expressed agenda and then regressing the earmark vote on the draws using a probitregression. The black lines represent the average relationship over 1000 draws.
Fig. 6 Senators who dedicate more attention to appropriations were more likely to oppose Demint-McCain. This figure shows that senators who dedicate more attention to appropriations in their pressreleases are more likely to oppose the Demint-McCain amendment. The vertical axis plots the vote onthe amendment, and along the horizontal axis is the average proportion of press releases dedicate todiscussing appropriations secured for fire departments. To generate the light gray lines, I took 100draws from each senator’s posterior expressed agenda and then regressed the earmark vote on thedraw from the posterior. The gray lines represent the expected probability of supporting the Demint-McCain amendment, and the solid black line is the expected value of the relationship, averaged overthe draws from the posterior distribution on the expressed agenda. The left-hand figure shows thatsenators who discuss fire department grants more often were more likely to oppose the Demint-McCain amendment, and the center plot shows that this relationship was even stronger for anaggregate appropriations category. The right-hand plot shows that the relationship remains even afterconditioning upon estimated ideal points of senators, suggesting that consistency explainscomponents of voting behavior beyond ideal point estimates.
19The Demint-McCain amendment was defeated 29-71. I did not include Roger Wicker (R-MS) and Trent Lott(R-MS) due to the change in senate seat after the 2007 session.
24 Justin Grimmer

Figure 6 shows that senators’ votes on the Demint-McCain amendment tended to beconsistent with the priorities articulated to constituents. In the left-hand plot, as the pro-portion of press releases dedicated to fire department grants increases, senators were lesslikely to support the moratorium on earmarks. The center plot exhibits the relationshipbetween the Demint-McCain vote and an aggregated appropriations category (constitutedof the bottom 13 topics from Table 4).20
This shows an even stronger relationship: senators who allocate more attention to appro-priations were much less likely to vote for the Demint-McCain amendment. The right-handplot in Fig. 6 shows that the results of the expressed agenda model provides predictivepower beyond low-dimensional summaries of previous roll-call votes: the relationship be-tween a senator’s vote on Demint-McCain and the proportion of press releases discussingappropriations is still strong and negative, even after conditioning upon a senator’s idealpoint.21 Taken together, these three plots show that the results of the expressed agendamodel relate as expected to votes on the Senate floor. This provides another validationthat the expressed agenda model estimates quantities of theoretical interest.
9 Applying the Expressed Agenda Model
In this section, I show that the estimated expressed agendas are ideal to address theoret-ically important questions about legislators’ home styles. The use of Bayesian inferenceallows for direct inference about quantities of interest derived from the estimated expressedagendas. Further, by efficiently using all the press releases from each Senate office, theexpressed agenda model allows comprehensive tests of hypotheses, in contrast to the lim-ited tests that had been previously carried out in the literature.
9.1 Partners Not Rivals in the Senate
The structure of representation in the Senate is distinctive from other legislative bodies,with each state allocated two senators. Schiller argues that the dual representation in theSenate forces senators representing the same state to articulate distinctive priorities due tothe persistent competition for media and public attention (2000, 65). Schiller (2000) pro-vides evidence and a persuasive argument for this novel hypothesis, but is hindered by theexisting methods and data, only comparing the statements of a handful of legislators fromnewspapers. While newspaper stories are an excellent measure of the kind of informationavailable to citizens, newspaper stories conflate senators’ priorities with the depictionsoffered by news writers. The expressed agenda model and the Senate press releases allowa direct and comprehensive test of whether senators from the same state articulate a dis-tinctive set of priorities in press releases.
Schiller’s (2000) argument asserts that senators from the same state respond to eachother’s priorities by advocating a different set of issues, which implies that we should ob-serve senators from the same state articulating a distinctive set of issues. But, Schiller’s
20Twomethods were used to label these topics. First, I used topics with appropriations-related labels and increasedattention around the passage of an appropriation bill. Second, I used a topic hierarchy to identify groups of issuesthat clearly referred to appropriations.
21Ideal points were estimated using a one-dimensional item-response theory model, as implemented inMCMCpack (Martin and Quinn 2008). The regressions in the right-hand plot incorporate uncertainty from boththe priorities and the ideal points. In each plot, the senators’ votes were regressed on draws from the posteriordistribution on the priorities and the ideal points for each senator. The simulated lines were generated by varyingthe attention allocated to appropriations.
25A Bayesian Hierarchical Topic Model for Political Texts
(2000) argument could be incorrect and we could still observe some differences in thestated priorities of same-state senators, due to idiosyncratic differences between thetwo senators in a delegation: such as distinct personal interests, divergent backgrounds,support among different constituencies located in the same state, and different partisanship.All these factors are unrelated to the strategic considerations outlined in Schiller (2000).Therefore, the critical test is not whether two senators articulate a different set of priorities:all senators will have some differences in their stated priorities. Rather, a test of Schiller’s(2000) hypothesis depends upon whether senators from the same state have priorities thatare more distinctive than a comparison group of senators who have no incentive to inten-tionally articulate different priorities. To perform this test, I compare the differences inpriorities among senators who represent the same state to the differences in prioritiesamong senators who represent different states. Under Schiller’s (2000) hypothesis, senatorswho represent different states do not have incentive to carve out distinctive expressed agen-das, and therefore, senators who represent different states provide a reasonable group tocompare the differences that should be expected due to idiosyncratic variation.
Tomeasure the distance between two expressed agendas, I use the distance metric on thesimplex defined in Billheimer et al. (2001), which generalizes intuition about properties ofdistance in Euclidean space to the simplex. In Appendix 14 I define this metric. Definethe distance between two expressed agendas pj;pi, Distancei; j 5 g
�pj;pi
�where
g(�, �) is the distance metric developed in Billheimer et al. (2001). To test Schiller’s(2000) hypothesis, I compare the average distance between expressed agendas of senatorswho represent different states to the average distance between expressed agendas of sen-ators who represent the same state.22 If Schiller’s (2000) hypothesis is correct, averagedistance between expressed agendas of senators who represent different states to the av-erage distance between expressed agendas of senators who represent the same state shouldbe negative: implying that senators from the same state tend to have expressed agendasfurther apart than senators from different states.
The left-most line in Fig. 7 presents this quantity estimated from Senate press releases.This shows that senators who represent the same state have expressed agendas that aremore similar than senators who represent different states. The solid dot in Fig. 7 representsthe expected value of average distance between expressed agendas of senators whorepresent different states to the average distance between expressed agendas of senatorswho represent the same state and is above the horizontal dotted line, indicating thatsenators from the same state have more similar priorities, on average, than senatorswho represent different states. The thick lines and thin lines are 50% and 90% HPD in-tervals for the difference and both fail to intersect the zero line, indicating that there isa high posterior probability that senators from the same state tend to emphasize similarissues. This holds regardless of the partisanship of the state delegation: the next threelines show that the expressed agendas of split, Republican, and Democratic delegations
22To derive the comparison between the expressed agendas of senators from the same state and different states,
collect the
�100
2
�10025 4950 pairs of senators into the set P. For example, one pair of senators in this set is
Grassley ðR2IAÞ;Murray ðD2WAÞÞ. Define the set S as the set of 50 pairs of senators who represent thesame state, such as (Bayh (D-IN), Lugar (R-IN))2 S. And define S#5PnS as the 4900 pairs of senators whorepresent different states, for example, (McCain (R-AZ), Obama (D-IL))2 S. Formally,
DiffðS#;SÞ5X
ði;jÞ2S#
gðpi;pjÞ4900
2X
ðk;mÞ2S#
g�pm; pk
�50
ð9:1Þ
26 Justin Grimmer

are closer, on average, than the average distance between priorities for senators who rep-resent different states. The final set of lines compare the distance in each senate delegationwith the average distance between the expressed agendas of senators who represent dif-ferent states, and the lines are color-coded according to the partisanship of the delegation.This shows that the majority of state’s delegations tend to be more similar than the averagedistance between the priorities of senators who represent different states, although there issubstantial variation in this quantity across states.
This shows that contrary to the prediction’s from Schiller’s (2000) theory, senators fromthe same state emphasize a more similar set of priorities than senators who represent dif-ferent states, in press releases from 2007. This similarity could occur because senatorsfrom the same state may rely upon similar groups as part of their ‘‘reelection’’ constituency(Fenno 1978), subsequently leading senators to identify a similar set of priorities to pleasethis constituency. Alternatively, senators might be able to multiply the effectiveness of theirown communication by coupling their efforts with the other senator from their state—forming a partnership to help ensure reelection for both senators.
10 Conclusions and Future Work
This paper has introduced a new method for analyzing the expressed priorities of politicalactors, as articulated in political texts: the expressed agenda model. This method is capable
Fig. 7 Senators who represent the same state have more similar expressed agendas than senatorsfrom other states. This figure compares the average distance among senators who represent differentstates to the average distance of senators who represent the same states. The solid dots represent theexpected difference, and the thick and thin lines are 50% and 90% HPD intervals, respectively.If senate delegations have more similar expressed agendas than senators who represent differentstates, then the estimates should be above the horizontal dashed zero-line. The first line comparesthe average distance between expressed agendas from senators from different states with the averagedistance between expressed agendas of senators from the same state, showing that senators fromthe same state communicate a more similar set of priorities than senators from other states. Thissame pattern holds regardless if the delegation is split, Republican, or Democrat. Further, moststates’ delegations have more similar expressed agendas than senators who represent differentstates.
27A Bayesian Hierarchical Topic Model for Political Texts

of handling thousands of texts from hundreds of political actors to estimate the topics ina data set, assign documents to topics, and measure the proportion of press releases eachpolitical actor dedicates to the topics. Using a Bayesian model and a recently developedestimation procedure allows for efficient inference about each senator’s priorities. I applythis method to an original collection of press releases from Senate offices and show that theexpressed agenda model is capable of retrieving a theoretically relevant set of topics andthat press releases are an ideal medium for measuring how senators portray themselves toconstituents. Through a series of applications I validate the estimated priorities and top-ics and show that the model facilitate tests of theoretically important questions aboutcongressional communication.
The statistical model developed in this paper is applicable to a variety of political sit-uations beyond the study of home style and therefore has broad implications for the waypolitical scientists study political communication. The expressed agenda model is idealwhenever scholars are interested in comparing the priorities that authors articulate in text,an important problem in large literatures studying campaign strategy (Petrocik 1996),media-content (Armstrong et al. 2006), and presidential communication (Lee 2008).The expressed agenda model can also be applied to study other forms of Congressionalcommunication, like the attention allocated to issues in Senate floor speeches (Quinn et al.forthcoming) or the issues raised during Senate committee hearings. The forthcoming soft-ware package (implemented in the R computing language) makes applying the expressedagenda model straightforward.
The press release data used to analyze senator’s expressed agendas provide a compre-hensive collection of statements senators make to constituents, which facilitates testing anumber of theories. For example, the press releases, coupled with stories from local news-papers, suggest a new approach to studying the connection between politicians and themedia. Previous studies of this interaction have relied upon time-series regressions tomeasure how the priorities politicians articulate covaries with the issues discussed inthe media (Bartels 1996). This method provides only suggestive evidence of how politi-cians and the press interact. In contrast, the press release coverage rate provides a directmeasure of how politicians ensure that their message is repeated (and amplified) by thepress. Expanding upon this analysis is an important topic for future research. Measuringhow often newspapers cover elite statements would provide an answer to a number oftheoretically important questions, including how reliant local newspapers are on infor-mation from Senate offices, identifying the role of partisanship in determining how of-ten a newspaper prints a legislator’s message, and determining how a newspaper’sreliance upon information from Congressional offices influences the incumbencyadvantage.
Appendix A. Collecting the Press Releases
The data set used in this paper contains all the Senate press releases from the 2007 calendaryear or the first session of the 110th Congress. Due to the large number of press releases,they require a large expenditure of resources to analyze manually (Yiannakis 1982;Lipinski 2004). I overcome this problem by using automatic data collection methods:I wrote a set of ‘‘screen scraping’’ scripts in the Python computing language. Each scriptcollects all the press releases from a senator’s Web site, removes any extraneous contentunrelated to the text of the press release, and then stores the text. The result of thisautomated collection process is a data set of 24,236 press releases for 2007.
28 Justin Grimmer

Appendix B. Deriving the Update Equations for Variational Inference
Given the model and priors outlined above the posterior is given by
ak��d; k�Gamma
�k; d�
for all k5 1; . . . ;K
pi
��a�Dirichlet�a�
for all i5 1; . . . ; n
tij��pi�Multinom
�pi
�for all j5 1; . . . ;Di; i5 1; . . . ; n
mk
��hk; j�vMFw
�h; j
�for all k5 1; . . . ;
y�ij��m; j; sdi;j 5 1�vMFw
�mj; j
�for all j5 1; . . . ;Di; i5 1; . . . ; n
with parametric form
pðp;m;a; tjYÞ}YKk5 1
expð2akÞexpðjh#mkÞ �C�PK
k5 1 ak�
QKk5 1
�ak�
�Y100i5 1
" YKk5 1
ðpikÞak21YDi
j5 1
YKk5 1
½ pikexpðjm#y�ijÞ �sijk 5 1
# ðB:1Þ
In the supplemental notes, I provide the model and derive the estimation algorithm for theexpressed agenda model with a multinomial distribution used to model document content.
B.1. Approximating Distribution
I adopt a standard mean-field approach to estimation of equation (B.1).23 Specifically, Iapproximate the full posterior with a family of distributions that contain additional inde-pendence assumptions but no specific parametric forms are assumed and then select themember of this distributional family that minimizes the Kullback-Leibler divergence be-tween the true posterior and the approximating distribution. Call the approximating distri-bution qðp; t;m;aÞ and assume that this distribution factors into qðpÞqðtÞqðmÞqðaÞ. Wewill estimate the full posterior for topics qðtÞ and senators’ priorities qðpÞ and then obtainMaximum a Posteriori estimates formk and a.
24 This implies that we can write the approx-imating distribution as qðp; t;m;aÞ5
QNi5 1 qðpÞi
QNi5 1
QDi
j5 1 qðtijÞQK
k5 1 dm�kda� where
d(�) is the Dirac delta function,m�k represents the MAP estimates for the kth category and a�
represents the MAP estimates for a.25
B.2. Minimizing KL Divergence
The standard approach to minimizing the KL divergence between the true posterior and theapproximating distribution in variational approximations is to solve an equivalent problem:
23The derivation throughout this appendix is a fairly standard in the application of variational inference to mixturemodels and therefore should have similarities to the derivations in Bishop (2006) and Blei et al. (2003). Note,that I provide these derivations because variational inference in political science is nonstandard.
24I estimate the full posterior (with distributions) for the model with multinomial distributions—the integral withvMF distributions are difficult to compute. Furthermore, not much is gained by maintaining a full posterior onthe components of the mixture because of the large number of stems used in the analysis.
25Recall that the Dirac delta function is a probability distribution that places all of the mass on a single number,given by the term in the subscript.
29A Bayesian Hierarchical Topic Model for Political Texts

maximizing a lower bound on the evidence or the marginal probability of the data. Toderive the lower bound, first write the log evidence as,
log pðYÞ5 logXs
Z Z ZpðY ; p; a; lÞ dpdlda:
Insert the approximating distribution qðp; t;m;aÞ by multiplying by 1,
log pðYÞ5 logXs
Z Z Zqðp; s; l; aÞqðp; s; l; aÞpðY ; p; a;lÞ dpdlda:
Applying Jensen’s inequality yields the lower bound
log pðYÞ>Xs
Z Z Zqðp; t;m;aÞlog
pðY ;p;a;mÞqðp; t;m;aÞ
dpdmda: ðB:2Þ
We will define the right-hand side of Inequality (B.2) as LðqÞ. A straightforward proof (insupplemental notes) shows that maximizing LðqÞ with respect to q is equivalent to min-imizing the KL divergence between the approximating and true posterior.26 This is thelower bound used to evaluate convergence of the model as well.
B.3. Distributional Forms
To maximize LðqÞ with respect to q, we need to obtain the parametric form of the approx-imating distribution and select the correct member of that family (maximize the parametersfor a given distribution). Either from direct derivation or by applying results on the use ofmean-field approximations to exponential families (Jordan et al. 1999), we can obtain thefunctional forms.27 This derivation shows that qðpÞi is a Dirichlet distribution and repre-sents the K � 1 vector of shape parameters that characterize this distribution ui. The samederivation shows that qðtÞij is a multinomial distribution and call rij the K � 1 vector ofparameters for jth document from senator i.
B.4. Iterative Algorithm for Estimation
Each iteration of the estimation algorithm proceeds in several steps. Define the valuesof the parameters from the previous iteration as mold;aold; uold; rold. In each step weupdate the parameters to maximize the lower bound LðqÞ with respect to each independentcomponent of the approximating distribution. The following describes each step in moredetail.
26Note that LðqÞ is a functional: an operator that maps from a space of functions to the real line (Bishop 2006). Inthe case of exponential family models, the lower bound is convex in the approximating distribution—facilitatingiterative (EM-like) algorithms for estimation.
27This derivation is standard in variational inferences, see Bishop (2006).
30 Justin Grimmer

B.4.1. Update step for rij
Typical element of senator rij for senator i, rnewijg is equal to
rnewijg 5exphW�holdig
�2W
�PKk5 1 h
oldik
� iexp½ jmold
g y�ij �
PKk5 1
exp
"Wðholdik Þ2Wð
PKj5 1
holdij Þ#exp�jmold
k y�ij�!: ðB:3Þ
where W(�) is the digamma function.
B.4.2. Update step for ui
Typical element hig of ui has update step (Blei et al. 2003),
hnewig 5 aoldg 1XDi
j5 1
rnewijg : ðB:4Þ
B.4.3. Update step for mk
The update step for mnewk is given by Banerjee et al. (2005),
mnewk 5
h1PN
i5 1
PDi
j5 1 rnewijk y�ij������h1PN
i5 1
PDi
j5 1 rnewijk y�ij
������: ðB:5Þ
B.4.4. Update step for a
Unfortunately, a closed form for the shape parameters a does not exist, so we use aNewton-Raphson algorithm, developed in Blei et al. (2003) to perform the optimization.
B.5. Using the Model
This estimation algorithm is deterministic and therefore easy to implement in a standardpackage. This version of the expressed agenda model, along with various extensions, isavailable in the free R software package expAgenda, which is forthcoming.
B.6. Generalizing the Expressed Agenda Model: Including Covariates
Suppose that we observe an M � 1 set of covariates for each author, X i (including anintercept term as well). The following extends the Dirichlet-multinomial regression sug-gested in Mimno and McCallum (2008) to allow for the inclusion of covariates to facilitatemore efficient smoothing. Specifically, we modify the model to include a regression at thetop of the hierarchy,
bk�Normal�0; r2I
�for all k5 1; . . . ;K
aik 5 exp�X#
ibk
�pi
��ai�Dirichlet�ai
�for all i5 1; . . . ;N:
tij��pi�Multinom
�1;pi
�for all j5 1; . . . ;Di; i5 1; . . . ;N
mk
��hk; j�vMFw
�h; j
�for all k5 1; . . . ;K
y�ij��m;j; sdi;j 5 1�vMFw
�mj; j
�for all j5 1; . . . ;Di; i5 1; . . . ; n
31A Bayesian Hierarchical Topic Model for Political Texts

where r2 represents the prior variance on the regression coefficients. The inclusion of co-variates allows the model to identify subsets of senators who express similar priorities andtherefore include additional information in the model that can aid in classification.
B.6.1. Modifying the variational approximation
In this section, I show how the algorithm in Appendix B can be extended to include theregression at the top of the hierarchy.28 The first modification is an update step for the re-gression coefficients for each topicbk . Collect the coefficient vectors into the M� K matrixb. We focus upon MAP estimates for the coefficients, and a closed form update for theregression coefficients is unavailable. Therefore, we apply a BFGS algorithm to maximizethe following,
f ðbÞ52XKk5 1
1
2r2ðb#
kbkÞ1XNi5 1
"logC
XKk5 1
aik
!2XKk5 1
CðaikÞ#
1XNi5 1
XKk5 1
"ðexpðX iktbkÞ21ÞðWðcikÞ2W
XKk5 1
cikÞ#:
The only other modification to the update step for qðpiÞ to include the additional infor-mation in the prior aik,
cik 5 aik1XDi
j5 1
rijk:
The algorithm otherwise remains unchanged.
Appendix C. Deriving an Expression for Mutual Information
To derive an expression for mutual information, we apply the definitions ofH(k) and H(k|w)to obtain
HðkÞ2HðkjwÞ5X1t5 0
X1s5 0
Prðf5 t;x5 sÞlog2Prðf5 t;x5 sÞ
Prðf5 tÞPrðx5 sÞ: ðC:1Þ
To evaluate equation (C.1), we compute the necessary probabilities. Define the number ofdocuments in which word wj appears as nj 5
PDi5 1 x
ij and the number of documents where
wj does not appear as n–j 5 D – nj. Define the effective number of documents assigned tocluster k and the effective number of documents not in cluster k as nk 5
PDi5 1 ri;k and n–k 5
D – nk. To finish the relevant counts, we need to attend to the four possible joint counts ofwords and topics,
nj;k5XDi5 1
ri;kxij; nj;2k 5
XDi5 1
ð12ri;kÞxij; n2j;k 5
XDi5 1
ri;kð12xijÞ; n2j;2k 5
XDi5 1
ð12ri;kÞð12xijÞ:
28Mimno and McCallum (2008) suggest stochastic EM to estimate a mixture model with the Dirichlet-multinomialregression prior. To my knowledge, this is the first suggestion of a variational-maximization approach.
32 Justin Grimmer

The probabilities are then defined as,
Prðf5 1;xj 5 1Þ5 nj;kD; Prðf5 1;xj 5 0Þ5 nj;2k
D; Prðf5 0;xj 5 1Þ
5n2j;k
DPrðf5 0;xj 5 0Þ5 n2j;2k
D; Prðf5 1Þ5 nk
DPrðf5 0Þ5 n2k
DPrðxj 5 1Þ
5njD
Prðxj 5 0Þ5 n2j
D:
This implies the following formula for I(k|wj) (Manning et al. 2008),
IðkjwjÞ5nj;kDlog2
nj;kD
njnk1nj;2k
Dlog2
nj;2kD
njn2k1n2j;k
Dlog2
n2j;kD
n2jnk1n2j;2k
Dlog2
n2j;2kD
n2jn2k:
Appendix D. Defining Distance on the Simplex
In Section 9, I rely upon the distance metric on a simplex developed in Billheimer et al.(2001). In this appendix, I define this metric. Define the composition operator,
CðpÞ5�
p1Pj
i5 1pi; . . . ;
pjPj
i5 1pi
�and define 4k21 as the k – 1 dimensional simplex. Define
the additive logistic map / : 4k21/Rk21 /ðcÞ5�log�c1ck
�; . . . ; log
�ck21
ck
��, where
c 2 4k21 (Aitchison 1986). Suppose that N21k21 5 Ik212
1k11
# and that Ik21 is a k – 1� k – 1 identity matrix and 1 is a vector of 1’s. For two points in a
simplex, pj;pi 2 4k21, define g : 4k21 � 4k21/R1, gðpj;piÞ5
/�C�pj1
pi1
; . . . ;pjk
pik
��N21
k21/�C�pj1
pi1
; . . . ;pjk
pik
��:
References
Aitchison, John. 1986. The statistical analysis of compositional data. New York: Chapman and Hall.
Armstrong, Elizabeth, Daniel Carpenter, and Marie Hojnacki. 2006. ‘‘Whose deaths matter? Mortality, advocacy,
and attention to disease in the mass media.’’ Journal of Health Politics, Policy and Law 31(4):729–72.
Arnold, R. Douglas. 1992. The logic of congressional action. New Haven, CT: Yale University Press.
———. 2004. Congress, the press, and political accountability. Princeton, NJ: Princeton Press.
Associated Press. 2007. ‘‘‘Biotown’ receives federal grant.’’ Times of Nortwest Indiana (accessed May 15, 2008).
———. 2008. ‘‘Chicago to receive 9.6 million for hybrid buses’’. Chicago Tribune (accessed June 10, 2008).
Banerjee, Arindam, Inderjit S. Dhillon, Joydeep Ghosh, and Suvrit Sra. 2005. ‘‘Clustering on the unit hypersphere
using von Mises-Fisher distributions.’’ Journal of Machine Learning Research 6:1345–82.
Bartels, Larry. 1996. ‘‘Politicians and the press: Who leads, who follows?’’ Presentation at the Annual Meeting of
APSA, San Francisco, CA.
Billheimer, D., Peter Guttorp, and William F. Fagan. 2001. ‘‘Statistical interpretation of species composition.’’
Journal of the American Statistical Association 96(456):1205–15.
Bingaman, Sen. Jeff. 2007. ‘‘Bingaman and Domenici introduce legislation to dramatically expand renewable
fuel sources.’’ http://bingaman.senate.gov/ (accessed January 1, 2008).
Bishop, Christopher. 2006. Pattern recognition and machine learning. New York: Springer.
Blei, David, and John Lafferty. 2006. ‘‘Dynamic topic models.’’ Proceedings of the 23rd International Conference
on Machine Learning, Pittsburgh, PA, June 25–29, 2006. 113–20.
Blei, David, Andrew Y. Ng, and Michael Jordan. 2003. ‘‘Latent Dirichlet allocation.’’ Journal of Machine Learn-
ing and Research 3:993–1022.
Bloomfield, Louis. 2008. ‘‘WCopyFind.’’ Software. http://plagiarism.phys.virginia.edu/Wsoftware.html (accessed
June 1, 2008).
33A Bayesian Hierarchical Topic Model for Political Texts
Cain, Bruce, John Ferejohn, and Morris Fiorina. 1987. The personal vote: Constituency service and electoral
independence. Cambridge, MA: Harvard University Press.
Chambliss, Sen. Saxby 2007. ‘‘Chambliss Touts focus on BioFuels in Next Farm Bill.’’ (accessed January 1, 2008).
Collins, Sen. Susan 2007. ‘‘Senator Collins announces $894,918 for Domtar, Fraser mill workers.’’ http://collins.
senate.gov/public/ (accessed January 1, 2008).
Cook, Timothy. 1988. ‘‘Press secretaries and media strategies in the House of Representatives: Deciding whom to
pursue.’’ American Journal of Political Science 32(4):1047–69.
———. 1989. Making laws and making news: Media strategies in the US House of Representatives. Washington,
DC: Brookings.
Craig, Sen. Larry 2007. ‘‘Senate confirms Randy Smith.’’ http://craig.senate.gov/ (accessed January 1, 2008).
Durbin, Sen. Richard 2008. ‘‘Durbin announces a 9.6 million DOT grant for CTA hybrid buses.’’ http://durbin.
senate.gov/ (accessed June 10, 2008).
Fenno, Richard. 1973. Congressmen in committees. Boston: Little Brown and Company.
———. 1978. Home style: House members in their districts. Boston: Addison Wesley.
Fraley, Chris, and Adrian Raftery. 2002. ‘‘Model-based clustering, discriminant analysis, and density estimation.’’
Journal of the American Statistical Association 97(458):611.
Gabel, Mathhew, and Kenneth Scheve. 2007. ‘‘Estimating the effect of elite communications on public opinion.’’
American Journal of Political Science 51(4):1013–28.
Gelman, Andrew, and Gary King. 1990. ‘‘Estimating incumbency advantage without bias.’’ American Journal of
Political Science 34(4):1142–64.
Gelman, Andrew, and Jennifer Hill. 2007. Data analysis using regression and multilevel/hierarchical models.
Cambridge: Cambridge University Press.
Grassley, Sen. Chuck. 2007. ‘‘Grassley questions big oil’s commitment to lessening US dependence on foreign
oil.’’ http://grassley.senate.gov/ (accessed January 1, 2008).
Gutmann, Amy, and Dennis Thompson. 1996. Democracy and disagreement. Cambridge, MA: Harvard Univer-
sity Press.
Harkin, Sen. Tom 2007. ‘‘Lawmakers make renewable fuels availability, energy efficiency a top priority for Con-
gress.’’ http://harkin.senate.gov/ (accessed January 1, 2008).
Hastie, Trevor, Robert Tibshirani, and Jerome Friedman. 2001. The elements of statistical learning. New York:
Springer.
Hill, Kim Quaile, and Patricia Hurley. 2002. ‘‘Symbolic speeches in the US Senate and their representational
implications.’’ Journal of Politics 64(1):219–31.
Hillard, Dustin, Stephen Purpura, and John Wilkerson. 2008. ‘‘Computer-assisted topic classification for mixed-
methods social science research.’’ Journal of Information Technology and Politics 4(4):31–46.
Hopkins, Daniel, and Gary King. Forthcoming. ‘‘Extracting systematic social science meaning from text.’’
American Journal of Political Science.
Jordan, Michael, Zoubin Ghahramani, Tommi Jaakkola, and Lawrence K. Saul. 1999. ‘‘An Introduction to var-
iational methods for graphical models.’’ Machine Learning 37:183–233.
King, Gary. 1991. ‘‘Constituency service and the incumbency advantage.’’ British Journal of Politics 21(1):
119–28.
Kingdon, John. 1989. Congressmen’s voting decisions. Ann Arbor: University of Michigan.
Kyl, Sen. John. 2007. ‘‘Senate approves Kyl Feinstein provision adding judgeship.’’ http://kyl.senate.gov/
(accessed January 1, 2008).
Lautenberg, Sen. Frank 2007. ‘‘Lautenberg Bill to reverse Bush administration’s weakening of toxic releases
reporting,’’ Press Release.
Lee, Frances. 2008. ‘‘Dividers, not uniters: Presidential leadership and Senate partisanship, 1981–2004.’’ Journal
of Politics 70(4):914–28.
Lipinski, Daniel. 2004. Congressional communication: Content and consequences. Ann Arbor: University of
Michigan Press.
Lugar, Sen. Richard 2007. ‘‘Biotown awarded 1.71 million USDA grant.’’ http://lugar.senate.gov/ (accessed
January 1, 2008).
MacKay, David. 2003. Information theory, inference, and learning algorithms. Cambridge, UK: Cambridge Uni-
versity Press.
Manning, Christopher, Prabhakar Raghavan, and Hinrich Schutze. 2008. Introduction to information retrieval.
Cambridge: Cambridge University Press.
Mansbridge, Jane. 2003. ‘‘Rethinking representation.’’ American Political Science Review 97(4):515–28.
Martin, Andrew, and Kevin Quinn. 2008. ‘‘Markov chain Monte Carlo package (MCMCpack).’’ Software, R
Package.
34 Justin Grimmer

Mayhew, David. 1974. Congress: The electoral connection. New Haven, CT: Yale University Press.
McCombs, Maxwell. 2004. Setting the agenda: The mass media and public opinion. Cambridge: Polity.
McLachlan, Geoffrey, and David Peel. 2000. Finite mixture models. New York: John Wiley & Sons.
McLachlan, Geoffrey, and Thriyambakam Krishnan. 1997. The EM algorithm and extensions. New York: Wiley.
Menendez, Sen. Robert, 2007. ‘‘Lautenberg Bill to reverse Bush administration’s weakening of toxic releases
reporting,’’ Press Release.
Mimno, David, and Andrew McCallum. 2008. ‘‘Topic models conditioned on arbitrary features with Dirichlet-
multinomial regression.’’ Conference on Uncertainty in Artificial Intelligence. Plenary Presentation, Helsinki,
Finland.
Ng, Andrew, Michael Jordan, and Yair Weiss. 2002. ‘‘On spectral clustering: Analysis and an algorithm.’’
Advances in Neural Information Processing Systems 14: Proceedings of the 2002 Conference, Vancouver,
Canada.
Petrocik, John. 1996. ‘‘Issue ownership in presidential elections, with a 1980 case study.’’ American Journal of
Political Science 40(3):825–50.
Porter, Martin. 1980. ‘‘An algorithm for suffix stripping.’’ Program 14(3):130–7.
Quinn, Kevin, Burt Monroe, Michael Colaresi, Michael Crespin, and Dragomir Radev. Forthcoming. ‘‘How to
analyze political attention with minimal assumptions and costs.’’ American Journal of Political Science.
Schaffner, Brian. 2006. ‘‘Local news coverage and the incumbency advantage in the US house.’’ Legislative
Studies Quarterly 31(4):491–511.
Schiller, Wendy. 2000. Partners and rivals: Representation in US Senate delegations. Princeton, NJ: Princeton
University Press.
Sigelman, Lee, and Emmitt Buell. 2004. ‘‘Avoidance or engagement? Issue convergence in US presidential cam-
paigns, 1960–2000.’’ American Journal of Political Science 48(4):650–61.
Simon, Adam. 2002. The winning message: Candidate behavior, campaign discourse, and democracy Cambridge,
UK: Cambridge University Press.
Staff, 2007. ‘‘Sens. Snowe, Collins announce NEG Funding.’’ Bangor Daily News, November 2, 2007 (accessed
June 15, 2008).
Sulkin, Tracy. 2005. Issue politics in congress. Cambridge: Cambridge University Press.
Teh, Y., M. Jordan, M. Beal, and D. Blei. 2006. ‘‘Hierarchical Dirichlet processes.’’ Journal of the American
Statistical Association 101(476):1566–81.
Vinson, Danielle. 2002. Through local eyes: Local media coverage of congress. Creskill, NJ: Hampton.
Watanabe, Satosi. 1969. Knowing and guessing: A quantitative study of inference and information. New York:
Wiley.
Webb, Sen. Jim 2007. ‘‘Senators Warner and Webb announce recommendations for judgeships.’’ http://webb.
senate.gov (accessed January 1, 2008).
Wolpert, D. H., and W. G. Macready. 1997. ‘‘No free lunch theorems for optimization.’’ IEEE Transactions on
Evolutionary Computation 1(1):67–82.
Yiannakis, Diana Evans 1982. ‘‘House members’ communication styles: Newsletter and press releases.’’ Journal
of Politics 44(4):1049–71.
Zhong, Shi, and Joydeep Ghosh. 2003. ‘‘A unified framework for model-based clustering.’’ Journal of Machine
Learning 4(Nov.):1001–37.
35A Bayesian Hierarchical Topic Model for Political Texts