Embed Size (px)
Citation preview
OrganisasiPerburuhanInternasional
dalam Industri Kepariwisataan lebih dari Neraca Satelit Pariwisata
Mengukur Lapangan Kerja
Studi Kasus Indonesia Studi Kasus Indonesia
InternationalLabourOrganization
in the Tourism Industries beyond a Tourism Satellite Account:
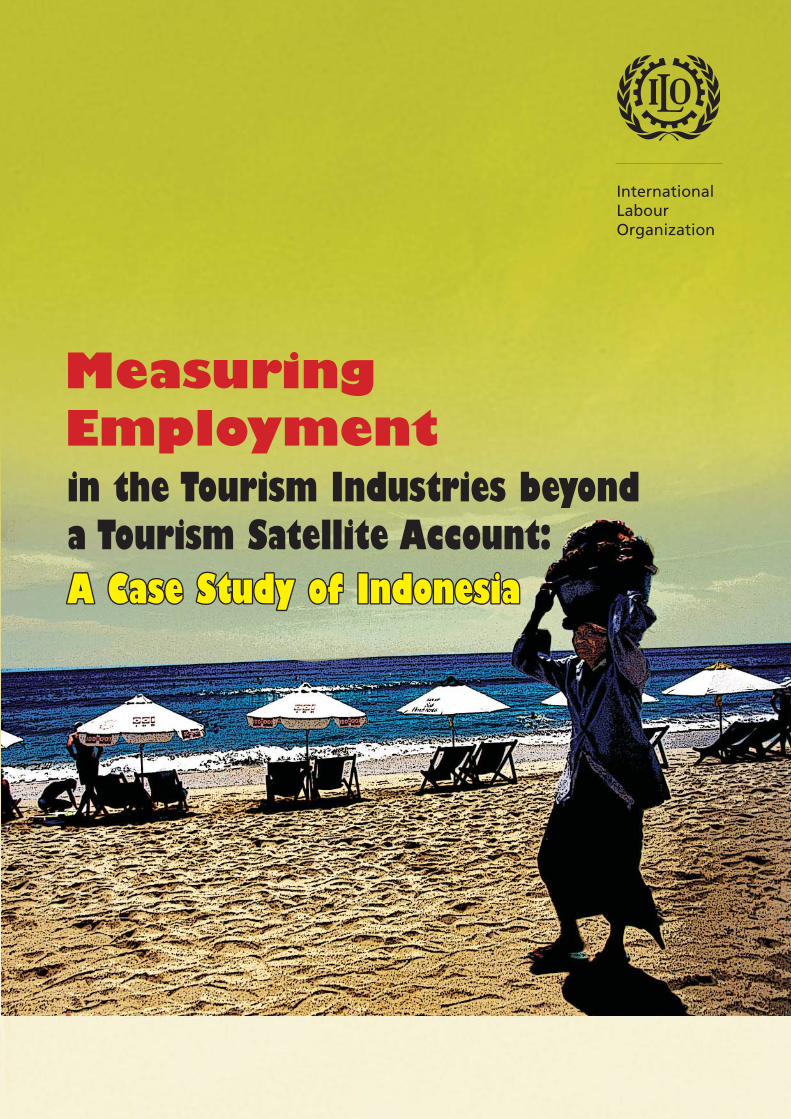
Measuring Employment
A Case Study of IndonesiaA Case Study of Indonesia
Men
guku
r La
pang
an K
erja
dal
am Ind
ustr
i Kep
ariw
isat
aan
lebi
h da
ri N
erac
a Sa
telit
Par
iwis
ata:
Stu
di K
asus
Ind
ones
ia
Measuring Em
ployment in the Tourism
Industries beyond a Tourism
Satellite Account: A
Case Study of Indonesia
cover tourism.indd 1 cover tourism.indd 19/19/2011 4:22:55 PM 9/19/2011 4:22:55 PM
Edited by: Nicki Ferland
in the Tourism Industries beyond a Tourism Satellite Account:
Measuring Employment
A Case Study of Indonesia
2
Measuring Employment in the Tourism Industries beyond a Tourism Satellite Account: A Case Study of Indonesia
Copyright © International Labour Organization 2011
First published 2011
Publications of the International Labour Offi ce enjoy copyright under Protocol 2 of the Universal Copyright Convention. Nevertheless,
short excerpts from them may be reproduced without authorization, on condition that the source is indicated. For rights of reproduction
or translation, application should be made to ILO Publications (Rights and Permissions), International Labour Offi ce, CH-1211 Geneva
22, Switzerland, or by email: [email protected]. The International Labour Offi ce welcomes such applications.
Libraries, institutions and other users registered with reproduction rights organizations may make copies in accordance with the
licences issued to them for this purpose. Visit www.ifrro.org to fi nd the reproduction rights organization in your country.
ISBN 978-92-2-025160-7 (print)
978-92-2-025161-4 (web pdf)
ILO
Measuring Employment in the Tourism Industries beyond a Tourism Satellite Account: A Case Study of Indonesia/International
Labour Offi ce – Jakarta: ILO, 2011
86 p.
Also available in Bahasa Indonesia: Mengukur Lapangan Kerja dalam Industri Kepariwisataan lebih dari Neraca Satelit Pariwisata:
Studi Kasus Indonesia/Kantor Perburuhan Internasional – Jakarta: ILO, 2011
90 p
ILO Cataloguing in Publication Data
The designations employed in ILO publications, which are in conformity with United Nations practice, and the presentation of
material therein do not imply the expression of any opinion whatsoever on the part of the International Labour Offi ce concerning
the legal status of any country, area or territory or of its authorities, or concerning the delimitation of its frontiers.
The responsibility for opinions expressed in signed articles, studies and other contributions rests solely with their authors, and
publication does not constitute an endorsement by the International Labour Offi ce of the opinions expressed in them.
Reference to names of fi rms and commercial products and processes does not imply their endorsement by the International Labour
Offi ce, and any failure to mention a particular fi rm, commercial product or process is not a sign of disapproval.
ILO publications and electronic products can be obtained through major booksellers or ILO local offi ces in many countries, or direct
from ILO Publications, International Labour Offi ce, CH-1211 Geneva 22, Switzerland. Catalogues or lists of new publications are
available free of charge from the above address, or by email: [email protected]
Visit our website: www.ilo.org/publns
Printed in Indonesia
3
Preface
Like any other sector of the economy, employment is an important dimension for characterizing and acknowledging the importance of tourism from productive, social and strategic points of view. Tourism off ers a wide variety of types of occupations, from low-skilled, low value-added to very high-skilled and high value-added. The tourism industries attract top level managers specialised in hotel management, catering and other tourism-related activities.
In order to gain a better understanding of the exact nature and scope of the tourism industries, including tourist behaviour and consumption patterns, it is necessary to have an accurate, effi cient and timely method for compiling and assessing tourism statistics. Tourism statistics play a key role in determining policy and planning through the determination of preferred products as well as in marketing and promotion through the identifi cation of source markets, etc. Notably, tourism plays a crucial role in the creation of productive employment.
However, employment in the tourism industries in general, and the economic value of tourism in terms of employment as a source of productive labour in particular, remain inadequately measured and insuffi ciently studied.
To fi ll this gap, the International Labour Organization (ILO) and the World Tourism Organization (UNWTO) are joining their eff orts to improve the quantitative and qualitative statistical data on tourism-related employment. This collaboration was formalized through an agreement on cooperation signed between the two organizations and has culminated in the implementation of a Joint ILO/UNWTO Project on the Measurement of Employment and Decent Work in the Tourism Industries.
The project has the following three major activities:
(i) Preparation and publication of the joint ILO/UNWTO Technical Guide on Best Practices for Measuring Employment in the Tourism Industries.
(ii) Testing the applicability of the recommendations included in the aforementioned Technical Guide in two countries with developed statistical systems and tourism services.
(iii) Measuring decent work in the tourism industries.
The UNWTO, in collaboration with the Organization for Economic Co-operation and Development (OECD), the European Commission and the UN Statistics Division, has developed a Tourism Satellite Account (TSA), which is a method of measuring the direct economic contributions of tourism consumption to a national
4
Measuring Employment in the Tourism Industries beyond a Tourism Satellite Account: A Case Study of Indonesia
1 UN Statistics Division (UNSD), the Statistical Offi ce of the European Communities (EUROSTAT), the Organization for Economic Co-operation and Development (OECD), and the World Tourism Organization (UNWTO), Tourism Satellite Account: Recommended Methodological Framework 2008 (Geneva: Statistical Commission, 2008).
2 UN Statistics Division (UNSD) and the World Tourism Organization (UNWTO), International Recommendations for Tourism Statistics 2008 (Geneva: Department of Economic and Social Aff airs, 2008).
3 Mike Sharrocks, Implications of the Global Economic Crisis for Tourism Employment: Case Study for Indonesia (Jakarta: ILO Country Offi ce for Indonesia, 2010).
economy. This methodology, described in great detail in the 2008 Tourism Satellite Account: Recommended Methodological Framework (TSA: RMA 2008),1 was formally adopted by the UN Statistical Commission in February 2008.
The TSA consists of ten tables of predominantly economic data that measure international consumption (in cash and in kind), value-added of the tourism industries, tourism value-added, and tourism GDP. However, only one table (Table 7) deals with employment.
In 2008, a revised edition of the International Recommendations for Tourism Statistics (IRTS 2008)2 was adopted by the UN Statistical Commission. IRTS 2008 contains a new section, “Chapter 7: Employment in the Tourism Industries.” This chapter was included in the most recent IRTS with the objective to help countries measure quantitative and qualitative dimensions of employment in order to better understand its impact on the tourism economy in a given country and to complement the limited employment data produced for Table 7 of the TSA.
Indonesia has been constructing a national TSA since 2000. Additionally, the country constructs the TSA for six provinces, including Bali. Indonesia has also recently produced, jointly with the ILO, a series of useful and interesting publications on tourism employment, e.g. Implications of the Global Economic Crisis for Tourism Employment: Case Study for Indonesia.3
Considering Indonesia’s notable achievements in the development of national tourism statistics and the production of data on employment in the tourism industries within the TSA framework at diff erent administrative levels, Indonesia has been selected as a pilot county for the Joint ILO/UNWTO Project. The objective of this Joint Project is to carry out an in-depth study on possible ways of applying the latest international recommendations in the fi eld of tourism statistics to produce new sets of data on employment in the tourism industries beyond the TSA.
Another objective of the study is to present the scope of Indonesia’s Decent Work Indicators and to suggest which of these could be used to measure progress on decent work in the tourism industries.
It is expected that Indonesia’s experience and the results of this study will be used to lay the foundation for a future that includes more consistent, harmonized, regular, rich and comprehensive data on employment in the tourism industries beyond those measures laid out in the TSA.
This Case Study of Indonesia, conceived of by and written under the guidance of Mr. Igor Chernyshev, ILO Department of Statistics, was prepared by Ms. Myra P. Gunawan, Advisor at the Centre for Tourism Planning and Development, Bandung Technological Institute and Mr. Kusmadi Saleh, Former Deputy Head of the National Statistic Agency of Indonesia, and with the support of Mr. Adi Lumaksono, Director for Statistics of Finance, ICT and Tourism at the National Statistic Agency . Mr. Tendy Gunawan, ILO Jakarta Offi ce, provided continual backstopping and effi cient coordination of the preparatory work.
Rafael Diez de Medina Peter Van Rooij Antonio Massieu, ILO Chief Statistician, Director Director Chief UNWTO, Department of Department of Statistics ILO Jakarta Offi ce Statistics and Tourism Satellite Account (TSA)
5
Table of Contents
Preface 3
Table of Contents and Glossary 5
Executive Summary & Recommendations 11
Introduction 15
CHAPTER 1 TOURISM IN INDONESIA 21
1.1 Importance of the Tourism Industries/Sector for Indonesia 21 Tourism and regional development 21 Tourism for national and cultural awareness 22 Tourism as a means for discouraging urbanization 22 Tourism as a means for conservation 22 Tourism, small and medium-size enterprises (SMEs) and jobs 22 1.2 World of Work in Tourism 23 1.3 The Role of the Government in Tourism Development 26 1.4 Tourism Associations and Their Role in Employment Generation 27
CHAPTER 2 THE IMPORTANCE OF TOURISM EMPLOYMENT STATISTICS 29 2.1 The Underlying Indonesian Laws and Regulations 29 2.2 Tourism and Sustainable Development 30 2.3 Beyond the Tourism Industry 31 2.4 The Importance of Employment Statistics as Indicators 31
CHAPTER 3 MEASURING EMPLOYMENT IN THE TOURISM INDUSTRIES IN INDONESIA: CURRENT SITUATION AND CHALLENGES BEYOND TSA 33
3.1 Current Situation 33 3.1.1 Tourism Satellite Accounts: general information 33 3.1.2 Tourism Satellite Account of Indonesia 34 3.1.3. Sources of employment statistics in Indonesia 37
3.2 Beyond the Tourism Satellite Account 40 3.2.1 Employment and informal Sector 40 3.2.2 Inbound-outbound balance sheet 41
6
Measuring Employment in the Tourism Industries beyond a Tourism Satellite Account: A Case Study of Indonesia
3.2.3 Domestic and international tourism 41
3.3 New Agenda for Indonesia Tourism – Needs for Employment Statistics 43
3.4 A Way to Go 45
CHAPTER 4 AN APPROACH FOR COLLECTING A WIDE SET OF DATA ON EMPLOYMENT IN THE TOURISM INDUSTRIES: BENCHMARKING FOR INDONESIA’S TOURISM STATISTICS 49
4.1 Background 49
4.2 The Case of Australia 50
4.3 The Case of Canada 50 4.31 Human Resources Module of CTSA 2009 51
4.4 Lessons Learned from Australia and Canada 51
4.5 The Case of Indonesia 52 4.5.1 Background 52 4.5.2 Preparing the TSA for Indonesia 53 4.5.3 Follow-up steps 54
CHAPTER 5 TOURISM AND DECENT WORK IN INDONESIA 55
5.1 ILO Decent Work Agenda 55
5.2. ILO Decent Work Indicators 55
5.3 Tourism and Decent Work in Indonesia: Present Situation 58
5.4 Proposed DWI for Tourism Sector in Indonesia and Sources of Information 60
CHAPTER 6 CONCLUSIONS AND RECOMMENDATIONS 65
6.1 Conclusions 65
6.2 Recommendations 67
APPENDIX I – AUSTRALIA 69
APPENDIX II – CANADA 71
APPENDIX III – Chapter 7 of IRTS 2008 77
7
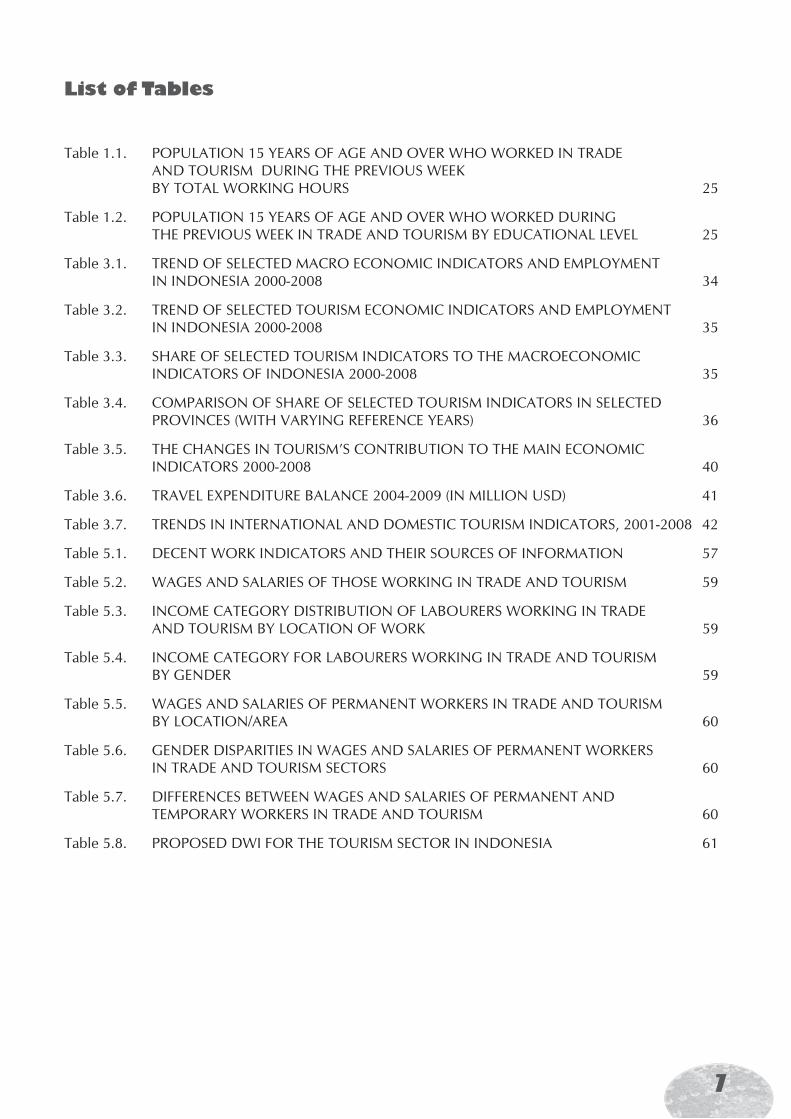
List of Tables
Table 1.1. POPULATION 15 YEARS OF AGE AND OVER WHO WORKED IN TRADE AND TOURISM DURING THE PREVIOUS WEEK BY TOTAL WORKING HOURS 25
Table 1.2. POPULATION 15 YEARS OF AGE AND OVER WHO WORKED DURING THE PREVIOUS WEEK IN TRADE AND TOURISM BY EDUCATIONAL LEVEL 25
Table 3.1. TREND OF SELECTED MACRO ECONOMIC INDICATORS AND EMPLOYMENT IN INDONESIA 2000-2008 34
Table 3.2. TREND OF SELECTED TOURISM ECONOMIC INDICATORS AND EMPLOYMENT IN INDONESIA 2000-2008 35
Table 3.3. SHARE OF SELECTED TOURISM INDICATORS TO THE MACROECONOMIC INDICATORS OF INDONESIA 2000-2008 35
Table 3.4. COMPARISON OF SHARE OF SELECTED TOURISM INDICATORS IN SELECTED PROVINCES (WITH VARYING REFERENCE YEARS) 36
Table 3.5. THE CHANGES IN TOURISM’S CONTRIBUTION TO THE MAIN ECONOMIC INDICATORS 2000-2008 40
Table 3.6. TRAVEL EXPENDITURE BALANCE 2004-2009 (IN MILLION USD) 41
Table 3.7. TRENDS IN INTERNATIONAL AND DOMESTIC TOURISM INDICATORS, 2001-2008 42
Table 5.1. DECENT WORK INDICATORS AND THEIR SOURCES OF INFORMATION 57
Table 5.2. WAGES AND SALARIES OF THOSE WORKING IN TRADE AND TOURISM 59
Table 5.3. INCOME CATEGORY DISTRIBUTION OF LABOURERS WORKING IN TRADE AND TOURISM BY LOCATION OF WORK 59
Table 5.4. INCOME CATEGORY FOR LABOURERS WORKING IN TRADE AND TOURISM BY GENDER 59
Table 5.5. WAGES AND SALARIES OF PERMANENT WORKERS IN TRADE AND TOURISM BY LOCATION/AREA 60
Table 5.6. GENDER DISPARITIES IN WAGES AND SALARIES OF PERMANENT WORKERS IN TRADE AND TOURISM SECTORS 60
Table 5.7. DIFFERENCES BETWEEN WAGES AND SALARIES OF PERMANENT AND TEMPORARY WORKERS IN TRADE AND TOURISM 60
Table 5.8. PROPOSED DWI FOR THE TOURISM SECTOR IN INDONESIA 61
8
Measuring Employment in the Tourism Industries beyond a Tourism Satellite Account: A Case Study of Indonesia
GlossaryList of Abbreviations and Terms in Bahasa (Italic)
AEC ASEAN Economic Community
ASDP River, Lake and Crossing Transportation (Angkutan Sungai, Danau dan Penyeberangan)
ASEAN Association of Southeast Asian Nations
ASITA Indonesia Travel Bureau Association
ASTINDO Indonesia Ticketing Agent Association
BI Bank of Indonesia
BPS Central Bureau of Statistics (Badan Pusat Statistik)
BTDC Bali Tourism Development Corporation
CPA Canadian Productivity Accounts
CSNA Canadian System of National Accounts
CTSA Canadian Tourism Satellite Account
DCWP Decent Work Country Programme
DINAS Sectoral Offi ces of the Provincial/Local Government (e.g. Tourism Offi ce = Dinas Pariwisata)
DKI Jakarta Jakarta Capital Region (Daerah Khusus Ibukota Jakarta)
DPBH Directory of Incorporated Establishment (Direktori Perusahaan Berbadan Hukum)
ECOSOC United Nations Economic and Social Council
ESCAP United Nations Economic and Social Commission for Asia and the Pacifi c
FOF Flow of Fund
FGD Focus Group Discussion
GDP Gross Domestic Product
GNP Gross National Product
HILDIKTIPARI Association of Tourism Higher Education (Himpunan Lembaga Pendidikan Tinggi Pariwisata)
HRM Human Resource Module
IDR Indonesian Rupiah
I-O Input-Output
IRTS International Recommendation on Tourism Statistics
ISCO-2 International Standard Classifi cation of Occupations 1969
JAMSOSTEK Manpower Social Insurance (Jaminan Sosial Tenaga Kerja)
KANWIL Regional Offi ce of the Central Government (Kantor Wilayah)
LFS Labour Force Survey
LWS Labour Wage Survey
9
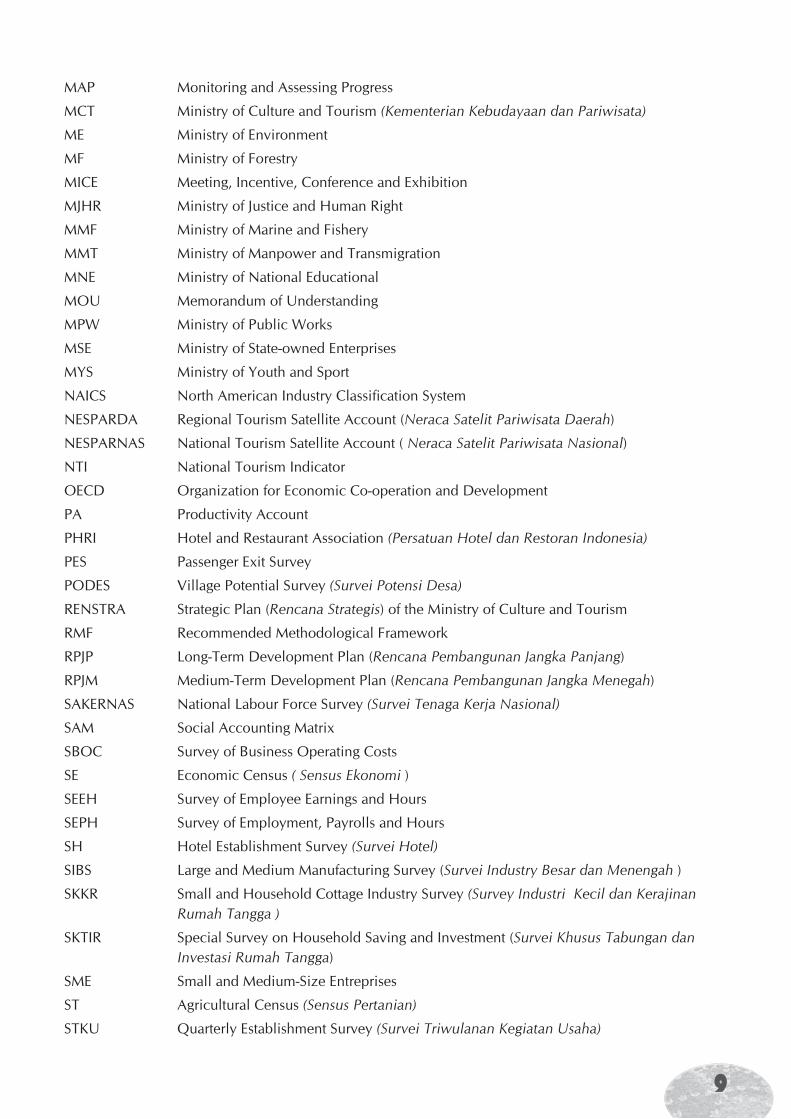
MAP Monitoring and Assessing Progress
MCT Ministry of Culture and Tourism (Kementerian Kebudayaan dan Pariwisata)
ME Ministry of Environment
MF Ministry of Forestry
MICE Meeting, Incentive, Conference and Exhibition
MJHR Ministry of Justice and Human Right
MMF Ministry of Marine and Fishery
MMT Ministry of Manpower and Transmigration
MNE Ministry of National Educational
MOU Memorandum of Understanding
MPW Ministry of Public Works
MSE Ministry of State-owned Enterprises
MYS Ministry of Youth and Sport
NAICS North American Industry Classifi cation System
NESPARDA Regional Tourism Satellite Account (Neraca Satelit Pariwisata Daerah)
NESPARNAS National Tourism Satellite Account ( Neraca Satelit Pariwisata Nasional)
NTI National Tourism Indicator
OECD Organization for Economic Co-operation and Development
PA Productivity Account
PHRI Hotel and Restaurant Association (Persatuan Hotel dan Restoran Indonesia)
PES Passenger Exit Survey
PODES Village Potential Survey (Survei Potensi Desa)
RENSTRA Strategic Plan (Rencana Strategis) of the Ministry of Culture and Tourism
RMF Recommended Methodological Framework
RPJP Long-Term Development Plan (Rencana Pembangunan Jangka Panjang)
RPJM Medium-Term Development Plan (Rencana Pembangunan Jangka Menegah)
SAKERNAS National Labour Force Survey (Survei Tenaga Kerja Nasional)
SAM Social Accounting Matrix
SBOC Survey of Business Operating Costs
SE Economic Census ( Sensus Ekonomi )
SEEH Survey of Employee Earnings and Hours
SEPH Survey of Employment, Payrolls and Hours
SH Hotel Establishment Survey (Survei Hotel)
SIBS Large and Medium Manufacturing Survey (Survei Industry Besar dan Menengah )
SKKR Small and Household Cottage Industry Survey (Survey Industri Kecil dan Kerajinan Rumah Tangga )
SKTIR Special Survey on Household Saving and Investment (Survei Khusus Tabungan dan Investasi Rumah Tangga)
SME Small and Medium-Size Entreprises
ST Agricultural Census (Sensus Pertanian)
STKU Quarterly Establishment Survey (Survei Triwulanan Kegiatan Usaha)

10
Measuring Employment in the Tourism Industries beyond a Tourism Satellite Account: A Case Study of Indonesia
SUB Employee Wage Survey (Survei Upah Buruh )
SUPAS Intercensal Population Survey (Survei Penduduk Antar Sensus)
SUSENAS National Socio-Economic Survey (Survei Sosial Ekonomi Nasinal)
SUSI Small and Household-Establishments Integrated Survey (Survei Usaha Kecil dan Rumah Tangga Terpadu)
TSA Tourism Satellite Account
TSA: RMF Tourism Satellite Account: Recommended Methodological Framework
UNDAF United Nations Development Assistance Framework
USD United States Dollar
11
Executive Summary & Recommendations
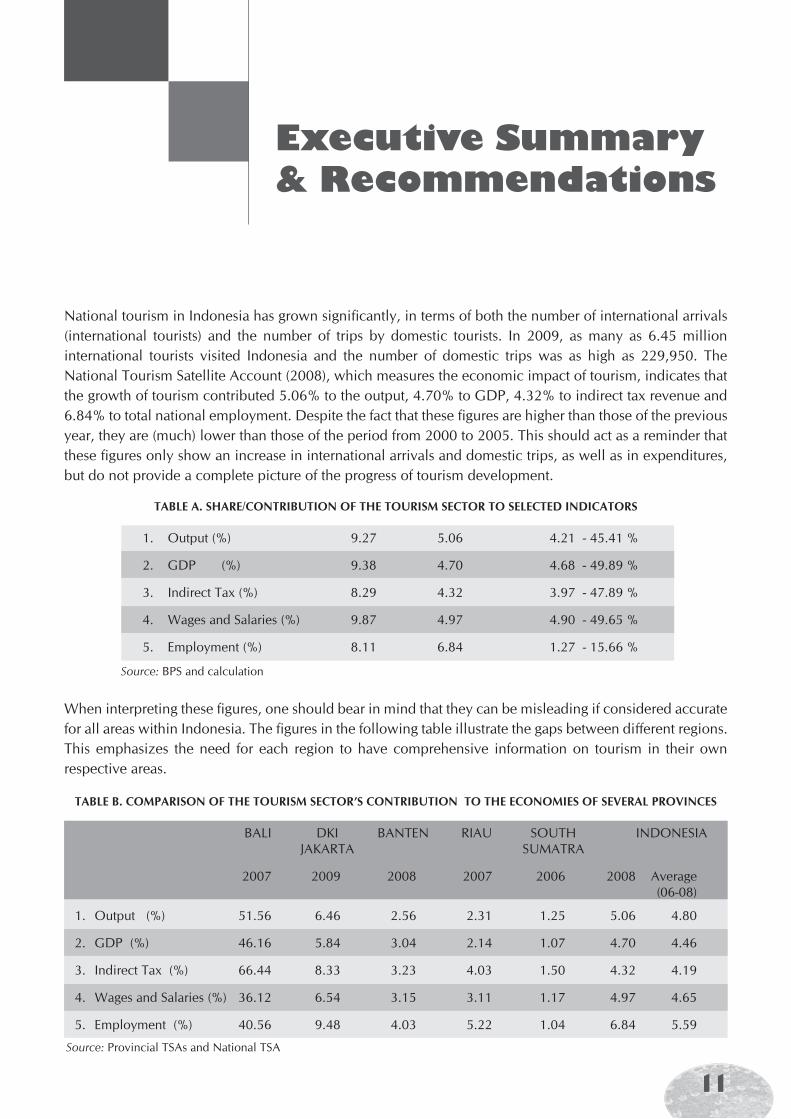
National tourism in Indonesia has grown signifi cantly, in terms of both the number of international arrivals (international tourists) and the number of trips by domestic tourists. In 2009, as many as 6.45 million international tourists visited Indonesia and the number of domestic trips was as high as 229,950. The National Tourism Satellite Account (2008), which measures the economic impact of tourism, indicates that the growth of tourism contributed 5.06% to the output, 4.70% to GDP, 4.32% to indirect tax revenue and 6.84% to total national employment. Despite the fact that these fi gures are higher than those of the previous year, they are (much) lower than those of the period from 2000 to 2005. This should act as a reminder that these fi gures only show an increase in international arrivals and domestic trips, as well as in expenditures, but do not provide a complete picture of the progress of tourism development.
When interpreting these fi gures, one should bear in mind that they can be misleading if considered accurate for all areas within Indonesia. The fi gures in the following table illustrate the gaps between diff erent regions. This emphasizes the need for each region to have comprehensive information on tourism in their own respective areas.
TABLE A. SHARE/CONTRIBUTION OF THE TOURISM SECTOR TO SELECTED INDICATORS
1. Output (%) 9.27 5.06 4.21 - 45.41 %
2. GDP (%) 9.38 4.70 4.68 - 49.89 %
3. Indirect Tax (%) 8.29 4.32 3.97 - 47.89 %
4. Wages and Salaries (%) 9.87 4.97 4.90 - 49.65 %
5. Employment (%) 8.11 6.84 1.27 - 15.66 %
Source: BPS and calculation
TABLE B. COMPARISON OF THE TOURISM SECTOR’S CONTRIBUTION TO THE ECONOMIES OF SEVERAL PROVINCES
Source: Provincial TSAs and National TSA
BALI DKI BANTEN RIAU SOUTH INDONESIA JAKARTA SUMATRA
2007 2009 2008 2007 2006 2008 Average (06-08)
1. Output (%) 51.56 6.46 2.56 2.31 1.25 5.06 4.80
2. GDP (%) 46.16 5.84 3.04 2.14 1.07 4.70 4.46
3. Indirect Tax (%) 66.44 8.33 3.23 4.03 1.50 4.32 4.19
4. Wages and Salaries (%) 36.12 6.54 3.15 3.11 1.17 4.97 4.65
5. Employment (%) 40.56 9.48 4.03 5.22 1.04 6.84 5.59
12
Measuring Employment in the Tourism Industries beyond a Tourism Satellite Account: A Case Study of Indonesia
It is interesting to note that despite a signifi cant increase in the tourism sector in South Sumatra and Riau, its contribution to the economies of these provinces is not as large as one might expect. One of the reasons for this is that the growth is mainly concentrated in the regions’ capital cities and as a result of the domination of forestry, oil and gas in their economies.
Law No. 10/2009 on Tourism and Law No. 13/2003 on Labour confer a mandate on the government to eliminate unemployment and create employment. With regard to this mandate, one of the most signifi cant measures for assessing its progress is employment in the tourism sector. The table above illustrates that the contribution of the tourism sector in terms of employment creation had decreased by 5.66% during the period from 2000 to 2008. Although this decrease was not as high as the decrease in other indicators, it still begs serious attention from all stakeholders.
The existing tourism statistics are not enough to provide a complete picture of the real conditions and performance of the tourism industries. Data on international arrivals are the most comprehensive and usually the most updated, but data on their expenditure are not very reliable as it is still diffi cult to obtain a representative number of respondents to the Passenger Exit Surveys (PES). Data on domestic trips are only available at the national level and, therefore, are not very appropriate to support policy/decision-making at the provincial and municipality/district level. Data on some other indicators are obtained from establishment surveys, which suff er from limited coverage and questions as well as questionable quality. So far, coverage for these establishment surveys has been limited to hotels, restaurants and travel agencies. This might account for the low fi gures in tourism employment. Since regional tourism offi ces under the Ministry were closed, information fl ow from provinces/regions has become scarce. The data vary widely from one region to the other in terms of format, coverage and quality. In general, the development of tourism databases has not been of concern to the provinces, not to mention a priority. Despite the fact that informal sectors and micro/small-scale enterprises have shown a signifi cant contribution to employment creation, especially for the less skilled or (un)educated, the data are not adequate and, in some cases, are even absent.
These fi gures should be an inspiration for follow-up steps, whether formulating policies or developing programmes to improve the conditions of tourism employment. However, applying national fi gures to formulate regional policies may lead developments in the wrong direction.
There is an indication that some jobs in the tourism sector cannot be categorized as “decent work” as they do not provide their workers with adequate income and/or rights.
The study also shows that there is a gap between tourism education institutions and the absorption of their graduates into tourism industries and the public sector.
Some recommendations resulting from a review of the statistics and other studies are as follows:
A. Provincial/Regional Government
i. Develop valid and reliable databases to support the formulation of policies and planning for tourism development programmes in each province/region. These databases should be comprehensive enough to measure the performance of the tourism sector and, therefore, not limited to the number of trips/visits.
ii. Certain provinces/regions in which tourism is a strategic sector need to have a clear, detailed description of their market potential that can provide information for investment. The decision to position tourism as a strategic sector can be based on a number of considerations, including already possessing developed destinations or having limited potential in other sectors.
iii. Constructing a Regional Tourism Satellite Account (NESPARDA) will help regional governments understand the real contribution/role of the tourism sector to their economies.
13
B. The Ministry of Culture and Tourism
i. Together with BPS, determine those activities which belong to the tourism sector, taking international recommendations into account, and determine the country-specifi c activities. This information should be used as a standard reference for regional tourism statistics.
ii. Allocate an adequate budget for improving the quality and coverage of regional tourism databases, either independently or supported by BPS.
iii. Facilitate and support districts/municipalities in preparing their own databases and constructing the regional TSA, particularly by introducing concepts and implementing methodologies.
iv. Strengthen the roles and institutional capacity of data and information centres, so that they are more capable of collecting/accessing regional data, through the development of an integrated network system and operational budget.
v. Develop a database of tourism educational institutions and their graduates, as an initial step towards constructing a manpower development plan for the tourism industries.
vi. Collaborate with BPS and the Ministry of Manpower and Transmigration to tackle employment issues, and partner with diff erent ministries to overcome other tourism issues.
C. BPS, in collaboration with the Ministry of Culture and Tourism
i. Improve tourism data processing from the existing database.
ii. Review/evaluate previous surveys and possibly extend tourism statistics as agreed.
iii. Take the initiative to organize workshops or training sessions on tourism statistics at the provincial level.
D. The Ministry of Manpower and Transmigration
i. Monitor and track tourism workers abroad to ensure that their working conditions are in line with the decent work indicators developed in collaboration with the ILO.
ii. Conduct studies on the eff ectiveness of labour policies and on the implementation of labour laws/regulations for the tourism industries.
Jakarta, May 2011
Myra P. Gunawan & Kusmadi Saleh

14
Measuring Employment in the Tourism Industries beyond a Tourism Satellite Account: A Case Study of Indonesia
15
4 See: International Labour Organization (ILO), Development and Challenges in the Hospitality and Tourism Sector: Issues Paper for Discussion at the Global Forum for the Hotels, Catering and Tourism Sector (23-24 November 2010) (Geneva: International Labour Organization, 2010).
5 For more information see: Igor Chernyshev, Employment in the Tourism Industries: Measurement Issues and Case Studies, Keynote, Session III, the 5th UNWTO International Conference on Tourism Statistics – Tourism: an Engine for Employment (Bali, Indonesia: World Tourism Organization, 30 March –2 April 2009).
6 For more information on the ILO’s Decent Work Agenda, please see: http://www.ilo.org/global/About_the_ILO/Mainpillars/WhatisDecentWork/lang--en/index.htm.
Tourism is extremely labour intensive and is also a signifi cant source of employment. It is among the world‘s top creators of jobs requiring varying degrees of skills and allows for quick entry into the workforce for youth, women and migrant workers. Tourism accounts for 30 percent of the world‘s export services. With regard to the supply chain in this sector, one job in the core hotel, catering and tourism industry indirectly generates roughly 1.5 additional jobs in the related economy. In 2010, the sector‘s global economy accounted for more than 235 million jobs, equivalent to about 8 per cent of the overall number of jobs (direct and indirect), or one in every 12.3 jobs.4 The World Tourism Organization is expecting the sector‘s global economy to provide 296 million jobs in 2019.
In order to understand what is happening in the tourism-related labour markets and develop adequate employment policies and strategies, governments, policy makers and specialists in tourism development need at their disposal comprehensive information on employment and conditions of work in this sector. However, in spite of the fact that tourism’s job-creating potential has long been recognized, employment in the tourism industries has up until now been one of the least studied of all the sectors. Only a handful of countries produce meaningful statistics on employment in the tourism industries.5
This lack of valid data can be explained by the diverse nature of tourism and by the problems involved in collecting reliable data for these industries. Statistics should play an important role in monitoring developments and undertaking diff erent types of analyzes with regard to tourism. Employment in the tourism industries needs to be measured and described in a more consistent way through the development of proper statistical instruments based on international tools and enhanced through international cooperation.
In 2007, with this in mind, the International Labour Organisation (ILO) and the World Tourism Organization (UNWTO) launched a series of statistics-related initiatives geared towards the elaboration of a joint biennial programme of work between the ILO Bureau of Statistics and the UNTWO Department of Statistics and Tourism Satellite Account within the framework of the ILO Decent Work Agenda.6
Introduction
16
Measuring Employment in the Tourism Industries beyond a Tourism Satellite Account: A Case Study of Indonesia
The above steps resulted in a framework of cooperation between the ILO and the UNWTO being approved by the ILO Governing Body at its 301st Session (March 2008) and further ratifi ed by the General Assembly of the UNWTO.
The global objective of the above agreement is to improve and strengthen the cooperation between the two UN agencies in enhancing the national capacity of member states to measure employment in the tourism industries, while recognizing the fundamental role of decent work in the accommodations, food and beverage, and other tourism industries in bringing about social development, assisting in the eradication of poverty, promoting prosperity and encouraging international understanding of ILO standards.
Therefore, the agreement refers to the UNWTO Global Code of Ethics for Tourism and other relevant international labour conventions on fundamental principles and rights at work as well as tourism sector-specifi c conventions and recommendations.
The agreement is an example of the joint activities between UN agencies designed to improve the Delivering as One approach as well as an example of mainstreaming employment and the Decent Work Agenda in the tourism sector.7
One of the areas covered by the agreement is the improvement of national sources and methods of data collection on employment in the tourism industries.
The availability of comprehensive statistics on employment in the tourism industries should enable national stakeholders to analyze or even predict the impact of (or changes in) tourism fl ows and expenditures on employment levels and structures in the diff erent tourism-related industries. This entails linking the supply side of tourism to the demand side, carrying out analyzes at diff erent levels of detail, checking consistency with fi nancial data, illuminating the role of tourism in creating, preserving and diversifying employment, as well as shedding new light on the number, structure and remuneration levels of jobs in the tourism industry.
Further, data on employment should provide valid, good and useful information for socio-economic and tourism policy makers in areas such as labour force and tourism planning, as well as for individual businesses or regions for benchmarking purpose. This data enables decision-makers to focus their actions on maximizing tourism growth and its contribution to employment.
However, as previously mentioned, valid labour statistics on the tourism industries are generally poor or absent.
Consequently, in countries where tourism is one of the major sources of income and employment as well as an important contribution to GDP growth, the lack of statistics on employment in the tourism industries makes it impossible to accurately measure the economic activity of a nation, its productivity, and also the economic value of tourism as a whole.
Given the shortage or non-availability of valid statistics on employment in the tourism industries, measuring progress towards decent work in the tourism sector is impeded, both in the ILO and UNWTO member states and in the tourism sector globally.
The collaboration between these two organizations has culminated in the implementation of a Joint ILO/UNWTO Project on the Measurement of Employment and Decent Work in the Tourism Industries.
The project has the following three major activities:
(i) Preparation and publication of the joint ILO/UNWTO Technical Guide on Best Practices for Measuring Employment in the Tourism Industries.
7 The ILO’s Decent Work Agenda involves providing opportunities for work that are productive and deliver a fair income; ensuring security in the workplace and social protection for workers and their families; enabling better prospects for personal development and social integration; supporting freedom for people to express their concerns, organize and participate in decisions that aff ect their lives; and advocating equality of opportunity and treatment for all.
17
(ii) Testing the applicability of the recommendations included in the aforementioned Technical Guide in two countries with developed statistical systems and tourism services.
(iii) Measuring decent work in tourism industries.
While practically all countries have a system of National Accounts to determine the economic values of GDP, value-added of industries and other economic aggregates, tourism is usually not covered due to it being a demand-side sector. The concept of Tourism Satellite Account (TSA) was put forward to remedy this lack of economic data on tourism. In a TSA, demand/consumption of tourism (a standard measurement of visitor expenditure) is identifi ed, linked to the industry that serves them, and then value-added arising from that expenditure is calculated. Thus, the diff erent industries that serve visitors can then be compiled and added together to establish tourism value-added. For that reason, it serves as an extremely valuable lobbying tool for the sector.
The UNWTO, in collaboration with the Organization for Economic Co-operation and Development (OECD), the European Commission and the UN Statistics Division, developed a Tourism Satellite Account (TSA), to measure the direct economic contributions of tourism consumption to a national economy. This methodology, described in great detail in the 2008 Tourism Satellite Account: Recommended Methodological Framework (TSA-RMA 2008),8 was formally adopted by the UN Statistical Commission in February 2008.
The TSA consists of ten tables of predominantly economic data that measures international consumption (in cash and in kind), value-added of the tourism industries, tourism value-added, and tourism GDP. However, only one of the ten tables (Table 7) deals with employment in the tourism industries and that is only in terms of the number of jobs, hours of work, and full-time equivalent jobs by status in employment.
In 2008, a revised edition of the International Recommendations for Tourism Statistics (IRTS 2008)9 was adopted by the UN Statistical Commission. The IRTS 2008 contains a new “Chapter 7: Employment in the Tourism Industries.”10 This chapter was included in the most recent IRTS with an objective to help countries measure quantitative and qualitative dimensions of employment in order to gain a better understanding of its impact on the tourism economy in a given country and to complement the limited employment data produced for Table 7 of the TSA.
Indonesia has been constructing the national TSA since 2000. Additionally, the country constructs the TSA for six provinces, including Bali. Indonesia has also recently produced, jointly with the ILO, a series of useful and interesting publications on tourism employment, such as Implications of the Global Economic Crisis for Tourism Employment: Case Study for Indonesia.11
Considering Indonesia’s notable achievements in the development of national tourism statistics and the production of data on employment in the tourism industries within the TSA framework at diff erent administrative levels, Indonesia has been selected as a pilot country for the Joint ILO/UNWTO Project. The objective of this Joint Project includes carrying out an in-depth study on possible ways of applying the latest international recommendations in the fi eld of tourism statistics to produce new sets of data on employment in the tourism industries beyond the TSA.
The idea is, therefore, to move from the System of National Accounts (SNA) - TSA approach based on the
8 UN Statistics Division (UNSD), the Statistical Offi ce of the European Communities (EUROSTAT), the Organization for Economic Co-operation and Development (OECD), and the World Tourism Organization (UNWTO), 2008 Tourism Satellite Account: Recommended Methodological Framework (Geneva: Statistical Commission, 2008).
9 UN Statistics Division (UNSD) and the World Tourism Organization (UNWTO), International Recommendations for Tourism Statistics 2008 (Geneva: Department of Economic and Social Aff airs, 2008).
10 See Appendix III for IRTS 2008 “Chapter 7: Employment in the Tourism Industries.”11 Mike Sharrocks, Implications of the Global Economic Crisis for Tourism Employment: Case Study for Indonesia (Jakarta: ILO
Country Offi ce for Indonesia, 2010).
18
Measuring Employment in the Tourism Industries beyond a Tourism Satellite Account: A Case Study of Indonesia
economic or pecuniary side of employment to its human or individual signifi cance, i.e. to collect data not only on the number of jobs but also on the number of persons employed in tourism-characteristic jobs as well as on the working conditions of persons engaged in tourism-characteristic activities including their hours of work (rather than or in addition to the full-time equivalent jobs), their wages and salaries, their occupation and education, whether they are engaged in paid or self-employment, etc.
Another objective of the study is to present the scope of Indonesia’s Decent Work Indicators and suggest which of these could be produced to measure progress on decent work in the tourism industries.
This publication is addressed to national producers of tourism statistics who would like to upgrade and/or enhance their methods used for data collection on employment in the tourism industries. It is also recommended to policy makers and specialists in tourism development to better understand and analyze the world of work in tourism and to develop tourism-specifi c labour market policies geared towards reducing decent work defi cits in the tourism sector.
The recommendations from this Case Study of Indonesia may be used by tourism policy makers within the ASEAN member states to better understand the processes taking place in the tourism labour markets of its members and to facilitate the process of integration with the ASEAN Economic Community (AEC) by the horizon of 2015.
This publication addresses the special needs of the Ministry of Culture and Tourism in trying to understand how the data is currently being collected and how it could be further improved in order to get a better understanding of the employment situation in the tourism industries.
Measuring Employment in the Tourism Industries Beyond a Tourism Satellite Account: A Case Study of Indonesia consists of six chapters and three appendices. Brief synopses of these sections follow:
Chapter I presents the general condition of tourism in Indonesia including its role in the world of work, the employment conditions in tourism, and also descriptions of the government ministries concerned with tourism and of the tourism associations.
Chapter II refers to existing laws advocating the importance of employment as an indicator of tourism development. Chapter II stresses that tourism performance is also dependent on the role of the public sector; therefore, disseminating tourism employment information among the public sector is mentioned as a point of attention.
Chapter III reviews the growth of tourism’s economic role from the available TSAs at both the national and provincial levels, thus demonstrating the importance of the TSA for policy input. Determining the challenges, Chapter III tries to defi ne what needs to be done in the future.
Chapter IV outlines Indonesia’s experience in preparing the TSA, referring to lessons learned from Australia and Canada.
Chapter V refers to the Decent Work Indicators identifi ed in the ILO’s previous work and revises these indicators to the context of tourism, identifying sources of information for measuring them.
Chapter VI summarizes the fi ndings of the case study, off ering some recommendations for follow up steps and proposing a new direction towards better statistics. These actions are necessary for planning and policy formulation and emphasize tourism employment statistics and the strategic importance of developing tourism databases at the national, regional and local levels.
Appendix 1 contains a succinct description of the method used in Australia to measure the number of persons employed in the tourism industries.
Appendix 2 presents the Canadian Human Resource Module for the Canadian Tourism Satellite Account. According to the ILO, Statistics Canada compiles one of the most comprehensive time series on employment in the tourism industries. It should be noted that currently Statistics Canada and the
19
Canadian Tourism Human Resource Council are jointly developing an approach to the implementation of relevant Chapter 7 recommendations from IRTS 2008 to produce comprehensive data sets characterizing persons employed in the tourism industries.
Appendix 3 contains “Chapter 7: Employment in the Tourism Industries,” taken from the 2008 International Recommendations for Tourism Statistics developed by the UNWTO.
This study is based on previous ILO studies and undertakings,12 TSA analyzes of six provinces across the archipelago and Indonesia as a whole, as well as discussions with individuals from tourism industries and associations. The authors’ personal experiences are also foundational, both as scholars in tourism planning at the national, regional and local levels and as the former Head of the Statistical Department at Biro Pusat Statistik (BPS), the Central Bureau of Statistics.
In writing this Case Study, special attention has been given to “Chapter 7: Employment in the Tourism Industries” of the International Recommendations for Tourism Statistics 2008, which describes concepts, defi nitions and basic categories of employment in the tourism industries from a general statistical rather than a specifi c national accounts perspective. It also provides insight into a broader range of indicators on tourism industries which could eventually be incorporated into a TSA within an expanded employment data integration framework.
12 These studies and undertakings include: Implications of the Global Economic Crisis for Tourism Employment: Case Study for Indonesia, Job Opportunities for Youth (JOY) Project, ILO Country Offi ce for Indonesia, December 2009 and Monitoring and Assessing Progress on Decent Work in Indonesia, National Background Study by Diah Widiarti, ILO Country Offi ce for Indonesia, “Monitoring and Assessing Progress on Decent Work”(MAP), 2010.

20
Measuring Employment in the Tourism Industries beyond a Tourism Satellite Account: A Case Study of Indonesia
21
1.1 Importance of the Tourism Industries/Sector for Indonesia
Tourism, as a major sector in the world economy, has become an economic mainstay for both developed and developing countries, including Indonesia. In the past, the role of tourism in Indonesia has mainly been measured through foreign exchange earned from the expenditure of inbound tourists. Recently, Indonesia has placed more attention on domestic tourism, which has proved to be a major source of tourism expenditure. Even though the average expenditure per domestic tourist is quite low, the total expenditure of domestic tourists in Indonesia proved to be bigger than the total value of international tourists’ expenditure, which is common for big countries. If domestic tourism is included with the international arrivals fi gures, Indonesia will be on the top ten list of most visited countries in the world (Eijgelaar, 2010). Total expenditure of the 6.4 million international tourists amounted to IDR 80.46 trillion (approximately USD 8.59 billion) and placed fourth13 as foreign exchange earnings after oil and gas, coconut oil and processed rubber. In contrast, domestic expenditure amounted to IDR 119.17 trillion (USD 12.72 billion).
Even so, tourism is not an end, but rather a means to achieve the development goals of the country as well as for the population at large. Foreign exchange earnings and income from domestic tourism expenditure are not the only indicators used to measure the importance of tourism in Indonesia. Besides the economic dimension, tourism in Indonesia is also expected to play a socio-cultural and political role. Over time, starting from early Independence until the present, the importance of tourism has shifted dynamically. Originally playing a political role, tourism has become increasingly important for the economy and more recently, has played a growing socio-cultural role. As a result, community, rather than politics or the economy, has become the subject of development. In the future, the economic role of tourism will become more strategic as the primary sector deposits are decreasing; tourism will be expected to play a greater role in non-oil and gas foreign exchange earnings.
Tourism and regional development
Since tourism can and may be developed in regions with no natural resources for primary or manufacturing industries but with natural beauty and socio-cultural uniqueness (possibly in remote areas), tourism is also expected to play a role in regional development and to decrease the imbalances among diff erent regions.
Tourism in IndonesiaChapter 1
13 It was ranked 6th in 2006 and 5th in 2007.
22
Measuring Employment in the Tourism Industries beyond a Tourism Satellite Account: A Case Study of Indonesia
Tourism could function as an engine of growth for less developed areas that are blessed with natural and/or cultural attractiveness (resources for tourism development), if provided with infrastructure and market access.
Tourism for national and cultural awareness
Domestic tourism in Indonesia is steadily improving with the increase in the disposable income of the Indonesian middle class and the development of infrastructure. The government prioritizes tourism to encourage understanding between diff erent population groups living in diff erent areas/regions, encouraging unity and love for the country. It is important for a country with a diverse population and numerous ethnic groups with diff erent traditions and cultures (which has the potential to encourage confl icts) to highlight tourism from the perspective of socio-cultural diff erence, i.e. what makes one region attractive for people from other regions. While the economic dimension of tourism is measurable, its socio-cultural and political roles are more diffi cult to measure. Tourism could also become a means for increasing the understanding of the country itself amongst Indonesians.
Tourism as a means for discouraging urbanization
In the context of tourism development, in accordance with their general/macro policies of pro-growth, pro-jobs, pro-poor and pro-environment, the government has adopted a community-based tourism concept. This concept, which states that communities living at or near tourist destinations are expected to play an active role in tourism industries and benefi t appropriately from tourism in their localities, is becoming increasingly important. Rural tourism is expected not only to create employment and jobs for the locals, but also to play an indirect role in decreasing the tendency towards urbanization. Tourism can also improve the value-added to other sectors, like in the case of agro-tourism.
Tourism as a means for conservation
Tourism might occur anywhere from the big metropolitan areas with international access to the most remote areas with very limited access, including protected natural reserves and cultural heritage areas. The development of nature (or eco-) tourism in these areas and at cultural heritage sites has signifi cant educational value, in that it helps people understand the importance of protecting both nature and cultural heritage. Even though these kinds of benefi ts have not been very eff ective as of yet, in some cases there are already lessons learned in the form of good and best practises that can be replicated elsewhere. Those protected areas in highly populated regions have the greatest market opportunities, while those in remote areas still have to face the threat of illegal exploitation of their tourism resources caused by a lack of supervision and a need for resources. The government income from market opportunities may help conserve the areas which provide jobs and income for the community, but at the same time the growing demand for eco-tourism also puts pressure on the environment’s carrying capacity.
Tourism, small and medium-size enterprises (SMES) and jobs
The level of tourism development in regions/provinces throughout Indonesia are often described by the scale and number of investments; the number of formal establishments, including resort-like developments, hotels and other accommodations; restaurants and cafés; amusement and recreation centres; theme parks and other
There is no such knowledge of the nation as comes of traveling it, of seeing eye to eye its vast extent, its various and teeming wealth, and above all its purpose-fi lled people.
(Samuel Bowles, Across the Continent, 1865)
23
formal establishments. The former and present government allows micro and small informal undertakings providing goods and services to tourists to fl ourish. Reports on the number of informal establishments do not exist since they can open and close their businesses any time they wish. Although these micro and small scale, mainly informal, businesses may not create income for the government, their existence has been meaningful for the lower-end tourists and also for absorbing the labour supply and creating jobs for certain population groups, thus reducing poverty and decreasing the work of the government, who is tasked with creating employment for a population in need. Total wages and salaries in tourism amounted to IDR 70.42 trillion (USD 7.37 billion) which was 4.64% of the national total (2008).
The tourism paradox in the country is that, on the one hand, Indonesia has to compete internationally with both emerging and established destinations to gain a share of the international market. They need, therefore, professional practises for quality standards of services. On the other hand, the country faces a problem of poverty and needs to fi nd/create jobs for the most disadvantaged population, who often have low educational attainment and, in many cases, inappropriate competencies to fi ll the open opportunities. In 2008, tourism contributed 6.98% to the total national employment.
The fact that tourism demand in Indonesia varies from the high-end tourism market to the lowest-end can, in one way or another, be considered a blessing. The higher-end tourism with higher expenditure has a large multiplier eff ect that covers a whole range of activities in the more limited clustered locations, providing jobs mostly for educated or well-trained persons, while the lower-end market is more geographically dispersed. Although the multiplier eff ect is lower, it covers wider areas and includes the informal sector of the local economy, creating jobs for the less and least educated or less (and even un-) trained. Tourism activities have, therefore, created not only jobs for the educated/well-trained, but also for those with minimum educational attainment who would otherwise have diffi culties entering the labour market.
The size and coverage of domestic tourism in the country has opened opportunities for locals to create their own jobs, producing many diff erent goods and services for tourists. In fact, some of these entrepreneurs, starting with tiny businesses, have grown into international players. Some examples of this growth can be seen with packaged snacks, crafts and even traditional cultural shows which attract international tourists. But most of locals are still working in small and micro establishments or as informal workers. Many food and handicraft producing activities have involved informal workers, which include a signifi cant if not dominant share of females, who work informally around their additional household and reproductive responsibilities.
Even though in many cases the income generated from informal labour is not much, for the poor to very poor families, this small amount of income will make a meaningful contribution by either enabling them to send their children to school or in securing opportunities that would otherwise be unaff ordable (guide training, community empowerment programmes, etc).
In economic terms, tourism has had an eff ect on the production of good and services, which constitute 4.81% of the total national fi gure, and has impacted the sector value-added, which is 4.49% of the Indonesia’s GNP. Tourism has also contributed 4.25% of the national income from taxes (BPS, 2008).
1.2 The World of Work in Tourism
Tourism is known as a labour intensive sector, which may involve the most well-trained and experienced persons as well as persons with no experience or training at all. Consequently, it also off ers high salaries at one extreme and low pay at the other.
24
Measuring Employment in the Tourism Industries beyond a Tourism Satellite Account: A Case Study of Indonesia
The world of work in tourism can be seen from two diff erent perspectives. From a positive angle, some say that working in the tourism industry is enjoyable because of the work in nice places and the opportunity to meet with happy, leisurely people. Guides as well as tour leaders may enjoy their experiences in interesting places as much as the tourists. Working in hotels with air conditioning may be considered better than working in factories or other hectic places. One might also look at the seasonal characteristic of tourism as a positive opportunity; a freelancer or part-time tour guide or food vendor, for instance, can make extra income during the tourist season. From our observations, it was noted that many women managing households/freelancers are employed or running a successful tourism-related business while also accomplishing their additional tasks at home.
From the other perspective, a tourism-related job may be an uncertain opportunity for those who really need full-time employment to support a decent living. For some, it may seem unfair that tourism employees are working hard while others are enjoying their holiday or weekend. In some cases, such as 24 hour businesses like the hotel industry, an employee may not be able to refuse night shifts, which may create diffi culties for some people, especially women in certain lifecycles. Selections of jobs in the tourism industry are just less appropriate for pregnant women, due to the heavy lifting in a hotel kitchen, for instance. The routines of tourism jobs, like visiting the same places over and over as a tour guide, even though it may be a nice place, is not as interesting as one may think; boredom may be a cause of the high turn over rate in the tourism industries. There are many cases of disagreement and confl ict between workers unions and the management of tourism-related companies; this is an indication of worker’s dissatisfaction with working conditions caused by gaps between workers expectations for their salary, paid holidays, working hours and other social benefi ts and the company’s unwillingness to pay or fulfi l the workers’ expectations.
Statistic’s from Indonesia’s Tourism Satellite Account (TSA) show that those working in tourism related industries are predominantly high school graduates or less. Only 14.39% have graduated from institutions of higher learning.14 At the provincial level, where there is a wider variation, these conditions may diff er. In Central Sulawesi, for instance, the proportion of those with higher education is only 3.66%, and more than 55% are somewhere in between being a primary school dropout or only having a high school education.15
Over 90% of the jobs are created to directly serve tourists. Investment-related and other activities, including marketing and promotions are neglected.16
Even though the government has issued a law concerning minimum wages for labour, there is still the possibility that in smaller companies, minimum wage legislation may not be eff ective for those with only high school diploma or less due to the imbalances between supply and demand.
In smaller companies with fewer employees, there is, unfortunately, no union for the workers, though they sometimes receive social security through an existing system like Social Security for Labourers (Jaminan Sosial Tenaga Kerja - JAMSOSTEK).
It has been declared in a Labour Law that those who have worked for 6 consecutive years are eligible for one full month of paid holidays in their 7th and 8th year. This law, though, is not fully eff ective yet. Some companies have given longer-term employees an additional day or so of annual leave, but they cannot aff ord to lose their experienced workers for longer periods of time.
To a certain extent, opportunities for employment are often temporary. This may be caused by the fact that tourism is seasonal in nature. The diversity of the market segment for Indonesia, especially the domestic market, particularly the short school quarterly holidays, long weekends and multicultural holidays (related to diff erent religions: Idul Fitri, Christmas, Nyepi and others), keep business going.
14 BPS, National Tourism Satellite Account of Indonesia.15 BPS, Tourism Satellite Account of Sulawesi Tengah.16 BPS, National Tourism Satellite Account of Indonesia, 2003.
25
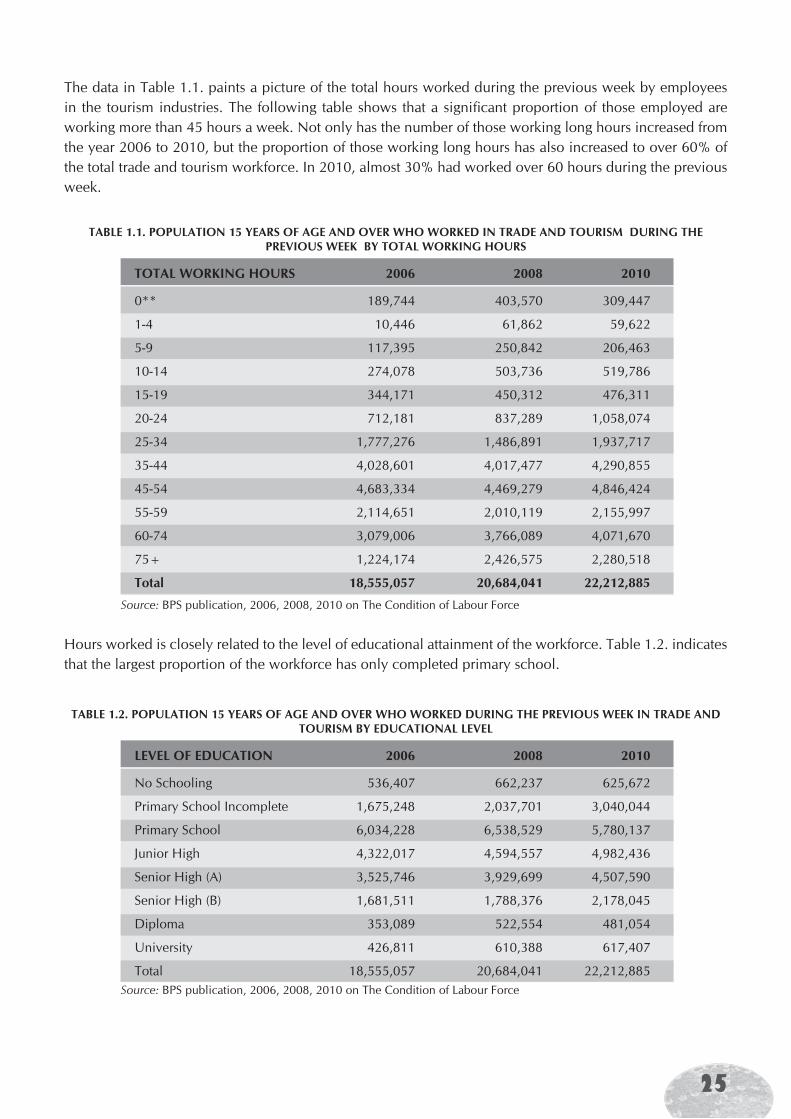
The data in Table 1.1. paints a picture of the total hours worked during the previous week by employees in the tourism industries. The following table shows that a signifi cant proportion of those employed are working more than 45 hours a week. Not only has the number of those working long hours increased from the year 2006 to 2010, but the proportion of those working long hours has also increased to over 60% of the total trade and tourism workforce. In 2010, almost 30% had worked over 60 hours during the previous week.
TABLE 1.1. POPULATION 15 YEARS OF AGE AND OVER WHO WORKED IN TRADE AND TOURISM DURING THE PREVIOUS WEEK BY TOTAL WORKING HOURS
Source: BPS publication, 2006, 2008, 2010 on The Condition of Labour Force
TOTAL WORKING HOURS 2006 2008 2010
0** 189,744 403,570 309,447
1-4 10,446 61,862 59,622
5-9 117,395 250,842 206,463
10-14 274,078 503,736 519,786
15-19 344,171 450,312 476,311
20-24 712,181 837,289 1,058,074
25-34 1,777,276 1,486,891 1,937,717
35-44 4,028,601 4,017,477 4,290,855
45-54 4,683,334 4,469,279 4,846,424
55-59 2,114,651 2,010,119 2,155,997
60-74 3,079,006 3,766,089 4,071,670
75+ 1,224,174 2,426,575 2,280,518
Total 18,555,057 20,684,041 22,212,885
Hours worked is closely related to the level of educational attainment of the workforce. Table 1.2. indicates that the largest proportion of the workforce has only completed primary school.
TABLE 1.2. POPULATION 15 YEARS OF AGE AND OVER WHO WORKED DURING THE PREVIOUS WEEK IN TRADE AND TOURISM BY EDUCATIONAL LEVEL
Source: BPS publication, 2006, 2008, 2010 on The Condition of Labour Force
LEVEL OF EDUCATION 2006 2008 2010
No Schooling 536,407 662,237 625,672
Primary School Incomplete 1,675,248 2,037,701 3,040,044
Primary School 6,034,228 6,538,529 5,780,137
Junior High 4,322,017 4,594,557 4,982,436
Senior High (A) 3,525,746 3,929,699 4,507,590
Senior High (B) 1,681,511 1,788,376 2,178,045
Diploma 353,089 522,554 481,054
University 426,811 610,388 617,407
Total 18,555,057 20,684,041 22,212,885
26
Measuring Employment in the Tourism Industries beyond a Tourism Satellite Account: A Case Study of Indonesia
1.3 The Role of the Government in Tourism Development
The role of the government in tourism development and growth in Indonesia is not limited to the role of the Ministry of Culture and Tourism alone. Like in any other developing country, the government has played an important role in the initiative for tourism development and growth.
In Indonesia, the role of the government in tourism development and growth is divided among the Ministry of Culture and Tourism (MCT) and other Ministries, as well as the provincial and local/district governments.
There has been a signifi cant shift in the eff ectiveness of the central government’s role in tourism development and growth since before and after the 2004 enactment of Law No. 32 on Regional Governance. Since then, the central government is more focused on facilitation and control, while operational matters like permit issuance has been transferred to local governments.
According to Law No. 10 (2009) on Tourism in paragraph 23, the central and regional governments are responsible for:
i. The provision of information, legal protection, safety and security for tourists;
ii. Creating a conducive investment climate, which includes equal opportunity as well as facilitation and assurance of law enforcement;
iii. Maintenance, development and conservation of potential assets as tourists attractions; and
iv. Supervision and control in order to avoid the negative impact of tourism on communities, and responding to these impacts when necessary.
The role of the government basically follows a hierarchy of authority as arranged in the law. The authority of the central, provincial and local governments is described in Chapter VII, Paragraph 28-30 of the Law on Tourism, which covers a range of topics, such as plan preparation; legitimization of plans and standards, guidance and criteria for monitoring and supervising the system; maintaining, developing and conserving government asset potential for tourism development; as well as facilitating tourism promotion.
The central government is also responsible for the formulation of policies on human resources development.
The role played by the Ministry of Culture and Tourism (MCT), as the main institution in charge of tourism, includes the following:
i. General Directorate for Marketing, in charge of international and domestic promotions as well as image and location marketing;
ii. General Directorate for Destination Development, covering the function for product development, industry development, community development and standardization;
iii. General Directorate for History and Heritage, in charge of the protection and development of heritage assets;
iv. General Directorate for Cultural Values, Art and Films, in charge of preserving core cultural values and control over production and import of fi lms;
v. Training and development for research on Culture and Tourism to support the policy making processes; and
vi. International cooperation, such as regulating institutional memberships in international organizations like the UNWTO, the Pacifi c Asia Travel Association (PATA) and others.
There are many other Ministries which contribute or are related to the development, growth and control of tourism in Indonesia. Among others, they include:
27
Ministry of Environment (ME), which deals with the environmental impact control of big establishments and activities, including tourism.
Ministry of Forestry (MF), which manages National Parks, Nature Tourism Parks, Hunting Parks and Wildlife Parks.
Ministry of Marine and Fisheries (MMF), which manages sea parks, small islands and coastal regions related to marine tourism.
Ministry of Public Works (MPW), which deals with infrastructure development, including the rehabilitation of government-owned heritage buildings.
Ministry of National Education (MNE), which regulates the policies on the national education system, as well as supervises and controls their implementation. Through their policies, schools are encouraged to bring students travelling under the teacher’s supervision.
Ministry of Youth and Sport (MYS), in charge of sporting events, both national and international. Although the country does not consider this Ministry to be tourism-related, they have to a certain extent contributed to the creation of tourism in places where sporting events are taking place, such as the forthcoming Asian Games in South Sumatra and the National Games (Pekan Olahraga Nasional) in Riau.
Ministry for State Enterprises (MSE), manages various kinds of tourism-related businesses, such as the airline industry or the Bali Tourism Development Corporation (BTDC), in charge of managing and developing the Nusa Dua Resorts in Bali, as well as helping to develop Tourism Development Corportations in other locations. The national airline and its sister company operate hotel and travel businesses as well. The airport management organization is also under this ministry. In general, their main objectives are control over strategic sectors and initiating growth in prioritized locations.
Ministry of Justice and Human Rights (MJHR), in charge of visa matters.
There are many other Ministries or government institutions related to tourism. For instance, the Ministry of Manpower and Transmigration (MMT), in charge of employment, is concerned with matters related to tourism employment.
1.4 Tourism Associations and Their Role in Employment Generation
Tourism associations can be classifi ed as employers’ associations, professionals’ association and workers’ associations. Employers’ associations are by far the most popular among tourism associations for various reasons, and are as old as Indonesia’s Independence. The Hotel and Restaurant Association (PHRI) and the Indonesia Travel Agent Association (ASITA) are among the most popular and oldest associations. More recently, more heterogeneous industry associations have emerged, such as the Association of Marine Tourism Industry (Gabungan Pengusaha Wisata Bahari or GAHAWISRI), in which businesses belonging to many diff erent industries contributing to marine tourism can become members, including hotels, airlines, cruise lines, travel services and others. Homogeneous associations have also developed where selection of members is more specifi c, such as the Casa Grande, a four and fi ve star hotel association, the Bumi Melati, a non-classifi ed hotel association in Bandung, the ASTINDO, an outbound ticketing enterprises association, etc. These associations are all working towards a better bargaining position for their respective members in terms of government policies. They are, essentially, employers’ associations for the benefi t of employers. Tourism associations, as mentioned above, are usually concerned with the interests of their members and work with the government in search of support for undertaking their programme activities, which may vary from marketing to human resources development and regulation issues. Associations in the travel industry at the national level, for instance, may off er skills training and then regional associations can pass this information regarding the availability of training to their respective members.
28
Measuring Employment in the Tourism Industries beyond a Tourism Satellite Account: A Case Study of Indonesia
Professionals’ associations include the association of Hotel Marketing Managers, the Association of Cooks, for examples, and many others. Their goals and objectives are mainly to improve professionalism in their respective fi elds through training and/or sharing experiences for individual benefi ts and a better position in their respective places of work. This may include facilitation for certifi cation.
The third association, workers’ associations are, theoretically, working for their members’ interests in the workplace, most commonly for the right return on their work, in line with the related laws and regulations. These might include minimum wages, decent working hours, the right to annual and other kinds of leave, the right to become a member of a workers’ associations, etc.
Another kind of association that operates under the guise of ‘creating’ employment indirectly is the Association of Tourism Higher Education (Himpunan Lembaga Pendidikan Tinggi Pariwisata – HILDIKTIPARI). This association is supposedly interested in increasing the employment prospects of their graduates. However, it is diffi cult to measure where these students fi nally end up because the schools do not maintain formal records on their graduates after they have completed their studies. Graduates from the best hotel schools are aiming to work in hotels with higher classifi cations, preferably overseas. Those who graduate from special training/education or who have enough experience are also very keen to work on cruise ships. Trained or educated workers are aiming for higher wages and salaries that smaller scale establishments cannot aff ord to pay. For these reasons, there are fewer opportunities for smaller scale establishments to employ trained or educated workers. Thus, the tourism industry in Indonesia is locked into a vicious circle. In addition to these issues, workers’ mobility is high and turnover is common, especially amongst the most highly trained.
29
The most popular and easiest approach for measuring the performance of tourism development is, thus far, using the indicator for total arrivals of international tourists, the number of trips for domestic tourists and their expenditures. Number of outbound is also used, but not as often. Although these are important indicators for positioning Indonesia in the global and regional scenes, those fi gures do not measure the performance of tourism in real terms. Performance needs to be related to the goals and objectives of tourism development in the country. Tourism may be defi ned diff erently for diff erent countries and its meaning may also diff er between developing and developed countries.
2.1 The Underlying Indonesian Laws and Regulations
As stated in Law No. 10 (2009) on Tourism in Chapter II, paragraph 3, the goals of tourism development for Indonesia are manifold and consist of not only economic growth but also community welfare; poverty alleviation; overcoming unemployment; resource conservation; cultural development; encouraging love for the country, national identity and unity; and promoting international friendship among nations. Understanding the philosophical foundation of this law, community is the subject of development, which includes tourism-related development. Although community welfare is one of the foremost goals to be attained via development, in which tourism is considered a tool for achieving this, it is not the ultimate goal in itself. When community welfare is the defi nitive goal, it includes poverty alleviation and employment of the workforce, in addition to access to education and health services.
It is also stated in Labour Law No. 13 (2003) in Chapter VII, paragraph 9-(1) that it is the responsibility of the government to expand the opportunities for jobs, meaning employment creation. Employment in this sense may mean direct employment as public servants as well as employment in the private sectors, supported by government policy and regulations which are benefi cial for both the job providers and the job seekers, thus creating a healthy labour market.
Employment statistics in tourism are important for showing how much tourism has contributed to the achievement of development goals, and thus tourism development success should become one of the common indicators for measuring development.
The Importance of Tourism Employment Statistics
Chapter 2
30
Measuring Employment in the Tourism Industries beyond a Tourism Satellite Account: A Case Study of Indonesia
Data on employment not only provides information on how much tourism has contributed to the unemployment elimination programme at all levels (national, regional and local), but also provides a picture of community welfare and poverty eradication. Employment statistics can illustrate the benefi ts that tourism provides for the community, particularly because tourism development is not only for satisfying tourists, but more importantly for the impact that it can have on people’s welfare. In this regard, tourism statistics depict the conditions of work in tourism taking into account their hours worked, their wages and other data on persons employed in the tourism industries including their gender, age and educational background/attainment. These are appropriate indicators for understanding how far the community/population is directly impacted by the presence of tourism in their locality.
Employment statistics also illustrate the eff ectiveness of related policies and regulations for creating and maintaining a healthy labour market. Employment statistics supply policy makers with data for making better policy assessments, help them evaluate the condition of work as it relates to regulations and understand whether the goals of the related policy have been met or whether there is a policy or market failure. In summary, tourism statistics help us understand:
i. the underlying issues: the dominance of most workers low level of education, for instance;
ii. the condition of work: hours worked, level of pay, seasonality of employment, etc,;
iii. which education and training programmes are needed and where productivity development is required; and
iv. the whole picture of the labour market: not only how many are unemployed or underemployed, but which population groups are un/underemployed. These indicators are the most relevant for understanding how much we have contributed to one of the major tourism development goals: overcoming unemployment.
Employment in tourism is important for many reasons. Tourism has been placed, with others, as a priority sector in the national development scheme. The published Presidential Instruction No. 16 (2005) on Culture and Tourism Development Policy states that 20 Ministries/Ministry-level Government Institutions, all Governors, Bupati (District Heads) and Mayors are to support MCT in achieving the government’s tourism development goals. The Ministry of Manpower and Transmigration is specifi cally assigned the task of supporting overseas promotion by improving the quality of training for migrant workers and the overall quality of the tourism work force. Also, the Ministry for National Education is, among others, instructed to improve the quality of education for workers in the tourism industries.
2.2 Tourism and Sustainable Development
Tourism is a major sector in the Indonesian economy with varying degrees of importance in regional/provincial economies.
The concept of sustainable development has been introduced through seminars, conferences and articles in both media and academic journals. Whether this ideal of sustainable development has been applied or how much it has been approached remains an important question.
The sustainability principle can be applied to various environmental, economic and socio-cultural aspects of tourism development. A suitable balance must be established between these three dimensions to guarantee the long term sustainability of development schemes. Achieving sustainable tourism is a continuous process that requires constant monitoring of impacts so that follow up or corrective actions can be pursued.
31
Sustainable tourism should (i) make optimal use of environmental resources; (ii) respect socio-cultural authenticity and host communities; and (iii) ensure viable, long term economic operations that provide socio-economic benefi ts to all stakeholders, including stable employment and income earning opportunities, which are fairly distributed, off er social services to host communities and contribute to poverty alleviation (WTO Conceptual Defi nition, 2004). Thus statistics on real employment in tourist destinations constitute a tool for measuring some elements of development sustainability.
2.3 Beyond the Tourism Industry
Tourism in all countries is only made possible with the involvement of many stakeholders, the public and private sectors and the community. How much the government is involved in tourism is also important to note, since it diff ers from country to country. The division of responsibilities with regard to tourism within Indonesia’s bureaucracy is an option, but ultimately depends on the position of tourism in the regional economy. It is also necessary to identify tourism-related employment in the public sector. So far, this data has not been collected. Public sector employment at the national, provincial and local levels must be very small compared to those working directly or indirectly for tourists/tourism in the private sector, but even so, this small number of government-employed persons cannot be neglected and must be taken into consideration. Of course, this will require a diff erent approach and the authorities are crucial in determining the quality and direction of development. What is important is not their number, but their competence in taking the lead.
Of similar importance are those indirectly serving the business sector, i.e. the educators and trainers, both private and public, working at diff erent levels and for diff erent aspects of tourism education and training, as well as researchers and NGO employees.
2.4 The Importance of Employment Statistics as Indicators
Employment statistics can be used as:
i. A means to keep track of or direct our attention to key issues such as wage levels, youth employment, working hours, etc.;
ii. A tool for better planning; for instance, tourism manpower and human resources development for supporting the tourism industries and the public sector, as well as for training and education institutions’ undertakings;
iii. Performance indicators, which reveal how much tourism has contributed to the national development goals; and
iv. A tool for policy monitoring and evaluation.
Employment statistics are available through the BPS’s household and establishment surveys, as well as from the MMT’s administrative records. BPS employment-related surveys, as listed in the previous ILO report, include the National Labour Force Survey (SAKERNAS), Establishment Surveys, Labour Wage Survey, Wage Structure Survey, Large and Medium Manufacturing Survey, Integrated Establishment Survey (SUSI), Micro and Small Industry Survey as well as the population and economic censuses. Not all of these surveys are regularly undertaken nor cover all regions of the country.
32
Measuring Employment in the Tourism Industries beyond a Tourism Satellite Account: A Case Study of Indonesia
Tourism employment statistics in Indonesia could essentially be prepared from the same source if it was capable of processing the specifi c fi eld data related to tourism. Therefore, the fi rst thing that is necessary is to defi ne what is regarded as tourism industry/ies. The existing statistics in BPS usually place tourism in the same group as trade. Businesses included in the establishment surveys are still limited to accommodations, travel services and food and beverage services, which neglect the unincorporated/informal sector. Due to the regional/destination diversity of the country, what might represent the tourism industry/ies may diff er among localities. As a result of this, it is not enough to identify country-wide industrial sectors as the UNWTO indicates; regional-specifi c activities also need to be identifi ed.
The population census that covers all kinds of employment does not categorize tourism as such, rather tourism is represented only by hotels and restaurants and then grouped together with trade during data processing.
Relatively recently (2000) the government started preparing the Tourism Satellite Account (TSA) to produce derived indicators of the economic impact (both direct and indirect) of tourism. The TSA also references the number of jobs created directly and indirectly by the sectors.
The dominance of the informal sectors should be seen as a positive indication of the populations’ ability to create their own employment opportunities with however small resources and however low education they might have. With a similar mindset, we may come up with policies to empower the population and facilitate informal employment creation, rather than looking at these types of employment as a disturbance to order and banning them from many strategic locations, as we have in the past. At present, the country has very limited statistics on the informal sector in general and, in particular, the tourism-related informal sector. There is a need for more research on this sector in order to have a more complete picture of their potential, the problems they face and their contributions to the sector in terms of servicing visitors at tourist localities.
33
3.1 Current Situation
This section reviews the tourism satellite accounts (TSA) with regard to labour and employment, and in particular, how they relate to the decent work indicators (DWI). While inspecting these issues, one needs to assess the TSA of Indonesia and Provincial TSAs, especially the quality of data and information that supports this compilation. One also needs to consult the latest developments of TSA as recommended in the System of National Accounts (SNA) 2008 and TSA: RMF 2008.
3.1.1 Tourism Satellite Accounts: general information
As stated in the System of National Accounts (SNA) 1993, satellite accounts or satellite systems generally stress the need to expand the analytical capacity of national accounting for selected areas of social concern. Satellite accounts are thus able to play a dual role as tools for analysis and as tools for statistical coordination. The TSA is a long established satellite account, a signifi cant number of countries having compiled one at some stage. A manual of international guidelines, the 2008 Tourism Satellite Accounts: Recommended Methodological Framework, has been published.
The goal of TSA is to provide the following information:17
a. Macroeconomic aggregates that describe the size and economic contribution of tourism;
b. Detailed data on tourism consumption associated with the activities of visitors as consumers, and how this demand is met by domestic supply and imports;
Measuring Employment in the Tourism Industries in Indonesia: Current Situation and Challenges Beyond TSA
Chapter 3
17 BPS, System of National Accounts, Chapter 29 (paragraph 29.90), 2008.
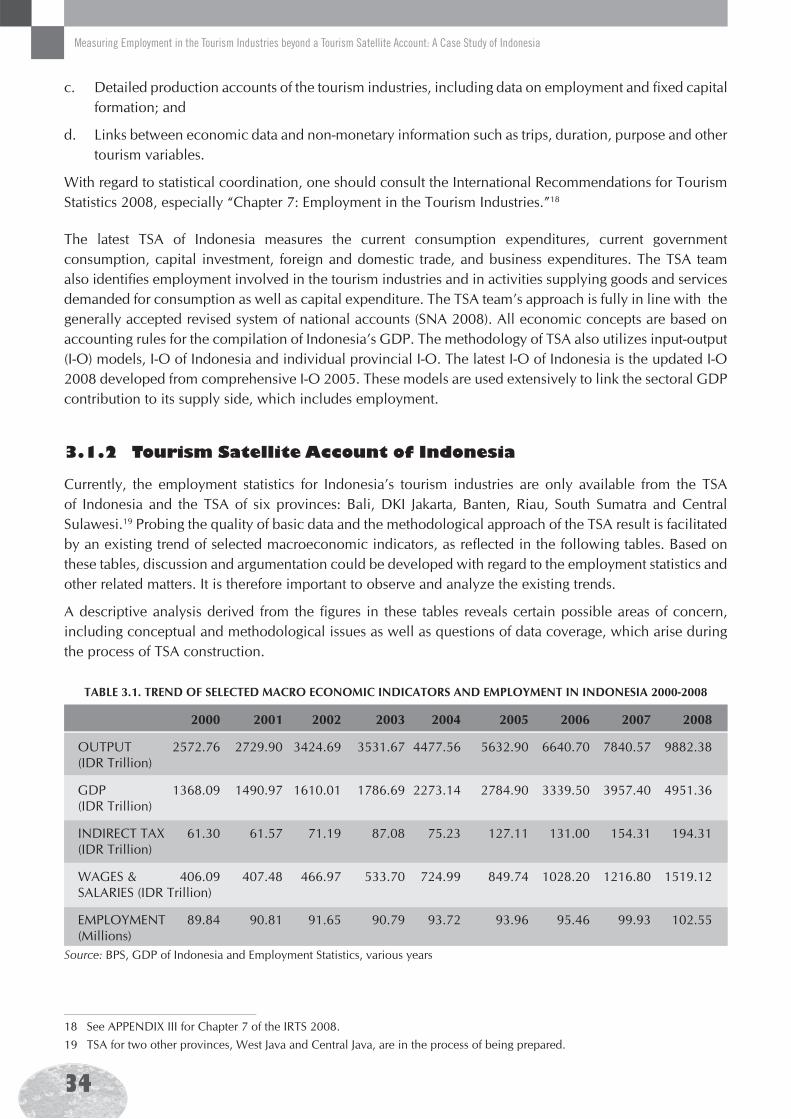
34
Measuring Employment in the Tourism Industries beyond a Tourism Satellite Account: A Case Study of Indonesia
c. Detailed production accounts of the tourism industries, including data on employment and fi xed capital formation; and
d. Links between economic data and non-monetary information such as trips, duration, purpose and other tourism variables.
With regard to statistical coordination, one should consult the International Recommendations for Tourism Statistics 2008, especially “Chapter 7: Employment in the Tourism Industries.”18
The latest TSA of Indonesia measures the current consumption expenditures, current government consumption, capital investment, foreign and domestic trade, and business expenditures. The TSA team also identifi es employment involved in the tourism industries and in activities supplying goods and services demanded for consumption as well as capital expenditure. The TSA team’s approach is fully in line with the generally accepted revised system of national accounts (SNA 2008). All economic concepts are based on accounting rules for the compilation of Indonesia’s GDP. The methodology of TSA also utilizes input-output (I-O) models, I-O of Indonesia and individual provincial I-O. The latest I-O of Indonesia is the updated I-O 2008 developed from comprehensive I-O 2005. These models are used extensively to link the sectoral GDP contribution to its supply side, which includes employment.
3.1.2 Tourism Satellite Account of Indonesia
Currently, the employment statistics for Indonesia’s tourism industries are only available from the TSA of Indonesia and the TSA of six provinces: Bali, DKI Jakarta, Banten, Riau, South Sumatra and Central Sulawesi.19 Probing the quality of basic data and the methodological approach of the TSA result is facilitated by an existing trend of selected macroeconomic indicators, as refl ected in the following tables. Based on these tables, discussion and argumentation could be developed with regard to the employment statistics and other related matters. It is therefore important to observe and analyze the existing trends.
A descriptive analysis derived from the fi gures in these tables reveals certain possible areas of concern, including conceptual and methodological issues as well as questions of data coverage, which arise during the process of TSA construction.
TABLE 3.1. TREND OF SELECTED MACRO ECONOMIC INDICATORS AND EMPLOYMENT IN INDONESIA 2000-2008
Source: BPS, GDP of Indonesia and Employment Statistics, various years
2000 2001 2002 2003 2004 2005 2006 2007 2008
OUTPUT 2572.76 2729.90 3424.69 3531.67 4477.56 5632.90 6640.70 7840.57 9882.38(IDR Trillion)
GDP 1368.09 1490.97 1610.01 1786.69 2273.14 2784.90 3339.50 3957.40 4951.36(IDR Trillion)
INDIRECT TAX 61.30 61.57 71.19 87.08 75.23 127.11 131.00 154.31 194.31(IDR Trillion)
WAGES & 406.09 407.48 466.97 533.70 724.99 849.74 1028.20 1216.80 1519.12SALARIES (IDR Trillion)
EMPLOYMENT 89.84 90.81 91.65 90.79 93.72 93.96 95.46 99.93 102.55(Millions)
18 See APPENDIX III for Chapter 7 of the IRTS 2008.19 TSA for two other provinces, West Java and Central Java, are in the process of being prepared.
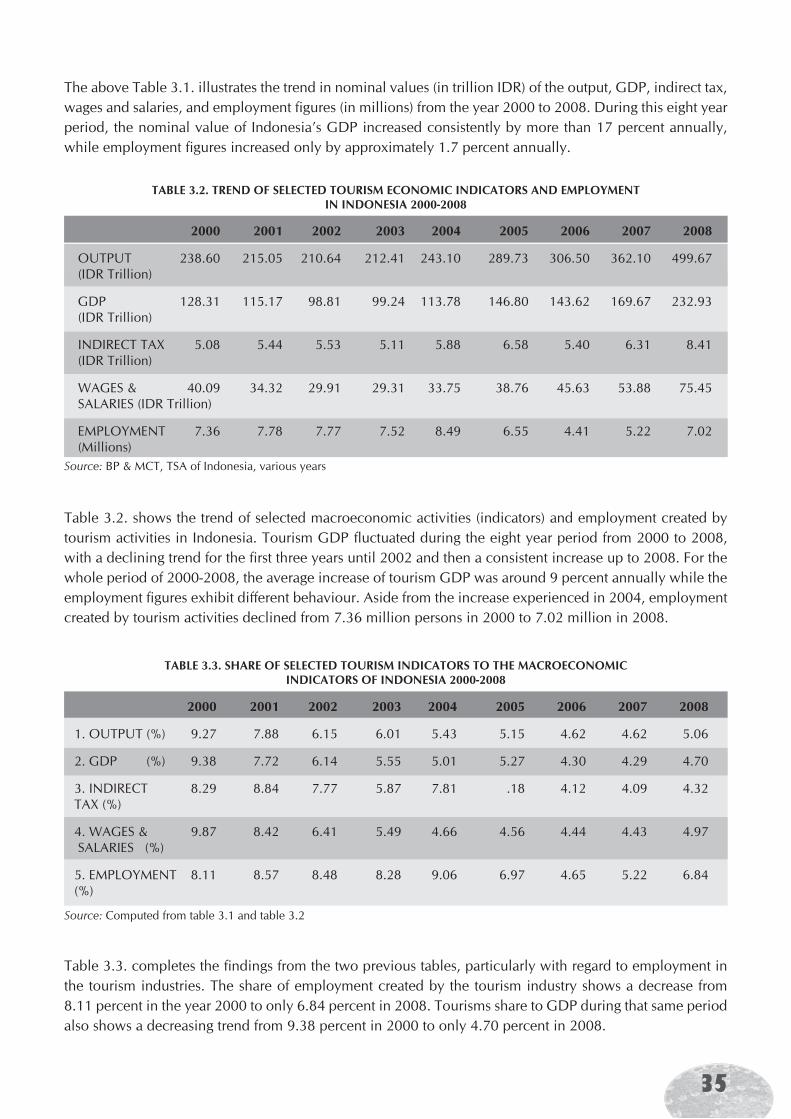
35
The above Table 3.1. illustrates the trend in nominal values (in trillion IDR) of the output, GDP, indirect tax, wages and salaries, and employment fi gures (in millions) from the year 2000 to 2008. During this eight year period, the nominal value of Indonesia’s GDP increased consistently by more than 17 percent annually, while employment fi gures increased only by approximately 1.7 percent annually.
TABLE 3.2. TREND OF SELECTED TOURISM ECONOMIC INDICATORS AND EMPLOYMENT
IN INDONESIA 2000-2008
Source: BP & MCT, TSA of Indonesia, various years
2000 2001 2002 2003 2004 2005 2006 2007 2008
OUTPUT 238.60 215.05 210.64 212.41 243.10 289.73 306.50 362.10 499.67 (IDR Trillion)
GDP 128.31 115.17 98.81 99.24 113.78 146.80 143.62 169.67 232.93 (IDR Trillion)
INDIRECT TAX 5.08 5.44 5.53 5.11 5.88 6.58 5.40 6.31 8.41 (IDR Trillion)
WAGES & 40.09 34.32 29.91 29.31 33.75 38.76 45.63 53.88 75.45 SALARIES (IDR Trillion)
EMPLOYMENT 7.36 7.78 7.77 7.52 8.49 6.55 4.41 5.22 7.02(Millions)
Table 3.2. shows the trend of selected macroeconomic activities (indicators) and employment created by tourism activities in Indonesia. Tourism GDP fl uctuated during the eight year period from 2000 to 2008, with a declining trend for the fi rst three years until 2002 and then a consistent increase up to 2008. For the whole period of 2000-2008, the average increase of tourism GDP was around 9 percent annually while the employment fi gures exhibit diff erent behaviour. Aside from the increase experienced in 2004, employment created by tourism activities declined from 7.36 million persons in 2000 to 7.02 million in 2008.
TABLE 3.3. SHARE OF SELECTED TOURISM INDICATORS TO THE MACROECONOMICINDICATORS OF INDONESIA 2000-2008
Source: Computed from table 3.1 and table 3.2
2000 2001 2002 2003 2004 2005 2006 2007 2008
1. OUTPUT (%) 9.27 7.88 6.15 6.01 5.43 5.15 4.62 4.62 5.06
2. GDP (%) 9.38 7.72 6.14 5.55 5.01 5.27 4.30 4.29 4.70
3. INDIRECT 8.29 8.84 7.77 5.87 7.81 .18 4.12 4.09 4.32TAX (%)
4. WAGES & 9.87 8.42 6.41 5.49 4.66 4.56 4.44 4.43 4.97 SALARIES (%)
5. EMPLOYMENT 8.11 8.57 8.48 8.28 9.06 6.97 4.65 5.22 6.84(%)
Table 3.3. completes the fi ndings from the two previous tables, particularly with regard to employment in the tourism industries. The share of employment created by the tourism industry shows a decrease from 8.11 percent in the year 2000 to only 6.84 percent in 2008. Tourisms share to GDP during that same period also shows a decreasing trend from 9.38 percent in 2000 to only 4.70 percent in 2008.
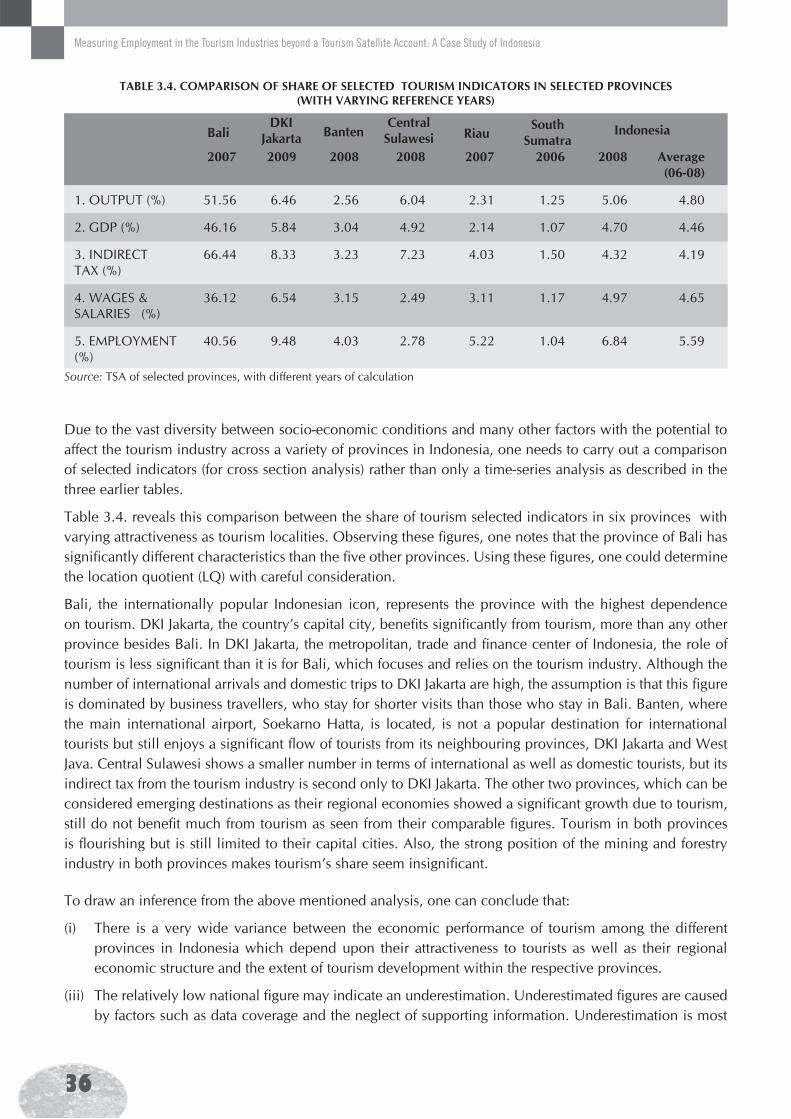
36
Measuring Employment in the Tourism Industries beyond a Tourism Satellite Account: A Case Study of Indonesia
TABLE 3.4. COMPARISON OF SHARE OF SELECTED TOURISM INDICATORS IN SELECTED PROVINCES (WITH VARYING REFERENCE YEARS)
Source: TSA of selected provinces, with diff erent years of calculation
2007 2009 2008 2008 2007 2006 2008 Average (06-08)
1. OUTPUT (%) 51.56 6.46 2.56 6.04 2.31 1.25 5.06 4.80
2. GDP (%) 46.16 5.84 3.04 4.92 2.14 1.07 4.70 4.46
3. INDIRECT 66.44 8.33 3.23 7.23 4.03 1.50 4.32 4.19TAX (%)
4. WAGES & 36.12 6.54 3.15 2.49 3.11 1.17 4.97 4.65SALARIES (%)
5. EMPLOYMENT 40.56 9.48 4.03 2.78 5.22 1.04 6.84 5.59(%)
BaliDKI
Jakarta BantenCentral
Sulawesi RiauSouth
SumatraIndonesia
Due to the vast diversity between socio-economic conditions and many other factors with the potential to aff ect the tourism industry across a variety of provinces in Indonesia, one needs to carry out a comparison of selected indicators (for cross section analysis) rather than only a time-series analysis as described in the three earlier tables.
Table 3.4. reveals this comparison between the share of tourism selected indicators in six provinces with varying attractiveness as tourism localities. Observing these fi gures, one notes that the province of Bali has signifi cantly diff erent characteristics than the fi ve other provinces. Using these fi gures, one could determine the location quotient (LQ) with careful consideration.
Bali, the internationally popular Indonesian icon, represents the province with the highest dependence on tourism. DKI Jakarta, the country’s capital city, benefi ts signifi cantly from tourism, more than any other province besides Bali. In DKI Jakarta, the metropolitan, trade and fi nance center of Indonesia, the role of tourism is less signifi cant than it is for Bali, which focuses and relies on the tourism industry. Although the number of international arrivals and domestic trips to DKI Jakarta are high, the assumption is that this fi gure is dominated by business travellers, who stay for shorter visits than those who stay in Bali. Banten, where the main international airport, Soekarno Hatta, is located, is not a popular destination for international tourists but still enjoys a signifi cant fl ow of tourists from its neighbouring provinces, DKI Jakarta and West Java. Central Sulawesi shows a smaller number in terms of international as well as domestic tourists, but its indirect tax from the tourism industry is second only to DKI Jakarta. The other two provinces, which can be considered emerging destinations as their regional economies showed a signifi cant growth due to tourism, still do not benefi t much from tourism as seen from their comparable fi gures. Tourism in both provinces is fl ourishing but is still limited to their capital cities. Also, the strong position of the mining and forestry industry in both provinces makes tourism’s share seem insignifi cant.
To draw an inference from the above mentioned analysis, one can conclude that:
(i) There is a very wide variance between the economic performance of tourism among the diff erent provinces in Indonesia which depend upon their attractiveness to tourists as well as their regional economic structure and the extent of tourism development within the respective provinces.
(iii) The relatively low national fi gure may indicate an underestimation. Underestimated fi gures are caused by factors such as data coverage and the neglect of supporting information. Underestimation is most
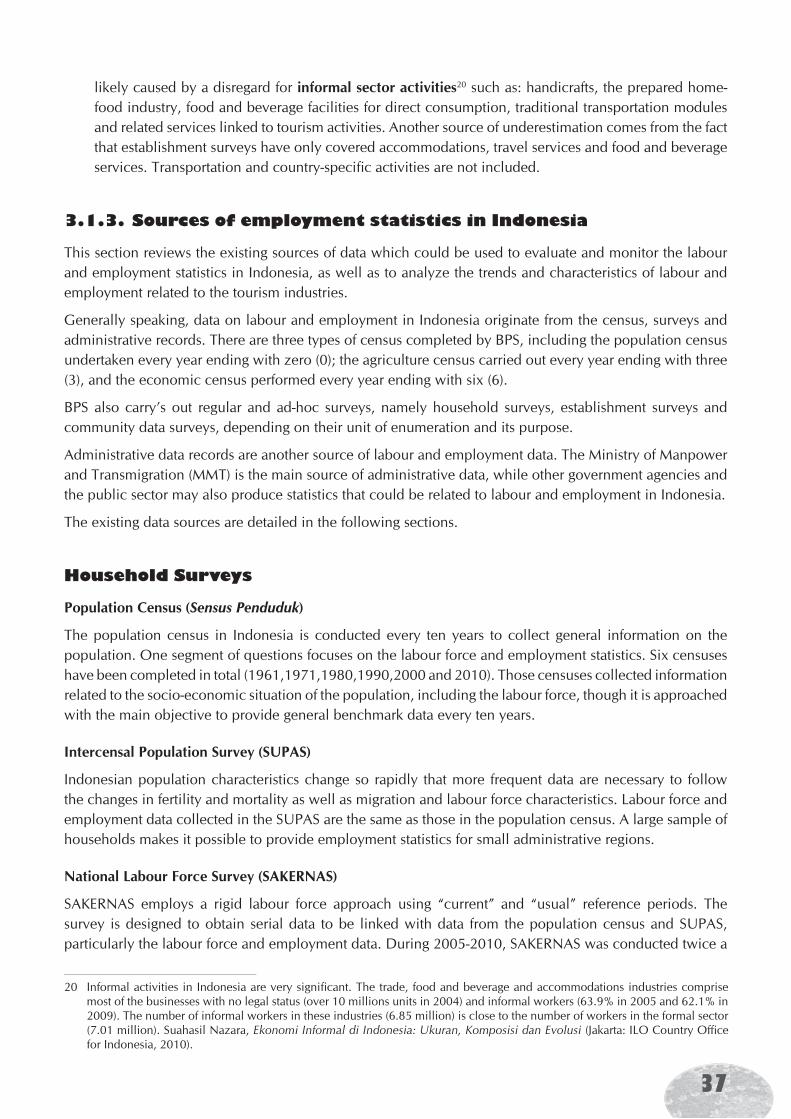
37
likely caused by a disregard for informal sector activities20 such as: handicrafts, the prepared home-food industry, food and beverage facilities for direct consumption, traditional transportation modules and related services linked to tourism activities. Another source of underestimation comes from the fact that establishment surveys have only covered accommodations, travel services and food and beverage services. Transportation and country-specifi c activities are not included.
3.1.3. Sources of employment statistics in Indonesia
This section reviews the existing sources of data which could be used to evaluate and monitor the labour and employment statistics in Indonesia, as well as to analyze the trends and characteristics of labour and employment related to the tourism industries.
Generally speaking, data on labour and employment in Indonesia originate from the census, surveys and administrative records. There are three types of census completed by BPS, including the population census undertaken every year ending with zero (0); the agriculture census carried out every year ending with three (3), and the economic census performed every year ending with six (6).
BPS also carry’s out regular and ad-hoc surveys, namely household surveys, establishment surveys and community data surveys, depending on their unit of enumeration and its purpose.
Administrative data records are another source of labour and employment data. The Ministry of Manpower and Transmigration (MMT) is the main source of administrative data, while other government agencies and the public sector may also produce statistics that could be related to labour and employment in Indonesia.
The existing data sources are detailed in the following sections.
Household Surveys
Population Census (Sensus Penduduk)
The population census in Indonesia is conducted every ten years to collect general information on the population. One segment of questions focuses on the labour force and employment statistics. Six censuses have been completed in total (1961,1971,1980,1990,2000 and 2010). Those censuses collected information related to the socio-economic situation of the population, including the labour force, though it is approached with the main objective to provide general benchmark data every ten years.
Intercensal Population Survey (SUPAS)
Indonesian population characteristics change so rapidly that more frequent data are necessary to follow the changes in fertility and mortality as well as migration and labour force characteristics. Labour force and employment data collected in the SUPAS are the same as those in the population census. A large sample of households makes it possible to provide employment statistics for small administrative regions.
National Labour Force Survey (SAKERNAS)
SAKERNAS employs a rigid labour force approach using “current” and “usual” reference periods. The survey is designed to obtain serial data to be linked with data from the population census and SUPAS, particularly the labour force and employment data. During 2005-2010, SAKERNAS was conducted twice a
20 Informal activities in Indonesia are very signifi cant. The trade, food and beverage and accommodations industries comprise most of the businesses with no legal status (over 10 millions units in 2004) and informal workers (63.9% in 2005 and 62.1% in 2009). The number of informal workers in these industries (6.85 million) is close to the number of workers in the formal sector (7.01 million). Suahasil Nazara, Ekonomi Informal di Indonesia: Ukuran, Komposisi dan Evolusi (Jakarta: ILO Country Offi ce for Indonesia, 2010).
38
Measuring Employment in the Tourism Industries beyond a Tourism Satellite Account: A Case Study of Indonesia
year in February and August. In 2011, SAKERNAS will be executed on a quarterly basis in February, May, August, and November with the sample size covering around fi fty thousand households spread throughout fi ve thousand Census Blocks around Indonesia. For August’s survey, there will be an additional sample taken from fi fteen thousand Census Blocks to enable a more accurate estimation of the labour force and employment data at the district and municipality level.
National Socio-Economic Survey (SUSENAS)
SUSENAS is a multi-purpose household survey with the main objective to collect data on demographic and socio-economic household characteristics. After 1997, SUSENAS was re-designed to simplify its operation by covering only three modules including the consumption expenditure module, which is collected every three years, the welfare indicator module conducted every year, and the labour force and employment module collected every year and designed to be comparable with data from SAKERNAS. In 2011, SUSENAS will be executed on a quarterly basis with a sample size of around seventy fi ve thousand households every quarter.
Establishment Surveys
BPS conducts several establishment surveys that contain data on the labour force and employment. Most of these surveys collect data on the cost of production, input and output structure, capital formation, and business operation. Employment data is collected as part of the information on caste structure. Among other surveys currently conducted via establishment enumeration include the economic census, the large and medium manufacturing survey, the small and household-establishment integrated survey (SUSI); the small and household cottage industry survey, the hotel establishment survey, the labour wage survey and, fi nally, the wage structure survey. Selected establishment surveys are presented below.
Labour Wage Survey (LWS)
This survey began in 1979 to collect detailed information on wage development and structure including distribution by occupation. The survey is conducted quarterly every year in March, June, September and December. Wages were broken down by establishment size, gender, sub-sector and capital ownership. The 2010 LWS covered 3675 establishments including the manufacturing industry, hotels, non-oil and gas, livestock and fi shery as well as the wholesale and retail trade.
Wage Structure Survey
This survey is conducted every year, but only for limited industries and selected occupations. The survey is based on the framework used in the labour wage survey. Questions cover factors such as employment, income and status in employment.
Large and Medium Manufacturing Survey
This survey is conducted annually and covers large and medium sized manufacturing establishments. The survey collects detailed information including production cost, outputs and services performed, power generation, investments, capital and assets.
Micro and Small Industry and Integrated Establishment Survey (SUSI)
The micro and small industry survey is only conducted in some parts of Indonesia. Since the 2006 Economic Census, it has been integrated into SUSI. SUSI covers all non-agricultural establishments without legal entity; the sample is approximately fi fteen thousand establishments throughout Indonesia. The survey asks questions related to employment, status in employment and worker compensation.
39
Hotel, Restaurants and Tours and Travel Establishment Surveys
Hotel and other accommodation statistics are based on an inventory survey conducted by the appropriate regional offi ces of BPS throughout Indonesia. Data coverage of the survey includes average number of workers per establishment/room and numbers of workers by kind of job.
Restaurant statistics derived from the survey are also conducted by BPS regional offi ces throughout Indonesia. Data coverage of the survey includes number of workers by gender, education, and citizenship, as well as their compensation.
Tours and travel service statistics are based on a complete survey enumeration conducted by BPS regional offi ces throughout Indonesia. Data coverage of the survey includes the number of workers by gender, nationality, education, as well as workers’ compensation.
Administrative Records and Other Potential Sources
Community Data Survey and Village Potential Survey (PODES)
Community data surveys, such as PODES, regularly conducted by BPS, are part of a large data collection undertaking such as the Census, SUPAS and other national sample surveys. Community data contains more aggregated information and the employment data in PODES is very limited.
Administrative Records
The Ministry of Manpower and Transmigration (MMT) keeps records on labour and employment-related data but this data is not normally processed or published. MMT also keeps records of Indonesians working abroad, but for some reason this data is of poor quality. MMT has been running diff erent employment-related development programmes and is required to maintain these records. However, the availability and consistency of data are limited and not systematically processed to generate statistics.
Potential Sources of Employment Statistics
BPS regularly publishes Input-Output (I-O) Tables, Flow of Funds (FOF) and the Social Accounting Matrix (SAM), maximizing the utilization of existing data. Special surveys have been designed to support those publications. A good example of this is the special survey on household savings and investments (SKTIR) 2008.
SKTIR 2008 was conducted in 13 provinces covering a sample of 5480 households with the main objective to determine income and the expenditure structure of these households. Several segments in the questionnaire cover the main sources of labour and employment information. Household members are individually identifi ed by their status in economic activities, occupations and industries.
SAM produces data on a number of employment and worker-related topics. Several tables present data on the weekly average of hours worked, average wages and salaries per worker.
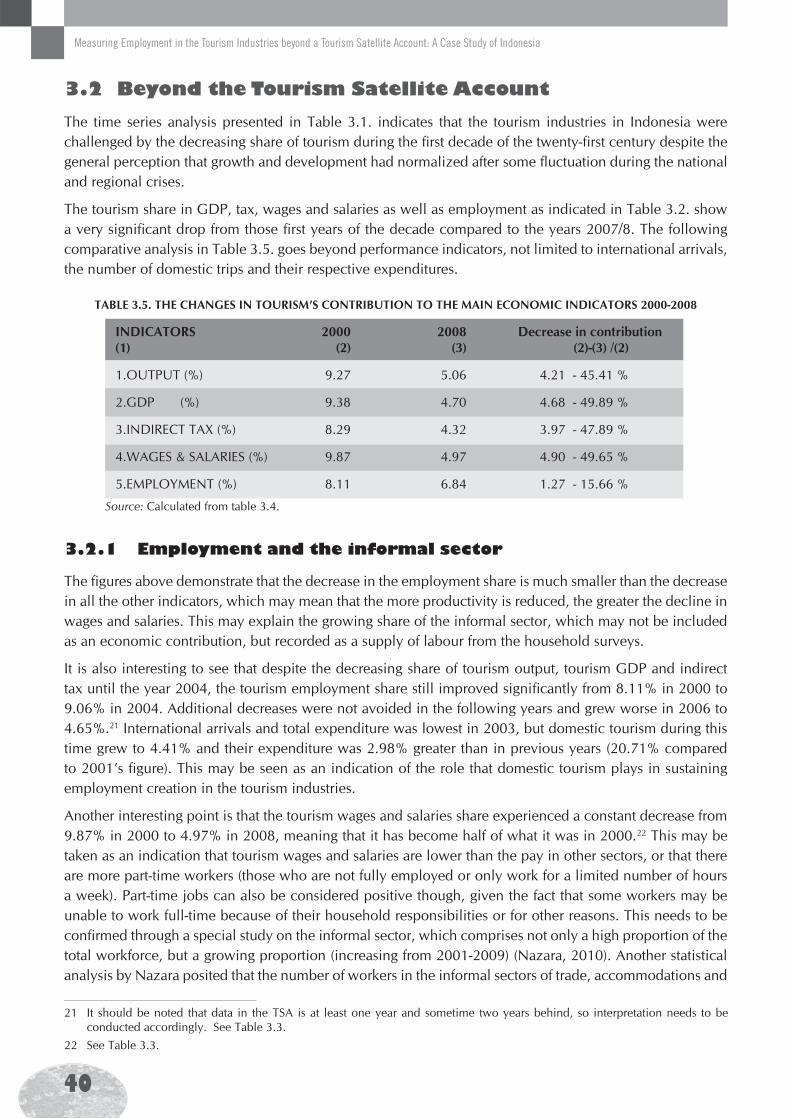
40
Measuring Employment in the Tourism Industries beyond a Tourism Satellite Account: A Case Study of Indonesia
3.2 Beyond the Tourism Satellite Account
The time series analysis presented in Table 3.1. indicates that the tourism industries in Indonesia were challenged by the decreasing share of tourism during the fi rst decade of the twenty-fi rst century despite the general perception that growth and development had normalized after some fl uctuation during the national and regional crises.
The tourism share in GDP, tax, wages and salaries as well as employment as indicated in Table 3.2. show a very signifi cant drop from those fi rst years of the decade compared to the years 2007/8. The following comparative analysis in Table 3.5. goes beyond performance indicators, not limited to international arrivals, the number of domestic trips and their respective expenditures.
TABLE 3.5. THE CHANGES IN TOURISM’S CONTRIBUTION TO THE MAIN ECONOMIC INDICATORS 2000-2008
Source: Calculated from table 3.4.
INDICATORS 2000 2008 Decrease in contribution(1) (2) (3) (2)-(3) /(2)
1.OUTPUT (%) 9.27 5.06 4.21 - 45.41 %
2.GDP (%) 9.38 4.70 4.68 - 49.89 %
3.INDIRECT TAX (%) 8.29 4.32 3.97 - 47.89 %
4.WAGES & SALARIES (%) 9.87 4.97 4.90 - 49.65 %
5.EMPLOYMENT (%) 8.11 6.84 1.27 - 15.66 %
3.2.1 Employment and the informal sector
The fi gures above demonstrate that the decrease in the employment share is much smaller than the decrease in all the other indicators, which may mean that the more productivity is reduced, the greater the decline in wages and salaries. This may explain the growing share of the informal sector, which may not be included as an economic contribution, but recorded as a supply of labour from the household surveys.
It is also interesting to see that despite the decreasing share of tourism output, tourism GDP and indirect tax until the year 2004, the tourism employment share still improved signifi cantly from 8.11% in 2000 to 9.06% in 2004. Additional decreases were not avoided in the following years and grew worse in 2006 to 4.65%.21 International arrivals and total expenditure was lowest in 2003, but domestic tourism during this time grew to 4.41% and their expenditure was 2.98% greater than in previous years (20.71% compared to 2001’s fi gure). This may be seen as an indication of the role that domestic tourism plays in sustaining employment creation in the tourism industries.
Another interesting point is that the tourism wages and salaries share experienced a constant decrease from 9.87% in 2000 to 4.97% in 2008, meaning that it has become half of what it was in 2000.22 This may be taken as an indication that tourism wages and salaries are lower than the pay in other sectors, or that there are more part-time workers (those who are not fully employed or only work for a limited number of hours a week). Part-time jobs can also be considered positive though, given the fact that some workers may be unable to work full-time because of their household responsibilities or for other reasons. This needs to be confi rmed through a special study on the informal sector, which comprises not only a high proportion of the total workforce, but a growing proportion (increasing from 2001-2009) (Nazara, 2010). Another statistical analysis by Nazara posited that the number of workers in the informal sectors of trade, accommodations and
21 It should be noted that data in the TSA is at least one year and sometime two years behind, so interpretation needs to be conducted accordingly. See Table 3.3.
22 See Table 3.3.
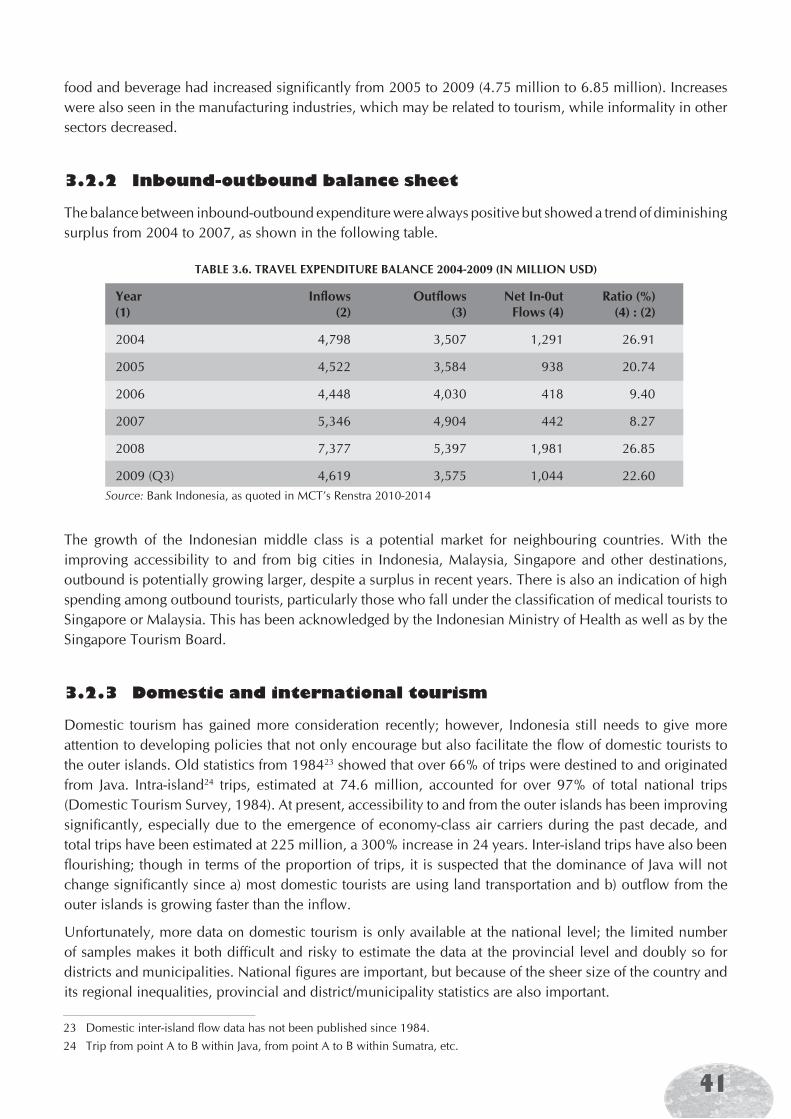
41
food and beverage had increased signifi cantly from 2005 to 2009 (4.75 million to 6.85 million). Increases were also seen in the manufacturing industries, which may be related to tourism, while informality in other sectors decreased.
3.2.2 Inbound-outbound balance sheet
The balance between inbound-outbound expenditure were always positive but showed a trend of diminishing surplus from 2004 to 2007, as shown in the following table.
23 Domestic inter-island fl ow data has not been published since 1984.24 Trip from point A to B within Java, from point A to B within Sumatra, etc.
TABLE 3.6. TRAVEL EXPENDITURE BALANCE 2004-2009 (IN MILLION USD)
Source: Bank Indonesia, as quoted in MCT’s Renstra 2010-2014
Year Infl ows Outfl ows Net In-0ut Ratio (%)(1) (2) (3) Flows (4) (4) : (2)
2004 4,798 3,507 1,291 26.91
2005 4,522 3,584 938 20.74
2006 4,448 4,030 418 9.40
2007 5,346 4,904 442 8.27
2008 7,377 5,397 1,981 26.85
2009 (Q3) 4,619 3,575 1,044 22.60
The growth of the Indonesian middle class is a potential market for neighbouring countries. With the improving accessibility to and from big cities in Indonesia, Malaysia, Singapore and other destinations, outbound is potentially growing larger, despite a surplus in recent years. There is also an indication of high spending among outbound tourists, particularly those who fall under the classifi cation of medical tourists to Singapore or Malaysia. This has been acknowledged by the Indonesian Ministry of Health as well as by the Singapore Tourism Board.
3.2.3 Domestic and international tourism
Domestic tourism has gained more consideration recently; however, Indonesia still needs to give more attention to developing policies that not only encourage but also facilitate the fl ow of domestic tourists to the outer islands. Old statistics from 198423 showed that over 66% of trips were destined to and originated from Java. Intra-island24 trips, estimated at 74.6 million, accounted for over 97% of total national trips (Domestic Tourism Survey, 1984). At present, accessibility to and from the outer islands has been improving signifi cantly, especially due to the emergence of economy-class air carriers during the past decade, and total trips have been estimated at 225 million, a 300% increase in 24 years. Inter-island trips have also been fl ourishing; though in terms of the proportion of trips, it is suspected that the dominance of Java will not change signifi cantly since a) most domestic tourists are using land transportation and b) outfl ow from the outer islands is growing faster than the infl ow.
Unfortunately, more data on domestic tourism is only available at the national level; the limited number of samples makes it both diffi cult and risky to estimate the data at the provincial level and doubly so for districts and municipalities. National fi gures are important, but because of the sheer size of the country and its regional inequalities, provincial and district/municipality statistics are also important.
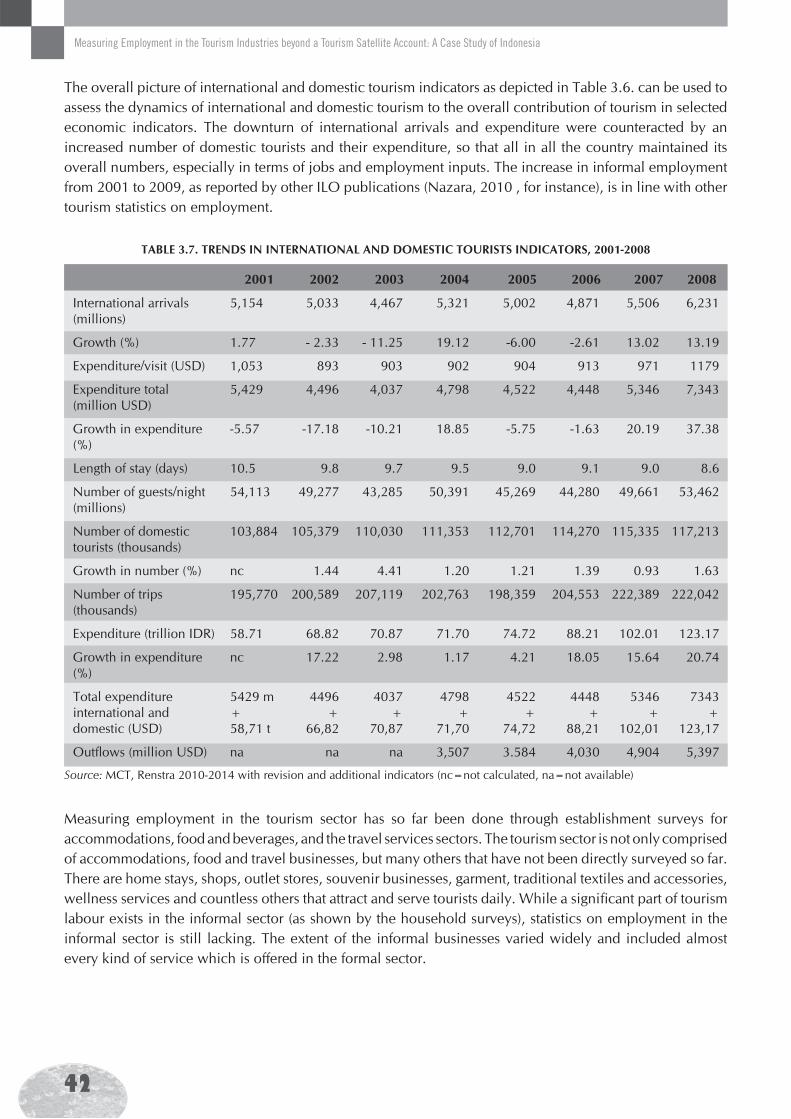
42
Measuring Employment in the Tourism Industries beyond a Tourism Satellite Account: A Case Study of Indonesia
The overall picture of international and domestic tourism indicators as depicted in Table 3.6. can be used to assess the dynamics of international and domestic tourism to the overall contribution of tourism in selected economic indicators. The downturn of international arrivals and expenditure were counteracted by an increased number of domestic tourists and their expenditure, so that all in all the country maintained its overall numbers, especially in terms of jobs and employment inputs. The increase in informal employment from 2001 to 2009, as reported by other ILO publications (Nazara, 2010 , for instance), is in line with other tourism statistics on employment.
TABLE 3.7. TRENDS IN INTERNATIONAL AND DOMESTIC TOURISTS INDICATORS, 2001-2008
Source: MCT, Renstra 2010-2014 with revision and additional indicators (nc=not calculated, na=not available)
2001 2002 2003 2004 2005 2006 2007 2008
5,154 5,033 4,467 5,321 5,002 4,871 5,506 6,231
1.77 - 2.33 - 11.25 19.12 -6.00 -2.61 13.02 13.19
1,053 893 903 902 904 913 971 1179
5,429 4,496 4,037 4,798 4,522 4,448 5,346 7,343
-5.57 -17.18 -10.21 18.85 -5.75 -1.63 20.19 37.38
10.5 9.8 9.7 9.5 9.0 9.1 9.0 8.6
54,113 49,277 43,285 50,391 45,269 44,280 49,661 53,462
103,884 105,379 110,030 111,353 112,701 114,270 115,335 117,213
nc 1.44 4.41 1.20 1.21 1.39 0.93 1.63
195,770 200,589 207,119 202,763 198,359 204,553 222,389 222,042
58.71 68.82 70.87 71.70 74.72 88.21 102.01 123.17
nc 17.22 2.98 1.17 4.21 18.05 15.64 20.74
5429 m 4496 4037 4798 4522 4448 5346 7343+ + + + + + + +58,71 t 66,82 70,87 71,70 74,72 88,21 102,01 123,17
na na na 3,507 3.584 4,030 4,904 5,397
International arrivals (millions)
Growth (%)
Expenditure/visit (USD)
Expenditure total (million USD)
Growth in expenditure (%)
Length of stay (days)
Number of guests/night (millions)
Number of domestic tourists (thousands)
Growth in number (%)
Number of trips (thousands)
Expenditure (trillion IDR)
Growth in expenditure (%)
Total expenditure international and domestic (USD)
Outfl ows (million USD)
Measuring employment in the tourism sector has so far been done through establishment surveys for accommodations, food and beverages, and the travel services sectors. The tourism sector is not only comprised of accommodations, food and travel businesses, but many others that have not been directly surveyed so far. There are home stays, shops, outlet stores, souvenir businesses, garment, traditional textiles and accessories, wellness services and countless others that attract and serve tourists daily. While a signifi cant part of tourism labour exists in the informal sector (as shown by the household surveys), statistics on employment in the informal sector is still lacking. The extent of the informal businesses varied widely and included almost every kind of service which is off ered in the formal sector.
43
3.3 New Agenda for Tourism – Needs for Employment Statistics
The national development programme, as outlined in the presidential speech, has highlighted the spirit of pro-growth, pro-jobs, pro-poor and pro-environment. Employment creation is therefore one of the top national interests, whereby tourism is expected to play a greater role than ever before. The sector is considered to be labour intensive and a fl exible entry point for employment, but there are still many questions concerning tourism employment that need to be clarifi ed. The present estimate, portrayed by the latest national TSA (2008), indicated that tourism has created jobs for 6.98 million people, constituting 6.81% of the national total. The real number of people engaged in tourism related jobs must be much higher than this estimate, considering that the data source may not be accurate or complete for many reasons, including, most importantly, that the informal sector is not included. Other than the estimate on the number of persons employed in the tourism industries, the impact on wages and salaries is only 4.64% of the national total, which means that the tourism sector is creating jobs with wages and salaries below the national average and other sectors. Therefore, the pro-jobs and pro-poor message can be interpreted as not only the need to employ more people, but also the need to create more jobs that can eradicate poverty, factors that are related to the ILO’s decent work agenda.
The tourism development agenda, as well as other sectors’ development agendas, is based on the national long-term development plan, enacted as Law No. 17 (2007) on Long-Term Development Plan (known as RPJP 2005-2025). Under this vision, the national mid-term development goals are sequenced as follows:
1. 2005-2009 Focus on further recovery post-national crisis; security and peace; improve welfare and social security (based on the community development index, gender development index and the protection of women and children);
2. 2010-2014 Capacity building: improve the quality of human resources and the capacity of science and technology; strengthen economic competitiveness; welfare; increase income; poverty reduction; decrease unemployment; increase social security and gender equality;
3. 2015-2019 Improve competitiveness and quality of human resources; improve capacity in science, technology and art; and
4. 2020-2024 Create a strong economic structure based on competitive advantage in the regions, supported by competitive and high quality human resources.
Note that during the second stage, from 2010 to 2014, though not limited to this period, the agenda focuses on employment creation together with improved social security and gender equality to improve competitiveness and create a stronger economic structure. Based on the Long-Term Development Plan and the Second Mid-term Development Plan (RPJM), mentioned above, the Ministry of Culture and Tourism has endorsed a Five Year Plan for the period from 2010 to 2014, popularly known as RENSTRA (Strategic Plan of the Ministry for Culture and Tourism), which is being translated into programmes and activities.
MCT’s strategic plan essentially focuses on three main programmes, namely (1) the destination development programme, (2) the marketing development programme, and (3) the (human) resource development programme.
The destination development programme is aimed at improving the quality and capacity of tourism businesses, industries and investments. It is focused on improving the competitiveness of Indonesia within the global market by increasing tourist expenditure and length of stay. Priorities include the development of tourism businesses, industries and investment; standardization and development of attractions in selected regional destinations and community empowerment.
44
Measuring Employment in the Tourism Industries beyond a Tourism Satellite Account: A Case Study of Indonesia
The marketing development programme is aimed at ensuring that marketing becomes the mainstay of an integrated and sustainable tourism development programme, improving the capacity of non-oil and gas foreign exchange earnings and improving the distribution of tourists’ mobility and trips within the country. It is focused on increasing demand for domestic tourism packages, generating tourism events (within the country and abroad) as well as improving the participation of stakeholders and information services. Priorities include more creative domestic and international promotion, improved market information and publications, as well as capacity development for the meetings, incentives, conference and exhibitions (MICE) industry.
The resource development programme is aimed at improving the quality and increasing the quantity of cultural and tourism (human) resources as well as improving the professionalism and adaptability of stakeholders. The focus is mainly capacity building through training, education and research development within the Ministry.
In 2009, MCT prepared a National Tourism Master Plan, which is in the process of being enacted into a Government Regulation at the present time.
There are two important points to bear in mind when considering tourism employment issues:
(i) tourism is not only an industry for the private sector to be concerned with, government services and community participation are equally critical to the success of the industry; and
(ii) not only the tourists need to be taken care of, the host population needs to be cared for as well. The host population has an equal right to become tourists themselves.
Tourism employment issues include employment in those public sectors that deal directly or indirectly with tourism, but also include employment at the community level and within the informal sector, which serves tourists or the tourism industry too.
Yet so far, tourism employment statistics have not dealt with public sector employment, the informal sector or other unincorporated businesses.
Based on the directives in the RPJP and MCT’s RENSTRA, there is a need for data on:
(i) The existing micro condition of employment at the industry establishment level to be obtained from establishment surveys and public sector employment at the local level from government organization surveys to be sampled from the whole country and signifi cant tourism provinces, in particular;
(ii) Considering its signifi cant role in employment creation, general data on the informal sector to be obtained from primary surveys and local governments. We also need an inventory of the informal sector for controlling policy more than retribution collection. The local government, as the most knowledgeable and capable stakeholder for getting this information, is crucial;
(iii) Income and improved welfare of the tourism dependent households to be obtained from household surveys conducted during the population census, national labour force survey (SAKERNAS) and/or national economic survey (SUSENAS); and
(iv) Education and training facilities and their supporting supra structures to be obtained from MNE, MMT’s administrative fi les or via institutional surveys.
Considering that the regional/provincial TSAs have shown a wide gap between one and the other, it is important to note that statistics and other data also need to be analyzed at the provincial level with breakdowns for districts/cities.
It is of prime importance to really measure how far tourism has contributed to a decrease in unemployment and an increase in the populations’ welfare (income and beyond) at both the macro national level and the provincial/micro levels. In order to strengthen economic competitiveness, create a quality industry and
45
consistently place poverty alleviation and environment sustainability at the forefront, we need both labour and thoughtful human resources to be innovative and creative through higher education. Innovative and intelligent human resources are needed for policy formulation and development planning, which requires a population with more advanced education (higher education not only limited to the hospitality industry, but to other sectors among tourism’s multidimensional possibilities, including research and others).
Higher education and research need to be supported by human resources. Tourism policy and planning (not only in manpower) need to be based on applicable research. Tourism education also needs to be developed and tailored to the needs of the country, which takes into account the international standards/modules. These international standards do not necessarily need to be strictly followed, rather they should be used as guidelines and made to fi t the Indonesian context.
Data from the surveys mentioned above are needed to help us understand:
(i) The existing condition of tourism employment and its contribution to the specifi c development goals, including abolishing unemployment, poverty and gender inequalities, and to see whether tourism employment provides decent pay, despite there being existing regulations on minimum wages, this may not apply for part-time and temporary workers;
(ii) Whether government employees are fi t to support and control the growth and development of the tourism industry;
(iii) The condition of work in the tourism industries; and
(iv) Whether the supply and demand of human resources is balanced.
3.4 A Way to Go
The UNWTO and the UN Statistics Division, based on worldwide consultations and inputs from leading international organizations, have prepared a revised International Recommendations for Tourism Statistics 2008 (IRTS 2008), which are taken into consideration by the Central Bureau of Statistics, BPS. In writing this Case Study, special attention has been given to IRTS 2008 “Chapter 7: Employment in the tourism industries.” Most of the defi nitions and the methods of collection recommended within the IRTS 2008 have been adopted. The general issues that Indonesia faces include:
Budget availability to undertake the selected surveys more often due to the magnitude of the country, resulting in limited sample sizes and geographical distributions not covering all administrative units. Bearing in mind the importance of these statistics, an increased tourism budget for these matters needs to be proposed and allocated;
Budget availability and demand from MCT also determines the kinds of establishments surveyed. As a result of developments in the tourism industries in recent decades, there is an increasing number of establishments other than those already surveyed that need to be included. The transportation industry, for instance, even though it is not managed by MCT, is an important part of the tourism industry. Others classifi ed as country-specifi c industries also need to be defi ned and agreed upon among stakeholders.
Data content and reliability. For the formal sector, there should be records on employment and payroll matters that can be periodically reported and used as a reference rather than collected from interviews. Some information can be collected in the regularly undertaken surveys with the addition of simple questions.
As far as the provincial TSA is concerned, data on international tourist expenditure is needed. There is a limitation on the availability of this kind of data in certain provinces due to the distribution of respondents
46
Measuring Employment in the Tourism Industries beyond a Tourism Satellite Account: A Case Study of Indonesia
during the Passenger Exit Surveys known as PES. The construction of regional TSAs for provinces is facing a number of constraints, including:
(i) The lack of political will from the regional authorities and (or due to) lack of understanding on the importance of TSA as a means to understand tourism performance for policy formulation and decision-making by the provincial government or the offi cial in charge of tourism;
(ii) The budget needed for the regional TSA is not allocated or prioritized. Even when it is, most of the time it is underestimated due to the misperception/understanding of the project. Data is often incomplete and an update has to be undertaken before preparing the TSA;
(iii) The absence of offi cial/s with proper understanding and opportunity has resulted in the outsourcing of consultants and data collection activities;
(iv) MCT has observed that in some instances, lack of cooperation and coordination between the regional tourism offi cials and the regional statistical offi ces has caused further challenges during preparation of the TSA;
(v) In the above mentioned situation, the regional government then relays the preparation of their regional TSA to the central government (MCT), which in their view is the Ministry responsible for preparing the TSA. It is impossible for the Ministry to prepare the regional TSAs for all provinces/regions at once and if it is done sequentially, it will take many years to fi nish, becoming outdated before it is even completed;
(vi) As far as technicalities are concerned, there are also diffi culties in collecting data on the number of tourists in a certain province or region. This is caused by the free movement between provinces whereby not all ins and outs are recorded. Airports, stations, terminals and toll gates maintain records, but the recorded numbers are less than the movements/visits among provinces; and
(vii) Last but not least, even the most popular tourism province, Bali, was not keen to prepare their own and depended upon the central government to prepare their regional TSA. Even the capital region, DKI Jakarta, which has an abundant budget, has prepared a single TSA (2009) since their last one in 2004, with the consequence that the trend or ups and downs of the various indicators are not known.
With regard to these above mentioned issues and the necessity of the TSA at both the national and regional/provincial levels, the following steps need to be taken:
(i) A joint, country-wide, executive awareness programme between MCT and BPS on the importance of TSA and how it can be used for policy making and decision support systems;
(ii) Encouragement for developing a tourism database. Advocacy in this matter requires a central initiative to provide regional and local offi cials with standardized training to help them understand the need for data in tourism development and planning as well as methods of collection. There is a need to underline the fact that local governments are an important source of local-specifi c information, which can help them and the central government to pave the development path/s;
(iii) Advocacy also needs to be directed at tourism industry associations as well as workers’ associations in order for these groups to participate in the eff ort to provide the government with reliable information for formulating appropriate policies and regulations;
(iv) Policies on the integrated eff orts of BPS regional offi ces and tourism offi ces need to be institutionalized, possibly through a Surat Keputusan Bersama (joint decree) between BPS and MCT. As a result, a
25 It needs to be understood that not only the promotional budget needs to be enlarged but also the budget for basic needs in tourism development.
47
budget must be proposed through the necessary bureaucracies and agreed to by the legislative body.25 Short courses/training needs to include offi cials beyond BPS, in order to ease mutual understanding;
(v) Existing data base processing needs to be undertaken to maximize the possibility of exposing tourism-related information, including but not limited to employment and workforce statistics, in order to better understand the labour market and other employment and decent work-related data;
(vi) Mapping and evaluation of existing tourism education undertakings at various levels and market absorption of their graduates, leading to a National Human Resources Development Plan;
(vii) Special studies in selected provinces. Based on the fact that tourism in diff erent provinces has diff erent positions, roles and characteristics (demand, supply and employment), it is necessary to select a number of provinces that play a strategic role in tourism to be surveyed in-depth. This can enable better understanding and avoid a possible misinterpretation of the national statistics. This statement can be justifi ed by looking at the regional/provincial TSA variation, compared to the national TSA as presented in Table 3.3.;
(viii) A special study on those tourism-related informal sectors in selected locations; and
(ix) A review of the need to expand and improve the Passenger Exit Survey (PES) as well as the domestic tourism database and the way that data is processed in order to show inter-provincial movement (as previously prepared in 1984).

48
Measuring Employment in the Tourism Industries beyond a Tourism Satellite Account: A Case Study of Indonesia
49
4.1 Background
It is not always easy to determine a reference system for Indonesia as an archipelagic country. Historically, in certain cases, Indonesia inherited the Dutch system, which was then modifi ed to cope with the present demand situation. There are many things that caused irrelevancies in adopting any one country’s system, whether its statistical concept in general or tourism statistics in particular. Considering tourism is a geographical phenomenon, a geographical point of view is worth considering when looking for reference/s. Domestic tourism is related to the geographic and population size of the country. Interstate/inter-provincial travel is common and represents a dominant proportion of the total number of tourists in a country comprising a large region and population. The diff erence between developed and developing countries usually lies in the proportion of domestic and international tourists; the developed countries, because they are either source markets or destinations, have a higher proportion of international tourists. Due to the geographical extent of Indonesia, two references are taken into consideration, Australia and Canada, because both are developed countries with large geographical areas. Both countries are among the most developed countries in the centralized statistical system. The tourism statistical system in these two countries is outlined in the following subchapters. For a more elaborate description, the appendices describe these countries’ methodologies for collecting tourism-related employment data. The idea for benchmarking tourism statistics originated from two examples of best national practices in measuring employment in the tourism industries; those examples are based upon Australia and Canada’s experiences.26 Later on in this chapter, the Indonesian case study is presented.
An Approach for Collecting a Wide Set of Data on Employment in the Tourism Industries:Benchmarking for Indonesia’s Tourism Statistics
Chapter 4
26 Complete texts of the Australian and Canadian cases are attached as Appendix I and II, respectively.
50
Measuring Employment in the Tourism Industries beyond a Tourism Satellite Account: A Case Study of Indonesia
4.2 The Case of Australia
Offi cial national data appear in Australia’s Tourism Satellite Account (TSA) and are based on a combination of sources.
Tourism employment is derived somewhat simplistically for each industry by applying the tourism value- added industry ratios from each of the benchmark years to employment estimates for each industry in subsequent years. The employment estimates between benchmark years are then smoothed. This method of using the tourism value added industry ratios involves an assumption that the employment generated by tourism in each industry is in direct proportion to value-added generated by tourism in the benchmark year.
Details of employment by industry are collected in the Labour Force Survey (LFS) in February, May, August and November. Estimates of the number of employed persons by industry and in total are calculated as the average of these four months. Total employment is derived by adding employment in the defence forces to the civilian labour force. To the extent that the survey months exclude the major Christmas holiday period, there could be some downward bias in estimates for the tourism industries.
The exceptions are accommodations, travel agencies, cafes and restaurants, clubs, pubs, taverns and bars, casinos and other gambling services, and air and water transport industries, where employer survey data have been used when available. Employment in these industries has been extrapolated using movements in the LFS for the updated years.
Some of the tourism industries in the TSA have been compressed in tables relating to employment because the LFS is not designed to produce estimates of suffi cient accuracy for some of the fi ne-level industries in the TSA.
4.3 The Case of Canada
Offi cial national data appear in the Canadian System of National Accounts (CSNA) and the Canadian Tourism Satellite Accounts (CTSA) and are based on a combination of sources. The CSNA includes data on labour income by industry, including tourism industries, while the Canadian Productivity Accounts, which are part of the CNSA, include data on employment, wages and hours of work by detailed industry. Both of these Accounts use a combination of data sources which span a wide range, including the LFS, SEPH, administrative data, tax returns, surveys of businesses operating costs, etc.
In addition, Statistics Canada produces a Tourism Satellite Account (TSA) which includes estimates of the number of jobs and labour compensation directly attributable to visitor spending in both tourism and non-tourism industries. The TSA draws on the Canadian Productivity Accounts Database for its estimates of tourism employment (i.e. an estimate of the number of jobs that can be directly attributed to tourism spending). The following method is applied:
Like tourism GDP, tourism employment is calculated at the industry level. Therefore, the employment calculation uses the same industry ratios as GDP to calculate the tourism portion of each industry. Therefore, if the ratio of tourism demand for the outputs of an industry to its total gross output (at basic prices) is 50%, half of this industry’s employment is allocated to tourism. A similar calculation is conducted for all industries and then the results are summed up to arrive at total tourism employment within Canada;
The benchmark tourism employment estimates in the TSA form the basis of estimates for quarterly employment directly attributable to visitor spending in the tourism and non-tourism industries in the National Tourism Indicators (NTI) Quarterly Estimates. The NTI employment estimates are carried
51
forward on annual patterns of growth observed in the Productivity Accounts and quarterly job series from SEPH by industry; and
Finally, even more detailed information is available in the Tourism Human Resource Module (HRM) of the TSA. The HRM is based on and rooted in the accounting framework of the Canadian TSA, which follows the international guidelines outlined in the Tourism Satellite Account: Recommended Methodological Framework (TSA: RMF). It carries information on the number of employee and self-employment jobs, full-time equivalent employment, total hours worked and labour income, gross wages and salaries and supplementary labour income, by industry. For employee jobs, this information is available by occupation, gender, age group and immigrant status. Owing to the large amount of occupation and demographic detail, the industry dimension of the HRM is broken down from the data in the TSA. The HRM includes details on 6 industries: air transportation, other transportation industries, accommodations, food and beverages services, recreation and entertainment, and fi nally, travel services.
4.3.1 Human Resources Module of CTSA 2009
Tourism HRM of the Canadian TSA consists of the following fi ve main tables:
Table 1. Gross domestic product, tourism, GDP, tourism expenditures and jobs in tourism industry and total economy
Table 2. Annual compensation and hourly compensation in tourism industries and total economy
Table 3. Jobs in tourism industries and total economy
Table 4. Weekly hours worked in tourism industries and total economy
Table 5. Employee jobs, hours and wages by employee characteristics in tourism industries
4.4 Lessons Learned from Australia and Canada
In general, Australia and Canada share a common methodology, referring to the System of National Accounts (SNA) 1993, which has since been updated. SNA 2008, the most recent revision, does not diff er much from the preceding one, especially with regard to Satellite Accounts. Data availability/quality has always been the constraint that Indonesia faces.
The Social Accounting Matrix (SAM) framework explicitly incorporates various crucial transformations between variables. These include mapping the factorial existence, particularly the labour factor income distribution from the structure of production as well as mapping the household income distribution from labour and other factors supplied by various household groups.
Statistics Canada set up a comprehensive system of national accounts complemented by sub-accounts and modules, such as the Productivity Account (PA). The PA data consists of employment, wages and hours of work by detailed industry, including the tourism industry. Statistics Canada also compiled a TSA that included an estimate of the number of jobs and labour compensation directly related to visitor’s expenditure. National Tourism Indicators (NTI) are also released in order to link the employment data and the tourism expenditure data in the TSA.
Signifi cant eff orts are made by Statistics Canada to compile the Human Resource Module (HRM). The HRM includes details of the main industries related to TSA, namely transportation, accommodation, food and beverage, recreation and entertainment, and travel services. The HRM complements and enhances
52
Measuring Employment in the Tourism Industries beyond a Tourism Satellite Account: A Case Study of Indonesia
the analytical capacity provided by the TSA and NTI allowing for broader insight into tourism’s role in the economy.
All of the above described systems, modules and indicators compiled by Statistics Canada are derived from data available as a result of various surveys such as LFS, SEPH, Survey of Business Operating Costs (SBOC), administrative data records, etc.
The main table format in the HRM is the annual time series data on number of jobs and average hourly compensation. That data breakdowns into detailed tourism-related industry statistics. Other tables in the tourism industry profi le are provided to deal with share of employee jobs, gender issues, age group classifi cation and immigration status.
4.5 The Case of Indonesia
4.5.1 Background
The approach to data collection in Indonesia is closely related to the collection and adoption of our national development strategy. This strategy was largely predetermined by a set of more or less interrelated and consistent policies and its specifi c selection depended on the following:
the prevailing development objective derived from formal or legal documents released by the legislative body for the guidance of executive agencies in the government;
the existing body of theories, hypotheses and models derived from academic literatures; and
the underlying data systems available to diagnose the current situation and to measure performance.
Data systems do not exist independent of a conceptual framework. An integrated framework is necessary in order to plan policies in which multidimensional objectives are considered and to estimate the result of various policy combinations. In a broad sense, a conceptual development principle has to be built for which policymakers can use as a guideline when formulating socio-economic policies.
One comprehensive framework for socio-economic analysis is the System of National Accounts (SNA). Depending on analytical requirements and data availability, emphasis within the central framework may vary by using the system’s classifi cation of institutional sectors, industries, products, transactions, etc. at various levels of detail by using diff erent methods, diff erent frequencies and diff erent priorities, by rearranging the results, or by introducing additional elements.
In certain types of analysis, the main intention is simply to focus on a certain fi eld or aspect of economics and social life such as the Tourism Satellite Account. Various aspects of production and consumption activities connected with tourism may appear in detailed classifi cation of activities, products and purposes.
Analysis, however, requires a framework. Building a conceptual framework which brings together growth, distribution and employment comprehensively with special reference to the tourism sector is the main theme of this study. Such a framework should be based on two pillars:
1. A modular analytical framework specifying for a set of interconnections and interrelationships between sub-systems; and
2. An elaborate complementary data and classifi cation system.
53
4.5.2 Preparing the TSA for Indonesia
During the 1998 national economic crisis, tourism was among the sectors signifi cantly impacted, as indicated by both negative and positive growth. The number of international tourists visiting Indonesia was declining, although outbound tourism experienced a considerable increase. Domestic tourism was also increasing signifi cantly. This situation encouraged the government to understand tourism’s contribution to the national economy. With limited information from the supply side, Indonesia started to discuss the possibility of applying the demand side approach, developed and applied in Canada and elsewhere, in Indonesia. Concerning this possibility, intensive discussions were held between the Department of Tourism, Posts and Telecommunications, the Central Bureau of Statistics (BPS) and the Bank of Indonesia (BI). With reference to the Canadian TSA, it was decided that Indonesia would prepare their own TSA, known as Neraca Satelit Pariwisata Nasional (NESPARNAS).
The main diffi culty in preparing the TSA, experienced by other countries as well, is the availability complete and accurate demand side data. Indonesia, a member country, was invited to a regional workshop in 2008 on Tourism Statistics held by UNWTO and the United Nations Economic and Social Commission for Asia and the Pacifi c (ESCAP) held in Bangkok and attended by offi cials from the Department of Tourism, Posts and Telecommunications (the Ministry of Culture and Tourism before being reorganized and renamed), BPS and BI. Indonesia has so far been regularly collecting data on international tourists’ arrivals through their immigration cards and on their expenditure through the Passenger Exit Survey. Data on domestic tourism was available but rather out of date; surveys concerning domestic tourism were not regularly (annually) undertaken. Indonesia is also equipped with the I-O Table. All of these are vital statistics needed for the preparation of a TSA.
In 2000, when it was decided to assemble a national TSA, some data was still missing. Domestic trips and expenditure were estimated from a special module in the National Socio-Economic Survey (SUSENAS). Data on investment was estimated through a component of GDP, namely the Gross Fixed Capital. Government expenditure for tourism was collected from the administrative records of the Central and Provincial Government budget for tourism purposes.
The ultimate goal in preparing the TSA was to gather fi gures on the economic impact generated by the demand for goods and services resulting from tourism activities. With this method, the direct and indirect impact of tourism toward output, value-added, indirect tax, wages and salaries, and employment can be calculated. The results of Indonesia’s TSA were reported to UNWTO and presented at a UNWTO seminar in 2003, which was organized with the cooperation with the Philippine Government in Manila. Thailand and Australia also presented their respective TSAs at the seminar.
MCT and BPS have disseminated the results of Indonesia’s TSA to the provincial governments and, having stressed the importance of TSA at the provincial level, encouraged them to prepare their respective provincial TSAs in order to know the magnitude of tourism’s contribution to their economies.
Based on the results of periodic seminars, BPS has taken the initiative to improve the database and to further develop the methodology. The latest NESPARNAS (Indonesian TSA) was prepared in 2010, utilizing data from 2008. Eff orts to shorten the time-lag between data collection and preparation of the NESPARNAS are continuously being made.
The BPS’s advocacy has encouraged several provinces to prepare regional TSAs (NESPARDA – Neraca Satelit Pariwisata Daerah). The provinces that have prepared NESPARDA are DKI Jakarta (2004 and 2009), Bali (2007), South Sumatra (2006), Riau (2007), Banten (2008) and Central Sulawesi (2008). In 2011, West and Central Java are preparing their own NESPARDA.
54
Measuring Employment in the Tourism Industries beyond a Tourism Satellite Account: A Case Study of Indonesia
4.5.3 Follow-up steps
BPS is regularly developing their methodology and improving the data requirements. At present, BPS claims that they are quite advanced, and have the capacity to share their experience with other UNWTO member countries. In 2010, Indonesia was still receiving technical assistance from the Asia-Pacifi c Economic Cooperation (APEC) in order to stimulate the provincial governments to prepare their regional TSAs. In terms of methodology, nothing new has been developed. The problem remains the limited availability of data.
This section tries to identify possible steps for setting up a more stable system for collecting data on employment in tourism industries for the next TSA. While dissemination is a must, database improvement is another key factor in the timely preparation of regional TSAs. To accumulate quality data, we need larger sample sizes and cooperation from the population and establishments to provide reliable information in the surveys. At the same time, methodology should continuously be improved upon. Provinces also need to update their TSA, as DKI Jakarta did in 2009; TSA it is not a one time exercise, fl uctuation may direct certain policy responses. In order to maintain good indicators and sustain its relevancy, the TSA needs to be updated often.
Information sharing among provinces at national seminars is essential in order to understand each other’s socio-economic conditions and for better positioning of each province within the national context.
Integrated eff orts by BPS, MCT and MMT to build the capacity for the compilation of TSA, Modules, Indicators and Related Accounts need to be developed to elicit a shared understanding of TSA and improved results.
We need action plans to encourage, via a specially assigned team, comprehensive discussions and evaluations of Indonesia’s TSA as well as assessments of the existing statistics related to tourism such as GDP, I-O, SAM and FOF. We require facilitation and support to carry out Focus Group Discussions (FGD) or workshops attended by stakeholders concerned with tourism, particularly for setting up activities to compile HRM, NTI, PA and the related methodologies. Involvement of tourism and statistical scholars is positive for all parties.
Extracting existing tourism-related and employment-related data from various censuses, surveys, administrative records and other potential sources needs to be further explored before designing another survey; thus making the best use of limited budgets. Stakeholders must toil together to increase their budgets for a better tourism database for an improved decision and policy support system. In fact, with a larger budget, tourism databases with an emphasis on employment-related statistics at the national and regional levels can be stimulated and developed.
The above mentioned follow-up steps can contribute to better data collection for an ever growing sector that plays a signifi cant role in both the national and regional economies, which translates into a better policy and decision-making apparatus. A renewed Memorandum of Understanding (MOU) between MCT and BPS, and perhaps involving MOMT, needs to be considered.
55
5.1 ILO Decent Work Agenda
Decent work is a refl ection of the strategic objectives of the ILO, which has been promoted since 1999. Acknowledging the objectives of decent work, developing and transition countries have either developed or are in the process of developing their own decent work strategies. Decent work objectives were endorsed by the international community when Heads of State resolved to make the goal of full and productive employment and decent work for all part of the eff ort to achieve the Millennium Development Goals at the 2005 World Summit. The 2006 Ministerial Declaration of the UN Economic and Social Council (ECOSOC) also underlined the importance of decent work and called for the whole multilateral system to mainstream the goal of full employment and decent work in their policies, programmes and activities. Europe Aid actively supports raising awareness and enhancing understanding of decent work. The 2008 ILO Declaration on Social Justice and a Fair Globalization encourages member states to consider the establishment of appropriate indicators or statistics, to monitor and evaluate the progress made towards decent work for all.27
5.2 ILO Decent Work Indicators
A project on Monitoring and Assessing Progress on Decent Work (MAP) has been developed with the assistance of ILO. The project incorporates ten countries, including Indonesia. The immediate objective of the project is to develop a global methodology to strengthen the capacity of developing and transition countries to self-monitor and self-assess progress towards decent work using a selection of Decent Work Indicators. The indicators and statistics are useful tools for understanding a country’s performance.
The ILO Country Offi ce for Indonesia (also known as ILO CO-Jakarta) took the initiative to develop their own decent work indicators. The initiative was started in 2002-3 and was followed by phase two in 2004-5.
Tourism and Decent Work in Indonesia
Chapter 5
27 Summarized from Diah Widarti, Monitoring and Assessing Progress on Decent Work in Indonesia: National Background Study (Jakarta and Geneva: International Labour Offi ce, 2010).
56
Measuring Employment in the Tourism Industries beyond a Tourism Satellite Account: A Case Study of Indonesia
Following consultations with ILO constituents, the fi rst Decent Work Country Programme (DWCP) for Indonesia was formulated for the period from 2006 to 2010. In brief, Indonesia’s DWCP is founded and aligned with key policy frameworks of the ILO, the UN system and the Indonesian Government.
The DWI is categorized into 4 groups of indicators, namely
(i) employment: structural changes, short term trends, un/underemployment, informal sector, wages and remuneration, hours worked;
(ii) social protection: coverage of social security, percentage of social assistance to the GDP;
(iii) social dialogue: membership in trade unions, number of enterprises belonging to employers’ association, coverage of company regulations and collective labour agreements, strikes and lockouts; and
(iv) rights at work: non-school participation of children 7 to 15, percentage of women working in International Standard Classifi cation of Occupations (ISCO-2 1969), number of cases brought to the committee of labour dispute settlement.
The Indonesia DWCP for 2006-10, which has been appraised by the Regional DWCP Support Group for quality assurance and endorsed by the Indonesian tripartite constituents, focuses on three main priorities which are:
1. Stopping exploitation at work – This fi rst priority focuses on a more eff ective application of policies and laws to reduce the worst forms of labour exploitation. The RPJM and the MMT’s RENSTRA also identifi ed the vulnerability of children and women migrant workers as a serious issue, which was acknowledged in the United Nations Development Assistance Framework (UNDAF) outcome where ILO was the lead agency. This priority’s main areas of operation have been formulated, including tackling the worst forms of child labour through the implementation of the action plan prepared by the National Action Committee on the elimination of child labour;
2. Employment creation for poverty reduction and livelihood recovery, especially for youth – Depending on the threshold used, the number of poor persons in Indonesia is massive. As noted in the ILO report, based on Indonesia’s defi nition of poor, the number has been estimated at 40 million; if using US$2 per day as the determinate of the poverty threshold, the number is over 110 million (Widarti, 2010). Productive and robust employment creation is the only sustainable way to help a population out of poverty and the strategies for such an end include making employment concerns essential to Indonesia’s socio-economic planning, implementing an employment-intensive and livelihood programme for the crisis-aff ected areas of Aceh, North Sumatra and East Indonesia, as well as promoting youth employment and entrepreneurship through education, training systems and policies; and, fi nally,
3. Social dialogue for economic growth and right at work – Economic growth alone is not adequate, with growth must come equity, social advancement, and poverty reduction. The ILO’s Declaration encourages member countries to ensure social development in line with economic advancement and development through freedom of association and the recognition of the right to collective bargaining, the elimination of all forms of forced or compulsory labour, eff ective abolition of child labour, and elimination of discrimination with regard to employment and occupation. Two strategies were proposed: application of labour standards and practices, including strengthening labour administration as well as strengthening the institutional capacity of employers’ and workers’ organizations in relation to employment and labour market policies in Indonesia, and improving tripartite mechanisms for dialogue on labour and social policy issues.
The following table indicates the sources and repositories of each DWI as identifi ed in the Review on Labour Market Information/Decent Work Indicators in Indonesia conducted in 2005.28
28 Diah Widiati, A Review on Labour Market Information/Decent Work Indicators in Indonesia (Jakarta: International Labour Organization, 2005).
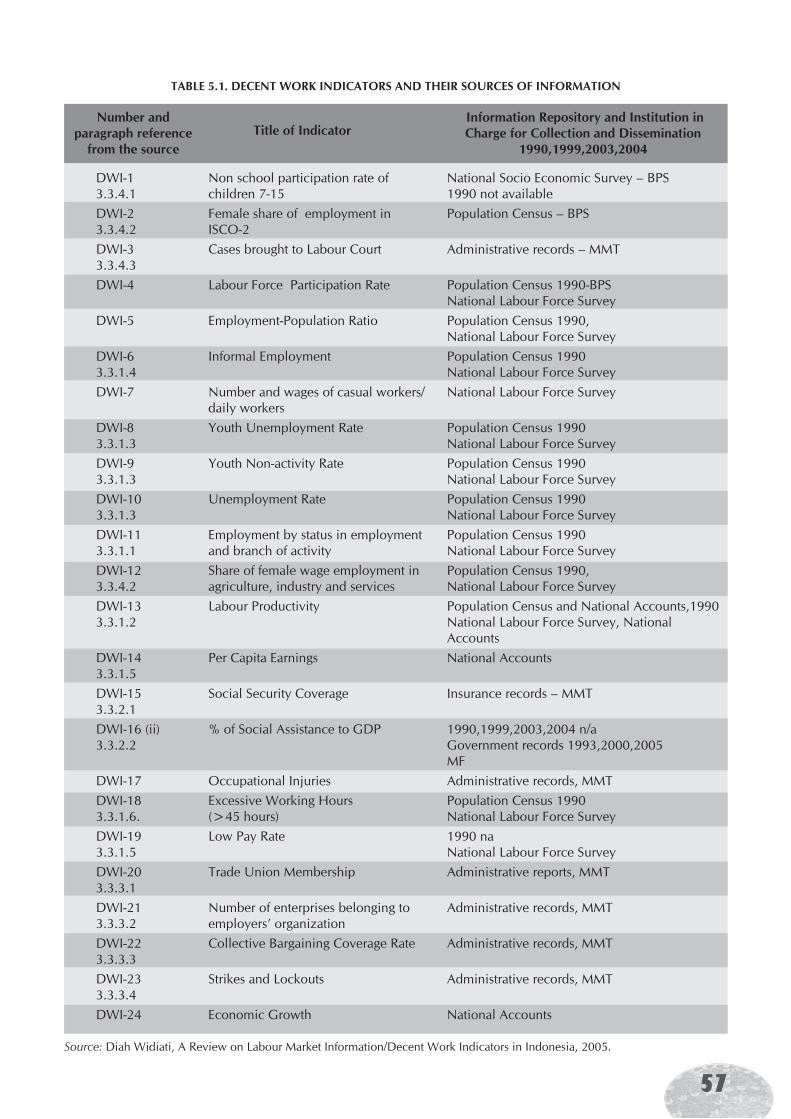
57
TABLE 5.1. DECENT WORK INDICATORS AND THEIR SOURCES OF INFORMATION
Source: Diah Widiati, A Review on Labour Market Information/Decent Work Indicators in Indonesia, 2005.
Number and paragraph reference
from the sourceTitle of Indicator
Information Repository and Institution in Charge for Collection and Dissemination
1990,1999,2003,2004
DWI-13.3.4.1DWI-2 3.3.4.2DWI-3 3.3.4.3DWI-4
DWI-5
DWI-6 3.3.1.4DWI-7 DWI-8 3.3.1.3DWI-9 3.3.1.3DWI-10 3.3.1.3DWI-11 3.3.1.1DWI-12 3.3.4.2DWI-133.3.1.2 DWI-14 3.3.1.5DWI-15 3.3.2.1DWI-16 (ii) 3.3.2.2
DWI-17DWI-183.3.1.6.DWI-193.3.1.5DWI-203.3.3.1DWI-213.3.3.2DWI-223.3.3.3DWI-233.3.3.4DWI-24
Non school participation rate of children 7-15Female share of employment in ISCO-2Cases brought to Labour Court
Labour Force Participation Rate
Employment-Population Ratio
Informal Employment
Number and wages of casual workers/daily workersYouth Unemployment Rate
Youth Non-activity Rate
Unemployment Rate
Employment by status in employment and branch of activityShare of female wage employment in agriculture, industry and servicesLabour Productivity
Per Capita Earnings
Social Security Coverage
% of Social Assistance to GDP
Occupational InjuriesExcessive Working Hours(>45 hours)Low Pay Rate
Trade Union Membership
Number of enterprises belonging to employers’ organizationCollective Bargaining Coverage Rate
Strikes and Lockouts
Economic Growth
National Socio Economic Survey – BPS1990 not availablePopulation Census – BPS
Administrative records – MMT
Population Census 1990-BPSNational Labour Force Survey Population Census 1990,National Labour Force SurveyPopulation Census 1990National Labour Force SurveyNational Labour Force Survey
Population Census 1990National Labour Force SurveyPopulation Census 1990National Labour Force SurveyPopulation Census 1990National Labour Force SurveyPopulation Census 1990National Labour Force SurveyPopulation Census 1990,National Labour Force Survey Population Census and National Accounts,1990National Labour Force Survey, National AccountsNational Accounts
Insurance records – MMT
1990,1999,2003,2004 n/aGovernment records 1993,2000,2005MFAdministrative records, MMTPopulation Census 1990National Labour Force Survey1990 naNational Labour Force SurveyAdministrative reports, MMT
Administrative records, MMT
Administrative records, MMT
Administrative records, MMT
National Accounts
58
Measuring Employment in the Tourism Industries beyond a Tourism Satellite Account: A Case Study of Indonesia
5.3 Tourism and Decent Work in Indonesia: Present Situation
This section will focus on decent work in Indonesia’s tourism sector. Among the diffi culties is the defi nition of what comprises the tourism sector. Tourism is inherently a very complex phenomenon and thus diffi cult to defi ne. One perspective looks at tourism as an industry comprising a variety of tasks centred around the more specifi c provision of goods and services for tourists. It is not a single industry, but is instead an amalgamation of industry sectors - a demand force and supply market, a personal experience and a complicated international phenomenon. Tourism incorporates social, cultural and environmental concerns beyond the physical development of a destination and marketing. It encompasses both supply and demand, more than the sum of marketing and economic development (Edgell et al., 2008).29
For Indonesia, tourism played a strategic role during the golden years from the early 1980s up until the mid to late 1990s. Indonesia experienced a severe decline in international tourism during and after the economic crisis. The crisis, though, brought some positive changes to a growing market of domestic tourists. Tourism receipts quantifying expenditure in Indonesia as gross foreign exchange earning and receipts from domestic expenditure have been measured. This data indicates that while trying to increase the country receipt from tourism, Indonesian outbound tourists spend an increasing amount of money outside the country, lessening the net receipt of Indonesia.
For a brief overview of the macro-economic indicators and employment in Indonesia refer to Tables 3.1., 3.2. and 3.3.; for a depiction of selected provincial fi gures refer to Table 3.4.
The scale of the industry and its impact, as indicated by the latest TSA, is as follows:
i. number of domestic trips (2008): 225.0 million with total expenditure: IDR 119.17 trillion;
ii. number of international arrivals (2008): 6.234 million with total expenditure: IDR 80.46 trillion or USD 7,377 million;
iii. the expenditure of outbound tourists: USD 5,397 million;
iv. impact on tax revenue: IDR 8.28 trillion, comprising 4.25% of the national total; and
v. impact on employment creation: 6.98 million, comprising 6.81% of the national total (see Tables 3.1-3.7).
Existing statistics do not comprise all elements of the tourism industry, instead they include only the most common and signifi cant elements such as accommodations, travel services, and food and beverage services. In most cases, tourism is still combined with other sectors; as a result, it does not describe the reality of the situation. On one hand, the data on tourism is incomplete, resulting in an underestimation, and on the other hand, the fi gures used also include the trade sector, which further confuse the fi ndings.
The following Tables 5.2. to 5.4. demonstrate:
i. A high percentage (59.37%) of those employed in the trade and tourism sectors, according to the survey undertaken in February 2010, are paid less than IDR 1 million per month, which translates to approximately USD 100. The case in rural areas is even worse with 76.23% of rural persons compared to 52.86% of urban persons receiving less than IDR 1 million per month in remuneration (see Table 5.2. and 5.3.);
29 David L. Edgell, Maria DelMastro Allen, Ginger Smith, Jason Swanson, Tourism Policy and Planning: Yesterday, Today and Tomorrow (United Kingdom: Butterworth-Heinemann, 2007).
The offi cially accepted UNWTO defi nition:
Tourism comprises the activities of persons traveling to and staying in places outside their unusual environment for not more than one consecutive year for leisure, business and other purposes not related to the exercise of an activity remunerated from within the place visited.
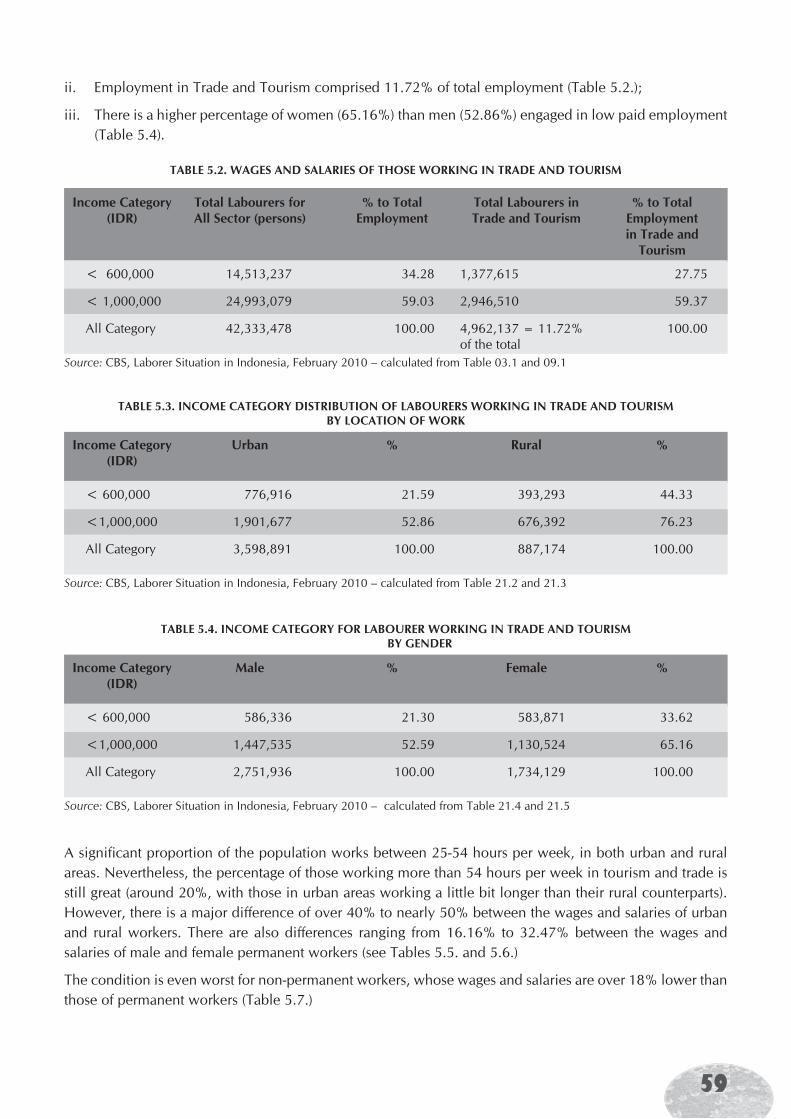
59
ii. Employment in Trade and Tourism comprised 11.72% of total employment (Table 5.2.);
iii. There is a higher percentage of women (65.16%) than men (52.86%) engaged in low paid employment (Table 5.4).
TABLE 5.2. WAGES AND SALARIES OF THOSE WORKING IN TRADE AND TOURISM
Income Category(IDR)
Total Labourers for All Sector (persons)
< 600,000
< 1,000,000
All Category
14,513,237
24,993,079
42,333,478
% to Total Employment
Total Labourers in Trade and Tourism
% to Total Employment in Trade and
Tourism
34.28
59.03
100.00
1,377,615
2,946,510
4,962,137 = 11.72% of the total
27.75
59.37
100.00
Source: CBS, Laborer Situation in Indonesia, February 2010 – calculated from Table 03.1 and 09.1
TABLE 5.3. INCOME CATEGORY DISTRIBUTION OF LABOURERS WORKING IN TRADE AND TOURISMBY LOCATION OF WORK
Income Category(IDR)
Urban
< 600,000
<1,000,000
All Category
776,916
1,901,677
3,598,891
% Rural %
21.59
52.86
100.00
393,293
676,392
887,174
44.33
76.23
100.00
Source: CBS, Laborer Situation in Indonesia, February 2010 – calculated from Table 21.2 and 21.3
TABLE 5.4. INCOME CATEGORY FOR LABOURER WORKING IN TRADE AND TOURISM BY GENDER
Income Category(IDR)
Male
< 600,000
<1,000,000
All Category
586,336
1,447,535
2,751,936
% Female %
21.30
52.59
100.00
583,871
1,130,524
1,734,129
33.62
65.16
100.00
Source: CBS, Laborer Situation in Indonesia, February 2010 – calculated from Table 21.4 and 21.5
A signifi cant proportion of the population works between 25-54 hours per week, in both urban and rural areas. Nevertheless, the percentage of those working more than 54 hours per week in tourism and trade is still great (around 20%, with those in urban areas working a little bit longer than their rural counterparts). However, there is a major diff erence of over 40% to nearly 50% between the wages and salaries of urban and rural workers. There are also diff erences ranging from 16.16% to 32.47% between the wages and salaries of male and female permanent workers (see Tables 5.5. and 5.6.)
The condition is even worst for non-permanent workers, whose wages and salaries are over 18% lower than those of permanent workers (Table 5.7.)
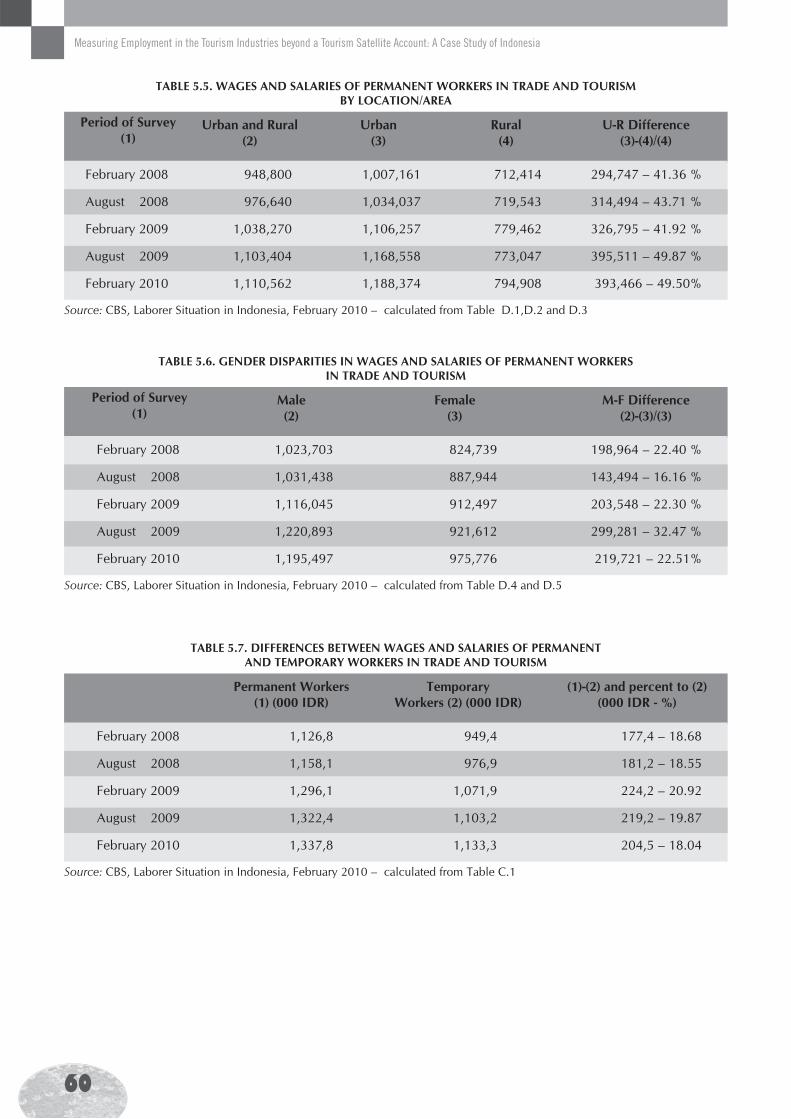
60
Measuring Employment in the Tourism Industries beyond a Tourism Satellite Account: A Case Study of Indonesia
TABLE 5.5. WAGES AND SALARIES OF PERMANENT WORKERS IN TRADE AND TOURISM BY LOCATION/AREA
Period of Survey (1)
Urban and Rural(2)
Urban(3)
Rural(4)
U-R Difference(3)-(4)/(4)
Source: CBS, Laborer Situation in Indonesia, February 2010 – calculated from Table D.1,D.2 and D.3
February 2008
August 2008
February 2009
August 2009
February 2010
948,800
976,640
1,038,270
1,103,404
1,110,562
1,007,161
1,034,037
1,106,257
1,168,558
1,188,374
712,414
719,543
779,462
773,047
794,908
294,747 – 41.36 %
314,494 – 43.71 %
326,795 – 41.92 %
395,511 – 49.87 %
393,466 – 49.50%
TABLE 5.6. GENDER DISPARITIES IN WAGES AND SALARIES OF PERMANENT WORKERS IN TRADE AND TOURISM
Period of Survey (1)
Male(2)
Female(3)
M-F Difference(2)-(3)/(3)
Source: CBS, Laborer Situation in Indonesia, February 2010 – calculated from Table D.4 and D.5
February 2008
August 2008
February 2009
August 2009
February 2010
1,023,703
1,031,438
1,116,045
1,220,893
1,195,497
824,739
887,944
912,497
921,612
975,776
198,964 – 22.40 %
143,494 – 16.16 %
203,548 – 22.30 %
299,281 – 32.47 %
219,721 – 22.51%
TABLE 5.7. DIFFERENCES BETWEEN WAGES AND SALARIES OF PERMANENT AND TEMPORARY WORKERS IN TRADE AND TOURISM
Permanent Workers (1) (000 IDR)
TemporaryWorkers (2) (000 IDR)
(1)-(2) and percent to (2) (000 IDR - %)
Source: CBS, Laborer Situation in Indonesia, February 2010 – calculated from Table C.1
February 2008
August 2008
February 2009
August 2009
February 2010
1,126,8
1,158,1
1,296,1
1,322,4
1,337,8
949,4
976,9
1,071,9
1,103,2
1,133,3
177,4 – 18.68
181,2 – 18.55
224,2 – 20.92
219,2 – 19.87
204,5 – 18.04
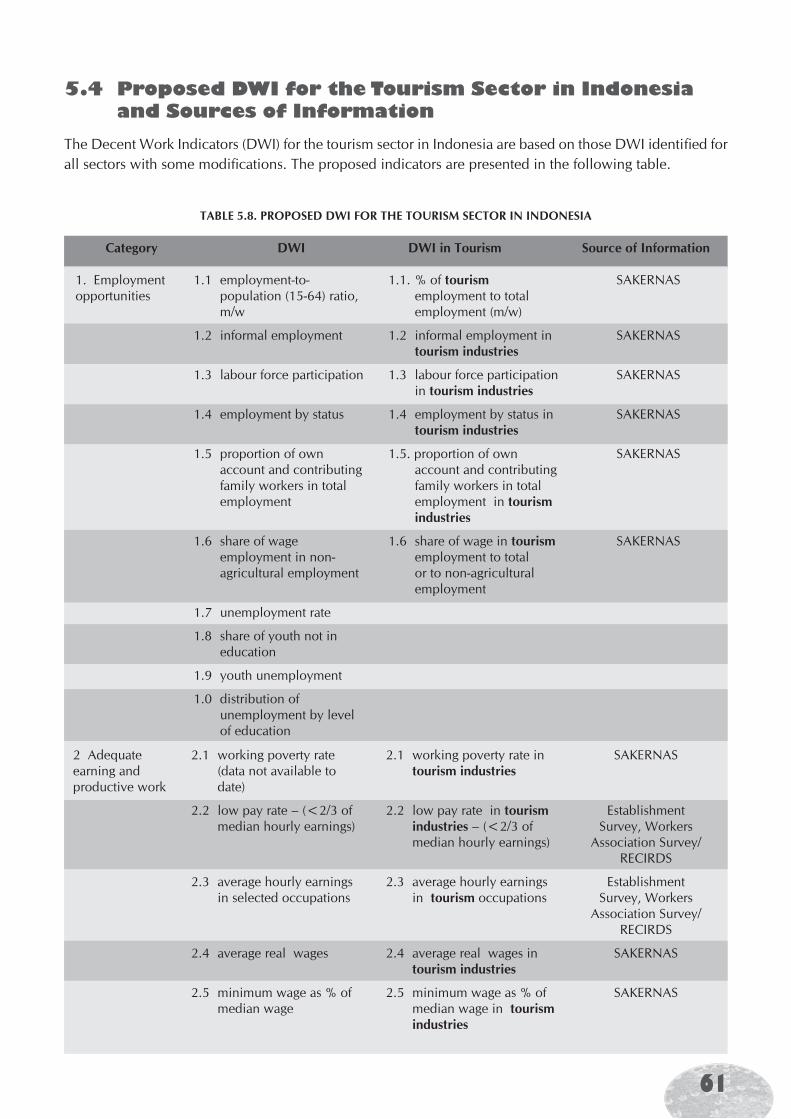
61
5.4 Proposed DWI for the Tourism Sector in Indonesia and Sources of Information
The Decent Work Indicators (DWI) for the tourism sector in Indonesia are based on those DWI identifi ed for all sectors with some modifi cations. The proposed indicators are presented in the following table.
TABLE 5.8. PROPOSED DWI FOR THE TOURISM SECTOR IN INDONESIA
Category DWI DWI in Tourism Source of Information
1. Employment opportunities
1.1 employment-to-population (15-64) ratio, m/w
1.2 informal employment
1.3 labour force participation
1.4 employment by status
1.5 proportion of own account and contributing family workers in total employment
1.6 share of wage employment in non-agricultural employment
1.7 unemployment rate
1.8 share of youth not in education
1.9 youth unemployment
1.0 distribution of unemployment by level of education
SAKERNAS
SAKERNAS
SAKERNAS
SAKERNAS
SAKERNAS
SAKERNAS
1.1. % of tourism employment to total employment (m/w)
1.2 informal employment in tourism industries
1.3 labour force participation in tourism industries
1.4 employment by status in tourism industries
1.5. proportion of own account and contributing family workers in total employment in tourism industries
1.6 share of wage in tourism employment to total or to non-agricultural employment
2 Adequate earning and productive work
2.1 working poverty rate (data not available to date)
2.2 low pay rate – (<2/3 of median hourly earnings)
2.3 average hourly earnings in selected occupations
2.4 average real wages
2.5 minimum wage as % of median wage
SAKERNAS
Establishment Survey, Workers
Association Survey/RECIRDS
Establishment Survey, Workers
Association Survey/RECIRDS
SAKERNAS
SAKERNAS
2.1 working poverty rate in tourism industries
2.2 low pay rate in tourism industries – (<2/3 of median hourly earnings)
2.3 average hourly earnings in tourism occupations
2.4 average real wages in tourism industries
2.5 minimum wage as % of median wage in tourism industries
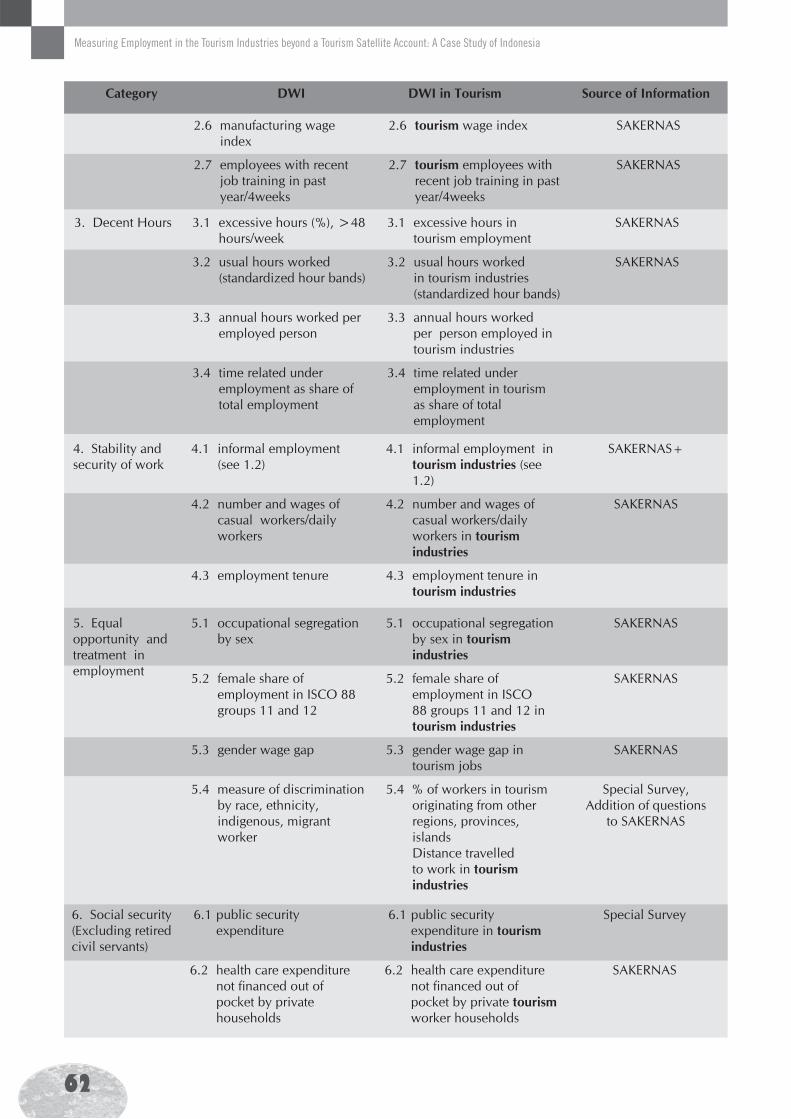
62
Measuring Employment in the Tourism Industries beyond a Tourism Satellite Account: A Case Study of Indonesia
Category DWI DWI in Tourism Source of Information
2.6 manufacturing wage index
2.7 employees with recent job training in past year/4weeks
SAKERNAS
SAKERNAS
2.6 tourism wage index
2.7 tourism employees with recent job training in past year/4weeks
3. Decent Hours 3.1 excessive hours (%), >48 hours/week
3.2 usual hours worked (standardized hour bands)
3.3 annual hours worked per employed person
3.4 time related under employment as share of total employment
SAKERNAS
SAKERNAS
3.1 excessive hours in tourism employment
3.2 usual hours worked in tourism industries (standardized hour bands)
3.3 annual hours worked per person employed in tourism industries
3.4 time related under employment in tourism as share of total employment
4. Stability and security of work
4.1 informal employment (see 1.2)
4.2 number and wages of casual workers/daily workers
4.3 employment tenure
SAKERNAS+
SAKERNAS
4.1 informal employment in tourism industries (see 1.2)
4.2 number and wages of casual workers/daily workers in tourism industries
4.3 employment tenure in tourism industries
5. Equal opportunity and treatment in employment
5.1 occupational segregation by sex
5.2 female share of employment in ISCO 88 groups 11 and 12
5.3 gender wage gap
5.4 measure of discrimination by race, ethnicity, indigenous, migrant worker
SAKERNAS
SAKERNAS
SAKERNAS
Special Survey, Addition of questions
to SAKERNAS
5.1 occupational segregation by sex in tourism industries
5.2 female share of employment in ISCO 88 groups 11 and 12 in tourism industries
5.3 gender wage gap in tourism jobs
5.4 % of workers in tourism originating from other regions, provinces, islands Distance travelled to work in tourism industries
6. Social security (Excluding retired civil servants)
6.1 public security expenditure
6.2 health care expenditure not fi nanced out of pocket by private households
Special Survey
SAKERNAS
6.1 public security expenditure in tourism industries
6.2 health care expenditure not fi nanced out of pocket by private tourism worker households
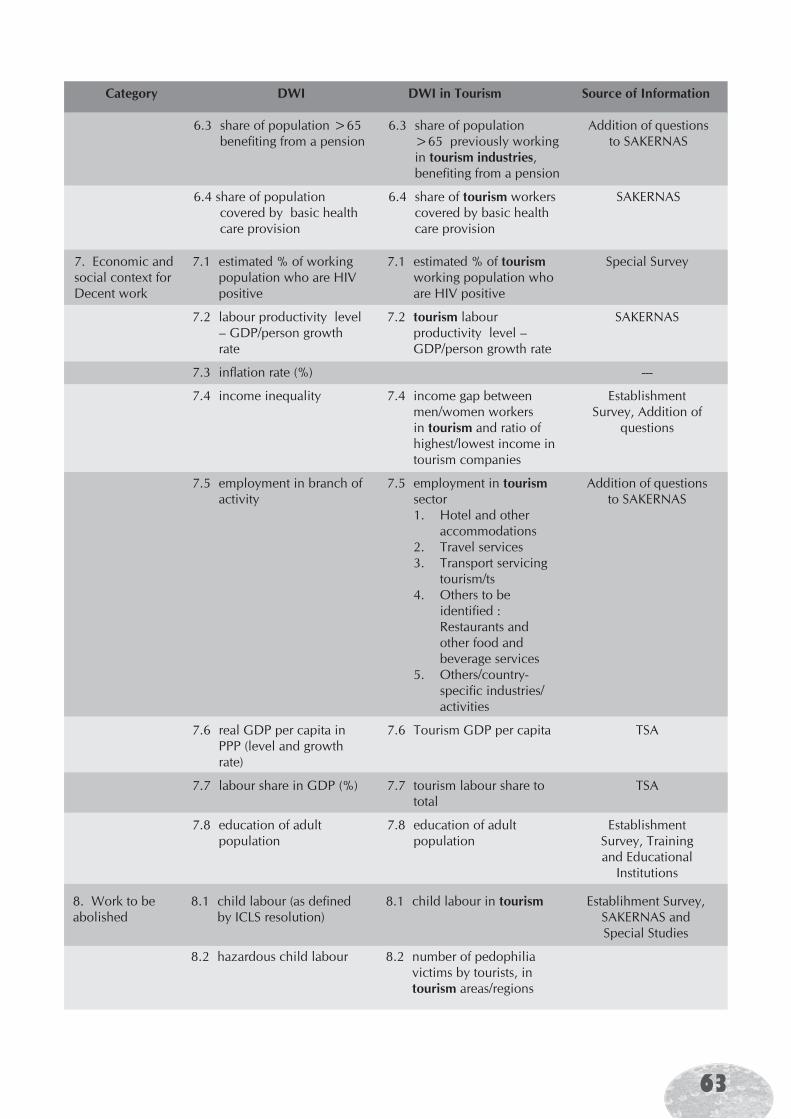
63
Category DWI DWI in Tourism Source of Information
6.3 share of population >65 benefi ting from a pension
6.4 share of population covered by basic health care provision
Addition of questions to SAKERNAS
SAKERNAS
6.3 share of population >65 previously working in tourism industries, benefi ting from a pension
6.4 share of tourism workers covered by basic health care provision
7. Economic and social context for Decent work
8. Work to be abolished
8.1 child labour (as defi ned by ICLS resolution)
8.2 hazardous child labour
Establihment Survey, SAKERNAS and Special Studies
8.1 child labour in tourism
8.2 number of pedophilia victims by tourists, in tourism areas/regions
7.1 estimated % of working population who are HIV positive
7.2 labour productivity level – GDP/person growth rate
7.3 infl ation rate (%)
7.4 income inequality
7.5 employment in branch of activity
7.6 real GDP per capita in PPP (level and growth rate)
7.7 labour share in GDP (%)
7.8 education of adult population
7.1 estimated % of tourism working population who are HIV positive
7.2 tourism labour productivity level – GDP/person growth rate
7.4 income gap between men/women workers in tourism and ratio of highest/lowest income in tourism companies
7.5 employment in tourism sector1. Hotel and other
accommodations2. Travel services3. Transport servicing
tourism/ts4. Others to be
identifi ed : Restaurants and other food and beverage services
5. Others/country-specifi c industries/activities
7.6 Tourism GDP per capita
7.7 tourism labour share to total
7.8 education of adult population
Special Survey
SAKERNAS
---
Establishment Survey, Addition of
questions
Addition of questions to SAKERNAS
TSA
TSA
Establishment Survey, Training and Educational
Institutions
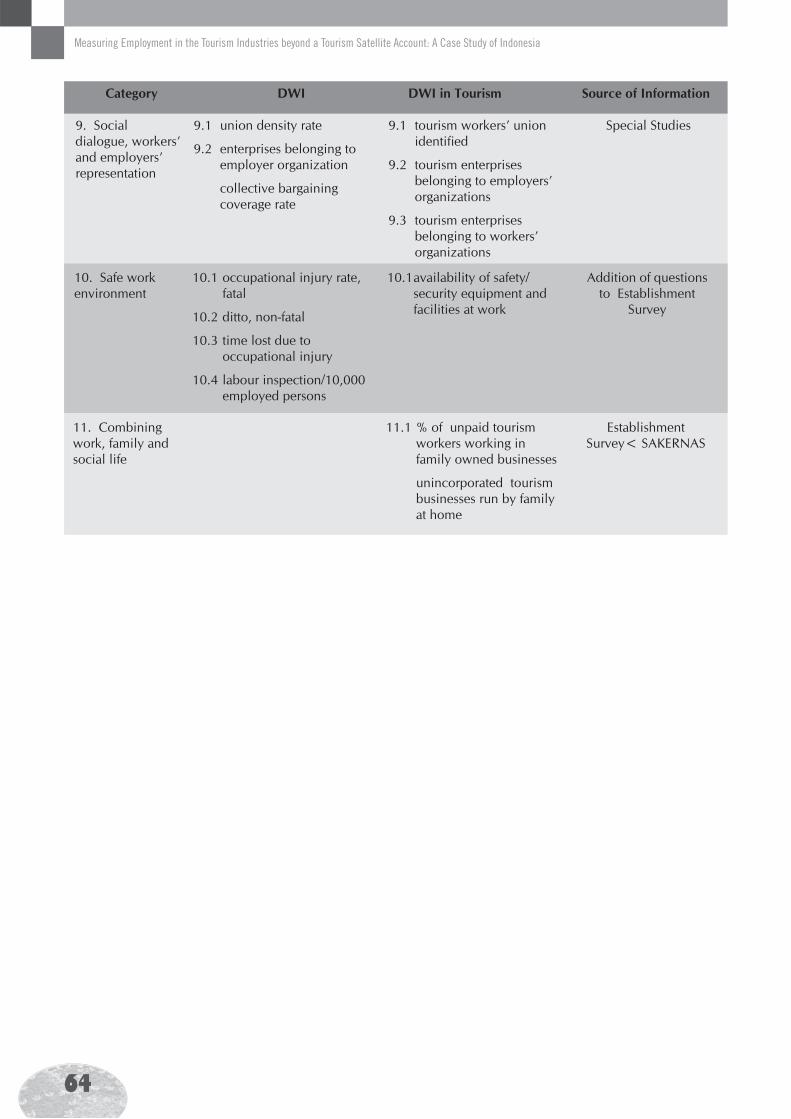
64
Measuring Employment in the Tourism Industries beyond a Tourism Satellite Account: A Case Study of Indonesia
Category DWI DWI in Tourism Source of Information
9. Social dialogue, workers’ and employers’ representation
9.1 union density rate
9.2 enterprises belonging to employer organization
collective bargaining coverage rate
Special Studies9.1 tourism workers’ union identifi ed
9.2 tourism enterprises belonging to employers’ organizations
9.3 tourism enterprises belonging to workers’ organizations
10. Safe work environment
11. Combining work, family and social life
Establishment Survey< SAKERNAS
11.1 % of unpaid tourism workers working in family owned businesses
unincorporated tourism businesses run by family at home
10.1 occupational injury rate, fatal
10.2 ditto, non-fatal
10.3 time lost due to occupational injury
10.4 labour inspection/10,000 employed persons
10.1 availability of safety/security equipment and facilities at work
Addition of questions to Establishment
Survey
65
6.1 Conclusions
Reviews of existing publications coupled with discussions with respected offi cials and other stakeholders, including education institutions, have led to these conclusions:
1. Employment statistics are important indicators for planning, policy formulation and performance monitoring, in addition to their importance for understanding and responding to the issues.
2. National statistics are important, but may be misleading for provincial and local decision-makers because of the diff erent status of tourism in each province, which fl uctuates due to diff erent regional economic structures as well as the amount and type of tourism in any specifi c region. Bali’s fi gures, for instance, are extremely diff erent than the national average and all other provinces. Provinces with a signifi cant GDP from oil and forestry will have substantial impact on the regional TSA structure. DKI Jakarta’s role in tourism is also very diff erent than other provinces. Because it is a metropolitan region, visits to the capital city are dominated by business travellers, including those visiting for meetings, incentives, conferences and exhibitions (MICE). Metropolises and big urban concentrations/cities are gradually becoming more popular travel destinations for domestic tourists and transit cities for internal tourists. Measurements in specifi c and strategic provinces/regions will help us to better understand the situation of tourism in the country and appreciate the particularities of the provinces, including the impacts on employment creation that diff er (widely) from the national picture. Information on tourism employment in selected urban areas/metropolises is needed, especially since their profi les may diff er from the regional average.
3. Regional governments might not be interested in preparing a Regional TSA, because they may have less of an understanding of the benefi ts of having one, they may not have the signifi cant budget needed to prepare one and they might hope that the central government will do it for them. There is an indication that some regions believe TSA is not needed for provinces with “successful” tourism industries or economies; therefore, provinces that have less and least developed tourism sectors seem to be more enthusiastic about preparing one.
4. Tourism industries in Indonesia have not been so inclined to conform with the international standard classifi cations; the country-specifi c tourism industries have not been defi ned and/or are not being used to compile statistical data. This condition has raised diffi culties for a) international comparisons and
Conclusions and Recommendations
Chapter 6
66
Measuring Employment in the Tourism Industries beyond a Tourism Satellite Account: A Case Study of Indonesia
b) regional comparisons, where there is no standard classifi cation of the industry and of which data to collect, except those under the auspices of BPS.
5. Important tourism establishments, such as transportation services or recreation and entertainment, have not yet been included in the establishment survey, resulting in under representation of the direct employment data.
6. Information on the informal sector, which is known to be signifi cant in tourist locations/areas, is unavailable. It is therefore crucial to undertake a major study on the informal sector within tourism industries.
7. Despite the limited tourism employment data available, there is information that can be produced from the existing databases. The National Labour Force Survey (SAKERNAS), which is undertaken twice a year (February and August) includes questions on number of days and number of hours worked in the week preceding the survey, information on place of work and industry type, type of work and work status, number of hours worked and work status, and wages/salaries from the respondents’ main job for each member of the household. The other survey, the National Socio-Economic Survey (SUSENAS), another household survey, includes questions on whether the respondent worked in the week preceding the interview, days and hours worked, net income, type of work and industry as well as status of work, which can then be cross tabulated with other variables. Both surveys provide valuable information on tourism-related employment without having to conduct extra/additional surveys.
8. There is more information needed for a policy and planning support system, which can be garnered with additional questions integrated into the existing surveys managed by BPS such as the Labour Force Survey and/or the Wages and Salaries Survey. There are other surveys that need to have their coverage extended, particularly the establishment survey. The establishment survey needs some general changes in order to obtain/maintain reliable information.
9. With regard to tourism performance indicators, employment and related factors are not popular despite the fact that reducing and ultimately eliminating unemployment are among Indonesia’s development goals. One reason for this is that not many people have access to the TSA or other insuffi ciently promoted publications.
10. There is some indication that a gap exists between tourism education and the industry. While some tourism-centred higher education institutions claim that their graduates have all been absorbed into the market, there are no records depicting the total picture, especially at the secondary education level. Many establishments have their own in-house training. Some members of the industry employ those from non-tourism schools and some data on the export of graduates exists.
11. Tourism statistics have not become a priority within the government’s programme. The budget formulated for national statistics is very limited compared to the overall budget allocated for tourism. At the provincial and local levels, the conditions are even worst, as was suggested by the lack of adequate information when it was time to prepare the regional TSAs in some provinces. Information on outbound tourists is also very limited, while an estimation of domestic tourists is not available annually. Relatively timely data is only available on a fraction of international arrivals.
12. Decent work indicators have not been popular among tourism scholars and neither have employment in the public sector or education institutions become a prime concern of employment statisticians.
67
6.2 Recommendations
Throughout the discussions conducted during the process of this study, the following recommendations surfaced:
1. First of all, Indonesia must adopt those activities included as tourism industries in IRTS 2008 and defi ne the scope of the country-specifi c tourism activities. Even if some modifi cations are made, they need to be defi ned at the national level and disseminated regionally, to be known and adopted at all levels.
2. Based on the defi nition of tourism, the following must be completed:
establishments that have never been surveyed before, with diff erent possibilities among provinces depending on their situations and circumstances, must be assessed;
specifi c surveys on the informal sector, which is assumed/suspected to be a signifi cant share of total direct tourism employment, need to be undertaken; and
databases from the previous surveys need to be used in order to identify the share and magnitude of tourism employment in the country and provincially. Wages and salaries and other information, as agreed upon, must be widely published.
3. Design a Memorandum of Understanding (MOU) between MCT and BPS (with the involvement of MMT) to establish common objectives and a shared action plan for growth, job creation, and to distribute the role of tourism industries and activities within the economy of Indonesia.
4. Construct an action plan for comprehensive discussions and evaluations of the Indonesian TSA and also for existing statistics related to tourism such as GDP, I-O, SAM and FOF to be conducted by a specially assigned team.
5. Facilitation and support to carry-out Focus Group Discussions (FGD) or workshops attended by tourism stakeholders, especially for organizing activities to compile HRM, NTI, PA and the related basic methodology, taking into consideration BPS and Statistics Canada’s lessons learned.
6. Based on Canada and Australia’s experiences, plan for special processing of a survey with the main objective to improve the existing statistics related to tourism in Indonesia, emphasizing employment in the tourism industries.
7. Provinces diff er signifi cantly in the nature of tourism in their localities; in-depth surveys/studies need to be undertaken in selected provinces to avoid misleading interpretations caused by the national fi gures. Selection of these particular provinces may be based on their contribution to GRDP (Gross Regional Domestic Product) or on the character of the tourism phenomena in respective provinces. In the western part of the country, priority needs to be given to provinces in Java and Bali where population movements are very substantial in creating internal or domestic tourism at both the national and provincial levels.
8. The following localities are suggested. The provinces of Bali, DKI Jakarta and Kepulauan Riau (where Batam is situated) are main international gateways; Daerah Istimewa Yogyakarta, East and Central Java have large domestic and internal tourist densities; West Java and Banten are strategic locations bordering the capital city; West Sumatra and North Sumatra are both provinces in need of revitalization, South Sumatra and Riau are emergent, fast-growing destinations. In addition, Riau has the locational advantage of being close to main markets: Singapore and Malaysia.
9. In the middle and eastern part of the country, priority might be given to selected provinces: North Sulawesi, South Sulawesi, Nusa Tenggara Barat and Timur. In other provinces, special studies need to be undertaken in districts with concentrations of tourists (Raja Ampat in Papua) and with strategic
68
Measuring Employment in the Tourism Industries beyond a Tourism Satellite Account: A Case Study of Indonesia
locations bordering Malaysia (Kalimantan). The selection of districts/cities for special surveys needs to be coordinated with other government programmes/activities.
10. The database “departments” in the bureaucracies need to be strengthened in both position and in terms of supporting troops. Capacity building for database development needs to be prioritized; an online system of basic data sharing between districts/cities, provinces and the national tourism offi ce must be considered for the timely information distribution needed to support the decision-making process. The challenge will be advocating for and appropriately allocating a budget for database development.
11. A special mapping study of tourism education and training facilities and their graduates needs to be carried out in order to increase budget eff ectiveness in supporting the Indonesian tourism industry.
12. Often and widely used as key performance indicators in formal publications and speeches, employment statistics can raise public and political awareness about, as well as appreciation of, the importance of tourism in the national development agenda.
13. Decent work indicators need to be disseminated and key data based on those indicators must be prepared.
69
APPENDIX I – AUSTRALIA
According to the Australian Bureau of Statistics, tourism has a major impact on the Australian economy. It aff ects many sectors of the economy and contributes to employment, exports, consumption, gross value- added (GVA) and other services. In 2003–2004, tourism contributed 3.9% to gross domestic product (GDP). Tourism also provides a signifi cant contribution to the economy of local regions within Australia. The economic contribution of tourism in Australia is dominated by domestic, not international, visitors. Tourism is also an important contributor to Australia’s export earnings.31
As follows from Sources and Methods, Labour Statistics: Employment in the Tourism Industries (Special edition),32 Australia uses the following sources for collecting data on employment in the tourism industries:
Labour force or other household-based sample surveys:
- Labour Force Survey (LFS)
Establishment surveys:
- Economic Activity Survey
- Survey of Employee Earnings and Hours (SEEH)
Administrative records and related sources:
- Travel Agency Services
In order to compile national statistics on employment, wages and hours of work in the tourism industries, the Australian Bureau of Statistics constructs the Tourism Satellite Account.
The TSA provides a comprehensive set of economic data on the direct contribution of tourism to the Australian economy within the national accounting framework. It provides a means by which the economic aspects of tourism can be drawn out and analyzed separately within the structure of the main accounts and allows for the determination of tourism’s contribution to major national accounting aggregates.
The tourism satellite account uses a model to measure the magnitude of the tourism “industry” so it can be compared on a consistent basis with other industries in the economy. Key measures include tourism GDP, tourism GVA, tourism consumption by type of visitor, and tourism employment.
Offi cial national data appear in the TSA and are based on a combination of sources.
Employment in the tourism industries is derived somewhat simplistically for each industry by applying the tourism value-added industry ratios from each of the benchmark years to employment estimates for each industry in subsequent years. The employment estimates between benchmark years are then smoothed. This method of using the tourism value-added industry ratios involves an assumption that the employment generated by tourism in each industry is in direct proportion to value-added generated by tourism in the benchmark year.
Details by industry of employment are collected in the Labour Force Survey (LFS) in February, May, August and November. Estimates of the number of employed persons by industry and in total are calculated as the average of these four months. Total employment is derived by adding employment in the defence forces to the civilian labour force. To the extent that the survey months exclude the major Christmas holiday period, there could be some downward bias in estimates for the tourism industries.
30 For detailed information, see: Australian Bureau of Statistics, “A Statistical Overview of Tourism,” Australian Economic Indicators no. 1350.0 (13 January 2006), 3-15.
31 For more information, see: ILO and UNWTO, Sources and Methods: Labour Statistics - Employment in the Tourism Industries Special Edition (Madrid, Spain: World Tourism Organization and International Labour Organization, 2008), 13-23.
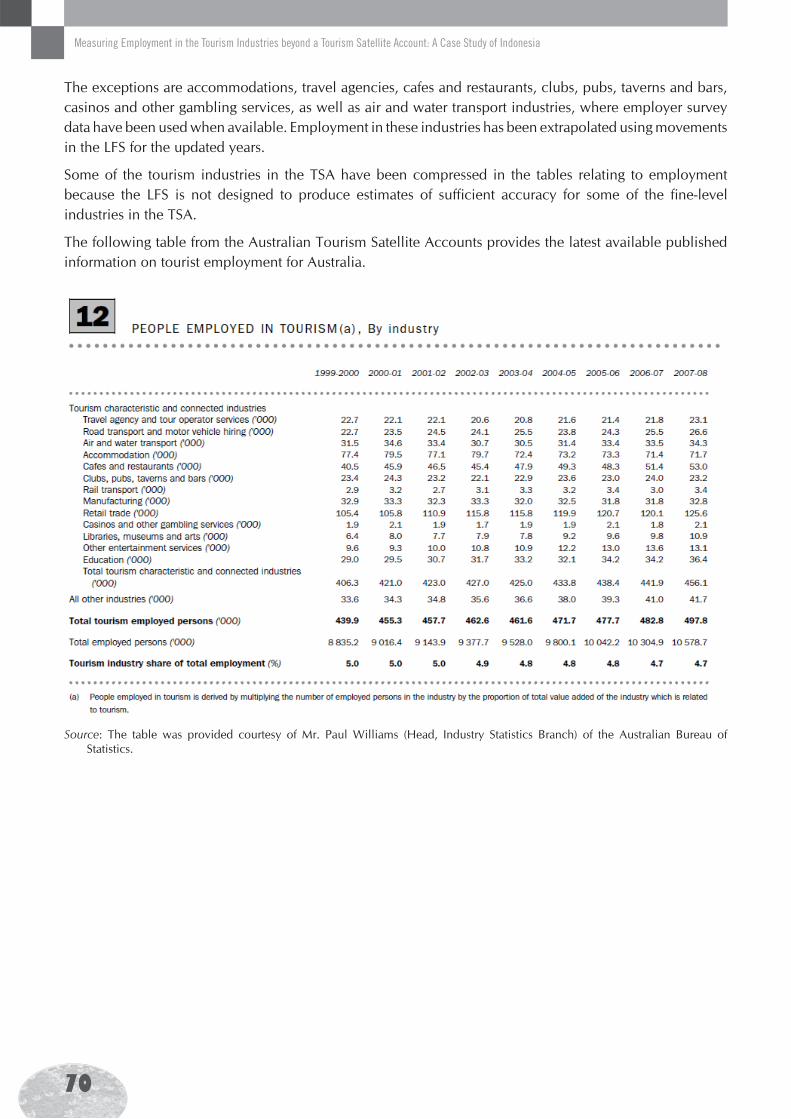
70
Measuring Employment in the Tourism Industries beyond a Tourism Satellite Account: A Case Study of Indonesia
The exceptions are accommodations, travel agencies, cafes and restaurants, clubs, pubs, taverns and bars, casinos and other gambling services, as well as air and water transport industries, where employer survey data have been used when available. Employment in these industries has been extrapolated using movements in the LFS for the updated years.
Some of the tourism industries in the TSA have been compressed in the tables relating to employment because the LFS is not designed to produce estimates of suffi cient accuracy for some of the fi ne-level industries in the TSA.
The following table from the Australian Tourism Satellite Accounts provides the latest available published information on tourist employment for Australia.
Source: The table was provided courtesy of Mr. Paul Williams (Head, Industry Statistics Branch) of the Australian Bureau of Statistics.
71
APPENDIX II - CANADA32
The Method used in Canada for the computation of national statistics on employment, wages and hours of work in the tourism industries is as follows.
Offi cial national data appear in the Canadian System of National Accounts (CSNA) and the Canadian Tourism Satellite Account (CTSA) and both are based on a combination of sources. The CSNA includes data on labour income by industry, including tourism industries, while the Canadian Productivity Accounts (CPA), which are part of the CSNA, include data on employment, wages and hours of work, by detailed industry. Both of these Accounts use a combination of data sources which span a wide range, including the LFS, SEPH, administrative data, tax returns, surveys of business operating costs, etc.
In addition, Statistics Canada produces a Tourism Satellite Account (TSA) which includes estimates of the number of jobs and labour compensation directly attributable to visitor spending in both tourism and non-tourism industries. The TSA draws on the Canadian Productivity Accounts Database for its estimates of tourism employment (i.e., an estimate of the number of jobs that can be directly attributed to tourism spending). The following method is applied:
Like tourism GDP, tourism employment is calculated at the industry level. Therefore, the employment calculation uses the same industry ratios as GDP to calculate the tourism portion of each industry. Thus, if the ratio of tourism demand for the outputs of an industry to its total gross output (at basic prices) is 50%, half of this industry’s employment is allocated to tourism. A similar calculation is done for all industries and then the results are summed to arrive at total tourism employment within Canada.
The benchmark tourism employment estimates in the TSA form the basis of estimates of quarterly employment directly attributable to visitor spending in tourism and non-tourism industries in the National Tourism Indicators (NTI) Quarterly Estimates. The NTI employment estimates are carried forward on annual patterns of growth observed in the Productivity Accounts and quarterly job series from SEPH by industry.
Finally, even more detailed information is available in the Tourism Human Resource Module (HRM) of the TSA. The HRM is based on and rooted in the accounting framework of the Canadian TSA, which follows the international guidelines outlined in Tourism Satellite Account: Recommended Methodological Framework (TSA:RMF).33 It carries information on the number of employee and self-employment jobs, full-time equivalent employment, total hours worked and labour income, gross wages and salaries and supplementary labour income, by industry. For employee jobs, this information is available by occupation, gender, age group and immigrant status. Owing to the large amount of occupation and demographic detail, the industry dimension of the HRM is broken down from the data in the TSA. The HRM includes details on six industries: air transportation, other transportation industries, accommodations, food and beverages services, recreation and entertainment, and travel services.
In the HRM, total employment in an industry is the number of all employee and self-employment jobs in that industry. The HRM also estimates the number of jobs in an industry that can be directly attributed to tourism demand. These estimates provide the link between the HRM and the TSA/NTI. The diff erence between tourism employment and total employment in an industry is just the number of jobs attributable to non-tourism (i.e. not directly attributable to tourism demand).
The same percentage share of tourism employment in an industry (discussed above) is applied to full-time equivalent employment, total hours worked and labour income. Derived variables for jobs in the industry,
32 Excerpted from ILO and UNWTO, Sources and Methods: Labour Statistics - Employment in the Tourism Industries Special Edition (Madrid, Spain: World Tourism Organization and International Labour Organization, 2008), 75-85.
33 UN Statistics Division (UNSD), the Statistical Offi ce of the European Communities (EUROSTAT), the Organization for Economic Co-operation and Development (OECD), and the World Tourism Organization (UNWTO), Tourism Satellite Account: Recommended Methodological Framework 2008 (Geneva: Statistical Commission, 2008).
72
Measuring Employment in the Tourism Industries beyond a Tourism Satellite Account: A Case Study of Indonesia
such as annual average hours worked and annual average wage and salary per tourism job, as well as the average hourly earnings per hour worked per tourism job are assumed to be the same for jobs that are, and are not, directly attributable to tourism.
Defi nition of Tourism: at the core of the TSA, NTI and HRM is the defi nition of tourism. Tourism is defi ned according to international standards as: “the activities of persons travelling to and staying in places outside their usual environment for not more than one consecutive year for leisure, business and other purposes not related to the exercise of an activity remunerated from within the place visited.” Persons who engage in tourism, so-defi ned, are called visitors. Visitors consist of tourists (those who visit and stay outside their usual environment for at least one night) and same-day visitors.
Data sources: there are four main sources of data underlying the Human Resource Module estimates: the Canadian Productivity Accounts (CPA) data in the Canadian System of National Accounts (CSNA), the Population Census, the Labour Force Survey (LFS), and the Survey of Employment, Payrolls and Hours (SEPH).
Canadian System of National Accounts
The CPA database in the CSNA provides the tourism industry totals for employee jobs and hours worked, labour income, wages and salaries, supplementary labour income, for both full-time and part-time jobs, age distribution and gender. Comparable data are also available for self-employment jobs, but the income variable is the net income of unincorporated businesses. These totals are for all jobs, including those attributable to both tourism and non-tourism demand. The data are classifi ed on a North American Industry Classifi cation System (NAICS) basis.
The CPA data for jobs are based, in turn, on the Labour Force Survey estimates for the number of persons employed. This is adjusted to jobs by adding the second jobs of multiple-job holders; additions are made for employment not covered by the LFS (e.g., regular military, employed persons in the territories, employed persons living on First Nations reserves, and civil servants working in Canadian embassies abroad) to refl ect the total economy. Deductions are made to exclude those absent from work without pay during the reference week. SEPH is primarily used to develop the industry allocation of the adjusted LFS benchmarks, although industry surveys and administrative sources are also used for selected industries.
The hours worked data includes the following:
Hours actually worked during normal periods of work;
Time worked in addition to hours worked during normal periods of work, and generally paid at higher rates than the normal rate (overtime);
Time spent at the place of work on work such as the preparation of the workplace, repairs and maintenance, preparation and cleaning of tools, and the preparation of receipts, time sheets and reports;
Time spent at the place of work waiting or standing-by for such reasons as lack of supply of work, breakdown of machinery, or accidents, or time spent at the place of work during which no work is done but for which payment is made under a guaranteed employment contract; and
Time corresponding to short periods of rest at the workplace, including tea and coff ee breaks.
They exclude:
Hours paid for but not actually worked, such as paid annual leave, paid public holidays, paid sick leave;
Meal breaks; and
73
Time spent on travel to and from home and work.
The hours worked data are adjusted to correct for reference week eff ects in order to estimate annual hours worked.
In the CSNA, industry totals for wages and salaries come from a detailed reconciliation of wages and salaries from survey data and administrative data. Estimates for components of supplementary labour income come in part from administrative data (e.g., employer contributions to Employment Insurance and Canada and Quebec pension plans, administrative data on registered pension plans and from Workers Compensation Boards), as well as other survey sources (for benefi ts like life, accident and health insurance).
Adjustments for selected tips that go unreported are made to the benchmarks for several industries:
Performing arts and spectator sports and related industries (NAICS 711)
Amusement, gambling and recreation industries (713)
Accommodation services (721)
Food services and drinking places (722).
The adjustments for tips are made on the basis of industry sales of alcoholic beverages, full service restaurant meals (no tips are assumed on fast food), and accommodation. There are additional, smaller imputations for tips in personal care services (barbershops and beauty salons, etc.) and railway transportation industries (for luggage porters).
Average hourly earnings are calculated in the HRM as wages and salaries divided by total hours worked. Because tips and pay for absences (sick leave, vacations, etc.) are included in wages and salaries, the hourly earnings include an implicit premium on top of the straight wage for both.
Population Census
The Population Census provides comprehensive data on the demographic, social and economic characteristics of Canadians. Basic information is collected from a census of the population, while detailed information on labour market activity is collected from one in every fi ve households. Given its large sample size, the Census serves as the most reliable source of information on occupational distributions.
Data from the 2001 Census was used primarily to distribute the CSNA totals on employee jobs, hours worked and wages and salaries across occupations and between immigrants and non-immigrants.
Labour Force Survey
The Labour Force Survey is conducted monthly and includes approximately 53,500 households, which translates roughly to a sample size of 100,000 people aged 15 years and over. The LFS collects basic labour force activity information including industry and occupation of employment for the survey reference week (normally the week including the 15th of the month), both for employees and self-employed persons. It does not cover the territories, military personnel or civil servants stationed abroad, or persons residing on First Nations reserves.
The LFS is used to develop the time series on jobs, hours worked and wages and salaries by occupation, as well as age and gender for each industry group in the HRM. The LFS is used in the CSNA to establish overall number of jobs totals.
74
Measuring Employment in the Tourism Industries beyond a Tourism Satellite Account: A Case Study of Indonesia
Survey of Employment, Payrolls and Hours
The Survey of Employment, Payrolls and Hours (SEPH) is conducted monthly. It collects the number of employee jobs and payroll data from a sample of establishments in Canada.
Establishments are coded by industry through the Business Register, thereby providing a reliable source of timely information on the industry distribution of employee jobs and payrolls. The administrative data are supplemented by the monthly Business Payroll Survey of 11,000 businesses. This survey collects data on employment, earnings and paid or usual hours according to whether workers are paid by the hour, salaried or remunerated some other way.
SEPH data are used to remove rooming and boarding houses from the CSNA totals for accommodation services and to develop the accommodation time series. SEPH is also used extensively in the CSNA to determine the industry distributions of employee jobs.
The basic methodology for the HRM estimates essentially consists of seven steps:
(i) taking totals from the CSNA for jobs, hours worked, and wages and salaries;
(ii) further disaggregating these totals using data from the CSNA for full-time and part-time jobs, age distribution and gender;
(iii) distributing the CSNA totals across occupations and immigrant status based on Census data;
(iv) building time series from these benchmarks based on movements in corresponding series from the LFS;
(v) smoothing the time series for LFS occupations, while keeping the overall industry group totals; and
(vi) making limited, fi nal adjustments to data values. This step completes the estimates for total employment of the HRM; fi nally,
(vii) applying tourism ratios to obtain employment attributable to tourism.
Step 1: Benchmark totals
The industry totals on jobs, hours worked, labour income and wages and salaries, including the details by class of worker (employee or self-employed), full and part-time status, age group and gender come from the CPA database of the CSNA. A number of adjustments are then made, in particular:
1. The labour component of mixed income from self-employment is imputed by multiplying the hours worked in self-employment by the average hourly labour income per employee job. This method assumes that self-employed persons and paid employees earn the same on average.
2. The inclusion of rooming and boarding houses in the Accommodation Services industry requires an adjustment to remove it. This is done using details from SEPH on the industry’s share of overall jobs, hours and earnings. These shares are used to adjust both employee and self-employment jobs.
Step 2: Distribution of CSNA data by age and gender
Data from the CPA database in the CSNA are used to split jobs, hours worked and income by age group and gender. This information is adapted to fi t the age groups used in the HRM.
75
Step 3: Distribution of industry totals by occupation
To develop occupational distributors for the industry totals (related to employee jobs), special census tabulations are done identifying persons in the tourism industries who had employment income in the reference year and were not self-employed. The selected persons were grouped according to their industry and whether they worked mainly full or part-time during the reference year. For each of these groups the distribution of the (weighted) sample by occupation was determined, as well as the distribution of total hours worked and wage and salary income.
The occupational distributor for hours worked is based on the distribution of total hours (jobs multiplied by average hours worked) across occupations within each industry. The occupational distributor for wages and salaries is based on the distribution of total wages and salaries (jobs multiplied by hours worked multiplied by hourly earnings) across occupations in each industry.
Step 4: Building the occupational time series
Step 4 entails using the corresponding LFS annual average series by occupation, age group and gender to build a time series. Information on immigrant status is not available from the LFS and therefore the percentage distribution from the Census reference year (2000) is maintained for all years. The LFS occupation and industry data match those used in the Census. The LFS data are adjusted to the Census level to maintain growth rates between years.
Steps 5 and 6: Smoothing the LFS data and manual adjustments
Step 5 entails smoothing to reduce volatility in the occupational time series found in the LFS. Smoothing of the data is implemented in a way that preserves the overall industry totals (from the CSNA) and the occupational distributions (from the 2000 census), as these benchmarks are limits that must be respected. A simple moving average is applied to the indicators (discussed in Step 3) used to build the time series on jobs, hours worked and wages and salaries, full and part-time, by occupation and for each industry. A four-year moving average is judged to provide the best results overall in terms of reasonableness and consistency, reduced volatility and minimizing the need for manual adjustments.
The last step in developing the total industry estimates involves manual adjustments when the smoothed series appear out of line, or are notably inconsistent with the hours worked or wages and salaries, or generate erratic movements in the implied average annual hours or average hourly earnings. Results from the feasibility study indicate that the smoothing and manual adjustments have little eff ect on the general pattern of the occupational distributions. However, they notably reduce the volatility of year-to-year growth rates. Approximately 1% of the data cells were adjusted after the smoothing.
Step 7: Application of tourism ratios to obtain tourism employment
The next step involves estimating the number of jobs, hours worked and wages and salaries attributable to tourism, by gender, age distribution and immigration status. To do this, implicit tourism ratios are determined from the employment generated by tourism from the NTI.
Tourism ratios were calculated for each occupation within each industry individually, according to their tourism content. For example, in the case of air transportation, approximately 77% of jobs are considered to be attributable to tourism, meaning (according to TSA convention and practice) that 77% of the industry’s GDP and employment can be attributed to tourism demand (most of the rest is attributable to freight operations). Can 77% of the jobs in each occupation be reasonably or plausibly attributed to tourism? Probably not.
76
Measuring Employment in the Tourism Industries beyond a Tourism Satellite Account: A Case Study of Indonesia
Pursers and fl ight attendants are not required to move cargo. Almost 100% of their employment would seem to be, and could be, attributed to tourism demand. But then, less than 77% of the employment in other occupations would have to be attributed to tourism, otherwise the industry ratio could not be satisfi ed. In this study, each occupation was given a tourism ratio related to its tourism activity. The ratio was based on commodity tourism ratios. After these were applied, the totals were benchmarked to the NTI data so that the HRM and the NTI have consistent employment data.
Documentation
The following publications contain detailed methodological information and are available from Statistics Canada’s website:
Producing Hours Worked for the SNA in Order to Measure Productivity: the Canadian Experience by Andrée Girard, Jean-Pierre Maynard and Marc Tanguay
http://www.statcan.ca/english/research/15-206-XIE/15-206-XIE2006004.htm
Canadian Tourism Satellite Account, 2000 by Conrad Barber-Dueck and Demi Kotsovos http://dsp-psd.pwgsc.gc.ca/Collection/Statcan/13-604-M/13-604-MIE2005048.pdf
National Tourism Indicators: Quarterly Estimates. From First Quarter 2000 to Fourth Quarter 2010 http://dsp-psd.pwgsc.gc.ca/Collection/Statcan/13-009-XIB/13-009-XIB-e.html
Human Resource Module of the Tourism Satellite Account, 1997-2002 by Conrad Barber-Dueck (see Appendix B: Methodology)
http://dsp-psd.pwgsc.gc.ca/Collection/Statcan/13-604-M/13-604-MIE2006051.pdf
Human Resource Module of the Tourism Satellite Account, Update to 2005 by Chris Jackson http://www.statcan.ca/bsolc/english/bsolc?catno=13-604-M2007055
77
APPENDIX III – Chapter 7 of IRTS 2008
The following appendix contains Chapter 7: Employment in the Tourism Industries copied from the International Recommendations for Tourism Statistics 2008.34
7.1 As in any other sector of the economy, employment is an important dimension to characterize and acknowledge the importance of tourism from the productive, social and strategic points of view.
7.2 Because, tourism-characteristic activities are generally labour-intensive, governments are particularly keen in measuring the contribution of tourism in terms of generating jobs and providing people with access to income.
7.3 While labour can be associated with the total output of an establishment, it cannot be assigned to any particular output without the use of specifi c assumptions and modelling procedures. For this reason, tourism employment, referring to the employment strictly related to the goods and services (tourism-characteristic, tourism-connected and other) acquired by visitors and produced by either tourism industries or other industries cannot be directly observed. Its measurement would require techniques that go beyond the present recommendations.
7.4 As a result, the recommendations in this chapter are restricted to employment in the tourism industries (see Chapter 6). As already mentioned, (see paras. 6.15. to 6.20.) in each country, the tourism industries will include all establishments whose main activity is a tourism-characteristic activity. These tourism industries are common to all countries except for the individual country-specifi c tourism characteristic activities (category 12; see para. 5.34.). It should be noted that persons engaged in secondary tourism-characteristic activities of an establishment belonging to a non-tourism industry (e.g., all establishments whose principal activity is not a tourism-characteristic activity) will not be included in “employment in the tourism industries” although they would be counted in “tourism employment”. On the other hand, persons employed in an establishment belonging to a tourism industry who participate in the establishment’s secondary non-tourism-characteristic activities will be included in “employment in the tourism industries” but not included in “tourism employment”.
7.5 Besides data on persons employed and the number of jobs in the tourism industries, other measures like hours worked or full-time equivalent employment are also required in order to gauge the amount of labour assigned to a particular tourism industry. The diff erent concepts and defi nitions of employment in the tourism industries and their interrelations are given below.
A. Concepts and defi nitions
7.6 It should be noted that labour statistics have their own international standards35 that comprise a full range of concepts, defi nitions and classifi cations which should be referred to and used when collecting employment statistics. Consequently, the concepts and defi nitions presented in this chapter should primarily be used for statistical purposes as well as a basis for data reconciliation procedures for the production of TSA and SNA employment tables.
34 Excerpted from UN Statistics Division (UNSD) and the World Tourism Organization (UNWTO), International Recommendations for Tourism Statistics 2008 (Geneva: Department of Economic and Social Aff airs, 2008), 61-68.
35 Within the UN system, the International Labour Organization (ILO) is responsible for developing international standards in the fi eld of labour statistics. The standards can be found in http://www.ilo.org/public/english/bureau/stat/ (see: Labour Statistics’ Conventions, Resolutions, Recommendations, Guidelines); and “Resolution concerning statistics of the economically active population, employment, unemployment and underemployment”. Thirteenth International Conference of Labour of Labour Statisticians. Current International Recommendations on Labour Statistics, 2000 Edition. International Labour Offi ce, Geneva, 2000.
78
Measuring Employment in the Tourism Industries beyond a Tourism Satellite Account: A Case Study of Indonesia
7.7 In general terms, a person having a job is considered to be employed and is part of the economically active population (see Box 7.1).
Box 7.1
Job
“… a job is defi ned as an explicit or implicit contract between a person and an institutional unit to perform work on return for compensation for a defi ned period or until further notice. The institutional unit may be the proprietor of an unincorporated enterprise; in this case the person is described as being self-employed and earns a mixed income”.
Source: “System of National Accounts 1993”, para. 17.8.
Economically active population
“The economically active population or labour force comprises all persons of either sex who furnish the supply of labour for the production of goods and services as defi ned by the System of National Accounts during a specifi ed time-reference period. Activities that fall within the production boundary of the System may be summarized as follows: (a) The production of all individual or collective goods or services that are supplied to units other than their producers, or intended to be supplied, including the production of goods or services used up in the process of producing such goods or services…”
Source: ILO. “Resolution concerning statistics of the economically active population, employment, unemployment and underemployment”. Thirteenth International Conference of Labour of Statisticians. Current International Recommendations on Labour Statistics, 2000 Edition. Geneva, 2000, p. 24; and “System of National Accounts 1993”, para. 6.18.
7.8 Persons may have two or more jobs during a given reference period, and all, some or none of these jobs may be undertaken in the tourism industries. This leads to three diff erent measures of employment in the tourism industries that treat diff erently the distinction between employed persons and jobs.
7.9 Figure 7.1 illustrates this situation. Employment in tourism industries may be measured as a count of the persons employed in tourism industries in any of their jobs (1, 3 and 4a in Figure 7.1), as a count of the persons employed in tourism industries in their main job (1 and 3 in Figure 7.1), or as a count of the jobs in tourism industries (1, 3, 3a and 4a in Figure 7.1).
7.10 Each measure serves diff erent purposes, and countries may adopt one or more of them depending on the intended use. If the intent is to determine the number of people who depend to some extent for their livelihoods by working in the tourism industries, then a count of persons with a job (main or other) in these industries would be appropriate. The measure based on employment in the main job would serve to gauge those with signifi cant attachment to the tourism industries, for instance. If the intent is to make a comparison between tourism and non-tourism industries or between the tourism industries and the economy overall, then a count of jobs in the tourism industries would be more appropriate.
7.11 Countries may also be limited to one or other measure depending on their unique circumstances in terms of sources of data available. For example, in order to count the persons employed in tourism industries (all jobs), it is necessary to have information on the industry of each job of multiple job holders. If this information is not available, the count would necessarily be restricted to persons employed in tourism industries in their main jobs.
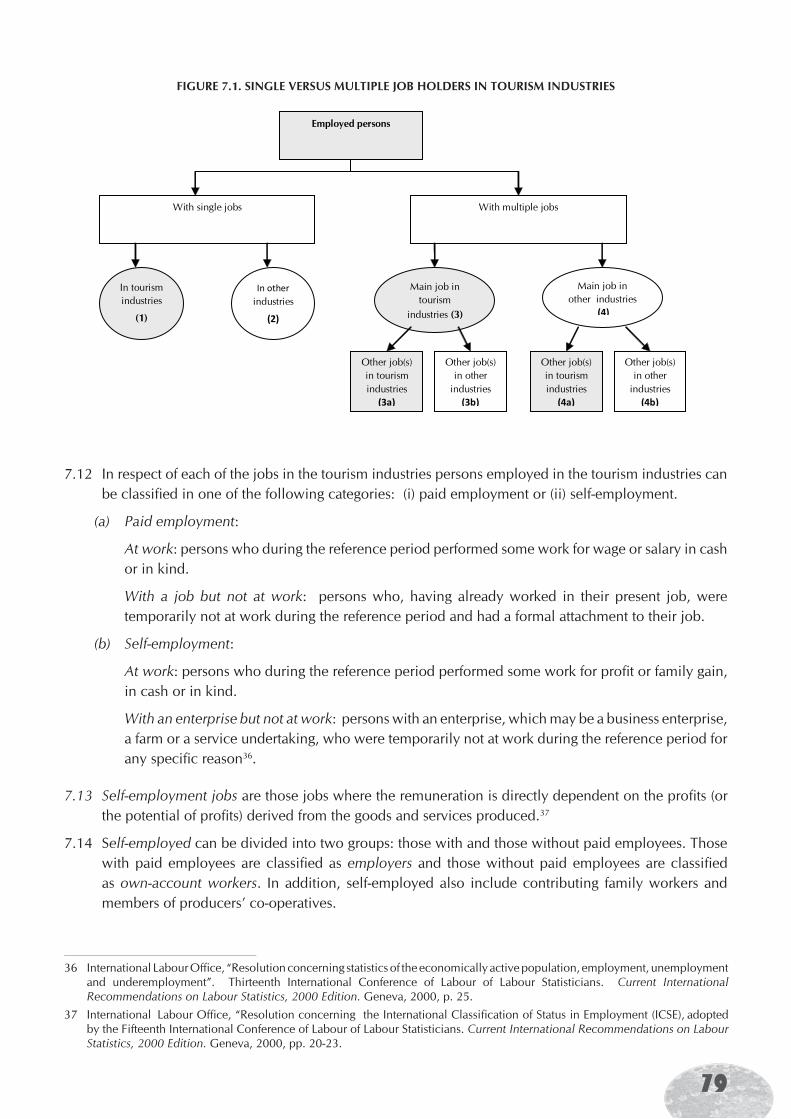
79
FIGURE 7.1. SINGLE VERSUS MULTIPLE JOB HOLDERS IN TOURISM INDUSTRIES
Employed persons
With single jobs With multiple jobs
Main job in other industries
(4)
Other job(s) in tourism industries
(3a)
Other job(s) in other
industries (3b)
Other job(s) in tourism industries
(4a)
Other job(s) in other
industries (4b)
Main job in tourism
industries (3)
In tourism industries
(1)
In other industries
(2)
7.12 In respect of each of the jobs in the tourism industries persons employed in the tourism industries can be classifi ed in one of the following categories: (i) paid employment or (ii) self-employment.
(a) Paid employment:
At work: persons who during the reference period performed some work for wage or salary in cash or in kind.
With a job but not at work: persons who, having already worked in their present job, were temporarily not at work during the reference period and had a formal attachment to their job.
(b) Self-employment:
At work: persons who during the reference period performed some work for profi t or family gain, in cash or in kind.
With an enterprise but not at work: persons with an enterprise, which may be a business enterprise, a farm or a service undertaking, who were temporarily not at work during the reference period for any specifi c reason36.
7.13 Self-employment jobs are those jobs where the remuneration is directly dependent on the profi ts (or the potential of profi ts) derived from the goods and services produced.37
7.14 Self-employed can be divided into two groups: those with and those without paid employees. Those with paid employees are classifi ed as employers and those without paid employees are classifi ed as own-account workers. In addition, self-employed also include contributing family workers and members of producers’ co-operatives.
36 International Labour Offi ce, “Resolution concerning statistics of the economically active population, employment, unemployment and underemployment”. Thirteenth International Conference of Labour of Labour Statisticians. Current International Recommendations on Labour Statistics, 2000 Edition. Geneva, 2000, p. 25.
37 International Labour Offi ce, “Resolution concerning the International Classifi cation of Status in Employment (ICSE), adopted by the Fifteenth International Conference of Labour of Labour Statisticians. Current International Recommendations on Labour Statistics, 2000 Edition. Geneva, 2000, pp. 20-23.
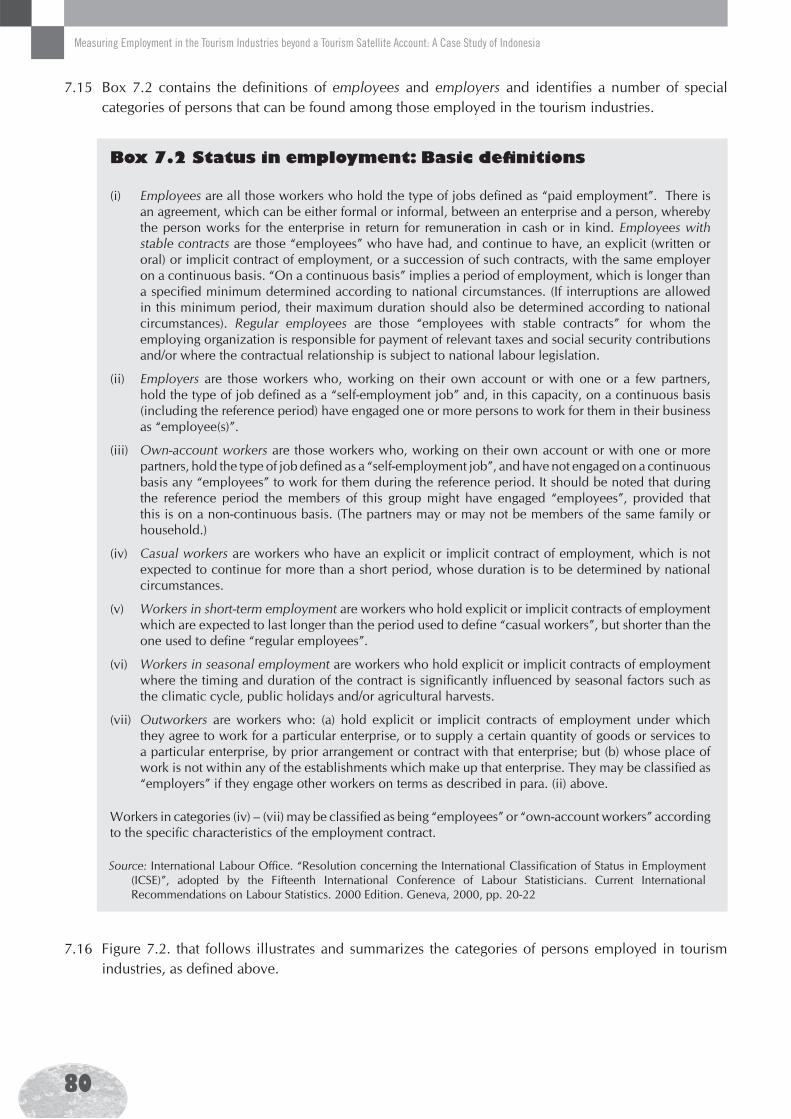
80
Measuring Employment in the Tourism Industries beyond a Tourism Satellite Account: A Case Study of Indonesia
7.15 Box 7.2 contains the defi nitions of employees and employers and identifi es a number of special categories of persons that can be found among those employed in the tourism industries.
Box 7.2 Status in employment: Basic defi nitions
(i) Employees are all those workers who hold the type of jobs defi ned as “paid employment”. There is an agreement, which can be either formal or informal, between an enterprise and a person, whereby the person works for the enterprise in return for remuneration in cash or in kind. Employees with stable contracts are those “employees” who have had, and continue to have, an explicit (written or oral) or implicit contract of employment, or a succession of such contracts, with the same employer on a continuous basis. “On a continuous basis” implies a period of employment, which is longer than a specifi ed minimum determined according to national circumstances. (If interruptions are allowed in this minimum period, their maximum duration should also be determined according to national circumstances). Regular employees are those “employees with stable contracts” for whom the employing organization is responsible for payment of relevant taxes and social security contributions and/or where the contractual relationship is subject to national labour legislation.
(ii) Employers are those workers who, working on their own account or with one or a few partners, hold the type of job defi ned as a “self-employment job” and, in this capacity, on a continuous basis (including the reference period) have engaged one or more persons to work for them in their business as “employee(s)”.
(iii) Own-account workers are those workers who, working on their own account or with one or more partners, hold the type of job defi ned as a “self-employment job”, and have not engaged on a continuous basis any “employees” to work for them during the reference period. It should be noted that during the reference period the members of this group might have engaged “employees”, provided that this is on a non-continuous basis. (The partners may or may not be members of the same family or household.)
(iv) Casual workers are workers who have an explicit or implicit contract of employment, which is not expected to continue for more than a short period, whose duration is to be determined by national circumstances.
(v) Workers in short-term employment are workers who hold explicit or implicit contracts of employment which are expected to last longer than the period used to defi ne “casual workers”, but shorter than the one used to defi ne “regular employees”.
(vi) Workers in seasonal employment are workers who hold explicit or implicit contracts of employment where the timing and duration of the contract is signifi cantly infl uenced by seasonal factors such as the climatic cycle, public holidays and/or agricultural harvests.
(vii) Outworkers are workers who: (a) hold explicit or implicit contracts of employment under which they agree to work for a particular enterprise, or to supply a certain quantity of goods or services to a particular enterprise, by prior arrangement or contract with that enterprise; but (b) whose place of work is not within any of the establishments which make up that enterprise. They may be classifi ed as “employers” if they engage other workers on terms as described in para. (ii) above.
Workers in categories (iv) – (vii) may be classifi ed as being “employees” or “own-account workers” according to the specifi c characteristics of the employment contract.
Source: International Labour Offi ce. “Resolution concerning the International Classifi cation of Status in Employment (ICSE)”, adopted by the Fifteenth International Conference of Labour Statisticians. Current International Recommendations on Labour Statistics. 2000 Edition. Geneva, 2000, pp. 20-22
7.16 Figure 7.2. that follows illustrates and summarizes the categories of persons employed in tourism industries, as defi ned above.
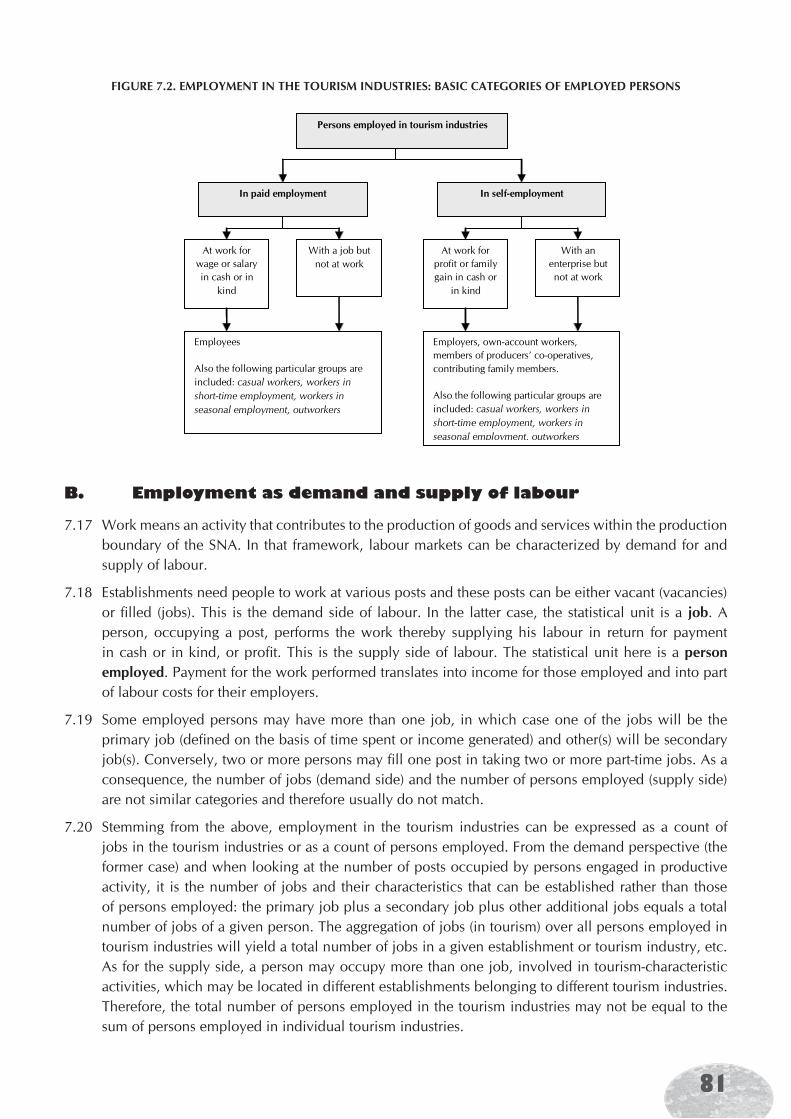
81
FIGURE 7.2. EMPLOYMENT IN THE TOURISM INDUSTRIES: BASIC CATEGORIES OF EMPLOYED PERSONS
Persons employed in tourism industries
In paid employment In self-employment
At work for wage or salary in cash or in
kind
With a job but not at work
At work for profit or family gain in cash or
in kind
With an enterprise but not at work
Employees
Also the following particular groups are included: casual workers, workers in short-time employment, workers in seasonal employment, outworkers
Employers, own-account workers, members of producers’ co-operatives, contributing family members.
Also the following particular groups are included: casual workers, workers in short-time employment, workers in seasonal employment, outworkers
B. Employment as demand and supply of labour
7.17 Work means an activity that contributes to the production of goods and services within the production boundary of the SNA. In that framework, labour markets can be characterized by demand for and supply of labour.
7.18 Establishments need people to work at various posts and these posts can be either vacant (vacancies) or fi lled (jobs). This is the demand side of labour. In the latter case, the statistical unit is a job. A person, occupying a post, performs the work thereby supplying his labour in return for payment in cash or in kind, or profi t. This is the supply side of labour. The statistical unit here is a person employed. Payment for the work performed translates into income for those employed and into part of labour costs for their employers.
7.19 Some employed persons may have more than one job, in which case one of the jobs will be the primary job (defi ned on the basis of time spent or income generated) and other(s) will be secondary job(s). Conversely, two or more persons may fi ll one post in taking two or more part-time jobs. As a consequence, the number of jobs (demand side) and the number of persons employed (supply side) are not similar categories and therefore usually do not match.
7.20 Stemming from the above, employment in the tourism industries can be expressed as a count of jobs in the tourism industries or as a count of persons employed. From the demand perspective (the former case) and when looking at the number of posts occupied by persons engaged in productive activity, it is the number of jobs and their characteristics that can be established rather than those of persons employed: the primary job plus a secondary job plus other additional jobs equals a total number of jobs of a given person. The aggregation of jobs (in tourism) over all persons employed in tourism industries will yield a total number of jobs in a given establishment or tourism industry, etc. As for the supply side, a person may occupy more than one job, involved in tourism-characteristic activities, which may be located in diff erent establishments belonging to diff erent tourism industries. Therefore, the total number of persons employed in the tourism industries may not be equal to the sum of persons employed in individual tourism industries.
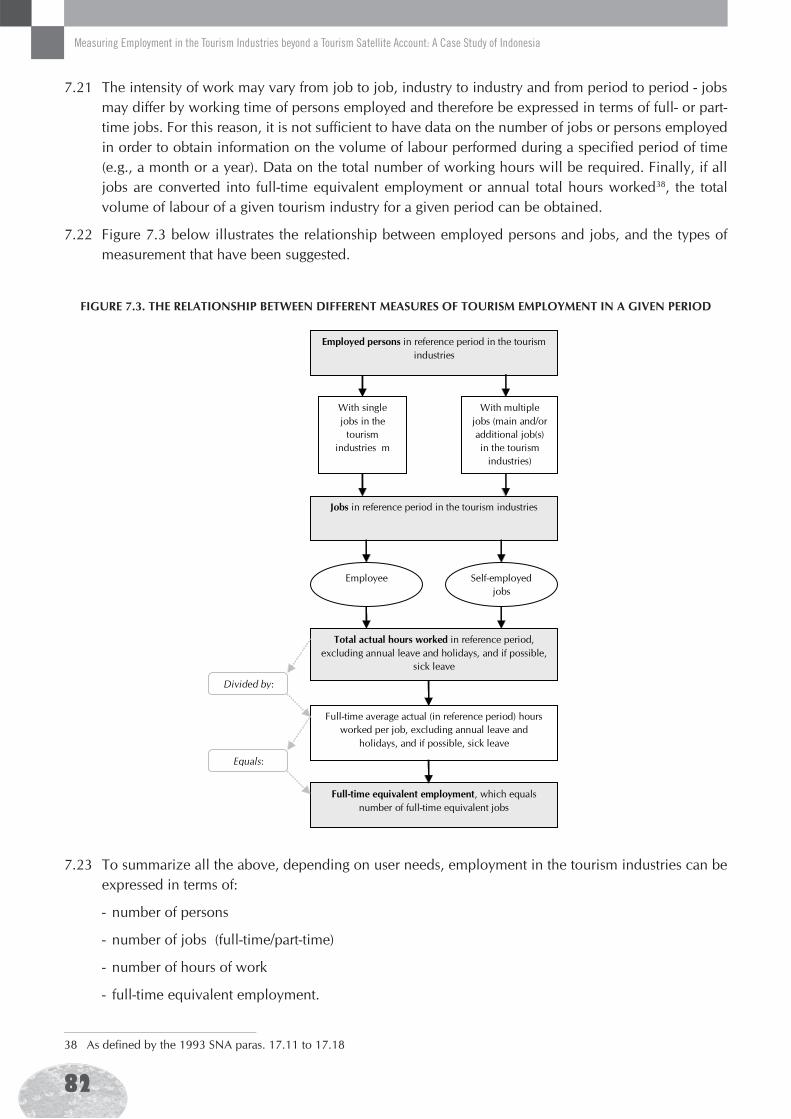
82
Measuring Employment in the Tourism Industries beyond a Tourism Satellite Account: A Case Study of Indonesia
7.21 The intensity of work may vary from job to job, industry to industry and from period to period - jobs may diff er by working time of persons employed and therefore be expressed in terms of full- or part-time jobs. For this reason, it is not suffi cient to have data on the number of jobs or persons employed in order to obtain information on the volume of labour performed during a specifi ed period of time (e.g., a month or a year). Data on the total number of working hours will be required. Finally, if all jobs are converted into full-time equivalent employment or annual total hours worked38, the total volume of labour of a given tourism industry for a given period can be obtained.
7.22 Figure 7.3 below illustrates the relationship between employed persons and jobs, and the types of measurement that have been suggested.
38 As defi ned by the 1993 SNA paras. 17.11 to 17.18
FIGURE 7.3. THE RELATIONSHIP BETWEEN DIFFERENT MEASURES OF TOURISM EMPLOYMENT IN A GIVEN PERIOD
Employed persons in reference period in the tourism industries
Jobs in reference period in the tourism industries
Total actual hours worked in reference period, excluding annual leave and holidays, and if possible,
sick leave
Full-time average actual (in reference period) hours worked per job, excluding annual leave and
holidays, and if possible, sick leave
Full-time equivalent employment, which equals number of full-time equivalent jobs
Divided by:
Equals:
Employee Self-employed jobs
With single jobs in the
tourism industries m
With multiple jobs (main and/or additional job(s) in the tourism
industries)
7.23 To summarize all the above, depending on user needs, employment in the tourism industries can be expressed in terms of:
- number of persons
- number of jobs (full-time/part-time)
- number of hours of work
- full-time equivalent employment.
83
C. Characteristics of employment
7.24 In order to provide information on the composition of jobs in tourism industries and identify more homogenous groups for analytical purposes, and as a basis for comparisons of statistics over time and between countries, the employment measures should be classifi ed according to various characteristics of the industries and of the persons occupying the jobs.
7.25 Thus, a job, in addition to classifi cation by working time of person(s) employed, can also be classifi ed by demographic, educational and social characteristics of person(s) occupying it. Also, remuneration linked to a given job is an important characteristic and should be classifi ed separately.
7.26 For the purpose of international comparisons, the classifi cations of statistics on employment in the tourism industries should adhere or be convertible to the standard international classifi cations most recently adopted such as:
(i) International Standard Industrial Classifi cation (ISIC Rev. 4) and its application for tourism statistics.
(ii) International Standard Classifi cation of Occupations (ISCO-88)39.
(iii) International Standard Classifi cation of Education (ISCED-97).
(iv) International Classifi cation of Status in Employment (ICSE-93)40.
7.27 In order to adequately analyze employment in the tourism industries, it is recommended that countries collect the following key variables for each of the tourism industries as identifi ed in Chapter 6 and for the tourism industries as a whole:
- Employment by age group, sex and nationality/country of residence (if relevant);
- Employment by type of establishments (size, formal, informal41, etc.);
- Employment classifi ed by occupation and status in employment;
- Permanent/temporary employment expressed in terms of number of jobs, hours of work, full- time equivalent, etc.
- Employment by educational attainment.
- Hours of work (normal/usual, actually worked, paid for).
- Working time arrangements.
7.28 As employment variables are eventually used for an in-depth analysis of a country’s tourism industries within a social and economic context, countries should also collect the following variables characterizing the monetary aspect of labour:
- Compensation of employees that includes wages and salaries payable in cash or in kind, and the value of the social contributions payable by employers42, for each industry and by categories of workers.
- Labour cost that besides remuneration for work performed also includes cost to the employer for vocational training, welfare services and miscellaneous items that are not necessarily included in
39 International Labour Offi ce. “International Standard Classifi cation of Occupations (ISCO-88). Geneva, 1990. Currently, ISCO-88 is being updated and its new version (ISCO-08) is expected to be available as of 2008.
40 _______ “Resolution concerning the International Classifi cation of Status in Employment (ICSE), adopted by the Fifteenth International Conference of Labour Statisticians”. Current International Recommendations on Labour Statistics. 2000 Edition. Geneva, 2000, pp. 20-23.
41 _______“Resolution concerning statistics of employment in the informal sector”, Current International Recommendations on Labour Statistics. 2000 Edition. Geneva, 2000, pp. 32-40.
42 As defi ned in the SNA 1993. See “System of National Accounts 1993”. Chapter VII “The primary distribution of income account”, para. 7.21, p. 164.
84
Measuring Employment in the Tourism Industries beyond a Tourism Satellite Account: A Case Study of Indonesia
compensation of employees such as transport of workers, work clothes and recruitment, together with taxes regarded as labour costs43.
- Mixed income of self-employed persons44.
D. Measuring employment
7.29 The collection of data on employment in the tourism industries should be integrated in the regular national statistical system. By its nature, employment in the tourism industries can be undertaken either in paid employment or self-employment. It is unlikely that a complete picture of employment in the tourism industries can be obtained from a single statistical source. In order to achieve a better coverage and get more detailed characteristics of persons employed, countries should, as far as possible, use the following major sources of data collection: (i) household-based sample surveys; (ii) establishment-based sample surveys; and (iii) administrative records.
7.30 Household Labour Force Surveys are an important data source that can in principle cover the entire population of a country, all industries, and all categories of workers, including the self-employed and casual workers. They can also capture economic activity in both formal and informal sectors, as well as informal employment.
7.31 Importantly, the Household Labour Force Surveys collect data from individuals and thus provide information on persons who may be employed in more than one job (multiple-job holders) and diff erent industries (tourism or non-tourism).
7.32 Establishment-based sample surveys are another important data source for jobs and persons employed. When the interest is in specifi c industries, which is the case with tourism industries, establishment surveys, given an adequate sampling frame, can provide an in-depth picture of target industries. It should be noted though that informal establishments are not covered by conventional establishment surveys. Reliable and detailed information on topics related to jobs and employment (e.g. earnings, remuneration and labour costs) can be obtained in establishment surveys, especially when they can draw upon payrolls and other available records.
7.33 Statistics based on administrative records (such as social security fi les, tax reports, employment reports) are usually by-products of administrative processes. They are often based on continuous operations, and can therefore be a useful source of fl ow statistics and other longitudinal data. However, they can also have various shortcomings such as limited coverage (the exclusion of informal establishments) and content, infl exible concepts and defi nitions, incompleteness, inconsistencies and restricted access due to legal or administrative constraints45.
43 International Labour Offi ce, “Resolution concerning statistics of labour cost, adopted by the Eleventh International Conference of Labour Statisticians”. Current International Recommendations on Labour Statistics. 2000 Edition. Geneva, 2000, pp. 41-43.
44 As defi ned in the SNA 1993. See “System of National Accounts 1993”. Chapter VII “The primary distribution of income account”, para. 7.80, p. 174.
45 For more ample information on statistical sources see: International Labour Offi ce. “Survey of economically active population, employment, unemployment and underemployment:
An ILO manual on concepts and methods”. ILO Geneva, 1990. _____ “Resolution concerning statistics of employment in the informal sector, adopted by the Fifteenth International Conference
of Labour Statistician (January 1993)”. Current International Recommendations on Labour Statistics. 2000 Edition. Geneva, 2000, pp. 32-38.
_____ “Guidelines concerning statistical defi nition of informal employment endorsed by the Seventeenth Conference of Labour Statistician (December 2003)”. Report of the Conference, Geneva, Seventeenth Conference of Labour Statisticians, 24 November – 3 December 2003.
_____ “An integrated system of wages statistics: A manual on methods”. Geneva, 1979. _____ “Labour Statistics based on administrative records: Guidelines on compilation and presentation”. ILO/EASMAT, ILO
Regional Offi ce for Asia and the Pacifi c, Bangkok, 1997.
85
7.34 As it is hardly feasible to comprehensively gauge and analyze employment in tourism industries on the basis of only one statistical source, the integration of data from diff erent sources is a preferable solution. This method yields more comprehensive information, provides a better overview and a more consistent picture, and results in a more accurate analysis.
7.35 Although signifi cant progress has been made in recent years in developing methodological frameworks for the integration of information on tourism employment with other macroeconomic aggregates and improvement of international data comparability, such as the Tourism Satellite Account (see Chapter 8) and the OECD Employment Module46, work is still underway in order to fi nd a better way or develop a more comprehensive framework for integrating data from diff erent sources and establishing better links with the SNA.
46 Organisation for Economic Cooperation and Development. “Guidelines for a Tourism Satellite Account: the employment module”. Paris 1999.

86
Measuring Employment in the Tourism Industries beyond a Tourism Satellite Account: A Case Study of Indonesia