Embed Size (px)
Citation preview

BTEX in CSG flowback water - Summary 1
Measuring economic trends and benefits of CSG development on local businesses
Small and Medium Enterprises (SME) Study – Trends and Benefits
Celoxis System ID: 149312 Report release date: 20 May 2016

SME Study – Trends and Benefits May 2016 2
Research Team
Dr Jerad A Ford, EY / Australian Institute of Business and Economics (AIBE) Research Fellow1
Assoc. Prof. Martie-Louise Verreynne1
Assoc. Prof. John Steen, Australian Institute of Business and Economics (AIBE) Sr. Research Fellow1 1The University of Queensland Business School
Acknowledgements
The researchers wish to acknowledge the helpful feedback from Dr Andrea Walton (CSIRO) and
members of the project advisory group, including Daniel Holm, Andrea Horsburgh, Sam Klaas, Katrina
March, Rob McRuvie and Craig Tunley. We would also like to thank the CCSG, Will Rifkin, Helen Schultz
and Andrew ‘Alf’ Garnett, in particular, for early guidance in project formulation, insights along the way,
and editorial commentary on drafts of this report. Finally, we would like to thank Matthew James of
Thought & Process for graphic design work including all infographics and charts in the main body of the
report.
Disclosure
The UQ Centre of Coal Seam Gas is currently funded by the University of Queensland 22% ($5
million) and the Industry members 78% ($17.5 million) over 5 years. An additional $3.0 million is
provided by industry members for research infrastructure costs. The industry members are QGC,
Santos, Arrow and APLNG. The Centre conducts research across Water, Geoscience, Petroleum
Engineering and Social Performance themes. For more information about the Centre’s activities and
governance see http://www.ccsg.uq.edu.au/
Disclaimer
The information, opinions and views expressed in this report do not necessarily represent those of The
University of Queensland, the Centre for Coal Seam Gas or its constituent members or associated
companies. Researchers within or working with the Centre for Coal Seam Gas are bound by the same
policies and procedures as other researchers within The University of Queensland, which are designed
to ensure the integrity of research. You can view these policies at:
http://ppl.app.uq.edu.au/content/4.-research-and-research-training
The Australian Code for the Responsible Conduct of Research outlines expectations and responsibilities
of researchers to further ensure independent and rigorous investigations.
This report has not yet been independently peer reviewed.
ISBN: 978 1 74272 140 8

SME Study – Trends and Benefits May 2016 3
Executive Summary
This report outlines the factors that influence performance of small businesses in Queensland towns affected by Coal Seam Gas (CSG) development across three time periods: investment (2008–2013), transition to operations (2013–2015) and estimated future performance (to 2017). The report focused on the concept of organisational resilience, which we define as the capacity to respond, adapt and transform in response to changes in the business environment. We surveyed 400 firms by phone about their performance, and gauged their perceived strength across eight resilience factors. The analysis herein tests for statistically significant relationships between these resilience factors and performance in each of the different time periods.
During the investment period we found slack (spare resources, including financial and human) was the biggest determinant that drove performance satisfaction (combined sales, sales growth, and profitability and market share) and contributed to higher growth prospects. In the transition to operations period, which is typified by declining investment in construction in the regional areas by the CSG companies, a strategic factor that we call pro-activeness, was a major reason that businesses were able to maintain growth. This aspect relates to how the firm strategically repositions their product and service offerings. We also found that a networking function called connectedness largely explains how firms maintained high levels of turnover, even when controlling for firm size and age. Connectedness refers to close coordination with network partners to develop plans and approaches to address change within the business environment.
In terms of future prospects, pro-activeness takes a lead role. Firms scoring above average in pro-activeness are 5 times more likely to expect high performance in the future and 2.5 times as likely to perceive healthy growth prospects. In addition, we find that adaptiveness – which is the ability to shift and reconfigure the business to meet new challenges in a swift and adept manner – relates strongly to positive expectations of future performance. High performance satisfaction is expected in 2017 is 3.5 times more likely for firms that reported above average adaptiveness. Coming full circle, slack – the

SME Study – Trends and Benefits May 2016 4
financial and human resources that may enable responses to opportunities and changes in the environment – appears to be a leading reason that businesses in this region foresee remaining viable (i.e., not exiting the business) two years into the future. We also found that performance is unevenly distributed. In the investment period, firms directly tied to CSG projects were over twice as likely to have higher performance satisfaction scores as others. Rural firms (those outside the Toowoomba / greater Brisbane region) were 1.5 times more likely to be highly satisfied with performance during the CSG investment period. Firms that were both rural and CSG-involved were 3.2 times more likely to report high performance satisfaction in 2013. We found these same firms to be hardest hit in the transition to operations period, with CSG-involved firms being 1.6 times, and rural firms 1.7 times, more likely to have diminished growth prospects. Firms that were both rural and CSG-involved were 3 times more likely than all other firms to have diminished growth prospects.
Yet, despite the CSG-involved and rural firms being disproportionately affected during the investment and transition periods, the future appears to be wide open for them. Neither CSG-involved firms nor rural firms are any more likely than other firms to foresee low prospects for future growth, have expectations for poor performance, or plan to exit from the business within the next two years in our full models. However, the subset of firms that were both CSG-involved and rural may be to be twice as likely to exit the business, but this is only true when ignoring the influence of resilience factors. This helps to show just how important resilience is in terms of organisational longevity.
However, we did observe that rural firms may lack in two key resilience areas: they are 1.6 times more likely to be below average in connectedness. This factor is important, seeing that connectedness is shown to be important predictor of high revenues in the transition to operations period. Rural firms were also 1.8 times more likely to be below average in adaptiveness, which is strongly related to future performance expectations. Although not directly tied to performance outcomes, survey responses also indicate this group is below average in innovative problem-solving skills. This implies that rural firms might have difficulty solving unexpected problems, particularly if solving these problems requires

SME Study – Trends and Benefits May 2016 5
diverging from existing processes or counterintuitive thinking. When we tested for differences for the subset of firms that were CSG-involved and also rural, we found no specific differences in their resilience scores.
Taken together, these findings suggest that high levels of performance in the future are obtainable by all small firms in the region; however, there is still room for improvement. Firms should focus on developing higher-order strategic planning capabilities that will aid them in reshaping product and service offerings to capture more business. Longer term, firms should strive to build up reserves (slack) and increase the number and quality of network partnerships in order to survive and increase revenues. In terms of policy implications, we noted there may be room to provide, or expand, services that coach small firms in various areas of resilience in order to improve their prospects. This improvement, in turn, will hopefully lead to more prosperous regional communities.

SME Study – Trends and Benefits May 2016 6
Table of Contents
Contents 1 Introduction ....................................................................................................................................... 8 2 Methods ............................................................................................................................................. 8
2.1 Survey instrument ...................................................................................................................... 8 2.2 Measuring resilience .................................................................................................................. 8 2.3 Sample ....................................................................................................................................... 9 2.4 Modelling ................................................................................................................................. 10
3 General findings on performance .................................................................................................... 11 3.1 Performance satisfaction ......................................................................................................... 11 3.2 Business prospects ................................................................................................................... 12
4 Impact of resilience on performance ............................................................................................... 15 4.1 Firm performance during the investment period .................................................................... 15 4.2 Firm performance during transition to operations ................................................................. 17 4.3 Future prospects ...................................................................................................................... 19 4.4 Resilience profile of top performers ........................................................................................ 20 4.5 Resilience differences .............................................................................................................. 21
4.5.1 Rural firms ........................................................................................................................ 21 4.5.2 CSG-related firms ............................................................................................................. 22 4.5.3 Industry differences ......................................................................................................... 22
5 Discussion and conclusions .............................................................................................................. 23 5.1 Bringing it all together ............................................................................................................. 23 5.2 Implications for business ......................................................................................................... 24
5.2.1 Building up slack resources .............................................................................................. 24 5.2.2 Strategic repositioning ..................................................................................................... 24 5.2.3 Networking ...................................................................................................................... 25
5.3 Policy implications ................................................................................................................... 26 5.3.1 Helping regional firms to become more resilient ............................................................ 26 5.3.2 Enabling long-term viability of regional small businesses ............................................... 28
5.4 Limitations of the current research and next steps ................................................................. 28 5.4.1 Limitations of the current research ................................................................................. 28 5.4.2 Outreach and communication of results ......................................................................... 28 5.4.3 Expanding the current research stream .......................................................................... 29
6 Appendices....................................................................................................................................... 31 6.1 References ............................................................................................................................... 31 6.2 Analysis methods ..................................................................................................................... 32
6.2.1 Literature review .............................................................................................................. 32 6.2.2 Resilience scale development .......................................................................................... 33 6.2.3 Survey .............................................................................................................................. 33 6.2.4 Sample ............................................................................................................................. 33 6.2.5 Modelling approach ......................................................................................................... 37 6.2.6 Variable list ...................................................................................................................... 39
6.3 Correlation table ...................................................................................................................... 43 6.4 Regression models ................................................................................................................... 44 6.5 Survey instrument ....................................................................... Error! Bookmark not defined.
Tables Table 1 – Tenders ..................................................................................................................................... 16
Table 2 – Constraints negatively affecting performance in the transition to operations period ............ 18
Table 3 – Market constraints ................................................................................................................... 19
SME Study – Trends and Benefits May 2016 7
Table 4 – Slack .......................................................................................................................................... 24
Table 5 – Adapt and transition into new product and service areas ....................................................... 25
Table 6 – Ensure that your firm is better connected within the industry ............................................... 26
Table 7 – Improvement areas for regional small businesses ................................................................... 27
Table 8 – Adapt and transition into new product and service areas ....................................................... 28
Table 9 – Preliminary research agenda on resilience .............................................................................. 29
Table 10 – Literature review search strings ............................................................................................. 32
Table 11 – Variable list ............................................................................................................................. 39
Table 12 – Correlation matrix .................................................................................................................. 43
Table 13 – Investment period regression models ................................................................................... 44
Table 14 – Transition to operations regression models .......................................................................... 45
Table 15 – Future performance regression models ................................................................................. 46
Figures Figure 1 – Location heat map of small businesses, n=400 ........................................................................ 9
Figure 2 – Location heat map (excluding Brisbane firms), n=343 ........................................................... 10
Figure 3 – Location heat map of ‘rural’ firms (control variable), n=196 firms (excluding greater
Brisbane and Toowoomba) ...................................................................................................................... 10
Figure 4 – Satisfaction with performance aspects, n=400 ....................................................................... 12
Figure 5 – Average performance satisfaction, n=400 .............................................................................. 12
Figure 6 – Likelihood of firm exiting the business within the next two years, n=400 ............................. 13
Figure 7 – Business prospects as compared with various baselines, n=400 ........................................... 14
Figure 8 – Average growth prospects, n=400 .......................................................................................... 14
Figure 9 – Keys to performance in investment period ............................................................................ 15
Figure 10 – Slack ...................................................................................................................................... 15
Figure 11 – Breakdown of firms established during investment period .... Error! Bookmark not defined.
Figure 12 – Keys to performance in ‘transition to operations’ period .................................................... 17
Figure 13 – Pro-activeness ....................................................................................................................... 17
Figure 14 - Connectedness ....................................................................................................................... 18
Figure 15 - Anticipation ............................................................................................................................ 18
Figure 16 – Resilience factors relating to future prospects ..................................................................... 19
Figure 17 – Adaptiveness ............................................................................ Error! Bookmark not defined.
Figure 18 - Analysis of top performers .................................................................................................... 21
Figure 19 – Problem-solving .................................................................................................................... 21
Figure 20 – Flexibility ............................................................................................................................... 22
Figure 21 – Improvisation ........................................................................................................................ 22
Figure 22 – Keys to performance across all time periods ........................................................................ 23
Figure 23 – Literature review process ..................................................................................................... 32
Figure 24 – Firm size (n=400, Mean 25.2, Median 12, Mode 5, SD 36, Min 1, Max 200) ........................ 34
Figure 25 – Firm age (n=400, Mean 29.79 Median 25.00 Mode 30, SD 27.4, Min 1, Max 175) .............. 34
Figure 26 – Industry segments, n=400 ..................................................................................................... 35
Figure 27 – Turnover ranges, n=368 ........................................................................................................ 35
Figure 28 – Barriers to meeting business objectives, n=400 ................................................................... 36
Figure 29 – Barriers to meeting business objectives (Queensland 2013 weighted – QBIS report) ......... 36
Figure 30 – Innovation by category over the last three years, n=400 ..................................................... 37

SME Study – Trends and Benefits May 2016 8
1 Introduction
Organisational resilience – the capacity to respond, adapt and transform in response to changes in the
business environment – is now recognised as an important capability that enables businesses to
prepare, recover and adapt to a range of disruptions including economic fluctuations. Considering the
dramatic increase in the number and revenue of regional Queensland businesses resulting from capital
investments in coal seam gas (CSG), we chose to investigate how resilience factors enable small
businesses to perform well in light of these positive economic changes. We also wanted to understand
what factors engendered success when economic times are less favourable, like those associated with
the ‘transition to operations’ phase of the CSG projects, and which related to bright future prospects.
To accomplish this goal we created a means to measure and assess organisational resilience. We then
surveyed 400 small and medium enterprises (SMEs) in regional Queensland about a range of factors
including business performance, their competitive situation, innovation levels and resilience
capabilities. Analysis of the survey responses found eight organisational resilience capabilities that
firms may exhibit: anticipation, slack, innovative problem-solving, improvisation, flexibility,
connectedness, adaptiveness and pro-activeness. We were able to show that the certain of these
resilience factors positively relate to performance in the peak investment period, the transition to
operations period, and to future prospects. We also conduct a series of tests to compare resilience
capabilities across groups, such as those firms involved in the CSG supply chain or not. In conclusion,
we developed recommendations for business practice and strategy and for government policy.
2 Methods
This study aimed to identify and measure organisational resilience capabilities that contribute to
performance of small businesses throughout the CSG investment cycle and into the future. This section
provides the reader with an overview of the methods used. Further detail is in Appendix 6.2, Analysis
methods.
2.1 Survey instrument We adopted a survey methodology to capture information from a large number of firms operating in
regional, southern Queensland. The survey was split into several sections, which considered general
characteristics of the business, resilience, innovation, competitive situation and financial performance.
The survey is based on a highly regarded small business research instrument developed originally by the
Centre for Business Research (CBR) at Cambridge University (UK) [1], to which we added resilience
questions.
2.2 Measuring resilience We reviewed prior research on organisational resilience to find existing scales (see 6.2.1, Literature
review). From this review, it became apparent that prior work on organisational resilience had focused
on catastrophes, and little had been done to understand how firms respond to economic fluctuations.
Thus we conducted a step-by-step process to develop a scale to measure organisational resilience,
which included expert consultation. This process yielded 55 survey questions which we added to the
survey (see 6.2.2, Resilience scale development).

SME Study – Trends and Benefits May 2016 9
After administering the survey we interrogated the resulting data to find clusters of questions that
reflected resilience capabilities commonly held by the firms in the sample. This approach yielded eight
resilience capabilities that we named anticipation, slack, innovative problem-solving, improvisation,
flexibility, connectedness, adaptiveness and pro-activeness (see 6.2.6, Variables). These resilience
variables are central to the analysis contained in this report.
2.3 Sample We used a combination of primary industry trade materials and purchased databases to develop a list
of 2,388 potential small businesses in regional Queensland. The survey was administered to executive
managers and business owners of small firms by a computer-aided telephone interviewing (CATI)
system through a subcontractor. The campaign duration was from November 16th, 2015 to December
17th, 2015. We ended the campaign after receiving 400 responses, achieving a 43.9 per cent response
rate based on 512 direct refusals. Out of this overall sample 24.5 per cent of the sample (98 firms) said
that they were directly involved in CSG industry projects. The location of firms in the sample is shown
below in the heat maps contained in Figure 1, Figure 2 and Figure 3.
Figure 1 – Location heat map of small businesses, n=400

SME Study – Trends and Benefits May 2016 10
Figure 2 – Location heat map (excluding Brisbane firms), n=343
Figure 3 – Location heat map of ‘rural’ firms (control variable), n=196 firms (excluding greater
Brisbane and Toowoomba)
2.4 Modelling We used regression models to establish the relationship between resilience factors and performance
across three time periods:
investment (2008–2013),
transition to operations (2013–2015), and
estimated future performance (to 2017).
In these models, we controlled for a range of factors including industry position, direct CSG involvement,
rural location, firm size and firm age (see Section 6.2.6, Variables). The significant relationships
discussed in this report are present even when controlling for all of these other confounding factors.

SME Study – Trends and Benefits May 2016 11
To further inspect the significant relationships revealed by the regression models, cross-tabulations
were conducted. Cross-tabulations yield odds that provide a more intuitive understanding of the
relationships between variables. For example, we will quickly describe how cross-tabulations result in
the following finding: firms with above average pro-activeness are 4.8 times more likely to predict high
performance satisfaction in 2017. First, we made a binary variable that reflects a firm being either
above, or below, average in their pro-activeness. Second, we created a binary variable reflecting either
high performance satisfaction in 2017 (either 4 – satisfied, or a 5 – very satisfied, on the measurement
scale we used), or not (1, 2 or 3 on the scale). Third, a statistical test found that a significantly higher
number of firms that had above average pro-activeness also had high 2017 performance expectations.
So to calculate the odds of this co-occurrence, we divided the probability of being above average in pro-
activeness and having high performance in 2017 (89 firms/108 firms=0.91), over the probability of being
below average in pro-activeness and having high 2017 performance (30 firms/159 firms =0.19). This
calculation leads to the finding that, firms with above average pro-activeness are 4.8 times more likely
to predict high performance satisfaction in 2017 (.91/.19 = 4.8). A full explanation of the modelling
approach is contained in Section 6.2.5.
3 General findings on performance
3.1 Performance satisfaction We investigated firm performance across four criteria: sales, sales growth, profitability and market
share. These measures are actually reflections of performance as gauged by the executives or owners
we surveyed, as they pertain to their particular industry segment. These measures tend to correlate
very strongly with actual fiscal performance [2]. Figure 4 indicates that firm owners were generally
positive about their performance, with a clear peak in 2013 for each type of performance. However,
Figure 5 shows a slight downward trend when considering average performance satisfaction over time.

SME Study – Trends and Benefits May 2016 12
Figure 4 – Satisfaction with performance aspects, n=400
Figure 5 – Average performance satisfaction, n=400
3.2 Business prospects To investigate business prospects, we considered the likelihood of firm exit (closing the business) and
growth intentions (see Figure 6). We asked respondents about the likelihood of them exiting their
business through a range of approaches and found that between six and 15 per cent of firms had
contemplated one of these approaches. The first bar on the chart corresponds with a similar question
asked by the ABS. Based on that question, a recent report from the ABS showed that approximately 10
per cent of firms on the Western Downs exited their business in any given year[3]. We asked about
additional forms of exit, to those reported by the ABS, which may contribute to our slightly higher
percentage. We find that approximately 40 per cent of firms may be considering exit, but that fewer
than a quarter rated themselves ‘highly likely’ to exit in any of the seven categories we asked about.

SME Study – Trends and Benefits May 2016 13
Figure 6 – Likelihood of firm exiting the business within the next two years, n=400
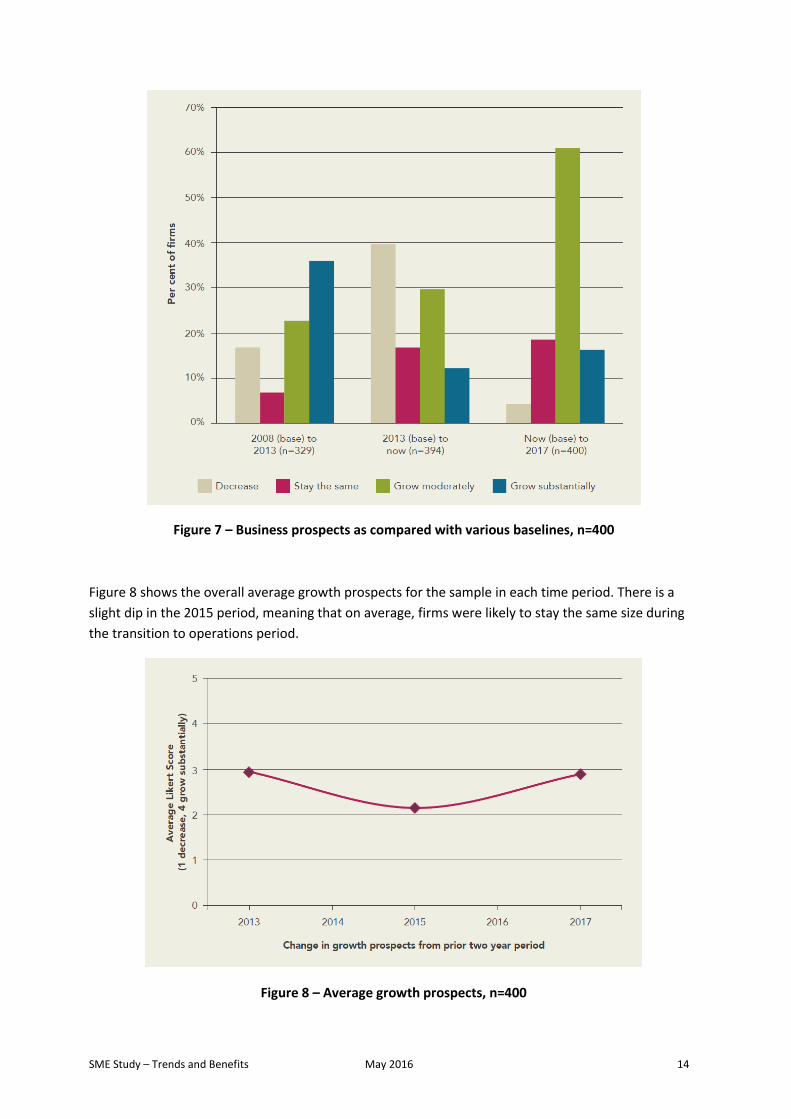
Figure 7 compares growth intentions between different time periods. Reflecting on the change in
growth between 2008 and 2013, 59 per cent of firms reported some level of growth. Comparing 2013
to when firms were surveyed (late 2015), 42 per cent reported some level of growth. Looking forward
to 2017, many firms were optimistic, with 77 per cent intending to grow moderately or substantially.
SME Study – Trends and Benefits May 2016 14
Figure 7 – Business prospects as compared with various baselines, n=400
Figure 8 shows the overall average growth prospects for the sample in each time period. There is a
slight dip in the 2015 period, meaning that on average, firms were likely to stay the same size during
the transition to operations period.
Figure 8 – Average growth prospects, n=400

SME Study – Trends and Benefits May 2016 15
4 Impact of resilience on performance
4.1 Firm performance during the investment period
Figure 9 – Keys to performance in investment period
In the peak investment period of the CSG industry (2008–2013),
one of the most important predictors of performance was simply
having spare capacity to capture new business opportunities. We
term this factor slack. It relates to spare resources (including
financial) that allow firms to capture work associated with the
influx of CSG-related investment. Firms with higher than average
slack were 2.1 times more likely to have growth intentions (2008–
2013) and 2.1 times more likely to be highly satisfied with
performance in 2013 (a combined measure of satisfaction score
for sales, sales growth, and profitability and market share). See
Figure 9, above, and Figure 10, at right.
Figure 10 – Slack
We also found that a resilience factor, which we termed adaptiveness, is negatively related to business
prospect growth during this period. This factor has to do with reconfiguring the business quickly to
capitalise on opportunities. Taken together, these findings imply that long-term investments in things
SME Study – Trends and Benefits May 2016 16
like spare capacity – rather than short-term adaptation – is a more important consideration for positive
performance in the investment period.
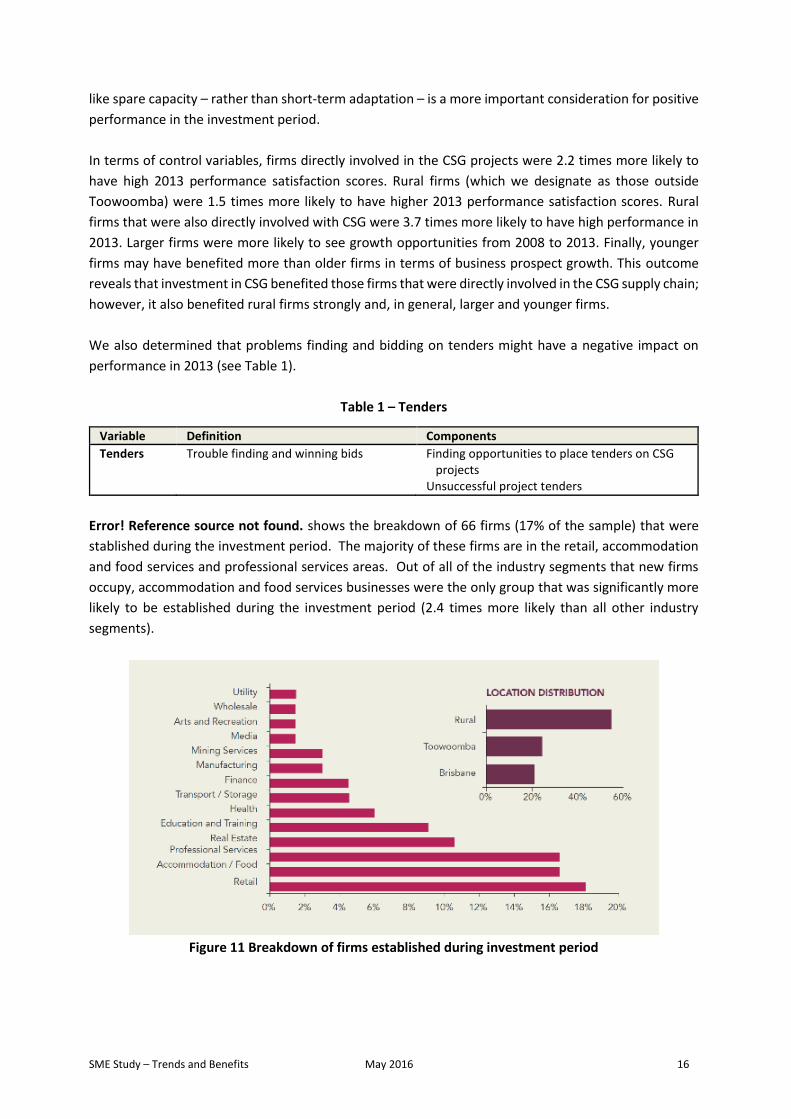
In terms of control variables, firms directly involved in the CSG projects were 2.2 times more likely to
have high 2013 performance satisfaction scores. Rural firms (which we designate as those outside
Toowoomba) were 1.5 times more likely to have higher 2013 performance satisfaction scores. Rural
firms that were also directly involved with CSG were 3.7 times more likely to have high performance in
2013. Larger firms were more likely to see growth opportunities from 2008 to 2013. Finally, younger
firms may have benefited more than older firms in terms of business prospect growth. This outcome
reveals that investment in CSG benefited those firms that were directly involved in the CSG supply chain;
however, it also benefited rural firms strongly and, in general, larger and younger firms.
We also determined that problems finding and bidding on tenders might have a negative impact on
performance in 2013 (see Table 1).
Table 1 – Tenders
Variable Definition Components
Tenders Trouble finding and winning bids Finding opportunities to place tenders on CSG projects
Unsuccessful project tenders
Error! Reference source not found. shows the breakdown of 66 firms (17% of the sample) that were
stablished during the investment period. The majority of these firms are in the retail, accommodation
and food services and professional services areas. Out of all of the industry segments that new firms
occupy, accommodation and food services businesses were the only group that was significantly more
likely to be established during the investment period (2.4 times more likely than all other industry
segments).
Figure 11 Breakdown of firms established during investment period
SME Study – Trends and Benefits May 2016 17
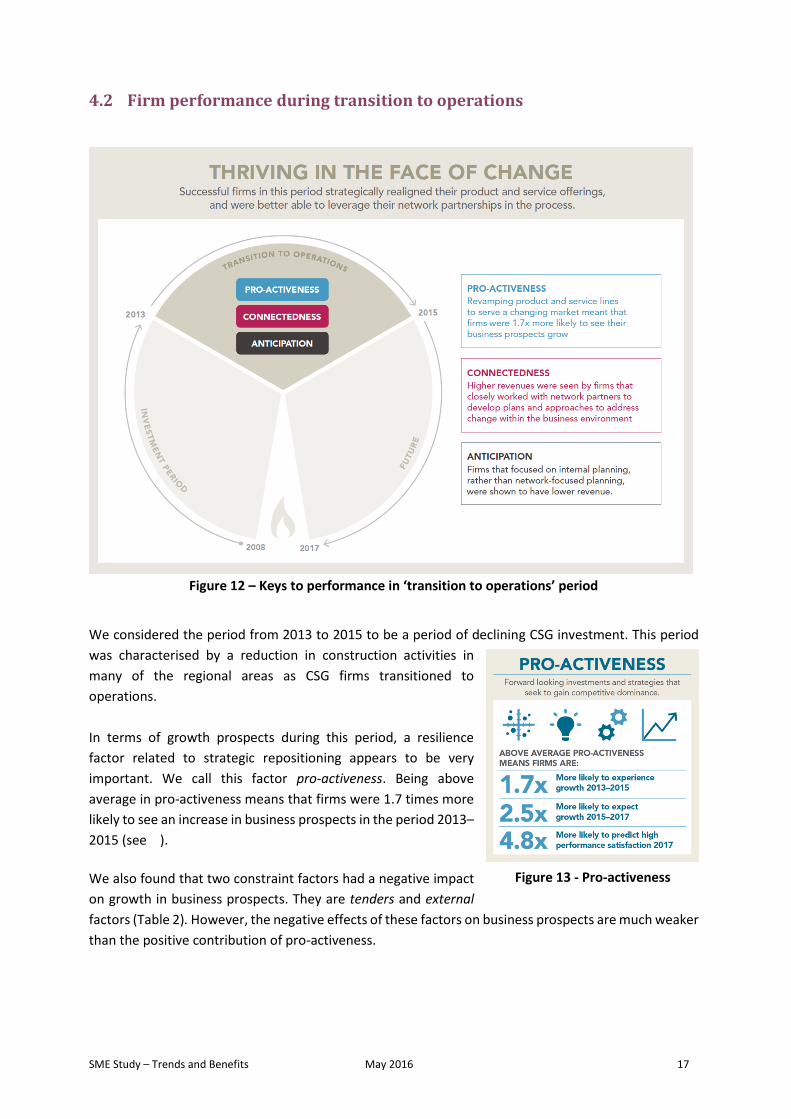
4.2 Firm performance during transition to operations
Figure 12 – Keys to performance in ‘transition to operations’ period
We considered the period from 2013 to 2015 to be a period of declining CSG investment. This period
was characterised by a reduction in construction activities in
many of the regional areas as CSG firms transitioned to
operations.
In terms of growth prospects during this period, a resilience
factor related to strategic repositioning appears to be very
important. We call this factor pro-activeness. Being above
average in pro-activeness means that firms were 1.7 times more
likely to see an increase in business prospects in the period 2013–
2015 (see ).
We also found that two constraint factors had a negative impact
on growth in business prospects. They are tenders and external
factors (Table 2). However, the negative effects of these factors on business prospects are much weaker
than the positive contribution of pro-activeness.
Figure 13 - Pro-activeness

SME Study – Trends and Benefits May 2016 18
Table 2 – Constraints negatively affecting performance in the transition to operations period
Variable Definition Components
External External trouble, including competitors, customers, and regulators
Meeting customer expectations Increasing competition Environmental regulations and compliance Government regulations and compliance
Tenders Trouble finding and winning bids Finding opportunities to place tenders on CSG projects
Unsuccessful project tenders
In terms of control variables, firms directly involved in CSG projects were 1.7 times more likely to see a
decrease in growth prospects than other firms during this period. Similarly, rural firms were twice as
likely as other firms to see their business prospects diminish. CSG-
involved rural firms were three times more likely to see decreased
growth prospects.
To assess performance in the transition period, we also analysed
the factors predicting higher revenues (alternatively, turnover) in
2015. We found that connectedness – a factor relating to
managing network partnerships – is the most important factor
after firm size (see Figure 14). It is important to note that
connectedness and firm size do not correlate strongly. This means
that smaller firms can exhibit high levels of connectedness; it is
not simply a function of firm size.
Figure 14 - Connectedness
We also found that another factor – anticipation – had a
negative relationship to turnover. Anticipation has to do
with active monitoring of the business environment to
avoid being caught off-guard. This factor seems to be
focused toward the short-term and on the internal
machinations of the firm, in comparison to connectedness,
which consists of active management of external network
partnerships (see
Figure 15).
Figure 15 - Anticipation
Taken together, these results indicated that higher revenue (alternatively, turnover) in 2015 was related
to externally-facing stability; that is, how connected the firm is to the rest of the industry rather than
internal processes exhibited by the anticipation variable. This difference may reflect the important role
that strong network partners play during periods of economic decline in helping firms to shape and
focus their strategy to the most appropriate business targets. In contrast, staying internally-focused in
terms of anticipating changes and identifying opportunities appears to relegate firms to a lower
turnover. This finding remains the same even when controlling for firm size and age.

SME Study – Trends and Benefits May 2016 19
In terms of control variables, higher turnover is related to a constraint that we termed markets (Table
3). This is most likely a reflection of the inherent difficulties in seeking higher revenues from foreign
markets, since the construct reflects firms’ difficulties with foreign exchange rates and troubles
accessing overseas markets, which are likely outgrowths of strategies to deal with struggling growth in
traditional markets. However, this effect size we found is relatively small. Also, there is no special
relationship between higher levels of turnover and being a rural or CSG-involved firm. Finally, firm size
and firm age have a positive relationship to turnover, as expected.
Table 3 – Market constraints
Variable Definition Components
Markets Trouble with market-related factors Access to overseas markets Overall growth of market demand in main
product markets Exchange rate
4.3 Future prospects
Figure 16 – Resilience factors relating to future prospects
To test the relationship between resilience and future prospects, we developed models that tested the
impact of various factors on performance satisfaction in 2017 (combined satisfaction score of sales,
sales growth, and profitability and market share), the change in growth prospects from 2015–2017, and
whether the firm will not exit in the next two years (i.e., survive).

SME Study – Trends and Benefits May 2016 20
Performance expectations in 2017 are strongly predicted by
adaptiveness (refer to Error! Reference source not found.) and
ro-activeness (refer to ). Above average pro-activeness means
that firms are 4.8 times more likely to have high performance
expectations in 2017, and above average adaptiveness means
that firms were 3.5 times more likely to have such expectations
in this dimension. In terms of controls, the external and tender
constraints (refer to Table 2) in this period are negatively related
to the performance in 2017; however, the effect is very weak in
comparison to the positive effect of the resilience factors.
High growth in business prospects during the period 2015–2017
is also explained by pro-activeness in our models. Above average
pro-activeness means that firms are 2.5 times more likely than others to have high growth prospects.
Significant control variables in this model include a negative effect regarding external constraints (refer
to Table 2) and a positive relationship to market constraints (refer to Table 3). Once again, these effects
are weak in comparison to pro-activeness.
We also asked businesses if they were planning to exit from their business within the next two years. In
this model, we added additional predictors, such as the change in business prospects during the
transition to operations period (2013–2015) and overall performance satisfaction (a composite measure
of performance satisfaction among four sub-components across 2008, 2013, and 2017 timeframes).
However, these factors are not significant, and it appears that slack alone (refer to Figure 10) is the most
important factor in predicting survival. No control variables gained significance in this model. Neither
CSG-involved firms, nor rural firms, are any more likely to exit the industry than other firms, according
to this model.
4.4 Resilience profile of top performers To create the resilience profile of top performers, we created two overall performance variables. One
variable measures overall growth in business prospects across all periods while the other one measures
performance satisfaction levels in all periods. We then created a variable representing the top 25 per
cent of performers in each category and compared these variables against being above average in each
resilience factor (refer to Section 2.4). We then calculated the odds of being above average in each
resilience category and being in the top 25 per cent in overall growth and overall performance. The
results for top 25 per cent growth largely mirror the results of the models revealed in the prior sections.
The overall performance satisfaction across all time periods shows top-performing firms are much more
likely to be above average in all resilience categories. For instance, firms in the top 25 per cent in overall
performance satisfaction are 2.26 times as likely to have above average anticipation levels. The results
are shown below in Figure 18.
Figure 17 - Adaptiveness
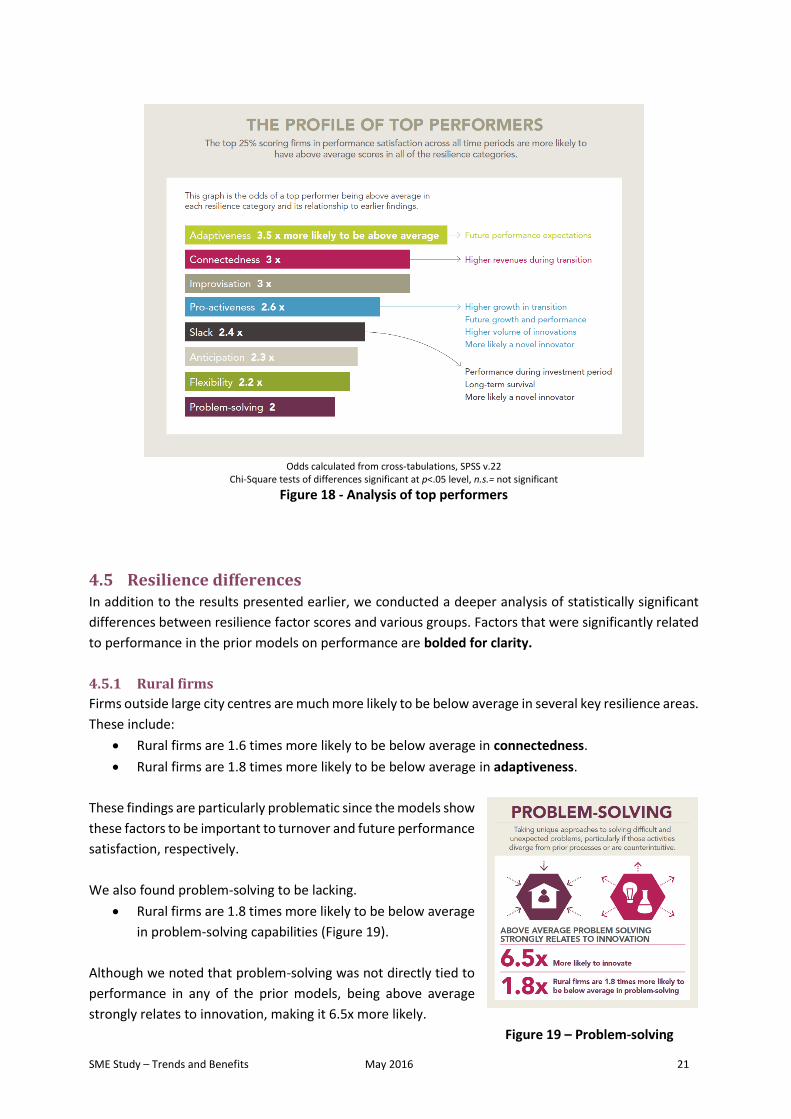
SME Study – Trends and Benefits May 2016 21
Odds calculated from cross-tabulations, SPSS v.22
Chi-Square tests of differences significant at p<.05 level, n.s.= not significant
Figure 18 - Analysis of top performers
4.5 Resilience differences In addition to the results presented earlier, we conducted a deeper analysis of statistically significant
differences between resilience factor scores and various groups. Factors that were significantly related
to performance in the prior models on performance are bolded for clarity.
4.5.1 Rural firms
Firms outside large city centres are much more likely to be below average in several key resilience areas.
These include:
Rural firms are 1.6 times more likely to be below average in connectedness.
Rural firms are 1.8 times more likely to be below average in adaptiveness.
These findings are particularly problematic since the models show
these factors to be important to turnover and future performance
satisfaction, respectively.
We also found problem-solving to be lacking.
Rural firms are 1.8 times more likely to be below average
in problem-solving capabilities (Figure 19).
Although we noted that problem-solving was not directly tied to
performance in any of the prior models, being above average
strongly relates to innovation, making it 6.5x more likely.
Figure 19 – Problem-solving

SME Study – Trends and Benefits May 2016 22
4.5.2 CSG-related firms
We also found that firms directly involved in CSG projects are 1.6
times more likely to have above average flexibility (Figure 20).
Nevertheless, it should be noted that we did not find flexibility to
be directly related to performance in the models.
Figure 20 – Flexibility
4.5.3 Industry differences
This section outlines any specific resilience differences across
industry categories. Differences that were significantly related
to performance in the prior models are bolded.
Manufacturing firms are twice as likely to be below
average in improvisation.
Retailers were 2.5 times more likely to be above
average in improvisation.
Wholesalers were 3.6 times more likely to be below
average in anticipation.
Figure 21 – Improvisation
Transportation and storage firms were
o 3.7 times more likely to be below average in problem-solving
o 3.5 times more likely to be below average in pro-activeness
o 3 times more likely to be below average in anticipation
Professional services firms were
o 2.3 times more likely to be below average in slack
o 2.1 times more likely to be below average in improvisation ( Figure 21).
Financial sector firms were
o 2.5 times more likely to have below average problem-solving
o 2.3 times more likely to have below average adaptiveness.
Accommodation / food services were twice as likely to be
below average in problem-solving.

SME Study – Trends and Benefits May 2016 23
5 Discussion and conclusions
5.1 Bringing it all together
Figure 22 – Keys to performance across all time periods
We found that different resilience factors are significant in different periods. In general, resilience
factors transition from being less sophisticated in the investment period to being more strategic as time
moves forward. In the investment period, simply being able to capture the ample business opportunities
requires extra capacity and little adaptation.
However, to flourish during the transition to operations period, firms needed to exhibit pro-activeness
toward developing new product and service niches and to rely on network partners in this process.
Looking to the future, pro-activeness plays a critical role – as does adaptation – in order to fluidly
transform business offerings in a new business environment. Astute firms will also consider investing in
spare capacity (i.e., slack, including saving financial resources) to deal with future shifts in the business
environment (see Figure 22).

SME Study – Trends and Benefits May 2016 24
5.2 Implications for business This section discusses the implications of our findings, with a particular focus on helping businesses
prosper through innovation.
5.2.1 Building up slack resources
Slack is a consistent predictor of performance in both the investment period and in the future. Slack
also predicts survival beyond the next two years.
Primarily, we suspect that slack resources are useful to buffer against uncertainty in demand in the
marketplace. On one hand, carrying excess capacity can help to ensure that the firm is ready to take
advantage of opportunities that arise (as we have shown to be true in the investment period). On the
other hand, having financial reserves helps to ensure survival over lull periods of demand for goods or
services. It can also provide firms with breathing room in terms of making business decisions (Table 4).
Table 4 – Slack
Variable Definition Characteristics of success
Slack Spare staff and financial resources that can be utilised or reassigned toward ad hoc activities or new priorities, and backup and redundant systems and processes that are held in reserve to buffer against uncertainty
Buffer against high demand: Invest in spare capacity to buffer against demand uncertainty – if you can afford to.
Rainy day: Keep liquid financial resources to help smooth out lulls in demand.
Invest in innovation: Firms with more slack spend wisely on new product, service, logistic, and process innovations.
Another advantage of slack is its contribution to innovation. This is because slack can be leveraged
during lull periods toward developing innovations [4], [5]. In fact, upon further inspection of the data,
firms with above average slack are 1.8 times more likely to be novel innovators – that is, introducing
any of seven types of innovation that are new to the industry and to the firm. They also produce
significantly more product, logistic, services and process innovations than other firms. Hence, investing
in slack can have indirect benefits to performance by underwriting the innovation activities of the firm.
5.2.2 Strategic repositioning
We found that performance is clearly tied to the ability to make adjustments to product and service
offerings, as shown by the repeated role of pro-activeness in our models. Firms that change their
product or service offerings are much more likely to outperform others.
We inspected the above average values in the pro-activeness variable to assess its intersection with
innovation. We found that above average pro-activeness relates to being an innovator (3x more likely).
It also relates to introducing significantly higher numbers of all seven types of innovation that we
measured. Furthermore, the likelihood of introducing a novel version (new to the industry) of each type
of innovation is also higher in almost every case. The likelihood of a novel version of each type of
innovation is displayed below parenthetically:
New or significantly improved product (1.9x)
Technological improvements in supply, storage or distribution systems for manufactured
SME Study – Trends and Benefits May 2016 25
product (2.6x)
New or significantly improved service (1.3x)
New or significantly improved process to deliver products or services (2x)
New organisational / managerial processes or business strategies (n/a)
New media or techniques for promotion or pricing strategies (3.2x)
Significant changes to the business model or corporate strategy (1.4x).
Interestingly, adaptiveness – an important predictor of high performance expectations in 2017 – does
not display a similar relationship to innovation. Firms with higher than average adaptiveness are twice
as likely to introduce innovations (including any type with any degree of novelty). However, none of the
aforementioned relationships to specific types of innovation were present in our analysis. This does not
mean that adaptiveness is not important. Instead, it may mean that adaptiveness is the other side of
the re-positioning equation that operates hand-in-hand with the more innovation-focused pro-
activeness capability. Firms with above average adaptiveness are 7.5 times as likely to also be above
average in their pro-activeness levels. Some recommendations regarding pro-activeness and
adaptiveness are shown in Table 5.
Table 5 – Adapt and transition into new product and service areas
Variable Definition Characteristics of success
Pro-activeness
Forward looking investments and strategies that seek to gain competitive dominance
Be aggressive: Strive to introduce new products and new services into the market before competitors do.
Treat threats as opportunities: Address strategic threats to your current business and transforming them into new business opportunities.
Be strategic: Invest the necessary time and resources to enable your firm to quickly recognise and gauge the impact of shifts in the marketplace.
Change your business: Modify your firm’s organisational structures to support new business opportunities.
Adaptiveness Shifting and reconfiguring to meet new challenges in a swift and adept manner
Shift things around: Deal with adversity in the industry by being malleable and adaptive.
Be resourceful: Use existing resources to adapt to change.
Be dependable: Never let your customers down – always strive to deliver value to your clients in the face of all obstacles.
5.2.3 Networking
Firms should try to improve their networking capabilities, as this factor is directly tied to higher
revenues. Further inspection of this relationship (as it pertains to innovation) reveals that a firm with
above average connectedness will be twice as likely to innovate, in general, and more likely to produce
higher numbers of innovations in all seven innovation categories.
The specific types of novel (new-to-industry) innovations that network partnerships support yields
insights into how they translate into higher revenues for the firm. Firms with above average

SME Study – Trends and Benefits May 2016 26
connectedness are 2.4 times more likely to introduce novel logistic innovations. These innovations
improve the efficiency with which goods and services are transported and stored. Furthermore, average
connectedness means that firms are 2.8 times more likely to have introduced novel pricing /
promotional innovations. This latter category of innovations helps to leverage the network to the fullest
extent. For instance, cross-promotional efforts and package deals with other firms can help to ensure
that a business is in constant demand through enticing new customers to engage. Recommendations
are made below in Table 6.
Table 6 – Ensure that your firm is better connected within the industry
Variable Definition Characteristics of success
Connectedness Working closely with network partners to develop plans and approaches to addressing change in the business environment (more outwardly focused)
Diversify: Work on developing diverse and heterogeneous network partnerships to spread risks and improve the effect of your marketing budget.
Build robust and long-lasting relationships: Spend the time to understand your value proposition to your network partners and actively manage those links to improve them.
Be pro-active: Connected firms pro-actively plan their business activities by including their customers and suppliers in the conversation – especially in terms of managing changes in the business environment.
Test your assumptions: Connected firms conduct scenario planning exercises to test and reveal weaknesses in their current plans in order to improve them.
5.3 Policy implications This section distils the findings into potential policy implications that could be considered by state
government, regional councils as well as CSG firm procurement functions.
5.3.1 Helping regional firms to become more resilient
We found that firms in regional towns such as Dalby, Chinchilla and Miles have witnessed a decrease in
growth prospects in the transition to operations period. That comes as no surprise. One potential
reason for this downturn is not simply that CSG-related work has subsided. Rather, this group was
found to be below average in several key resilience factors related to high performance. For instance,
connectedness was found to be below average; this factor relates to higher turnover at the height of
the downturn. Also, adaptiveness, which relates to high expected performance satisfaction in 2017, was
found to be well below average in this group of firms. Furthermore, these firms were shown to be below
average in problem-solving, which is directly related to innovation. We make some high-level
recommendations regarding potential ways to bolster these areas in the table below (see Table 7).
Many of these recommendations could be implemented by regional councils or the state government
in order to improve the viability of regional firms.

SME Study – Trends and Benefits May 2016 27
Table 7 – Improvement areas for regional small businesses
Variable Definition Potential policy implications Connectedness Working closely with
network partners to develop plans and approaches to addressing change in the business environment (more outwardly focused)
Marketing-related support to firms regarding how to leverage network partners in terms of cross-promotional approaches, and help with gaining a better understanding of market signals in terms of pricing strategies and bidding for contracts.
Development of collaborative partnerships or alliances to share costs of transport, logistics, and storage in order to offer a broader service offering to potential clients.
Support local industry associations and chambers of commerce.
Promote greater awareness of procurement portals and other forms of networking to increase awareness of partnership and bid opportunities.
Emulation by CSG firms of the North Sea Cost Reduction In the New Era (CRINE) strategies that would engender a more collaborative and connected supply chain, including but not limited to clearer communication of mid-term plans such as drilling sequences, consolidated functional requirements for products and technology, and common pre-qualification processes.
Providing a single point of promotion for networking events in regional areas
Formal collaboration partnerships between state, federal and local government with CSG firms focused on supplier development.
Adaptiveness Shifting and reconfiguring to meet new challenges in a swift and adept manner
Development and dissemination of successful case studies of firms in the region that have adapted and found new ways to use their existing resources.
Providing training for business owners in business skills such as planning and financial management.
Innovative problem-solving
Taking unique approaches to solving difficult and unexpected problems, particularly if those activities diverge from prior processes or are counterintuitive
Hosting more innovation-related events for rural firms, including best-practice seminars and case studies of how innovation can improve business outcomes.
Providing seminars on topics such as design-driven innovation and lean launch pad to build these capabilities in local business owners.
Investment in innovation hubs / connection points that support regional businesses to access faster internet, web-based seminars / platforms.
SME Study – Trends and Benefits May 2016 28
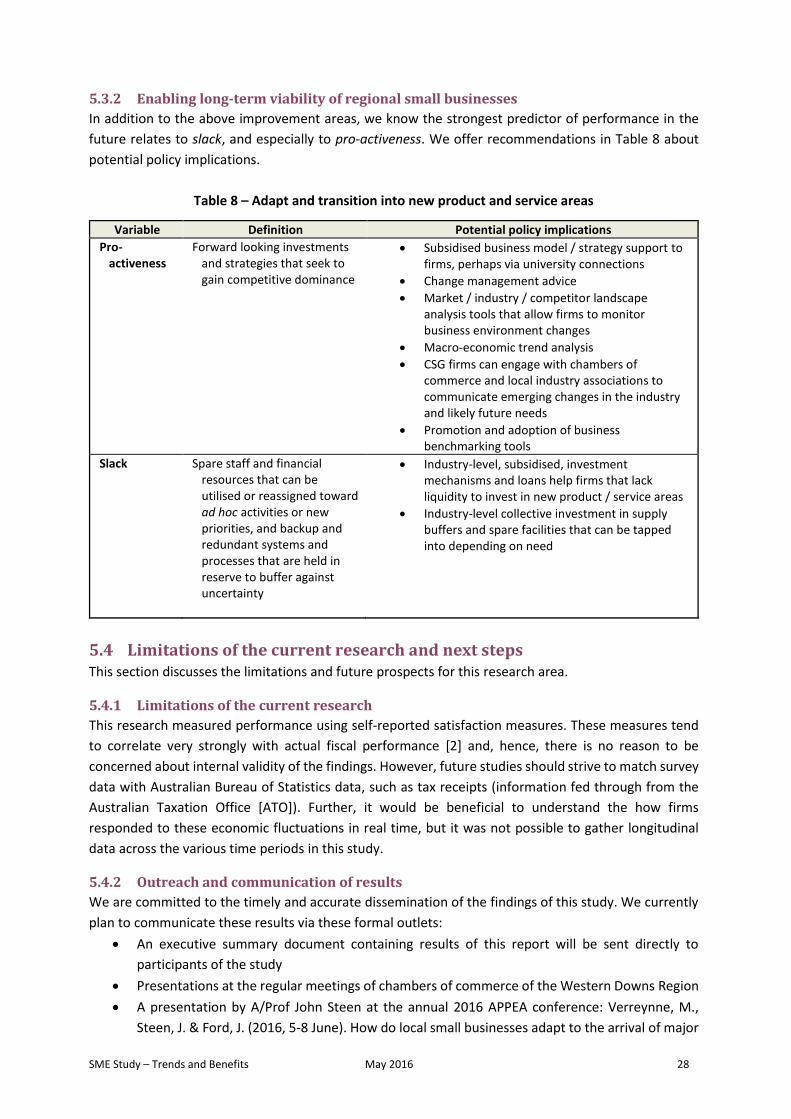
5.3.2 Enabling long-term viability of regional small businesses
In addition to the above improvement areas, we know the strongest predictor of performance in the
future relates to slack, and especially to pro-activeness. We offer recommendations in Table 8 about
potential policy implications.
Table 8 – Adapt and transition into new product and service areas
Variable Definition Potential policy implications
Pro-activeness
Forward looking investments and strategies that seek to gain competitive dominance
Subsidised business model / strategy support to firms, perhaps via university connections
Change management advice
Market / industry / competitor landscape analysis tools that allow firms to monitor business environment changes
Macro-economic trend analysis
CSG firms can engage with chambers of commerce and local industry associations to communicate emerging changes in the industry and likely future needs
Promotion and adoption of business benchmarking tools
Slack Spare staff and financial resources that can be utilised or reassigned toward ad hoc activities or new priorities, and backup and redundant systems and processes that are held in reserve to buffer against uncertainty
Industry-level, subsidised, investment mechanisms and loans help firms that lack liquidity to invest in new product / service areas
Industry-level collective investment in supply buffers and spare facilities that can be tapped into depending on need
5.4 Limitations of the current research and next steps This section discusses the limitations and future prospects for this research area.
5.4.1 Limitations of the current research
This research measured performance using self-reported satisfaction measures. These measures tend
to correlate very strongly with actual fiscal performance [2] and, hence, there is no reason to be
concerned about internal validity of the findings. However, future studies should strive to match survey
data with Australian Bureau of Statistics data, such as tax receipts (information fed through from the
Australian Taxation Office [ATO]). Further, it would be beneficial to understand the how firms
responded to these economic fluctuations in real time, but it was not possible to gather longitudinal
data across the various time periods in this study.
5.4.2 Outreach and communication of results
We are committed to the timely and accurate dissemination of the findings of this study. We currently
plan to communicate these results via these formal outlets:
An executive summary document containing results of this report will be sent directly to
participants of the study
Presentations at the regular meetings of chambers of commerce of the Western Downs Region
A presentation by A/Prof John Steen at the annual 2016 APPEA conference: Verreynne, M.,
Steen, J. & Ford, J. (2016, 5-8 June). How do local small businesses adapt to the arrival of major

SME Study – Trends and Benefits May 2016 29
oil and gas projects? The Queensland gasfields case. The APPEA 2016 Conference and
Exhibition, Brisbane, Australia.
Participation at the upcoming conference on regional resilience supported by the University of
Southern Queensland’s (USQ) Institute for Resilient Regions (15 June 2016)
A press release that will be prepared by the UQ Business School Marketing team
A written piece for the online magazine The Conversation, and the UQ Business School
Magazine Momentum
Academic journal articles.
5.4.3 Expanding the current research stream
The results from this initial study provide us with directional indicators for future research. This report
highlights important linkages between the capabilities of resilient firms and their ability to sustain their
performance through economic changes.
However, there is much more to do to uncover the specific mechanisms underlying these capabilities.
The table below shows links between current findings and new research questions as well as potential
methods to answer them. In doing so, the broad outlines of a future research programme come into
view (Table 9).
Based on this preliminary research agenda we will file an expression of interest (EOI) with the CCSG by
20 April 2016 to expand our resilience through an ARC Linkage grant.
Table 9 – Preliminary research agenda on resilience
Finding(s) New questions Research approaches Potential outcomes
Slack supports investment period performance, may be the single biggest reason for long-term survival
Slack is tied to novel (new to the industry) innovations and higher numbers of product, logistic, services and process innovations
How does slack help firms pro-actively take advantage of opportunities that economic fluctuations present?
How do firms leverage specific types of slack toward new innovations?
How do these slack-based innovations translate to performance?
The research could use as basis the well-known ability-motivation-opportunity (AMO) structure to discriminate between firms from different industries, those that have acquired more resources and those that can draw on ongoing profit margins. This is best done using a case study design.
Greater insight into the different elements of slack that most support expansion and survival
Detailed case study exemplars for training and outreach

SME Study – Trends and Benefits May 2016 30
Finding(s) New questions Research approaches Potential outcomes
Connectedness supports turnover in transition to operations period
What are the specific network relationship structures that support performance?
How do small firms leverage their networks to achieve higher revenues?
Network mapping of regional firms industrial connections
Identifying the most influential players in regional industrial networks:
Those most likely to serve as relationship brokers and idea connectors.
An explanation of which positions in the network make the rest of the network vulnerable to disruptions.
The role of pro-activeness in terms of dealing with declining economic conditions, and having strong positive outlook on future performance.
Strong ties between pro-activeness and innovation of all types, and new to industry versions.
How exactly do firms focus their innovation efforts in an economic downturn?
Case studies focused on innovation during economic downturns
Additional clarity on the mechanisms behind strategic planning in small businesses
Detailed case study exemplars for training and outreach
Nearly 20 percent of our sample is new firms incepted during the investment period, many of these being accommodation and food services.
How do new small firms form during periods of high economic activity?
How does increased economic activity in rural areas give rise to technologically sophisticated service firms and similar scientific and engineering-type firms?
Case studies of new firms focused on how they find footing and business niches during an uptick of economic activity
New insights into which firms are seeing opportunities, and which do not
Insights into how new firms mobilise and gain finance
Top performers exhibit higher levels of all resilience capabilities
Which forms of resilience work together?
What is the relationship between slack and pro-activeness?
How are anticipation and connectedness related?
Leveraging existing data, in conjunction with new ABS financial data, and perform path analysis to determine more nuanced relationships within various resilience factors (including moderation and mediation)
Insight into the multiplicative or substitutive qualities of various resilience capabilities
More specific insights into the impact of outcomes like revenue and profits via ABS data

31
6 Appendices
6.1 References
[1] A. Cosh, X. Fu, and A. Hughes, “Organisation structure and innovation performance in different environments,” Small Business Economics, vol. 39, pp. 301–317, 2012.
[2] G. G. Dess and R. B. Robinson Jr., “Measuring Organizational Performance in the Absence of Objective Measures: The Case of the Privately-Held Firm and Conglomerate Business Unit Authors ( s ): Gregory G . Dess , Richard B . Robinson and Jr . Published by : Wiley Stable URL : http://www.jsto,” Strategic Management Journal, vol. 5, no. 3, pp. 265–273, 1984.
[3] Australian Bureau of Statistics, “Australian Bureau of Statistics web site,” National Regional Profile, Western Downs (R) (LGA), 2014. [Online]. Available: http://stat.abs.gov.au/itt/r.jsp?RegionSummary®ion=37310&dataset=ABS_REGIONAL_LGA&geoconcept=REGION&datasetASGS=ABS_REGIONAL_ASGS&datasetLGA=ABS_REGIONAL_LGA®ionLGA=REGION®ionASGS=REGION. [Accessed: 29-Mar-2016].
[4] H. R. Greve, Organizational Learning from Performance Feedback: A Behavioral Perspective on Innovation and Change. Cambridge University Press, 2003.
[5] R. M. Cyert and J. G. March, Behavioral Theory of the Firm. Englewood Cliffs, N.J: Wiley, 1963.
[6] M.-L. Verreynne and J. Steen, “Queensland Business Innovation Survey 2014 Report,” 2014.
[7] K. Laursen and A. J. Salter, “The paradox of openness: Appropriability, external search and collaboration,” Research Policy, vol. 43, no. 5, pp. 867–878, Nov. 2014.
32
6.2 Analysis methods
6.2.1 Literature review
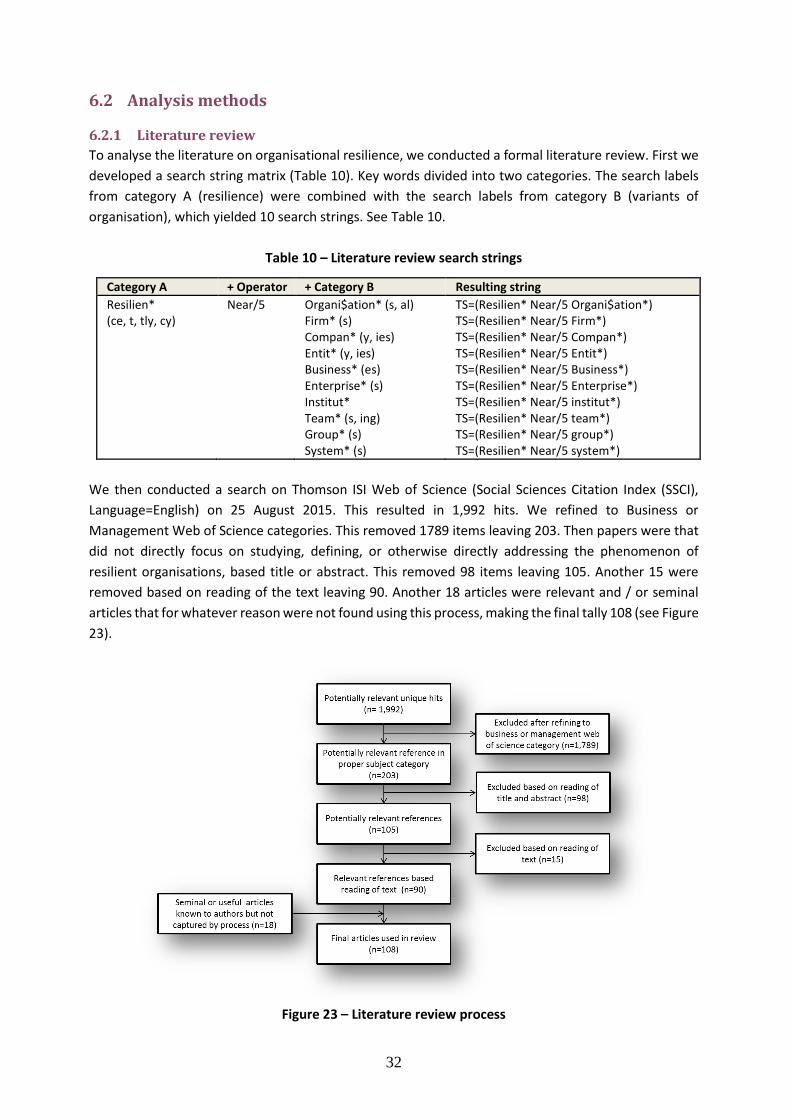
To analyse the literature on organisational resilience, we conducted a formal literature review. First we
developed a search string matrix (Table 10). Key words divided into two categories. The search labels
from category A (resilience) were combined with the search labels from category B (variants of
organisation), which yielded 10 search strings. See Table 10.
Table 10 – Literature review search strings
Category A + Operator + Category B Resulting string
Resilien* (ce, t, tly, cy)
Near/5 Organi$ation* (s, al) Firm* (s) Compan* (y, ies) Entit* (y, ies) Business* (es) Enterprise* (s) Institut* Team* (s, ing) Group* (s) System* (s)
TS=(Resilien* Near/5 Organi$ation*) TS=(Resilien* Near/5 Firm*) TS=(Resilien* Near/5 Compan*) TS=(Resilien* Near/5 Entit*) TS=(Resilien* Near/5 Business*) TS=(Resilien* Near/5 Enterprise*) TS=(Resilien* Near/5 institut*) TS=(Resilien* Near/5 team*) TS=(Resilien* Near/5 group*) TS=(Resilien* Near/5 system*)
We then conducted a search on Thomson ISI Web of Science (Social Sciences Citation Index (SSCI),
Language=English) on 25 August 2015. This resulted in 1,992 hits. We refined to Business or
Management Web of Science categories. This removed 1789 items leaving 203. Then papers were that
did not directly focus on studying, defining, or otherwise directly addressing the phenomenon of
resilient organisations, based title or abstract. This removed 98 items leaving 105. Another 15 were
removed based on reading of the text leaving 90. Another 18 articles were relevant and / or seminal
articles that for whatever reason were not found using this process, making the final tally 108 (see Figure
23).
Figure 23 – Literature review process
33
6.2.2 Resilience scale development
Following the literature review, it became apparent that prior work on organisational resilience had
focused on catastrophe and little had been done to understand how firms respond to economic
fluctuations. Consequently, we developed a new scale of organisational resilience following a step-by-
step process. Drawing on the literature, we listed concepts previously used to measure resilience. We
grouped similar concepts together and developed a comprehensive list of questions thought to reflect
the spirit of these new constructs. We then asked several experts to review whether the questions we
had developed strongly reflected our constructs. We compiled these expert reviews and made changes
to the questions; mostly by altering them to provide greater clarity or by deleting them. A final list of
55 questions was ultimately produced which reflected an anticipated 10 different constructs of
resilience.
After the survey was conducted, we subjected the answers to the organisational resilience questions to
exploratory factor analysis (EFA). This approach statistically grouped the questions we asked into larger
constructs, each reflecting different aspects of resilience. Specifically, we used principle component
extraction and direct Oblimin rotation in SPSS v.22. The Kaiser-Meyer-Olkin Measure of Sampling
Adequacy was .950 and the Bartlett’s Test of Sphericity was significant (p <.001), indicating that the
sample would yield a stable factor solution.
The EFA approach yielded an eight-factor solution that includes the following sub-scales: anticipation,
slack, innovative problem-solving, improvisation, flexibility, connectedness, adaptiveness and pro-
activeness. These eight constructs, components, and definitions can be found in Section 6.2.6. These
variables form the core of the analysis.
6.2.3 Survey
We adopted a survey methodology to capture information from a large number of firms operating in
regional Queensland. The core of the survey was based on a widely tested and highly regarded
instrument developed originally by the Centre for Business Research (CBR) at Cambridge University (UK)
[1], and used widely in Australia in surveys conducted by The University of Queensland Business School
(UQBS). The aforementioned resilience questions were added to the survey instrument. The final survey
was split into several sections which considered general characteristics of the business, resilience,
innovation, competitive situation and financial performance.
6.2.4 Sample
To curate a sample of firms, we first collected trade show materials from a recent Surat Basin Expo to
locate firms operating in the area which may be associated with the CSG industry. We combined this
list with an existing UQBS small business CSG-related database. We then purchased a larger database
of firms in the area from Impact Lists. This yielded at total of 2,388 potential firms. The survey was
administered by a computer-aided telephone interviewing (CATI) system through a subcontractor. We
targeted executive managers, including business owners of small firms. We ended our campaign after
receiving 400 responses. We achieved a 43.9 per cent response rate, based upon the total of 400
responses and 512 direct refusals that we logged before terminating the survey. Tests for non-response
bias revealed no cause for concern. Refer to Figure 1, Figure 2 and Figure 3 for the geographical
distribution of the sample.
6.2.4.1 Basic descriptive statistics
The average firm surveyed employed 25 staff. Most firms employed between five and 19 employees
(58 per cent), with only six per cent employing more than 100 staff. While the ABS [3] reports that only

34
10 per cent of firms on the Western Downs employ more than five staff, two considerations are
important. First, we did not survey farms which make up approximately half of the ABS sample. Second,
our stratified sampling process focused on allowing us a broader representation across size categories
for the purpose of comparisons between groups Figure 24.
Figure 24 – Firm size (n=400, Mean 25.2, Median 12, Mode 5, SD 36, Min 1, Max 200)
The average age of the firms in our sample was 30 years (see Figure 25).
Figure 25 – Firm age (n=400, Mean 29.79 Median 25.00 Mode 30, SD 27.4, Min 1, Max 175)
In terms of industry, we surveyed a broad range of industries, with a large proportion of our sample
coming from professional services, retail, manufacturing and accommodation and food services (see
<510%
5-929%
10-1929%
20-9926%
100-2006%
0
10
20
30
40
50
60
70
80
<5 years 5-9years
10-14years
15-19years
10-24years
25-29years
30-39years
40-49years
>50years
nu
mb
er
of
firm
s
Age group

35
Figure 26).
Figure 26 – Industry segments, n=400
Most firms reported turnover in the range of $1-5 million, with only a very small proportion reporting
turnover of above $100 million (Figure 27).
Figure 27 – Turnover ranges, n=368
6.2.4.2 Barriers to meeting business objectives
We asked firms to identify the most important barriers to meeting their business objectives. Not
surprisingly, increases in competition ranked most highly, followed by regulatory barriers and
0%
2%
4%
6%
8%
10%
12%
14%
16%
18%
20%
Pro
fess
ion
al, s
cien
tifi
c an
d…
Re
tail
trad
e
Man
ufa
ctu
rin
g
Acc
om
mo
dat
ion
an
d f
oo
d s
ervi
ces
Fin
anci
al a
nd
insu
ran
ce s
ervi
ces
Hea
lth
car
e a
nd
so
cial
ass
ista
nce
Edu
cati
on
an
d t
rain
ing
Re
nta
l, h
irin
g an
d r
eal
est
ate…
Co
nst
ruct
ion
Tran
spo
rt, p
ost
al a
nd
war
eh
ou
sin
g
Elec
tric
ity,
gas
, wat
er a
nd
was
te…
Wh
ole
sale
tra
de
Agr
icu
ltu
re, f
ore
stry
an
d f
ish
ing
Min
ing
Info
rmat
ion
med
ia a
nd
…
Ad
min
istr
ativ
e an
d s
up
po
rt…
Art
s an
d r
ecre
atio
n s
erv
ices
Pu
bic
ad
min
istr
atio
n a
nd
saf
ety
Pe
rce
nt
of
firm
s re
pre
sen
tin
g e
ach
se
gem
en
t
All firms (400)
Rural firms (198)
0.0
5.0
10.0
15.0
20.0
25.0
30.0
35.0
40.0
45.0
Less than$1M
$1M to lessthan $5M
$5M to lessthan $10M
$$10M to lessthan $100M
$100M andabove
Pe
rce
nt
of
firm
s

36
challenges in meeting customer expectation. Skilled labour also seemed to be an issue (see Figure 28).
Figure 28 – Barriers to meeting business objectives, n=400
These results are largely consistent with the QBIS 2014 [6] that reports competition, regulation and
skilled labour also made up three of the top four categories, with growth in market demand rounding
out the top four (see Figure 29).
Figure 29 – Barriers to meeting business objectives (Queensland 2013 weighted – QBIS report)
3.002.99
2.872.822.79
2.622.31
2.222.19
2.072.05
1.981.58
0.00 0.50 1.00 1.50 2.00 2.50 3.00 3.50
Increasing competition
Government regulations and compliance
Meeting customer expectations
Skilled labour
Overall growth of market demand in main product markets
Management skills
Availability and cost of finance for expansion
Difficulties in acquiring and implementing new technology
Environmental regulations and compliance
Finding opportunities to place tenders on CSG projects
Unsuccessful project tenders
Exchange rate
Access to overseas markets
Mean score, range 1 to 5 (crucial limitation)
0% 5% 10% 15% 20% 25% 30% 35%
Availability and cost of finance for expansion
Availability and cost of overdraft finance
Skilled labour
Management skills
Marketing skills
Acquisition of technology
Difficulties in implementing new technology
Availability of appropriate site
Environmental regulation compliance
Access to overseas markets
Growth in market demand
Competition
Government regulations and compliance
Adherence to standards
Exchange rate
Rest of Australia
Queensland

37
6.2.4.3 Innovation performance
Figure 30 shows the distribution of innovations that firms in the survey had introduced in the three
years preceding our survey.
Figure 30 – Innovation by category over the last three years, n=400
6.2.5 Modelling approach
We used regression models to identify the way in which resilience factors and a series of control
variables were related to performance across three timeframes: investment period (2008-2012);
transition to operations (2013-2015); and future (to 2017). Since most of the performance variables are
Likert scale, we used seemingly unrelated fractional logistic regressions [7]. This approach transforms
the Likert scale dependent variable into fractions varying between 0 and 1, and estimates the beta
values for the models simultaneously in order to deal with shared error across various performance
models in each time frame. In cases where the dependent variable is binary, as in the case of survival,
logistic regression was used. In our models we included all eight resilience factors and several control
variables, including firm size, age, and industry (please see the variables list in Section 6.2.6). All models
were executed in Stata v.14. The models are shown in Section 6.4 in the Appendix.
To further inspect the significant relationships between variables borne by the regression models and
to conduct supplementary analysis beyond the models, cross-tabulations were conducted between
binary variables. This approach provides a more intuitive understanding of the relationships between
variables. For instance, the reader can identify cross-tabulation results when the narrative takes the
form, ‘firms with above average pro-activeness are 4.8 times more likely to predict high performance
satisfaction in 2017’. We calculated this in the following manner. Above average pro-activeness can be
indicated by a binary variable and this can be compared with a binary variable indicating that the firm
has high / very high expected satisfaction performance in 2017. A cross-tabulation investigation reveals
a statistically significant relationship (chi-square, 2-tailed values below p< 0.05) and from this the odds
0
50
100
150
200
250
300
nu
mb
er
of
firm
s
Type of innovation
10+ innovations
5-9 innovations
1-4 innovations

38
ratio (4.8 in this example) is calculated. The analysis was conducted in SPSS v. 22. For the sake of brevity,
the raw data for these ancillary analyses are not contained in the Appendix.
Finally, Mann-Whitney mean ranking was conducted to compare count variables with different
categories. For instance, we compared the difference between being above or below average in pro-
activeness to see whether this has a significant impact on the number of product innovations produced.
This analysis was also conducted in SPSS v. 22. All variables used in the analysis are contained in Table
11 in the Appendix. A correlation matrix created in SPSS v. 22 for the variables used in the regression
models is contained in Section 6.3 of the Appendix.

39
6.2.6 Variable list
Table 11 – Variable list
Category Variable name Definition / notes
Independent variables
Perf_08T The addition of 2008 satisfaction scores for sales, sales growth, profitability, and market share measured on a Likert scale ranging from 1 (very dissatisfied) to 5 (very satisfied), divided by the highest possible score (20) to obtain a fraction.
Perf_13T The addition of 2013 satisfaction scores for sales, sales growth, profitability, and market share measured on a Likert scale ranging from 1 (very dissatisfied) to 5 (very satisfied), divided by the highest possible score (20) to obtain a fraction.
Perf_17T The addition of 2017 satisfaction scores for sales, sales growth, profitability, and market share measured on a Likert scale ranging from 1 (very dissatisfied) to 5 (very satisfied), divided by the highest possible score (20) to obtain a fraction.
Boom_growT Using 2008 as a baseline and comparing it with 2013, did your business prospects? Decrease (1), stay the same, grow moderately, grow substantially (4), divided by the highest possible score (4) to obtain a fraction.
Bust_growT Using 2013 as a baseline and comparing it with today, have your business prospects? Decrease (1), stay the same, grow moderately, grow substantially (4), divided by the highest possible score (4) to obtain a fraction.
Future_growT Which of the following do you feel describes your growth objectives over the next 3 calendar years? Become smaller (1), stay the same, grow moderately, grow substantially (4), divided by the highest possible score (4) to obtain a fraction.
Survive A binary indicator if the firm plans on remaining in business two years into the future. It is a binary indicator 1 (yes), 0 (no) indicating a firm did not report a 4 or 5 score (Likert scale ranged from 1 – highly unlikely, to 5-highly likely) on any of 7 modes of exit.
Anticipation Active monitoring and adjustment of stance to avoid being caught off-guard by shifts in the business environment (more inwardly focused)
Multi-item EFA derived factor with a Cronbach’s alpha of .856, consisting of the following items:
We do not take our organisation’s successes for granted We maintain and encourage training that goes beyond what the job requires When we face new challenges we put together workable solutions from our existing
resources We openly debate the pros and cons of our current strategy and strive to
continuously improve upon it We regularly look for even small changes in our circumstances that may adversely
affect our business prospects Staff are rewarded for “thinking outside of the box” We simulate or imagine how we will respond to particularly problematic situations Our organisation quickly restores business performance after a disruption Our organisation adjusts and communicates its priorities as our circumstances change
Slack Spare staff and financial resources that can be utilised or reassigned towards ad hoc activities or new priorities, and backup and redundant systems and processes that are held in reserve to buffer against uncertainty
Multi-item EFA consisting with a Cronbach’s Alpha of .731, consisting of the following items:
We maintain spare equipment, facilities or production capacity that we can use in times of need
We carry a buffer of excess inventory just in case a disruption occurs Our business has a reasonable amount of resources in reserve Not all of available resources are locked up in current business activities We have ample discretionary financial resources
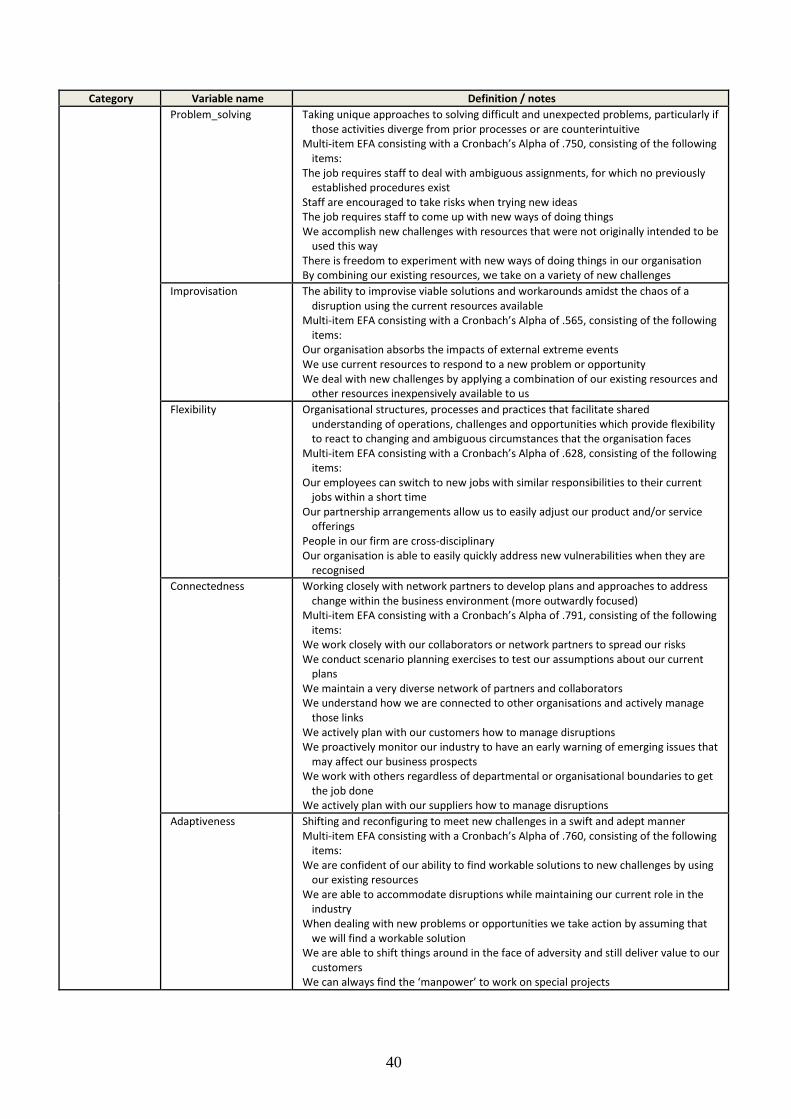
40
Category Variable name Definition / notes
Problem_solving Taking unique approaches to solving difficult and unexpected problems, particularly if those activities diverge from prior processes or are counterintuitive
Multi-item EFA consisting with a Cronbach’s Alpha of .750, consisting of the following items:
The job requires staff to deal with ambiguous assignments, for which no previously established procedures exist
Staff are encouraged to take risks when trying new ideas The job requires staff to come up with new ways of doing things We accomplish new challenges with resources that were not originally intended to be
used this way There is freedom to experiment with new ways of doing things in our organisation By combining our existing resources, we take on a variety of new challenges
Improvisation The ability to improvise viable solutions and workarounds amidst the chaos of a disruption using the current resources available
Multi-item EFA consisting with a Cronbach’s Alpha of .565, consisting of the following items:
Our organisation absorbs the impacts of external extreme events We use current resources to respond to a new problem or opportunity We deal with new challenges by applying a combination of our existing resources and
other resources inexpensively available to us
Flexibility Organisational structures, processes and practices that facilitate shared understanding of operations, challenges and opportunities which provide flexibility to react to changing and ambiguous circumstances that the organisation faces
Multi-item EFA consisting with a Cronbach’s Alpha of .628, consisting of the following items:
Our employees can switch to new jobs with similar responsibilities to their current jobs within a short time
Our partnership arrangements allow us to easily adjust our product and/or service offerings
People in our firm are cross-disciplinary Our organisation is able to easily quickly address new vulnerabilities when they are
recognised
Connectedness Working closely with network partners to develop plans and approaches to address change within the business environment (more outwardly focused)
Multi-item EFA consisting with a Cronbach’s Alpha of .791, consisting of the following items:
We work closely with our collaborators or network partners to spread our risks We conduct scenario planning exercises to test our assumptions about our current
plans We maintain a very diverse network of partners and collaborators We understand how we are connected to other organisations and actively manage
those links We actively plan with our customers how to manage disruptions We proactively monitor our industry to have an early warning of emerging issues that
may affect our business prospects We work with others regardless of departmental or organisational boundaries to get
the job done We actively plan with our suppliers how to manage disruptions
Adaptiveness Shifting and reconfiguring to meet new challenges in a swift and adept manner Multi-item EFA consisting with a Cronbach’s Alpha of .760, consisting of the following
items: We are confident of our ability to find workable solutions to new challenges by using
our existing resources We are able to accommodate disruptions while maintaining our current role in the
industry When dealing with new problems or opportunities we take action by assuming that
we will find a workable solution We are able to shift things around in the face of adversity and still deliver value to our
customers We can always find the ‘manpower’ to work on special projects

41
Category Variable name Definition / notes
Pro-activeness Forward looking investments and strategies that seek to gain competitive dominance Multi-item EFA consisting with a Cronbach’s Alpha of .877, consisting of the following
items: In dealing with competitors, our business is very often the first one to introduce new
products/services, administrative techniques, operating technologies, etc In dealing with competitors, my firm typically initiates actions, which competitors
then respond to In general, the top managers of my firm have a strong tendency to be ahead of others
in introducing novel ideas or products Our organisation has a history of turning threats into new opportunities We take on a broader range of challenges than our competitors that have similar
resources We invest in building new capabilities when we face unique business challenges Aspects of our business are reorganised to capture new opportunities that arise We develop responses to specific threats we face as an organisation We adapt quickly to accommodate changes in our environment or market Our business regularly recognises new business opportunities resulting from changes
in the market place
Anticipation_01 Above average indicator based on mean of 3.97
Slack_01 Above average indicator based on mean of 3.4013
Problem_solving_01 Above average indicator based on mean of 3.5240
Improvistaion_01 Above average indicator based on mean of 3.9624
Flexibility_01 Above average indicator based on mean of 3.6769
Connectedness_01 Above average indicator based on mean of 3.6633
Malleability_01 Above average indicator based on mean of 4.0160
Proactiveness_01 Above average indicator based on mean of 3.7473
Control Variables
LN_size Natural logarithm of firm size (employees)
LN_age Natural logarithm of firm age (years)
Industry The industry segment that the firm operates in A numeric value indicating one of 16 industry positions.
csg Firm is directly involved in coal seam gas project(s) Binary indicator, 1 (yes), 0 (no)
rural Rural firms excluding Brisbane or Toowoomba office locations Binary indicator, 1 (yes), 0 (no)
Skills Trouble acquiring necessary skills, technology and finance 4-item factor with a Cronbach’s Alpha of .698 obtained via exploratory factor analysis
of business constraints. Specifically, firms impact of various business performance barriers measured on a 5 point Likert scale ranging from 1 (insignificant limitation) to 5 (crucial limitation).
The individual scores for each of the following items were added and divided by 4 to arrive at the final variable:
Availability and cost of finance for expansion Skilled labour Management skills Difficulties in acquiring and implementing new technology
External External trouble, including competitors, customers, and regulators 2-item factor with a Cronbach’s Alpha of .728 obtained via exploratory factor analysis
of business constraints. Specifically, firms impact of various business performance barriers measured on a 5 point Likert scale ranging from 1 (insignificant limitation) to 5 (crucial limitation).
The individual scores for each of the following items were added and divided by 2 to arrive at the final variable:
Finding opportunities to place tenders on CSG projects Unsuccessful project tenders
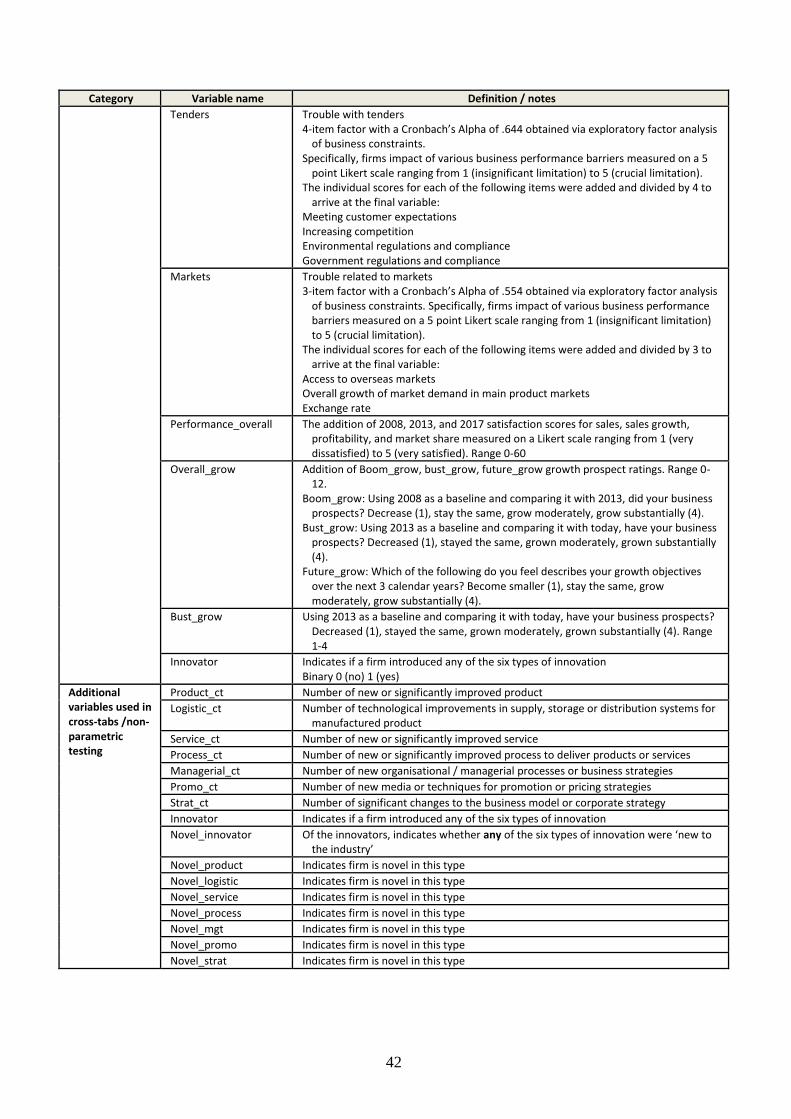
42
Category Variable name Definition / notes
Tenders Trouble with tenders 4-item factor with a Cronbach’s Alpha of .644 obtained via exploratory factor analysis
of business constraints. Specifically, firms impact of various business performance barriers measured on a 5
point Likert scale ranging from 1 (insignificant limitation) to 5 (crucial limitation). The individual scores for each of the following items were added and divided by 4 to
arrive at the final variable: Meeting customer expectations Increasing competition Environmental regulations and compliance Government regulations and compliance
Markets Trouble related to markets 3-item factor with a Cronbach’s Alpha of .554 obtained via exploratory factor analysis
of business constraints. Specifically, firms impact of various business performance barriers measured on a 5 point Likert scale ranging from 1 (insignificant limitation) to 5 (crucial limitation).
The individual scores for each of the following items were added and divided by 3 to arrive at the final variable:
Access to overseas markets Overall growth of market demand in main product markets Exchange rate
Performance_overall The addition of 2008, 2013, and 2017 satisfaction scores for sales, sales growth, profitability, and market share measured on a Likert scale ranging from 1 (very dissatisfied) to 5 (very satisfied). Range 0-60
Overall_grow Addition of Boom_grow, bust_grow, future_grow growth prospect ratings. Range 0-12.
Boom_grow: Using 2008 as a baseline and comparing it with 2013, did your business prospects? Decrease (1), stay the same, grow moderately, grow substantially (4).
Bust_grow: Using 2013 as a baseline and comparing it with today, have your business prospects? Decreased (1), stayed the same, grown moderately, grown substantially (4).
Future_grow: Which of the following do you feel describes your growth objectives over the next 3 calendar years? Become smaller (1), stay the same, grow moderately, grow substantially (4).
Bust_grow Using 2013 as a baseline and comparing it with today, have your business prospects? Decreased (1), stayed the same, grown moderately, grown substantially (4). Range 1-4
Innovator Indicates if a firm introduced any of the six types of innovation Binary 0 (no) 1 (yes)
Additional variables used in cross-tabs /non-parametric testing
Product_ct Number of new or significantly improved product
Logistic_ct Number of technological improvements in supply, storage or distribution systems for manufactured product
Service_ct Number of new or significantly improved service
Process_ct Number of new or significantly improved process to deliver products or services
Managerial_ct Number of new organisational / managerial processes or business strategies
Promo_ct Number of new media or techniques for promotion or pricing strategies
Strat_ct Number of significant changes to the business model or corporate strategy
Innovator Indicates if a firm introduced any of the six types of innovation
Novel_innovator Of the innovators, indicates whether any of the six types of innovation were ‘new to the industry’
Novel_product Indicates firm is novel in this type
Novel_logistic Indicates firm is novel in this type
Novel_service Indicates firm is novel in this type
Novel_process Indicates firm is novel in this type
Novel_mgt Indicates firm is novel in this type
Novel_promo Indicates firm is novel in this type
Novel_strat Indicates firm is novel in this type
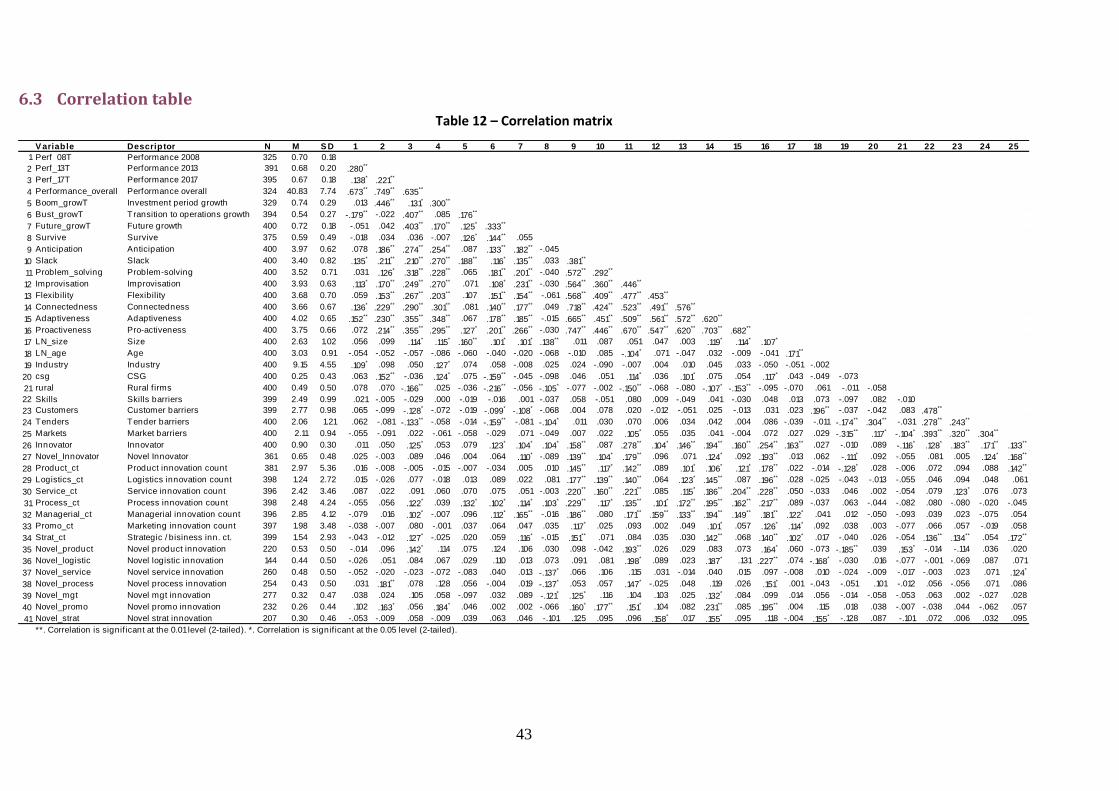
43
6.3 Correlation table Table 12 – Correlation matrix
V ariable Descriptor N M S D 1 2 3 4 5 6 7 8 9 10 11 12 13 14 15 16 17 18 19 20 21 22 23 24 25
1 Perf_08T Performance 2008 325 0.70 0.18
2 Perf_13T Performance 2013 391 0.68 0.20 .280**
3 Perf_17T Performance 2017 395 0.67 0.18 .138* .221**
4 Performance_overall Performance overall 324 40.83 7.74 .673** .749** .635**
5 Boom_growT Investment period growth 329 0.74 0.29 .013 .446** .131* .300**
6 Bust_growT Transition to operations growth 394 0.54 0.27 -.179** -.022 .407** .085 .176**
7 Future_growT Future growth 400 0.72 0.18 -.051 .042 .403** .170** .125* .333**
8 Survive Survive 375 0.59 0.49 -.018 .034 .036 -.007 .126* .144** .055
9 Anticipation Anticipation 400 3.97 0.62 .078 .186** .274** .254** .087 .133** .182** -.045
10 Slack Slack 400 3.40 0.82 .135* .211** .210** .270** .188** .116* .135** .033 .381**
11 Problem_solving Problem-solving 400 3.52 0.71 .031 .126* .318** .228** .065 .181** .201** -.040 .572** .292**
12 Improvisation Improvisation 400 3.93 0.63 .113* .170** .249** .270** .071 .108* .231** -.030 .564** .360** .446**
13 Flexibility Flexibility 400 3.68 0.70 .059 .153** .267** .203** .107 .151** .154** -.061 .568** .409** .477** .453**
14 Connectedness Connectedness 400 3.66 0.67 .136* .229** .290** .301** .081 .140** .177** .049 .718** .424** .523** .491** .576**
15 Adaptiveness Adaptiveness 400 4.02 0.65 .152** .230** .355** .348** .067 .178** .185** -.015 .665** .451** .509** .561** .572** .620**
16 Proactiveness Pro-activeness 400 3.75 0.66 .072 .214** .355** .295** .127* .201** .266** -.030 .747** .446** .670** .547** .620** .703** .682**
17 LN_size Size 400 2.63 1.02 .056 .099 .114* .115* .160** .101* .101* .138** .011 .087 .051 .047 .003 .119* .114* .107*
18 LN_age Age 400 3.03 0.91 -.054 -.052 -.057 -.086 -.060 -.040 -.020 -.068 -.010 .085 -.104* .071 -.047 .032 -.009 -.041 .171**
19 Industry Industry 400 9.15 4.55 .109* .098 .050 .127* .074 .058 -.008 .025 .024 -.090 -.007 .004 .010 .045 .033 -.050 -.051 -.002
20 csg CSG 400 0.25 0.43 .063 .152** -.036 .124* .075 -.159** -.045 -.098 .046 .051 .114* .036 .101* .075 .054 .117* .043 -.049 -.073
21 rural Rural f irms 400 0.49 0.50 .078 .070 -.166** .025 -.036 -.216** -.056 -.105* -.077 -.002 -.150** -.068 -.080 -.107* -.153** -.095 -.070 .061 -.011 -.058
22 Skills Skills barriers 399 2.49 0.99 .021 -.005 -.029 .000 -.019 -.016 .001 -.037 .058 -.051 .080 .009 -.049 .041 -.030 .048 .013 .073 -.097 .082 -.010
23 Customers Customer barriers 399 2.77 0.98 .065 -.099 -.128* -.072 -.019 -.099* -.108* -.068 .004 .078 .020 -.012 -.051 .025 -.013 .031 .023 .196** -.037 -.042 .083 .478**
24 Tenders Tender barriers 400 2.06 1.21 .062 -.081 -.133** -.058 -.014 -.159** -.081 -.104* .011 .030 .070 .006 .034 .042 .004 .086 -.039 -.011 -.174** .304** -.031 .278** .243**
25 Markets Market barriers 400 2.11 0.94 -.055 -.091 .022 -.061 -.058 -.029 .071 -.049 .007 .022 .105* .055 .035 .041 -.004 .072 .027 .029 -.315** .117* -.104* .393** .320** .304**
26 Innovator Innovator 400 0.90 0.30 .011 .050 .125* .053 .079 .123* .104* .104* .158** .087 .278** .104* .146** .194** .160** .254** .163** .027 -.010 .089 -.116* .128* .183** .171** .133**
27 Novel_Innovator Novel Innovator 361 0.65 0.48 .025 -.003 .089 .046 .004 .064 .110* -.089 .139** .104* .179** .096 .071 .124* .092 .193** .013 .062 -.111* .092 -.055 .081 .005 .124* .168**
28 Product_ct Product innovation count 381 2.97 5.36 .016 -.008 -.005 -.015 -.007 -.034 .005 .010 .145** .117* .142** .089 .101* .106* .121* .178** .022 -.014 -.128* .028 -.006 .072 .094 .088 .142**
29 Logistics_ct Logistics innovation count 398 1.24 2.72 .015 -.026 .077 -.018 .013 .089 .022 .081 .177** .139** .140** .064 .123* .145** .087 .196** .028 -.025 -.043 -.013 -.055 .046 .094 .048 .061
30 Service_ct Service innovation count 396 2.42 3.46 .087 .022 .091 .060 .070 .075 .051 -.003 .220** .160** .221** .085 .115* .186** .204** .228** .050 -.033 .046 .002 -.054 .079 .123* .076 .073
31 Process_ct Process innovation count 398 2.48 4.24 -.055 .056 .122* .039 .132* .102* .114* .103* .229** .117* .135** .101* .172** .195** .162** .217** .089 -.037 .063 -.044 -.082 .080 -.080 -.020 -.045
32 Managerial_ct Managerial innovation count 396 2.85 4.12 -.079 .016 .102* -.007 .096 .112* .165** -.016 .186** .080 .171** .159** .133** .194** .149** .181** .122* .041 .012 -.050 -.093 .039 .023 -.075 .054
33 Promo_ct Marketing innovation count 397 1.98 3.48 -.038 -.007 .080 -.001 .037 .064 .047 .035 .117* .025 .093 .002 .049 .101* .057 .126* .114* .092 .038 .003 -.077 .066 .057 -.019 .058
34 Strat_ct Strategic / bisiness inn. ct. 399 1.54 2.93 -.043 -.012 .127* -.025 .020 .059 .116* -.015 .151** .071 .084 .035 .030 .142** .068 .140** .102* .017 -.040 .026 -.054 .136** .134** .054 .172**
35 Novel_product Novel product innovation 220 0.53 0.50 -.014 .096 .142* .114 .075 .124 .106 .030 .098 -.042 .193** .026 .029 .083 .073 .164* .060 -.073 -.185** .039 .153* -.014 -.114 .036 .020
36 Novel_logistic Novel logistic innovation 144 0.44 0.50 -.026 .051 .084 .067 .029 .110 .013 .073 .091 .081 .198* .089 .023 .187* .131 .227** .074 -.168* -.030 .016 -.077 -.001 -.069 .087 .071
37 Novel_service Novel service innovation 260 0.48 0.50 -.052 -.020 -.023 -.072 -.083 .040 .013 -.137* .066 .106 .115 .031 -.014 .040 .015 .097 -.008 .010 -.024 -.009 -.017 -.003 .023 .071 .124*
38 Novel_process Novel process innovation 254 0.43 0.50 .031 .181** .078 .128 .056 -.004 .019 -.137* .053 .057 .147* -.025 .048 .119 .026 .151* .001 -.043 -.051 .101 -.012 .056 -.056 .071 .086
39 Novel_mgt Novel mgt innovation 277 0.32 0.47 .038 .024 .105 .058 -.097 .032 .089 -.121* .125* .116 .104 .103 .025 .132* .084 .099 .014 .056 -.014 -.058 -.053 .063 .002 -.027 .028
40 Novel_promo Novel promo innovation 232 0.26 0.44 .102 .163* .056 .184* .046 .002 .002 -.066 .160* .177** .151* .104 .082 .231** .085 .195** .004 .115 .018 .038 -.007 -.038 .044 -.062 .057
41 Novel_strat Novel strat innovation 207 0.30 0.46 -.053 -.009 .058 -.009 .039 .063 .046 -.101 .125 .095 .096 .158* .017 .155* .095 .118 -.004 .155* -.128 .087 -.101 .072 .006 .032 .095
**. Correlation is signif icant at the 0.01 level (2-tailed). *. Correlation is signif icant at the 0.05 level (2-tailed).

44
6.4 Regression models Table 13 – Investment period regression models
(1) (2) (3) (4) Investment period Perf_13T Perf_13T Boom_growT Boom_growT
Anticipation -0.057 -0.053 -0.093 -0.064 Slack 0.117 0.166* 0.396** 0.565** Problem_solving -0.062 -0.076 -0.095 -0.058 Improvisation 0.049 0.093 0.035 0.101 Flexibility -0.067 -0.118 0.006 -0.110 Connectedness 0.163 0.128 -0.048 -0.185 Adaptiveness 0.154 0.163 -0.195 -0.386* Pro-activeness 0.124 0.133 0.475+ 0.526 LN_size 0.066 0.317** LN_age -0.048 -0.248* Industry 0.026* 0.068* CSG 0.437** 0.328 rural 0.238* -0.143 Skills 0.081 -0.009 External -0.118 -0.029 Tenders -0.108* -0.096 Markets -0.049 -0.091 Innovator 0.068 0.013 Constant -0.812** -0.954* -0.563 -0.220
N 391 390 329 329 pseudo R2 .054 .119 .042 .096 AIC 688.138 704.391 613.870 630.901 BIC 723.857 779.748 648.034 703.026 ll -335.069 -333.195 -297.935 -296.450
* p < 0.05, ** p < 0.01
Model statistics are single equation logistic statistics
Seemingly unrelated fractional logistics regression models

45
Table 14 – Transition to operations regression models
(1) (2) (3) (4) Transition to operations
Bust_growT Bust_growT TurnoverT TurnoverT
Anticipation -0.121 -0.209 -0.550** -0.288** Slack 0.025 0.088 0.099 0.067 Problem_solving 0.116 0.063 -0.136 -0.118 Improvisation -0.057 -0.042 -0.049 -0.046 Flexibility 0.069 0.126 -0.145 -0.073 Connectedness -0.032 -0.090 0.432** 0.296** Adaptiveness 0.147 0.043 0.026 -0.051 Pro-activeness 0.238 0.348* 0.321* 0.150 LN_size 0.070 0.494** LN_age -0.031 0.107* Industry 0.010 -0.035** CSG -0.508** -0.012 rural -0.436** -0.040 Skills 0.099 -0.086 External -0.130* -0.017 Tenders -0.128** 0.053 Markets 0.012 0.154** Innovator 0.278 0.043 Constant -1.257** -0.723 0.199 -1.134**
N 394 393 368 368 pseudo R2 .030 .097 .093 .422 AIC 633.805 646.189 570.587 577.607 BIC 669.592 721.691 605.760 651.861 Ll -307.902 -304.094 -276.293 -269.804
* p < 0.05, ** p < 0.01
Model statistics are single equation logistic statistics
Seemingly unrelated fractional logistics regression models

46
Table 15 – Future performance regression models
(1) (2) (3) (4) (5) (6) Future performance Perf_17T Perf_17T Future_g
rowT Future_gr
owT Survive Survive
Anticipation -0.154 -0.154 -0.130 -0.136 -0.413 -0.256 Slack 0.018 0.053 0.022 0.049 0.169 0.610** Problem_solving 0.134 0.090 0.052 0.039 -0.074 -0.324 Improvisation 0.014 0.013 0.162 0.182 -0.048 -0.009 Flexibility 0.007 0.005 -0.028 -0.039 -0.308 -0.258 Connectedness 0.052 0.018 -0.010 -0.029 0.583* 0.506 Adaptiveness 0.252* 0.205* -0.006 -0.014 0.001 -0.509 Pro-activeness 0.174 0.235* 0.322** 0.313* -0.060 -0.092 LN_size 0.037 0.046 0.190 LN_age -0.007 -0.016 -0.222 Industry 0.010 0.007 -0.008 CSG -0.116 -0.159 -0.198 rural -0.149 -0.020 -0.329 Skills 0.028 0.042 0.036 External -0.140* -0.148** -0.228 Tenders -0.096** -0.070 -0.048 Markets 0.078 0.128* -0.106 Innovator 0.165 0.108 0.446 Performance_overall -- -- -0.006 Bust_grow -- -- 0.215 Constant -1.154** -0.880** -0.451 -0.367 1.153 2.769
N 395 394 400 398 396 319 pseudo R2 .145 .169 .067 .084 0.019 0.083 AIC 685.540 702.408 720.203 736.337 540.522 438.137 BIC 721.350 777.959 756.126 812.079 576.354 517.206 ll -333.770 -332.204 -351.102 -349.168 -261.261 -198.068
* p < 0.05, ** p < 0.01
Model statistics are single equation logistic statistics
Seemingly unrelated fractional logistics regression models
The survival model is a logistic model, and is included in the seemingly unrelated estimation with the fractional logistic
models.