Embed Size (px)
Citation preview
Measuring Economic Openness: A review of existing measures and empirical
practices
Claudius Gräbner, Philipp Heimberger, Jakob Kapeller and Florian Springholz
ICAE Working Paper Series - No. 84 - August 2018
Institute for Comprehensive Analysis of the Economy Johannes Kepler University Linz
Altenbergerstraße 69, 4040 [email protected]
www.jku.at/icae

1
Understanding economic openness: A review of existing measures*
Claudius Gräbnerab§, Philipp Heimbergerac, Jakob Kapellerab and Florian Springholza
Abstract This paper surveys measures of economic openness, the latter being understood as the degree to
which non-domestic actors can or do participate in a domestic economy. We introduce a
typology of openness indicators, which distinguishes between ‘real’ and ‘financial’ openness as
well as ‘de facto’ and ‘de jure’ measures of openness, and supply an openly available,
comprehensive data set of openness indicators. We use these data to analyze trends in openness
over time and conduct a correlation analysis across indicators. Finally, we illustrate the practical
implications of choosing among different openness measures within a growth regression
framework.
Keywords: Economic openness, Trade openness, financial openness, globalization.
JEL codes: F00, F40, F60.
* Supported by funds of the Oesterreichische Nationalbank (Austrian Central Bank, Anniversary Fund, project number: 17383). a Institute for the Comprehensive Analysis of the Economy (ICAE), Johannes Kepler University Linz, Austria. § Address for correspondence: [email protected] b Institute for Socio Economics, University of Duisburg-Essen, Germany. c Vienna Institute for International Economic Studies (wiiw), Vienna, Austria.

2
1. Introduction
The impact of economic openness on domestic economies has been a prime area of
interest within both the scientific community as well as the wider public. The relevant debates,
however, use a great diversity of concepts to describe the extent of international economic
integration: terms like ‘trade openness’, ‘economic integration’, ‘trade liberalization’ and
‘globalization’ are widely used when the general increase in economic openness during the last
decades is addressed. The same observation holds true for the financial dimension, where terms
like ‘financial openness’, ‘financial integration’ and ‘financial globalization’ are used regularly and
often interchangeably (e.g., Kose et al. 2009; De Nicolo and Juvenal 2014; Saadma and Steiner
2016). In analogy to this variety of terms and concepts, a large variety of measures of economic
openness have been developed, which typically emphasize different aspects of economic
integration. Thus, not only the definition, but also the measurement of openness has varied
considerably over the past three decades (Squalli and Wilson 2011).
A lack of consensus on how to best measure economic openness has been widely
acknowledged (e.g. Yanikkaya 2003; Busse and Koeniger 2012; Huchet-Bourdon et al. 2014);
Egger et al. 2019). At the same time, many econometric studies discount the underlying debate
on the measurement of economic openness by simply employing the most popular measures
without providing in-depth explanations or justifications for doing so. Against this backdrop, this
paper contributes to the literature by providing a systematic collection, categorization and
evaluation of the most prominent openness indicators used in the recent literature. Hence, the
main purpose of our work is threefold: first, we provide applied researchers with the relevant
information to make an informed choice on the use of different openness indicators, which
eventually depends on the specific questions and methods employed in their empirical work.
Second, we want to highlight the practical implications of choosing some openness indicator by
showing how empirical outcomes change when different openness indicators are used. Third, we
supply a novel and comprehensive data set on openness indicators to be used in further
research.4
In this context we will operate under two restrictions: first, we consider only measures
that are available for at least 20 years. Second, we restrict ourselves to direct measures of
economic openness. As a consequence, we exclude instrumental variables that are sometimes
developed to substitute openness indicators whenever one expects endogeneity problems (e.g. 4 The data, as well as the code to reproduce the estimation results and figures will be available online after peer-reviewed publication.
3
Frankel and Romer 2000, who use predictions from a gravity equation, or Felbermayr and
Gröschl 2013, who use the effects of natural disasters) as well as indicators based on extensive
models of domestic economies (such as Waugh and Ravikumar 2016). While these approaches
deserve their own assessment, we confine ourselves to direct measures of economic openness for
two main reasons: first, finding a suitable instrument or model capturing trade openness is
heavily context-dependent and requires of additional theoretical assumptions (e.g. exclusion
restrictions). Thus, a general assessment of such instruments seems difficult to undertake. Second,
the direct openness measures discussed below currently dominate much of the applied literature
(e.g. Dreher et al. 2010; Martens et al. 2015; Potrafke 2015), which is why we are convinced they
deserve a proper treatment on their own.
The paper proceeds as follows: the next section introduces a typology for openness
indicators by discussing the distinction between ‘trade’ and ‘financial’ openness, which have a ‘de
facto’ and ‘de jure’ dimension, respectively. We classify the most commonly used openness
measures according to this typology. Section 3 provides descriptive trends of the most relevant
openness indicators, while section 4 analyzes the mutual relationship of these indicators by
inspecting the correlations of different openness measures. Section 5 highlights the practical
implications of choosing among different measures within a growth regression framework.
Section 6 summarizes and concludes the paper.
2. Measures of economic openness
Existing measures of economic openness, generally understood as the degree to which
non-domestic actors can or do participate in a domestic economy, can be grouped in two ways:
first, according to the type of openness – ‘real’ or ‘financial’ – they aim to measure, and, second,
according to the sources utilized in composing the openness measure. These sources are either
aggregate economic statistics (de-facto measures) or assessments of the institutional foundations
of economic openness, i.e. the legally established barriers to trade and financial transactions (de-
jure measures).
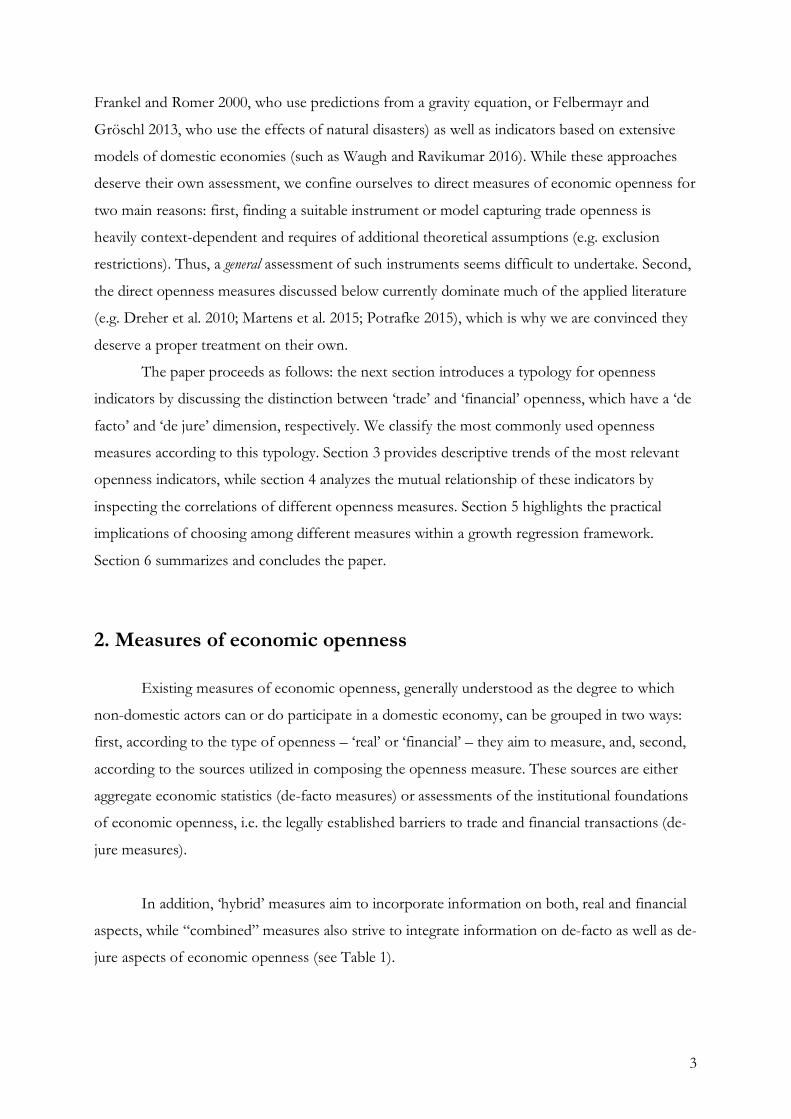
In addition, ‘hybrid’ measures aim to incorporate information on both, real and financial
aspects, while “combined” measures also strive to integrate information on de-facto as well as de-
jure aspects of economic openness (see Table 1).
4
Evaluation of openness with regard to real flows
(goods and services) Evaluation of openness with
regard to financial flows Combined
measures
Evaluation of outcomes:
De-facto measures of economic
openness
De facto measures of trade openness, for example: total
imports or total exports (relative to GDP)
De facto measures of financial openness, for example: FDI
inward/outward or foreign financial assets/liabilities
Mea
sure
s int
egra
ting
real
and
finan
cial
asp
ects
Hybrid measures for de-facto openness
Evaluation of legal framework:
De-jure measures of economic openness
De jure measures of trade openness, for example: tariff rates or non-tariff trade barriers
De jure measures of financial openness, for example: FDI
restrictions or capital account restrictions
Hybrid measures for de-jure openness
Table 1: Types of openness indicators.
De-facto measures are outcome-oriented indicators, reflecting a country’s actual degree of
integration into the world economy. De-jure measures, on the other hand, are based upon an
evaluation of a country’s legal framework: they reflect a country’s willingness to be open as
expressed by the prevailing regulatory environment. Typically, de-jure measures on trade are
based on tariff rates (such as duties and surcharges), information on non-tariff trade barriers
(such as licensing rules and quotas) or tax revenues emerging from trade activities relative to
GDP. Financial de-jure measures indicate the extent to which a country imposes legal restrictions
on its cross-border capital transactions. As de-jure indicators evaluate a country’s regulatory
environment, it is important to keep in mind that this environment is influenced not only by
national policies; they are also shaped by the impact of supranational institutions like the
European Union or the World Trade Organization.
The above construction and interpretation of the two main types of indicators, de-facto
and de-jure, reveals that these types do indeed measure different facets of openness, which need
not be consistent for a given country. For instance, a country could have a defensive legal stance
in terms of openness, but still play an important role in the world trading system e.g. due to its
special position as a trade hub (e.g. China) or as a financial hub (e.g. Malta). At the same time, a
country may be open to trade in terms of institutions and policy, but nonetheless lag behind in
terms of its relative integration in international trade due its geographic remoteness (e.g. Canada)
or technological inferiority (e.g. Uganda).5
5 One might be tempted to correct for such specific characteristics within the openness measure itself, but the problem with such practice would be that it sorts out one particular determinant of trade intensity in a potentially ad hoc manner. For example, since remoteness obviously impacts trade flows, a de facto measure for openness should, ceteris paribus, be lower for more remote

5
Hence, implications drawn from de-jure indicators can differ strongly from those derived
from de-facto indicators: while the former are mostly based on a single, yet prominent, factor in
shaping actual economic integration – a country’s regulatory environment – de-facto indicators
are focused on overall outcomes. Thus, they capture the total impact of a series of different
factors, such as the level of technology, geographical location, the existence of natural resources,
legal regulations and tax policies, political and historical relationships, multi- and bilateral
agreements or the quality of institutions. Therefore, de-facto measures can be seen as a way to
capture the overall impact of all relevant factors without any ambition to delineate their relative
contribution to the chosen outcome dimension. It is for these reasons, that any “combined
measure” (Table 1) has to be received with great care as it lumps together two qualitatively
different approaches towards economic openness and can, hence, lead to ambiguous results with
unclear interpretations (Martens et al. 2015).
2.1 Trade openness measures
De-facto openness to trade in goods and services is a prime subject of interest in
discussions on economic openness. The core measure in these discussions is Trade volume relative to
GDP (Fuji 2019). As Table 1 shows, alternative de facto openness measures are mostly based on
sub-components and variations of the Trade/GDP approach.
Table 2: De facto trade openness measures.
countries. There might be cases in which measures correcting for remoteness are useful, but they need to be carefully justified against the specific background of a given application and are, thus, not considered further in this general review.
Name Components Scale Type Time Countries Source Export share Exports (X) % of
nominal GDP
Co-Ra 1960-2016 200 World Bank, 2017
(publicly available) Import share Imports (M) Co-Ra
Trade share Trade Volume = Exports (X) + Imports (M) Co-Ra
Generalized Trade Openness
Index
The Index represents the trade volume as a share of a
country's GDP factor, defined by a CES-function of its own GDP and the GDP of the rest
of the world
0-100 Co-Int 1970-2014 145 Tang, 2011
(own calculations)
Composite Trade Share
Trade Volume (X+M) in % GDP, adjusted by the World
Trade Share (WTS) arbitrary Co-Int 1977-
2016 187 Squalli & Wilson,
2011 (own calculations)
Real trade share Trade Volume (X+M) in % of GDP at PPP
% of real GDP Co-Ra 1960-
2015 173 Alcala & Ciccone,
2004 (own calculations)
Adjusted trade share
Imports divided by GDP, adjusted for the nation’s share
in world production arbitrary Co-Ra 1960-
2016 187 Li et al. 2004, (own calculations)
Notes: In the type column “Co” corresponds to “continuous”, “Di” corresponds to “discrete”, “Bi” corresponds to “binary”, “Int” corresponds to “interval”, and “Ra” corresponds to “Ratio”.
6
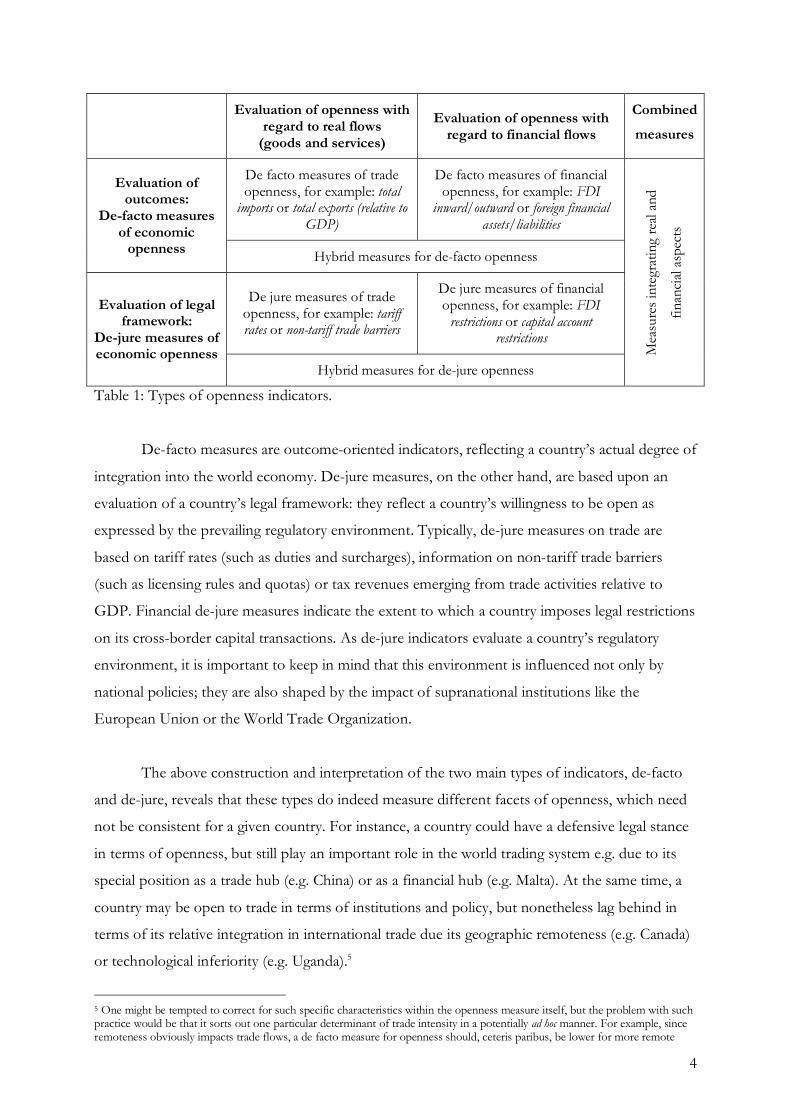
The popularity of Trade to GDP probably stems from its availability and its seemingly
close alignment to the question at stake. There are also a number of variants, such as
exports/GDP or imports/GDP, which can be worthwhile substitutes if one wants to focus on
openness understood in either a more ‘outward’ (Exports) or a more ‘inward’ sense (Imports), or
restrictions of what enters the numerator, such as variants considering solely trade in goods or
excluding exports in primary sectors.
However, despite its popularity Trade/GDP and its variants have to be used with caution
for a series of reasons, most of them relating to the normalization by GDP.
First, by taking GDP as a reference point, Trade/GDP incorporates a specific size bias as
small economies typically show higher trade volumes relative to GDP than large economies – a
fact well-known from the estimation of gravity equations (e.g. Feenstra 2015). As a consequence
strong domestic economies, which also happen to be major players in international trade (like the
U.S., Japan, Germany or China), find themselves at the lower end of any country-ranking
composed out of Trade/GDP.
Second, it is not entirely clear what Trade/GDP is actually measuring. Various
alternatives to the label ‘trade openness’, such as trade dependency ratio, trade openness index, trade share
or trade ratio, have been suggested. More recently, Fuji (2019) has discussed this question in
greater detail. By comparing values for Trade/GDP for international and intra-Japanese trade
data on the prefecture-level, he finds that Trade/GDP measures most of all the extent of spatial
economic remoteness and the idiosyncrasy in sectoral production distributions. He also finds that
on the international level, much of the variation of the measure goes back to variation in GDP,
rather than the trade flows. And indeed, because of the normalization by GDP the Trade/GDP
measure also captures cyclical swings of economies.6 For instance, the financial crisis in 2008/09
made several countries look ‘more open’ in terms of Trade/GDP, simply because of the
disproportionate effect of the crisis on GDP
Finally, the inclusion of Trade/GDP in regression approaches has also been the target of
endogeneity concerns (e.g. Frankel & Romer 2000). Hence, empirical researchers are well-advised
to think critically about possible endogeneity problems, especially when coupling Trade/GDP
with other GDP-related variables in applied work.
At least the size bias of Trade/GDP has been addressed by various authors, leading a
couple of alternative indicators (see Table 1). Additional strategies for addressing this size-bias
include the incorporation of an inversed Herfindahl-Index of the relative shares of all trading
6 A common reaction in the literature to address the problem of business cycles has been the use of 5-year averages, a practice that comes with a number of other problems as discussed in Herzer and Vollmer (2012).
7
partners (to account for the diversity of exchange relations; e.g. OECD 2010) or regression-based
strategies where Trade/GDP is first regressed on a series of demographical and geographical
variables and only the residuals of these regressions are interpreted as a for of ‘net openness’
conditional on some country characteristics (Lockwood 2004, Vujakovic 2010). Whether such a
corrective measures are appropriate eventually depends on one’s research question and empirical
setup. Alternatively, the size-bias of Trade/GDP can be addressed by substituting the
Trade/GDP variable with one of the alternatives listed above or by adding additional regressors
aiming to control for country size. But it is also evident that every alternative normalization
strategy comes with its own problems, which is why the ‘best’ de-facto measure of trade
openness depends on the particular question at hand.
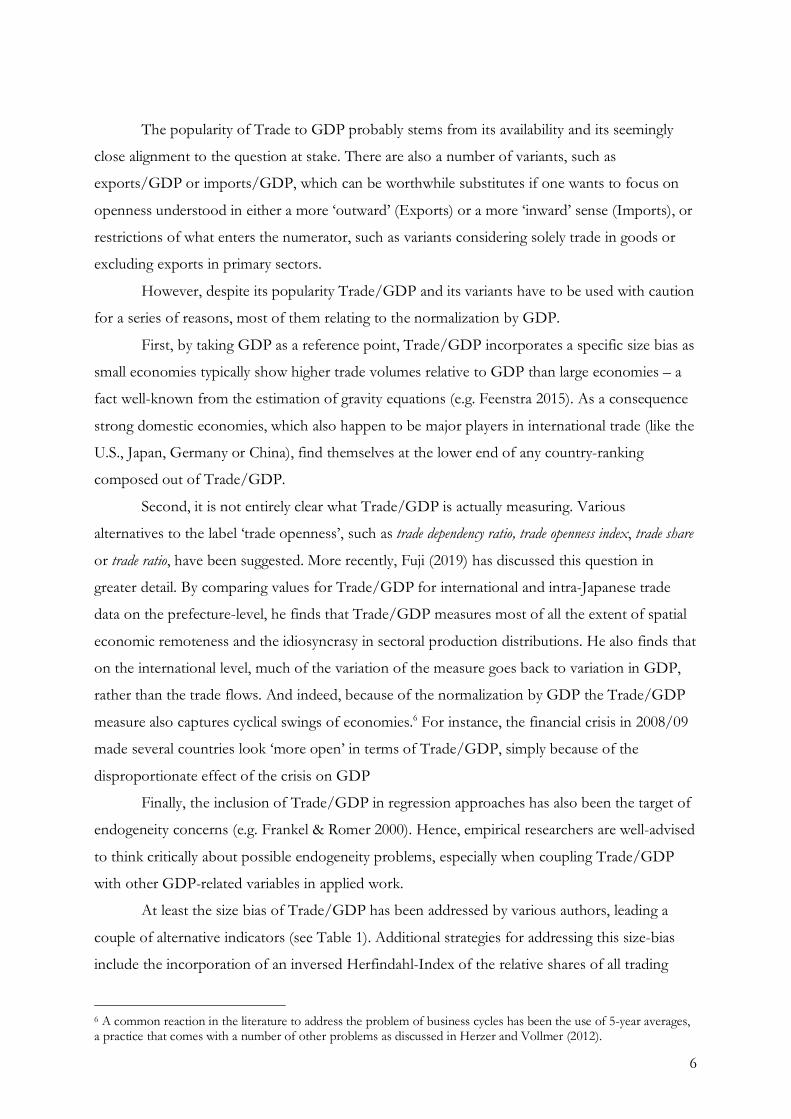
Name Components Scale Type Time Countries Source
Sachs-Warner index
Binary variable based on Sachs & Warner (1995) criterion (see
text for more details) 0-1 Di-Bi 1960-2010 118
Sachs and Warner, 1995
Extended by Wacziarg & Welch, 2008,
and Dollar et. al., 2016 (publicly available)
IMF Tariff Rates
(Tariff_RES)
100 – Average of the effective rate (=tariff revenue/import
value) and the average unweighted tariff rates
0-100 Co-Int 1980-2004 44 Jaumotte et. al., 2013, based on IMF database
(publicly available)
Trade Freedom
(HF_trade)
Trade-weighted average tariff rate – Nontariff trade barriers
(NTBs) 0-100 Di-Int 1995-2017 186
Miller et. al., 2018: Index of Economic Freedom. Heritage
Foundation (publicly available)
Freedom to Trade
Internationally (FTI_Index)
1. Tariffs: - Revenue from trade taxes
(% of trade sector) - Mean tariff rate - Standard deviation of
tariff rates 2. Regulatory trade barriers: - Non-tariff trade barriers - Compliance costs of
importing and exporting
0-10 Co-Int
5-year measure:
1970-2000
Yearly data:
2000-2015
159
Gwartney et. al, 2017: Economic Freedom of
the World: 2017 Annual Report. Fraser
Institute. (publicly available)
Additional variable with improved coverage
WITS Tariff Rates
(Tariff_WITS)
100 – Mean of Effectively Applied (AHS) and Most-Favored Nation (MFN) weighted average tariff rates
0-100 Co-Int 1988-2016 168
Based on tariff data of WITS databank
(own calculations)
Notes: In the type column “Co” corresponds to “continuous”, “Di” corresponds to “discrete”, “Bi” corresponds to “binary”, “Int” corresponds to “interval”, and “Ra” corresponds to “Ratio”.
Table 3: De jure trade openness measures.
In contrast to the outcome-orientation of de-facto measures, the focus of de-jure
measures typically lies on tariff rates and other institutional forms of trade-barriers (see Table 3).
Unfortunately, there is a lack of de-jure indices that are both methodologically sound and widely
available.
8
One of the earliest and most influential de-jure measures for trade openness is the index
by Sachs & Warner (1995). It is a binary index that classifies a country as closed if it meets at least
one out of five criteria relating to tariff rates, non-tariff trade barriers, socialist governance in
trade relations and the difference between black market exchange rates and official exchange
rates. When used in growth regressions, the index mostly suggests a positive relationship between
openness and trade (e.g. Harrison 1996; Wacziarg & Welch 2008; Dollar et al. 2016), yet it has
been strongly criticized for its ambiguous criterions and its dichotomous output dimension,
which classifies countries as either ‘open’ or ‘closed’ and, hence, does not allow for a more
nuanced analysis (Rodriguez & Rodrik 2001).
An alternative to the Sachs-Warner-index is the tariff-based measure as used in an
influential paper by Jaumotte et al. (2013), who employ a continuous index based on (1) the ratio
of tariff revenue to import value and (2) average unweighted tariff rates. Thus, it seeks to directly
measure the changes in the regulatory framework of countries, which is preferable to the rather
crude binary index of Sachs and Warner. Unfortunately, the coverage of the dataset provided by
Jaumotte et al. (2013) is limited and the authors base their index on internal data of the IMF
implying that replicating or expanding their dataset is a non-trivial exercise.
Two further alternatives are provided by two partisan think-tanks: the Trade Freedom Index,
based on the Economic Freedom Index of the Heritage Foundation, covers 186 countries from 1995
until 2017, and the Freedom to Trade Internationally Index, which is based on the Economic Freedom of
the World Index of the Fraser Institute. The latter covers the period between 1970-2000 in 5-year
intervals and contains yearly data over the period 2000-2014 for 159 countries. Both approaches
are composite indices that merge several tariff and non-tariff related variables into a final measure
(for details see Table 4). Due to the partisan orientation of these two institutions – which
promote a free-market agenda for normative reasons – and the opacity of data sources and
aggregation methods, neither of the indicators makes a strong case for being considered in
serious research on the role of economic openness.

9
Trade Freedom index
Trade Freedom = "## ⋅Tariff%&' − Tariff'
Tariff%&' −Tariff%)*−+,-
Variable Description Source and further details
TariffX Weighted average tariff rate in country X
Miller et al. (2018) Tariffmax, Tariffmin Upper and lower bounds for tariff rates;
NTB Minimum tariff is zero, the upper bound is set to 50 percent. Depending on the use of NTBs a
penalty is subtracted from the base score.
Freedom to Trade Internationally Index
.,/ ="
01 2)
0
*3"
Tariff dimension
Variable Description Source
2" Revenue from trade taxes
Fraser Institute (2018)
24 Mean tariff rate 25 Standard deviation of tariff rates
Regulatory trade barriers (included since 1995) 26 Non-tariff trade barriers 20 Compliance costs of importing and exporting
Table 4. Components of the Trade Freedom and the Freedom to Trade Internationally Index.
Given this unsatisfactory state of affairs we developed an additional alternative indicator
that closely follows the methodological approach of the tariff-based measures of Jaumotte et al.
(2013), but is based on the publicly available World Integrated Trade Solution (WITS) databank
of the World Bank. Thus, it is easy to replicate and available for 168 countries in the period
between 1988-2016. We calculate the index as 100 minus the average of (1) the effectively applied
tariff rates and (2) the weighted average of the most-favored nation tariff rates. The resulting
index is strongly correlated with the measure of Jaumotte (with a Pearson coefficient of 0.78 for
the joint data points) and, thus, preserves the methodological advantages of the original indicator,
while at the same time remedying its drawbacks in terms of coverage and replicability.
2.2. Financial openness measures
The most popular de-facto measure of financial openness comes from the dataset
compiled and continuously updated by Philip Lane and Gian Maria Milesi-Ferretti (2003, 2007,
2017). It is now typically referred to as the “financial openness index” and defined as the volume of a
country’s foreign assets and liabilities relative to GDP (Baltagi et al. 2009). The Lane and Milesi-

10
Ferretti (henceforth LMF) database is publicly available7 and currently contains data for 211
countries for the period 1970-2015. The LMF database is considered the most comprehensive
source of information in terms of financial capital stocks. In addition to the financial openness
index, this dataset also contains three more specific indicators focusing on FDI and equity
markets that are widely applied in empirical analyses. A comparable set of indicators on FDI can
also be obtained from UNCTAD8 (see Table 5). It is worth mentioning that most of these
indicators also make use of a normalization by GDP and are, therefore, subject to the same
criticisms as the de-facto trade openness measures discussed in section 2.1 (see also Gygli et al.
2019).
Name Components Scale Type Time Countries Source
Financial Openness Index
(LMF_OPEN)
LMF_OPEN represents the sum of Total Foreign Assests and Total Foreign
Liabilities in % GDP
% of GDP Co-Ra 1970-
2015 211 “LMF”: Lane & Milesi-Ferretti,
2017 (publicly available)
Equity-based Financial
Integration (LMF_EQ)
LMF_EQ represents the sum of Portfolio Equity Assets and Liabilities
(stocks)
% of GDP Co-Ra 1970-
2015 211
Private Financial Openness Index
(OPEN_pv)
OPEN_pv makes a distinction between private and official financial openness by subtracting official development aid from
foreign liabilities and international reserves from foreign assets.
% of GDP Co-Ra 1970-
2014 190 Saadma & Steiner, 2016
FDI liabilities (LMF)
(LMF_in_GDP, LMF_FDI_in)
The inward FDI stock represents the value of foreign investors' equity in and net loans to enterprises resident in the
reporting economy.
% of GDP Co-Ra 1970-
2015 202
Lane & Miles-Ferretti, 2017
(publicly available) USD Co-Int
FDI liabilities (UNCTAD)
(UNC_in_GDP, UNC_FDI_in)
% of GDP Co-Ra 1980-
2016
196
UNCTAD, 2017 (publicly available) USD Co-Int
FDI asset stock (LMF)
(LMF_out_GDP, LMF_FDI_out, )
The outward FDI stock represents the value of the resident investors' equity in and net loans to enterprises in foreign
economies.
% of GDP Co-Ra 1970-
2015 202
Lane & Miles-Ferretti, 2017
(publicly available) USD Co-Int
FDI asset stock (UNCTAD)
(UNC_out_GDP, UNC_FDI_in)
% of GDP Co-Ra 1980-
2016
196 UNCTAD, 2017
(publicly available) USD Co-Int
Notes: In the type column: “Co” corresponds to “continuous”, “Di” corresponds to “discrete”, “Bi” corresponds to “binary”, “Int” corresponds to “interval”, and “Ra” corresponds to “Ratio”.
Table 5: De facto financial openness measures.
Saadma & Steiner (2016) build on the data provided by Lane & Milesi-Ferretti to create
an index for private financial openness (OPEN_pv), which can be seen as further development
of the financial openness index. It distinguishes between private and state-led financial openness 7 The latest LMF dataset is available here: https://www.imf.org/en/Publications/WP/Issues/2017/05/10/International-Financial-Integration-in-the-Aftermath-of-the-Global-Financial-Crisis-44906 8 Existing differences between the FDI time series provided by Lane and Milesi-Ferretti (2017) in comparison to UNCTAD (2017) can be traced back to a partly different usage of balance of payment manuals: for some countries, the two sources treat reverse investment (between affiliates and parent companies) differently, which leads to deviations in the reported FDI assets and liabilities.
11
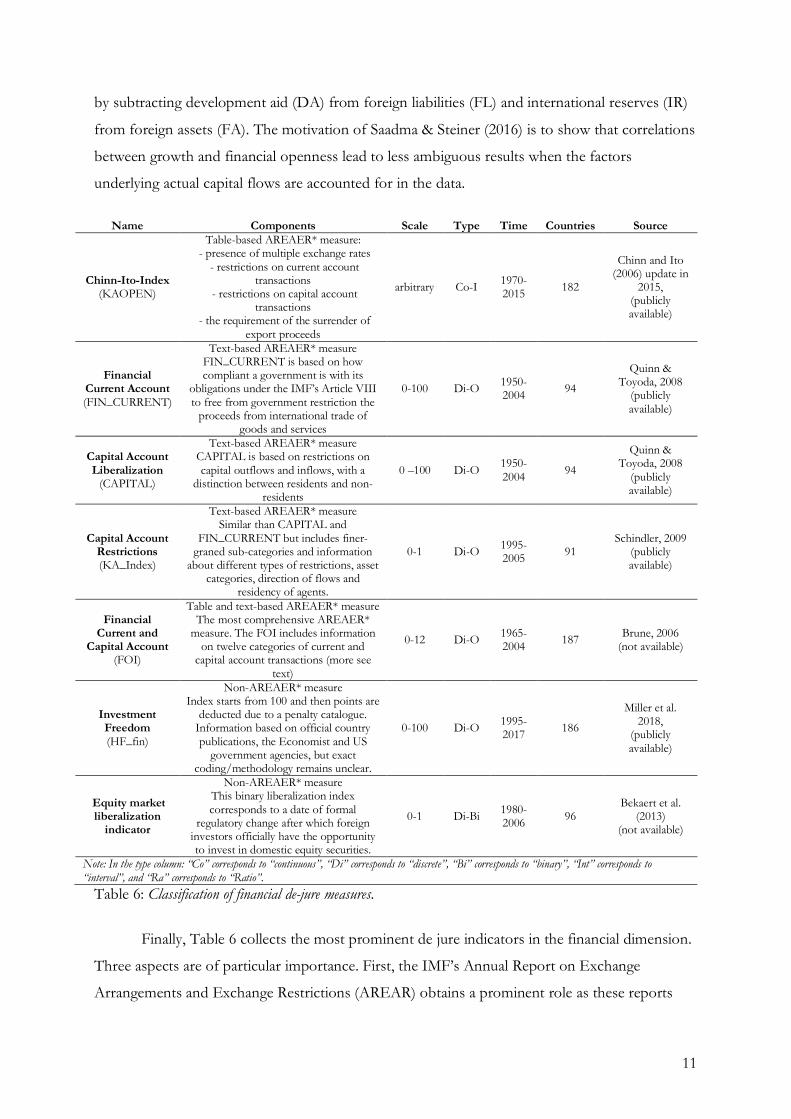
by subtracting development aid (DA) from foreign liabilities (FL) and international reserves (IR)
from foreign assets (FA). The motivation of Saadma & Steiner (2016) is to show that correlations
between growth and financial openness lead to less ambiguous results when the factors
underlying actual capital flows are accounted for in the data.
Name Components Scale Type Time Countries Source
Chinn-Ito-Index (KAOPEN)
Table-based AREAER* measure: - presence of multiple exchange rates
- restrictions on current account transactions
- restrictions on capital account transactions
- the requirement of the surrender of export proceeds
arbitrary Co-I 1970-2015 182
Chinn and Ito (2006) update in
2015, (publicly available)
Financial Current Account (FIN_CURRENT)
Text-based AREAER* measure FIN_CURRENT is based on how compliant a government is with its
obligations under the IMF’s Article VIII to free from government restriction the
proceeds from international trade of goods and services
0-100 Di-O 1950-2004 94
Quinn & Toyoda, 2008
(publicly available)
Capital Account Liberalization
(CAPITAL)
Text-based AREAER* measure CAPITAL is based on restrictions on capital outflows and inflows, with a
distinction between residents and non-residents
0 –100 Di-O 1950-2004 94
Quinn & Toyoda, 2008
(publicly available)
Capital Account Restrictions (KA_Index)
Text-based AREAER* measure Similar than CAPITAL and
FIN_CURRENT but includes finer-graned sub-categories and information
about different types of restrictions, asset categories, direction of flows and
residency of agents.
0-1 Di-O 1995-2005 91
Schindler, 2009 (publicly available)
Financial Current and
Capital Account (FOI)
Table and text-based AREAER* measure The most comprehensive AREAER*
measure. The FOI includes information on twelve categories of current and
capital account transactions (more see text)
0-12 Di-O 1965-2004 187 Brune, 2006
(not available)
Investment Freedom (HF_fin)
Non-AREAER* measure Index starts from 100 and then points are
deducted due to a penalty catalogue. Information based on official country publications, the Economist and US
government agencies, but exact coding/methodology remains unclear.
0-100 Di-O 1995-2017 186
Miller et al. 2018,
(publicly available)
Equity market liberalization
indicator
Non-AREAER* measure This binary liberalization index corresponds to a date of formal
regulatory change after which foreign investors officially have the opportunity to invest in domestic equity securities.
0-1 Di-Bi 1980-2006 96
Bekaert et al. (2013)
(not available)
Note: In the type column: “Co” corresponds to “continuous”, “Di” corresponds to “discrete”, “Bi” corresponds to “binary”, “Int” corresponds to “interval”, and “Ra” corresponds to “Ratio”.
Table 6: Classification of financial de-jure measures.
Finally, Table 6 collects the most prominent de jure indicators in the financial dimension.
Three aspects are of particular importance. First, the IMF’s Annual Report on Exchange
Arrangements and Exchange Restrictions (AREAR) obtains a prominent role as these reports

12
serve as a key source for deriving de-jure indicators regarding trade openness (IMF 2016).9 From
this we can distinguish three sub-categories of financial de jure measures: (i) de-jure indicators
that are based on the AREAER Categorical Table of Restrictions, (ii) de-jure indicators that are
based on the actual text of the AREAER and (iii) de-jure indicators that are not based on the
AREAER report (Quinn et al. 2011). Table-based indicators provide comprised data and come
with the advantage that they are relatively easy to replicate. In contrast, text-based indicators
contain finer-grained information on regulatory restrictions of capital flows. As a consequence
text-coded indicators can only be replicated if the authors provide a detailed description of their
coding-methodology.
Second, the Chinn-Ito index (KAOPEN) is most widely used in the literature on the
impacts of financial openness. It focuses on regulatory restrictions of capital account
transactions, is publicly available and covers 181 countries in the period 1970–2015.10 This
comparably huge coverage of the Chinn-Ito Index is a major asset one reason for its popularity.
The index is based on information about the restrictions on cross-border financial transactions,
as provided in the summary tables of the IMF AREAER report (Chinn and Ito, 2006, 2008). To
compose the index, Chinn and Ito (2008) codify binary variables for the four major categories
reported in the AREAR, i.e., (1) the presence of multiple exchange rates, (2) restrictions on
current account transactions, (3) restrictions on capital account transactions and (4) the
requirement of the surrender of export proceeds. Eventually the KAOPEN index (short for
capital account openness index) is constructed by conducting a principal component analysis on
these four variables.11
2.3. Hybrid and combined measures for economic openness
While there exist a series of different indicators for assessing the intensity of globalization
in general (see Gygli et al. 2019, Table 2, for an overview), indices that focus specifically on
economic globalization (as distinguished from e.g. social, political or cultural aspects of
globalization) are comparably rare. To derive such more specific measures of economic
globalization requires researchers to first isolate the relevant economic dimensions and then
identify suitable variables for measuring these dimensions. Among those globalization indicators
that could serve as a starting point for assessing the economic dimension of globalization – such
9 The IMF’s AREAER report draws on information from official sources and has been prepared in close consultation with national authorities. For more information visit: https://www.imf.org/~/media/Files/Publications/AREAER/AREAER_2016_Overview.ashx 10 Note that the covered time period is shorter for some countries due to data availability. 11 The Chinn-Ito-Index has been criticized for measuring more the extensity than the intensity of capital controls. In response, Chinn & Ito (2008) compare their index with de-jure indices that focus on the intensity of capital controls (e.g. CAPITAL in Table 6) and find a high correlation between CAPITAL and KAOPEN suggesting that KAOPEN is a valid proxy for the intensity of capital controls.

13
as the DHL Connectedness index (Ghemawat and Altman 2016), the New Globalization index
(Vujakovic 2010), or the Maastricht Globalization index (Figge and Martens 2014) – the KOF
Globalization index (Dreher 2006, Gygli et al. 2019) occupies an exceptional position in terms of
coverage, conceptual clarity and transparency. The index is supplied by the Swiss Economic
Institute (KOF) and is by far the most widely applied index of economic openness in the
economics literature (Potrafke 2015). Most recently, the KOF introduced a series of
methodological improvements as well as additional variables to revise and extend the basic
methodology for constructing the KOF globalization index (Gygli et al. 2019). In doing so, the
KOF also introduced a series of novel sub-indices based on a modular structure, which allows
for inspecting different dimensions of economic openness in a disaggregated form.
Name Components12 Scale Type Time Countries Source KOF trade
de-facto
Trade in goods (40.9%) Trade in services (45%) Trade partner diversification (14.1%)
0-100 Co-Int 1970-2015 221
Gygli et al. 2019,
(publicly available)
KOF finance de-facto
Foreign direct investment (27.5%) Portfolio investment (13.3%) International debt (27.2%) International reserves (2.4%) International income payments (29.6%)
KOF de-facto
KOF trade de-facto (50%) KOF finance de-facto (50%)
KOF trade
de-jure
Trade regulations (32.5%) Trade taxes (34.5%) Tariffs (33%)
KOF finance de-jure
Investment restrictions (21.7%) Capital account openness (78.3%)
KOF de-jure
KOF trade de-jure (50%) KOF finance de-jure (50%)
KOF econ
KOF de-facto (50%) KOF de-jure (50%)
Notes: In the type column: “Co” corresponds to “continuous”, “Di” corresponds to “discrete”, “Bi” corresponds to “binary”, “Iint” corresponds to “interval”, and “Ra” corresponds to “Ratio”. Table 7: The KOF economic globalization index as an example for a hybrid measure.
3. General trends for the openness indicators This section illustrates some of the general trends and properties exhibited by the
indicators presented so far.
3.1. Trade openness
Panels A and B in Figure 1 show trends of selected trade indicators. We classify countries
according to their economic complexity (Hidalgo and Hausmann 2009), a proxy for the level of
12 For more details see: https://www.ethz.ch/content/dam/ethz/special-interest/dual/kof-dam/documents/Globalization/2018/Variables_2018.pdf (accessed July 20, 2018).
14
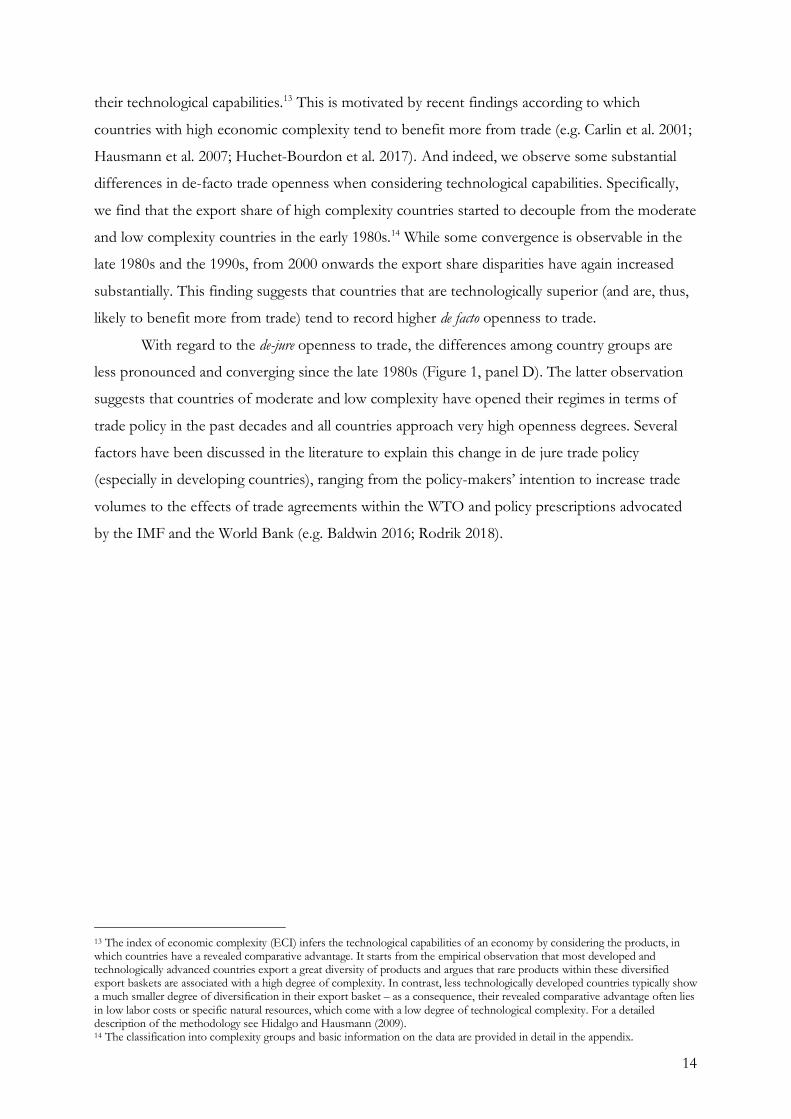
their technological capabilities.13 This is motivated by recent findings according to which
countries with high economic complexity tend to benefit more from trade (e.g. Carlin et al. 2001;
Hausmann et al. 2007; Huchet-Bourdon et al. 2017). And indeed, we observe some substantial
differences in de-facto trade openness when considering technological capabilities. Specifically,
we find that the export share of high complexity countries started to decouple from the moderate
and low complexity countries in the early 1980s.14 While some convergence is observable in the
late 1980s and the 1990s, from 2000 onwards the export share disparities have again increased
substantially. This finding suggests that countries that are technologically superior (and are, thus,
likely to benefit more from trade) tend to record higher de facto openness to trade.
With regard to the de-jure openness to trade, the differences among country groups are
less pronounced and converging since the late 1980s (Figure 1, panel D). The latter observation
suggests that countries of moderate and low complexity have opened their regimes in terms of
trade policy in the past decades and all countries approach very high openness degrees. Several
factors have been discussed in the literature to explain this change in de jure trade policy
(especially in developing countries), ranging from the policy-makers’ intention to increase trade
volumes to the effects of trade agreements within the WTO and policy prescriptions advocated
by the IMF and the World Bank (e.g. Baldwin 2016; Rodrik 2018).
13 The index of economic complexity (ECI) infers the technological capabilities of an economy by considering the products, in which countries have a revealed comparative advantage. It starts from the empirical observation that most developed and technologically advanced countries export a great diversity of products and argues that rare products within these diversified export baskets are associated with a high degree of complexity. In contrast, less technologically developed countries typically show a much smaller degree of diversification in their export basket – as a consequence, their revealed comparative advantage often lies in low labor costs or specific natural resources, which come with a low degree of technological complexity. For a detailed description of the methodology see Hidalgo and Hausmann (2009). 14 The classification into complexity groups and basic information on the data are provided in detail in the appendix.

15
Figure 1. Trends of trade indicators (panels A to C show de-facto measures; panel D a de-jure
measure).
3.2. Financial openness
Measures of financial openness show similar trends as those of trade openness (see Figure
2, panels A-D). De-facto measures of the high complexity group started to decouple from the
other groups between 1995 and 2000, that is, after the foundation of the WTO in 1994. Since
then, the gap between the former and the latter two groups has enlarged substantially, which
implies that the integration of financial markets among high complexity countries has proceeded
faster than in the rest of the world. Also, a comparison of in- and outflows of FDIs (panels A
and B in Figure 2), indicates that a large part of FDI in medium- and low complexity countries,
where inflows are much greater than outflows, stems from the high complexity country group.
With regard to the high complexity countries we find that, on average, larger countries play a
relatively greater role in terms of outflows than inflows and vice versa. Eventually, we observe
that the financial crisis of 07-08 had only a minor impact on financial openness: after a sharp
60
80
100
120
1970 1980 1990 2000 2010Year
Per c
ent o
f GD
PTrade as % of GDPA)
0.2
0.4
0.6
1970 1980 1990 2000 2010Year
Adju
sted
trad
e sh
are
Adjusted trade shareB)
0.00
0.25
0.50
0.75
1.00
1970 1980 1990 2000 2010Year
Trad
e to
GD
P (in
billi
on P
PP)
Real trade shareC)
50
60
70
80
90
1970 1980 1990 2000 2010Year
100−
tarif
f rat
e
WITS−based indexD)
All countries High complexity Low complexity Medium complexity
16
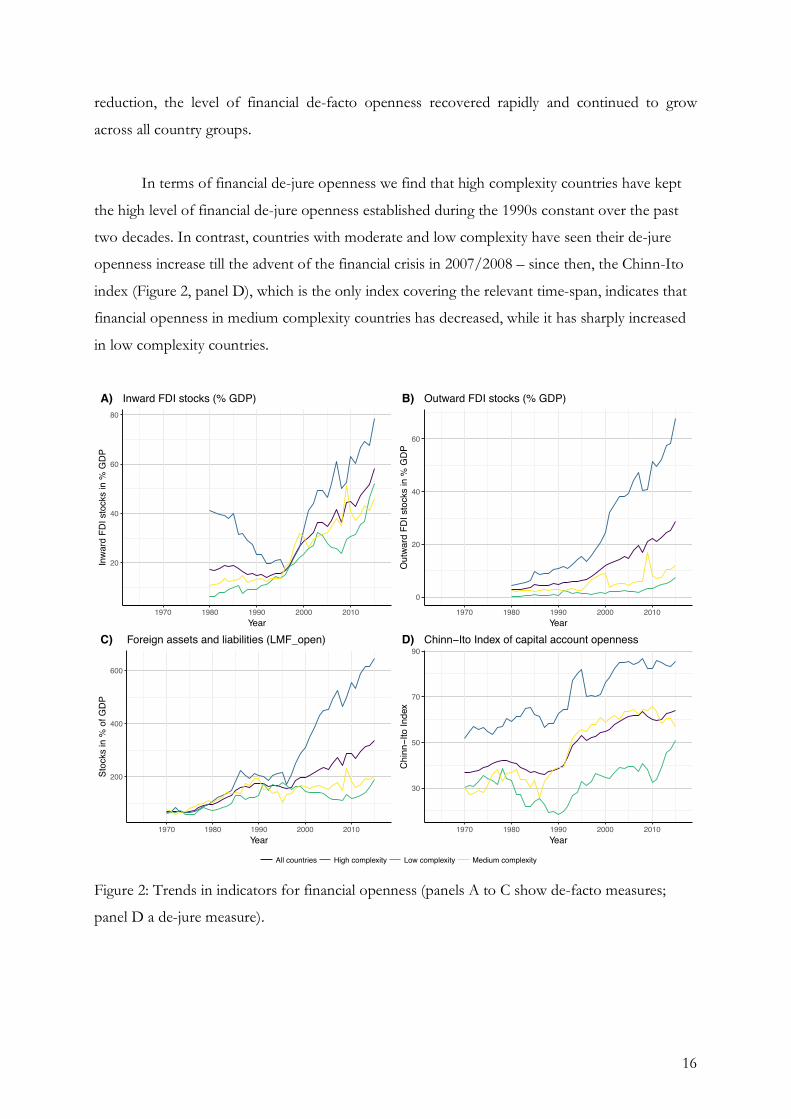
reduction, the level of financial de-facto openness recovered rapidly and continued to grow
across all country groups.
In terms of financial de-jure openness we find that high complexity countries have kept
the high level of financial de-jure openness established during the 1990s constant over the past
two decades. In contrast, countries with moderate and low complexity have seen their de-jure
openness increase till the advent of the financial crisis in 2007/2008 – since then, the Chinn-Ito
index (Figure 2, panel D), which is the only index covering the relevant time-span, indicates that
financial openness in medium complexity countries has decreased, while it has sharply increased
in low complexity countries.
Figure 2: Trends in indicators for financial openness (panels A to C show de-facto measures;
panel D a de-jure measure).
20
40
60
80
1970 1980 1990 2000 2010Year
Inwa
rd F
DI s
tock
s in
% G
DP
Inward FDI stocks (% GDP)A)
0
20
40
60
1970 1980 1990 2000 2010Year
Out
ward
FDI
sto
cks
in %
GDP
Outward FDI stocks (% GDP)B)
200
400
600
1970 1980 1990 2000 2010Year
Stoc
ks in
% o
f GDP
Foreign assets and liabilities (LMF_open)C)
30
50
70
90
1970 1980 1990 2000 2010Year
Chin
n−Ito
Inde
x
Chinn−Ito Index of capital account opennessD)
All countries High complexity Low complexity Medium complexity

17
Figure 3: The KOF globalization index as a hybrid measure. The KOF index provides a more complete view on the increase of economic openness in the
previous decades. As can be seen from Figure 3, the index captures the overall trend of
increasing openness (plot A) and the somehow different dynamics in the de facto and de jure
dimension (plots B and C). In the de facto dimension the KOF-index clearly mimics the on-
going divergence in terms of economic openness between high complexity countries and the rest
of the world, which has already been visible in Figure 1 and 2. Similarly, the weak but persistent
trend for a convergence in terms of the de-jure openness is picked up by the KOF-index. From a
global perspective, the main increase in de-jure openness had happened in the 1990s, in which all
three country-groups, on average, experienced a significant increase in the de-jure openness. De-
facto openness on the other hand is rising steadily over time, which, again, suggests that de-facto
developments are not primarily driven by de-jure (policy) changes.
4. Do different measures of openness measure the same? A correlation analysis
After introducing the most prominent indicators for economic openness and discussing
their conceptual differences, we will now examine the empirical relationship between these
openness indicators. Given the previous discussion, we would expect that indicators within the
same group (e.g. de-facto trade openness) measure similar aspects of economic openness and,
therefore, are strongly correlated with each other. To corroborate this hypothesis and to study
40
50
60
70
1970 1980 1990 2000 2010Year
KOF
Inde
xKOF Econ Globalization Index − complete versionA)
30
40
50
60
70
1970 1980 1990 2000 2010Year
KOF
Inde
x
KOF Econ Globalization Index − de factoB)
30
40
50
60
70
1970 1980 1990 2000 2010Year
KOF
Inde
x
KOF Econ Globalization Index − de jureC)
All countries High complexity Low complexity Medium complexity

18
the relationship between indicators belonging to different types, we now conduct a
comprehensive correlation analysis of the 32 indices of economic openness presented so far.
Since many papers use the first difference of these indicators, we pay attention to both
correlations of the variables in levels as well as across the time-series in first differences.15 This
exercise is useful for answering a variety of questions: for instance, whether indicators that were
built to measure the same type of openness are consistent with each other or to what extent
financial and trade indicators do behave similarly. In addition, such an approach allows for
clarifying the degree of alignment between one-dimensional indicators on the one hand and
hybrid and combined indicators on the other hand. Finally, studying the relationship between
different indicators is a relevant preliminary exercise for examining the question whether the
choice of indicators matters for empirical applications. In our analysis, we use the Spearman rank
coefficient since it requires only few assumptions on the scale and distribution of the compared
time-series (e.g. Weaver et al. 2017). We report the results using the Pearson coefficient, which
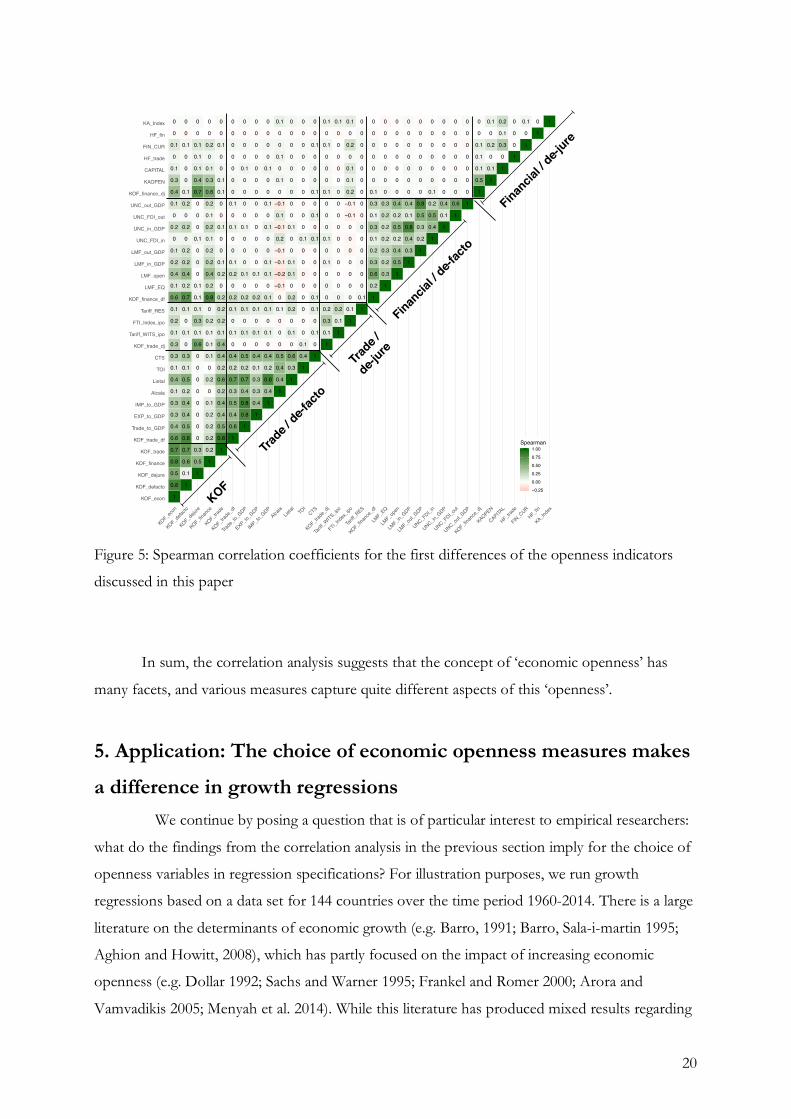
are qualitatively equivalent, in the accompanying appendix. While Figure 4 illustrates the
correlation of the various measures in levels, Figure 5 depicts correlations among the time series
of the various indicators in first differences.
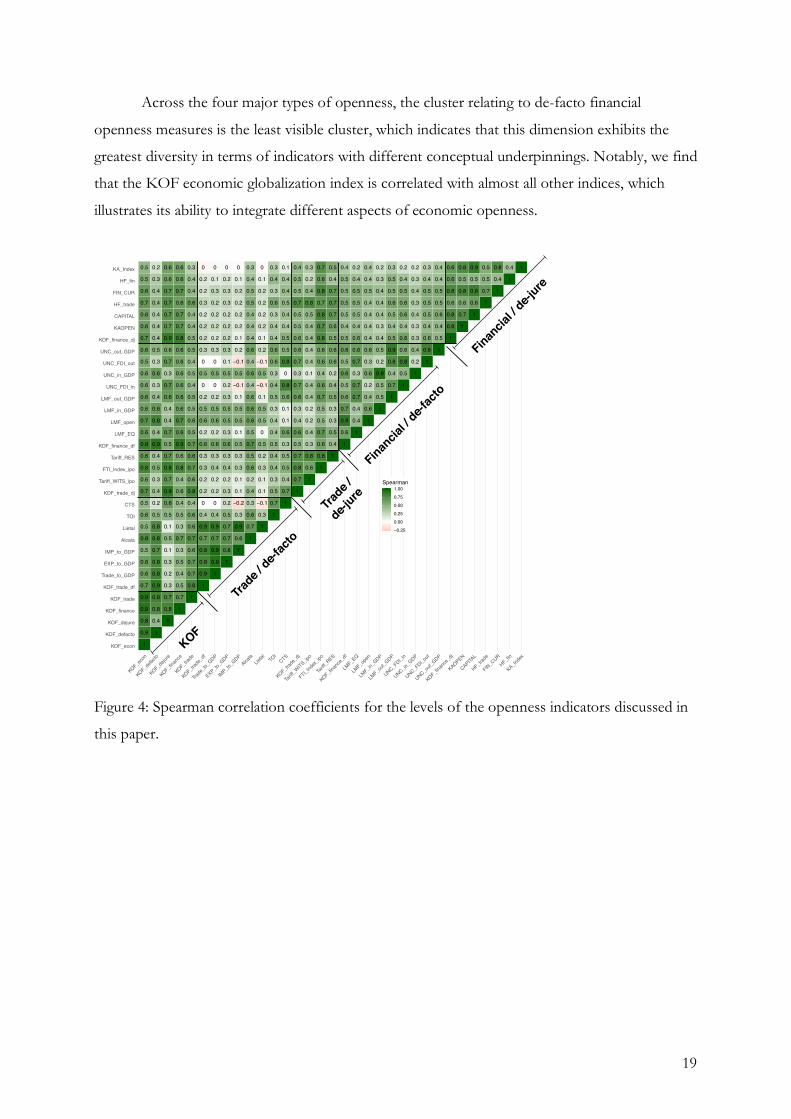
When inspecting Figures 4 and 5, we can identify clusters of closely related openness
measures: we generally find stronger associations among the indicators within each type (trade
de-facto; trade de-jure; financial de-facto; financial de-jure), but only weak to moderate
correlations of indicators can be established across different types (e.g. trade de-facto vis-à-vis
financial de-facto) – with some notable exceptions to be discussed below. Thereby, correlations
are consistently lower whenever one compares the differenced indicator (Figure 5), with
indicators of different types now being almost completely uncorrelated. Furthermore, these
correlations reveal that de-jure measures on trade and financial openness are more closely
correlated than its de-facto counterparts, while the correlation between de-facto and de-jure in
both dimensions (trade and finance) is weaker. This result implies that economic policy in terms
of trade and finance tends to be more convergent than de-facto outcomes; furthermore,
countries that decide to reduce institutional obstacles to trade generally do it simultaneously for
real and financial flows. Our findings lend support to the argument that de-facto indicators
generally represent more than just the outcome of economic policy, while de-jure indicators
measure the legal foundations of economic policy.
15 Unit roots tests for the individual time series are provided in the appendix. The Sachs-Warner as an index is excluded from this analysis.
19
Across the four major types of openness, the cluster relating to de-facto financial
openness measures is the least visible cluster, which indicates that this dimension exhibits the
greatest diversity in terms of indicators with different conceptual underpinnings. Notably, we find
that the KOF economic globalization index is correlated with almost all other indices, which
illustrates its ability to integrate different aspects of economic openness.
Figure 4: Spearman correlation coefficients for the levels of the openness indicators discussed in
this paper.
1
0.9
0.8
0.9
0.9
0.7
0.6
0.6
0.5
0.8
0.5
0.6
0.5
0.7
0.6
0.8
0.6
0.8
0.6
0.7
0.6
0.6
0.6
0.6
0.5
0.6
0.7
0.6
0.6
0.7
0.6
0.5
0.5
1
0.4
0.8
0.8
0.9
0.8
0.8
0.7
0.8
0.8
0.5
0.2
0.4
0.3
0.5
0.4
0.9
0.4
0.8
0.6
0.4
0.3
0.6
0.3
0.5
0.4
0.4
0.4
0.4
0.4
0.3
0.2
1
0.8
0.7
0.3
0.2
0.3
0.1
0.5
0.1
0.5
0.6
0.9
0.7
0.8
0.7
0.5
0.7
0.4
0.4
0.6
0.7
0.3
0.7
0.6
0.9
0.7
0.7
0.7
0.7
0.6
0.6
1
0.7
0.5
0.4
0.5
0.3
0.7
0.3
0.5
0.4
0.6
0.4
0.8
0.6
0.9
0.6
0.7
0.6
0.6
0.6
0.6
0.6
0.6
0.8
0.7
0.7
0.6
0.7
0.6
0.6
1
0.8
0.7
0.7
0.6
0.7
0.6
0.6
0.4
0.8
0.6
0.7
0.6
0.7
0.5
0.6
0.5
0.5
0.4
0.5
0.4
0.5
0.5
0.4
0.4
0.6
0.4
0.4
0.3
1
0.9
0.8
0.8
0.7
0.9
0.4
0
0.2
0.2
0.3
0.3
0.6
0.2
0.6
0.5
0.2
0
0.5
0
0.3
0.2
0.2
0.2
0.3
0.2
0.2
0
1
0.9
0.9
0.7
0.9
0.4
0
0.2
0.2
0.4
0.3
0.6
0.2
0.6
0.5
0.2
0
0.5
0
0.3
0.2
0.2
0.2
0.2
0.3
0.1
0
1
0.8
0.7
0.7
0.5
0.2
0.3
0.2
0.4
0.3
0.6
0.3
0.5
0.5
0.3
0.2
0.5
0.1
0.3
0.2
0.2
0.2
0.3
0.3
0.2
0
1
0.6
0.9
0.3
−0.2
0.1
0.1
0.3
0.3
0.5
0.1
0.5
0.5
0.1
−0.1
0.5
−0.1
0.2
0.1
0.2
0.2
0.2
0.2
0.1
0
1
0.7
0.6
0.3
0.4
0.2
0.6
0.5
0.7
0.5
0.6
0.6
0.6
0.4
0.6
0.4
0.6
0.4
0.4
0.4
0.5
0.5
0.4
0.3
1
0.3
−0.1
0.1
0.1
0.3
0.2
0.5
0
0.5
0.5
0.1
−0.1
0.5
−0.1
0.2
0.1
0.2
0.2
0.2
0.2
0.1
0
1
0.7
0.5
0.3
0.4
0.4
0.5
0.4
0.4
0.3
0.5
0.4
0.3
0.6
0.6
0.4
0.4
0.3
0.6
0.3
0.4
0.3
1
0.7
0.4
0.5
0.5
0.3
0.6
0.1
0.1
0.6
0.8
0
0.8
0.5
0.5
0.4
0.4
0.5
0.4
0.4
0.1
1
0.7
0.8
0.7
0.5
0.6
0.4
0.3
0.6
0.7
0.3
0.7
0.6
0.6
0.5
0.5
0.7
0.5
0.5
0.4
1
0.6
0.8
0.3
0.4
0.2
0.2
0.4
0.4
0.1
0.4
0.4
0.4
0.4
0.5
0.8
0.4
0.2
0.3
1
0.8
0.6
0.7
0.5
0.5
0.7
0.6
0.4
0.6
0.6
0.8
0.7
0.8
0.7
0.8
0.6
0.7
1
0.4
0.5
0.3
0.3
0.5
0.4
0.2
0.6
0.6
0.5
0.6
0.7
0.7
0.7
0.4
0.5
1
0.6
0.9
0.7
0.6
0.5
0.6
0.5
0.6
0.5
0.4
0.5
0.5
0.5
0.5
0.4
1
0.4
0.4
0.7
0.7
0.3
0.7
0.6
0.6
0.4
0.5
0.5
0.5
0.4
0.2
1
0.6
0.4
0.2
0.6
0.3
0.6
0.4
0.4
0.4
0.4
0.5
0.4
0.4
1
0.5
0.5
0.9
0.2
0.5
0.4
0.3
0.4
0.4
0.4
0.3
0.2
1
0.7
0.4
0.8
0.9
0.5
0.4
0.5
0.6
0.5
0.5
0.3
1
0.5
0.8
0.6
0.6
0.4
0.6
0.6
0.5
0.4
0.2
1
0.2
0.4
0.3
0.3
0.4
0.3
0.4
0.3
0.2
1
0.8
0.6
0.4
0.5
0.5
0.5
0.4
0.3
1
0.5
0.4
0.6
0.5
0.5
0.4
0.4
1
0.8
0.8
0.6
0.8
0.6
0.6
1
0.7
0.6
0.8
0.5
0.8
1
0.6
0.8
0.5
0.9
1
0.7
0.5
0.5
1
0.4
0.8
1
0.4 1
KOF_econ
KOF_defacto
KOF_dejure
KOF_finance
KOF_trade
KOF_trade_df
Trade_to_GDP
EXP_to_GDP
IMP_to_GDP
Alcala
Lietal
TOI
CTS
KOF_trade_dj
Tariff_WITS_ipo
FTI_Index_ipo
Tariff_RES
KOF_finance_df
LMF_EQ
LMF_open
LMF_in_GDP
LMF_out_GDP
UNC_FDI_in
UNC_in_GDP
UNC_FDI_out
UNC_out_GDP
KOF_finance_dj
KAOPEN
CAPITAL
HF_trade
FIN_CUR
HF_fin
KA_Index
KOF_econ
KOF_defacto
KOF_dejure
KOF_finance
KOF_trade
KOF_trade_df
Trade_to_GDP
EXP_to_GDP
IMP_to_GDPAlcala
Lietal TO
ICTS
KOF_trade_dj
Tariff_WITS_ipo
FTI_Index_ipo
Tariff_RES
KOF_finance_df
LMF_EQ
LMF_open
LMF_in_GDP
LMF_out_GDP
UNC_FDI_in
UNC_in_GDP
UNC_FDI_out
UNC_out_GDP
KOF_finance_dj
KAOPEN
CAPITAL
HF_trade
FIN_CUR
HF_fin
KA_Index
−0.25
0.00
0.25
0.50
0.75
1.00Spearman
Financia
l / de-f
acto
Financia
l / de-j
ure
Trade /
de-fac
to
Trade /
de-jure
KOF
20
Figure 5: Spearman correlation coefficients for the first differences of the openness indicators
discussed in this paper
In sum, the correlation analysis suggests that the concept of ‘economic openness’ has
many facets, and various measures capture quite different aspects of this ‘openness’.
5. Application: The choice of economic openness measures makes
a difference in growth regressions We continue by posing a question that is of particular interest to empirical researchers:
what do the findings from the correlation analysis in the previous section imply for the choice of
openness variables in regression specifications? For illustration purposes, we run growth
regressions based on a data set for 144 countries over the time period 1960-2014. There is a large
literature on the determinants of economic growth (e.g. Barro, 1991; Barro, Sala-i-martin 1995;
Aghion and Howitt, 2008), which has partly focused on the impact of increasing economic
openness (e.g. Dollar 1992; Sachs and Warner 1995; Frankel and Romer 2000; Arora and
Vamvadikis 2005; Menyah et al. 2014). While this literature has produced mixed results regarding
1
0.8
0.5
0.8
0.7
0.6
0.4
0.3
0.3
0.1
0.4
0.1
0.3
0.3
0.1
0.2
0.1
0.6
0.1
0.4
0.2
0.1
0
0.2
0
0.1
0.4
0.3
0.1
0
0.1
0
0
1
0.1
0.6
0.7
0.8
0.5
0.4
0.4
0.2
0.5
0.1
0.3
0
0.1
0
0.1
0.7
0.2
0.4
0.2
0.2
0
0.2
0
0.2
0.1
0
0
0
0.1
0
0
1
0.5
0.3
0
0
0
0
0
0
0
0
0.6
0.1
0.3
0.1
0.1
0.1
0
0
0
0.1
0
0
0
0.7
0.4
0.1
0.1
0.1
0
0
1
0.2
0.2
0.2
0.2
0.1
0
0.2
0
0.1
0.1
0.1
0.2
0
0.8
0.2
0.4
0.2
0.2
0.1
0.2
0.1
0.2
0.6
0.3
0.1
0
0.2
0
0
1
0.8
0.5
0.4
0.4
0.2
0.6
0.2
0.4
0.4
0.1
0.2
0.2
0.2
0
0.2
0.1
0
0
0.1
0
0
0.1
0.1
0
0
0.1
0
0
1
0.6
0.4
0.5
0.3
0.7
0.2
0.4
0
0.1
0
0.1
0.2
0
0.2
0.1
0
0
0.1
0
0.1
0
0
0
0
0
0
0
1
0.8
0.8
0.4
0.7
0.2
0.5
0
0.1
0
0.1
0.2
0
0.1
0
0
0
0.1
0
0
0
0
0.1
0
0
0
0
1
0.4
0.3
0.3
0.1
0.4
0
0.1
0
0.1
0.2
0
0.1
0
0
0
0
0
0
0
0
0
0
0
0
0
1
0.4
0.8
0.2
0.4
0
0.1
0
0.1
0.1
0
0.1
0.1
0
0
0.1
0
0.1
0
0
0.1
0
0
0
0
1
0.4
0.4
0.5
0
0
0
0.1
0
−0.1
−0.2
−0.1
−0.1
0.2
−0.1
0.1
−0.1
0
0.1
0
0.1
0
0
0.1
1
0.3
0.6
0
0.1
0
0.2
0.2
0
0.1
0.1
0
0
0.1
0
0
0
0
0
0
0
0
0
1
0.4
0.1
0
0
0
0
0
0
0
0
0.1
0
0
0
0
0
0
0
0
0
0
1
0
0.1
0
0.1
0.1
0
0
0
0
0.1
0
0.1
0
0.1
0
0
0
0.1
0
0
1
0.1
0.3
0.2
0
0
0
0.1
0
0.1
0
0
0
0.1
0
0
0
0.1
0
0.1
1
0.1
0.2
0
0
0
0
0
0
0
0
0
0
0
0
0
0
0
0.1
1
0.1
0
0
0
0
0
0
0
−0.1
−0.1
0.2
0.1
0.1
0
0.2
0
0.1
1
0.1
0
0
0
0
0
0
0
0
0
0
0
0
0
0
0
1
0.2
0.6
0.3
0.2
0.1
0.3
0.1
0.3
0.1
0
0
0
0
0
0
1
0.3
0.2
0.3
0.2
0.2
0.2
0.3
0
0
0
0
0
0
0
1
0.5
0.4
0.2
0.5
0.2
0.4
0
0
0
0
0
0
0
1
0.3
0.4
0.8
0.1
0.4
0
0
0
0
0
0
0
1
0.2
0.3
0.5
0.8
0
0
0
0
0
0
0
1
0.4
0.5
0.2
0.1
0
0
0
0
0
0
1
0.1
0.4
0
0
0
0
0
0
0
1
0.6
0
0
0
0
0
0
0
1
0
0
0
0
0
0
0
1
0.5
0.1
0.1
0.1
0
0
1
0.1
0
0.2
0
0.1
1
0
0.3
0.1
0.2
1
0
0
0
1
0
0.1
1
0 1
KOF_econ
KOF_defacto
KOF_dejure
KOF_finance
KOF_trade
KOF_trade_df
Trade_to_GDP
EXP_to_GDP
IMP_to_GDP
Alcala
Lietal
TOI
CTS
KOF_trade_dj
Tariff_WITS_ipo
FTI_Index_ipo
Tariff_RES
KOF_finance_df
LMF_EQ
LMF_open
LMF_in_GDP
LMF_out_GDP
UNC_FDI_in
UNC_in_GDP
UNC_FDI_out
UNC_out_GDP
KOF_finance_dj
KAOPEN
CAPITAL
HF_trade
FIN_CUR
HF_fin
KA_Index
KOF_econ
KOF_defacto
KOF_dejure
KOF_finance
KOF_trade
KOF_trade_df
Trade_to_GDP
EXP_to_GDP
IMP_to_GDPAlcala
Lietal TO
ICTS
KOF_trade_dj
Tariff_WITS_ipo
FTI_Index_ipo
Tariff_RES
KOF_finance_df
LMF_EQ
LMF_open
LMF_in_GDP
LMF_out_GDP
UNC_FDI_in
UNC_in_GDP
UNC_FDI_out
UNC_out_GDP
KOF_finance_dj
KAOPEN
CAPITAL
HF_trade
FIN_CUR
HF_fin
KA_Index
−0.25
0.00
0.25
0.50
0.75
1.00Spearman
Financia
l / de-f
acto
Financia
l / de-j
ure
Trade /
de-fac
to
Trade /
de-jure
KOF

21
the link between openness and growth (e.g. Edwards, 1993; Rodriguez and Rodrik 2001; Bekaert
et al. 2005; Bussiere and Fratzscher 2008), a number of studies has highlighted that the choice of
the openness indicator can have a pronounced impact on the obtained regression results (e.g.
Rodriguez and Rodrik, 2001; Yanikkaya 2003; Aribaz Fernandez et al. 2007; Quinn et al. 2011).
Against this background, we apply the trade and financial openness indicators analyzed in the
first sections of this paper in a standard growth regression framework; by doing so, we illustrate
how the choice of the openness variable matters.
Our regression equation closely follows standard specifications as used in the existing
literature (Barro, Sala-i-martin 1995; Arora and Vamvadikis 2005) and can be summarized as
follows:
789:;,= = >?@AB;,= + DE;,= + FG; +I;,= , (1)
where 789:;,= represents the growth rate of Gross Domestic product at PPP per
capita for country i in period t. ?@AB;,= is the main explanatory variable of interest, defined as the
natural logarithm of one of several (trade or financial) openness indicators, which we introduce
below. E;,=represents a vector of additional explanatory variables, which are explained in Table 8
(Data sources and summary statistics are available in the accompanying appendix). FG;are
country-fixed effects, which we include to account for unobservable, time-invariant country-
specific characteristics that may influence 789:;,= . In this setup, we express all variables as non-
overlapping five-year averages (except for the initial level of GDP per capita) to dampen the
effects of short-run business cycle fluctuations on GDP per capita growth (e.g. Arora and
Vamvadikis 2005). Additionally, and to account for the correlation structure found for the times
series in first differences (compare Figures 4 and 5), we also estimate a corresponding version of
equation (1) in first differences (FD):16
J789:; = J?@AB;,=> + JE;,=D +I;,= (2)
The results on the sign and statistical significance of the estimated coefficients are
summarized in Table 8. While our specifications may contain misspecifications, most notably due
to endogeneity issues, the outcomes reveal interesting patterns, both within and between the
various dimensions of openness, and thereby highlight the implications of choosing among
16 Notably, we use annual data (and not 5-year averages as in equation (1)) to estimate the first difference specification in equation (2).
22
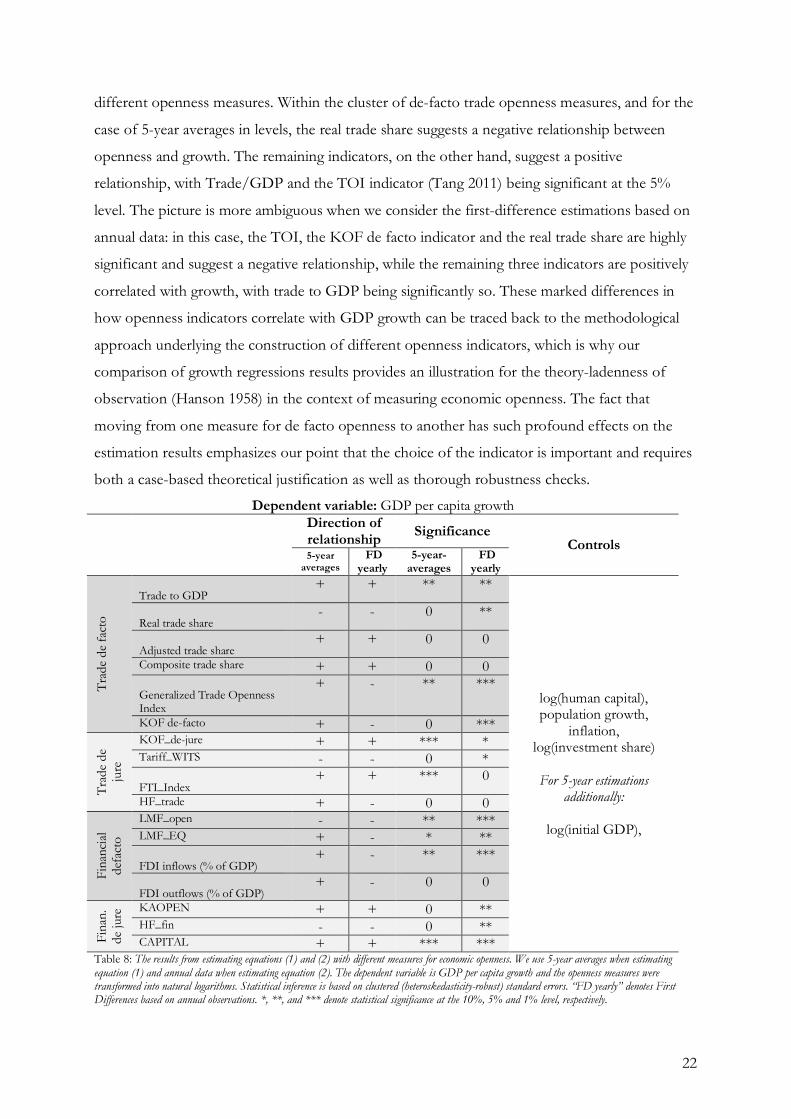
different openness measures. Within the cluster of de-facto trade openness measures, and for the
case of 5-year averages in levels, the real trade share suggests a negative relationship between
openness and growth. The remaining indicators, on the other hand, suggest a positive
relationship, with Trade/GDP and the TOI indicator (Tang 2011) being significant at the 5%
level. The picture is more ambiguous when we consider the first-difference estimations based on
annual data: in this case, the TOI, the KOF de facto indicator and the real trade share are highly
significant and suggest a negative relationship, while the remaining three indicators are positively
correlated with growth, with trade to GDP being significantly so. These marked differences in
how openness indicators correlate with GDP growth can be traced back to the methodological
approach underlying the construction of different openness indicators, which is why our
comparison of growth regressions results provides an illustration for the theory-ladenness of
observation (Hanson 1958) in the context of measuring economic openness. The fact that
moving from one measure for de facto openness to another has such profound effects on the
estimation results emphasizes our point that the choice of the indicator is important and requires
both a case-based theoretical justification as well as thorough robustness checks.
Dependent variable: GDP per capita growth Direction of
relationship Significance Controls
5-year averages
FD yearly
5-year-averages
FD yearly
Trad
e de
fact
o
Trade to GDP + + ** **
log(human capital), population growth,
inflation, log(investment share)
For 5-year estimations
additionally:
log(initial GDP),
Real trade share - - 0 **
Adjusted trade share + + 0 0
Composite trade share + + 0 0
Generalized Trade Openness Index
+ - ** ***
KOF de-facto + - 0 ***
Trad
e de
ju
re
KOF_de-jure + + *** * Tariff_WITS - - 0 *
FTI_Index + + *** 0
HF_trade + - 0 0
Fina
ncia
l de
fact
o
LMF_open - - ** *** LMF_EQ + - * **
FDI inflows (% of GDP) + - ** ***
FDI outflows (% of GDP) + - 0 0
Fina
n.
de ju
re KAOPEN + + 0 **
HF_fin - - 0 ** CAPITAL + + *** ***
Table 8: The results from estimating equations (1) and (2) with different measures for economic openness. We use 5-year averages when estimating equation (1) and annual data when estimating equation (2). The dependent variable is GDP per capita growth and the openness measures were transformed into natural logarithms. Statistical inference is based on clustered (heteroskedasticity-robust) standard errors. “FD yearly” denotes First Differences based on annual observations. *, **, and *** denote statistical significance at the 10%, 5% and 1% level, respectively.
23
The results within the cluster of trade de jure measures are also mixed: in case of the five-
year averages, three of the indicators (HF_trade , KOF_dejure and the FTI index) are positively
correlated with growth, with the latter two variables being highly statistically significant. The
estimate for Tariff_WITS has a negative sign but remains insignificant. The result for the FD-
specification is similar, although HF_trade now switches sign but remains insignificant, and both
the KOF de-jure index and the FTI index remain significant only at the 10% level.
The conclusion for measures of de-facto financial openness is also ambiguous: in case of
the five-year averages, three of the four de-facto measures suggest a positive relationship
(LMF_EQ, FDI inflows, FDI outflows), with two of them being significant at the 5 and 10%
level, while the LMF openness indicator (LMF_open) suggests a negative relationship, significant
at the 5% level. The results are more straightforward when the FD estimator is used: here all
indicators suggest a negative relationship and all these correlations, except for the FDI outflows,
are considered as statistically significant at the 5% or 1% percent level.
Finally, we observe ambiguous patterns for the financial de-jure measures with KAOPEN
and CAPITAL being positively, and HF_fin being negatively associated with growth, for both
the estimations based on first differences and five-year averages. All of these relationships are
highly significant at the 5% or 1% level, with KAOPEN and HF_fin in the 5-year average case
being the exception.
These exercises reveal that there is not only considerable variation in outcomes when
different types of economic openness are considered, but that results may also vary within a
certain conceptual dimension as different indicators are constructed in different ways. To arrive
at a fuller picture of the empirical assessment of economic openness, we estimate a more
complete regression equation in the next step. In doing so, we augment the baseline specification
by including measures for different types of economic openness based on the KOF openness
indicators.
The results regarding the determinants of GDP per capita growth obtained from these
estimations are again sensitive to both the dimensions of economic openness actually considered
as well as the set of openness indicators chosen to represent different dimensions of openness
(see Table 9). When we only include the KOF_econ indicator, we find a positive but statistically
insignificant coefficient regarding the impact of economic openness on growth. However, when
separating trade and financial openness using the KOF_trade and KOF_finance subindicators in
models (3) and (4), we arrive at a more nuanced result: while the coefficient of KOF_trade is
always positive and significant, KOF_finance is negative and in the FD specification statistically
significantly so. In models (5) and (6), we find that the KOF de jure measures (both in the trade
and in the finance dimension) generally correlate positively with economic growth, but no such

24
consistent observation is possible for the de facto measures. The even more disaggregated
models (7) and (8) suggest that openness to trade tends to correlate positively with growth in
both de facto and de jure terms, but that financial openness tends to correlate negatively with
growth when the de facto dimension is considered.
While we do not claim that we provide a fully-fledged estimation framework or that we
show a definite answer on the relationship between economic openness and growth – both of
which would require a much more careful consideration of possible endogeneity and reverse
causality issues –, we can nevertheless use the standard regression framework to derive some
general conclusions on the use of openness indicators. Our results indicate that operationalizing
economic openness for econometric research requires explicit theoretical justifications of the
relevant dimensions as well as the available indicators within these dimensions. Differences in
how openness indicators correlate with economic growth illustrate the theory-laddenness of
observation (Hanson 1958), i.e. the fact that the methodological approach underlying the
construction of different openness indicators makes an important difference. At the same time,
specifying growth regressions with more than one openness indicator, or running extensive
robustness checks with different indicators, can provide hints regarding how different types of
economic openness relate to GDP growth (as well as other variables of interest).

25
Table 9: Statistical inference based on clustered (heteroskedasticity-robust) standard errors.
Full specification
Dependent variable: GDP per capita growth
FD 5-year av FD 5-year av FD 5-year av FD 5-year av(1) (2) (3) (4) (5) (6) (7) (8)
log(KOF_econ) 2.465 1.191(2.701) (1.077)
log(KOF_trade) 6.240*** 1.516*
(2.258) (0.881)
log(KOF_finance) -3.707* -0.058(2.084) (0.742)
log(KOF_defacto) -0.651 0.068(1.938) (0.896)
log(KOF_dejure) 5.492*** 1.253(1.973) (0.844)
log(KOF_trade_df) 4.297** 0.331(1.726) (0.749)
log(KOF_trade_dj) 2.569** 0.989*
(1.295) (0.558)
log(KOF_finance_df) -4.739*** -0.056(1.776) (0.629)
log(KOF_finance_dj) 1.280 0.277(1.772) (0.517)
log(hc) 6.018 0.124 8.715 0.161 4.295 -0.014 9.459 -0.150(8.634) (1.695) (9.543) (1.668) (8.111) (1.659) (9.616) (1.708)
pop_growth -0.565** -0.512** -0.565** -0.495** -0.566** -0.503** -0.564** -0.490**
(0.276) (0.203) (0.270) (0.204) (0.279) (0.201) (0.277) (0.201)
inflation 0.001 -0.002*** 0.001 -0.002*** 0.001 -0.002*** 0.001 -0.002***
(0.001) (0.001) (0.001) (0.001) (0.001) (0.001) (0.001) (0.001)
log(inv_share) -0.058 1.503*** -0.241 1.433** -0.055 1.469*** -0.381 1.415**
(1.460) (0.558) (1.457) (0.575) (1.466) (0.552) (1.464) (0.570)
Constant -0.103 -0.106 -0.105 -0.094(0.098) (0.106) (0.095) (0.110)
Observations 5,127 1,179 5,127 1,179 5,102 1,173 5,096 1,172R2 0.002 0.066 0.005 0.068 0.004 0.067 0.007 0.069
F Statistic2.187*
(df = 5;5121)
14.561***
(df = 5;1033)
4.045***
(df = 6;5120)
12.522***
(df = 6;1032)
3.093***
(df = 6;5095)
12.302***
(df = 6;1027)
4.656***
(df = 8;5087)
9.436***
(df = 8;1024)
Note: *p<0.1; **p<0.05; ***p<0.01

26
6. Conclusions This paper has reviewed existing measures and empirical practices regarding economic
openness, which we can generally understand as the degree to which non-domestic actors can or
do participate in the domestic economy. We have compiled a comprehensive set of openness
indicators from the existing literature – the data set is published together with this article – and
have categorized the indicators using a typology of economic openness, which distinguishes
between ‘real’ and ‘financial’ openness, as well as a ‘de facto’ dimension (based on aggregate
economic statistics) and a ‘de jure’ dimension (focusing on institutional foundations of
openness), respectively.
We have used this data set to analyze the correlation across indicators, both in levels and
in first differences. We find that indicators that belong to the same category of openness
measures tend to be correlated more strongly. Correlations among openness indicators are,
however, in general much weaker in the case of first differences. By using a standard growth
regression framework, we have shown how different types of economic openness as well as
different indicators capture the impact of openness on economic growth in different ways. From
this finding, it follows that applied researchers are well advised to motivate their choice of
openness indicator rigorously, since different research questions might also entails different
conceptions of economic openness. At the same time, it can be argued that the identification of
reasons for why different measures of economic openness yield different results is an important
and rewarding research activity.
References
Aghion, P., Howitt, P. (2008). The Economics of Growth, Cambridge, M.A.: MIT Press.
Alcala, F., Ciccone, A. (2004): Trade and productivity, Quarterly Journal of Economics, 119(2), 613-
646.
Arora, V., Vamvadikis, A. (2005). How Much Do Trading Partners Matter for Economic
Growth?, IMF Staff Papers, 52(1), 24-40.
Arribas Fernández, I., Pérez García, F., & Tortosa-Ausina, E. (2007). Measuring International
Economic Integration: Theory and Evidence of Globalization, Documentos de Trabajo No. 24,
Bilbao: Fundacion BBV.
Baldwin, R. (2016): The World Trade Organization and the Future of Multilateralism, Journal of
Economic Perspectives, 30(1), 95-116.
Baltagi, B., Demetriades, P., Law, S. (2009). Financial development and openness: Evidence from
panel data, Journal of Development Economics, 89(2), 285-296.

27
Barro, R. (1991): Economic Growth in a Cross Section of Countries, Quarterly Journal of Economics,
106(2), 407-443.
Barro, R., Sala-i-martin, X. (1995). Economic growth, New York: McGraw Hill.
Bekaert, G., Harvey, C., Lundblad, C. (2005). Does financial liberalization spur growth?, Journal of
Financial Economics, 77(1), 3-55.
Bekaert et al. (2013). Risk, uncertainty and monetary policy, Journal of Monetary Economics, 60(7),
771-788.
Bussiere, M., Fratzscher, M. (2008). Financial Openness and Growth: Short-run Gain, Long-run
Pain?, Review of International Economics, 16(1), 69-95.
Brune, N. (2006). Financial Liberalization and Governance in the Developing World, Doctoral
Dissertation, Yale: Yale University.
Busse, M., Koeniger, J. (2012). Trade and Economic Growth: A Re-Examination of the
Empirical Evidence. HWWI Research Paper No. 123, Hamburg.
Carlin, W., Glyn, A., Van Reenen, J. (2001). Export Market Performance of OECD Countries:
An Empirical Examination of the Role of Cost Competitiveness, Economic Journal, 111(1),
128-162.
Chinn, M., Ito, H. (2006). What Matters for Financial Development? Capital Controls,
Institutions and Interactions, Journal of Development Economics, 81(1), 163-192.
Chinn, M., Ito, H. (2008). A New Measure of Financial Openness, Journal of Comparative
Analysis, 10(3), 309-322.
De Nicolo, G., Juvenal, L. (2014). Financial integration, globalization, and real activity, Journal of
Financial Stability, 10(3), 65-75.
Dollar, D. (1992). Outward-oriented developing economies really do grow more rapidly:
Evidence from 95 LDCs, 1976-1985, Economic Development and Cultural Change, 40(3), 523-
544
Dollar, D., Kleineberg, T., Kraay, A. (2016). Growth still is good for the poor. European Economic
Review, 81(1), 68–85.
Dreher, A. (2006). Does globalization affect growth? Evidence from a new index of globalization.
Applied Economics, 38(10), 1091–1110.
Dreher, A., Gaston, N., Martens, P., & Van Boxem, L. (2010). Measuring Globalization -
Opening the Black Box. A Critical Analysis of Globalization Indices. Journal of
Globalization Studies, 1(1), 166–185.
Edwards, S. (1993). Openness, Trade Liberalization, and Growth in Developing Countries,
Journal of Economic Literature, 31(3), 1358-1393.
28
Egger, P., Nigai, S., Strecker, N. (2019). The Taxing Deed of Globalization, American Economic
Review, 109(2), 353-390.
Felbermayr, Gabriel, Gröschl., J. 2013. “Natural Disasters and the Effect of Trade on Income: a
New Panel IV Approach.” European Economic Review 58 (February): 18–30.
Figge, Lukas, and Pim Martens. 2014. “Globalisation Continues: the Maastricht Globalisation
Index Revisited and Updated.” Globalizations 11 (6), 875-893.
doi:10.1080/14747731.2014.887389.
Frankel, J., Romer, D. (2000). Does Trade Cause Growth?, American Economic Review, 89(3), 379-
399.
Fraser Institute (2018): Economic Freedom Approach, Website of the Fraser Institute,
https://www.fraserinstitute.org/economic-freedom/approach [last access on June 15h
2018]
Fuji, E. (2019): What Does Trade Openness Measure?, Oxford Bulletin of Economics and Statistics,
forthcoming.
Ghemawat, P., Altman, S. (2016): DHL Global Connectedness Index, Bonn: Deutsche Post
DHL Group.
Gwartney, J., Lawson, R., Hall, J. (2017): Economic Freedom of the World. 2017 Annual Report,
Toronto: Fraser Institute.
Gygli, S., Haelg, F., Sturm, J. (2019): The KOF Globalisation Index – Revisited, Review of
International Organizations, forthcoming, doi: https://doi.org/10.1007/s11558-019-09344-
2.
Hanson, N.R. (1958): Patterns of Discovery. Cambridge University Press.
Harrison, A. (1996). Openness and growth: A time-series, cross-country analysis for developing
countries. Journal of Development Economics, 48(2).
Hausmann, R., Hwang, J., Rodrik, D. (2007). What you export matters. Journal of Economic Growth,
12(1), 1–25.
Herzer, D., and Vollmer, S. (2011): Inequality and Growth: Evidence From Panel Cointegration.
The Journal of Economic Inequality 10 (4): 489–503. doi:10.1007/s10888-011-9171-6.
Hidalgo, C., Hausmann, R. (2009). The building blocks of economic complexity. Proceedings of the
National Academy of Sciences, 106(26), 10570–10575.
Huchet-Bourdon, M., Le Mouël, C., Vijil, M. (2017). The relationship between trade openness
and economic growth: Some new insights on the openness measurement issue. World
Economy, 41(1), 59-76.
IMF (2016). Annual Report on Exchange Arrangements and Exchange Restrictions 2016,
Washington D.C.: International Monetary Fund.

29
Jaumotte, F., Lall, S., & Papageorgiou, C. (2013). Rising income inequality: Technology, or trade
and financial globalization? IMF Economic Review, 61(2), 271–309.
https://doi.org/10.1057/imfer.2013.7
Kalinova, B., Palerm, A., Thomsen, S. (2010). OECD’s FDI Restrictiveness Index: 2010 Update,
OECD Working Papers on International Investment No. 2010/03.
Kose, A., Prasad, E., Rogoff, K., Wei, S. (2009). Financial Globalization: A Reappraisal, IMF Staff
Papers, 56(1), 8-62.
Lane, P., Milesi-Ferretti, G. (2017). International Financial Integration in the Aftermath of the
Global Financial Crisis, IMF Working Paper No. 17/115.
Li, K., Morck, R., Yang, F., Yeung, B. (2004). Firm-specific variation and openness in emerging
markets, Review of Economics and Statistics, 86(3), 658-669.
Lockwood, Ben. (2004). How Robust Is the Kearney/Foreign Policy Globalisation Index?, The
World Economy 27(4), 507–23.
Martens, Pim, Marco Caselli, Philippe De Lombaerde, Lukas Figge, and Jan Aart Scholte. (2015).
New Directions in Globalization Indices. Globalizations, 12 (2), 217–228.
doi:10.1080/14747731.2014.944336.
McCloskey, D., Ziliak, S. (1996). The standard error of regressions, Journal of Economic Literature,
34(1), 97-114.
Menyah, K., Nazlioglu, S., Wolde-Rufael, Y. (2014). Financial development, trade openness and
economic growth in African countries: New insights from a panel causality approach,
Economic Modelling, 37(3), 386-394.
Miller, T., Kim, A., Roberts, J. (2018): 2018 Index of Economic Freedom, Washington, D.C.:
The Heritage Foundation.
Potrafke, Niklas (2015). The Evidence on Globalisation, The World Economy 38(3), 509-552.
Quinn, D. (2003). Capital Account Liberalization and Financial Globalization, 1890-1999: A
Synoptic View, International Journal of Finance and Economics, 8(3), 189-204.
Quinn, D., Toyoda, M. (2008). Does Capital Account Liberalization Lead to Growth?, Review of
Financial Studies, 21(3), 1403-1449.
Quinn, D., Schindler, M., Toyoda, A. (2011). Assessing Measures of Financial Openness and
Integration, IMF Economic Review, 59(3), 488-522.
Rodrik, D. (2018): What Do Trade Agreements Really Do?, Journal of Economic Perspectives, 32(2),
73-90.
Rodriguez, F., Rodrik, D. (2001): Trade Policy and Economic Growth: A Skeptic’s Guide to the
Cross-National Evidence, NBER Macroeconomics Annual 15, 261-338, Cambridge,
M.A.: MIT Press.
30
Sachs, J., Warner, A. (1995). Economic Reform and the Process of Global Integration. Brookings
Papers on Economic Activity, 1995(1), 1–95.
Schindler, M. (2009): Measuring Financial Integration: A New Data Set, IMF Staff Papers, 56(1),
222-238.
Squalli, J., Wilson, K. (2011). A New Measure of Trade Openness. The World Economy, 34(10),
1745–1770.
Saadma, T., Steiner, A. (2016). Measuring De Facto Financial Openness: A New Index, Beiträge
zur Jahrestagung des Vereins für Socialpolitik 2016 No. F16-V3, Kiel and Hamburg:
ZBW
Tang, K. (2011). Correcting the Size Bias in Trade Openness and Globalization Measures. Global
Economy Journal, 11(3), 1-24.
UNCTAD (2017). UNCTADSTAT, Database by the United Nations Conference on Trade and
Development, http://unctadstat.unctad.org/EN/ [last access on June 15th 2018].
Vujakovic, Petra (2010). How to Measure Globalization? A New Globalization Index (NGI),
Atlantic Economic Journal 38(2), 237–37.
Wacziarg, R., Welch, K. (2008). Trade Liberalization and Growth: New Evidence, World Bank
Economic Review, 22(2), 187-231.
Waugh, M., Ravikumar, B. (2016): Measuring openness to trade, Journal of Economic Dynamics and
Control, 72(6), 29-41.
Weaver, K., Morales, V., Dunn, S., Godde, K., Weaver, P. (2017). Pearson’s and Spearman’s
Correlation, in: Weaver et al. (2017). An Introduction to Statistical Analysis in Research:
With Applications in the Biological and Life, New Jersey: John Wiley & Sons, 435-471.
World Bank (2017): World Development Indicators Database,
https://datacatalog.worldbank.org/dataset/world-development-indicators [last access on
June 15th 2018].
Yanikkaya, H. (2003). Trade openness and economic growth: a cross-country empirical
investigation, Journal of Development Economics, 72(1), 57-89.
![Openness Agreements: Part Two The Reality of Openness · Presented by © Adoptive Families Association of BC [2016] Openness Agreements: Part Two The Reality of Openness](https://img.pdfslide.us/doc/110x75/5e81797d22c1fb32191241b3/openness-agreements-part-two-the-reality-of-openness-presented-by-adoptive-families.jpg)