Embed Size (px)
DESCRIPTION
Measuring development results in IFC. Evaluation Cooperation Group Washington, DC – June 6, 2007 Roland Michelitsch, Manager Development Effectiveness Unit, IFC. Why development results matter. IFC’s mission, purpose, articles Commitment by IFC management - PowerPoint PPT Presentation
Citation preview

Measuring development results Measuring development results in IFCin IFC
Evaluation Cooperation GroupEvaluation Cooperation GroupWashington, DC – June 6, 2007Washington, DC – June 6, 2007
Roland Michelitsch, Manager Roland Michelitsch, Manager Development Effectiveness Unit, IFCDevelopment Effectiveness Unit, IFC
2
Why development results Why development results mattermatter
IFC’s mission, purpose, articlesIFC’s mission, purpose, articles Commitment by IFC managementCommitment by IFC management Increasing demand from the Board Increasing demand from the Board
and other stakeholdersand other stakeholders Commitment to report publiclyCommitment to report publicly Continuously improve results:Continuously improve results:
“What gets measured – gets done” “What gets measured – gets done”
3
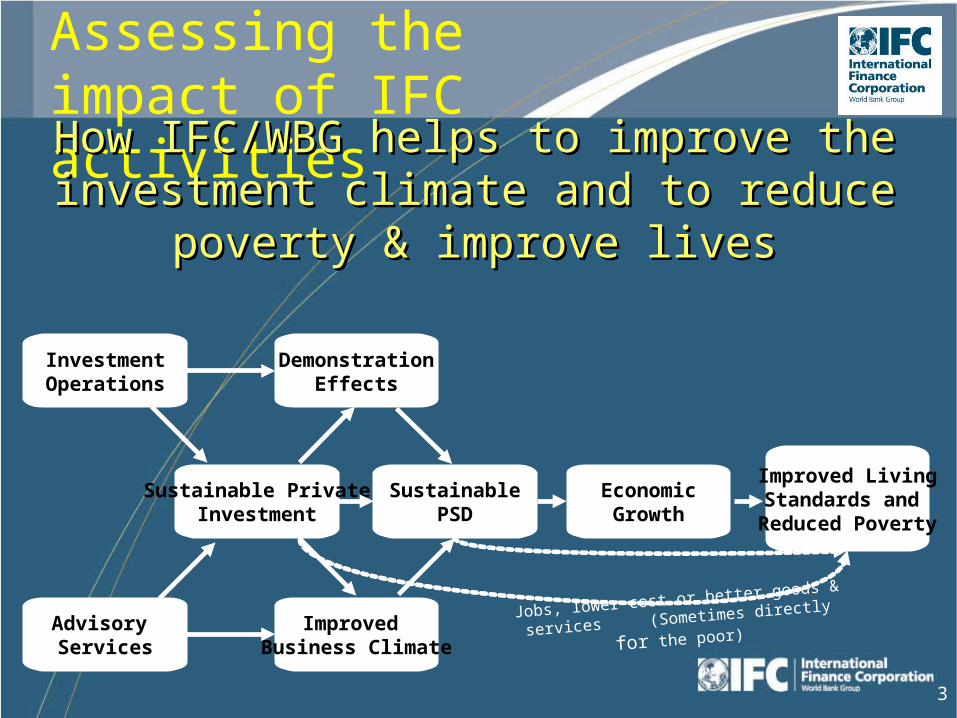
Assessing the impact of IFC activities
How IFC/WBG helps to improve the investment How IFC/WBG helps to improve the investment climate and to reduce poverty & improve livesclimate and to reduce poverty & improve lives
InvestmentOperations
Advisory Services
Sustainable PrivateInvestment
Improved Business Climate
DemonstrationEffects
SustainablePSD
EconomicGrowth
Improved LivingStandards and
Reduced Poverty
Jobs, lower-cost or better goods &
services (Sometimes directly for the
poor)
4
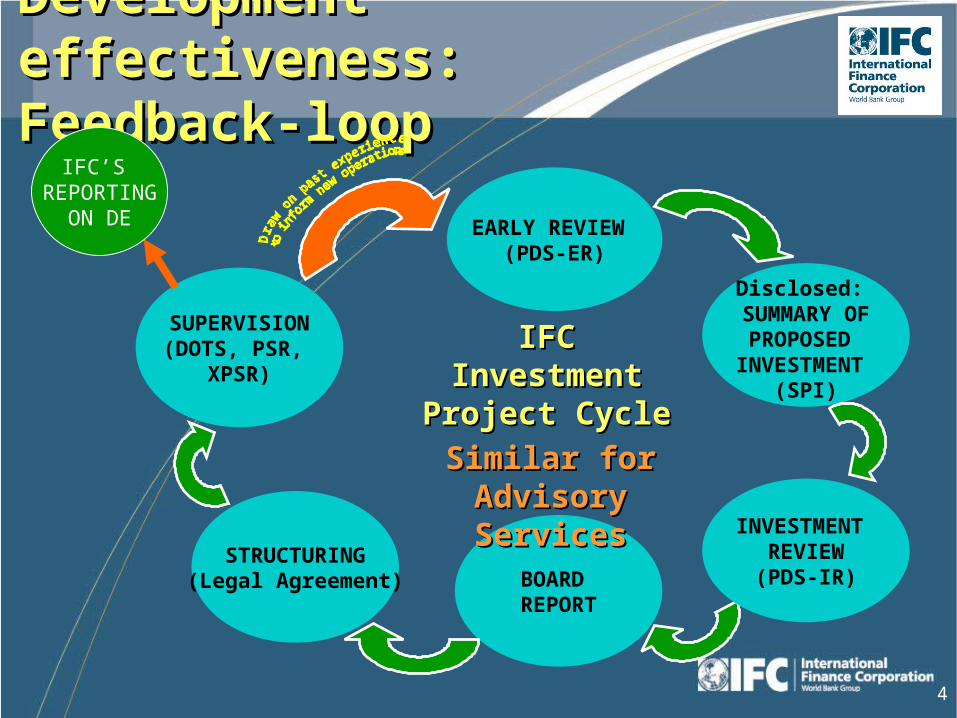
Development effectiveness: Development effectiveness:
Feedback-loopFeedback-loop
EARLY REVIEW (PDS-ER)
BOARD REPORT
STRUCTURING(Legal Agreement)
SUPERVISION(DOTS, PSR,
XPSR)
IFCIFCInvestment Investment
Project CycleProject Cycle
IFC’S REPORTING
ON DE
Disclosed: SUMMARY OFPROPOSED
INVESTMENT (SPI)
INVESTMENT REVIEW(PDS-IR)
Similar for Similar for Advisory Advisory ServicesServices
5
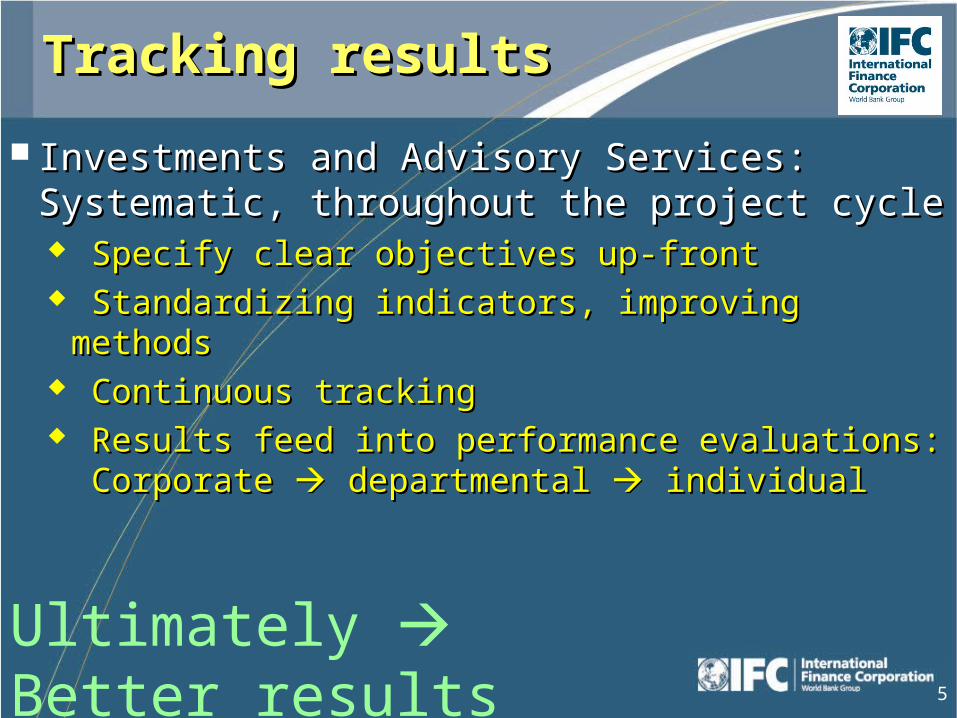
Tracking resultsTracking results
Investments and Advisory Services: Investments and Advisory Services: Systematic, throughout the project cycleSystematic, throughout the project cycle Specify clear objectives up-frontSpecify clear objectives up-front Standardizing indicators, improving methodsStandardizing indicators, improving methods Continuous trackingContinuous tracking Results feed into performance evaluations:Results feed into performance evaluations:
Corporate Corporate departmental departmental individual individual
Ultimately Better results

6
Hierarchy of measuresHierarchy of measures
Funds disbursed
Reach
Before-after
Market test or control group (with vs. w/o)
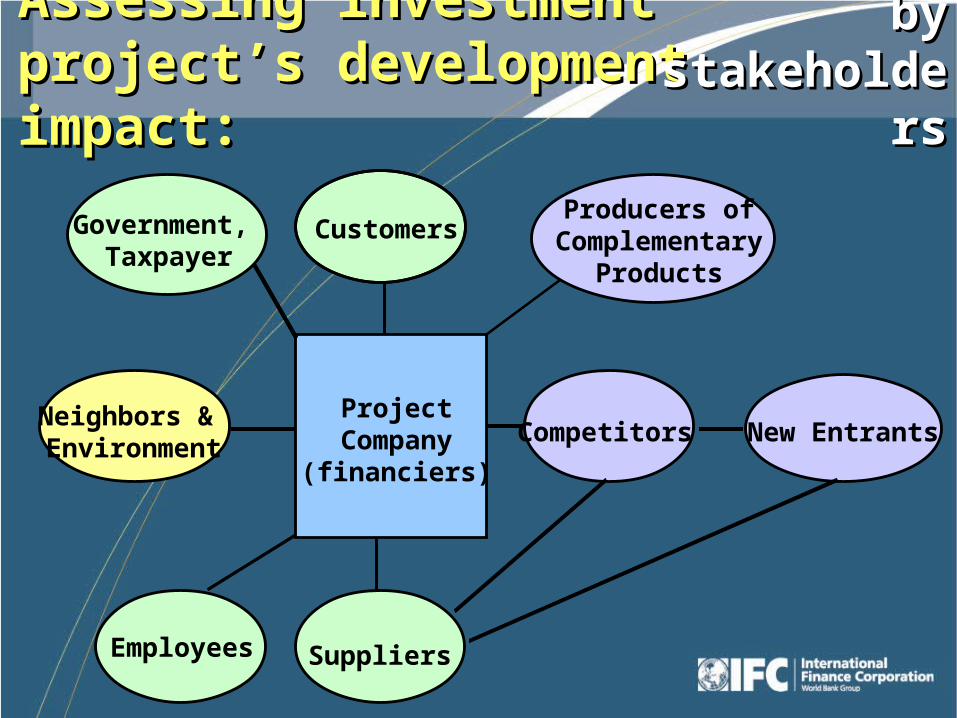
Assessing investment project’s Assessing investment project’s development impact:development impact:
Employees
Customers
Competitors
Producers ofComplementary
Products
Government, Taxpayer
Neighbors & Environment
New EntrantsProject
Company(financiers)
Suppliers
by by stakeholdersstakeholders
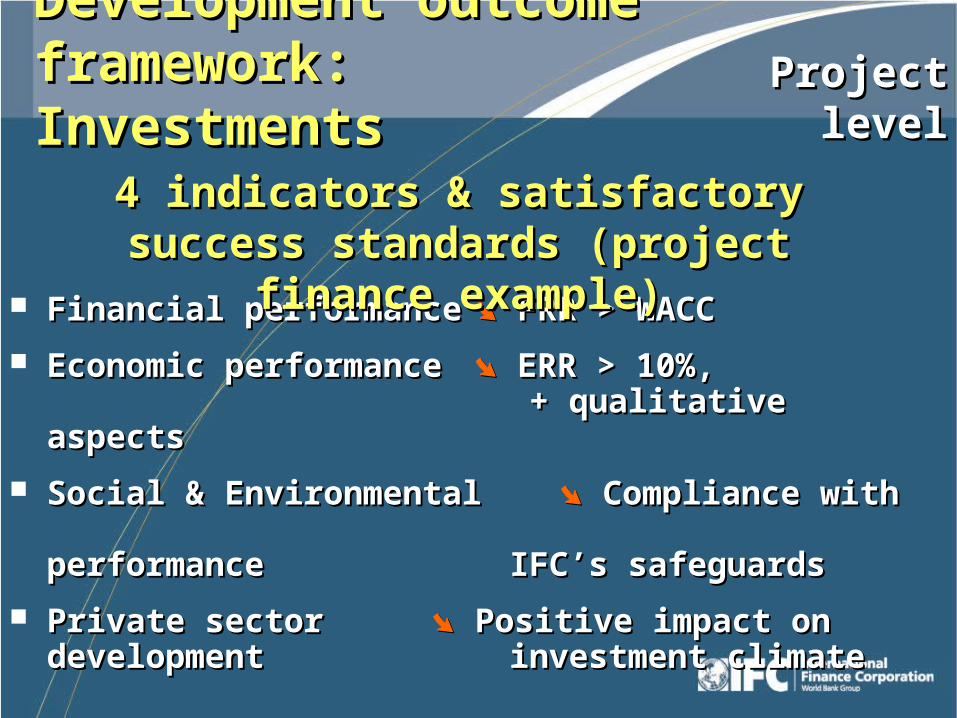
Development outcome Development outcome framework: Investmentsframework: Investments
Financial performanceFinancial performance FRR > WACCFRR > WACC
Economic performanceEconomic performance ERR > 10%, ERR > 10%, + qualitative + qualitative
aspectsaspects
Social & EnvironmentalSocial & Environmental Compliance with Compliance with performanceperformance IFC’s safeguards IFC’s safeguards
Private sector Private sector Positive impact on Positive impact on development development investment climate investment climate
4 indicators & satisfactory success standards 4 indicators & satisfactory success standards (project finance example)(project finance example)
Project Project levellevel
9
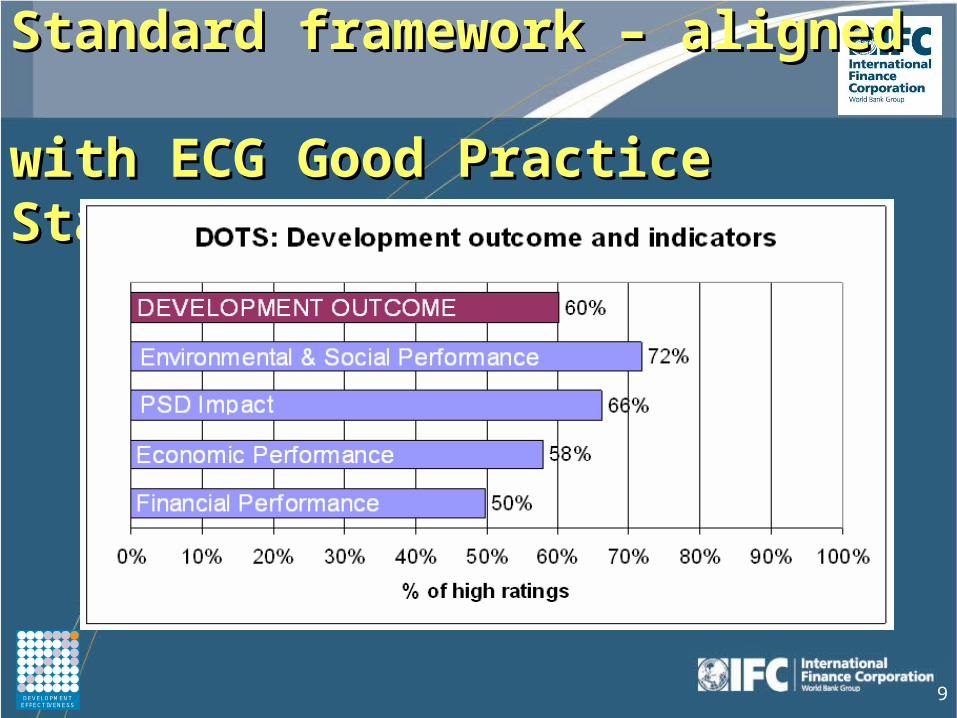
Measures for investments: Measures for investments: Standard framework – aligned Standard framework – aligned with ECG Good Practice Standardswith ECG Good Practice Standards
DEVELOPMENTEFFECTIVENESSDEVELOPMENT
EFFECTIVENESS
10
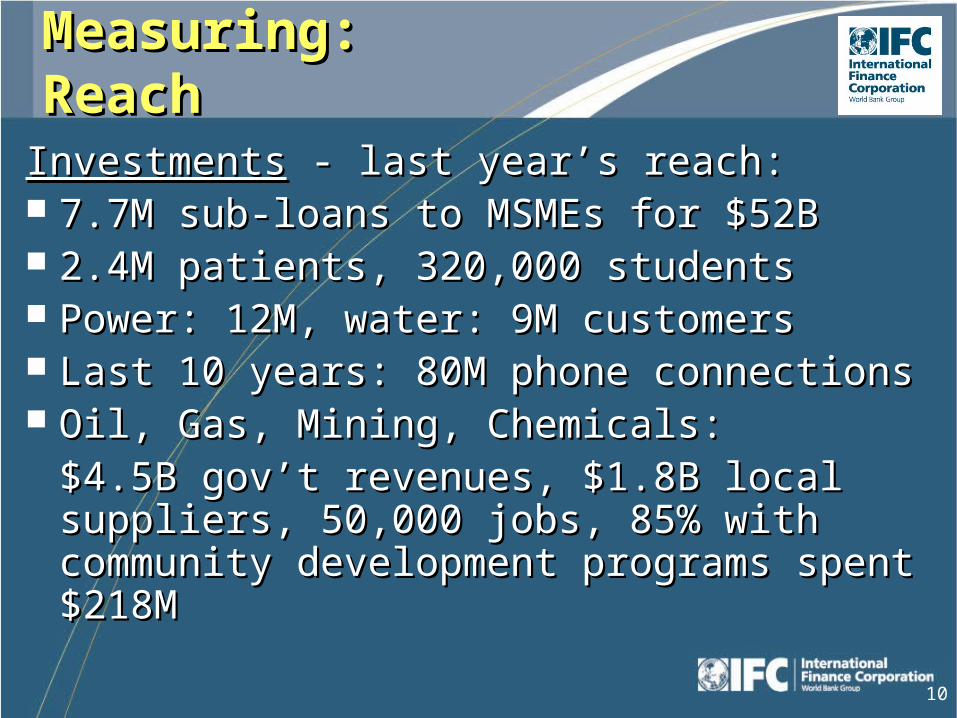
Measuring: Measuring: ReachReach
InvestmentsInvestments - last year’s reach: - last year’s reach: 7.7M sub-loans to MSMEs for $52B7.7M sub-loans to MSMEs for $52B 2.4M patients, 320,000 students2.4M patients, 320,000 students Power: 12M, water: 9M customersPower: 12M, water: 9M customers Last 10 years: 80M phone connectionsLast 10 years: 80M phone connections Oil, Gas, Mining, Chemicals:Oil, Gas, Mining, Chemicals:
$4.5B gov’t revenues, $1.8B local suppliers, $4.5B gov’t revenues, $1.8B local suppliers, 50,000 jobs, 85% with community 50,000 jobs, 85% with community development programs spent $218Mdevelopment programs spent $218M
11
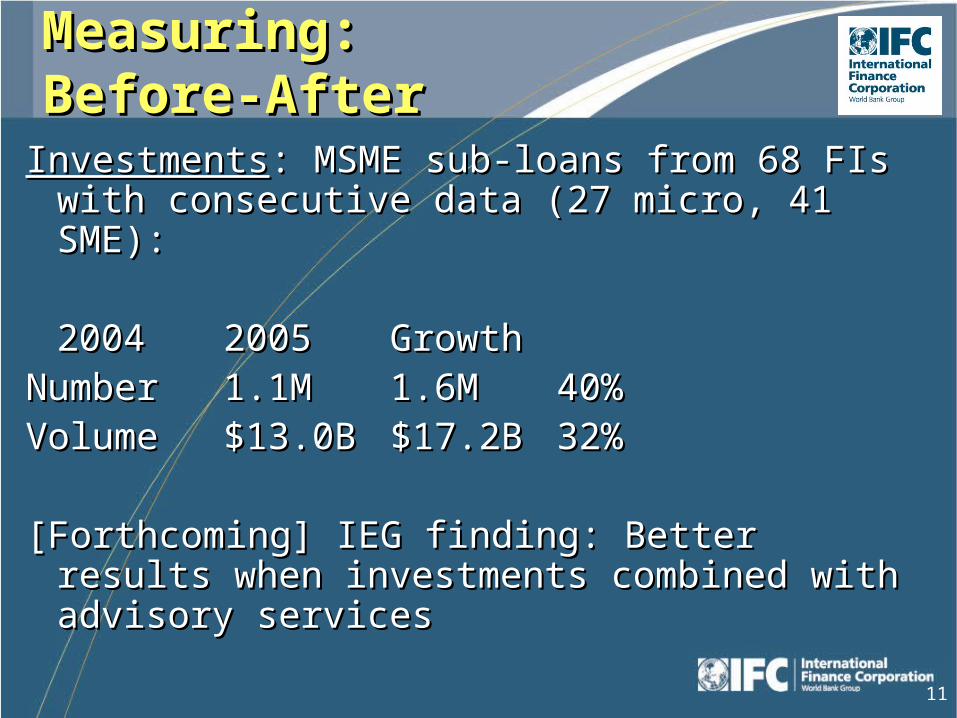
Measuring: Measuring: Before-AfterBefore-After
InvestmentsInvestments: MSME sub-loans from 68 FIs : MSME sub-loans from 68 FIs with consecutive data (27 micro, 41 SME):with consecutive data (27 micro, 41 SME):
20042004 20052005 GrowthGrowthNumberNumber 1.1M1.1M 1.6M1.6M 40%40%VolumeVolume $13.0B$13.0B $17.2B$17.2B 32%32%
[Forthcoming] IEG finding: Better results when [Forthcoming] IEG finding: Better results when investments combined with advisory servicesinvestments combined with advisory services
12
ChallengesChallenges
ComparisonsComparisons Success ratesSuccess rates Benchmarking institutionsBenchmarking institutions Contemporaneous assessmentContemporaneous assessment AggregationAggregation

13
Challenge: Challenge: ComparisonComparisonWhich institution performs best? Which institution performs best?
Success ratesSuccess rates World Bank: World Bank:
75%75% for “outcome” (now > 80%) for “outcome” (now > 80%)
EBRD: EBRD: 75%75% for “transition impact” (now > 80%) for “transition impact” (now > 80%)57%57% for “overall performance” for “overall performance”
(lower mainly due to financial performance)(lower mainly due to financial performance) IFC:IFC:
Investments:Investments: 60%60% for “development outcome”for “development outcome”
14
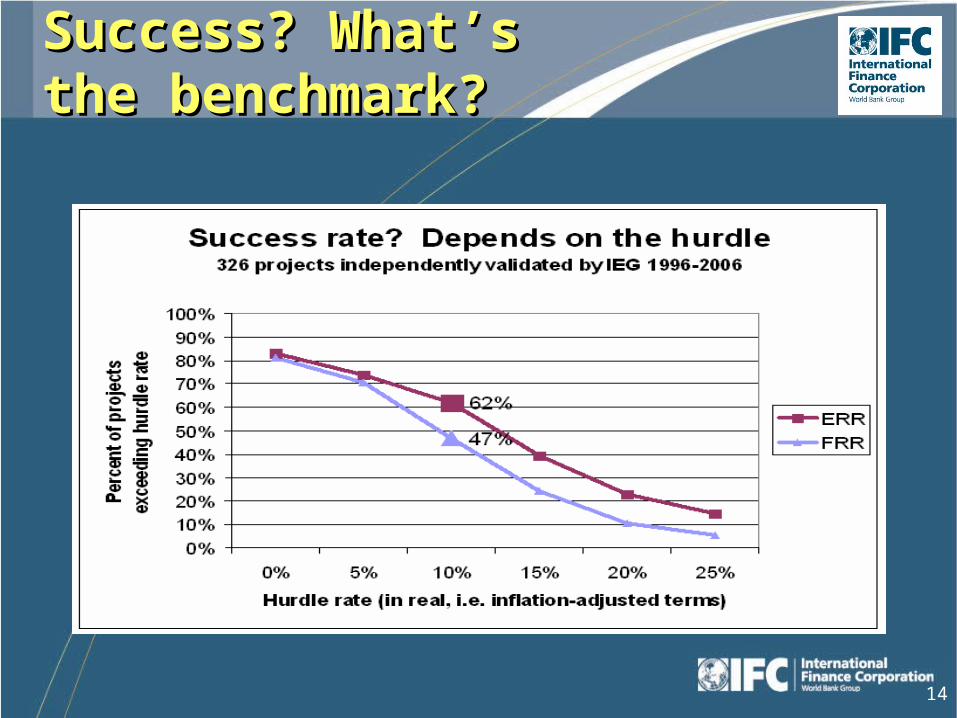
Success? What’s Success? What’s the benchmark?the benchmark?
15
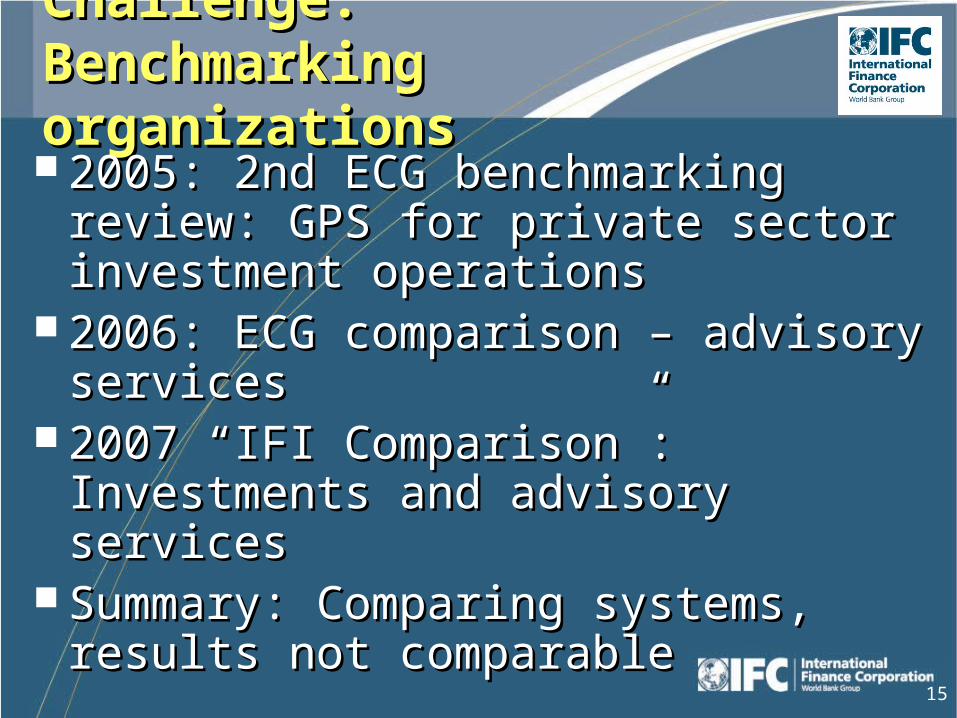
Challenge: Benchmarking Challenge: Benchmarking organizationsorganizations 2005: 2nd ECG benchmarking review: 2005: 2nd ECG benchmarking review:
GPS for private sector investment GPS for private sector investment operationsoperations
2006: ECG comparison – advisory 2006: ECG comparison – advisory servicesservices
2007 “IFI Comparison”: Investments and 2007 “IFI Comparison”: Investments and advisory servicesadvisory services
Summary: Comparing systems, Summary: Comparing systems, results not comparableresults not comparable
16
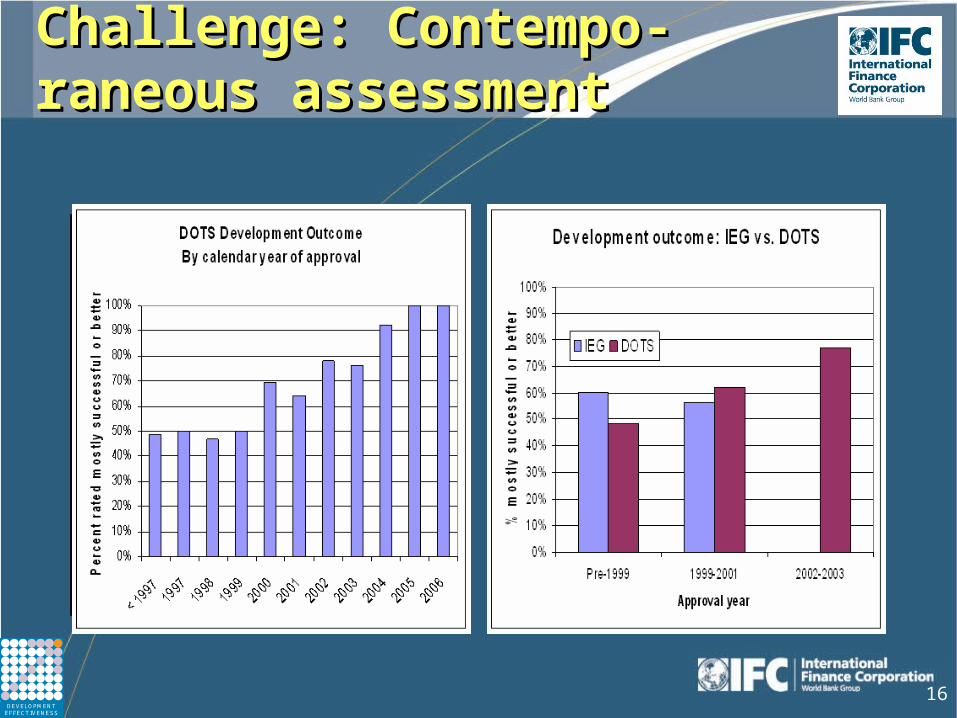
Challenge: Contempo-Challenge: Contempo-raneous assessmentraneous assessment
DEVELOPMENTEFFECTIVENESSDEVELOPMENT
EFFECTIVENESS
EarlyMature Immature
17
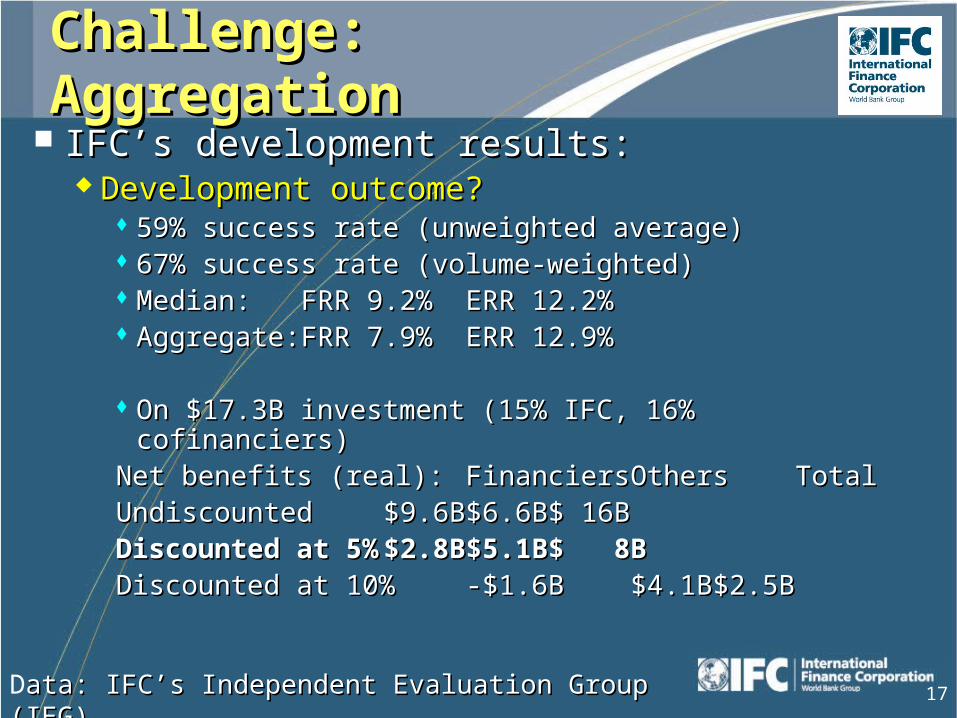
Challenge: Challenge: AggregationAggregation
IFC’s development results:IFC’s development results: Development outcome?Development outcome?
59% success rate (unweighted average)59% success rate (unweighted average) 67% success rate (volume-weighted)67% success rate (volume-weighted) Median: Median: FRR 9.2%FRR 9.2% ERR 12.2%ERR 12.2% Aggregate:Aggregate: FRR 7.9%FRR 7.9% ERR 12.9%ERR 12.9%
On $17.3B investment (15% IFC, 16% cofinanciers)On $17.3B investment (15% IFC, 16% cofinanciers)Net benefits (real):Net benefits (real): FinanciersFinanciers OthersOthers TotalTotalUndiscountedUndiscounted $9.6B$9.6B $6.6B$6.6B $ 16B$ 16BDiscounted at 5%Discounted at 5% $2.8B$2.8B $5.1B$5.1B $ 8B$ 8BDiscounted at 10%Discounted at 10% -$1.6B-$1.6B $4.1B$4.1B $2.5B$2.5B
Data: IFC’s Independent Evaluation Group (IEG)ata: IFC’s Independent Evaluation Group (IEG)
18
Some emerging Some emerging patternspatterns

19
For IFC projects: Close For IFC projects: Close correlation between financial correlation between financial and development resultsand development results
5%
54%
96% 99%
0%
10%
20%
30%
40%
50%
60%
70%
80%
90%
100%
Unsatisfactory PartlyUnsatisfactory
Satisfactory Excellent
Financial Performance Rating
Deve
lopm
ent O
utco
me
Succ
ess
Rate
DEVELOPMENTEFFECTIVENESSDEVELOPMENT
EFFECTIVENESS
20
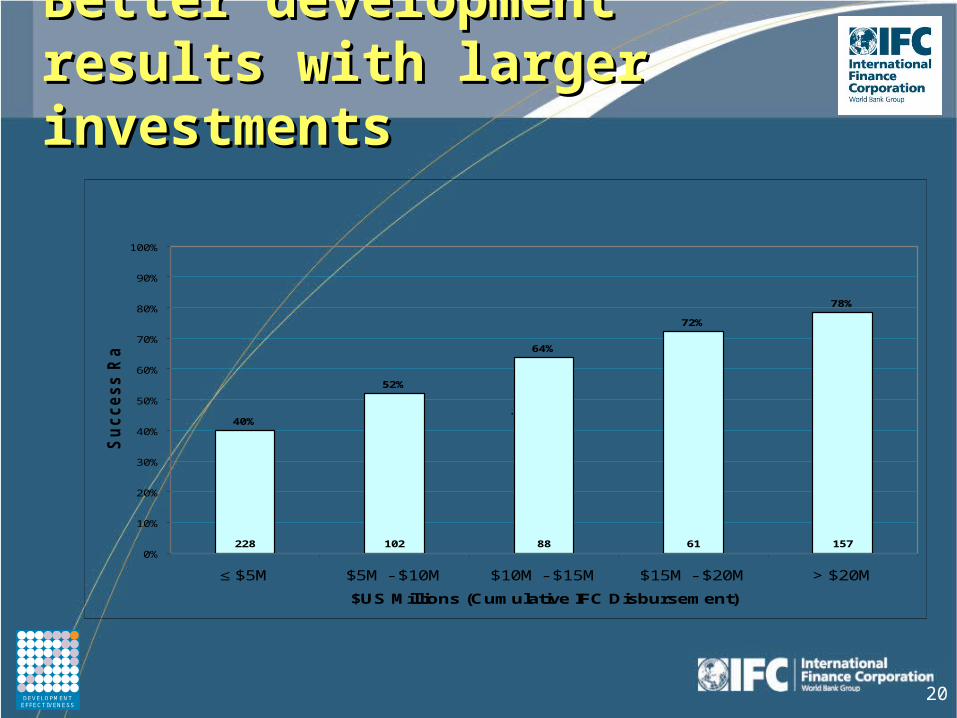
Better development results Better development results with larger investmentswith larger investments
40%
52%
64%
72%
78%
228 102 88 61 1570%
10%
20%
30%
40%
50%
60%
70%
80%
90%
100%
≤ $5M $5M - $10M $10M - $15M $15M - $20M > $20M
$US Millions (Cumulative IFC Disbursement)
Su
cc
es
s R
ate
s
.
DEVELOPMENTEFFECTIVENESSDEVELOPMENT
EFFECTIVENESS
21
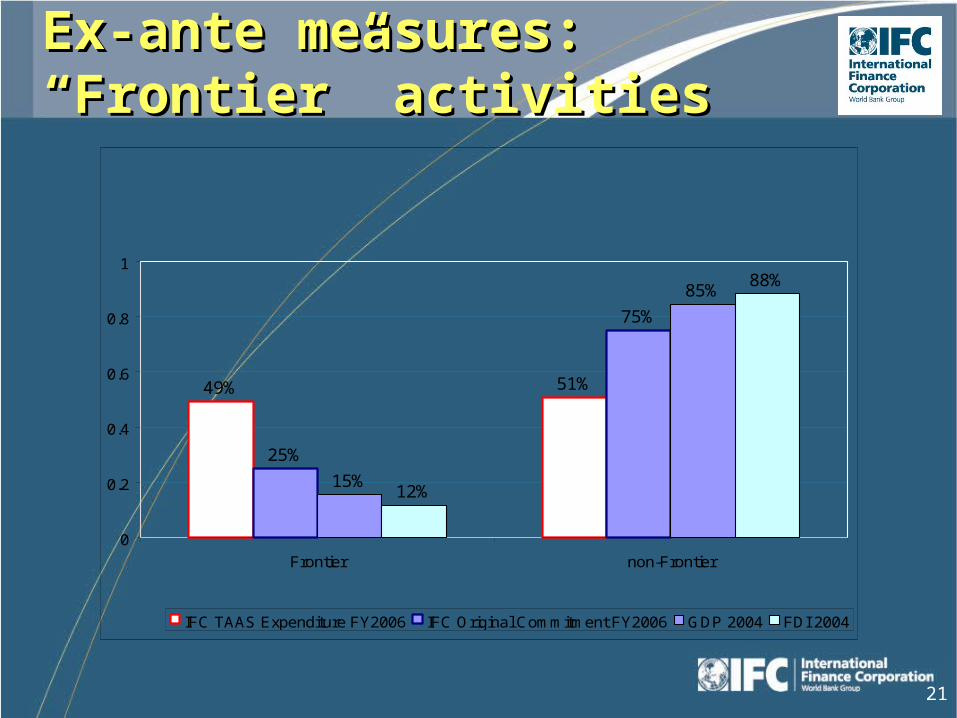
Ex-ante measures: Ex-ante measures: “Frontier” activities“Frontier” activities
49% 51%
25%
75%
15%
85%
12%
88%
0
0.2
0.4
0.6
0.8
1
Frontier non-Frontier
IFC TAAS Expenditure FY2006 IFC Original Commitment FY2006 GDP 2004 FDI 2004
22
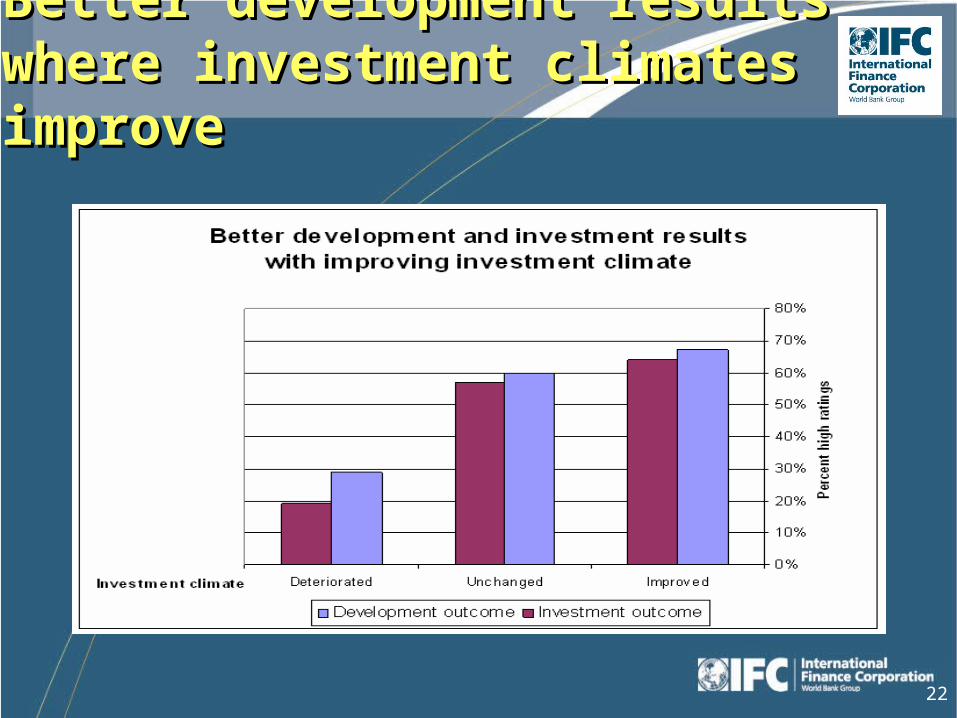
Better development results where Better development results where investment climates improveinvestment climates improve
23
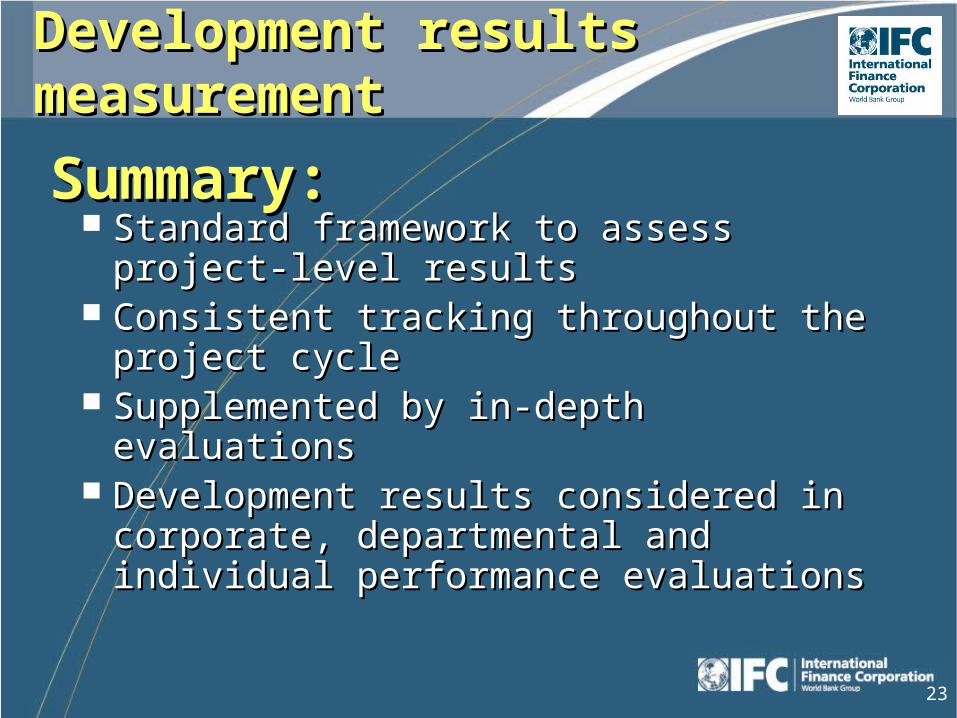
Development results Development results measurementmeasurement
Standard framework to assess project-Standard framework to assess project-level resultslevel results
Consistent tracking throughout the Consistent tracking throughout the project cycleproject cycle
Supplemented by in-depth evaluationsSupplemented by in-depth evaluations Development results considered in Development results considered in
corporate, departmental and individual corporate, departmental and individual performance evaluationsperformance evaluations
Summary:Summary: