Embed Size (px)
Citation preview
February 2, 2009
Measuring Rurality - RIO2008_BASIC: Methodology and Results
Boris Kralj, PhD Executive Director, Economics & Chief Economist
OMA Economics Department
- 1 -
Introduction and Background The Rurality Index for Ontario (RIO) was originally developed in 1999-2000, a full report outlining the methodology and results can be found in Kralj (2000)1. The RIO measure was a response to the need for a continuous and broader measure of rurality, than was available, for policy development purposes. In particular, policies and incentives aimed at physician recruitment and retention. This original methodology was refreshed using the most recently available data in 2004, resulting in the release of the RIO2004 measure. Since 2000, the use of RIO has grown and currently a wide variety of MOHLTC and OMA administered programs use it for determining incentive and/or bonus payment levels. Included are the following programs: Rural Medicine Investment Program, Underserviced Area Program, Locum Program, CME Program, Rural and Northern Physician Group Agreement (RNPGA), Hospital On-Call Program (HOCC), Primary Care: rurality gradient for FHN and harmonized models and hospital premium for rural FHN and harmonized models. Finally, it is OMA policy that RIO be employed as a tool for scaling incentive structures. Given the wide and growing use of RIO and the availability of more recent information (i.e., Census of Canada, municipal amalgamations/boundaries), the OMA Board of Directors recommended a review of RIO in the summer of 2007. The bilateral Physician Human Resources Committee (PHRC) was given this task and proceeded to strike a working group to carry out the task. The RIO Review Working Group met between October 2007 and January 2008 to conduct the review. The product of the review was the construction of a new measure of rurality, a new rurality index for Ontario (RIO) – RIO2008_BASIC. The use of this new measure has been supported by both the OMA and the MOHLTC.
1 Kralj, Boris (2000). “Measuring ‘rurality’ for purposes of health-care planning: an empirical measure for Ontario”. Ontario Medical Review. October 2000.
- 2 -
Components of RIO2008_BASIC The new RIO, RIO2008_BASIC, consists of three broad components as follows: RIO2008_BASIC = POP+TIMEa+TIMEb
Where, POP = Measure of community population and population density. TIMEb = Measure of travel time to nearest basic referral centre. TIMEa = Measure of travel time to nearest advanced referral centre. The implicit weights or influence of each component is as follows: POP = 28.6 percent; TIMEb = 47.6 percent; TIMEa = 23.8 percent This specification represents a measure that is analogous to earlier measures given that it is determined almost solely by geographic factors - distances/travel times. Hence, this measure is expected to remain quite stable or fixed over time. The exact empirical specification for each of these factors is presented in Appendix 1. We see that, as was the case with the original RIO, most factors are a relative measure to the provincial median. A brief overview of each of the components is provided below. POP The availability of many health services is positively or directly related to the size of the population. Also, it is a fact that rural areas are less densely populated than urban areas. As a result rural GP’s may have to travel longer distances for house calls or may have responsibility for satellite clinics at large distances from their home community. This component of the RIO awards points, in a linear fashion, to communities with a population lower than 45,000 persons. An additional 5 points can be awarded to communities based on their population density or dispersion relative to the provincial median population density. All population data and population density figures are for 2006 and provided by Statistics Canada. TIMEa and TIMEb Distance to referral centres is an important element which impacts scope of medical practice, levels of responsibility and on-call, as well as professional and social isolation of practitioners and their families. Issues of transportation and travel times may have particular importance in rural areas. Typically, rural residents have greater transportation difficulties and often travel longer distances to receive health care. Lack
- 3 -
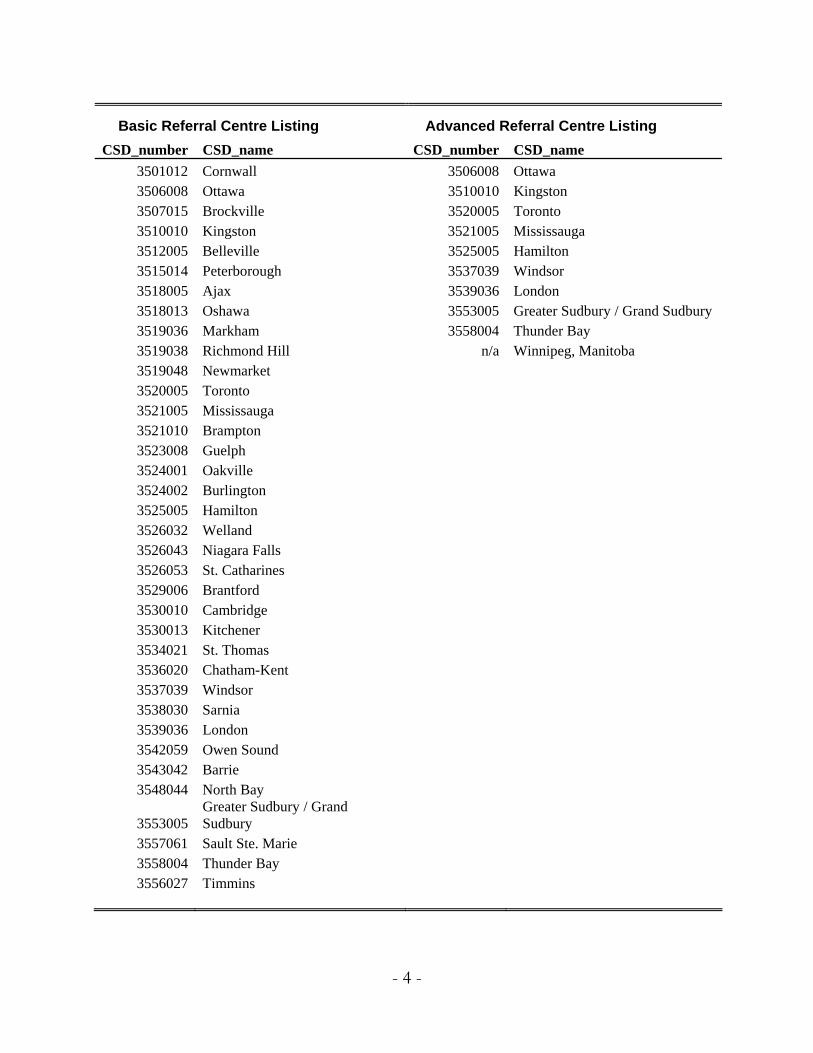
of adequate public transportation in rural areas also creates a barrier to receiving care. The transportation system available to a community determines its degree of isolation. Rural areas served by high-quality transportation corridors will typically have better access to health services. A well-developed road/highway system creates access for patients to local services and facilitates a referral system that links clinics to hospitals, and small hospitals to larger, tertiary care centres. Basic referral centre is a minimum of Level 2 referral centre as defined by the Provincial Coordinating Committee on Community and Academic Health Science Centre Relations (PCCCAR) [“An Interim Guide for Physician Resource Planning in Ontario”,October 1996, page 5-6]. That is a centre with a population greater than 10,000 with the following specialty services; GP/FP, Anaesthesia, Diagnostic Radiology, General Internal Medicine, General Surgery, Obs/Gyno, Orthopaedic Surgery, Paediatrics, and Psychiatry. Advanced referral centre is a minimum of Level 4 referral centre as defined by PCCCAR. Additionally, Winnipeg, Manitoba was included as an advanced referral centre based on input from the OMA Section of Rural Practice. A full listing of basic and advanced referral centres is provided in the table on the following page. Travel times, measured in minutes, were calculated using RouteView (routing and catchment analysis software), based on the quickest route via roads and highways. Routes originated and terminated at the centroid of the CSD. RouteView accounts for four different classes of road, and hence travel speeds. These are; (i) major road with default speed of 60 km/hr, (ii) regional road with default speed of 75 km/hr, (iii) highway with default speed of 90 km/hr, and (iv) expressway with default speed of 100 km/hr. When one combines these travel speeds with travel distances, the travel time measure is arrived at.
- 4 -
Basic Referral Centre Listing Advanced Referral Centre Listing CSD_number CSD_name CSD_number CSD_name
3501012 Cornwall 3506008 Ottawa 3506008 Ottawa 3510010 Kingston 3507015 Brockville 3520005 Toronto 3510010 Kingston 3521005 Mississauga 3512005 Belleville 3525005 Hamilton 3515014 Peterborough 3537039 Windsor 3518005 Ajax 3539036 London 3518013 Oshawa 3553005 Greater Sudbury / Grand Sudbury 3519036 Markham 3558004 Thunder Bay 3519038 Richmond Hill n/a Winnipeg, Manitoba 3519048 Newmarket 3520005 Toronto 3521005 Mississauga 3521010 Brampton 3523008 Guelph 3524001 Oakville 3524002 Burlington 3525005 Hamilton 3526032 Welland 3526043 Niagara Falls 3526053 St. Catharines 3529006 Brantford 3530010 Cambridge 3530013 Kitchener 3534021 St. Thomas 3536020 Chatham-Kent 3537039 Windsor 3538030 Sarnia 3539036 London 3542059 Owen Sound 3543042 Barrie 3548044 North Bay
3553005 Greater Sudbury / Grand Sudbury
3557061 Sault Ste. Marie 3558004 Thunder Bay 3556027 Timmins
- 5 -
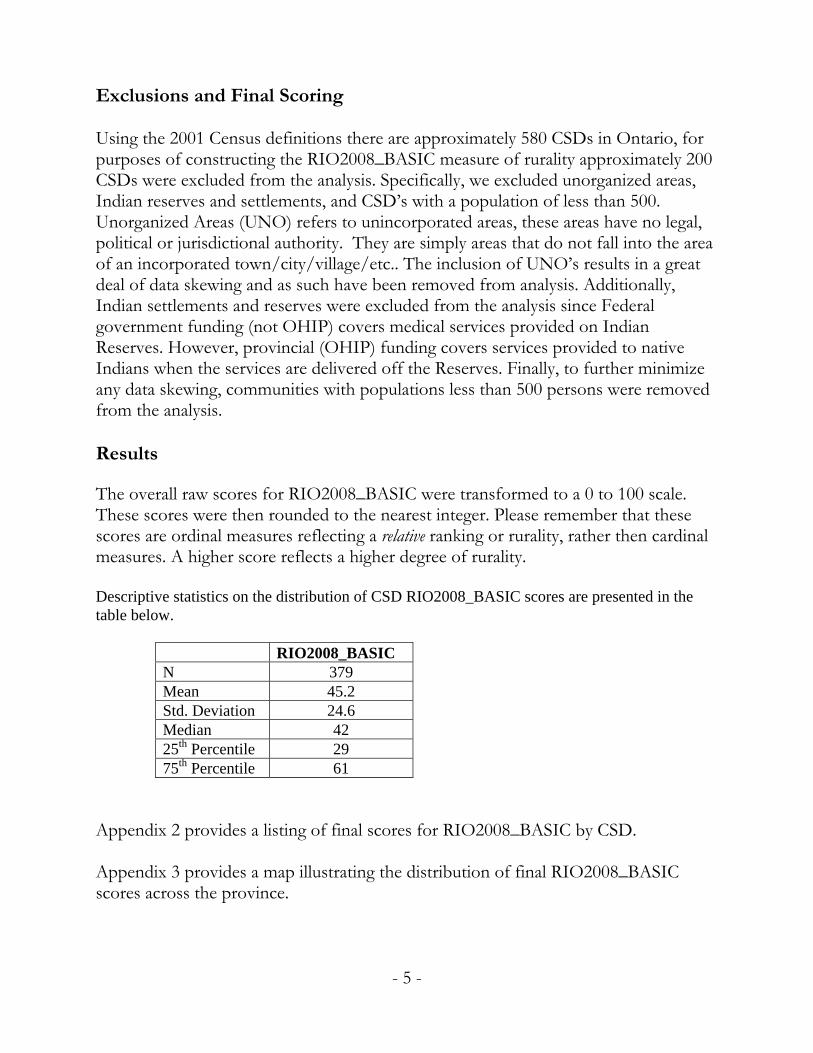
Exclusions and Final Scoring Using the 2001 Census definitions there are approximately 580 CSDs in Ontario, for purposes of constructing the RIO2008_BASIC measure of rurality approximately 200 CSDs were excluded from the analysis. Specifically, we excluded unorganized areas, Indian reserves and settlements, and CSD’s with a population of less than 500. Unorganized Areas (UNO) refers to unincorporated areas, these areas have no legal, political or jurisdictional authority. They are simply areas that do not fall into the area of an incorporated town/city/village/etc.. The inclusion of UNO’s results in a great deal of data skewing and as such have been removed from analysis. Additionally, Indian settlements and reserves were excluded from the analysis since Federal government funding (not OHIP) covers medical services provided on Indian Reserves. However, provincial (OHIP) funding covers services provided to native Indians when the services are delivered off the Reserves. Finally, to further minimize any data skewing, communities with populations less than 500 persons were removed from the analysis. Results The overall raw scores for RIO2008_BASIC were transformed to a 0 to 100 scale. These scores were then rounded to the nearest integer. Please remember that these scores are ordinal measures reflecting a relative ranking or rurality, rather then cardinal measures. A higher score reflects a higher degree of rurality. Descriptive statistics on the distribution of CSD RIO2008_BASIC scores are presented in the table below.
RIO2008_BASIC N 379 Mean 45.2 Std. Deviation 24.6 Median 42 25th Percentile 29 75th Percentile 61
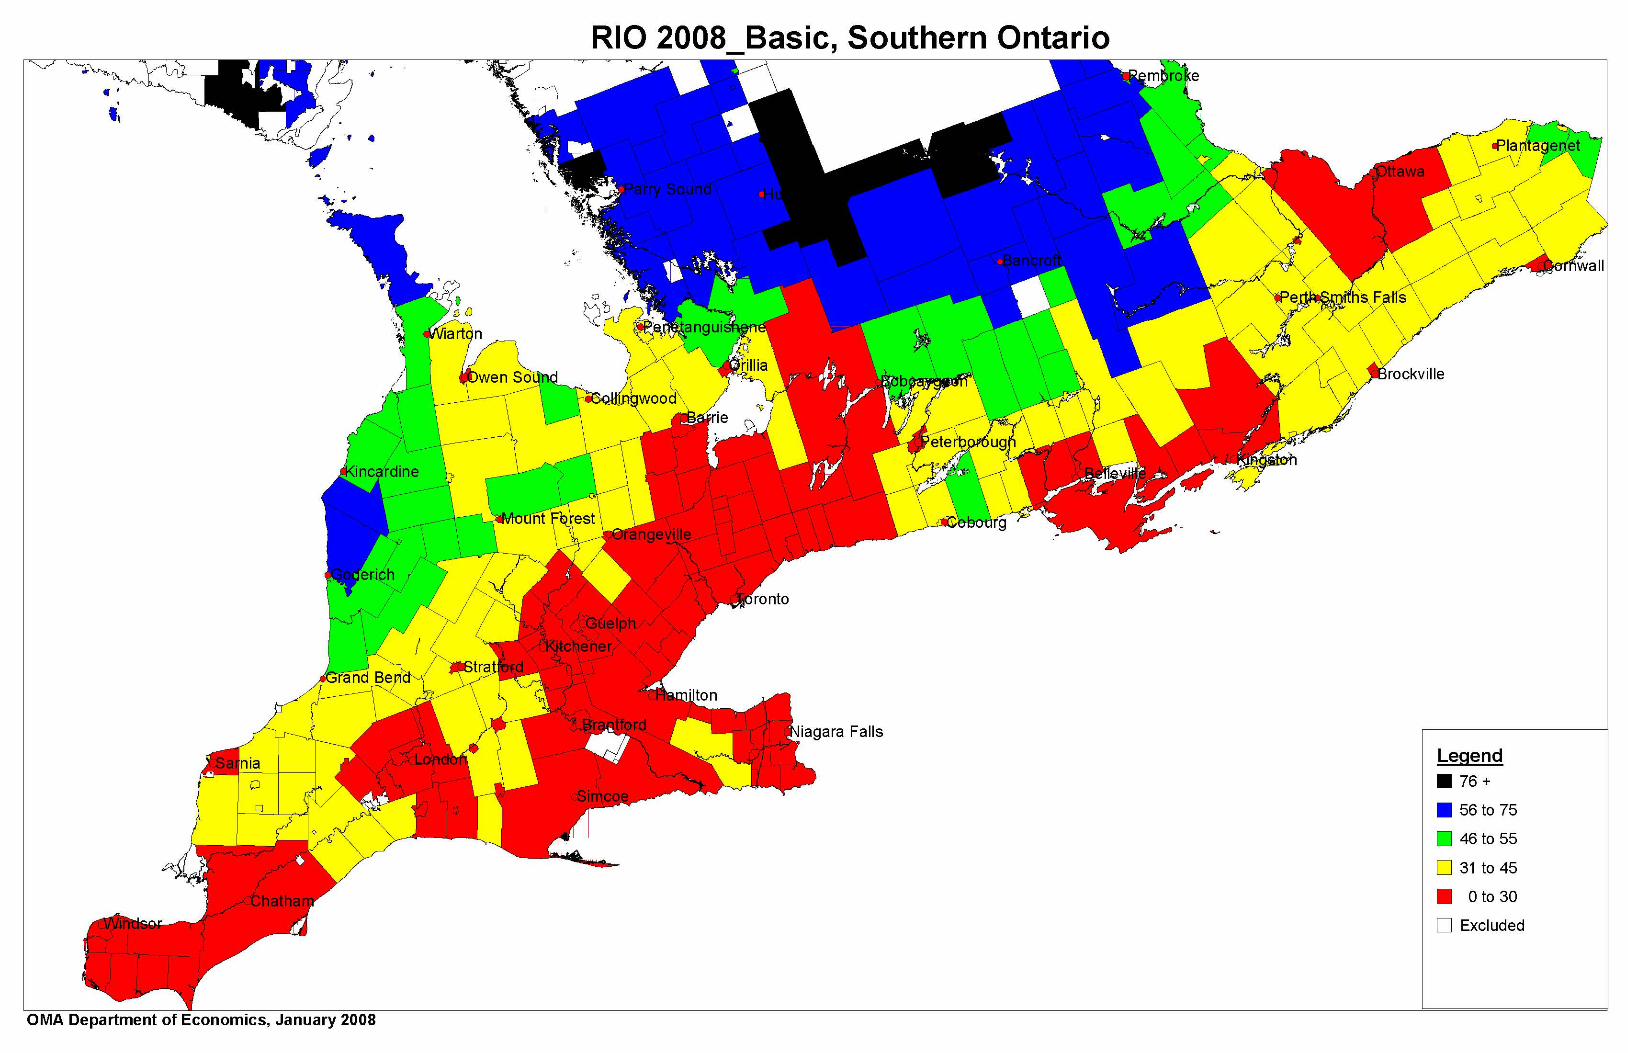
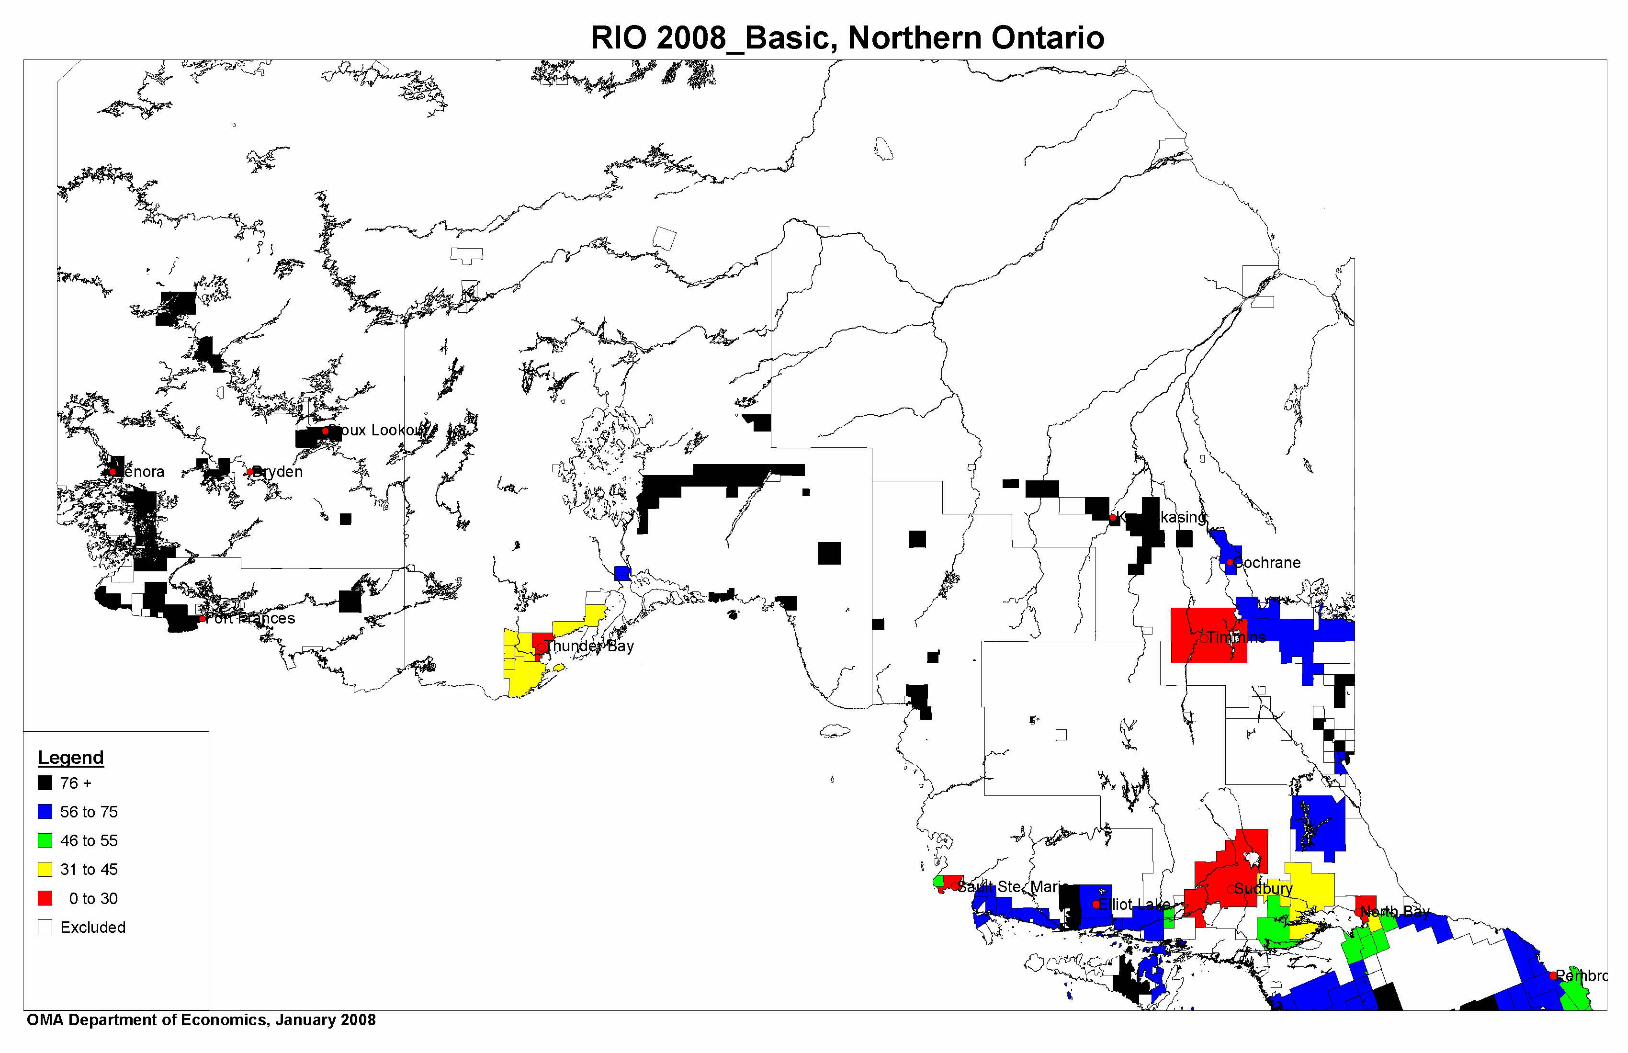
Appendix 2 provides a listing of final scores for RIO2008_BASIC by CSD. Appendix 3 provides a map illustrating the distribution of final RIO2008_BASIC scores across the province.
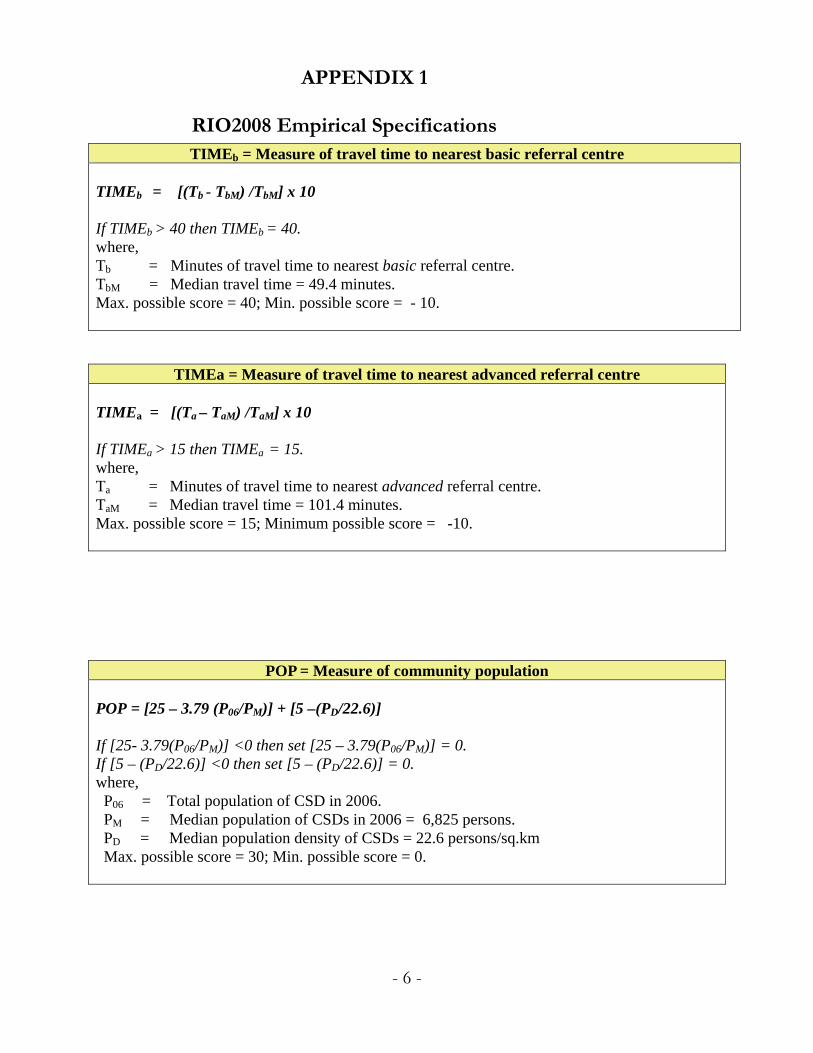
APPENDIX 1 RIO2008 Empirical Specifications TIMEb = Measure of travel time to nearest basic referral centre TIMEb = [(Tb - TbM) /TbM] x 10 If TIMEb > 40 then TIMEb = 40.
where, Tb = Minutes of travel time to nearest basic referral centre. TbM = Median travel time = 49.4 minutes. Max. possible score = 40; Min. possible score = - 10.
TIMEa = Measure of travel time to nearest advanced referral centre TIMEa = [(Ta – TaM) /TaM] x 10
If TIMEa > 15 then TIMEa = 15. where, Ta = Minutes of travel time to nearest advanced referral centre. TaM = Median travel time = 101.4 minutes. Max. possible score = 15; Minimum possible score = -10.
POP = Measure of community population POP = [25 – 3.79 (P06/PM)] + [5 –(PD/22.6)] If [25- 3.79(P06/PM)] <0 then set [25 – 3.79(P06/PM)] = 0. If [5 – (P
- 6 -
D/22.6)] <0 then set [5 – (PD/22.6)] = 0. where, P06 = Total population of CSD in 2006. P = Median population of CSDs in 2006 = 6,825 persons. M PD = Median population density of CSDs = 22.6 persons/sq.km Max. possible score = 30; Min. possible score = 0.
APPENDIX 2: RIO2008_BASIC listing by CSD
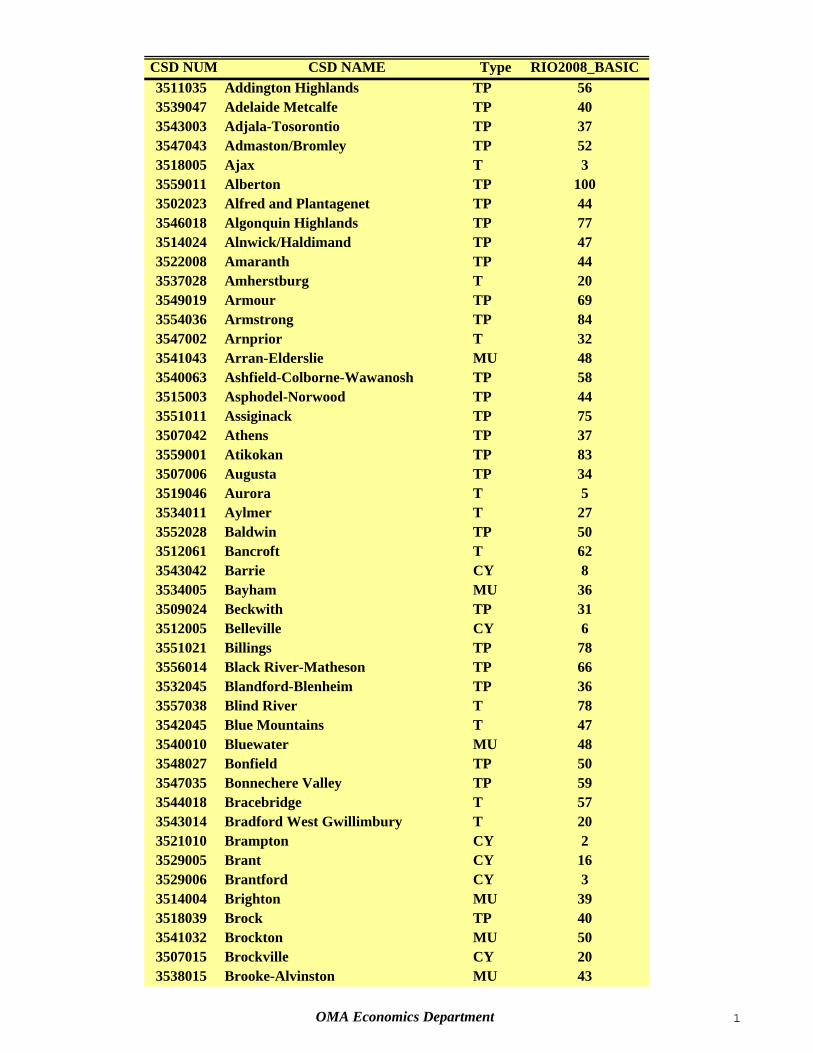
CSD NUM CSD NAME Type RIO2008_BASIC3511035 Addington Highlands TP 563539047 Adelaide Metcalfe TP 403543003 Adjala-Tosorontio TP 373547043 Admaston/Bromley TP 523518005 Ajax T 33559011 Alberton TP 1003502023 Alfred and Plantagenet TP 443546018 Algonquin Highlands TP 773514024 Alnwick/Haldimand TP 473522008 Amaranth TP 443537028 Amherstburg T 203549019 Armour TP 693554036 Armstrong TP 843547002 Arnprior T 323541043 Arran-Elderslie MU 483540063 Ashfield-Colborne-Wawanosh TP 583515003 Asphodel-Norwood TP 443551011 Assiginack TP 753507042 Athens TP 373559001 Atikokan TP 833507006 Augusta TP 343519046 Aurora T 53534011 Aylmer T 273552028 Baldwin TP 503512061 Bancroft T 623543042 Barrie CY 83534005 Bayham MU 363509024 Beckwith TP 313512005 Belleville CY 63551021 Billings TP 783556014 Black River-Matheson TP 663532045 Blandford-Blenheim TP 363557038 Blind River T 783542045 Blue Mountains T 473540010 Bluewater MU 483548027 Bonfield TP 503547035 Bonnechere Valley TP 593544018 Bracebridge T 573543014 Bradford West Gwillimbury T 203521010 Brampton CY 23529005 Brant CY 163529006 Brantford CY 33514004 Brighton MU 393518039 Brock TP 403541032 Brockton MU 503507015 Brockville CY 203538015 Brooke-Alvinston MU 43
OMA Economics Department 1
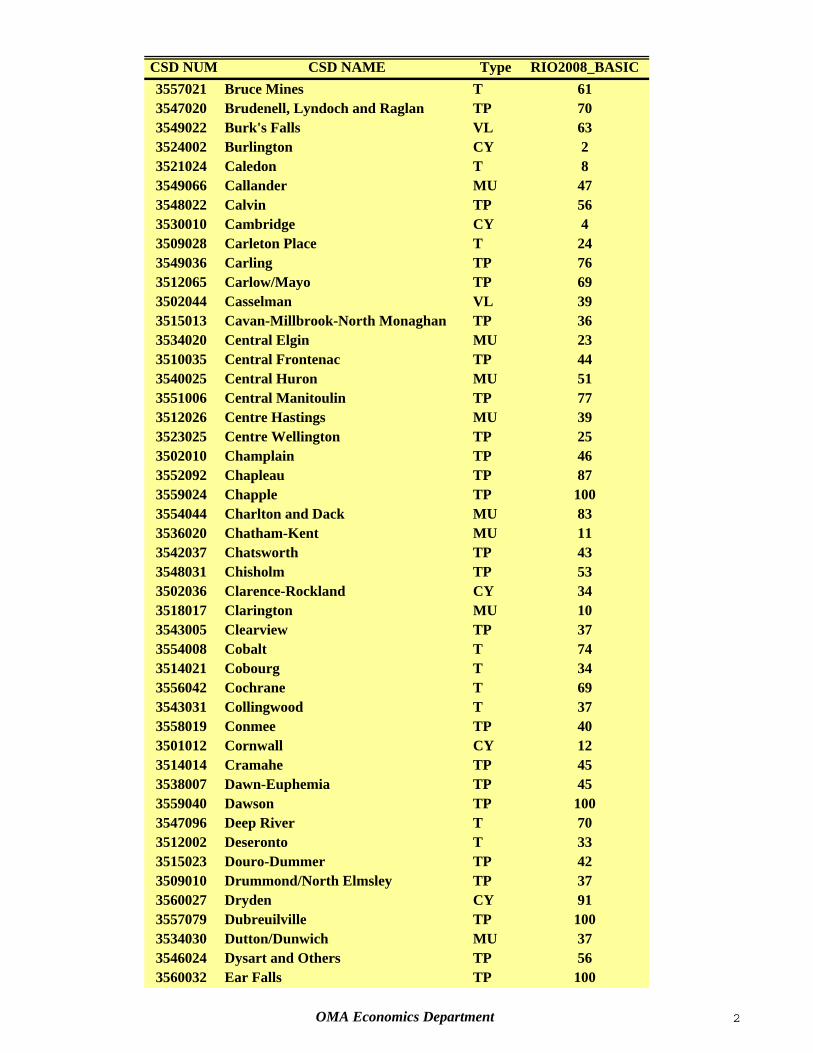
CSD NUM CSD NAME Type RIO2008_BASIC3557021 Bruce Mines T 613547020 Brudenell, Lyndoch and Raglan TP 703549022 Burk's Falls VL 633524002 Burlington CY 23521024 Caledon T 83549066 Callander MU 473548022 Calvin TP 563530010 Cambridge CY 43509028 Carleton Place T 243549036 Carling TP 763512065 Carlow/Mayo TP 693502044 Casselman VL 393515013 Cavan-Millbrook-North Monaghan TP 363534020 Central Elgin MU 233510035 Central Frontenac TP 443540025 Central Huron MU 513551006 Central Manitoulin TP 773512026 Centre Hastings MU 393523025 Centre Wellington TP 253502010 Champlain TP 463552092 Chapleau TP 873559024 Chapple TP 1003554044 Charlton and Dack MU 833536020 Chatham-Kent MU 113542037 Chatsworth TP 433548031 Chisholm TP 533502036 Clarence-Rockland CY 343518017 Clarington MU 103543005 Clearview TP 373554008 Cobalt T 743514021 Cobourg T 343556042 Cochrane T 693543031 Collingwood T 373558019 Conmee TP 403501012 Cornwall CY 123514014 Cramahe TP 453538007 Dawn-Euphemia TP 453559040 Dawson TP 1003547096 Deep River T 703512002 Deseronto T 333515023 Douro-Dummer TP 423509010 Drummond/North Elmsley TP 373560027 Dryden CY 913557079 Dubreuilville TP 1003534030 Dutton/Dunwich MU 373546024 Dysart and Others TP 563560032 Ear Falls TP 100
OMA Economics Department 2
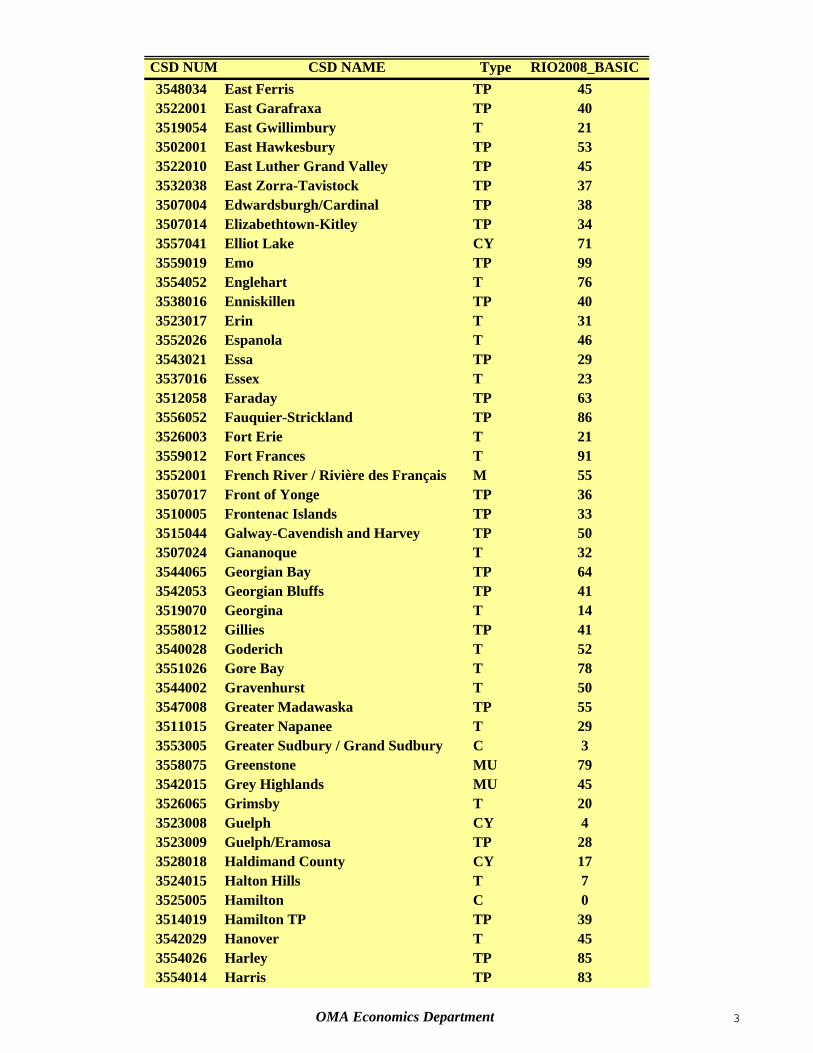
CSD NUM CSD NAME Type RIO2008_BASIC3548034 East Ferris TP 453522001 East Garafraxa TP 403519054 East Gwillimbury T 213502001 East Hawkesbury TP 533522010 East Luther Grand Valley TP 453532038 East Zorra-Tavistock TP 373507004 Edwardsburgh/Cardinal TP 383507014 Elizabethtown-Kitley TP 343557041 Elliot Lake CY 713559019 Emo TP 993554052 Englehart T 763538016 Enniskillen TP 403523017 Erin T 313552026 Espanola T 463543021 Essa TP 293537016 Essex T 233512058 Faraday TP 633556052 Fauquier-Strickland TP 863526003 Fort Erie T 213559012 Fort Frances T 913552001 French River / Rivière des Français M 553507017 Front of Yonge TP 363510005 Frontenac Islands TP 333515044 Galway-Cavendish and Harvey TP 503507024 Gananoque T 323544065 Georgian Bay TP 643542053 Georgian Bluffs TP 413519070 Georgina T 143558012 Gillies TP 413540028 Goderich T 523551026 Gore Bay T 783544002 Gravenhurst T 503547008 Greater Madawaska TP 553511015 Greater Napanee T 293553005 Greater Sudbury / Grand Sudbury C 33558075 Greenstone MU 793542015 Grey Highlands MU 453526065 Grimsby T 203523008 Guelph CY 43523009 Guelph/Eramosa TP 283528018 Haldimand County CY 173524015 Halton Hills T 73525005 Hamilton C 03514019 Hamilton TP TP 393542029 Hanover T 453554026 Harley TP 853554014 Harris TP 83
OMA Economics Department 3
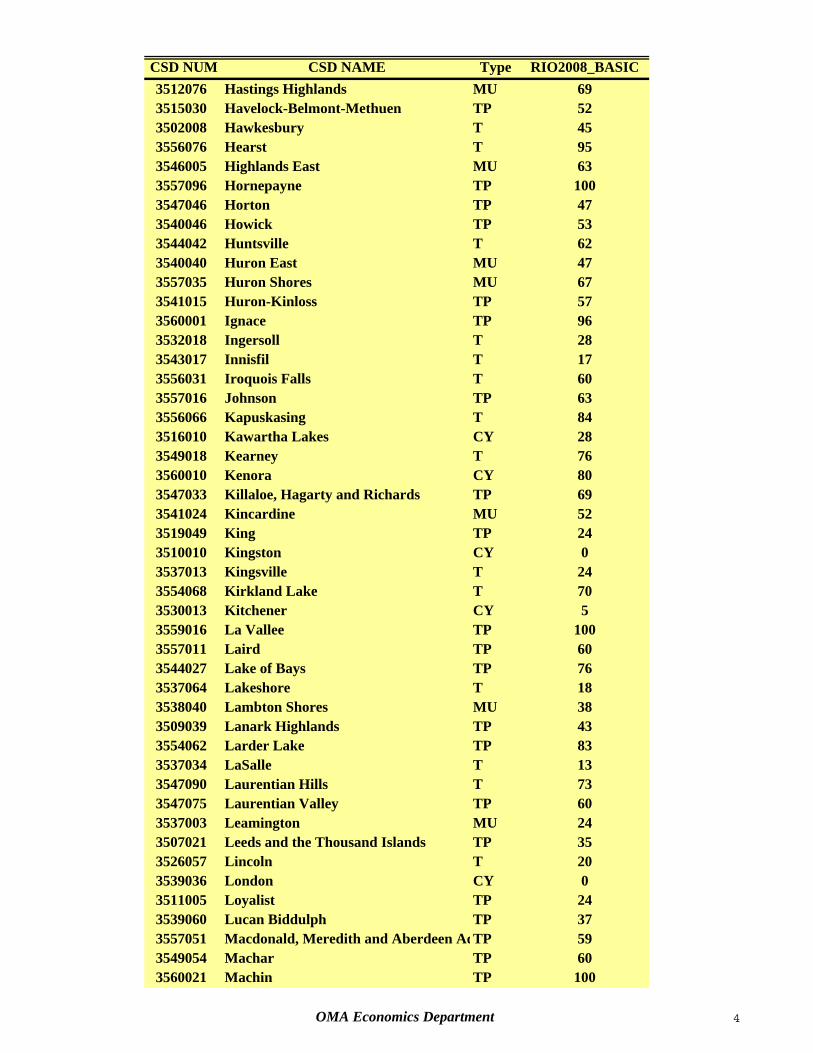
CSD NUM CSD NAME Type RIO2008_BASIC3512076 Hastings Highlands MU 693515030 Havelock-Belmont-Methuen TP 523502008 Hawkesbury T 453556076 Hearst T 953546005 Highlands East MU 633557096 Hornepayne TP 1003547046 Horton TP 473540046 Howick TP 533544042 Huntsville T 623540040 Huron East MU 473557035 Huron Shores MU 673541015 Huron-Kinloss TP 573560001 Ignace TP 963532018 Ingersoll T 283543017 Innisfil T 173556031 Iroquois Falls T 603557016 Johnson TP 633556066 Kapuskasing T 843516010 Kawartha Lakes CY 283549018 Kearney T 763560010 Kenora CY 803547033 Killaloe, Hagarty and Richards TP 693541024 Kincardine MU 523519049 King TP 243510010 Kingston CY 03537013 Kingsville T 243554068 Kirkland Lake T 703530013 Kitchener CY 53559016 La Vallee TP 1003557011 Laird TP 603544027 Lake of Bays TP 763537064 Lakeshore T 183538040 Lambton Shores MU 383509039 Lanark Highlands TP 433554062 Larder Lake TP 833537034 LaSalle T 133547090 Laurentian Hills T 733547075 Laurentian Valley TP 603537003 Leamington MU 243507021 Leeds and the Thousand Islands TP 353526057 Lincoln T 203539036 London CY 03511005 Loyalist TP 243539060 Lucan Biddulph TP 373557051 Macdonald, Meredith and Aberdeen AdTP 593549054 Machar TP 603560021 Machin TP 100
OMA Economics Department 4
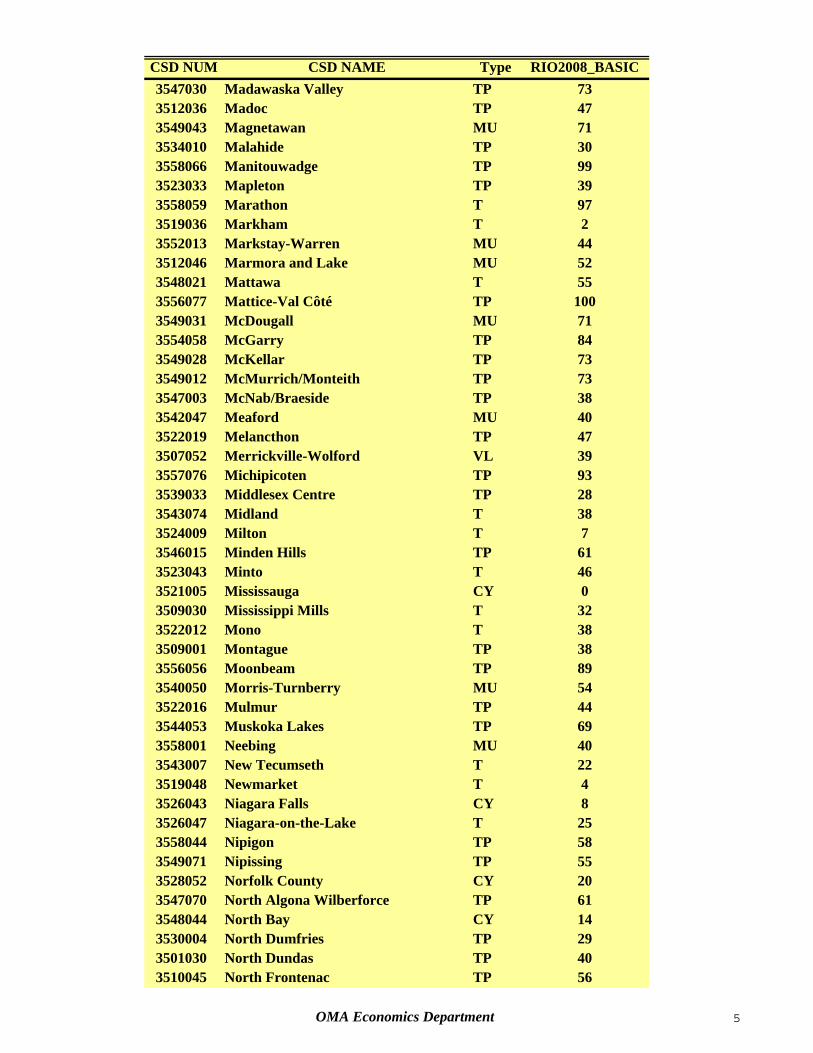
CSD NUM CSD NAME Type RIO2008_BASIC3547030 Madawaska Valley TP 733512036 Madoc TP 473549043 Magnetawan MU 713534010 Malahide TP 303558066 Manitouwadge TP 993523033 Mapleton TP 393558059 Marathon T 973519036 Markham T 23552013 Markstay-Warren MU 443512046 Marmora and Lake MU 523548021 Mattawa T 553556077 Mattice-Val Côté TP 1003549031 McDougall MU 713554058 McGarry TP 843549028 McKellar TP 733549012 McMurrich/Monteith TP 733547003 McNab/Braeside TP 383542047 Meaford MU 403522019 Melancthon TP 473507052 Merrickville-Wolford VL 393557076 Michipicoten TP 933539033 Middlesex Centre TP 283543074 Midland T 383524009 Milton T 73546015 Minden Hills TP 613523043 Minto T 463521005 Mississauga CY 03509030 Mississippi Mills T 323522012 Mono T 383509001 Montague TP 383556056 Moonbeam TP 893540050 Morris-Turnberry MU 543522016 Mulmur TP 443544053 Muskoka Lakes TP 693558001 Neebing MU 403543007 New Tecumseth T 223519048 Newmarket T 43526043 Niagara Falls CY 83526047 Niagara-on-the-Lake T 253558044 Nipigon TP 583549071 Nipissing TP 553528052 Norfolk County CY 203547070 North Algona Wilberforce TP 613548044 North Bay CY 143530004 North Dumfries TP 293501030 North Dundas TP 403510045 North Frontenac TP 56
OMA Economics Department 5
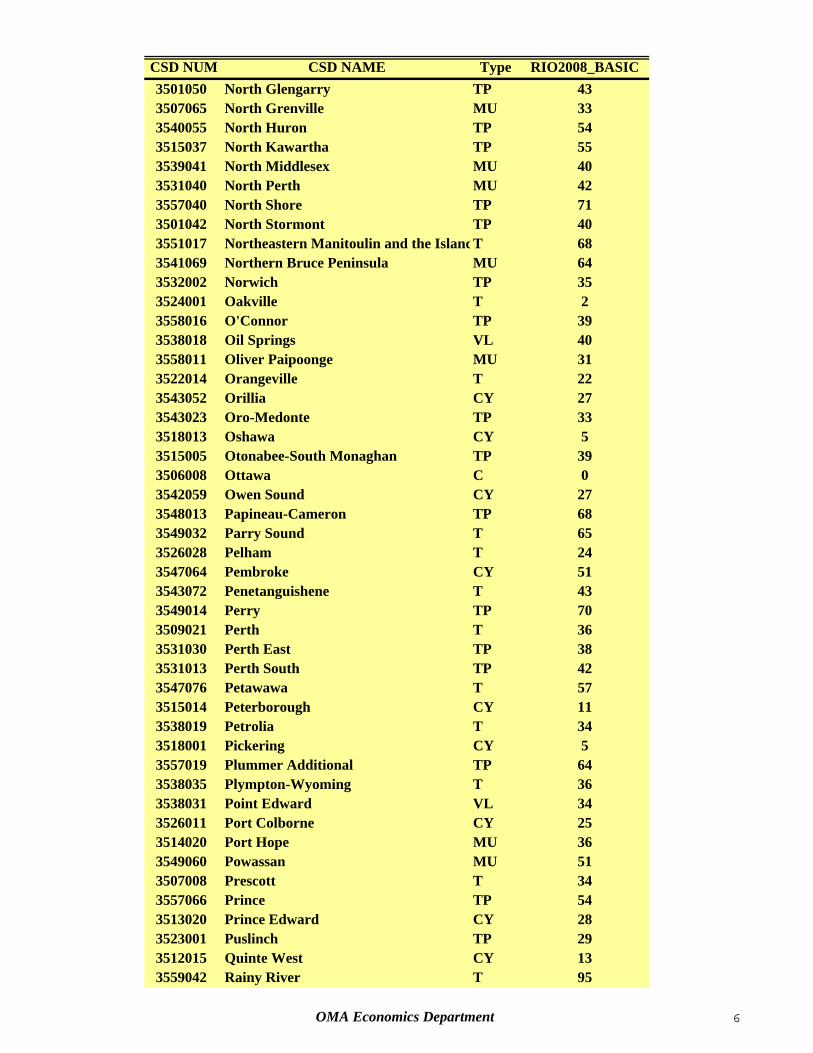
CSD NUM CSD NAME Type RIO2008_BASIC3501050 North Glengarry TP 433507065 North Grenville MU 333540055 North Huron TP 543515037 North Kawartha TP 553539041 North Middlesex MU 403531040 North Perth MU 423557040 North Shore TP 713501042 North Stormont TP 403551017 Northeastern Manitoulin and the IslandT 683541069 Northern Bruce Peninsula MU 643532002 Norwich TP 353524001 Oakville T 23558016 O'Connor TP 393538018 Oil Springs VL 403558011 Oliver Paipoonge MU 313522014 Orangeville T 223543052 Orillia CY 273543023 Oro-Medonte TP 333518013 Oshawa CY 53515005 Otonabee-South Monaghan TP 393506008 Ottawa C 03542059 Owen Sound CY 273548013 Papineau-Cameron TP 683549032 Parry Sound T 653526028 Pelham T 243547064 Pembroke CY 513543072 Penetanguishene T 433549014 Perry TP 703509021 Perth T 363531030 Perth East TP 383531013 Perth South TP 423547076 Petawawa T 573515014 Peterborough CY 113538019 Petrolia T 343518001 Pickering CY 53557019 Plummer Additional TP 643538035 Plympton-Wyoming T 363538031 Point Edward VL 343526011 Port Colborne CY 253514020 Port Hope MU 363549060 Powassan MU 513507008 Prescott T 343557066 Prince TP 543513020 Prince Edward CY 283523001 Puslinch TP 293512015 Quinte West CY 133559042 Rainy River T 95
OMA Economics Department 6
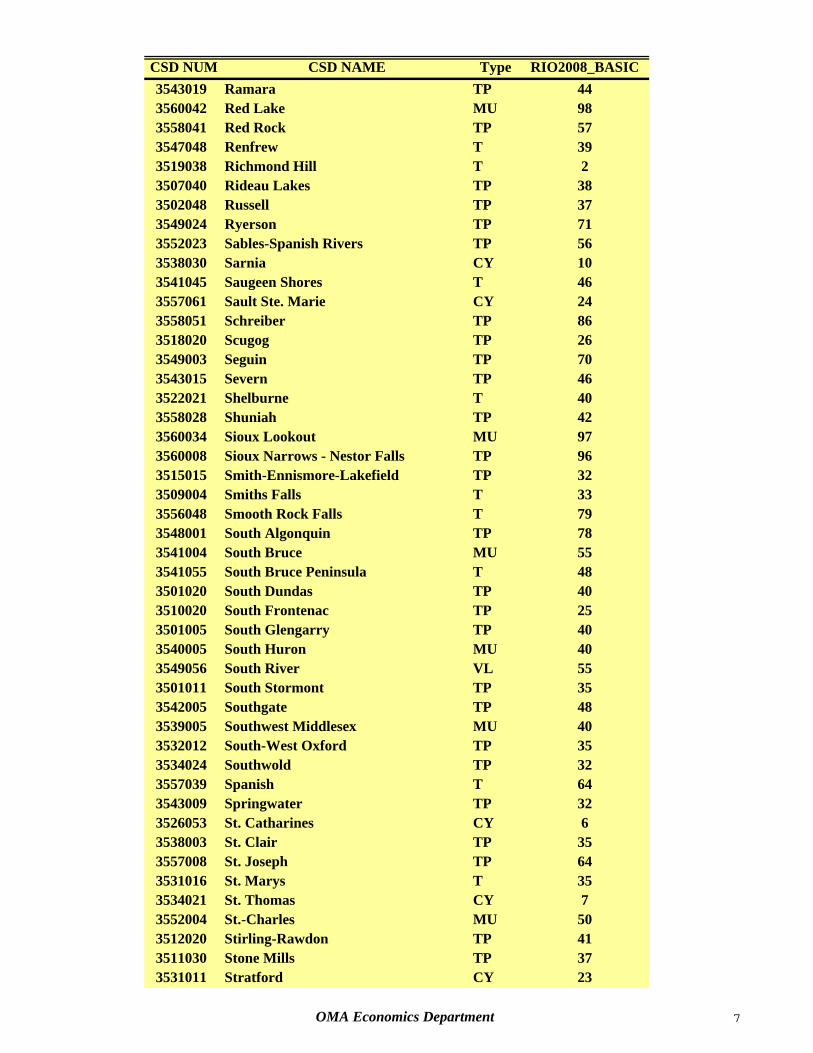
CSD NUM CSD NAME Type RIO2008_BASIC3543019 Ramara TP 443560042 Red Lake MU 983558041 Red Rock TP 573547048 Renfrew T 393519038 Richmond Hill T 23507040 Rideau Lakes TP 383502048 Russell TP 373549024 Ryerson TP 713552023 Sables-Spanish Rivers TP 563538030 Sarnia CY 103541045 Saugeen Shores T 463557061 Sault Ste. Marie CY 243558051 Schreiber TP 863518020 Scugog TP 263549003 Seguin TP 703543015 Severn TP 463522021 Shelburne T 403558028 Shuniah TP 423560034 Sioux Lookout MU 973560008 Sioux Narrows - Nestor Falls TP 963515015 Smith-Ennismore-Lakefield TP 323509004 Smiths Falls T 333556048 Smooth Rock Falls T 793548001 South Algonquin TP 783541004 South Bruce MU 553541055 South Bruce Peninsula T 483501020 South Dundas TP 403510020 South Frontenac TP 253501005 South Glengarry TP 403540005 South Huron MU 403549056 South River VL 553501011 South Stormont TP 353542005 Southgate TP 483539005 Southwest Middlesex MU 403532012 South-West Oxford TP 353534024 Southwold TP 323557039 Spanish T 643543009 Springwater TP 323526053 St. Catharines CY 63538003 St. Clair TP 353557008 St. Joseph TP 643531016 St. Marys T 353534021 St. Thomas CY 73552004 St.-Charles MU 503512020 Stirling-Rawdon TP 413511030 Stone Mills TP 373531011 Stratford CY 23
OMA Economics Department 7
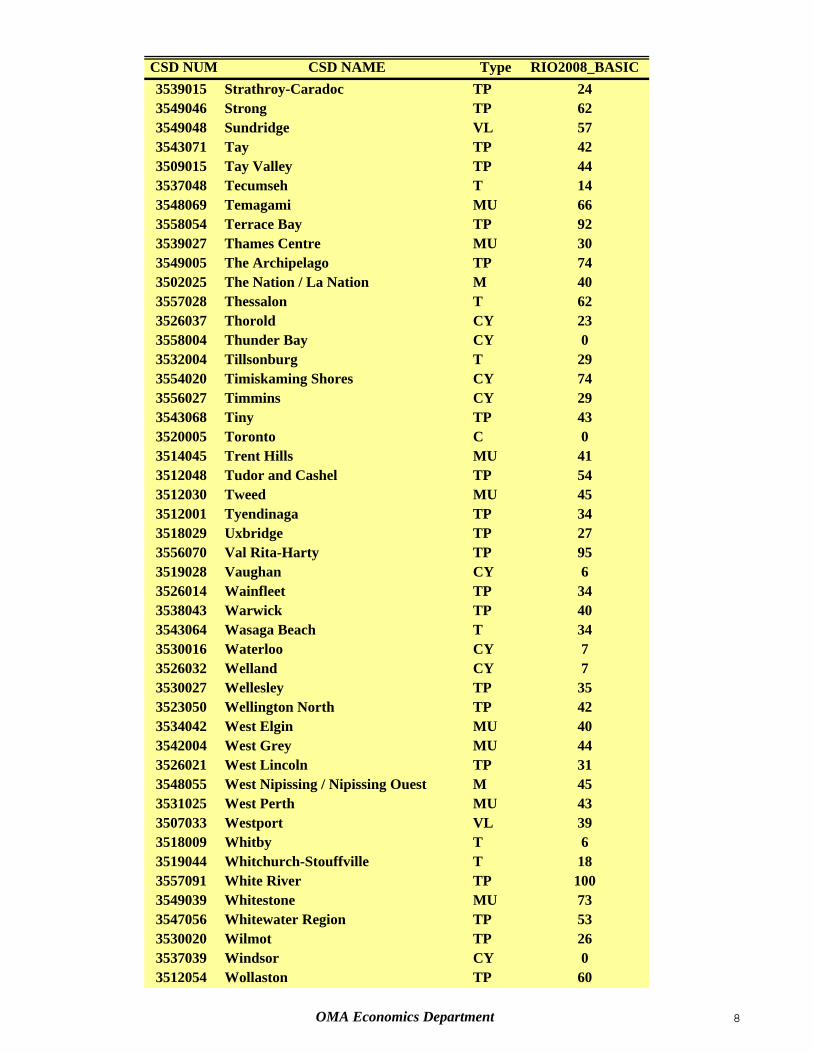
CSD NUM CSD NAME Type RIO2008_BASIC3539015 Strathroy-Caradoc TP 243549046 Strong TP 623549048 Sundridge VL 573543071 Tay TP 423509015 Tay Valley TP 443537048 Tecumseh T 143548069 Temagami MU 663558054 Terrace Bay TP 923539027 Thames Centre MU 303549005 The Archipelago TP 743502025 The Nation / La Nation M 403557028 Thessalon T 623526037 Thorold CY 233558004 Thunder Bay CY 03532004 Tillsonburg T 293554020 Timiskaming Shores CY 743556027 Timmins CY 293543068 Tiny TP 433520005 Toronto C 03514045 Trent Hills MU 413512048 Tudor and Cashel TP 543512030 Tweed MU 453512001 Tyendinaga TP 343518029 Uxbridge TP 273556070 Val Rita-Harty TP 953519028 Vaughan CY 63526014 Wainfleet TP 343538043 Warwick TP 403543064 Wasaga Beach T 343530016 Waterloo CY 73526032 Welland CY 73530027 Wellesley TP 353523050 Wellington North TP 423534042 West Elgin MU 403542004 West Grey MU 443526021 West Lincoln TP 313548055 West Nipissing / Nipissing Ouest M 453531025 West Perth MU 433507033 Westport VL 393518009 Whitby T 63519044 Whitchurch-Stouffville T 183557091 White River TP 1003549039 Whitestone MU 733547056 Whitewater Region TP 533530020 Wilmot TP 263537039 Windsor CY 03512054 Wollaston TP 60
OMA Economics Department 8
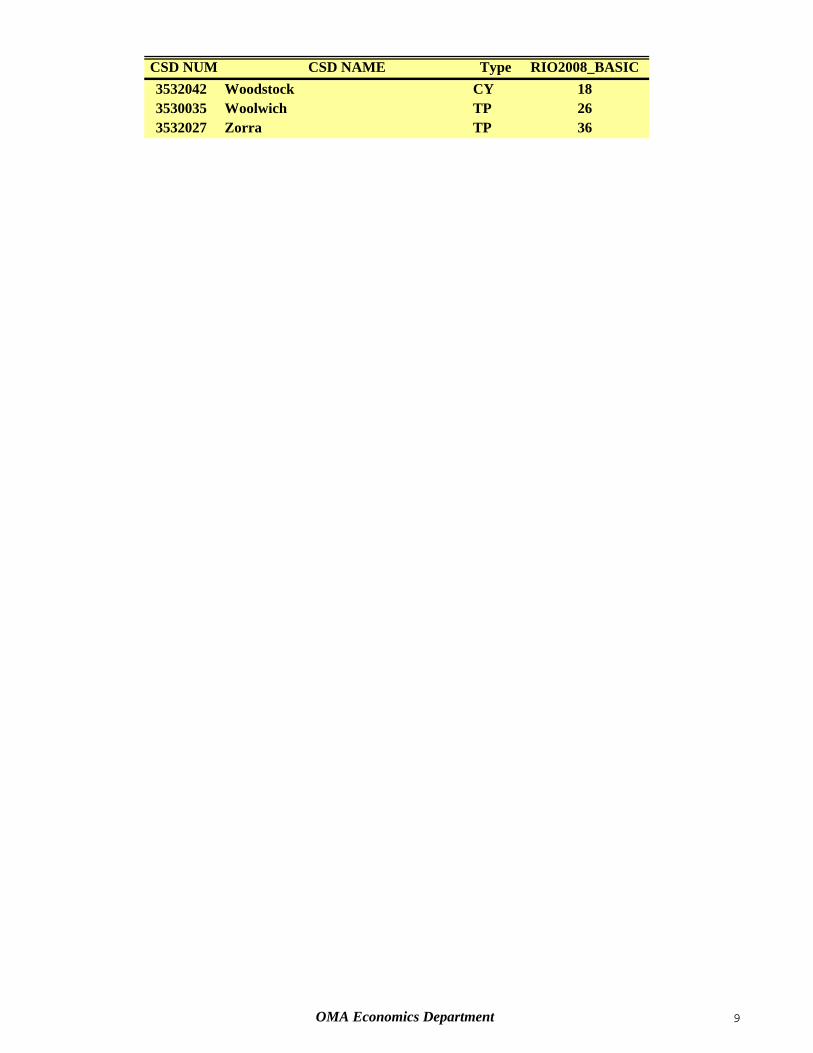
CSD NUM CSD NAME Type RIO2008_BASIC3532042 Woodstock CY 183530035 Woolwich TP 263532027 Zorra TP 36
OMA Economics Department 9