Embed Size (px)
Citation preview
Munich Personal RePEc Archive
Measuring Beliefs Supportive of
Environmental Action and Inaction: A
Reinterpretation of the Awareness of
Consequences Scale
Ryan, Anthony M. and Spash, Clive L.
CSIRO , Norwegian University of Life Sciences
July 2010
Online at https://mpra.ub.uni-muenchen.de/23900/
MPRA Paper No. 23900, posted 15 Jul 2010 01:41 UTC
Measuring Beliefs Supportive of Environmental Action and Inaction:
A Reinterpretation of the Awareness of Consequences Scale1
by
Anthony M. Ryan2 and Clive L. Spash3
ABSTRACT4
The Value-Belief-Norm model assumes that egoistic, social-altruistic and biospheric value
orientations causally influence how people cognitively structure beliefs regarding adverse
environmental consequences. Empirical studies have administered the Awareness of
Consequences (AC) scale to differentiate between these three orientations. We report an
analysis which challenges previous work in the field. Evidence is presented that indicates the
AC scale should be reinterpreted as a measure of beliefs supporting environmental action and
beliefs supporting environmental inaction. The beliefs supporting environmental action
appear to be differentiable according to beliefs in the positive consequences from
environmental protection and the seriousness of environment harm. This has major
implications for the Value-Belief-Norm model and its application.
___________________________________________________________________________
1 © Anthony M. Ryan and Clive L. Spash 2010. All rights reserved. This work is copyright. Apart from
any use as permitted under copyright law, no part may be reproduced by any process without prior
written permission from the authors.
2 Anthony M. Ryan is a researcher at the Sustainable Ecosystems Division of the CSIRO, Canberra, Australia.
3 Clive L. Spash holds the Chair of Public Policy and Governance at the Socio-Economics Department, WU,
Vienna University of Economics and Business, Wien, Austria, and is a Professor II in the Department of
International Environment and Development Studies, Noragric, Norwegian University of Life Sciences, Ås,
Norway.
4 This paper updates Ryan and Spash (2008) presenting new analysis and information. In particular we have
renamed the proposed scales
2
INTRODUCTION
Climate change, biodiversity loss, pollution of air, water and soil, and resource shortages are
some of the environmental challenges of the 21st Century. Tackling ecological problems
implies modifying a range of human behaviours conducted by the whole spectrum of societal
actors from the individual citizen to corporations and governments. A variety of motives
may stimulate or prevent action. Theoretical models can help identify key drivers and
obstacles to achieving behavioural change. Policy relevant behavioural models provide a
descriptive account of the interactions between variables and are subject to empirical testing.
Developing such models has been the aim of social psychologists working on environmental
problems. Psychometric scales are then typically employed to measure attitudes and beliefs,
which are sometimes connected to foundational values. Such attitudes and beliefs are
regarded as key explanatory variables for human behaviour.
Since Heberlein (1981) noted the need for understanding how people cognitively
organise beliefs and feelings about environmental issues there has been a growth in
environmental attitude-behaviour research resulting in a range of models (Ajzen, 1991; Grob,
1995; Homburg & Stolberg, 2006; Ohtomo & Hirose, 2007). However, developing
environmental scales is difficult because environmental issues are inherently complex,
involve multiple perspectives and plural values (Spash, 2000a). Recent studies (Hawcroft &
Milfont, 2010; Milfont & Duckitt, 2004) have challenged the interpretation of two widely
employed scales, the New Environmental Paradigm (NEP) (Dunlap & Van Liere, 1978;
Dunlap, Van Liere, Mertig, & Jones, 2000) and the Ecocentric and Anthropocentric
Environmental Attitude scale (Thompson & Barton, 1994), alongside several less popular
scales.
The current study critically investigates environmental scales arising from the Value-
Belief-Norm (VBN) model of Stern and colleagues (Stern, 2000; Stern, Dietz, Abel,
3
Guagnano, & Kalof, 1999). Stern, Dietz and Kalof (1993) integrated assumptions made by
several other theories into a broader behavioural framework of environmental intentions
which developed into the VBN. This has become one of the most popular and prominent
behavioural models in environmental psychology (De Groot & Steg, 2007, 2008; Kaiser,
Hübner, & Bogner, 2005; Nordlund & Garvill, 2003; Oreg & Katz-Gerro, 2006; Steg & De
Groot, 2008; Steg, Dreijerink, & Abrahamse, 2005).
The VBN model proposes that value orientations influence various environmental
perceptions and behaviour. It outlines three value orientations related to the ego, social-
altruism and the biosphere (Stern, Dietz, & Guagnano, 1995a), which are expected to be
distinguishable although correlated (Stern, Dietz, & Kalof, 1993). The value orientations are
hypothesised to directly influence the way in which people formulate and structure
environmental beliefs (Stern, 2000). Psychological scales have been developed to measure
the models' proposed environmental beliefs. These scales have then been administered in
studies that examine various environmental behaviours, such as political action and
willingness to pay for environmental improvements. There have also been attempts to use
the value orientation based belief scales to interpret contingent valuation on the basis of
whether people are egoistically, altruistically or biospherically motivated (see review in
Spash 2000b and Spash 2006).
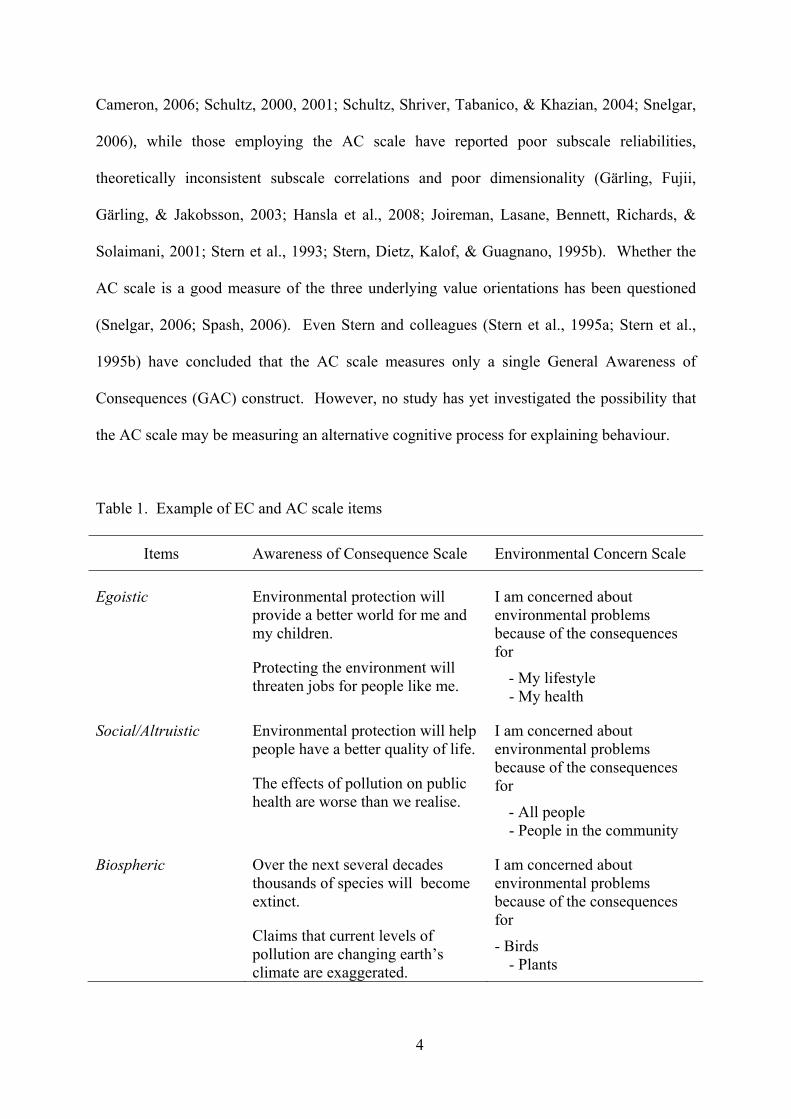
However, studies attempting to demonstrate that people cognitively differentiate
between beliefs about egoistic, social-altruistic and biospheric consequences, have given
mixed empirical results. Two approaches have been employed: the Environmental Concern
(EC) scale and the AC scale. Table 1 displays examples of EC and AC questions as used to
create the scales. Applications using the EC scale have provided supporting evidence that
people do cognitively construct their environmental concerns consistent with the three VBN
value orientations (Hansla, Gamble, Juliusson, & Gärling, 2008; Milfont, Duckitt, &
4
Cameron, 2006; Schultz, 2000, 2001; Schultz, Shriver, Tabanico, & Khazian, 2004; Snelgar,
2006), while those employing the AC scale have reported poor subscale reliabilities,
theoretically inconsistent subscale correlations and poor dimensionality (Gärling, Fujii,
Gärling, & Jakobsson, 2003; Hansla et al., 2008; Joireman, Lasane, Bennett, Richards, &
Solaimani, 2001; Stern et al., 1993; Stern, Dietz, Kalof, & Guagnano, 1995b). Whether the
AC scale is a good measure of the three underlying value orientations has been questioned
(Snelgar, 2006; Spash, 2006). Even Stern and colleagues (Stern et al., 1995a; Stern et al.,
1995b) have concluded that the AC scale measures only a single General Awareness of
Consequences (GAC) construct. However, no study has yet investigated the possibility that
the AC scale may be measuring an alternative cognitive process for explaining behaviour.
Table 1. Example of EC and AC scale items
Items Awareness of Consequence Scale Environmental Concern Scale
Egoistic Environmental protection will
provide a better world for me and
my children.
Protecting the environment will
threaten jobs for people like me.
I am concerned about
environmental problems
because of the consequences
for
- My lifestyle
- My health
Social/Altruistic Environmental protection will help
people have a better quality of life.
The effects of pollution on public
health are worse than we realise.
I am concerned about
environmental problems
because of the consequences
for
- All people
- People in the community
Biospheric Over the next several decades
thousands of species will become
extinct.
Claims that current levels of
pollution are changing earth’s
climate are exaggerated.
I am concerned about
environmental problems
because of the consequences
for
- Birds
- Plants
5
This paper aims to do so by reanalysing previously reported data. Across two studies,
three samples (N=572, 511, 531) were collected in face-to-face interviews with members of
the general public in the United Kingdom (UK) as part of on-going work relating to
economic valuation of the environment using contingent valuation (Spash, 2000c, 2006;
Spash et al., 2009). Previously published results from the first study, see Spash (2006), were
interpreted as consistent with a separation between selfish-altruism (the concept of altruism
found in mainstream economics), where gain to others is of direct benefit to the individual,
and social-altruism, where benefiting others is an end in itself. The AC social-altruistic scale
can then be seen as a mixture of items from these two categories. The evidence supported the
idea of selfish-altruism being related to egoism while social-altruism was associated with
biospherism, i.e. a two factor solution. This paper reanalyses data from the first Spash (2006)
study and analyses new data from a second study. The results reported here indicate that AC
scale factors are not oriented towards the self, others or the biosphere. It is also proposed that
the AC scale does not simply measure a one factor solution and therefore interpreting the
content and meaning of the scale requires reconceptualising the model.
The next section describes the VBN model along with the role of the AC scale as
developed in the literature. Specific items behind the scale are discussed and issues arising
from published empirical work are reported. Section 3 explores an alternative approach to
understanding the results. Section 4 describes our data and methods, and section 5 the results
which are discussed in section 6.
AWARENESS OF CONSEQUENCES THEORY AND MEASUREMENT
Stern et al.’s (1993) social psychological theory is based on assumptions originating in
Schwartz’s (1977) Norm Activation Model. The latter describes altruistic behaviour as the
result of an individual being explicitly aware of consequences in terms of the social harm of
6
not performing a particular behaviour and that they accept responsibility for the performance
of that behaviour. Awareness of consequences combined with accepting responsibility
increases the probability that a person will feel morally obliged to act. The VBN model
changes Schwartz’s definition in two ways. First, the “awareness of harmful consequences”
construct, which originally described an explicit awareness of consequences, is extended to
include beliefs about potential future world states. For example, an individual may believe
that “thousands of species will die within the next decade”, which may or may not happen.
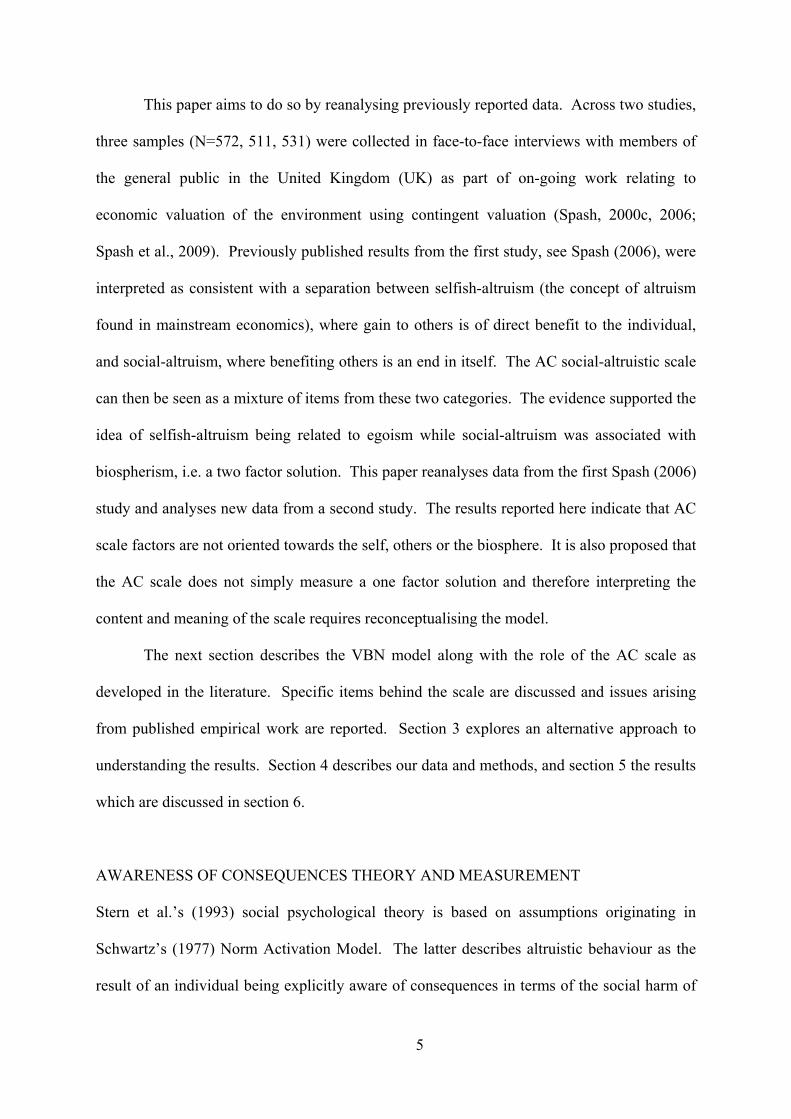
Second, an individual’s awareness of adverse consequences is assumed to be organised
around the three value orientations pertaining to oneself, other humans and non-humans. A
diagrammatic depiction of the VBN model is presented in Figure 1.
Pro-environmental
Values Beliefs Personal Norms Behaviours
Biospheric Ecological Adverse Perceived Sense of Activism
Worldview consequences ability to obligation to
Altruistic for valued reduce take pro- Nonactivist
objects (AC) threat (AR) environmental public-sphere
Egoistic actions behaviours
Private-sphere
behaviours
Behaviours in
organisations
Figure 1. The VBN model (adapted from Stern, 2000)
Stern et al. (1993) describe the three value orientations as logically distinct
relationships concerning self interest, altruism towards other humans, and altruism towards
other species and the biosphere. The value orientations are defined as being guiding
principles regarding states or outcomes that are desirable or appropriate (Rokeach, 1973;
Schwartz, 1992; Stern et al., 1999). The VBN theory posits that an individual’s value
orientation causally influences their beliefs relating to adverse consequences, because factual
7
information congruent with an individual’s value orientation is given more weight than value-
incongruent information (Stern, 2000; Stern & Dietz, 1994; Stern et al., 1999). That is: “A
strong value orientation may lead someone to seek information selectively or to attend
selectively to information about the consequences of an environmental condition for
particular valued objects, and therefore to develop beliefs about those consequences that will
guide action” (Stern & Dietz, 1994, p.68). Thus, an individual is assumed to be more
receptive to certain information depending upon their value orientation which then causally
influences their beliefs. At the same time, Stern et al. (1995a) note that beliefs can be judged
according to criteria of truthfulness, because “beliefs…are in principle vulnerable to
empirical challenge” (p.727-8). This second possibility, however, has not been formally
included in the VBN model.
In defining attitudes, the theory of planned behaviour (Ajzen, 1991) also refers to the
concept of beliefs. Attitudes are described as comprising an assessment of outcome
desirability and of the subjective probability that a behaviour will produce a certain outcome.
Ajzen (1991) refers to the pragmatic subjective probability component of an attitude as being
a belief. In contrast, the VBN lacks a formal process by which factual information can
influence beliefs regarding adverse environmental consequences. The theorised VBN link
between value orientations and beliefs may be weakened by believable freely available
information which proves incompatible with an individual’s value orientation. For example,
the mass media may convince an individual that many species may die in the near future,
even if that person has a weak biospheric value orientation.
The EC construct can be distinguished from beliefs about adverse environmental
consequences. EC has been defined as being rooted in feelings of interconnectedness and
empathy with regards to others or the natural environment (Schultz, 2000, 2001). Value
orientations may bias information processing via an affective or emotive process that
8
ultimately influences what an individual is concerned about rather than what they factually
believe. Under such circumstances, the EC construct would be expected to have a closer
relationship with egoistic, altruistic and biospheric orientations than beliefs concerning
factual statements about the environment.
Whether people cognitively differentiate their environmental concerns and beliefs
based upon Stern et al.’s proposed value orientations is a hypothesis open to empirical
investigation. The EC scale constructed by Schultz (2000) has produced the most supportive
results. As displayed in Table 1, the EC scale employs the statement: I am concerned about
environmental problems because of consequences for ‘______’. Respondents are then asked
to rate nouns such as: me, my health, people in the community, future generations, plants,
trees, whales. EC studies have reported exploratory and confirmatory analyses that support
the hypothesised factor structure, as well as strong subscale reliabilities and reasonably
interpretable correlations between subscales (Hansla et al., 2008; Milfont et al., 2006;
Schultz, 2000, 2001; Schultz et al., 2004; Snelgar, 2006). Such results provide evidence that
people do differentiate adverse environmental concerns according to the proposed value
orientations.
The items in the AC scale seem to have been designed based on a factual cause and
consequence formula. Each item is a statement proposing that a cause (e.g., pollution,
environmental protection) will affect a target, i.e., either oneself (ACego), others (ACsoc), or
the biosphere (ACbio). For example, a biospheric item might be related to the problem of
tropical deforestation, with the consequences being for the Earth as a whole, producing an
item statement: “Tropical rain forests are essential to maintaining a healthy planet Earth”.
The wording of items is generally kept simple and there appears a desire for some variety of
positively and negatively phrased questions on each AC category to construct the overall
scale. Yet, within this structure alternative interpretations of an item seem possible and the
9
task facing a respondent can involve unforseen complexities. Respondents may then interpret
the AC items and cluster them based on alternative and unexpected criteria.
Closed-ended questionnaire items must present participants with a restricted
representation of an issue. Wording and framing of items are well known influences on how
people interpret the meaning of a questionnaire (Tversky & Kahneman, 1981; Wang, Simons,
& Bredart, 2001). Linguistic and cognitive scientists (Croft & Cruse, 2004; Lakoff, 1987;
Pinker, 1998, 2007) have also noted that some variations of a statement or sentence will
result in a listener or reader extracting precisely the same meaning, while others, with
seemingly subtle sentence variations, can result in the recipient forming radically different
interpretations. Similarly, item sequence, the response scale and the overall questionnaire
format can influence responses (Schwarz, 1999, 2007a, 2007b; Schwarz & Bohner, 2001;
Schwarz & Strack, 1991). Hence, constructing an instrument that successfully differentiates
between VBN value orientations requires more than simply designing a set of items which
mention consequences affecting egoistic, social or biospheric targets. In particular, an
individual may fail to cognitively construct an interpretation based on their value orientations
if confronted by items appearing to be factual statements.
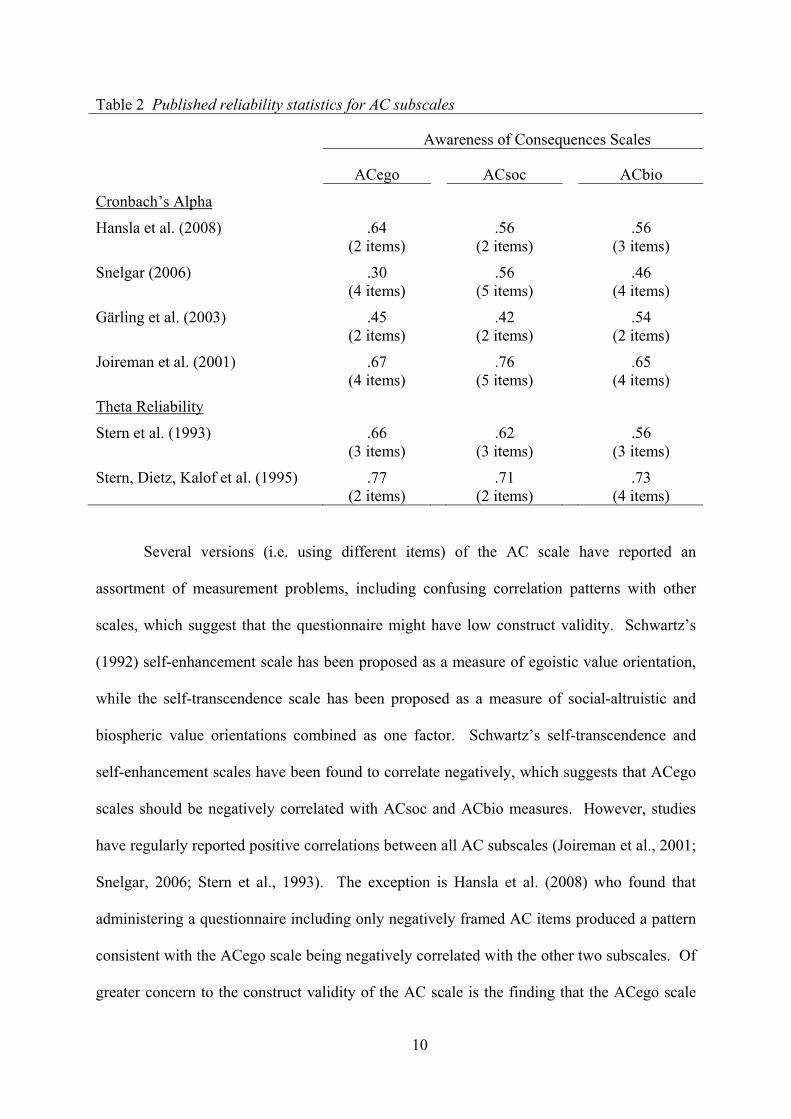
Table 2 displays subscale reliabilities reported by a variety of published studies
(Gärling et al., 2003; Hansla et al., 2008; Joireman et al., 2001; Snelgar, 2006; Stern et al.,
1993; Stern et al., 1995b). These show weak to moderate results. Early on Stern et al. (1993)
reasoned that moderate reliabilities might be due to too few items being administered.
However, both Gärling et al. (2003) and Hansla et al. (2008) had to remove an item from
each scale in order to improve reliability, while Joireman et al. (2001) reported only moderate
reliabilities despite having 4 to 5 item scales. Most studies conclude that a better set of items
would improve reliability, and that quest is undoubtedly in turn responsible for the variety
found in published versions of the scale.
10
Table 2 Published reliability statistics for AC subscales
Awareness of Consequences Scales
ACego ACsoc ACbio
Cronbach’s Alpha
Hansla et al. (2008) .64
(2 items)
.56
(2 items)
.56
(3 items)
Snelgar (2006) .30
(4 items)
.56
(5 items)
.46
(4 items)
Gärling et al. (2003) .45
(2 items)
.42
(2 items)
.54
(2 items)
Joireman et al. (2001) .67
(4 items)
.76
(5 items)
.65
(4 items)
Theta Reliability
Stern et al. (1993) .66
(3 items)
.62
(3 items)
.56
(3 items)
Stern, Dietz, Kalof et al. (1995) .77
(2 items)
.71
(2 items)
.73
(4 items)
Several versions (i.e. using different items) of the AC scale have reported an
assortment of measurement problems, including confusing correlation patterns with other
scales, which suggest that the questionnaire might have low construct validity. Schwartz’s
(1992) self-enhancement scale has been proposed as a measure of egoistic value orientation,
while the self-transcendence scale has been proposed as a measure of social-altruistic and
biospheric value orientations combined as one factor. Schwartz’s self-transcendence and
self-enhancement scales have been found to correlate negatively, which suggests that ACego
scales should be negatively correlated with ACsoc and ACbio measures. However, studies
have regularly reported positive correlations between all AC subscales (Joireman et al., 2001;
Snelgar, 2006; Stern et al., 1993). The exception is Hansla et al. (2008) who found that
administering a questionnaire including only negatively framed AC items produced a pattern
consistent with the ACego scale being negatively correlated with the other two subscales. Of
greater concern to the construct validity of the AC scale is the finding that the ACego scale
11
fails to correlate positively with Schwartz’s self enhancement scale (Stern et al., 1995b) or
the EC egoistic scale (Snelgar, 2006).
There have also been contradictory claims concerning the dimensionality of the AC
scale. Snelgar (2006) has criticised studies (Stern et al., 1993; Stern et al., 1995b) employing
a theta scaling procedure because this avoids dimensionality tests. There is no agreement as
to how many dimensions the AC scale measures, although the original goal was to assess
beliefs relating to the three value orientations. Another major problem has been the high
correlation between subscales. Subscales are reported to share the same variance as follows:
18.50% – 36.00% for Stern et al. (1993), 29.16% – 38.44% for Joireman et al. (2001) and
8.24% – 14.98% for Snelgar (2006). While Stern et al. (1993) foresaw the potential for
significant correlations between the three AC beliefs, the amount of shared variance is
worrisome. Stern et al (1993) take the high correlation between the subscales as an indication
that “value orientations may be part of a single perceptual package” (p.340). This conclusion
has been supported by studies where principal component analysis (PCA) yielded a one
factor solution (Stern et al., 1995a; Stern et al., 1995b). The authors concluded that, rather
than being a measure of the three value orientations, the AC scale measures a single
construct, the aforementioned GAC. Spash (2006), however, found a three factor solution
with the first loading most on egoistic and social items, the second on social and biospheric,
and the third combining all three value orientations. Snelgar (2006) found from two to five
factors could be extracted using principal axis factoring both with varimax and direct oblimin
rotations, and also PCA. She concluded: “no clear structure was obtained with any of these
analyses. Thus it is not appropriate to attempt to label any of the factors/components” (p.91).
Doubts that the scales accurately measure three distinctive elements has led to calls
for improvement by varying the number of items (Stern et al., 1993) or administering
negative items only (Hansla et al., 2008). However, Snelgar (2006), who presents a thorough
12
investigation of the measurement properties of the AC questionnaire, provides the most
pessimistic prognosis. Her conclusion is that the EC scale is a better instrument and should
be used in preference to the AC scale. However, another possibility is that the AC items are
being cognitively categorised using a criteria fundamentally different to the value orientation
system hypothesised by VBN authors.
ALTERNATIVE INTERPRETATIONS
A range of researchers have so far expressed concern about the state of the AC questionnaire.
If the questionnaire is found to elicit a response pattern that is incompatible with the VBN,
this may prove to be a valuable insight into how people cognitively organise environmental
beliefs. Noting that respondents fail to adopt the desired response pattern leaves two
investigative strategies. One approach is to scrap the scale, start afresh and aim to measure
the theoretical model employing a lot more new items and/or a different response scale. The
other approach requires investigating why the scale proves a poor measure of the proposed
model (Schwarz, 2007b). This would include looking for unexpected questionnaire response
patterns which explain how people are constructing their environmental attitudes and beliefs.
A response pattern that is consistently found—even when questionnaire context, participant
demographics and response scale are varied—would indicate an alternative interpretation of
the scale is required.
Previous studies provide some clues for alternative cognitive processes that could
account for AC scale responses. Spash (2006) found a factor combining equal loadings
across all three value orientations. This was interpreted as “…an anti-environmental
sentiment or lack of worry over possible environmental problems and a concern about the
potential negative personal consequences of environmental protection” (Spash, 2006, p.611).
The implication drawn being that negative egoistic attitudes failed to form part of the egoistic
13
scale and seemed to separate out. Hansla et al. (2008) found that AC subscale correlations
demonstrated a different pattern when using only the items phrased in terms of negative
outcomes. These results suggest respondents may sort negative environmental consequences
into a distinctive perceptual category and positive consequences into a separate category. In
addition, Snelgar (2006: 88) has commented that:
“As Stern et al. (1993, 1995) framed the value–belief–norm theory, beliefs that the
consequences are adverse will result in action. The beliefs part of the theory can also
be considered in terms of perceived costs and benefits for valued objects.
Behavioural intention will be influenced by the perceived costs and benefits of a
particular environmental action for each set of valued objects, weighted according to
the individual’s relative value orientations.”
The PCA matrix reported by Snelgar (2006) also suggests that people might differentiate
between the positive and negative consequences of not taking environmental action.
Indeed, there is strong empirical evidence that people are very sensitive as to whether
statements are framed as positively or negatively. The theory of planned behaviour, which is
a consequentialist theory, suggests that people naturally ascribe a positive or negative value
to their attitudes (Ajzen, 1991). Prospect theory (Kahneman & Tversky, 1979) argues that
individuals construct a reference point and then treat gains differently from losses. This is
supported by the endowment effect (Kahneman, Knetsch, & Thaler, 1990, 1991) and the
economic literature contrasting willingness to pay for environmental improvements with
willingness to accept compensation for environmental damages (Knetsch, 1994, 2005). A
plethora of framing studies, such as Tversky and Kahneman’s (1981) Asian disease problem,
suggest that choices can depend on whether the task is perceive in terms of gains or losses.
Regulatory focus theory (Higgins, 1987, 2000) also suggests that people differentiate
between the pursuit of gains and the avoidance of losses, and employ distinctive strategies to
14
deal with each of these situations. Framing in terms of gains evokes a “promotion-focus” that
leads to growth related strategies that strive to obtain an ideal goal. Framing in terms of
losses can form a “prevention-focus”, resulting in strategies to increase personal security in
“what ought to be”. Thus, a set of statements mentioning positive or negative consequences
for the environment may evoke the distinction between individuals promotion or prevention
stance (Semin, Higgins, Gil de Montes, Estourget, & Valencia, 2005), rather than the
categories suggested by the VBN model.
Another possible criterion that respondents might employ to categorise AC
questionnaire items is whether the items mention environmental protection, which implies the
environment is being proactively safeguarded by human action. Some AC items imply
environmental action (e.g., “Environmental protection is beneficial to my health”), while
others do not (e.g., “The effects of pollution on public health are worse than we realise”;
“Claims that we are changing the climate are exaggerated”). Anderson (2003) argues the
psychological literature has often ignored fundamental differences between action and
inaction, and that, other things being equal, people generally prefer no change. He refers to
the principle of “conservation of energy” as an explanation. For example, the option of
environmental protection may involve inconvenience and monetary losses that are less salient
under inaction. A range of psychological literature finds people prefer to do nothing as
opposed to performing an action e.g., status quo bias (Samuelson & Zeckhauser, 1988),
omission bias (Ritov & Baron, 1990, 1992), inaction inertia (Tykocinski, Pittman, & Tuttle,
1995) and choice deferral (Dhar, 1996).
In summary, no one has yet provided good evidence that the AC scale is a measure of
Stern et al.’s hypothesised structure. The AC scale has been described as providing a one
factor solution (Stern et al., 1995a; Stern et al., 1995b) or as being a poor scale (Snelgar,
2006). Yet, the AC scale may still be able to provide some insight into how people construct
15
their environmental beliefs. There is strong empirical research suggesting people cognitively
differentiate between positive and negative outcomes, as well as being sensitive to whether a
proposal implies action or inaction. In order to explore whether the AC scale is a measure of
an alternative cognitive process, the research reported next compares three public samples
collected in the context of willingness to pay surveys and a convenience sample collected by
Snelgar (2006). These datasets vary by the context in which the AC scale was administered,
as well as sample size, population characteristics, item presentation order and response scale.
Bryman (1988) notes that linking concepts to measurement can often be a much more
inductive exercise than implied by the classical social science model. In this vein, the
approach of the current paper is both exploratory and inductive, while drawing upon a
confirmatory analysis.
DATA AND METHOD
In order to analyse the psychometric properties of the AC scale we utilise three data sets
collected as part of research on the contingent valuation of environmental proposals. Two of
these data sets were collected as part of the same study (i.e., Spash Study 1), but were
differentiated based on whether the AC items were presented sequentially or mixed with
other questions. In all three of the contingent valuation samples respondents were (i)
members of the general public in the UK approached at home by an independent market
research company; (ii) recruited via a stratified random sampling procedure; and (iii) verbally
administered the AC questions in a face-to-face interview. These surveys were designed and
all related research coordinated by Spash and funded as part of European Community
projects (see acknowledgments).
16
Table 3 AC scale items in recent studies
Administered
Spash
1
Spash
2
Snelgar
(2006)
ACego1: Environmental protection will provide a better world
for me and my children ×
ACego2: Environmental protection is beneficial to my health
ACego3: Protecting the environment will threaten jobs for
people like me
ACego4: Laws to protect the environment limit my choice and
personal freedoms
ACego5: A clean environment provides me with better
opportunities for recreation
ACsoc1: Environmental protection benefits everyone
ACsoc2: Environmental protection will help people have a
better quality of life
ACsoc3: We don’t need to worry much about the environment
because future generations will be better able to deal
with these problems than we are
ACsoc4: The effects of pollution on public health are worse
than we realise
ACsoc5: Pollution generated here harms people all over the
earth
ACbio1: While some local plants and animals may have been
harmed by environmental degradation, over the whole
earth there has been little effect
×
ACbio2: Over the next several decades, thousands of species
will become extinct
ACbio3: Claims that current levels of pollution are changing
earth’s climate are exaggerated
ACbio4: Tropical rain forests are essential to maintaining a
healthy planet earth ×
ACbio5: Modern development threatens wildlife × ×
17
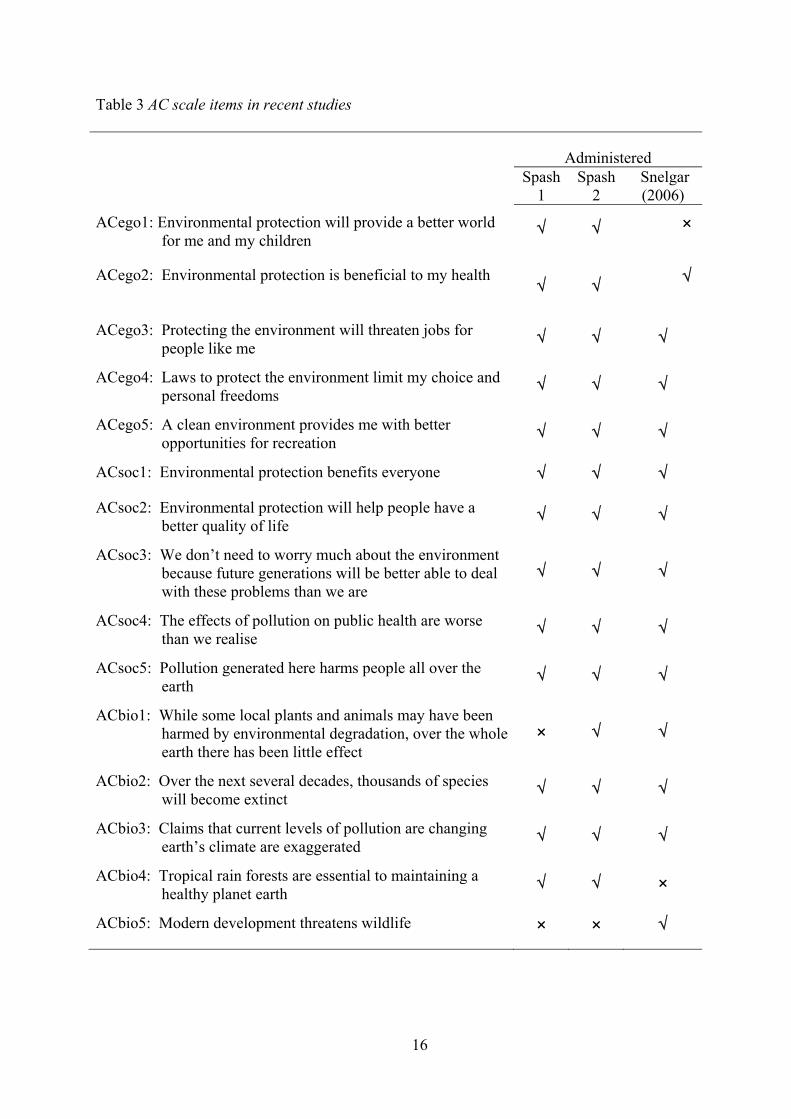
These surveys included 13 AC items designed by Stern and colleagues taken from the
following studies Stern et al. (1993), Guagnano, Dietz and Stern (1994), Stern et al. (1995a,
b). In reviewing the literature the number of distinct biospheric items was found to be limited
to just three and therefore an extra item was designed and added by Spash (Table 3 item
ACbio4). Similarly, Snelgar also designed an additional biospheric item (see Table 3 item
ACbio5). While the number of items employed seems small for measuring a multi-attribute
scale, the work on AC scales has often used even fewer items than in the work by Spash and
Snelgar.
Spash Study 1 (random condition and non-random condition)
The survey was conducted to assess the maximum amount people would personally be
willing to pay each quarter on their electricity bill over the next year to restore biodiversity in
the river Tummel and its surrounding area. In total 1069 people participated in the study.
They were residents from several Scottish regions. The questionnaire contained 50 items
including the 13 AC items displayed in Table 3. Participants answered the AC questions
using a 7 point scale (1 = strongly disagree; 7 = strongly agree).
Two conditions were administered Spash Study 1. One group of participants were
administered the AC items in a sequential non-random order, while the other answered the
AC items mixed in with other survey questions. These responses from these two conditions
were analysed separately because altering the order of questionnaire items can influence
responses (Schwarz, 1999; Schwarz, Strack, & Mai, 1991). The non-random condition
consisted of 528 participants and 511 participants answered all the AC items. For the random
condition 541 participants were administered the survey of which 531 participants
successfully answered all the AC items.
18
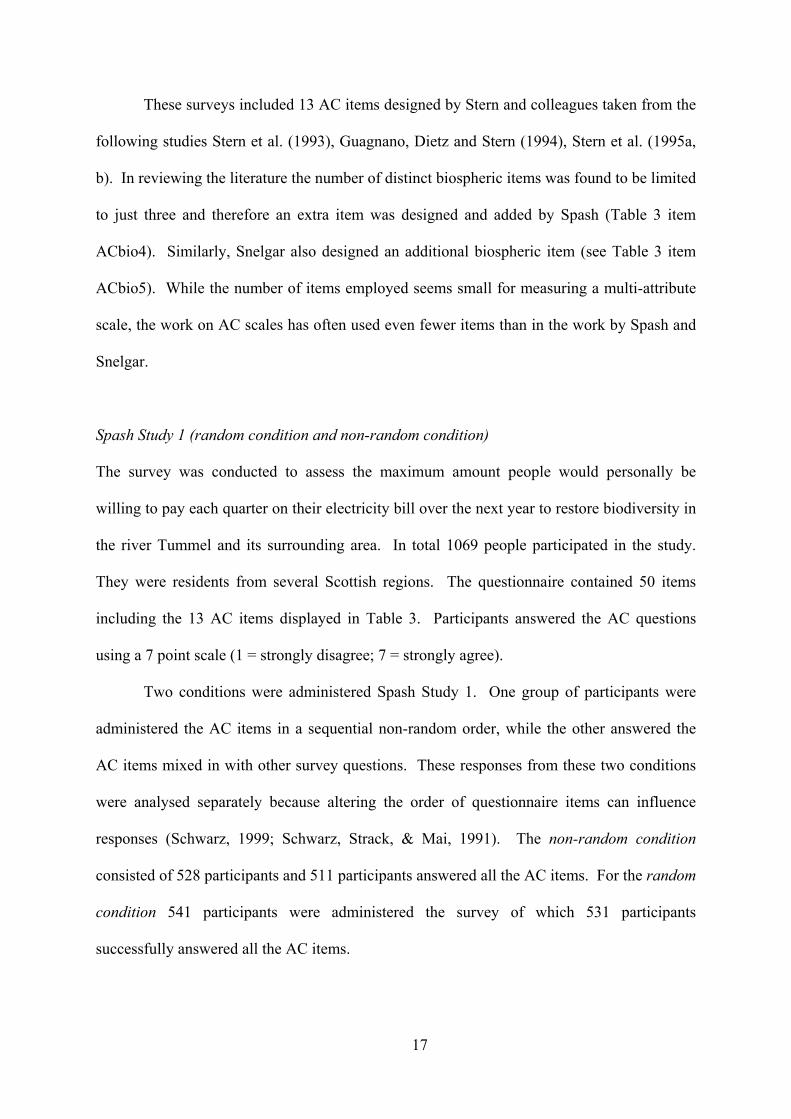
Spash Study 2
A survey was constructed to assess the maximum willingness to pay of individuals for
converting a small area of Cambridgeshire farmland into a wetland ecosystem. The
participants were 713 members of the public recruited from across the UK, with a national
and regional sample split. The questionnaire contained 45 items. In total 572 participants
completed the 14 AC items shown in Table 3. Participants responded on a 4-point scale (1 =
strongly disagree; 4 = strongly agree).
Table 4 Summary of the design and demographics of the four samples
Spash Study 1
Random
Spash Study 1
Non-Random
Spash Study 2 Snelgar Study
Test type
Verbally
administered
Verbally
administered
Verbally
administered
Pen & paper
questionnaire
Sample
N=531, Scotland N=511, Scotland N=572, UK
national
N=101,
University of
Westminster
Context of
administering
AC scale
WTP survey for
restoring
biodiversity
WTP survey for
restoring
biodiversity
WTP survey for
converting
farmland to
wetland
Undergraduate
course activity
AC items
sequential or
randomised
Randomly mixed
with other survey
items
Sequentially
administered
Randomly mixed
with political
action scale
Sequentially
administered
Response
Scale
7-point scale 7-point scale 4-point scale 7-point scale
Age
60.6% ≤ age 44 59.1% ≤ age 44 57.6% ≤ age 44 Not reported
Gender
53.1% females 48.5% females 59.1% females Not reported
Education
53.3% left school
at age 16
51.5% left school
at age 16
52.0% left school
at age 16
100%
undergraduate
students
19
Table 4 summarises the design of the three samples alongside the design reported by
Snelgar (2006). Table 4 highlights the differences in (i) how the scale was administered to
participants, (ii) study context, (iii) sample size, (iv) response scale, and (v) whether the items
were presented sequentially or mixed with non-AC questionnaire items. Table 4 also
presents demographics (i.e., age, gender and education) for the three samples collected by
Spash.
The following criteria will be used to assess whether the AC scale demonstrates the
pattern proposed by Stern and colleagues: (i) correlations between subscales, (ii) internal
consistency and (iii) dimensionality. Any emergent pattern is assessed based on (i)
interpretability, (ii) correlations between new factors, (iii) internal consistency and (iv) the
results of a confirmatory factor analysis.
RESULTS
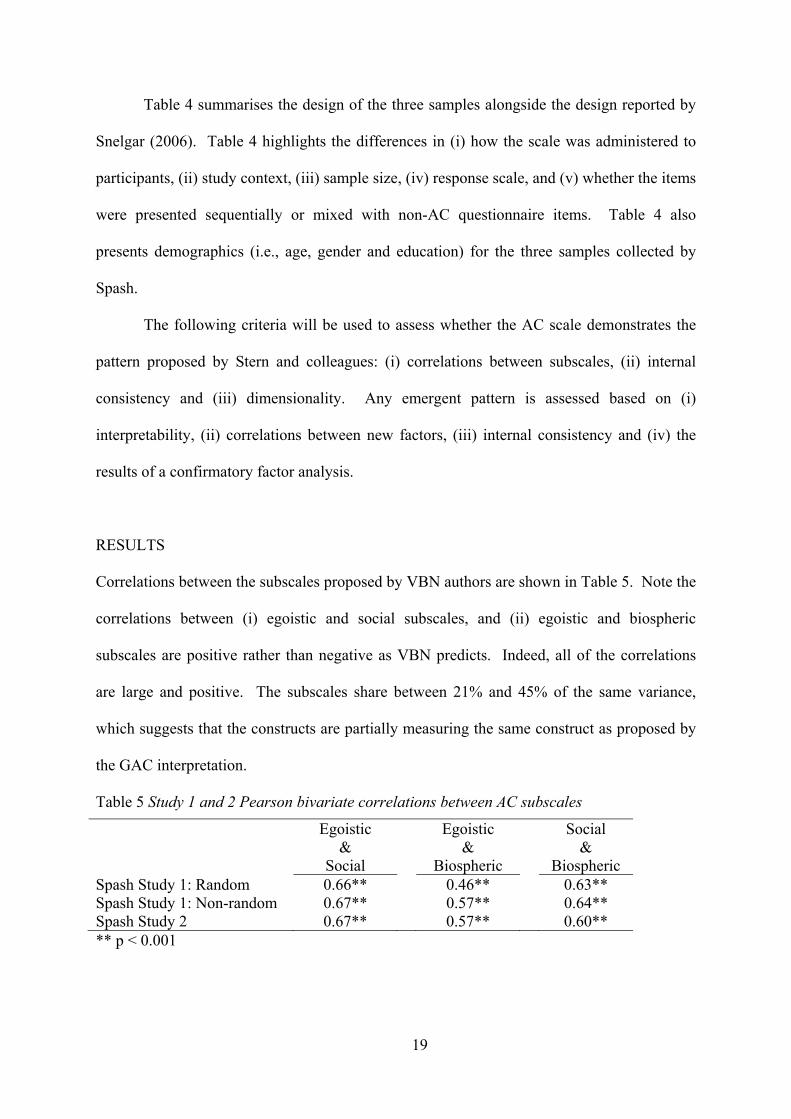
Correlations between the subscales proposed by VBN authors are shown in Table 5. Note the
correlations between (i) egoistic and social subscales, and (ii) egoistic and biospheric
subscales are positive rather than negative as VBN predicts. Indeed, all of the correlations
are large and positive. The subscales share between 21% and 45% of the same variance,
which suggests that the constructs are partially measuring the same construct as proposed by
the GAC interpretation.
Table 5 Study 1 and 2 Pearson bivariate correlations between AC subscales
Egoistic
&
Social
Egoistic
&
Biospheric
Social
&
Biospheric
Spash Study 1: Random 0.66** 0.46** 0.63**
Spash Study 1: Non-random 0.67** 0.57** 0.64**
Spash Study 2 0.67** 0.57** 0.60**
** p < 0.001
20
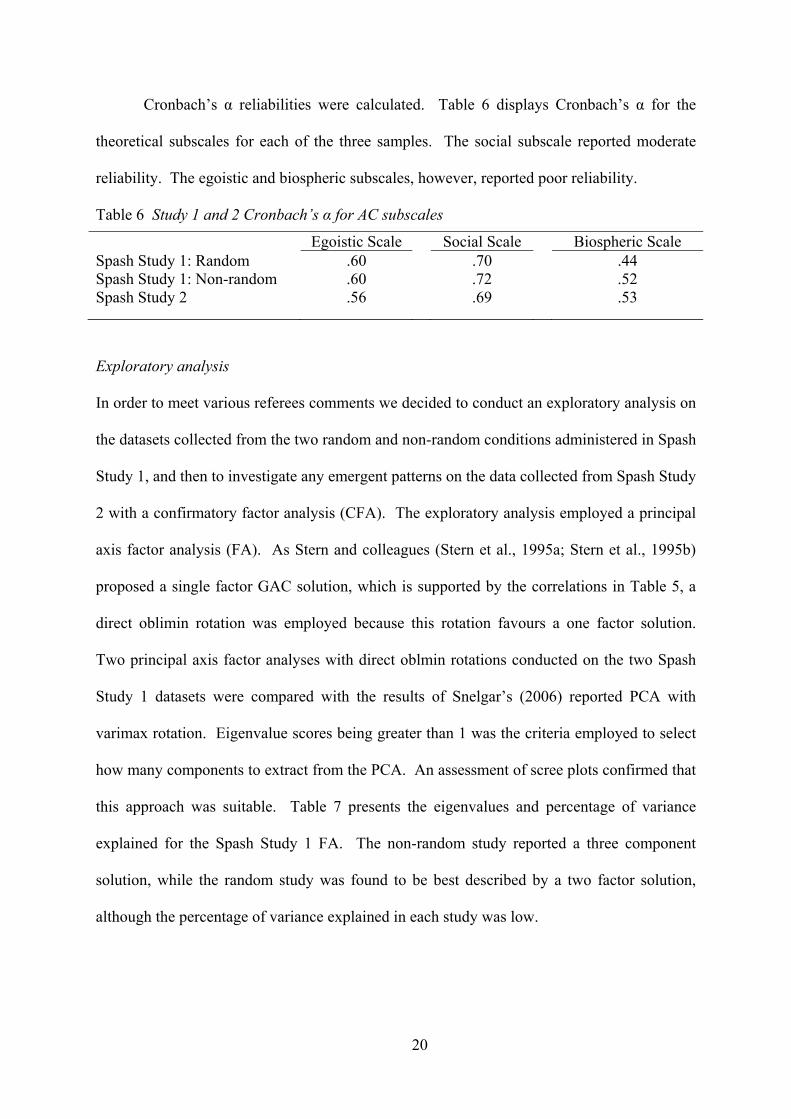
Cronbach’s α reliabilities were calculated. Table 6 displays Cronbach’s α for the
theoretical subscales for each of the three samples. The social subscale reported moderate
reliability. The egoistic and biospheric subscales, however, reported poor reliability.
Table 6 Study 1 and 2 Cronbach’s α for AC subscales
Egoistic Scale Social Scale Biospheric Scale
Spash Study 1: Random .60 .70 .44
Spash Study 1: Non-random .60 .72 .52
Spash Study 2 .56 .69 .53
Exploratory analysis
In order to meet various referees comments we decided to conduct an exploratory analysis on
the datasets collected from the two random and non-random conditions administered in Spash
Study 1, and then to investigate any emergent patterns on the data collected from Spash Study
2 with a confirmatory factor analysis (CFA). The exploratory analysis employed a principal
axis factor analysis (FA). As Stern and colleagues (Stern et al., 1995a; Stern et al., 1995b)
proposed a single factor GAC solution, which is supported by the correlations in Table 5, a
direct oblimin rotation was employed because this rotation favours a one factor solution.
Two principal axis factor analyses with direct oblmin rotations conducted on the two Spash
Study 1 datasets were compared with the results of Snelgar’s (2006) reported PCA with
varimax rotation. Eigenvalue scores being greater than 1 was the criteria employed to select
how many components to extract from the PCA. An assessment of scree plots confirmed that
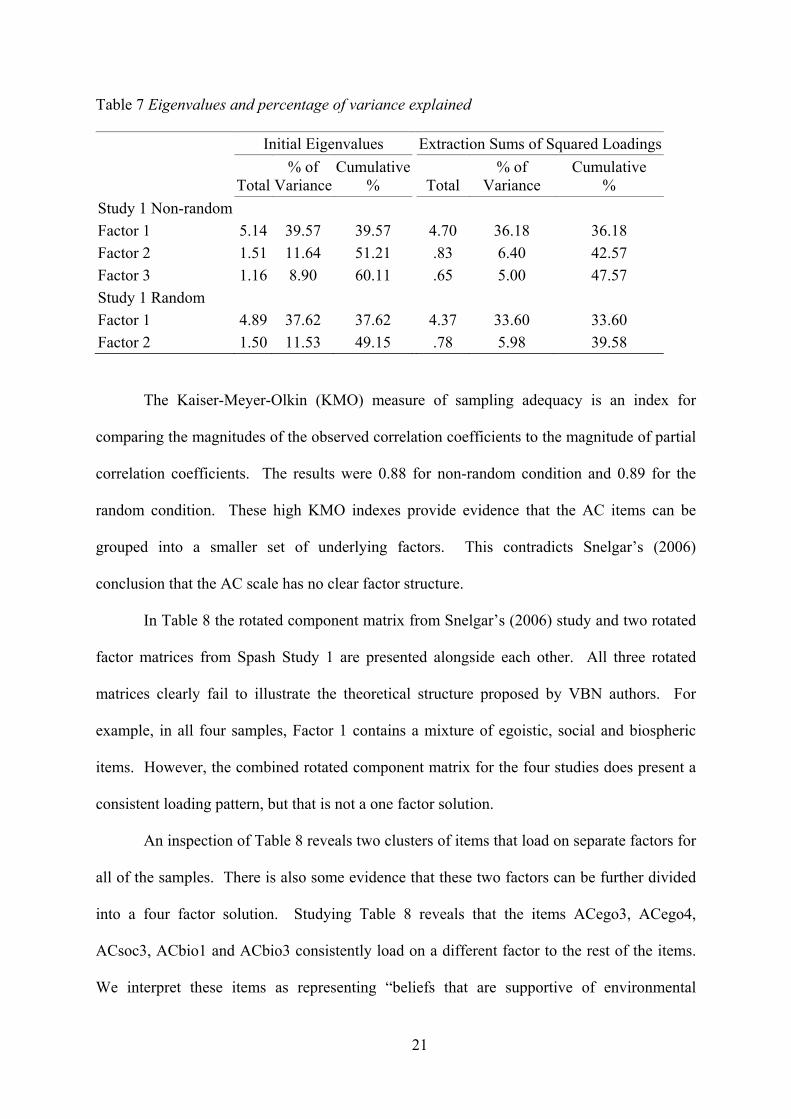
this approach was suitable. Table 7 presents the eigenvalues and percentage of variance
explained for the Spash Study 1 FA. The non-random study reported a three component
solution, while the random study was found to be best described by a two factor solution,
although the percentage of variance explained in each study was low.
21
Table 7 Eigenvalues and percentage of variance explained
Initial Eigenvalues Extraction Sums of Squared Loadings
Total
% of
Variance
Cumulative
% Total
% of
Variance
Cumulative
%
Study 1 Non-random
Factor 1 5.14 39.57 39.57 4.70 36.18 36.18
Factor 2 1.51 11.64 51.21 .83 6.40 42.57
Factor 3 1.16 8.90 60.11 .65 5.00 47.57
Study 1 Random
Factor 1 4.89 37.62 37.62 4.37 33.60 33.60
Factor 2 1.50 11.53 49.15 .78 5.98 39.58
The Kaiser-Meyer-Olkin (KMO) measure of sampling adequacy is an index for
comparing the magnitudes of the observed correlation coefficients to the magnitude of partial
correlation coefficients. The results were 0.88 for non-random condition and 0.89 for the
random condition. These high KMO indexes provide evidence that the AC items can be
grouped into a smaller set of underlying factors. This contradicts Snelgar’s (2006)
conclusion that the AC scale has no clear factor structure.
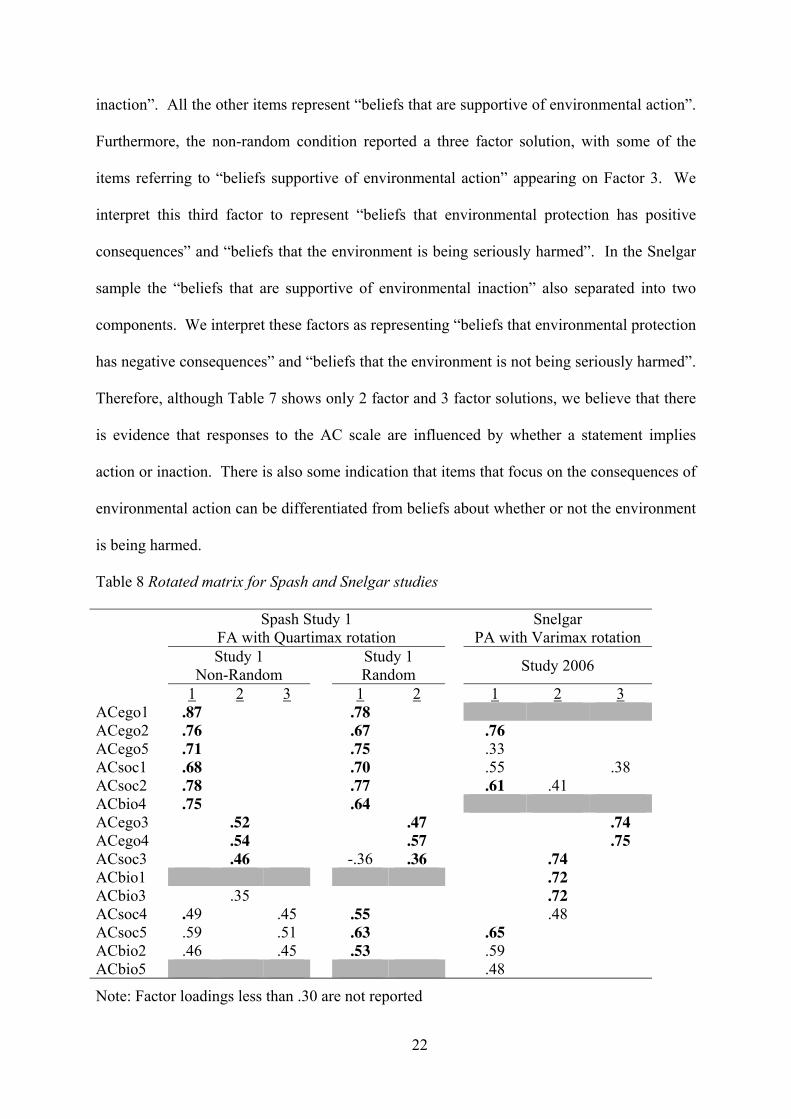
In Table 8 the rotated component matrix from Snelgar’s (2006) study and two rotated
factor matrices from Spash Study 1 are presented alongside each other. All three rotated
matrices clearly fail to illustrate the theoretical structure proposed by VBN authors. For
example, in all four samples, Factor 1 contains a mixture of egoistic, social and biospheric
items. However, the combined rotated component matrix for the four studies does present a
consistent loading pattern, but that is not a one factor solution.
An inspection of Table 8 reveals two clusters of items that load on separate factors for
all of the samples. There is also some evidence that these two factors can be further divided
into a four factor solution. Studying Table 8 reveals that the items ACego3, ACego4,
ACsoc3, ACbio1 and ACbio3 consistently load on a different factor to the rest of the items.
We interpret these items as representing “beliefs that are supportive of environmental
22
inaction”. All the other items represent “beliefs that are supportive of environmental action”.
Furthermore, the non-random condition reported a three factor solution, with some of the
items referring to “beliefs supportive of environmental action” appearing on Factor 3. We
interpret this third factor to represent “beliefs that environmental protection has positive
consequences” and “beliefs that the environment is being seriously harmed”. In the Snelgar
sample the “beliefs that are supportive of environmental inaction” also separated into two
components. We interpret these factors as representing “beliefs that environmental protection
has negative consequences” and “beliefs that the environment is not being seriously harmed”.
Therefore, although Table 7 shows only 2 factor and 3 factor solutions, we believe that there
is evidence that responses to the AC scale are influenced by whether a statement implies
action or inaction. There is also some indication that items that focus on the consequences of
environmental action can be differentiated from beliefs about whether or not the environment
is being harmed.
Table 8 Rotated matrix for Spash and Snelgar studies
Spash Study 1
FA with Quartimax rotation
Snelgar
PA with Varimax rotation
Study 1
Non-Random
Study 1
Random
Study 2006
1 2 3 1 2 1 2 3
ACego1 .87 .78
ACego2 .76 .67 .76
ACego5 .71 .75 .33
ACsoc1 .68 .70 .55 .38
ACsoc2 .78 .77 .61 .41
ACbio4 .75 .64
ACego3 .52 .47 .74
ACego4 .54 .57 .75
ACsoc3 .46 -.36 .36 .74
ACbio1 .72
ACbio3 .35 .72
ACsoc4 .49 .45 .55 .48
ACsoc5 .59 .51 .63 .65
ACbio2 .46 .45 .53 .59
ACbio5 .48
Note: Factor loadings less than .30 are not reported
23
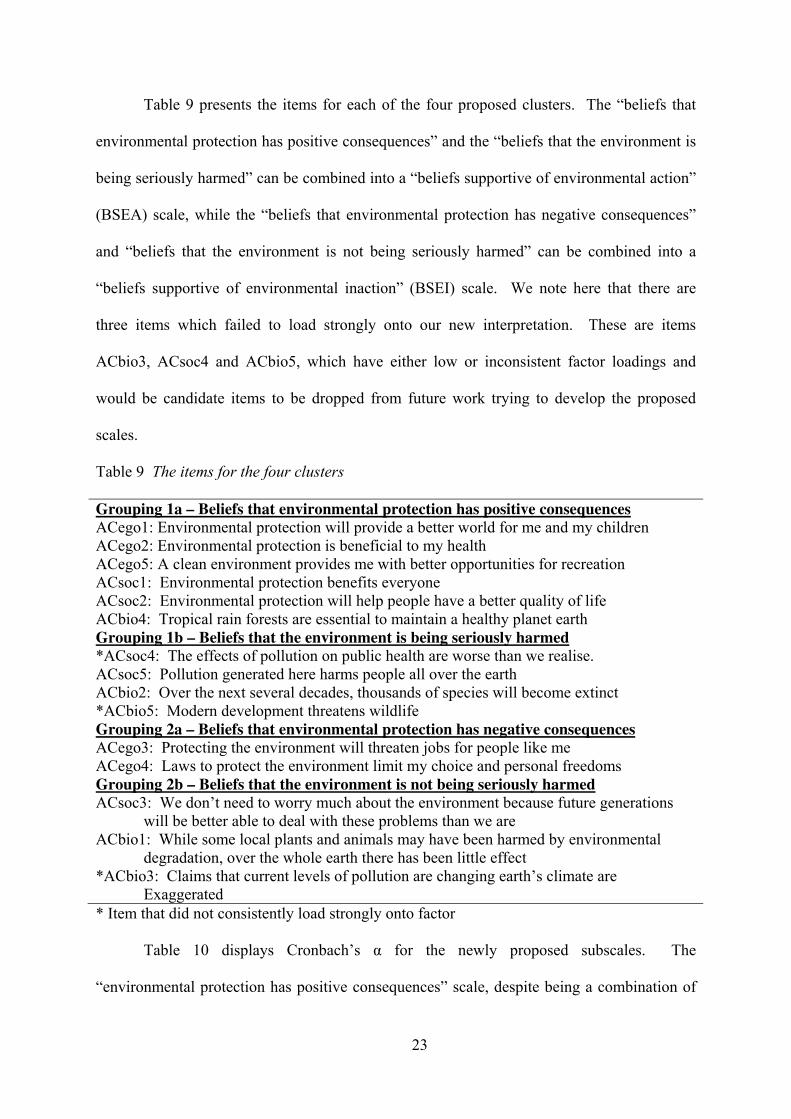
Table 9 presents the items for each of the four proposed clusters. The “beliefs that
environmental protection has positive consequences” and the “beliefs that the environment is
being seriously harmed” can be combined into a “beliefs supportive of environmental action”
(BSEA) scale, while the “beliefs that environmental protection has negative consequences”
and “beliefs that the environment is not being seriously harmed” can be combined into a
“beliefs supportive of environmental inaction” (BSEI) scale. We note here that there are
three items which failed to load strongly onto our new interpretation. These are items
ACbio3, ACsoc4 and ACbio5, which have either low or inconsistent factor loadings and
would be candidate items to be dropped from future work trying to develop the proposed
scales.
Table 9 The items for the four clusters
Grouping 1a – Beliefs that environmental protection has positive consequences
ACego1: Environmental protection will provide a better world for me and my children
ACego2: Environmental protection is beneficial to my health
ACego5: A clean environment provides me with better opportunities for recreation
ACsoc1: Environmental protection benefits everyone
ACsoc2: Environmental protection will help people have a better quality of life
ACbio4: Tropical rain forests are essential to maintain a healthy planet earth
Grouping 1b – Beliefs that the environment is being seriously harmed
*ACsoc4: The effects of pollution on public health are worse than we realise.
ACsoc5: Pollution generated here harms people all over the earth
ACbio2: Over the next several decades, thousands of species will become extinct
*ACbio5: Modern development threatens wildlife
Grouping 2a – Beliefs that environmental protection has negative consequences
ACego3: Protecting the environment will threaten jobs for people like me
ACego4: Laws to protect the environment limit my choice and personal freedoms
Grouping 2b – Beliefs that the environment is not being seriously harmed
ACsoc3: We don’t need to worry much about the environment because future generations
will be better able to deal with these problems than we are
ACbio1: While some local plants and animals may have been harmed by environmental
degradation, over the whole earth there has been little effect
*ACbio3: Claims that current levels of pollution are changing earth’s climate are
Exaggerated
* Item that did not consistently load strongly onto factor
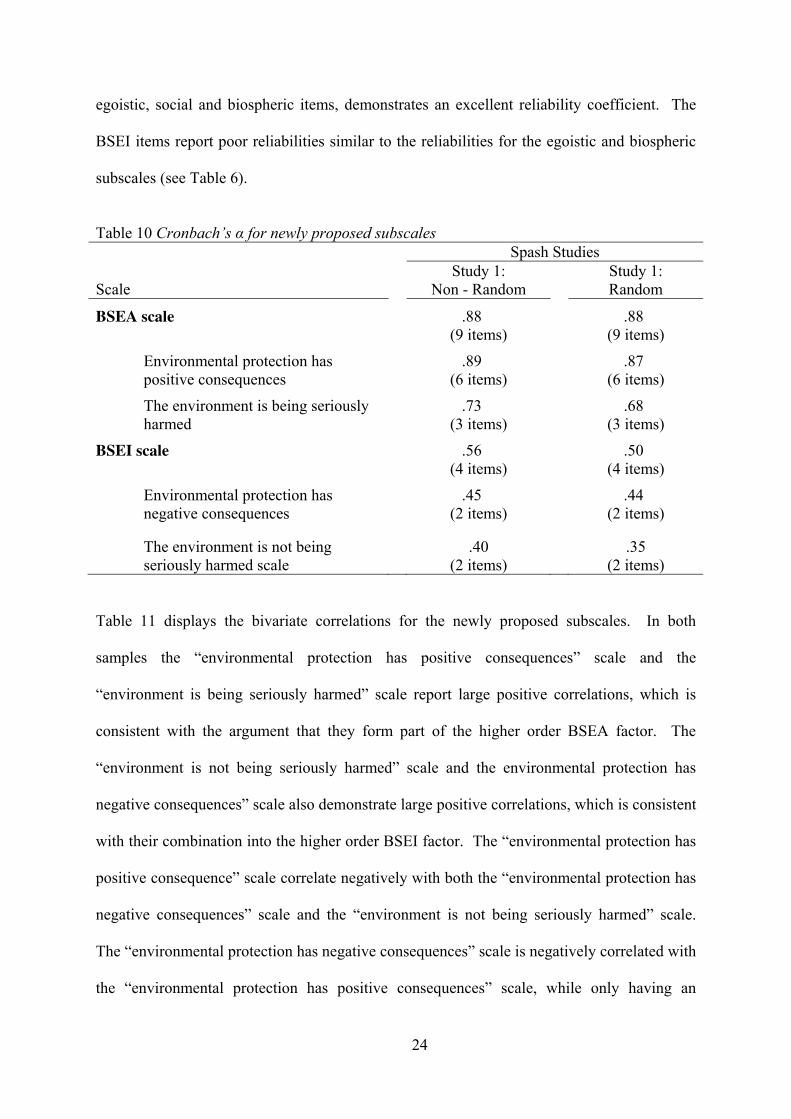
Table 10 displays Cronbach’s α for the newly proposed subscales. The
“environmental protection has positive consequences” scale, despite being a combination of
24
egoistic, social and biospheric items, demonstrates an excellent reliability coefficient. The
BSEI items report poor reliabilities similar to the reliabilities for the egoistic and biospheric
subscales (see Table 6).
Table 10 Cronbach’s α for newly proposed subscales
Spash Studies
Scale
Study 1:
Non - Random
Study 1:
Random
BSEA scale
.88
(9 items)
.88
(9 items)
Environmental protection has
positive consequences
.89
(6 items)
.87
(6 items)
The environment is being seriously
harmed
.73
(3 items)
.68
(3 items)
BSEI scale
.56
(4 items)
.50
(4 items)
Environmental protection has
negative consequences
.45
(2 items)
.44
(2 items)
The environment is not being
seriously harmed scale
.40
(2 items)
.35
(2 items)
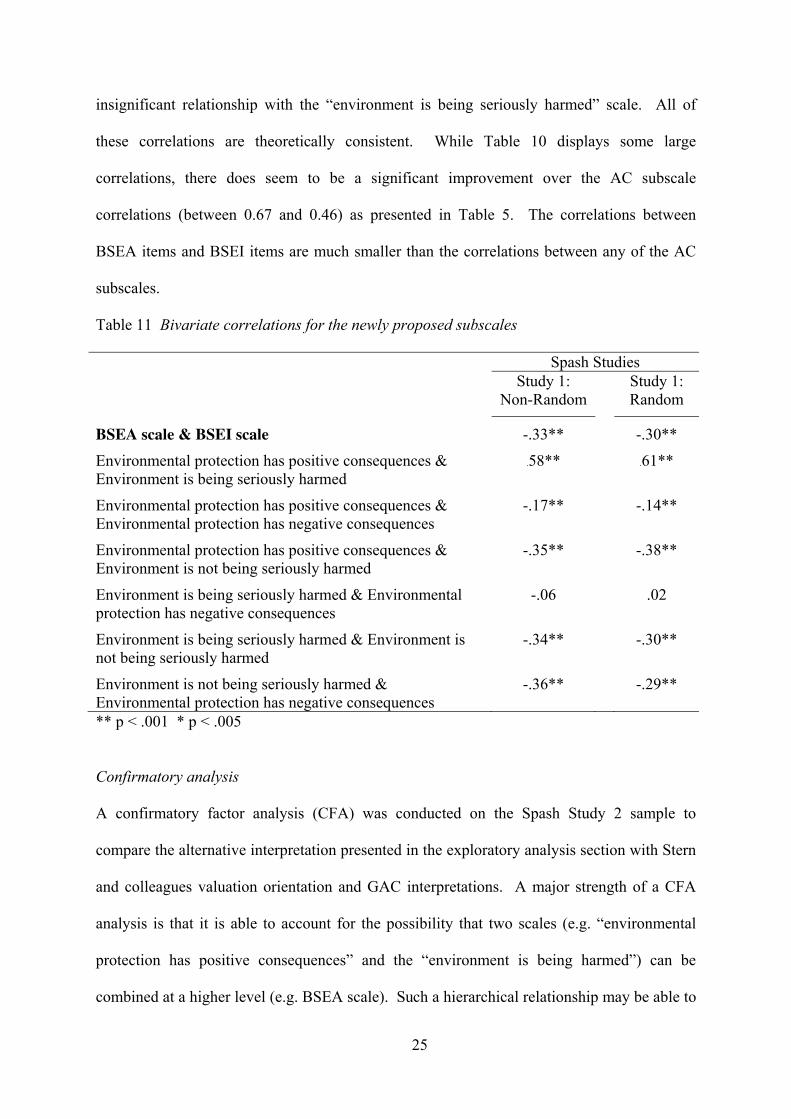
Table 11 displays the bivariate correlations for the newly proposed subscales. In both
samples the “environmental protection has positive consequences” scale and the
“environment is being seriously harmed” scale report large positive correlations, which is
consistent with the argument that they form part of the higher order BSEA factor. The
“environment is not being seriously harmed” scale and the environmental protection has
negative consequences” scale also demonstrate large positive correlations, which is consistent
with their combination into the higher order BSEI factor. The “environmental protection has
positive consequence” scale correlate negatively with both the “environmental protection has
negative consequences” scale and the “environment is not being seriously harmed” scale.
The “environmental protection has negative consequences” scale is negatively correlated with
the “environmental protection has positive consequences” scale, while only having an
25
insignificant relationship with the “environment is being seriously harmed” scale. All of
these correlations are theoretically consistent. While Table 10 displays some large
correlations, there does seem to be a significant improvement over the AC subscale
correlations (between 0.67 and 0.46) as presented in Table 5. The correlations between
BSEA items and BSEI items are much smaller than the correlations between any of the AC
subscales.
Table 11 Bivariate correlations for the newly proposed subscales
Spash Studies
Study 1:
Non-Random
Study 1:
Random
BSEA scale & BSEI scale -.33** -.30**
Environmental protection has positive consequences &
Environment is being seriously harmed
.58** .61**
Environmental protection has positive consequences &
Environmental protection has negative consequences
-.17** -.14**
Environmental protection has positive consequences &
Environment is not being seriously harmed
-.35** -.38**
Environment is being seriously harmed & Environmental
protection has negative consequences
-.06 .02
Environment is being seriously harmed & Environment is
not being seriously harmed
-.34** -.30**
Environment is not being seriously harmed &
Environmental protection has negative consequences
-.36** -.29**
** p < .001 * p < .005
Confirmatory analysis
A confirmatory factor analysis (CFA) was conducted on the Spash Study 2 sample to
compare the alternative interpretation presented in the exploratory analysis section with Stern
and colleagues valuation orientation and GAC interpretations. A major strength of a CFA
analysis is that it is able to account for the possibility that two scales (e.g. “environmental
protection has positive consequences” and the “environment is being harmed”) can be
combined at a higher level (e.g. BSEA scale). Such a hierarchical relationship may be able to
26
explain a significantly higher proportion of the variance of the scale than the Principal Axis
FA conducted on the AC scale.
The CFA compares Stern’s GAC interpretation (model 1), Stern’s value orientation
interpretation (model 2), the proposed two factor beliefs supportive of environmental
action/inaction interpretation (model 3), outlined in the previous section, and the hierarchical
interpretation outlined in Table 9. Structural analysis was conducting in Amos 17.0 using the
maximum likelihood method. Criteria usually thought to indicate an acceptable fit are: ≤ 3
for χ2/df, RMSEA ≤ .6 and the other fit indices (NFI, TLI, GFI, AGFI) ≥ .95 (Schreiber,
Nora, Stage, Barlow, & King, 2006). The CFA conducted on the generally accepted EC
scales, however, have reported CFA results where χ2/df ≤ 4 for, RMSEA ≤ .9 and the other
fit indices (NFI, TLI, GFI, AGFI) ≥ .90 (see Milfont et al., 2006; Schultz, 2000, 2001;
Snelgar, 2006). Nested models can also be compared with the χ2diff test. Models which are
not nested can be compare with the AIC and BIC statistics, where smaller AIC and BIC
statistics represent a better model.
When analysing the SEM for the hierarchical model proposed in Table 9, the 2nd
order
factor “environment is being seriously harmed” was found to report a variance greater than 1
and one of the items on this 2nd
order factor also reported a standardised coefficient greater
than 1. This suggests that the BSEI scale should not be further divided into 2nd
order-factors.
The hierarchal model (model 4) is therefore presented as having 2nd
order factors for the
BSEA scale, but not for BSEI scale (see Figure 5).
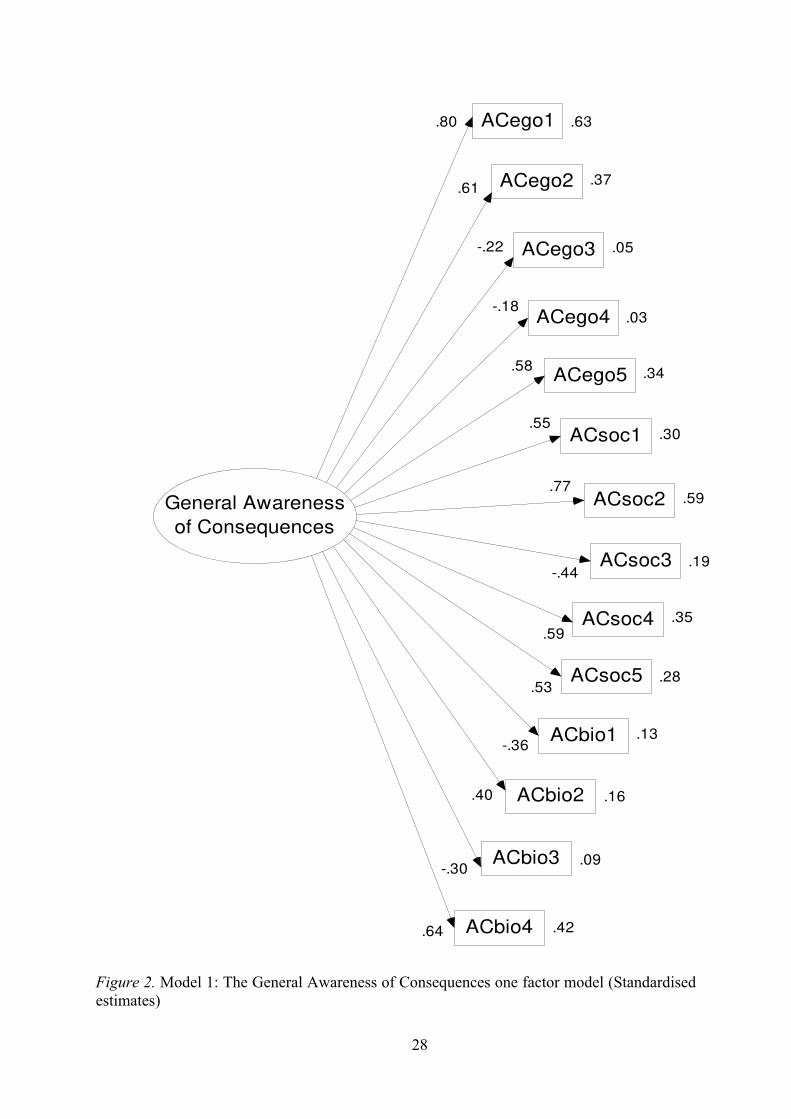
Table 12 displays the χ2 and fit indices outcomes for each model. Figure 2 illustrates
the estimated standardised regression weights and the variance of each observed variable for
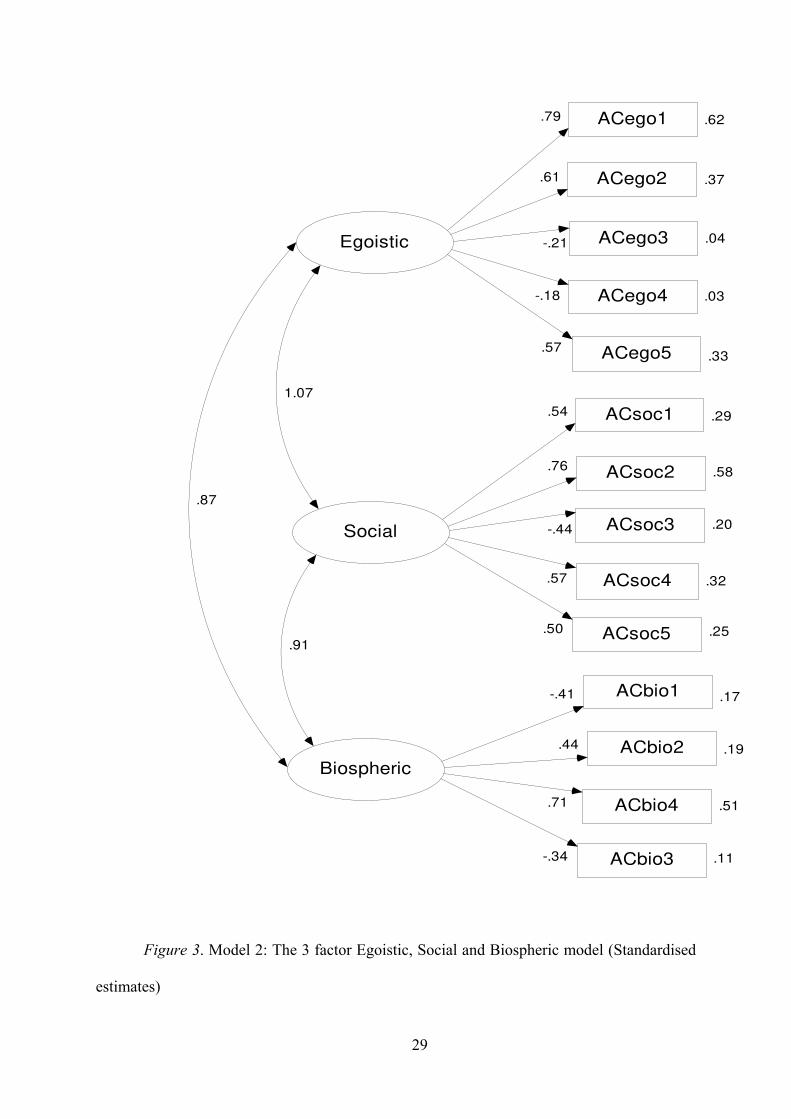
model 1. Figure 3 depicts model 2, with this model also displaying correlations between the
egoistic, social and biospheric scales. While model 2 was found to report a significantly
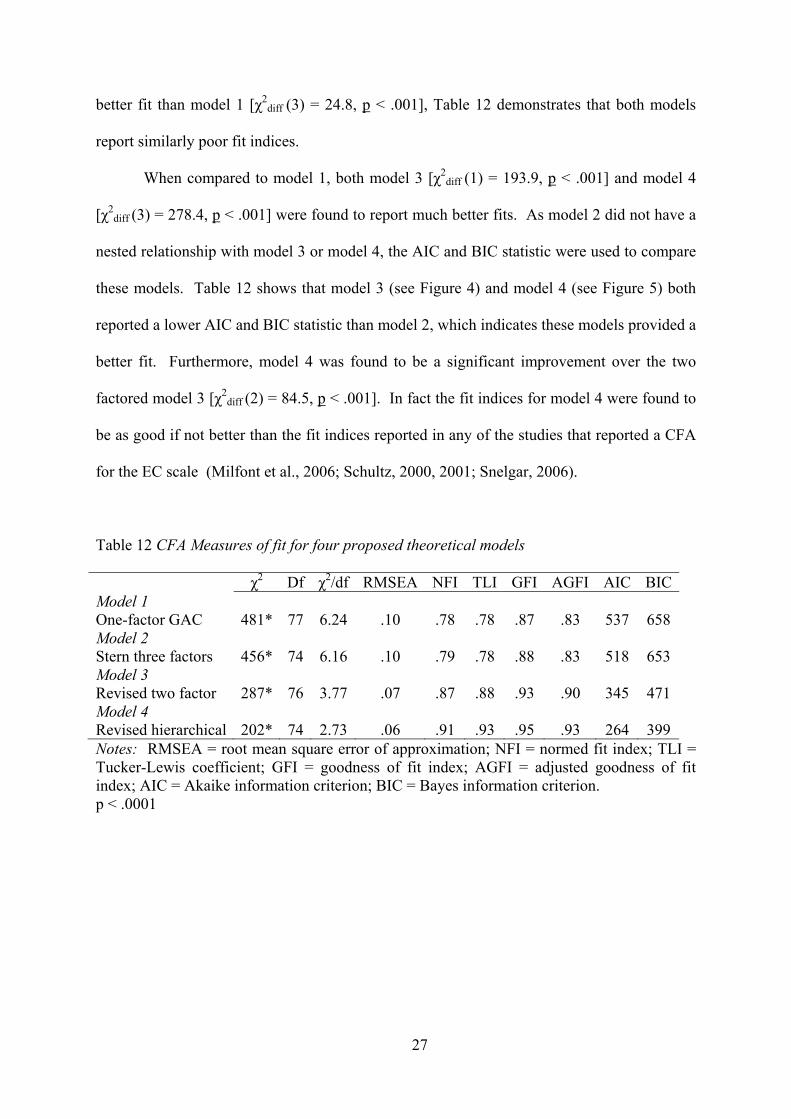
27
better fit than model 1 [χ2diff (3) = 24.8, p < .001], Table 12 demonstrates that both models
report similarly poor fit indices.
When compared to model 1, both model 3 [χ2diff (1) = 193.9, p < .001] and model 4
[χ2diff (3) = 278.4, p < .001] were found to report much better fits. As model 2 did not have a
nested relationship with model 3 or model 4, the AIC and BIC statistic were used to compare
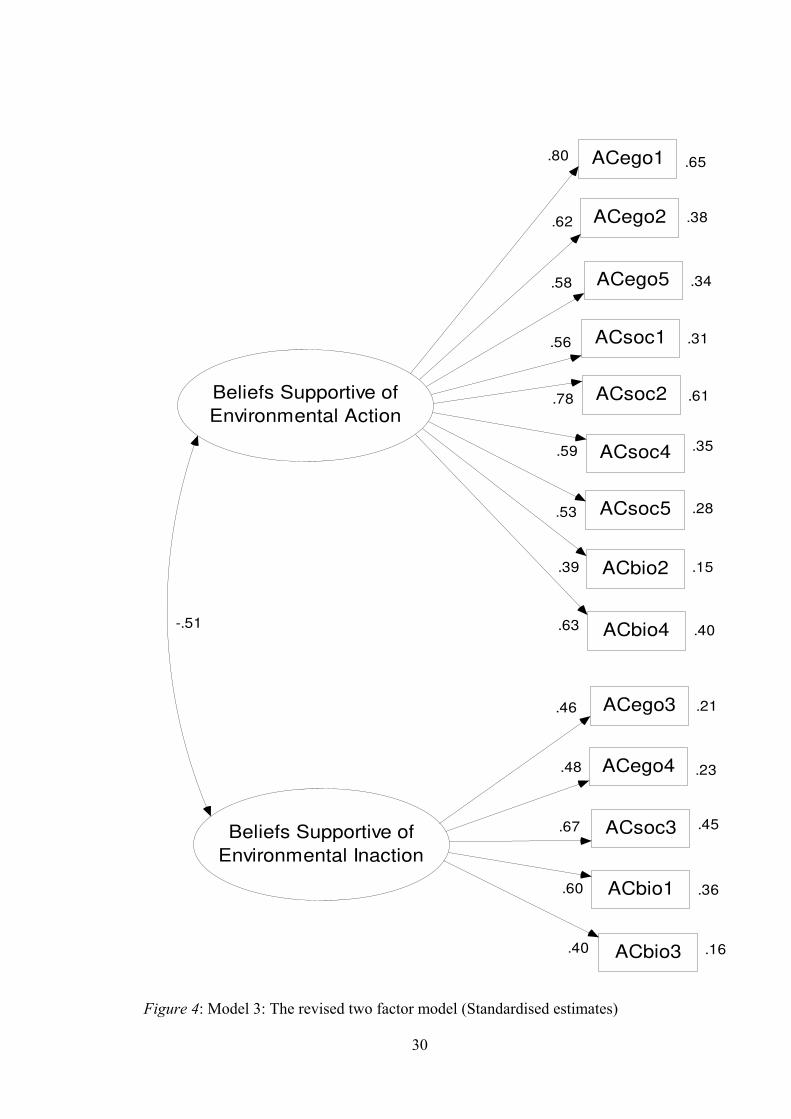
these models. Table 12 shows that model 3 (see Figure 4) and model 4 (see Figure 5) both
reported a lower AIC and BIC statistic than model 2, which indicates these models provided a
better fit. Furthermore, model 4 was found to be a significant improvement over the two
factored model 3 [χ2diff (2) = 84.5, p < .001]. In fact the fit indices for model 4 were found to
be as good if not better than the fit indices reported in any of the studies that reported a CFA
for the EC scale (Milfont et al., 2006; Schultz, 2000, 2001; Snelgar, 2006).
Table 12 CFA Measures of fit for four proposed theoretical models
χ2 Df χ2
/df RMSEA NFI TLI GFI AGFI AIC BIC
Model 1
One-factor GAC 481* 77 6.24 .10 .78 .78 .87 .83 537 658
Model 2
Stern three factors 456* 74 6.16 .10 .79 .78 .88 .83 518 653
Model 3
Revised two factor 287* 76 3.77 .07 .87 .88 .93 .90 345 471
Model 4
Revised hierarchical 202* 74 2.73 .06 .91 .93 .95 .93 264 399
Notes: RMSEA = root mean square error of approximation; NFI = normed fit index; TLI =
Tucker-Lewis coefficient; GFI = goodness of fit index; AGFI = adjusted goodness of fit
index; AIC = Akaike information criterion; BIC = Bayes information criterion.
p < .0001
28
General Awareness
of Consequences
.63ACego1
.37ACego2
.34ACego5
.30ACsoc1
.59ACsoc2
.28ACsoc5
.05ACego3
.03ACego4
.42ACbio4
.16ACbio2
.19ACsoc3
.55
.77
.53
-.44
.64
.58
-.18
.80
.13ACbio1-.36
.09ACbio3
.40
-.30
-.22
.61
.35ACsoc4.59
Figure 2. Model 1: The General Awareness of Consequences one factor model (Standardised
estimates)
29
Social
.62ACego1
.37ACego2
.33ACego5
.29ACsoc1
.58ACsoc2
.25ACsoc5
.04ACego3
.03ACego4
.51ACbio4
.19ACbio2
Biospheric
Egoistic
.20ACsoc3
.76
.79
.91
1.07
.17ACbio1
.11ACbio3
.32ACsoc4
.87
.54
-.21
-.18
.57
-.44
.57
.50
-.41
.44
.71
-.34
.61
Figure 3. Model 2: The 3 factor Egoistic, Social and Biospheric model (Standardised
estimates)
30
.65ACego1
.38ACego2
.34ACego5
.31ACsoc1
.61ACsoc2
.28ACsoc5
.21ACego3
.23ACego4
.40ACbio4
.15ACbio2
.45ACsoc3
Beliefs Supportive of
Environmental Action
Beliefs Supportive of
Environmental Inaction
-.51
.36ACbio1
.16ACbio3
.35ACsoc4
.80
.62
.58
.56
.78
.59
.53
.39
.63
.46
.48
.67
.60
.40
Figure 4: Model 3: The revised two factor model (Standardised estimates)
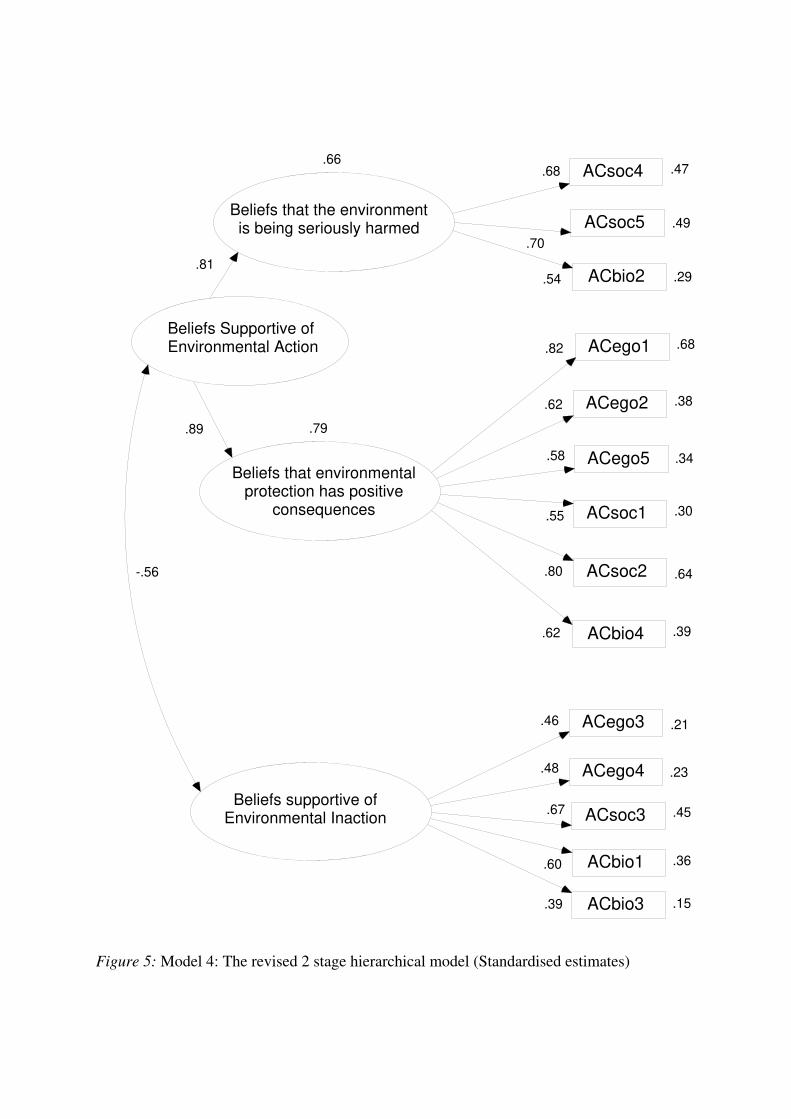
Figure 5: Model 4: The revised 2 stage hierarchical model (Standardised estimates)
.79
Beliefs that environmentalprotection has positive
consequences
.68ACego1
.38ACego2
.34ACego5
.30ACsoc1
.64ACsoc2
.49ACsoc5
.21ACego3
.23ACego4
.39ACbio4
.29ACbio2
.66
Beliefs that the environmentis being seriously harmed
.45ACsoc3
Beliefs Supportive of Environmental Action
Beliefs supportive of Environmental Inaction
.15ACbio3
.36ACbio1
.47ACsoc4
.81
-.56
.89
.68
.70
.54
.82
.62
.58
.55
.80
.62
.46
.48
.67
.60
.39
32
DISCUSSION AND CONCLUSIONS
Environmental psychologists investigate human behaviour and how it might be changed to
avoid environmental degradation. These constructs when placed into behaviour models can
feed into a policy process and influence regulatory design. Behavioural models are often
general in nature and can be applied to a variety of topics such as political action, recycling
and household water management. The potential for direct policy relevance relates to
correctly understanding the key motive and barriers to human action and for some
behavioural models this requires outlining an empirically verifiable relationship between
“held values” and other environmental cognitions.
Stern et al. designed the AC scale in order to test the proposition that people
cognitively differentiate between egoistic, social and biospheric concerns when assessing
beliefs about adverse general environmental consequences. The VBN model has made a
significant contribution to the environmental attitude-behaviour literature. However, the
results of the current study indicate that VBN value orientations are not influential in
organising general beliefs about environmental consequences. AC items, which are
representative of media statements and everyday comments, and therefore are of general
public interest, do not seem to be cognitively organised according to the assumptions of the
VBN model.
A questionnaire design that encourages participants to assess their beliefs on emotive
and subjective criteria, such as the EC scale, would seem to be required in order to develop a
scale that measures such constructs. If this is so, a scale trying to measure VBN value
orientations based on general statements of awareness of consequences could not be
improved by simply adding more items or designing ‘better’ items in the same mode. A
more emotive approach would be required to increase the salience of an individual’s value
orientation on the construction of the belief, such as asking participants to assess their
33
concerns about valued objects. In addition, value orientations may directly influence other
emotional cognitions such as environmental norms and expectations.
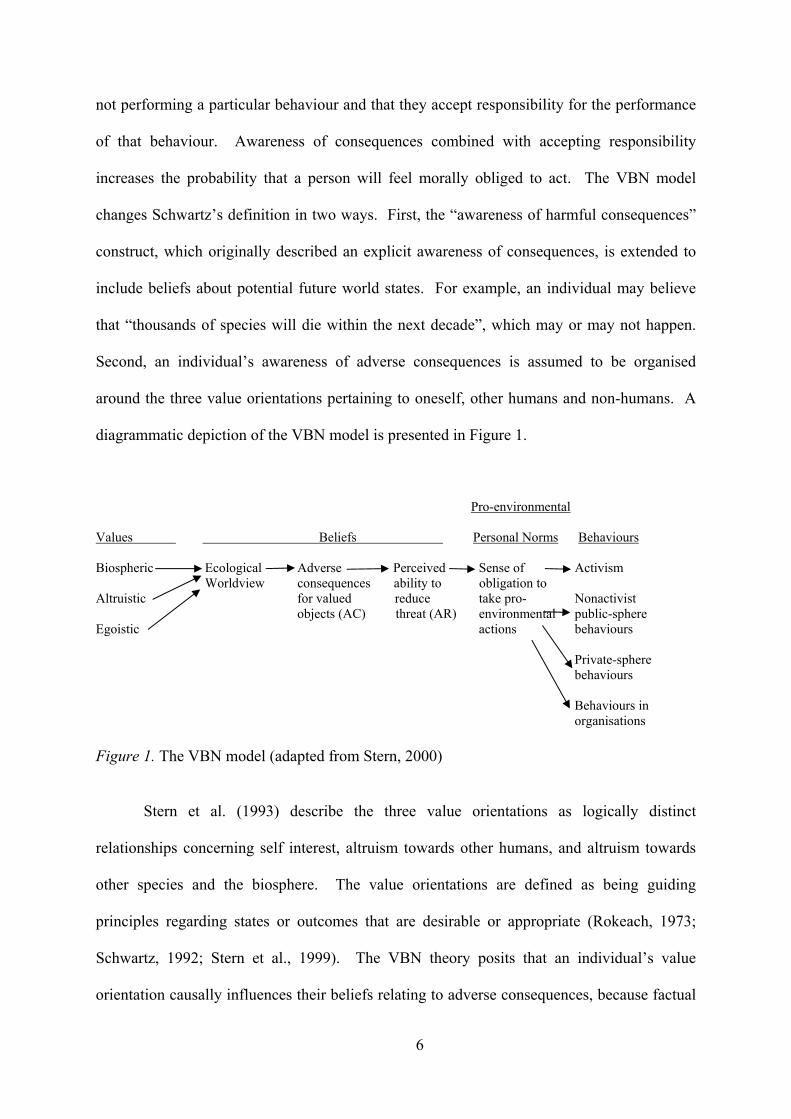
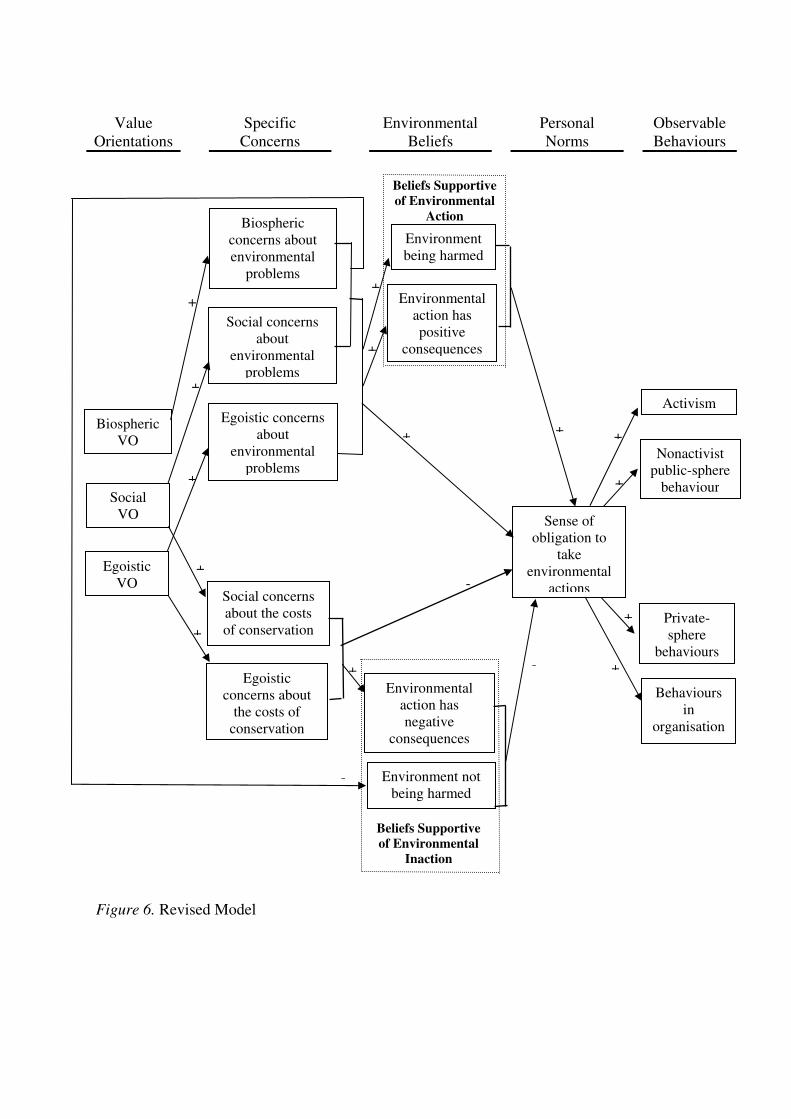
A revised model is proposed in Figure 6, which is consistent with empirical findings
for the current study and Snelgar. Based on the findings of both an exploratory and
confirmatory FA, “beliefs supportive of environmental action” appear to be influenced by
egoistic, social or biospheric concerns about environmental problems. Furthermore they can
be separated into “beliefs about the environment being seriously harmed” and “beliefs about
environmental protection having positive consequences”. While the current study, unlike
Snelgar's, did not find that “beliefs supportive of environmental inaction” can be similarly
separated into two components, we suggest this relationship should be further explored.
A possible relationship is that biospheric concerns about environmental problems are
negatively correlated with “beliefs that the environment is not being seriously harmed” (or
“beliefs supportive of environmental inaction”, if no second order factor is found). Social
and egoistic concerns about the costs of conservation should be positively correlated with
“beliefs that environmental action has negative consequences” (or “beliefs supportive of
environmental inaction”, if no second order factor is found). In future work there needs to be
some account taken of the relationships between environmental concern and environmental
beliefs.
Our exploratory and confirmatory FA presents evidence that people have a tendency
to differentiate between environmental action and inaction. There is also some evidence that
respondents differentiated between the environment being harmed and the benefits of
environmental protection. An improved BSEI scale should be developed. The relative
weakness of this scale is unsurprising given that it arises from items designed for a different
purpose (i.e. to measure AC beliefs). The BSEI scale could therefore be improved by
dropping some items (e.g. ACbio3 and ACsoc4), adapting others, and adding new items.
34
This process would also benefit from working with a far greater number of items than has
been typical in research on the AC scale. We note that the confirmatory analysis conducted
on hierarchical model 4, which is made up of items which could be refined, reported fit
indices on par, if not better than the indices reported for the EC scale.
These findings also shed light on some of the measurement anomalies in the AC scale
literature. Where subscale reliabilities have proven satisfactory this may be due to a high
proportion of environmental action items. Thus, the AC social subscale has four out of five
of its items classified into the BSEA factor and was found to have higher reliabilities than the
other subscales. The fact that different concepts are being measured than those assumed by
VBN theory also explains why the AC egoistic subscale has previously been found to be
insignificantly correlated with the EC egoistic subscale and Schwartz’s self enhancement
scale. This is also an alternative explanation, to the one factor GAC interpretation, for the
high correlations between the egoistic, social and biospheric AC subscales.
The results presented here indicate that the scales being employed to measure
egoistic, altruistic and biospheric value orientations actually relate to beliefs about whether
environmental action or inaction is required. “Beliefs Supportive of environmental action”
can be further classified into “beliefs about environmental harm being serious” and “beliefs
that environmental action has positive consequences”. Improving a reinterpreted scale as a
measure of these concepts seems worthwhile. This suggests a new relationship between
environmental concerns and beliefs. A more sophisticated understanding of this relationship
could aid environmental policy by supplying a new means of identifying motives behind and
barriers to behavioural change.
Value
Orientations Specific
Concerns Environmental
Beliefs Personal
Norms Observable
Behaviours
Figure 6. Revised Model
Social VO
Biospheric VO
Egoistic VO
Social concerns about
environmental problems
Egoistic concerns about
environmental problems
Social concerns about the costs of conservation
Egoistic concerns about
the costs of conservation
Sense of obligation to
take environmental
actions
Activism
Nonactivist public-sphere
behaviour
Private-sphere
behaviours
Behaviours in
organisation
+
+
+
+
+
+
+ + +
+
+
++
-
-
Biospheric concerns about environmental
problems
Environmental action has negative
consequences
Environment not being harmed
-
Environmental action has positive
consequences
+
-
Beliefs Supportive
of Environmental
Inaction
Beliefs Supportive
of Environmental
Action
Environment being harmed
36
ACKNOWLEDGEMENTS
Study 1 was sponsored by the European Commission DG XII under the project on “Social
Processes of Environmental Valuation” co-ordinated by Martin O’Connor, EC contract
ENV4-CT96-0226; the final report can be found on-line at http://alba.jrc.it/valse/report.htm.
Study 2 was part of the European Community project “Integrated Evaluation for Sustainable
River Basin Governance” (ADVISOR), co-ordinated by Paula Antunes, EC Contract EVK1-
CT-2000-00074 under the Framework V, Energy, Environment and Sustainable Development
RTD Programme.
REFERENCES CITED
Ajzen, I. (1991). The theory of planned behavior. Organizational Behavior and Human
Decision Making Processes, 50(2), 179-211.
Anderson, C. J. (2003). The psychology of doing nothing: Forms of decision avoidance result
from reason and emotion. Psychological Bulletin, 129(1), 139-167.
Bryman, A. (1988). Quantity and quality in social research (Vol. 18). London: Unwin
Hyman.
Croft, W. A., & Cruse, D. A. (2004). Cognitive linguistics. Cambridge: Cambridge
University Press.
De Groot, J. I. M., & Steg, L. (2007). Value orientations and environmental beliefs in five
countries: Validity of an instrument to measure egoistic, altruistic and biospheric
value orientations. Journal of Cross-Cultural Psychology, 38(3), 318-332.
De Groot, J. I. M., & Steg, L. (2008). Value orientations to explain beliefs related to
environmental significant behaviour: How to measure egoistic, altruistic and
biospheric value orientations. Environment and Behavior, 40(3), 330-354.
Dhar, R. (1996). The effect of decision strategy on the decision to defer choice. Journal of
Behavioural Decision Making, 9(4), 265-281.
Dunlap, R. E., & Van Liere, K. D. (1978). The "new environmental paradigm": A proposed
measuring instrument and preliminary results. Journal of Environmental Education, 9,
10-19.
Dunlap, R. E., Van Liere, K. D., Mertig, A. G., & Jones, R. E. (2000). Measuring
endorsement of the new ecological paradigm: A revised NEP scale. Journal of Social
Issues, 56, 425-442.
Gärling, T., Fujii, S., Gärling, A., & Jakobsson, C. (2003). Moderating effects of social value
orientation on determinants of proenvironmental behavior intentions. Journal of
Environmental Psychology, 23(1), 1-9.
Grob, A. (1995). A structural model of environmental attitudes and behaviour. Journal of
Environmental Psychology, 15(3), 209-220.
Hansla, A., Gamble, A., Juliusson, A., & Gärling, T. (2008). The relationships between
awareness of consequences, environmental concern, and value orientation. Journal of
Environmental Psychology, 28(1), 1-9.
37
Hawcroft, L. J., & Milfont, T. L. (2010). The use (and abuse) of the new environmental
paradigm scale over the last 30 years: A meta-analysis. Journal of Environmental
Psychology, 30(2), 143-158.
Heberlein, T. A. (1981). Environmental attitudes. Zeitschrift für Umweltpolitik, 2, 241-270.
Higgins, E. T. (1987). Self-discrepancy: A theory relating to self and affect. Psychological
Review, 94(3), 319-340.
Higgins, E. T. (2000). Beyond pleasure and pain. In E.T. Higgins & A. W. Kruglanski (Eds.),
Motivational Science: Social and Personality Perspectives (pp. 231-255).
Philadelphia: Psychology Press: Taylor & Francis Group.
Homburg, A., & Stolberg, A. (2006). Explaining pro-environmental behavior with a
cognitive theory of stress. Journal of Environmental Psychology, 26(1), 1-14.
Joireman, J. A., Lasane, T. P., Bennett, J., Richards, D., & Solaimani, S. (2001). Integrating
social value orientation and the consideration of future consequences within the
extended norm activation model of proenvironmental behaviour. British Journal of
Social Psychology, 40(1), 133-155.
Kahneman, D., Knetsch, J. L., & Thaler, R. H. (1990). Experimental tests of the endowment
effect and the coase theorem. Journal of Political Economy, 98(6), 1325-1348.
Kahneman, D., Knetsch, J. L., & Thaler, R. H. (1991). Anomalies: The endowment effect,
loss aversion, and status-quo bias. Journal of Economic Perspectives, 5(1), 193-206.
Kahneman, D., & Tversky, A. (1979). Prospect theory: An analysis of decision under risk.
Econometrica, XLVII, 263-291.
Kaiser, F. G., Hübner, G., & Bogner, F. X. (2005). Contrasting the theory of planned
behavior with the value-belief-norm model in explaining conservation behavior.
Journal of Applied Social Psychology, 35(10), 2150-2170.
Knetsch, J. L. (1994). Environmental valuations: Some problems of wrong questions and
misleading answers. Environmental Values, 3(4), 351-368.
Knetsch, J. L. (2005). Gains, losses, and the US EPA economic analyses guidelines: A
hazardous product? Environmental & Resource Economics, 32(1), 91-112.
Lakoff, G. (1987). Women, fire, and dangerous things: What categories reveal about the
mind. Chicago: CSLI.
Milfont, T. L., & Duckitt, J. (2004). The structure of environmental attitudes: A first and
second-order confirmatory analysis. Journal of Environmental Psychology, 24, 289-
303.
Milfont, T. L., Duckitt, J., & Cameron, L. D. (2006). A cross-cultural study of environmental
motive concerns and their implications for proenvironmental behavior. Environment
and Behavior, 38(6), 745-767.
Nordlund, A. M., & Garvill, J. (2003). Effects of values, problem awareness, and personal
norm on willingness to reduce personal car use. Journal of Environmental
Psychology, 23(4), 330-347.
Ohtomo, S., & Hirose, Y. (2007). The dual-process of reactive and intentional decision-
making involved in eco-friendly behavior. Journal of Environmental Psychology,
27(2), 117-125.
Oreg, S., & Katz-Gerro, T. (2006). Predicting proenvironmental behavior cross-nationality:
Values, the theory of planned behavior, and value-belief-norm theory. Environment
and Behavior, 38(4), 462-483.
Pinker, S. (1998). How the mind works. London: Penguin Group.
Pinker, S. (2007). The stuff of thought. London: Allen Lane.
Ritov, I., & Baron, J. (1990). Reluctance to vaccinate: Omission bias and ambiguity. Journal
of Behavioural Decision Making, 3(4), 263-277.
38
Ritov, I., & Baron, J. (1992). Status quo and omission biases. Journal of Risk and
Uncertainty, 5(1), 49-62.
Rokeach, M. (1973). The nature of human values. New York: Free Press.
Ryan, A., & Spash, C. L. (2008). Measuring "Awareness of Environmental Consequences":
Two Scales and Two Interpretations, Socio-Economics and Environment in
Discussion (SEED) Working Papers. Canberra, Australia: Commonwealth Scientific
and Industrial Research Organisation (CSIRO).
Samuelson, W., & Zeckhauser, R. (1988). Status quo bias in decision making. Journal of Risk
and Uncertainty, 1(1), 7-59.
Schreiber, J. B., Nora, A., Stage, F. K., Barlow, E. A., & King, J. (2006). Reporting structural
equation modeling and confirmatory factor analysis results: A review. The Journal of
Educational Research, 99(6), 323-338.
Schultz, P. W. (2000). Empathizing with nature: The effects of perspective taking on concern
for environmental issues. Journal of Social Issues, 56(3), 391-406.
Schultz, P. W. (2001). The structure of environmental concern: Concern for self, other people
and the biosphere. Journal of Environmental Psychology, 21(4), 327-339.
Schultz, P. W., Shriver, C., Tabanico, J. J., & Khazian, A. M. (2004). Implicit connections
with nature. Journal of Environmental Psychology., 24(4), 31-42.
Schwartz, S. H. (1977). Normative influences on altruism. In L. Berkowitz (Ed.), Advances in
experimental social psychology (Vol. 10, pp. 221-279). San Diego: Academic Press.
Schwartz, S. H. (1992). Universals in the content and structure of values: Theoretical
advances and empirical tests in 20 countries. In M. P. Zanna (Ed.), Advances in
experimental social psychology. (Vol. 25, pp. 1-65). Orlando, Fl: Academic.
Schwarz, N. (1999). Self-reports: How the questions shape the answers. American
Psychologist, 54(2), 93-105.
Schwarz, N. (2007a). Attitude construction: Evaluation in context. Social Cognition, 25(5),
638-656.
Schwarz, N. (2007b). Cognitive aspects of survey methodology. Applied Cognitive
Psychology, 21(2), 277-287.
Schwarz, N., & Bohner, G. (2001). The construction of attitudes. In A. Tesser & N. Schwarz
(Eds.), Blackwell handbook of social psychology: Intraindividual processes (pp. 436-
457). Malden, MA: Blackwell.
Schwarz, N., & Strack, F. (1991). Context effects in attitude surveys: Applying cognitive
theory to social research. European Review of Social Psychology, 2(1), 31-50.
Schwarz, N., Strack, F., & Mai, H. P. (1991). Assimilation and contrast effects in part-whole
question sequence: A conversational logic analysis. Public Opinion Quarterly, 55(1),
3-23.
Semin, G. R., Higgins, T., Gil de Montes, L., Estourget, Y., & Valencia, J. F. (2005).
Linguistic signatures of regulatory focus: How abstraction fits promotion more than
prevention. Journal of Personality & Social Psychology, 89(1), 36-45.
Snelgar, R. S. (2006). Egoistic, altruistic, and biospheric environmental concerns:
Measurement and structure. Journal of Environmental Psychology, 26(2), 87-99.
Spash, C. L. (2000a). Multiple value expression in contingent valuation: Economics and
ethics. Environmental Science & Technology, 34(8), 1433-1438.
Spash, C. L. (2000b). Ethical motives and charitable contributions in contingent valuation:
Empirical evidence from social psychology and economics. Environmental Values,
9(4), 453-479.
Spash, C. L. (2000c). Ecosystems, contingent valuation and ethics: The case of wetlands re-
creation. Ecological Economics, 34(2), 195-215.
39
Spash, C. L. (2006). Non-economic motivation for contingent values: Rights and attitudinal
beliefs in the willingness to pay for environmental improvements. Land Economics,
82(4), 602-622.
Spash, C. L., Urama, K., Burton, R., Kenyon, W., Shannon, P., & Hill, G. (2009). Motives
behind willingness to pay for improving biodiversity in a water ecosystem:
Economics, ethics and social psychology. Ecological Economics, 68(4), 955-964
Steg, L., & De Groot, J. I. M. (2008). Value orientations to explain beliefs related to
environmental significant behavior: How to measure egoistic, altruistic, and
biospheric value orientations. Environment and Behavior, 40(3), 330-354.
Steg, L., Dreijerink, L., & Abrahamse, W. (2005). Factors influencing the acceptability of
energy policies: A test of VBN theory. Journal of Applied Psychology, 25(4), 415-
425.
Stern, P. C. (2000). Toward a coherent theory of environmentally significant behavior.
Journal of Social Issues, 56(Fall), 407-424.
Stern, P. C., & Dietz, T. (1994). The value basis of environmental concern. Journal of Social
Issues, 50(3), 65-84.
Stern, P. C., Dietz, T., Abel, T., Guagnano, G. A., & Kalof, L. (1999). A value-belief-norm
theory of support for social movements: The case for environmental concern. Human
Ecology Review, 6(2), 81-97.
Stern, P. C., Dietz, T., & Guagnano, G. A. (1995a). The new ecological paradigm in social-
psychological context. Environment and Behavior, 27(6), 723- 743.
Stern, P. C., Dietz, T., & Kalof, L. (1993). Value orientation, gender, and environmental
concern. Environment and Behavior, 25(3), 322-348.
Stern, P. C., Dietz, T., Kalof, L., & Guagnano, G. A. (1995b). Values, beliefs, and
proenvironmental action: Attitudes formation toward emergent attitude objects.
Journal of Applied Social Psychology, 25(18), 1611-1636.
Thompson, S. C. G., & Barton, M. A. (1994). Ecocentric and anthoropocentric attitudes
toward the environment. Journal of Environmental Psychology, 14, 149-157.
Tversky, A., & Kahneman, D. (1981). The framing of decisions and the psychology of
choice. Science, 211, 453-458.
Tykocinski, O. E., Pittman, T. S., & Tuttle, E. S. (1995). Inaction inertia: Foregoing future
benefits as a result of an initial failure to act. Journal of Personality & Social
Psychology, 68(5), 793-802.
Wang, X. T., Simons, F., & Bredart, S. (2001). Social cues and verbal framing in risky
choice. Journal of Behavioural Decision Making, 14(1), 1-15.