Embed Size (px)
Citation preview

Measuring What’s Hidden How College Physics Courses Implicitly Influence Student Beliefs
Darren Tarshis
April 7, 2008
Physics Honors Thesis
University of Colorado at Boulder
Committee Members:
Noah Finkelstein (Advisor) – Physics
John Cumalat (Honors Council member) – Physics
Steven Pollock – Physics
Valerie Otero – School of Education
Daniel Jones – Honors Program
Mary Nelson – Applied Mathematics
Rolf Norgaard – Program for Writing and Rhetoric, Honors Program

1
TABLE OF CONTENTS ABSTRACT……………………………………………………………………………….2
PREFACE…………………………………………………………………………………3
INTRODUCTION………………………………………………………………………...5
BACKGROUND
PER shifts its focus: from content, to student attitudes, beliefs, and values………6
The Hidden Curriculum………………………………………………………….10
What causes changes in student attitudes and beliefs? —A gap in the research...13
A STUDY OF HIDDEN CURRICULA
Overview…………………………………………………………………………13
Methodology —examples of how the rubrics were applied……………………..15
Methodology —survey design…………………………………………………...20
RESULTS AND ANALYSIS……………………………………………………………22
Dimension 1: Process vs. Product…………………………………………...…..23
Dimension 2: Source of Knowledge……………………………………….……..27
Dimension 3: Real World vs. Abstract………………………………….………..31
Dimension 4: Gender Bias vs. Gender Neutral………………...………………..34
Summary of Results…………………………………………...…………………36
LIMITATIONS AND FUTURE DIRECTIONS……………………...…………………38
CONCLUSION………………………………………………………..…………………39
APPENDIX
A1…………………………………………………………………………….…..41
A2…………………………………………………………………………….…..45
A3………………………………………………………………………………...48
A4………………………………………………………………………………...50
B………………………………………………………………………………….52
C1………………………………………………………………………………...54
C2…………………………………………………………………………….…..55
C3…………………………………………………………………………….…..56
C4………………………………………………………………………….……..57
REFERENCES……………………………………………………………..……………58

2
Abstract Educators devote most of their attention to students learning the subject matter of
a course. What is less recognized by educators, is that beyond learning the content,
students’ attitudes, beliefs, and values change too—sometimes in unexpected and
unintended ways. When something is not explicitly taught, but students learn it anyway,
it is part of the “hidden curriculum.” Because the explicit curriculum tends to focus on
content, it’s the hidden curriculum that influences students’ beliefs about the nature of
science, and the nature of learning science. This thesis presents a study of the hidden
curricula in three different introductory physics courses. All three are second semester
Electricity and Magnetism courses at the University of Colorado at Boulder. This
research focuses on four dimensions of the hidden curriculum: Process vs. Product,
Source of Knowledge, Real World vs. Abstract, and Gender Bias vs. Gender Neutral. In
order to measure these four dimensions of the hidden curricula of three courses, rubrics
have been developed, and course environments have been observed and measured using
these rubrics. Additionally, the impact that varying hidden curricula have on students is
addressed by surveying student beliefs. Results indicate that course practices implicitly
affect student attitudes and beliefs in a way that might be predictable by measuring the
hidden curriculum—especially for students with less strongly held beliefs. Furthermore,
the hidden curriculum sends mixed messages to students, and certain course elements
have greater influence on students’ beliefs than others (like lecture versus homework).
3
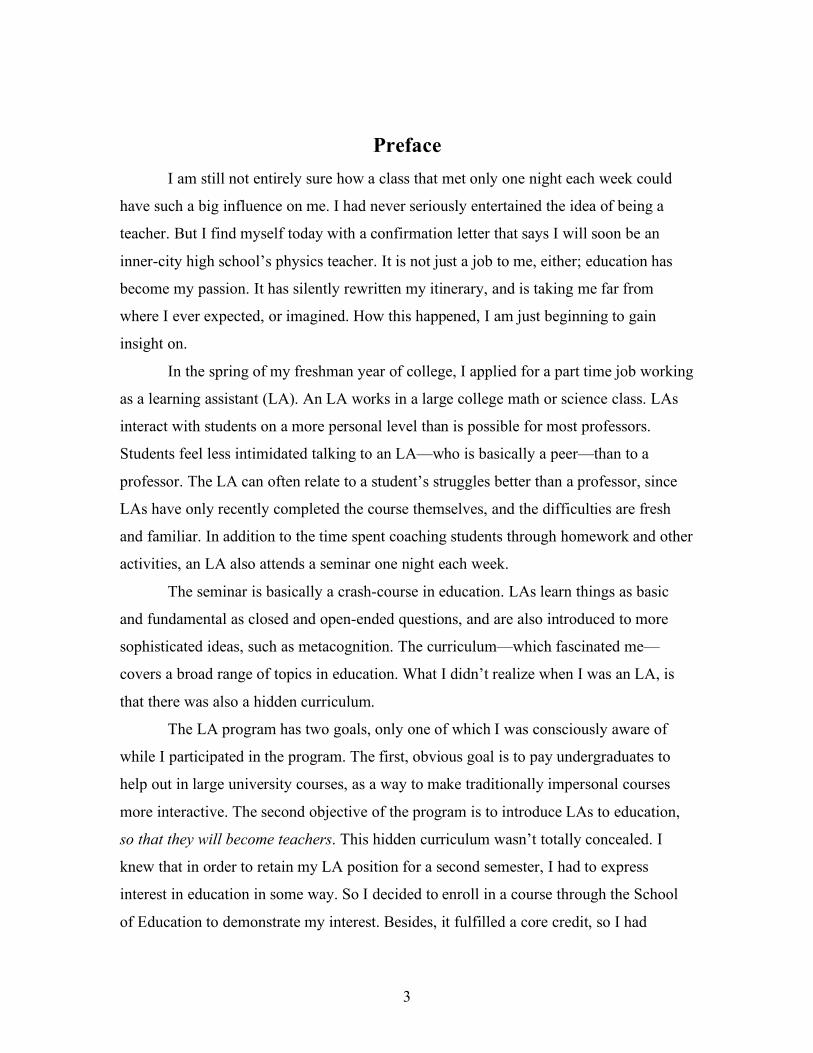
Preface I am still not entirely sure how a class that met only one night each week could
have such a big influence on me. I had never seriously entertained the idea of being a
teacher. But I find myself today with a confirmation letter that says I will soon be an
inner-city high school’s physics teacher. It is not just a job to me, either; education has
become my passion. It has silently rewritten my itinerary, and is taking me far from
where I ever expected, or imagined. How this happened, I am just beginning to gain
insight on.
In the spring of my freshman year of college, I applied for a part time job working
as a learning assistant (LA). An LA works in a large college math or science class. LAs
interact with students on a more personal level than is possible for most professors.
Students feel less intimidated talking to an LA—who is basically a peer—than to a
professor. The LA can often relate to a student’s struggles better than a professor, since
LAs have only recently completed the course themselves, and the difficulties are fresh
and familiar. In addition to the time spent coaching students through homework and other
activities, an LA also attends a seminar one night each week.
The seminar is basically a crash-course in education. LAs learn things as basic
and fundamental as closed and open-ended questions, and are also introduced to more
sophisticated ideas, such as metacognition. The curriculum—which fascinated me—
covers a broad range of topics in education. What I didn’t realize when I was an LA, is
that there was also a hidden curriculum.
The LA program has two goals, only one of which I was consciously aware of
while I participated in the program. The first, obvious goal is to pay undergraduates to
help out in large university courses, as a way to make traditionally impersonal courses
more interactive. The second objective of the program is to introduce LAs to education,
so that they will become teachers. This hidden curriculum wasn’t totally concealed. I
knew that in order to retain my LA position for a second semester, I had to express
interest in education in some way. So I decided to enroll in a course through the School
of Education to demonstrate my interest. Besides, it fulfilled a core credit, so I had
4
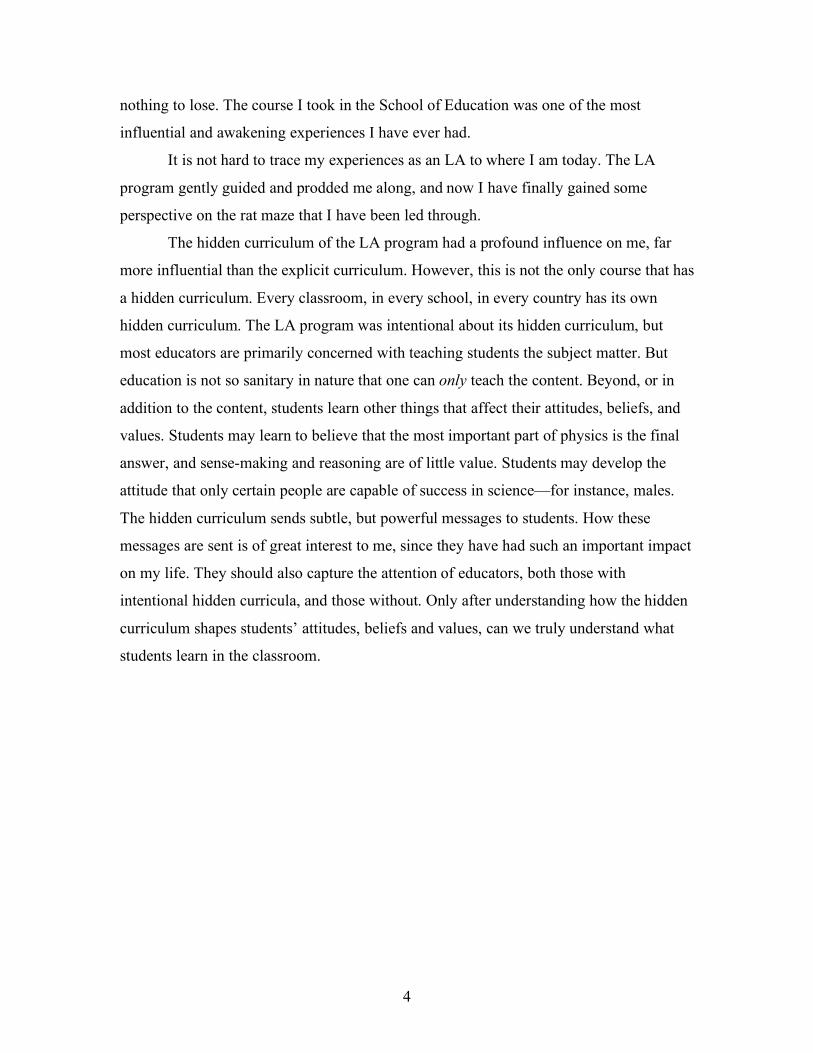
nothing to lose. The course I took in the School of Education was one of the most
influential and awakening experiences I have ever had.
It is not hard to trace my experiences as an LA to where I am today. The LA
program gently guided and prodded me along, and now I have finally gained some
perspective on the rat maze that I have been led through.
The hidden curriculum of the LA program had a profound influence on me, far
more influential than the explicit curriculum. However, this is not the only course that has
a hidden curriculum. Every classroom, in every school, in every country has its own
hidden curriculum. The LA program was intentional about its hidden curriculum, but
most educators are primarily concerned with teaching students the subject matter. But
education is not so sanitary in nature that one can only teach the content. Beyond, or in
addition to the content, students learn other things that affect their attitudes, beliefs, and
values. Students may learn to believe that the most important part of physics is the final
answer, and sense-making and reasoning are of little value. Students may develop the
attitude that only certain people are capable of success in science—for instance, males.
The hidden curriculum sends subtle, but powerful messages to students. How these
messages are sent is of great interest to me, since they have had such an important impact
on my life. They should also capture the attention of educators, both those with
intentional hidden curricula, and those without. Only after understanding how the hidden
curriculum shapes students’ attitudes, beliefs and values, can we truly understand what
students learn in the classroom.

5
Introduction College physics classes have historically acted as a filter; a small minority of
students passes through to become physicists, while the majority chooses different majors
and career paths. There are a variety of reasons for this. Most students—physics majors
included—consider physics to be a challenging subject. Many students believe that
physics has no connection to their lives. And for some students, physics just doesn’t
capture their interest. The statistics reveal the way physics classes “weed out” students.
Although the number of college students in the United States has doubled from about 8.5
million in 1970, to 17.5 million in 2005,1 the annual number of physics majors has
decreased from about 5,000 to 4,000 over the same time period.2 In fact, in 2004, only
0.6% of college students were physics majors.3
Meanwhile outside the classroom, the rapid development of technology is
changing society. Employers seek out graduates with technical and scientific knowledge.
Recently, members of the House of Representatives and the Senate asked what actions
policymakers could take to best ensure America’s future.4 A committee that included
CEOs, university presidents, and Nobel Prize winners published their recommendations
in 2007.5 One suggestion was to “increase the number and proportion of US citizens who
earn bachelor’s degrees in the physical sciences.”6 Society increasingly values science,
and many believe America’s future relies on it. As science permeates our culture, it is
becoming more important for the general population to be competent in physics.
Especially in a democracy, citizens should be knowledgeable about the issues that affect
politics, which are increasingly technological and scientific7–nuclear energy, space
exploration, and global warming. For these reasons, physics educators realized that it is
not all right for only a small group of students to understand physics; the greater
population needs to be educated as well.
Starting around 1980, a new scholarly endeavor began: Physics Education
Research (PER). In this relatively young research field, physicists collaborate with
education experts to study how students can best learn physics, and how instructors can
teach it most effectively. PER approaches education in a scientific way. Theories are
developed about how students learn, pedagogical (or teaching) experiments are
conducted, and data about what students learn (or don’t learn) is collected and analyzed.
6
The PER community has recognized that even smart, talented students struggle to learn
physics.7 Rather than label an individual as inadequate for failing to master physics, PER
looks to correct the shortcomings of physics instruction.
Background PER shifts its focus: from content, to student attitudes, beliefs, and values
Historically, PER has focused mainly on physics content: student conceptual
understanding, instructional strategies, problem solving, etc. In their (1999) summary of
the state of PER, McDermott and Redish8 list 224 publications in PER, of which the vast
majority—over 200—concern physics content. Because the PER community directed its
collective energy towards student content mastery, there has been significant progress in
this area. One of the most widely publicized observations to trigger an alarm was
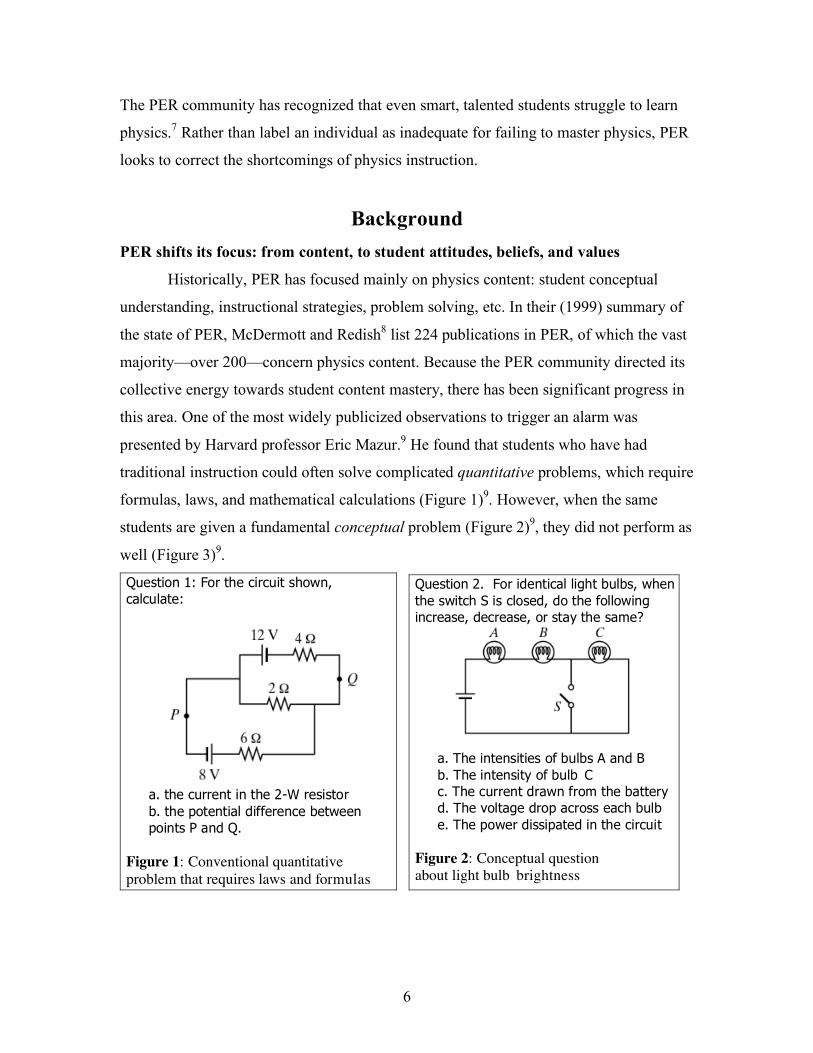
presented by Harvard professor Eric Mazur.9 He found that students who have had
traditional instruction could often solve complicated quantitative problems, which require
formulas, laws, and mathematical calculations (Figure 1)9. However, when the same
students are given a fundamental conceptual problem (Figure 2)9, they did not perform as
well (Figure 3)9.
Question 1: For the circuit shown,
calculate:
a. the current in the 2-W resistor
b. the potential difference between
points P and Q.
Figure 1: Conventional quantitative
problem that requires laws and formulas
Question 2. For identical light bulbs, when
the switch S is closed, do the following
increase, decrease, or stay the same?
a. The intensities of bulbs A and B
b. The intensity of bulb C
c. The current drawn from the battery
d. The voltage drop across each bulb
e. The power dissipated in the circuit
Figure 2: Conceptual question
about light bulb brightness

7
Number of students
Score (out of 10) Score (out of 10)
Figure 3: Student performance was, surprisingly, lower on the conceptual problem than it was on the conventional quantitative problem.
Physics educators consider conceptual problems to be far more basic than
quantitative problems, and a key indicator of student understanding. Mazur’s results
imply that traditional instruction is insufficient for developing students’ conceptual
understanding. This has led to reformed instruction, which gives students a more active
role in their education. There are many types of interactive engagement, often including:
1) peer discussion in the middle of lecture; 2) students answering questions in lecture
using an electronic response system, which gives the professor and students immediate
feedback about what the class understands, and 3) in recitations, small groups of students
work together on activities, instead of (traditionally) one teaching assistant doing
problems at the board.
Richard Hake,10 an Indiana University professor, conducted a study involving
more than 6000 students, which shows that interactive engagement results in much higher
learning gains compared to traditional instruction (Figure 4)10. A learning gain is
calculated using a student’s initial performance on a content test, and comparing it to the
student’s score on the same test at the conclusion of the course. The learning gain is what
a student did learn, divided by what that student could have learned. Hake found that
students in traditionally taught classes have average learning gains of 0.23, which means
students learn 23% of what they could have learned. In contrast, students who are
actively engaged have average learning gains of 0.48—twice the learning gain of a
traditionally taught course. Student learning gains have shown significant growth in
reformed classes, but students don’t only learn the content.

8
Currently in PER, there is a growing trend to focus not only on the content
students learn, but also on their attitudes and beliefs. Several tools have been developed
to assess what students are learning beyond, or in addition to, the physics content. These
measurement tools attempt to quantify student attitudes and beliefs about the nature of
science, and the nature of learning science. One of the first tools to measure student
attitudes and beliefs is the Maryland Physics Expectations survey (MPEX)11. The
following are two example statements from the MPEX:12
Learning physics made me change some of my ideas about
how the physical world works.
"Understanding" physics basically means being able to
recall something you've read or been shown.
The first statement probes the connection students make between physics and the
outside world (which MPEX refers to as the “Reality Link”). The second statement
measures whether students think learning physics requires creating their own

9
understanding, or receiving and accepting information from an authority figure (MPEX
calls this dimension “Independence”). Students rate statements, like the two above, on a
5-point Likert scale according to whether they agree, disagree, or are neutral about the
statement. If a student’s answer agrees with the consensus of professional physicists, then
the student’s attitudes and beliefs are classified as sophisticated, or favorable.
Alternatively, if a student’s answer disagrees with the experts’, the student has an
unfavorable or unsophisticated attitude or belief. There are several other surveys similar
to the MPEX: Epistemological Beliefs Assessment for Physical Science (EBAPS)13,
which is customized for K-12, Colorado Learning Attitudes about Science Survey
(CLASS)14, Views of the Nature of Science (VNOS)15, and Views About Science Survey
(VASS)16. These surveys have revealed surprising, and often alarming results.
While research-based reform has caused significant gains in student conceptual
understanding, surveys like the MPEX and CLASS have shown that students are
consistently acquiring unfavorable attitudes and beliefs—after only one semester. The
MPEX was given at the beginning and end of the semester at six institutions, ranging
from large research university to small liberal arts college. “In all cases, the result of
instruction on the overall survey was an increase in unfavorable responses, and a decrease
in favorable responses”17. There are similar findings on the University of Colorado’s
CLASS.14 There is consistently a
detrimental shift in students’
attitudes about physics and about
learning physics. For example,
students leave a course thinking that
physics has less to do with the real
world than when they began the
course (Figure 5)14.
There are several reasons to study student attitudes and beliefs. Attitudes and
beliefs are important for their own sake. Andrew Elby, a physicist who is active in PER
and has taught high school physics, even asserts that, “Perhaps to best prepare students
10
for advanced work in science, engineering, and medicine, instructors of introductory
physics courses should focus more on epistemological development [or beliefs about
knowledge] and less on content.”18 Decades after graduation (or perhaps immediately
after taking the exam), a student is likely to have forgotten the Maxwell stress tensor, but
the values that a student has developed remain long after the content has faded. Attitudes
and beliefs about physics are also significant because research has shown that they are in
fact connected to the content.19, 20
The CLASS measures various dimensions, or categories, of student attitudes and
beliefs. Two of these dimensions—‘conceptual understanding’ and ‘math physics
connection’—relate to how much content students learn (as measured by the Force and
Motion Conceptual Evaluation, or FMCE).19 There is also a correlation between students
who have favorable beliefs at the beginning of the course, and the likelihood they will
learn more content.19 There are other categories of attitudes and beliefs that do not appear
to relate to content, like ‘real world connection’. Although this belief doesn’t directly
relate to content, it is the dimension of beliefs that has the strongest relationship with
students developing an interest in physics.20 Attitudes and beliefs are important not only
for their own sake, but because of their relationship to content and student interest—but
what exactly is causing students’ attitudes and beliefs to change?
The Hidden Curriculum
Not everything that will be taught is written on the syllabus. The syllabus
explicitly communicates exactly what subject matter will be covered throughout the
course. The topics that are explicitly addressed make up the curriculum. In addition, there
is also a “hidden curriculum”11. As research has shown, students’ attitudes and beliefs
about physics and about learning physics change during a one-semester course, and if
these beliefs are not explicitly addressed, something is affecting them implicitly. The
hidden curriculum can seem abstract, so two specific examples will be used to show how
it manifests itself in the classroom, and how much influence it has on students.
Jean Anyon21 spent 150 hours observing fifth grade classrooms in various social
class communities in New Jersey. The schools can be categorized as serving ‘working
class’, ‘middle class’, ‘affluent professional’, or ‘executive elite’ families. In all of these

11
schools, Anyon found similarities in the explicit curriculum: they used the same math
book, had similar reading programs, and studied the same language arts topics. However,
the hidden curricula Anyon witnessed were vastly diverse.
Teachers presented schoolwork in the ‘working-class’ school as steps to follow.
They emphasized doing the procedure correctly, rather than understanding the ideas. The
teachers also controlled materials in the room. In the ‘middle class’ school, students had
more freedom on the steps they could use to solve problems, since what was valued was
getting the answer right. Creativity was absent, and the correct answers were “words,
sentences, numbers, or facts and dates; one writes them on paper, and one should be
neat.”22 In ‘affluent professional’ schools, there was a strong emphasis on creativity and
expression of ideas. The teacher negotiated with students rather than dictate. In the
‘executive elite’ classrooms, there was less focus on expression, but students’ opinions
were highly valued, and students were encouraged to use their authority when they
disagreed with an answer. They had access to materials in the classroom without asking
for permission, and could freely leave the room.
The different types of work, classroom policies, and relationships to authority had
a hidden curriculum. The ‘working class’ students were taught the importance of
following the correct steps, which was preparing them for rote wage labor.23 This
contrasts with the ‘affluent professional’ students’ work, which valued creativity and
expression, preparing these students for more intellectual (and higher income) futures.
The hidden curriculum in these fifth grade classrooms was more influential than the
curriculum; it was powerfully shaping students’ attitudes and beliefs concerning where
they belong in society, and training them to behave accordingly.
Another dimension of attitudes or beliefs a student may acquire (from the hidden
curriculum) is which gender is better equipped for success in physics. Laura
McCullough24 altered the context of questions on the Force Concept Inventory (FCI). The
FCI is a widespread instrument used to measure students’ conceptual understanding of
Newtonian mechanics. The questions were re-worded from school and male contexts, to
everyday life and female contexts. For example, “the war-like image of a bowling ball
falling from airplane (Figure 6)25 was replaced with a flying eagle dropping a fish”26
(Figure 7)24. Although the context changed, the physical principles tested stayed exactly

12
the same. The way males and females answered the newer version of the FCI changed
(Figure 8)24. The number of males who answered correctly was unaffected, but the
number of females who answered correctly more than doubled.
Question: A bowling ball accidentally
falls out of the cargo bay of an airliner
as it flies along in a horizontal direction.
As observed by a person standing on the ground and viewing the plane,
which path would the bowling ball most
closely follow after leaving the airplane?
Figure 6: Original FCI question 14
Question: A bird is carrying a fish in its claws as it flies along in a horizontal direction above a lake. The bird accidentally drops the fish. As seen from the lakeshore, which path would the fish most closely follow after leaving the bird's claws?
Figure 7: Altered FCI question 14
Although likely unintentional, there is a hidden curriculum of gender bias in the
FCI. This affects the scores of men and women differently. Women who are consistently
outscored by their male classmates may start questioning their capabilities. Differences in

13
students’ test scores can impact their beliefs about who—or which gender—is better
suited for physics.
What causes changes in student attitudes and beliefs? —A gap in the research
Much of the published research concerning student attitudes and beliefs focuses
on the effects physics courses have on students.11, 14 These publications call attention to
the unfavorable shift in student attitudes and beliefs, but they do not thoroughly
investigate what causes these effects. There is also research on the effects of explicit
instruction of attitudes and beliefs about physics.18, 27 It has been shown that intentionally
addressing attitudes and beliefs as part of the curriculum can have positive effects as
measured by the MPEX, EBAPS, and CLASS. However, the majority of instructors do
not explicitly address epistemology in their courses, and assessment tools (like the MPEX
and CLASS) still measure mostly negative shifts in student attitudes and beliefs. When
attitudes and beliefs are not being explicitly addressed, it is important to know what is
affecting them.
When something is not explicitly taught in a course, but students learn it anyway,
it is part of the hidden curriculum. There has been an insufficient amount of research
conducted in PER to understand how the hidden curriculum sends powerful messages to
students, which impact their attitudes, beliefs, and values. The rest of this paper will
describe an attempt to measure and document variations in the hidden curricula for three
different physics courses. Additionally, it will address the impact these differences have
on student attitudes and beliefs.
A Study of Hidden Curricula
Overview
In this research, I study three different introductory physics courses at the
University of Colorado at Boulder. They are all second semester courses centered on the
same content: electricity and magnetism. It has been shown that student responses on the
CLASS vary depending on the subject matter of the course.14 It is therefore important
that each course teaches similar content so that the differences in student responses are
due to hidden curricula rather than content variations. The first course, which will be

14
referred to as “Course A,” is intended for non-science majors, and requires minimal math.
The next two are very large introductory courses. “Course B” is a popular choice for
students studying pre-medicine and the biological sciences (non-physics majors) and
requires algebra. “Course C” is for physics and engineering majors, and requires calculus.
This research attempts to measure and document variations in the hidden curricula in
these courses.
The hidden curriculum can have profound impacts on students in many different
ways, from social class to gender. Tools like the MPEX and CLASS assess certain
categories of attitudes and beliefs. Similarly, in this research I focus on four dimensions.
•Process versus Product—Do students think that (physics) knowledge is about
the reasoning process, or rather that value is in getting the right answer?
•Source of Knowledge—Do students believe that knowledge comes from
themselves making sense of things, or do they accept knowledge from authority?
What is the source of knowledge?
•Real-World versus Abstract—Do students believe that physics explains the real
world that they experience outside of the classroom, or do they see it as abstract
equations, facts, and principles that have no connection to reality?
•Gender Bias versus Gender Neutral—Does the class support a male, female, or
gender-neutral environment?
In each of the three courses, the hidden curriculum is measured along these four
dimensions. This research can be broken down into three pieces: rubric development,
measurements of course environments, and a survey of student beliefs.
Rubrics: After a review of PER literature, rubrics were developed to rate four
dimensions of the hidden curriculum. These rubrics rate each dimension on a 1-5 scale.
For example, a rating of 1 on the Real-World versus Abstract dimension would be
assigned to a course that sends the message that physics is abstract, and has no
connection to students’ lives. Alternatively, a rating of 5 would imply that a course
strongly emphasizes the relationship between physics and students’ everyday lives. But
courses can send mixed messages; there are gray areas, so the ratings span a five-point
scale (See Appendix A1-A4 for a full set of rubrics and coding explanations).

15
Measurements: The hidden curriculum is everywhere. Messages are sent to
students through every element of a course’s environment: lecture, lab, textbook,
syllabus, homework, exams, grading policy, etc. The rubrics are used to rate these course
elements along the four dimensions. In addition to measuring a course’s hidden
curriculum, these rubrics also provide a way to compare the hidden curricula of different
courses.
Survey: Additionally, this thesis will address the impact that different hidden
curricula have on students. An identical survey has been given to students in each of the
three courses. (See appendix B for survey.) Their responses were analyzed for distinct
trends, which might be the result of the varying hidden curricula in the three different
courses.
Methodology —examples of how the rubrics were applied
Although I am focusing on four dimensions of the hidden curriculum, six rubrics
have been developed. Two of the four dimensions (Real-World versus Abstract and
Gender Bias versus Gender Neutral) require one rubric each. Something either relates to
the real world, or it is abstract; these classifications are mutually exclusive. Similarly,
something is either male-biased, female-biased, or gender neutral; it cannot be male and
female biased. However, the other two dimensions of the hidden curriculum (Process
versus Product and Source of Knowledge) require two rubrics each. An instructor can
send the message that the process is important, but he or she might also value the product,
the correct answer. Likewise, a course might emphasize that students should create their
own knowledge, but the professor (authority figure) might also present sophisticated
math that the students are unfamiliar with, so they are expected to accept it. It was
necessary, therefore, to develop two rubrics for both of these latter dimensions. These six
rubrics can be applied to measure the hidden curriculum along four dimensions.
Although numerous elements in a classroom environment send messages to
students (lecture, lab, textbook, syllabus, homework, exams, grading policy, etc.), I
examined the hidden curricula of three. I chose to study the lecture, homework, and
textbook, for each of the three courses. More than 12 hours (750 minutes) were spent
observing the three courses’ lectures. All three course combined have approximately 100

16
hours of lecturing, so more than 10% of the lectures were observed. Three homework sets
were analyzed for each course. Since each of the three courses assigned 14-16 homework
sets, approximately 20% of the homework was coded. One section from each course’s
textbook was examined. For consistency, the section that introduces electricity—
including static electricity, Coulomb’s Law, conductors, insulators, and induced charge—
was examined in each textbook.
The lectures, homework, and textbooks were broken into events. An event is
something noteworthy. In lecture, an event was recorded if the professor spent
considerable time doing something (like deriving a formula, or administering a clicker
question), presented something relating to one of the four dimensions being studied,
made a request to the students (such as asking students to explain their reasoning), or
repeatedly demonstrated similar behavior. On the homework, each question was counted
as an event, and weighted according to point value. The events in the textbooks were
similar to events in lecture, but things that were emphasized in some way (highlighted,
boxed, boldfaced) and all pictures/diagrams were also counted as events. Each event
observed was rated according to the rubrics. A few examples of how events were coded
will demonstrate how the hidden curriculum was measured.
Event in lecture: Professor B projects a multiple-choice question on the front
screen. Professor B then gives students 90 seconds to discuss the question with peers, and
vote on the answer using an electronic response system. After the peer discussion has
ended, and everyone has voted, Professor B says, “Most [58%] people answered A,
which is correct.” Then Professor B spends several minutes explaining why A is the
correct answer by going through the reasoning process in detail.
This event can be coded along the dimension Source of Knowledge. After
consulting the rubric, this dimension receives a 5 on the ‘Individual’ rubric (Figure 9) for
reason ‘a’: Students were given adequate time to discuss the question with each other,
which sends the message that knowledge is produced by the students as they make sense
of things. However, a high ‘Individual’ rating does not exclude a high ‘Authority’ rating.
Although there was a strong message that knowledge is created by the individual, the
event also sent the message that knowledge is something accepted from authority. The
professor simply told the students the correct answer (even though only 58% of the

17
students were correct). Then, the professor told students exactly how to reason through
the problem. The event therefore scored a 5 on the ‘Authority’ rubric (Figure 10) for
reason ‘a’. Individual Ratings:
5- Students creating knowledge by sense-making is highly valued:
a. S t u d e n ts are given adequate time to discuss a question with peers.
b. Students are asked to explain their reasoning (related to process vs.
product).
c. S t u d e n t questions are encouraged, and taken seriously.
d. E x a m ples/derivations are not completed, but left for students to
complete.
e. S t u d e n t input is encouraged during derivations or examples.
f. Inquiry-driven instruction (student questions, or instructors questions
posed to students, guide the curriculum)
g . L e cture notes are intermediary/tool for sense-making (students asked
to re-write in own words, fill in blanks, etc.)
Figure 9: Rubric rating ‘5’ shown for Individual on the
Individual versus Authority dimension Authority Ratings:
5- Accepting knowledge from authority is highly value d
a. C o m p lete answer comes from the instructor (not the students)
b. Instructor’s language always includes: “trust me,” “it’s just right,”
“because Einstein said so,”
c. S t u d e n ts are not expected to verify/confirm any results presented to
them.
d. Student input not welcome during derivations or examples
e. E q u a tions are presented that cannot be derived at the level of the
course (therefore students must accept the results from authority)
f. S t u d e n ts are encouraged to copy lecture notes exactly, or are provided
a complete copy.
Figure 10: Rubric rating ‘5’ shown for Authority on the
Individual versus Authoity dimension The ‘Individual’ rating is combined with the ‘Authority’ rating in the following way:
!
Combined _Rating =(6 " Authority) + Individual
2=(6 " 5) + 5
2= 3
This allows both ratings to be combined on a 1-5 scale for the Source of Knowledge
dimension. A combined rating of 1 means that accepting knowledge from authority is
highly valued, while 5 means that an individual’s sense-making is emphasized. In this
event, both ‘Individual’ and ‘Authority’ received a 5, and using the formula above,
results in an overall rating of 3. This makes sense, since ‘Authority’ and ‘Individual’ both
received equal ratings, this dimension averages out at 3, right in the middle.

18
Homework event: (Figure 11)
Figure 11: Homework problem from course B
This event can be coded along two dimensions. The first is Real-World versus Abstract.
After reviewing the rubric for this dimension, this event receives a rating of 5 for reason
‘c’ (Figure 12): The concept of voltage is not being learned for its own sake; it’s being
applied to a plausible, realistic situation. Real-World versus Abstract ratings:
5- Real-world connection is very strong:
a. E x a m ples are relevant to nearly all students’ lives.
b. Explanations are always given when idealizations are used (massless
string, frictionless surface, infinite wire, neglect gravity, etc.).
c. C o n c e pts are applied to plausible situations, not just learned for their
own sake.
d. Explanations describe how content is useful to students (outside of
course).
e. R elevant, interdisciplinary examples are provided (MRI, photography,
etc.).
f. Demons t rations/simulations used are very realistic.
g. His to rical context is provided.
Figure 12: Rubric rating ‘5’ shown for Real-World versus
Abstract dimension
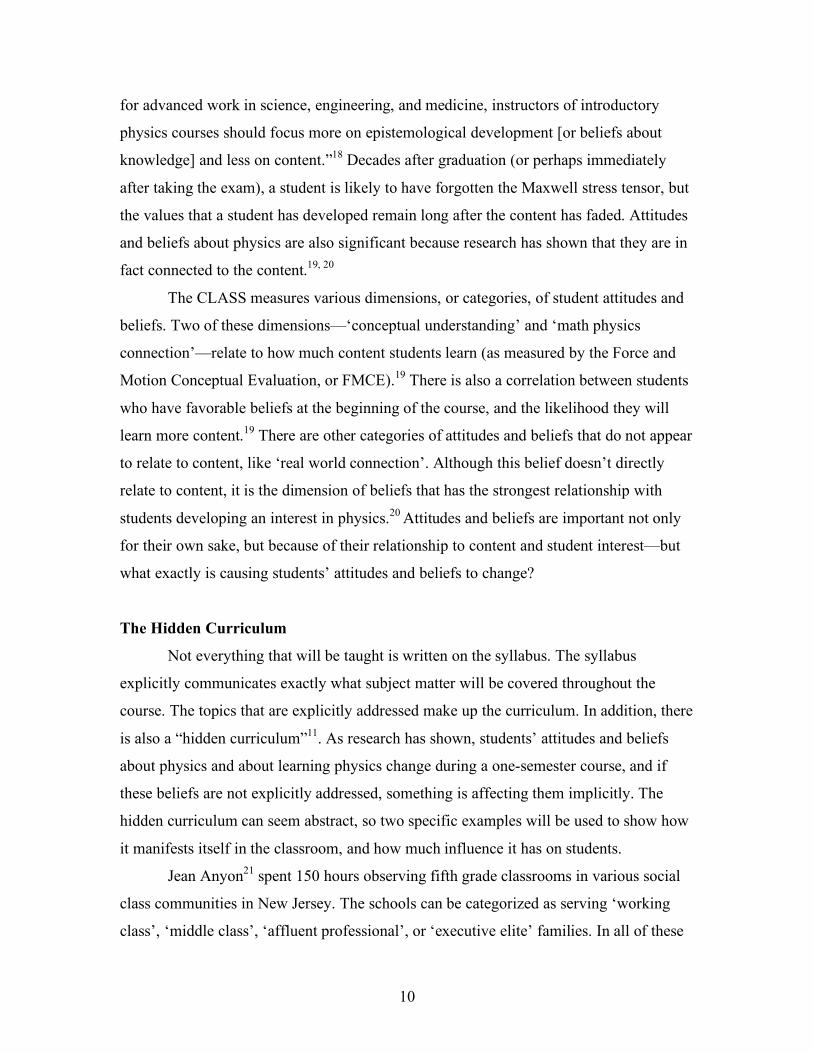
This event can also be coded on the Process versus Product dimension. Although
it scored highly on the real-world dimension, it scores very poorly on ‘Thought Process.’
It receives a rating of 1 on ‘Thought Process’ because of reason ‘e’ (Figure 13): A
19
student’s thought process is not awarded any credit. However, it scores a 5 on the
‘Product’ rating for reason ‘a’ (Figure 14): Students are only rewarded credit if they
calculate the correct final answer. The ‘Process’ rating is combined with the ‘Product’
rating using the formula:
!
Combined _Rating =(6 " product) + process
2=(6 " 5) +1
2=1
A combined rating of 1 means that the product is highly valued, while a rating of 5 would
imply that the process is highly valued. The rating of 1 in the example above makes sense
because the process was neglected recognition in this problem. All that mattered was the
correct final answer, the product. Thought Process ratings:
1- Thought process neglected :
a. S t u d e n ts are never asked how/why they got their answer.
b. E x a m ple problems/derivations provide result/formula without
showing any steps
c. D e r i v ations/examples are devalued (“won’t need to know this for the
exam…”).
d. Error source leading to incorrect answers are not addressed.
e. No credit is given for correct procedure/reasoning.
f. S t u d e n ts not encouraged to understand why answer is correct.
g. Students expected to copy class notes whether or not they understand
them.
h. Q u e s tions are self-contained, and do not address steps to the solution.
i. P o s t e d answers do not show work.
j. Only one representation is used (chalk board derivations, powerpoint
text).
k. Problems only solved in one way
l. A n a l o g ies are never used to aid the thought process
Figure 13: Rubric rating ‘1’ shown for Process on the Process
versus Product dimension

20
Product Ratings:
5- Correct answers highly value d :
a. C r e dit given only for correct answers (intermediate steps not rewarded
credit)
b. Correct answers always available to students (online or somewhere
else).
c. Answers/formulas always boxed/starred/highlighted.
d. High scores are applauded or encouraged for their own sake, not for
mastering the physics.
e. No value/worth is associated with incorrect answers.
Figure 14: Rubric rating ‘5’ shown for Product on the Process versus Product dimension
In this fashion, every event observed in lecture, homework, and the textbook was
coded according to the rubrics. A full set of rubrics and coding explanations is included
in Appendix A1-A4.
Methodology —survey design
In order to see if the measured hidden curricula had an effect on the students, a
survey was given. (See Appendix B for the survey). This survey was designed to
investigate two things. The first part of the survey asks students how much time they
spend on each element of the course (i.e. lecture, lab, homework, textbook, and website).
Then they are asked in which of these elements of the course they learn the most physics.
This information is useful to determine which elements of the course have the largest
perceived influence on students. Their responses are both a factor of how much time they
are exposed to each part of the course environment, and from which element they believe
they are learning the most physics. This information is useful to determine the most
influential elements of a course, which would presumably have the most influential
hidden curricula.
The next portion of the survey consists of questions that have been chosen from the
CLASS because they probe student attitudes and beliefs along three of the dimensions
being studied (the fourth dimension, gender, will be addressed shortly). Students respond
to the statements on a 5-point Likert scale according to whether they agree, disagree, or
are neutral about the statement. In addition to using seven CLASS questions, I have
written two additional questions to further assess student attitudes and beliefs:

21
Equations used in physics class have nothing to do
with my life outside of school.
I try to accept things an instructor says, even when
they don’t make sense to me.
The first question above addresses the Real-World versus Abstract dimension. Students
who see a connection between physics and everyday life should disagree or strongly
disagree with the statement, because they realize that equations are a representation of
things in their lives. The second question targets the Source of Knowledge dimension. A
student who believes that knowledge is something one accepts from authority—rather
than something created by an individual’s sense-making—would agree or strongly agree
with this statement.
There were no questions on this research survey relating to the fourth dimension,
Gender Bias versus Gender Neutral. This decision was made for two reasons. A hidden
gender bias in the course would be unlikely to show up on a survey that asks students if
they agree with the statement Physics is easier for males. The hidden curriculum is—as
its name implies—often very hidden to students. Where the gender bias would show up is
on students’ grades, content assessments like the FMCE, and self-reported interest in
physics.
The second reason that gender bias was left out of the survey is because of a
concern of “stereotype threat.”28 Stereotype threat occurs when someone becomes aware
of being identified as a member of a group that has a negative stereotype associated with
it. For example, there is a stereotype in American society that males are better at math
than females are. Stanford sociologist Claude Steele conducted an experiment
to test how stereotype threat could affect academic performance.7 Two groups of college
math majors and minors were given a high-level math test. Just before they were given
the test, a comment was made to one of the groups that this test “showed gender
differences”29 In the group that received the “stereotype threat,” females’ scores dropped
substantially (Figure 15)7.

22
Test score
Figure 15: Test scores of males and females in the
group with “stereotype threat,” and the group without A concern of “stereotype threat” makes it seem inappropriate to ask gender-related
questions on the survey—especially since there are prevalent stereotypes in western
culture that men are better suited for physics.
Results and Analysis This section presents measurements from the evaluation of the three introductory
physics courses (Table 1 below), along four dimensions of the hidden curriculum. Each
dimension is presented separately. For each dimension, the statistically significant1
1 Only results that are marginally statistically significant or better (p < 0.1) will be presented in
this section. The p-value basically represents the chance that a result happened by chance. A p-value of .05
can be interpreted to mean there is a 5% possibility that the observations happened by random chance. The
p-vales used to determine statistical significance were calculated using the data sets of the two most
extreme measurements. If Course A scored the highest Real World Connection, and Course B scored the
lowest on that dimension, the p-value of these two courses' data sets was calculated. This shows that there
are (or are not, depending on the p-value) measurable difference between courses' hidden curricula. It does
not imply that the results of all three courses are statistically significant—just the two extremes.

23
results from lecture, homework, and the textbook will be reported. (For all of the results
see Appendix C). Additionally, the responses from the survey of student beliefs will be
presented in order to look for connections between the measurements of course practices
and student beliefs.
Student majors Math level Content Class size
Course A: Non-science Minimal E&M 56
Course B: Biology/Pre med Algebra E&M 386
Course C: Engineering/Physics Calculus E&M 431
Table 1: characteristics of the three courses that were studied
Dimension 1: Process vs. Product
Lecture: The results from the lecture are shown below in Figure 16. Course A’s
lecture had the greatest emphasis on thought process relative to its emphasis on the final
product. Similarly, Course C’s lecture also strongly emphasized the thought process. Of
the three courses, Course B’s lecture had the least emphasis on thought process compared
to its focus on the final product. The differences between Courses A and B and Courses C
and B are marginally statistically significant at p = .068 and .084 respectively.
Although Course B emphasized the thought process the least, it is notable that all
three courses’ measurements (including error bars) are to the right of the centerline. The
centerline represents an equally strong emphasis on process and product (or a completely
neutral message that does not emphasize either). Since each course’s rating is on the
‘process’ side of the centerline, each course sends stronger messages that the thought
process is valued more than the final product.
The lecture results reflect the observations made in these three classrooms. In
lecture, Professor A would often emphasize the thought process over the final product.
Once, Professor A told the students, "The goal of this class is to learn, not to get an A."
Another time, Professor A was heard telling students, "It's not about the answer; it's about
the reasoning folks!" Professor C sent similar messages. Once, while listening to students'
explanations, professor C said, "I'm really listening to what you're saying, so I can hear
where the snags are [in your reasoning]." On a different day, after giving an explanation,

24
Professor C said, "Does that help your thought process at all?" In contrast, Professor B
once said, "I'm not going to bother working this [equation] out; I'll just state it."
Figure 16: Lecture results for the dimension Process vs. Product
Homework: The results from the homework are shown below in Figure 17.
Course A’s homework has the highest rating on the scale, closest to ‘process’. Courses B
and C are closer to ‘product’ than Course A, course B having the lowest rating of the
three. The differences between Courses A and B and Courses A and C are very
statistically significant at p < 0.0001.
There are some similarities and differences between the homework results and the
lecture results. The order of the three courses on the scale is the same for lecture and
homework. In both elements—lecture and homework—Course A is closest to the
‘process’ end of the scale, Course B is closest to the ‘product’ end of the scale, and
course C is located in between.
Although the positions of the three courses relative to each other are the same,
their exact locations are very different. Course A’s lecture and homework both emphasize
the process more than the product, since both measurements are to the right of the
centerline (including error bars). However, Courses B and C emphasized the process
more in lecture, but the product more on homework. These two course elements could be
sending students a mixed message.

25
These results can be explained by the rubric for this dimension (see Appendix
A1). The rubric ratings for the homework are largely based on how points are awarded to
students, since point values are how (hidden curriculum) messages are emphasized.
Course A's homework was the only one to give students points for explaining their
reasoning. The homework for courses B and C only rewarded credit for the correct final
answer. Though it is true that reasoning is often required to get the correct final answer
on course B's and C's homework—assuming students are not blindly guessing—one must
ask, what message is being sent to the students? Although the instructor might design the
problems to target students’ thought processes, these rubrics were designed to rate
elements of the course based on how students interpret messages. Many students see
points as equivalent to importance.
Figure 17: Homework results for the dimension Process vs. Product
Textbook: The textbook ratings were not statistically significant for this
dimension, and will therefore not be presented in this section. However, it is worth noting
a trend in the textbook measurements: they were all closer to the ‘process’ side of the
scale than they were to the ‘product’ side. The average ratings for the textbooks for each
of the three courses was 3.80 (Course A), 3.33 (Course B), and 3.69 (Course C).
Student Survey: The number of students who completed the survey was 39 in
course A (70% of the class), 265 in course B (69%), and 115 in Course C (27%). The

26
results from the survey are shown below in Figure 18. A low percentage of students in all
three courses strongly believe (response 1) and believe (response 2) that the final product
is most important. Although few students value the final product, there is a higher
percentage of Course B students who have this attitude. In all three courses, a much
higher percentage of students believe that the thought process is more important
(response 4). For students who answered this way, there were approximately 10% more
students in Courses A and C than Course B students. Overall, the averages reveal that
students in course C value the thought process the most (3.93), second is course A (3.80),
followed by course B (3.64). (For rating 5, Course B’s blue triangle is underneath Course
A’s red square)
It is somewhat unexpected that overall, students in course C value the thought
process the most. In the measurements of lecture and homework, course A’s hidden
curriculum emphasized thought process much more than course C. However, the
measurements did correctly predict that students in course B would have the lowest rating
on the scale.
Also, it is interesting that the average survey response for each course is above 3.
This implies that students in all three courses value the thought process more than the
final product. This could mean that the hidden curriculum in lecture, in which all three
measurements were to the right of the centerline (closer to ‘process’), is sending the most
powerful messages. It could also imply that the hidden curriculum in the homework has
little effect on students. Lecture may have more influence on students’ attitudes and
beliefs than other elements of the courses, such as the homework.
Another notable detail is the percentage of students who believe (but not strongly
believe) that the thought process is more important than the product (response 4). The
lowest percentage is Course B, then Course C, Course A being the highest. This is the
same relative order of both measurements of the hidden curriculum above. These results
suggest that the hidden curriculum measurements better predict student responses to
answer 4. Students who choose response 4 (agree) instead of response 5 (strongly agree)
might have less strongly held beliefs, and the hidden curriculum might have a more
influence on these students. Close attention will be paid to this detail when analyzing the
other dimensions.

27
Figure 18: Student survey responses for the dimension Process vs. product
Dimension 2: Source of Knowledge
Lecture: The results from the lecture are shown below in Figure 19. Course A’s
lecture was observed to have the greatest emphasis on knowledge being something that is
created by an individual, instead of something one should accept from authority. Course
C also emphasized the individual over authority. The lecture measurement for Course B,
however, is on the left side of the centerline (including error bars), meaning that
accepting knowledge from authority was emphasized over an individual creating it.
Differences in Courses A and B and Courses C and B are statistically significant at p =
.020 and .033 respectively.
These results reflect the classroom practices of the three professors. All three
courses frequently used clicker questions (an interactive technique in lecture where
students discuss a problem with peers, then vote on the answer). However, the way
professors used clicker questions was not uniform30. After students voted on an answer,
Professors A and C would often—if not always—ask students to explain their reasoning,
and describe how they arrived at their answers. Both of these professors tried not to give
students the answer right away, but instead, let the students produce it themselves. The
knowledge was coming from the students. In contrast, Professor B, after seeing the
results, would tell the students which answer was correct—regardless of the student vote

28
distribution. For example, after a clicker questions, Professor B once said, “Most people
[2/3 of the class] answered C. That’s correct; that’s great.” Then Professor B proceeded
to explain the answer. This classroom practice sends the message that knowledge—or at
least correct knowledge—comes from the professor, the authority figure.
Figure 19: Lecture results for the dimension Source of Knowledge
Homework: This dimension was not measured for the homework. The rubric for
this dimension was not applicable to the homework, and therefore it was not rated.
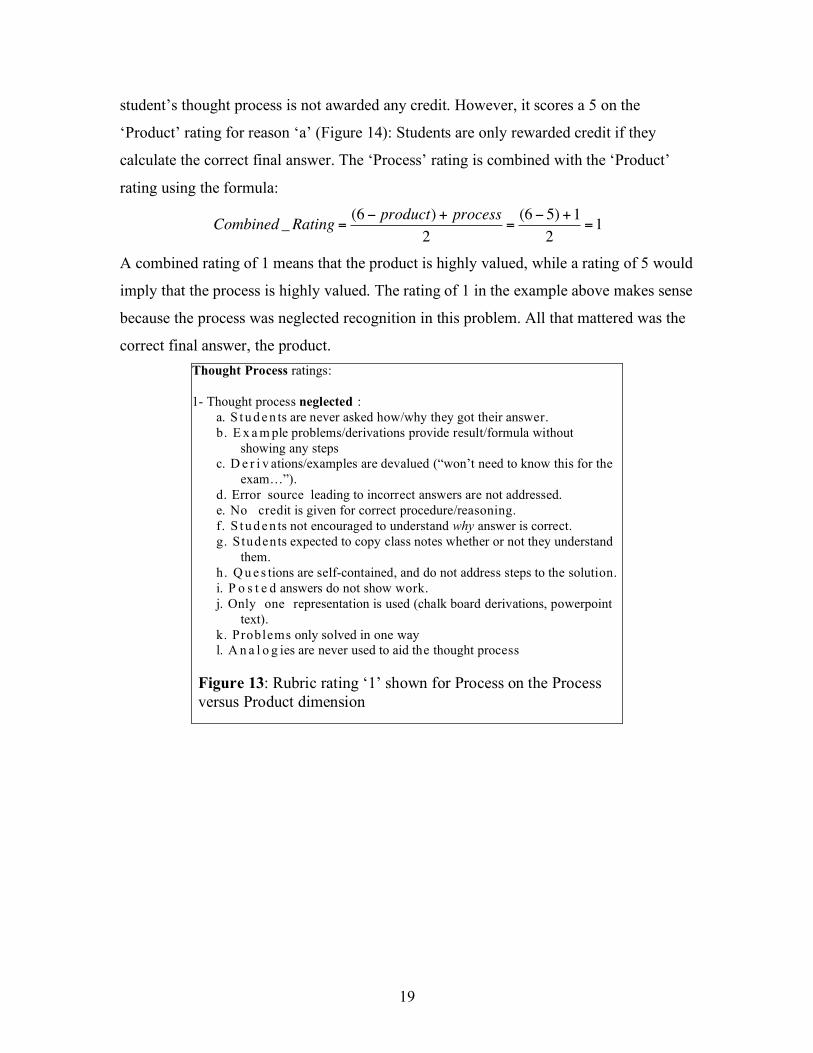
Textbook: The results from the textbook are shown below in Figure 20. The most
striking aspect of the textbook evaluation is that all three measurements lay to the left of
the centerline. Course B is farthest left, and closest to ‘authority.’ Course C’s textbook is
between the other two courses. Course A is to the left of the centerline, but its error bar
stretches across the centerline. Differences in Courses A and B are statistically significant
at p = .004.
Notice that like the previous dimension, Process vs. Product, the order of the
three courses relative to each other (B-C-A) is the same for both elements: lecture and
textbook. However, the locations of the ratings for Courses A and C have shifted to the
left of the centerline. As was seen in the previous dimension, this may be sending
students mixed messages.
29
One reason that all three courses’ textbooks are rated on the ‘authority’ side of the
scale is due to the nature of textbooks. Textbooks are not an exchange of information.
Rather, the author (authority figure) presents students a bulk of information. However,
course A's textbook had a slightly different tone than the other two textbooks. In all three
books, the author posed questions to the reader to check that he or she understood the
previous passage. But in course A's textbook, sometimes answers were not provided by
the author, and other times the answers were in the back of the chapter, so that the reader
was given a chance to think about the correct answer before it was given. The data
reflects this: Course A's error bar overlaps the centerline, while textbooks for courses B
and C are clearly in the 'authority' region.
Figure 20: Textbook results for the dimension Source of Knowledge
Student Survey: The results from the student survey responses are shown below in
Figure 21. The student responses to this dimension are split, or bi-modal. A high
percentage of students view knowledge as something created by the individual (ratings 4
and 5), but a slightly higher percentage of students believe that it is something that is
accepted from authority (ratings 1 and 2). A non-negligible fraction of student has strong
beliefs that knowledge should be accepted from authority (rating 1). Also notable is that
the averages for all three courses’ responses are less than 3, implying an overall tendency
to accept knowledge from authority.

30
The student survey responses for this dimension being split is suggestive that the
hidden curriculum is sending students mixed messages. In the two elements presented
above, two of the lectures emphasized the individual, while all three textbooks
emphasized authority.
As discussed for the previous dimension, there is a very interesting trend in rating
4, and in this dimension it is even more dramatic. Course B has the smallest fraction of
students who believe (but not strongly believe) that knowledge is created by the
individual, followed by Course C, and topped by course A. Again, this is the same
relative order of the measurements of the lecture and textbook above, so maybe the
hidden curriculum has a stronger influence on students who do not have strongly-held
beliefs, and would therefore answer 4.
Figure 21: Student survey results for the dimension Source of Knowledge
Dimension 3: Real World vs. Abstract
Lecture: The lecture ratings were not statistically significant for this dimension,
and will therefore not be presented in this section. However, it’s worth pointing out a
trend: all three courses’ lecture measurements were closer to ‘real world’ than to
‘abstract’. The average ratings for each of the three courses for the lecture were 4.48
(Course A), 3.90 (Course B), and 4.25 (Course C).

31
Homework: The results from the homework are shown below in Figure 22. The
measurements of the three courses’ homework are dramatic. Course A’s homework
scored a 5, meaning it emphasized the connection between physics and the real world; the
homework was relevant to students’ lives. On the opposite end is Course C. Its
homework scored a 1, implying that it was abstract, and had no connection to students’
lives. Between these two extremes was Course B, which was measured to the left of the
centerline, meaning that its homework was more abstract than it was grounded in the real
world.
The Real World vs. Abstract dimension of the homework shows the largest
differences between these three courses. Neither Course A nor Course C has visible error
bars. This is because every single homework question that was coded along the real
world dimension on course A's homework scored a 5, while every question on course C's
homework scored a 1 on the same rubric (see Appendix A3 for rubric explanations).
Course A's homework was centered around the real world. For example, one homework
assignment had students investigate why the lights dim in an old house when an electric
heater is turned on; another homework explored audio speakers. Course C's homework,
in contrast, was purely abstract. Concepts were not extended beyond the field of physics;
they were just not relevant to students' lives. Figure 23 is an example from course C’s
homework.
Figure 22: Homework results for the dimension Real World vs. Abstract

32
Figure 23: An example of an abstract homework question for Course C
Textbook: The textbook results are shown below in Figure 24. Course A’s
textbook had the highest measurement, closest to the ‘real world’ end of the scale. Course
C’s textbook had the second highest rating, followed by Course B. All three courses’
measurements are to the right of the centerline, so they emphasize the connection
between physics in the real world more than its abstract nature. Course B’s error bar does
extend beyond the centerline. Differences between Courses A and B are statistically
significant at p = .042.
For the previous two dimensions (process vs. product and source of knowledge),
the measurements of the three courses relative to each other were consistent for the
different course elements. In this dimension, this trend does not hold. The order is C-B-A
for the homework, but it is B-C-A for the textbook. However, like the previous two
dimensions, mixed messages are being sent. Two of the courses sent messages that
physics is abstract through their homework, but the textbook (and the lecture)
demonstrated the connection between physics and the real world.
It was clear that each of the three textbooks made an effort to ground the physics
content in the real world—to varying extents. Textbook C gave a wide range of real-

33
world applications of electricity, including how a laser printer works and how electric
charge is exploited when painting a car. Textbook B had fewer references to the outside
world. Textbook A was written quite differently than the other two. While books for
courses B and C first introduced the physics and then applied it to the real world,
textbook A started with the real world, and then explored the physics needed to explain
how something works. For example, electricity is learned in the context of understanding
how an electric air filter works. Each concept is introduced because it can help explain
the air filtering process, from charging the dust, to collecting the particles. The ratings
below reflect these observations of the textbooks.
Figure 24: Textbook results for the dimension Real World vs. Abstract
Student Survey: The results from the student survey responses are shown below in
Figure 25. Course C had the highest percentage of students who believe physics relates to
the real world. Course A has the second highest average response, followed by course B.
Although Course C has the highest average score, the largest percentage of students who
strongly believe that physics has a connection to the real world are in course A.
It is surprising that more students in Course C believe that physics is connected
to the real world than in course A. Course A’s measurements above were always much
closer to the ‘real world’ than course C’s. In fact, Course C’s homework was purely
abstract, while course A’s homework was completely grounded in the real world. These
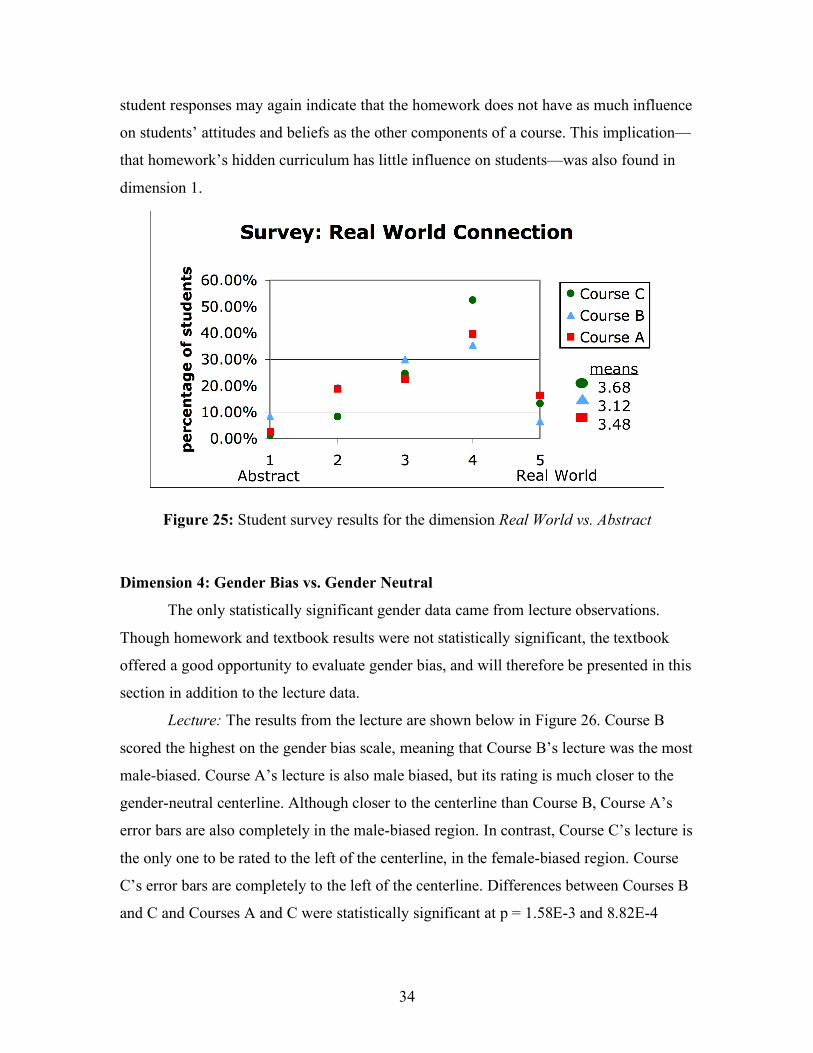
34
student responses may again indicate that the homework does not have as much influence
on students’ attitudes and beliefs as the other components of a course. This implication—
that homework’s hidden curriculum has little influence on students—was also found in
dimension 1.
Figure 25: Student survey results for the dimension Real World vs. Abstract
Dimension 4: Gender Bias vs. Gender Neutral
The only statistically significant gender data came from lecture observations.
Though homework and textbook results were not statistically significant, the textbook
offered a good opportunity to evaluate gender bias, and will therefore be presented in this
section in addition to the lecture data.
Lecture: The results from the lecture are shown below in Figure 26. Course B
scored the highest on the gender bias scale, meaning that Course B’s lecture was the most
male-biased. Course A’s lecture is also male biased, but its rating is much closer to the
gender-neutral centerline. Although closer to the centerline than Course B, Course A’s
error bars are also completely in the male-biased region. In contrast, Course C’s lecture is
the only one to be rated to the left of the centerline, in the female-biased region. Course
C’s error bars are completely to the left of the centerline. Differences between Courses B
and C and Courses A and C were statistically significant at p = 1.58E-3 and 8.82E-4
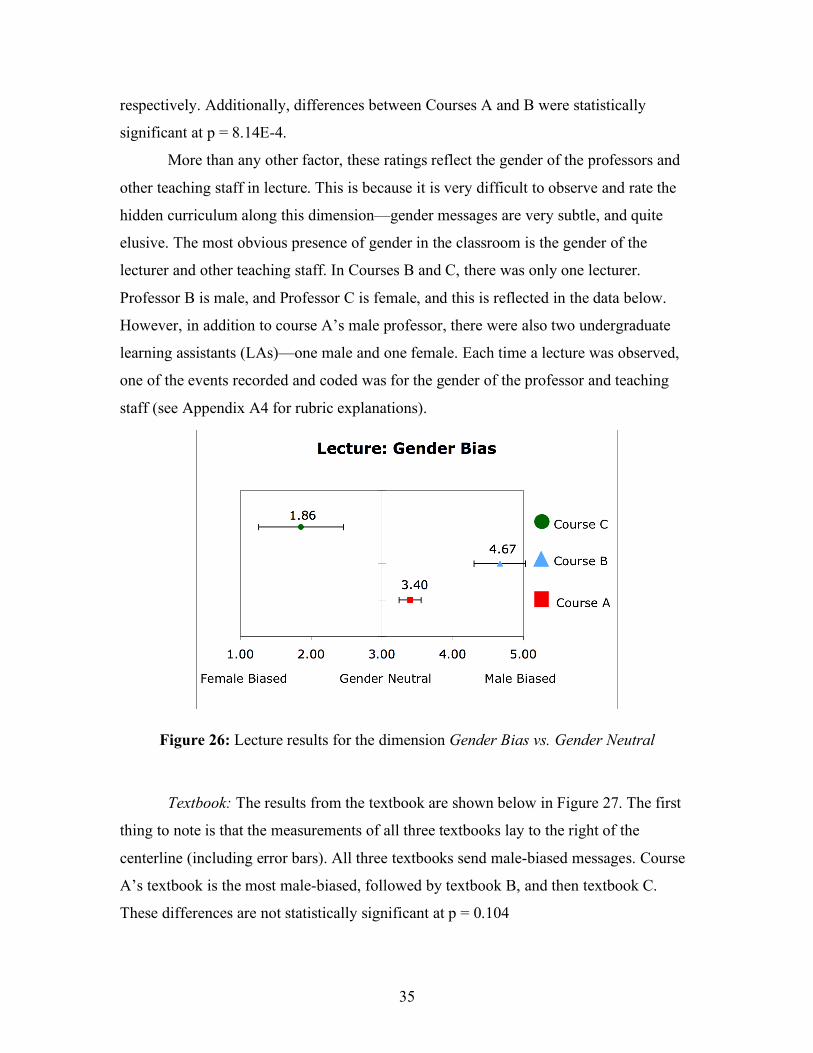
35
respectively. Additionally, differences between Courses A and B were statistically
significant at p = 8.14E-4.
More than any other factor, these ratings reflect the gender of the professors and
other teaching staff in lecture. This is because it is very difficult to observe and rate the
hidden curriculum along this dimension—gender messages are very subtle, and quite
elusive. The most obvious presence of gender in the classroom is the gender of the
lecturer and other teaching staff. In Courses B and C, there was only one lecturer.
Professor B is male, and Professor C is female, and this is reflected in the data below.
However, in addition to course A’s male professor, there were also two undergraduate
learning assistants (LAs)—one male and one female. Each time a lecture was observed,
one of the events recorded and coded was for the gender of the professor and teaching
staff (see Appendix A4 for rubric explanations).
Figure 26: Lecture results for the dimension Gender Bias vs. Gender Neutral
Textbook: The results from the textbook are shown below in Figure 27. The first
thing to note is that the measurements of all three textbooks lay to the right of the
centerline (including error bars). All three textbooks send male-biased messages. Course
A’s textbook is the most male-biased, followed by textbook B, and then textbook C.
These differences are not statistically significant at p = 0.104

36
In textbooks B and C, there seemed to be an effort to make the textbook more
gender neutral. For example, pictures of body parts (like hands and faces) were cropped.
Seeing only fingertips, or lips and a tip of a nose, made it impossible to determine the
gender of the person. However, there were still more male references (in historical
references, physicists were all male), and male dominated activities (like baseball). There
was no detectable effort in textbook A towards gender neutrality.
Figure 27: Textbook results for the dimension Gender Bias vs. Gender Neutral
Summary of Results
A hidden curriculum exists in college physics courses. Messages—which are not
explicit—are being sent to students. Rubrics have made it possible to measure the hidden
curriculum along four dimensions. These rubrics have provided a way to document
variations, as well as similarities in hidden curricula. Courses A and B, for example, sent
very different messages to students. Course A emphasized the thought process and the
individual, while Course B placed more value on the product and accepting knowledge
from authority. However, in other ways the three courses’ hidden curricula were alike.
All three courses’ lectures emphasized the process over the product, and all three
textbooks connected physics to the real world and were male biased.

37
Some very interesting trends in the hidden curricula of these three courses have
been documented. In every element for the first two dimensions, all three courses’ hidden
curriculum measurements have the same relative order (B-C-A). This trend is often
dramatic because courses are measured on opposite sides of the centerline—implying that
different courses are sending opposite messages. For both of these dimensions, the
student responses for answer 4 (agree, not strongly agree) also have the same relative
order (B-C-A). This suggests that course practices can affect student attitudes and beliefs
in a way that might be predictable by measuring the hidden curriculum. Also, the hidden
curriculum may have a greater influence on students who do not have strongly held
beliefs, and would therefore answer 4 (agree) rather than 5 (strongly agree).
Although there were consistencies when comparing the three courses relative to
each other, there were inconsistencies within a single course. Mixed messages are being
sent to students. It was common for one course to have its different elements—lecture,
homework, and textbook—send different messages for the same dimension. This is
shown in the results above for dimensions 1, 2, and 3; different elements of the same
course were measured on opposite sides of the centerline for the same dimension.
Courses B and C, for example, strongly emphasized the process during lecture, but they
highly valued the final product on the homework.
Certain elements of the course may have a more significant impact on students’
attitudes and beliefs than others. The hidden curriculum in lecture may have a more
powerful influence on students than other elements. This is suggested by the data from
dimension 1: The hidden curriculum of each of the three lectures was measured to the
right of the centerline, closer to the process than the product. Similarly, the average of the
student responses to this dimension was above three, implying the process is more highly
valued by students. The hidden curriculum of the homework may have a very small
influence on students. This is shown in the results from dimensions 1 and 3: For
dimension 1, the homework for Courses B and C strongly emphasized the product, yet
the student responses on the survey still favored the process, since both averages were
above 3. For dimension 3, the homework for Courses B and C was very abstract, but the
student responses to the survey indicated that they associate physics more with the real
world, since both averages were above 3.

38
Limitations and Future Directions Previous research has not thoroughly explored how the hidden curriculum sends
messages to students. Therefore, this research has made an effort unpack the hidden
curriculum in order to understand how student beliefs are affected. Still, compared to the
current understanding of student content learning, little is understood about student
attitudes, beliefs, and values. This is an area of education that still needs more attention.
If future work builds on this research, there are several shortcoming and limitations of
this study that should be addressed.
This research focused on three elements of a course: lecture, homework, and
textbook. In a future study, more elements of the course should be measured. Additional
elements could account for some of the survey results. For example, students in Course C
attend tutorials once each week. Tutorials are completely focused on the process, and
student sense-making. If this element of the course was observed and measured, it may
have accounted for Course C’s student responses (Figure 17 above), which have an
average closer to the ‘process’ than the other two courses. Additional (recommended)
elements of a course to study for hidden curricula are: lab, recitation, exam, website, and
syllabus.
To address how the hidden curriculum affects student beliefs, a survey was given
to each of the three courses well into the semester. This survey showed differences
between courses, but can’t assert that these differences are necessarily caused by the
varying hidden curricula. For example, students in Course C believe that physics
describes the real world more than students in the other two courses. But Course C is for
engineering and physics majors, so this belief might have caused these students to chose
their major, rather than Course C’s hidden curriculum instilling this belief. Though, the
hidden curriculum could have reinforced it. So rather than just a post-survey, a pre-
survey should also be administered to track changes in beliefs. Shifts in responses on a
pre/post survey could be attributed to hidden curricula, and could account for population
differences.
In this research, two of us were involved in developing the rubrics. Together, we
discussed, revised, and refined them. After creating them, they were applied by one
person. If these rubrics were handed over to a different observer, it’s uncertain that the

39
two observers’ measurements of the same course environment would agree. Rubric
reliability testing should be conducted, and a more consistent coding procedure could be
developed.
One rubric especially, gender bias vs. gender neutral, could be further developed.
It is very difficult to observe gender bias, especially when it is inherently built into a
system. Most of the lecture events for this dimension were due to the gender of the
instructor, because this is the most obvious way gender is present in the classroom.
Gender biases are present in so many other ways, so the coding guidelines could be
modified and expanded.
Conclusion On the University of Colorado Physics Department’s website, there is a list of
courses that are offered each semester. The first course on that list is titled, Physical
Science for Nonscientists. At first, this sounds fine. But with an awareness of the hidden
curriculum in mind, something about this title does not seem quite right. This title is
capable of sending subtle, yet powerful messages to students. True, this course is
intended for students who are not majoring in science. But this title labels any student
taking this course a “nonscientist.” This has much deeper implications. It suggests that
students are not capable of understanding “real” physics. It might also imply that this
course is perhaps “dumbed-down” for the English and Psychology majors who are
scientifically incompetent. In a way, this title shows the physics department’s
expectations of students who take this course before they even enroll.
Recently, the title of this course has been changed. If you click on the link (which
still reads Physical Science for Nonscientists) the title at the top of the new website is
Physics of Everyday Life. Someone may have recognized the hidden curriculum beneath
the old course title, and made an effort to correct it. The new title also has a hidden
curriculum, and this time it is positive. It sends the message that physics explains the
world outside the classroom, that it is relevant to students’ lives.
It is not clear if educators should expend enormous amounts of energy perfecting
the hidden curriculum in their classrooms. What educators should acknowledge is that the
hidden curriculum can have a profound influence on students—often far more powerful

40
than the explicit curriculum. The textbook chosen to accompany the course, how points
are awarded on the homework; everything that makes up the course environment sends
messages to students. These messages affect student attitudes, beliefs, and values in
either favorable or unfavorable ways. Educators should try to develop an awareness of
the messages that the hidden curriculum is sending to their students. Without making the
hidden curriculum explicit, educators can be intentional about it in order to positively
influence students, and even compliment the subject matter. Above all, educators—as
well as students—should realize that far more is learned in a course than a final exam
grade indicates.

41
Appendix A
A1 Rubric 1
Dimension of Hidden Curriculum: Process vs. Product Does course present knowledge as a process, or only value the correct answer?
(Neglected)………..……………(Highly Valued)
Element Frequency 1 2 3 4 5 Syllabus
Exam TP* A** Homework
Lecture Observation Lecture Notes
Textbook Website
Posted Solutions *TP = Thought Process
**A = Answer These are not actual results. This shows how the rubric would be used if an exam was
coded according to the criteria below, and received a 2 for ‘Thought Process’ and a 4 for ‘Product’. The overall rating for this dimension would be:
!
Combined _Rating =(6 " product) + process
2=(6 " 4) + 2
2= 2
Thought Process Ratings: 5- Thought process highly valued:
a. Students are always asked to explain how/why they got their answer. b. Example problems/derivations do not skip steps (if they do, reason is provided). c. Derivations/examples are always given importance (“it’s important to understand
where this equation comes from”). d. Incorrect answers are always examined for the flawed reasoning that caused them. e. Credit is rewarded for all correct procedure/reasoning (even if final result is
incorrect). f. Students are encouraged to understand why an answer is correct. g. Students are encouraged to make sense of class notes, not just copy them. h. Questions are broken into segments, creating a process to the solution. i. Posted answers clearly show all work. j. Three or more representations (mathematical, graphical, pictorial, simulations) are
used to help thought processes of various student learning styles. k. Problems are solved in multiple ways to show different processes l. Analogies are used to aid the thought process

42
4- Thought process valued:
a. Students are often asked to explain how/why they got their answer. b. Example problems/derivations skip very few steps (without commenting why). c. Derivations/examples are often given importance d. Incorrect answers are often examined for the flawed reasoning that caused them. e. Credit is often rewarded for correct procedure/reasoning (even if final result is
incorrect). f. Students are often encouraged to understand why an answer is correct. g. Students are often encouraged to make sense of class notes, not just copy them. h. Questions are often broken into segments, creating a process to the solution. i. Posted answers show most work. j. Two representations (mathematical, graphical, pictorial, simulations) are mostly
used, and a third is barely acknowledged. k. Problems are often solved in multiple ways to show different processes l. Analogies are often used to aid the thought process
3- Thought process moderately valued: a. Students are sometimes asked to explain how/why they got their answer. b. Example problems/derivations skip many steps (without providing reason). c. Derivations/examples are rarely given importance d. Incorrect answers are sometimes examined for the flawed reasoning that caused
them. e. Credit is sometimes rewarded for correct procedure/reasoning (even if final result
is incorrect). f. Students are sometimes encouraged to understand why an answer is correct. g. Students are sometimes encouraged to make sense of class notes, not just copy
them. h. Questions are sometimes broken into segments, creating a process to the solution. i. Posted answers show some work. j. Two different representations (mathematical, graphical, pictorial, simulations) are
used to help thought process of two student learning styles. k. Problems are sometimes solved in multiple ways to show different processes l. Analogies are sometimes used to aid the thought process
2- Thought process slightly valued: a. Students are rarely asked to explain how/why they got their answer. b. Example problems/derivations skip most steps (without providing reason). c. Derivations/examples are rarely given importance (“it’s important to understand
where this equation comes from”). d. Incorrect answers are rarely examined for the flawed reasoning that caused them. e. Credit is rarely rewarded for correct procedure/reasoning (even if final result is
incorrect). f. Students are rarely encouraged to understand why an answer is correct. g. Students are rarely encouraged to make sense of class notes, not just copy them. h. Questions are rarely broken into segments, creating a process to the solution.

43
i. Posted answers show little work. j. One representation is mostly used (mathematical, graphical, pictorial,
simulations) and another representation is barely acknowledged k. Problems are usually solved only one way and only show one process l. Analogies are rarely used to aid the thought process
1- Thought process neglected: a. Students are never asked how/why they got their answer. b. Example problems/derivations provide result/formula without showing any steps c. Derivations/examples are devalued (“won’t need to know this for the exam…”). d. Error source leading to incorrect answers are not addressed. e. No credit is given for correct procedure/reasoning. f. Students not encouraged to understand why answer is correct. g. Students expected to copy class notes whether or not they understand them. h. Questions are self-contained, and do not address steps to the solution. i. Posted answers do not show work. j. Only one representation is used (chalk board derivations, powerpoint text). k. Problems only solved in one way l. Analogies are never used to aid the thought process
Product Ratings: 5- Correct answers highly valued:
a. Credit given only for correct answers (intermediate steps not rewarded credit) b. Correct answers always available to students (online or somewhere else). c. Answers/formulas always boxed/starred/highlighted. d. High scores are applauded or encouraged for their own sake, not for mastering the
physics. e. No value/worth is associated with incorrect answers.
4- Correct answers valued: a. Credit mostly given for correct answers (intermediate steps rewarded some credit) b. Correct answers usually available to students (online or somewhere else). c. Answers/formulas usually boxed/starred/highlighted. d. High scores mostly applauded or encouraged for their own sake, slightly for
mastering the physics. e. Little value/worth is associated with incorrect answers.
3- Correct answers moderately valued: a. Half of the credit is given for correct answers (intermediate steps rewarded other
half) b. Correct answers sometimes available to students (online or somewhere else). c. Answers/formulas sometimes boxed/starred/highlighted.

44
d. High scores are applauded or encouraged as much as mastering the physics is applauded.
e. Some value/worth is associated with incorrect answers.
2- Correct answers slightly valued: a. Little credit is given for correct answers (intermediate steps rewarded most credit) b. Correct answers rarely available to students (online or somewhere else). c. Answers/formulas rarely boxed/starred/highlighted. d. High scores rarely applauded or encouraged for their own sake, mostly for
mastering the physics. e. Often value/worth is associated with incorrect answers.
1- Correct answers neglected a. Credit is not based on answer correctness. b. Correct answers are not posted. c. Answers are not emphasized (just another step in the problem). d. High scores are not recognized. e. Incorrect answers are acknowledged for their value/worth.

45
A2 Rubric 2
Dimension of Hidden Curriculum: Source of Knowledge Are students encouraged to create their own knowledge (by sense making), or accept it
from authority?
(Holds no Value)..…..………….( Highly Valued) Element Frequency 1 2 3 4 5 Syllabus
Exam Homework
Lecture Observation Lecture Notes
Textbook Website
Posted Solutions Individual = I, Authority = A
Individual Ratings: 5- Students creating knowledge by sense-making is highly valued:
a. Students are given adequate time to discuss a question with peers, or to think about a questions before the answer is given to them.
b. Students are asked to explain their reasoning (related to process vs. product). c. Student questions are encouraged, and taken seriously. d. Examples/derivations are not completed, but left for students to complete. e. Student input is encouraged during derivations or examples. f. Inquiry-driven instruction (student questions, or instructors questions posed to
students, guide the curriculum) g. Lecture notes are intermediary/tool for sense-making (students asked to re-write
in own words, fill in blanks, etc.)
4- Students creating knowledge by sense-making is valued: a. Students are often given adequate time to discuss a question with peers, or to
think about a questions before the answer is given to them. b. Students are often asked to explain their reasoning c. Student questions are often encouraged, and usually taken seriously. d. Examples/derivations are often not completed, but left for students to complete. e. Student input is often encouraged during derivations or examples. f. Often instruction is inquiry-driven (student/instructor questions help guide the
curriculum) g. Lecture notes are often intermediary/tool for sense-making
3- Students creating knowledge by sense-making is moderately valued:
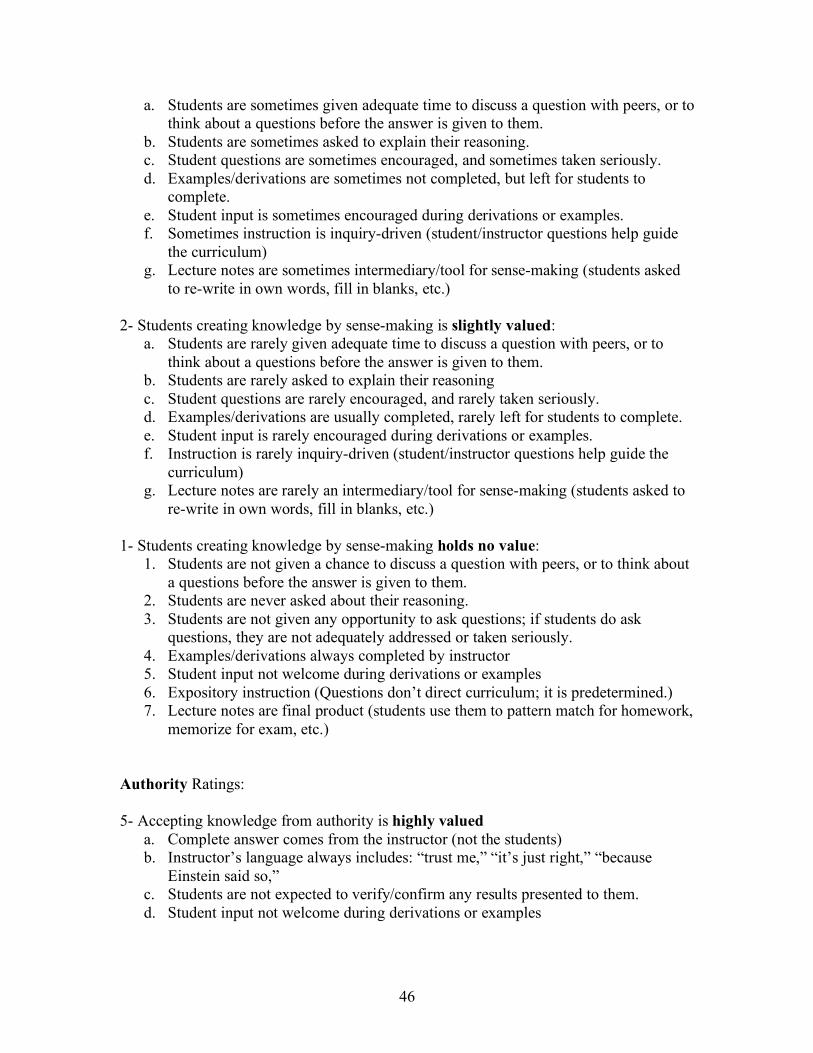
46
a. Students are sometimes given adequate time to discuss a question with peers, or to think about a questions before the answer is given to them.
b. Students are sometimes asked to explain their reasoning. c. Student questions are sometimes encouraged, and sometimes taken seriously. d. Examples/derivations are sometimes not completed, but left for students to
complete. e. Student input is sometimes encouraged during derivations or examples. f. Sometimes instruction is inquiry-driven (student/instructor questions help guide
the curriculum) g. Lecture notes are sometimes intermediary/tool for sense-making (students asked
to re-write in own words, fill in blanks, etc.)
2- Students creating knowledge by sense-making is slightly valued: a. Students are rarely given adequate time to discuss a question with peers, or to
think about a questions before the answer is given to them. b. Students are rarely asked to explain their reasoning c. Student questions are rarely encouraged, and rarely taken seriously. d. Examples/derivations are usually completed, rarely left for students to complete. e. Student input is rarely encouraged during derivations or examples. f. Instruction is rarely inquiry-driven (student/instructor questions help guide the
curriculum) g. Lecture notes are rarely an intermediary/tool for sense-making (students asked to
re-write in own words, fill in blanks, etc.)
1- Students creating knowledge by sense-making holds no value: 1. Students are not given a chance to discuss a question with peers, or to think about
a questions before the answer is given to them. 2. Students are never asked about their reasoning. 3. Students are not given any opportunity to ask questions; if students do ask
questions, they are not adequately addressed or taken seriously. 4. Examples/derivations always completed by instructor 5. Student input not welcome during derivations or examples 6. Expository instruction (Questions don’t direct curriculum; it is predetermined.) 7. Lecture notes are final product (students use them to pattern match for homework,
memorize for exam, etc.) Authority Ratings: 5- Accepting knowledge from authority is highly valued
a. Complete answer comes from the instructor (not the students) b. Instructor’s language always includes: “trust me,” “it’s just right,” “because
Einstein said so,” c. Students are not expected to verify/confirm any results presented to them. d. Student input not welcome during derivations or examples
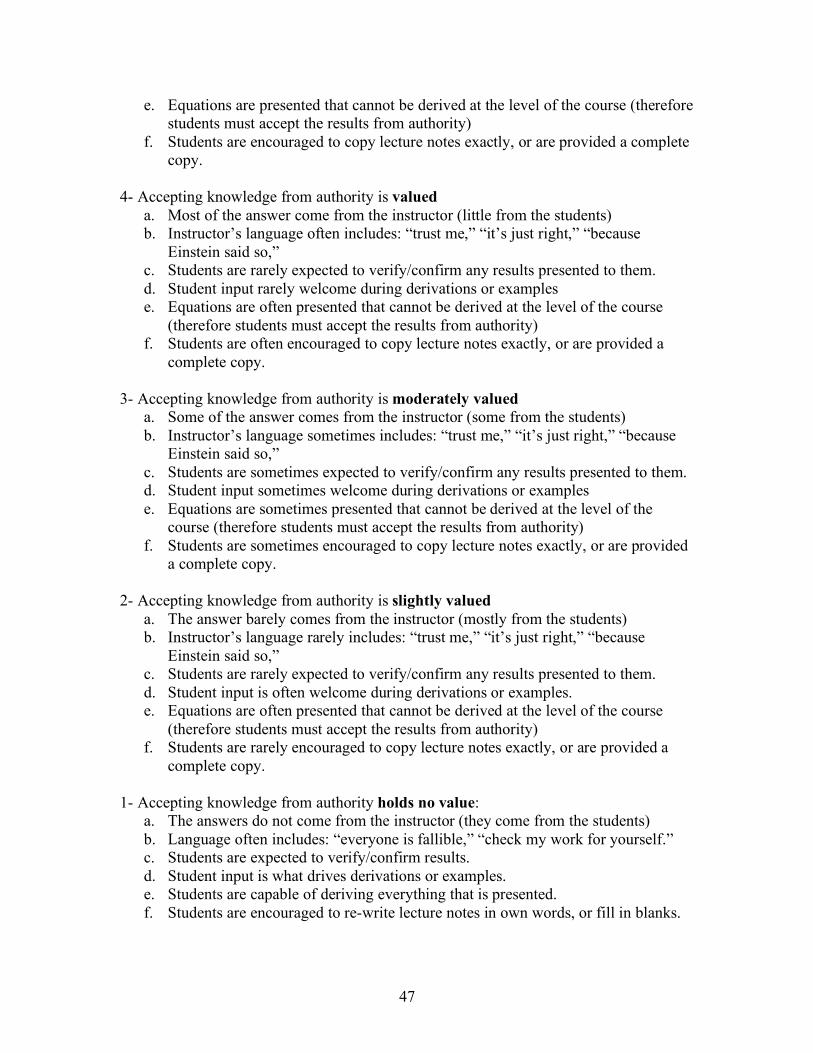
47
e. Equations are presented that cannot be derived at the level of the course (therefore students must accept the results from authority)
f. Students are encouraged to copy lecture notes exactly, or are provided a complete copy.
4- Accepting knowledge from authority is valued
a. Most of the answer come from the instructor (little from the students) b. Instructor’s language often includes: “trust me,” “it’s just right,” “because
Einstein said so,” c. Students are rarely expected to verify/confirm any results presented to them. d. Student input rarely welcome during derivations or examples e. Equations are often presented that cannot be derived at the level of the course
(therefore students must accept the results from authority) f. Students are often encouraged to copy lecture notes exactly, or are provided a
complete copy.
3- Accepting knowledge from authority is moderately valued a. Some of the answer comes from the instructor (some from the students) b. Instructor’s language sometimes includes: “trust me,” “it’s just right,” “because
Einstein said so,” c. Students are sometimes expected to verify/confirm any results presented to them. d. Student input sometimes welcome during derivations or examples e. Equations are sometimes presented that cannot be derived at the level of the
course (therefore students must accept the results from authority) f. Students are sometimes encouraged to copy lecture notes exactly, or are provided
a complete copy.
2- Accepting knowledge from authority is slightly valued a. The answer barely comes from the instructor (mostly from the students) b. Instructor’s language rarely includes: “trust me,” “it’s just right,” “because
Einstein said so,” c. Students are rarely expected to verify/confirm any results presented to them. d. Student input is often welcome during derivations or examples. e. Equations are often presented that cannot be derived at the level of the course
(therefore students must accept the results from authority) f. Students are rarely encouraged to copy lecture notes exactly, or are provided a
complete copy.
1- Accepting knowledge from authority holds no value: a. The answers do not come from the instructor (they come from the students) b. Language often includes: “everyone is fallible,” “check my work for yourself.” c. Students are expected to verify/confirm results. d. Student input is what drives derivations or examples. e. Students are capable of deriving everything that is presented. f. Students are encouraged to re-write lecture notes in own words, or fill in blanks.
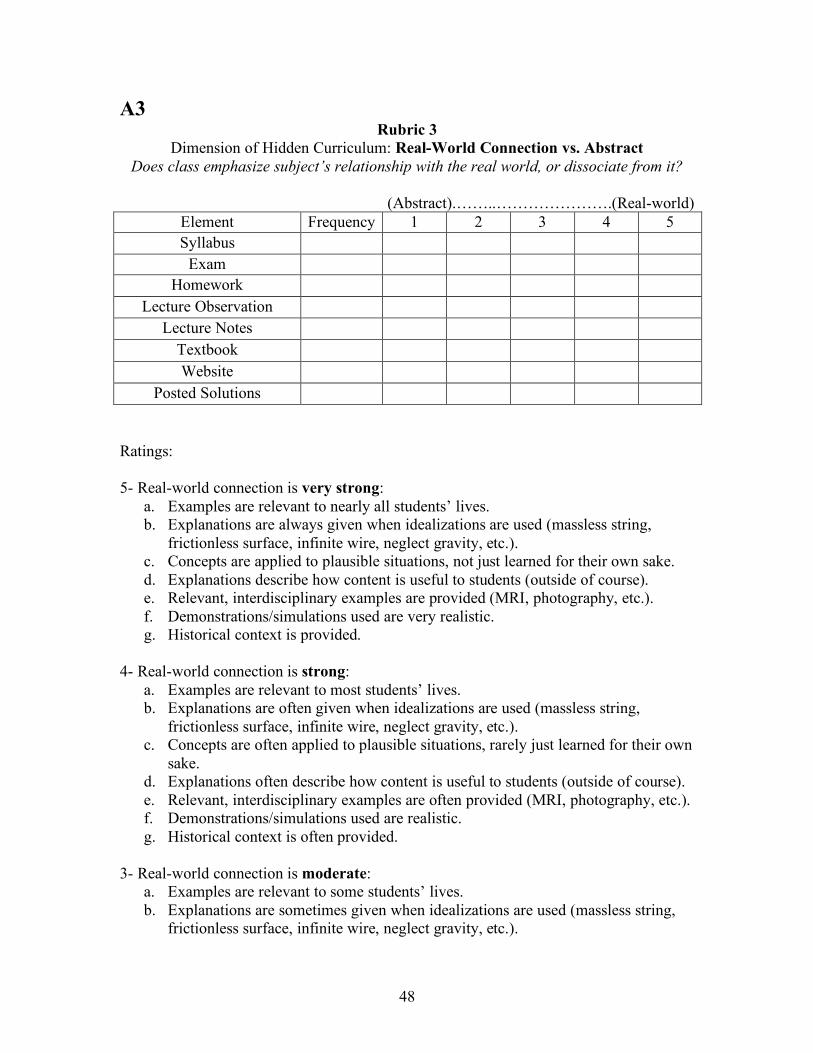
48
A3 Rubric 3
Dimension of Hidden Curriculum: Real-World Connection vs. Abstract Does class emphasize subject’s relationship with the real world, or dissociate from it?
(Abstract).……..………………….(Real-world)
Element Frequency 1 2 3 4 5 Syllabus
Exam Homework
Lecture Observation Lecture Notes
Textbook Website
Posted Solutions
Ratings: 5- Real-world connection is very strong:
a. Examples are relevant to nearly all students’ lives. b. Explanations are always given when idealizations are used (massless string,
frictionless surface, infinite wire, neglect gravity, etc.). c. Concepts are applied to plausible situations, not just learned for their own sake. d. Explanations describe how content is useful to students (outside of course). e. Relevant, interdisciplinary examples are provided (MRI, photography, etc.). f. Demonstrations/simulations used are very realistic. g. Historical context is provided.
4- Real-world connection is strong: a. Examples are relevant to most students’ lives. b. Explanations are often given when idealizations are used (massless string,
frictionless surface, infinite wire, neglect gravity, etc.). c. Concepts are often applied to plausible situations, rarely just learned for their own
sake. d. Explanations often describe how content is useful to students (outside of course). e. Relevant, interdisciplinary examples are often provided (MRI, photography, etc.). f. Demonstrations/simulations used are realistic. g. Historical context is often provided.
3- Real-world connection is moderate: a. Examples are relevant to some students’ lives. b. Explanations are sometimes given when idealizations are used (massless string,
frictionless surface, infinite wire, neglect gravity, etc.).

49
c. Concepts are sometimes applied to plausible situations, not just learned for their own sake.
d. Explanations sometimes describe how content is useful to students (outside of course).
e. Relevant, interdisciplinary examples are sometimes provided (MRI, photography, etc.).
f. Demonstrations/simulations used are moderately realistic. g. Historical context is sometimes provided.
2- Real-world connection is weak: a. Examples are relevant to few students’ lives. b. Explanations are rarely given when idealizations are used (massless string,
frictionless surface, infinite wire, neglect gravity, etc.). c. Concepts are rarely applied to plausible situations, not just learned for their own
sake. d. Explanations rarely describe how content is useful to students (outside of course). e. Relevant, interdisciplinary examples are rarely provided (MRI, photography,
etc.). f. Demonstrations/simulations used are slightly realistic. g. Historical context is rarely provided.
1- Real-world connection neglected:
a. Examples are irrelevant to nearly all students’ lives. b. Idealizations lack justification. c. Concepts are learned for their own sake, not applied. d. No explanation of how content is useful to student (outside of course) is provided. e. Examples do not extend beyond physics (such as medicine, technology, etc.) f. Demonstrations/simulations never used, or are totally abstract/unrealistic g. No historical context is provided.

50
A4 Rubric 4
Dimension of Hidden Curriculum: Gender-Bias vs. Gender-Neutral Does class support a male, female, or gender-neutral environment?
(Male-biased)(Gender neutral)(Female-biased)
Elements Frequency 1 2 3 4 5 Syllabus
Exam Homework
Lecture Observation Lecture Notes
Textbook Website
Posted Solutions
Ratings: 5- Male-bias is strong:
a. Examples are relevant to most males’ lives, and irrelevant to most females’ lives b. Examples of the application of physics in the real-world (medicine, sports,
technology, military, etc.) use male-dominated disciplines c. Examples involve males (names, pictures, “he”, etc.) d. Males are featured stereotypically (lifting weights, throwing a football, etc.) e. Encouragement for argumentation/assertion/defense of beliefs/ideas f. All professors/teaching assistants/learning assistant are male (which shows who’s
successful in this field) – coded as one event per lecture observed 4- Male-bias is present:
a. Examples are more relevant to males’ lives than to females’ b. Applications/examples use disciplines with higher male presence than female c. Examples more frequently involve males d. Males are featured more subtly, and less stereotypically e. Sometimes encouragement for argumentation/assertion/defense of beliefs/ideas f. Majority of professors/teaching assistants/learning assistant are male – coded as
one event per lecture observed 3- Class is not gender-biased:
a. Examples are equally relevant to males’ and females’ lives b. Applications/examples use disciplines with equally represented genders c. Examples equally involve males and females d. Males and females are not represented stereotypically

51
e. Articulation/explanation/reasoning are encouraged as often as argumentation/assertion/ defense of beliefs/ideas
f. Professors/teaching assistants/learning assistant represent genders equally – coded as one event per lecture observed
2- Female-bias is present:
a. Examples are more relevant to females’ lives than to males’ b. Applications/examples use disciplines that have higher female presence than male c. Examples more frequently involve females d. Females are featured more subtly, and less stereotypically e. Articulation/explanation/reasoning is encouraged more than
argumentation/assertion/ defense of beliefs/ideas f. Majority of professors/teaching assistants/learning assistant are female – coded as
one event per lecture observed 1- Female-bias is very strong:
a. Examples are relevant to most females’ lives, and irrelevant to most males’ lives b. Applications/examples use female-dominated disciplines c. Examples involve females (names, pictures, “she”, etc.) d. Females are featured stereotypically (ice-skating, carrying baby, etc.) e. Students encouraged to articulate/explain/reason their beliefs/ideas f. All professors/teaching assistants/learning assistant are female – coded as one
event per lecture observed

52
Appendix B
Student Survey
Thank you for participating in this survey. It should not take you more than a couple of minutes. Please answer each question honestly, since this information will help improve physics education.
(#1-5) How many hours per week do you spend on each part of the course?
1. Lecture a. less than 1 b. 1-2 c. 2-3 d. 3-4 e. More than 4
2. Homework a. less than 1 b. 1-2 c. 2-3 d. 3-4 e. More than 4
3. Lab/tutorial/ a. less than 1 b. 1-2 c. 2-3 d. 3-4 e. More than 4
recitation/helproom
4. Reading the a. less than 1 b. 1-2 c. 2-3 d. 3-4 e. More than 4 textbook
5. Website a. less than 1 b. 1-2 c. 2-3 d. 3-4 e. More than 4 (accessing lecture notes, homework solutions, simulations, etc.)
6. In which part of the course (above) do you learn the most physics?
a. Lecture b. Homework c. Lab/tutorial/recitation/helproom d. Reading the textbook e. Website (accessing lecture notes, homework solutions, simulations, etc.)
(#7-15) Here are a number of statements that may or may not describe your beliefs about learning physics. You are asked to rate each statement by selecting a letter between a. and e. where the letters mean the following:
a. Strongly Disagree b. Disagree c. Neutral d. Agree e. Strongly Agree
Choose one of the above five choices that best expresses your feeling about the statement. If you don't understand a statement, leave it blank. If you have no strong opinion, choose c.

53
7. I think about the physics I experience in everyday life. a. Strongly Disagree b. Disagree c. Neutral d. Agree e. Strongly Agree
8. When I solve a physics problem, I explicitly think about which physics ideas apply to the problem.
a. Strongly Disagree b. Disagree c. Neutral d. Agree e. Strongly Agree
9. I am not satisfied until I understand why something works the way it does. a. Strongly Disagree b. Disagree c. Neutral d. Agree e. Strongly Agree
10. Learning physics changes my ideas about how the world works.
a. Strongly Disagree b. Disagree c. Neutral d. Agree e. Strongly Agree
11. To learn physics, I only need to memorize solutions to sample problems. a. Strongly Disagree b. Disagree c. Neutral d. Agree e. Strongly Agree
12. I cannot learn physics if the teacher does not explain things well in class.
a. Strongly Disagree b. Disagree c. Neutral d. Agree e. Strongly Agree
13. Understanding physics basically means being able to recall something you've read or been shown.
a. Strongly Disagree b. Disagree c. Neutral d. Agree e. Strongly Agree
14. Equations used in physics class have nothing to do with my life outside of school. a. Strongly Disagree b. Disagree c. Neutral d. Agree e. Strongly Agree
15. I try to accept things an instructor says, even when they don’t make sense to me.
a. Strongly Disagree b. Disagree c. Neutral d. Agree e. Strongly Agree

54
Appendix C
C1 Results for Dimension 1: Process vs. Product
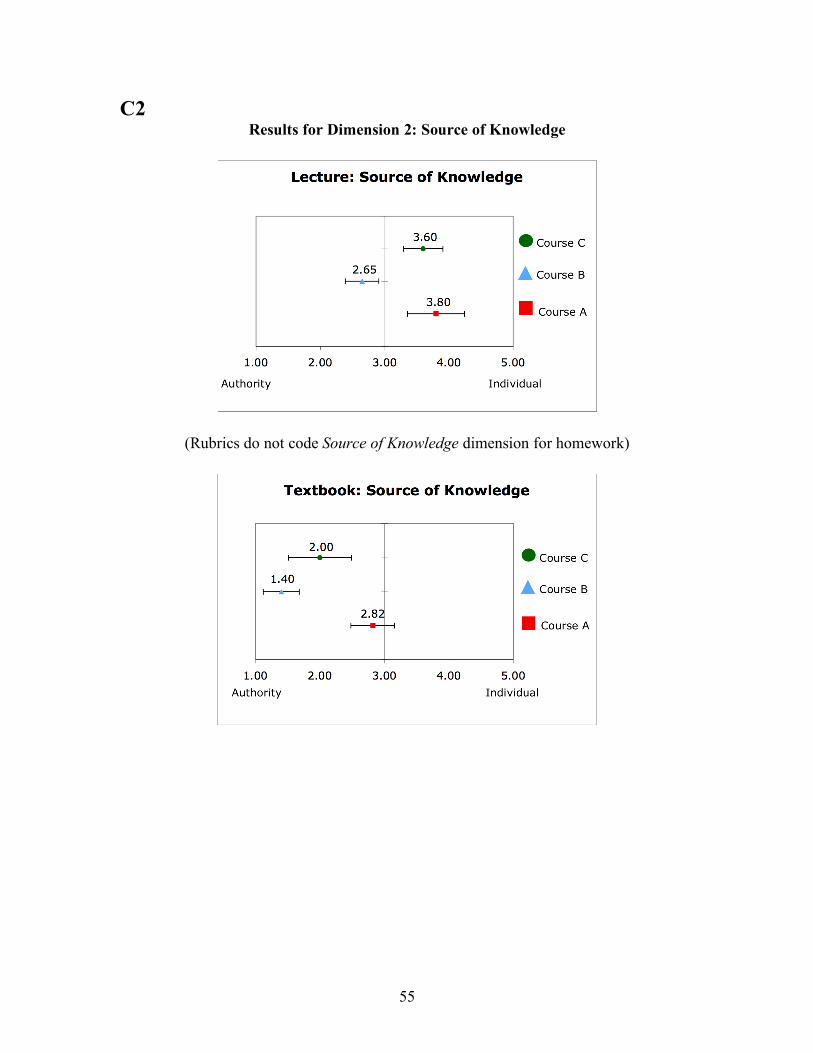
55
C2 Results for Dimension 2: Source of Knowledge
(Rubrics do not code Source of Knowledge dimension for homework)
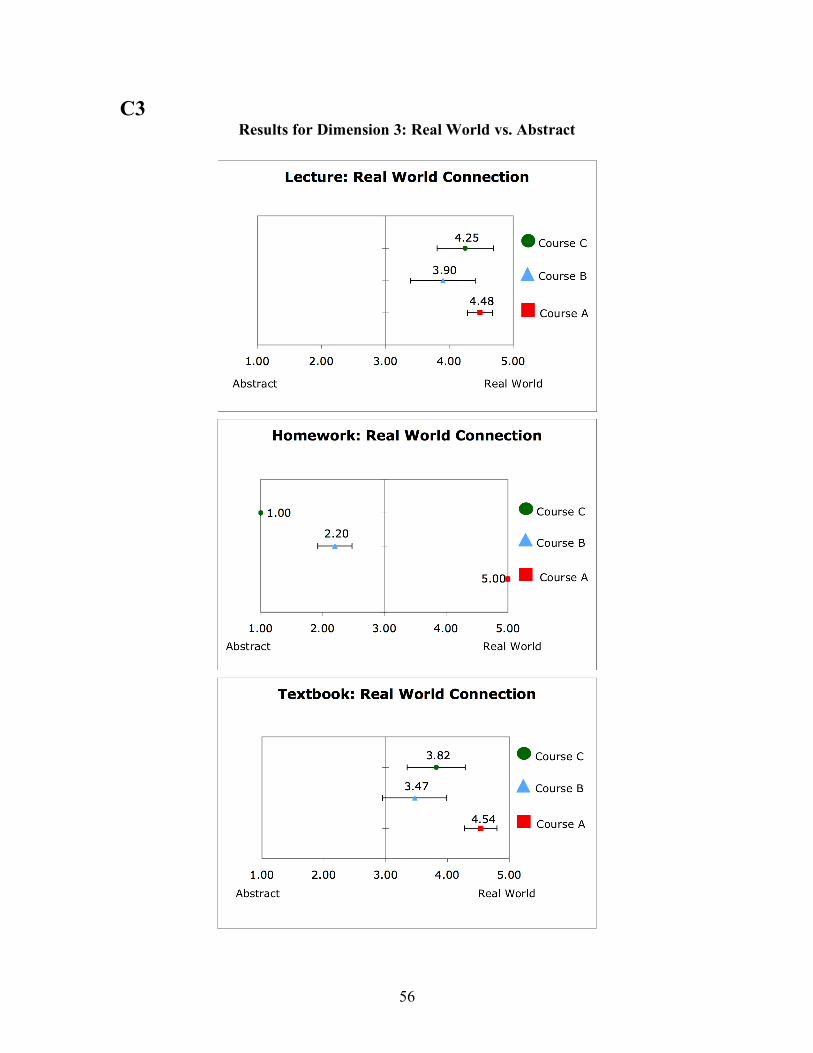
56
C3 Results for Dimension 3: Real World vs. Abstract

57
C4 Results for Dimension 4: Gender Bias vs. Gender Neutral
58
References 1 National Center for Educational Statistics (table 175):
http://nces.ed.gov/programs/digest/d06/tables/dt06_175.asp 2 National Center for Educational Statistics (table 295):
http://nces.ed.gov/programs/digest/d06/tables/dt06_295.asp 3National Center for Educational Statistics (table 7):
http://nces.ed.gov/das/epubs/2007165/showTable2007.asp?rt=p&tableID=3673&b=tables
_figures.asp%23p1 4 Rising Above The Gathering Storm: Energizing and
Employing America for a Brighter Economic Future Executive Summary (2007):
www.nap.edu/execsumm_pdf/11463.pdf 5 Committee on Prospering in the Global Economy of the 21st Century: An Agenda for
American Science and Technology, National Academy of Sciences, National Academy of
Engineering, Institute of Medicine. (2007). Rising Above the Gathering Storm:
Energizing and Employing America for a Brighter Economic Future. The National
Academies Press. 6 Rising Above the Gathering Storm Executive Summary. p. 9 7 Redish, E. F. (2003). Teaching Physics with the Physics Suite. John Wiley & Sons, Inc. 8 McDermott, L. C., & Redish, E. F. (1999). RL- PER1: Resource Letter on Physics
Education Research. American Association of Physics Teachers. 9 Mazur, E. (1997). Peer Instruction: A user’s manual. New Jersey: Prentice Hall, Inc. 10 Hake, R. R. (1998). Interactive-engagement versus traditional methods: A six-
thousand-student survey of mechanics test data for introductory physics courses. The
American Journal of Physics 66, p. 64. 11 Redish, E. F., Saul, J. M., & and Steinberg, R. N. (1998). Student Expectations in
Introductory Physics. The American Journal of Physics 66, pp. 212-224. 12 Student Expectations in University Physics: MPEX The Maryland Physics
Expectations Survey (1997): http://www.physics.umd.edu/perg/expects/mpex.htm

59
13 Elby, A., Fredrikson, J., Schwarz, C., & White, B. (2001). Epistemological Beliefs
Assessment for Physical Science: http://www2.physics.umd.edu/~elby/EBAPS/home.htm 14 Adams, W. K., Perkins, K. K., Podolefsky, N., Dubson, M., Finkelstein, N. D., &
Wieman, C. E. (2006). A new instrument for measuring student beliefs about physics and
learning physics: the Colorado Learning Attitudes about Science Survey. Phys. Rev ST:
Phys. Educ. Res. 2, 1, 010101. 15 Abd-El-Khalick, F. (2001). Journal of Science Teacher Education 12(3), pp. 215-233. 16 Halloun, I. A. (1996). Views about Science and Physics Achievement: The VASS Story.
Paper presented at the International Conference on Undergraduate Physics Education.
College Park, MD. 17 Student Expectations in Introductory Physics. (1997). Part 3, p. 2 18 Elby, A. (2001). Helping physics students learn how to learn. American Journal of
Physics 69, pp. S54-S64. 19 Perkins, K. K., Adams, W. K., Finkelstein, N. D., Pollock, S. J. & Wieman, C. E.
(2005). Correlating student attitudes with student learning using the Colorado Learning
Attitudes about Science Survey. PERC Proceedings 2004. 20 Perkins, K. K., Gratny, M. M., Adams, W. K., Finkelstein, N. D., & Wieman, C. E.
(2006) Towards characterizing the relationship between students' self-reported interest
in and their surveyed beliefs about physics. PERC Proceedings 2005 818, 137. 21 Anyon, J. (1980). Social Class and the Hidden Curriculum or Work. Journal of
Education 162, no. 1. 22 Anyon. (1980). p. 77 23 Anyon. (1980). p. 88 24 McCullough, L., & Meltzer, D. Differences in male/female response patterns on
alternative-format versions of FCI items. Proceedings of the 2001 Physics Education
Research Conference. 25 Halloun, I., Hake, R.R., Mosca, E.P., and Hestenes, D. (1995). Force Concept
Inventory (revised, 1995). On-line (password protected) at:
http://modeling.asu.edu/R&E/Research.html.

60
26 Dancy, M. The Myth of Gender Neutrality. (2004). AIP Conference Proceedings 720,
pp. 31-36. 27 Otero, V., & Gray, K. (2007) Learning to Think Like Scientists with the PET
Curriculum. PERC Proceedings, AIP Press. 28 Steele, C. (1999) Thin Ice: “Stereotype Threat” and Black College Students. Atlantic
Monthly. 29 Redish, E. (2003). p. 68 30 Turpen, C., & Finkelstein, N. (2007). Understanding Physics Faculty’s Use of Peer
Instruction. Proceedings of the 2007 Physics Education Research Conference, AIP Press
951.