Embed Size (px)
Citation preview
Preliminary Investigation Caltrans Division of Research and Innovation Produced by CTC & Associates LLC
Measuring and Improving Performance in Incident Management
Requested by
Nader Eshghipour, Deputy District Director, District 4-Maintenance Diana Gomez, Chief, Office of System Management Operations, HQ Traffic Operations
March 18, 2010 The Caltrans Division of Research and Innovation (DRI) receives and evaluates numerous research problem statements for funding every year. DRI conducts Preliminary Investigations on these problem statements to better scope and prioritize the proposed research in light of existing credible work on the topics nationally and internationally. Online and print sources for Preliminary Investigations include the National Cooperative Highway Research Program (NCHRP) and other Transportation Research Board (TRB) programs, the American Association of State Highway and Transportation Officials (AASHTO), the research and practices of other transportation agencies, and related academic and industry research. The views and conclusions in cited works, while generally peer reviewed or published by authoritative sources, may not be accepted without qualification by all experts in the field.
Executive Summary
Background Traffic incidents account for about 25 percent of traffic congestion and delay. Clearing incidents rapidly is crucial in minimizing congestion, reducing secondary crashes and improving safety for both emergency responders and travelers. Especially for incidents where large vehicles such as freight trucks are involved, the clearance time can be several hours because of the size of the vehicles and the cargo they carry. Caltrans recognizes the importance of quick clearance of traffic incidents. One of the strategies identified in the Caltrans Strategic Plan 2007-20121 for achieving Objective 2.2—by 2012, increase reliability by 10 percent throughout the transportation system—is to improve incident management. The performance measure used to monitor incident management is the percentage of major incidents cleared in less than 90 minutes. (Major incidents occur when the California Highway Patrol (CHP) and Caltrans both respond to the incident.) Although there have been improvements made since reporting on this performance measure began in 2005, the average clearance time for major incidents is still longer than the target clearance time of less than 90 minutes. Through compiling existing and current research and investigating state and regional activities related to measuring performance in incident management, this Preliminary Investigation aims to identify how other states and regions are monitoring and reducing the time it takes to respond to and clear major traffic incidents; the data used to monitor clearance time and how it is collected; how issues related to interagency coordination and data reliability have been resolved; and the measures that show promise in reducing incident clearance times.
Summary of Findings We gathered information in five topic areas related to measuring and improving performance in incident management:
• Performance Measures: A Survey of State and Regional Practice. • Best Practices: Data Management and Performance Measurement. • Programs to Reduce Incident Clearance Times.
1 See http://www.dot.ca.gov/docs/StrategicPlan2007-2012.pdf.
2
• National, Regional and State Coalitions. • Research in Progress.
Following is a summary of findings by topic area. Performance Measures: A Survey of State and Regional Practice
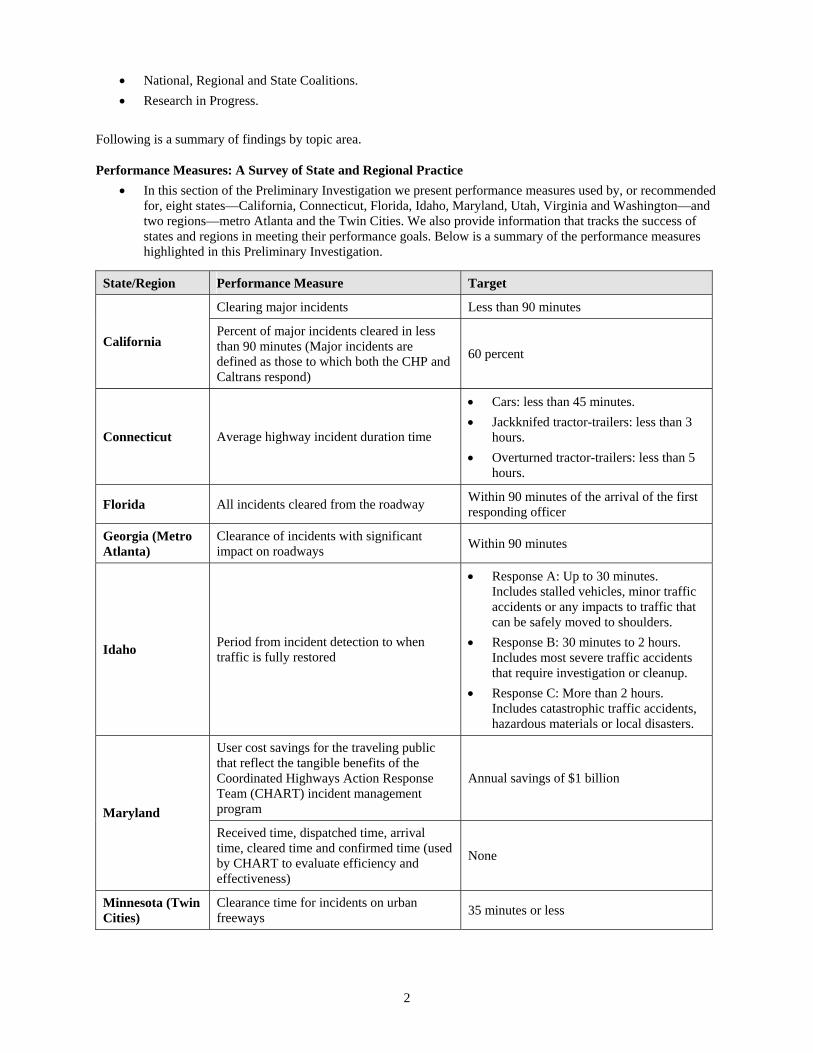
• In this section of the Preliminary Investigation we present performance measures used by, or recommended for, eight states—California, Connecticut, Florida, Idaho, Maryland, Utah, Virginia and Washington—and two regions—metro Atlanta and the Twin Cities. We also provide information that tracks the success of states and regions in meeting their performance goals. Below is a summary of the performance measures highlighted in this Preliminary Investigation.
State/Region Performance Measure Target
Clearing major incidents Less than 90 minutes
California Percent of major incidents cleared in less than 90 minutes (Major incidents are defined as those to which both the CHP and Caltrans respond)
60 percent
Connecticut Average highway incident duration time
• Cars: less than 45 minutes. • Jackknifed tractor-trailers: less than 3
hours. • Overturned tractor-trailers: less than 5
hours.
Florida All incidents cleared from the roadway Within 90 minutes of the arrival of the first responding officer
Georgia (Metro Atlanta)
Clearance of incidents with significant impact on roadways Within 90 minutes
Idaho Period from incident detection to when traffic is fully restored
• Response A: Up to 30 minutes. Includes stalled vehicles, minor traffic accidents or any impacts to traffic that can be safely moved to shoulders.
• Response B: 30 minutes to 2 hours. Includes most severe traffic accidents that require investigation or cleanup.
• Response C: More than 2 hours. Includes catastrophic traffic accidents, hazardous materials or local disasters.
User cost savings for the traveling public that reflect the tangible benefits of the Coordinated Highways Action Response Team (CHART) incident management program
Annual savings of $1 billion
Maryland Received time, dispatched time, arrival time, cleared time and confirmed time (used by CHART to evaluate efficiency and effectiveness)
None
Minnesota (Twin Cities)
Clearance time for incidents on urban freeways 35 minutes or less

3
State/Region Performance Measure Target
Utah Clearing incidents
• Noninjury incidents in 30 minutes or less.
• Serious injuries in 60 minutes or less. • Fatalities in less than 2 hours.
Virginia
Average and median incident duration (Duration of an incident is the time elapsed between first notification until all lanes have been cleared)
Unknown
Clearing highway traffic incidents 90 minutes
Washington Average length of time to clear major incidents lasting more than 90 minutes on key highway segments
155 minutes
Best Practices: Data Management and Performance Measurement
• A study documented in a 2009 University of Minnesota report identifies quantitative performance metrics and develops a method for using these metrics as feedback to improve interagency coordination and overall traffic incident management (TIM) performance.
• Reports issued in January 2009 by the Federal Highway Administration (FHWA) include a draft report that offers best practices in TIM, a report that focuses on how information is obtained and shared during an event, and traffic control activities and policies that are intended to encourage quick clearance of incidents.
• The FHWA’s TIM Self-Assessment (SA) Guide, revised for 2009, includes questions with regard to data collection, integration and sharing. A September 2008 FHWA report summarizes results from the 2008 TIM SA.
• The FHWA’s Traffic Incident Management Performance Measures Focus States Initiative involves 11 states that have defined and conducted field tests of traffic incident performance measures (reducing roadway clearance time and reducing incident clearance time). Reports are available that document progress through October 2007.
• A January 2008 draft report provides the results of a National Cooperative Highway Research Program (NCHRP) project that tested the operations performance measures developed by the National Transportation Operations Coalition in 2005.
• An October 2006 NCHRP report documents the results of surveys and discussions with selected state DOTs with regard to statewide incident reporting systems and strategies. Case studies reveal the different approaches being used to integrate data and share information. Case studies are used again in a 2004 NCHRP report to examine information sharing for incident management.
• Researchers producing a May 2004 NCHRP Research Results Digest reviewed current practice and gathered input from selected state DOTs to determine the best performance measures for TIM.
Programs to Reduce Incident Clearance Times
• A variety of towing programs have been introduced by states and regional authorities over the last several years that are proving to be successful in reducing incident clearance times. A 2008 towing summit held by the I-95 Corridor Coalition discussed some of these innovative programs, and a 2007 report by the coalition offers information culled from a scanning tour of four sites within the I-95 corridor, a survey of state DOTs and results of a 2005 European scanning tour.

4
• Below is a summary of the towing programs we highlight in this Preliminary Investigation.
State/Region Towing Program Description
California Big Rig Tow Contract with towing company to assist heavy-duty vehicles requiring short-term mechanical assistance along the I-710 corridor
Colorado Heavy Tow Contract with towing company to provide standby wreckers at strategic locations along I-70 during weekends, holidays and adverse weather
Florida Rapid Incident Scene Clearance (RISC)
Incentive-based program for the rapid removal of more complex incidents; most commonly used when incidents cause complete roadway closures on limited-access highways
Georgia (Metro Atlanta)
Towing and Recovery Incentive Program (TRIP)
Financial incentive program for expedited towing and recovery services for large commercial vehicle incidents on the metro Atlanta Interstate system
Texas (City of Houston) SAFEClear
A private sector freeway patrol that divides Houston’s freeways into segments with assigned operators responsible for their own segments
Washington Blok-Buster Major Incident Tow Program
Incentive program to remove heavy-truck collisions faster; participating tow companies are eligible for bonus compensation if they meet quick-clearance requirements at major incidents
National, Regional and State Coalitions
• The National Traffic Incident Management Coalition (NTIMC) promotes TIM standards, best practices and performance measures. NTIMC led the development of a National Unified Goal (NUG) for TIM that addresses safety, quick clearance and prompt, reliable communications.
• Washington Traffic Incident Management Coalition, a coalition of Washington State DOT; Washington State Patrol; and fire, towing and other incident responders, will oversee implementation of the NTIMC’s NUG.
• The I-95 Corridor Coalition is an alliance of transportation agencies, toll authorities and related organizations in the states that have a portion of I-95 within their boundaries. The coalition’s Coordinated Incident Management Committee focuses on implementation of interagency efforts in response to major incidents.
Research in Progress
• A final report is due soon for a study in Oregon that aimed to identify institutional barriers that may affect rapid clearance of incidents and recommend procedures that could expedite incident clearance.
• The I-95 Corridor Coalition is expected to wrap up a study in January 2010 that examines best practices associated with incident management teams.
• A June 2010 completion date is anticipated for a Washington State DOT project that evaluates the current state of the practice of the incident response program in Washington.

5
Gaps in Findings Our research indicates that some state DOTs and regional transportation authorities are taking an active interest in their incident management programs and the efforts that can be made to reduce incident clearance times. However, innovative programs designed to reduce clearance times are relatively new and a limited number of states appear to be actively employing and monitoring performance measures in connection with TIM. More research, analysis and interagency sharing of best practices will assist transportation agencies seeking to improve major incident clearance times.
Next Steps Caltrans might consider the following related to measuring and improving performance in incident management:
• Some states are clearly focusing a great deal of attention on TIM, performance measures, data collection and interagency coordination. States that may be appropriate for Caltrans to contact to delve deeper into TIM-related activities include the following:
o Washington has demonstrated improvement in meeting its TIM performance measure targets, and has experience with data integration and establishing interagency relationships.
o Florida was an early adopter of TIM performance measures, and use of its RISC towing program is expanding beyond the Florida Turnpike.
• Effective integration of data is a common theme in the TIM literature. Caltrans may wish to consult with states that have already integrated public safety data—most often data from the highway patrol—with a DOT traffic management system or are considering such integration. Possible states to contact include Arizona, Kentucky, Oregon, Utah and Washington.
• The integration of public safety data from sources other than the highway patrol—from fire departments, emergency medical service providers and the coroner’s office—is important for the development of a sequential incident timeline and a comprehensive performance monitoring system. Caltrans may wish to conduct further analysis to identify how incident response data can be collected from a wide range of public safety agencies.
• Caltrans may wish to conduct in-depth analyses of performance measures and incident data already in use across California to identify how current practices relate to other effective state incident management programs.

6
Performance Measures: A Survey of State and Regional Practice
Performance measures that set a target for clearing traffic incidents can take a variety of forms. For some states, clearance times are based on the type of vehicle or incident, while others use average incident duration. Other states specify the time it takes to clear incidents from travel lanes, or track the timing of each response from incident detection to when traffic is fully restored. Other approaches to performance metrics include user cost savings for the traveling public and reducing average clearance time for incidents on specific highway segments. Below we highlight performance measures used by a selection of state DOTs and performance goals set for specific regions. State DOT Practice We begin with a recent report that provides data on California’s performance measure—percent of major incidents cleared in less than 90 minutes—and highlight the performance measures used by, or recommended for, seven states—Connecticut, Florida, Idaho, Maryland, Utah, Virginia and Washington. California Performance Measures for the Quarter Ending September 30, 2009, Office of Strategic Planning and Performance Measurement, California Department of Transportation, undated. http://www.dot.ca.gov/perf/docs/2009-Q3QuarterlyPerformanceReport.pdf Page 10 of the PDF provides data on Performance Measure 2.2b, percent of major incidents cleared in less than 90 minutes. The baseline of 32 percent was established from the first quarter of 2007; the target is 60 percent. The report’s current data indicate 36 percent. From the report:
This measure is reported on a quarterly basis. Figure for current data represents the first quarter (July - September) of fiscal year 2009/10. There were 259 Major incidents reported in the Major Incident Database in the July-September 2009 quarter of which 94 were cleared in 90 minutes or less. The average clearance time was 3 hours 8 minutes. Major incidents are defined as those requiring 30 minutes or more to clear.
Page 20 of the PDF provides a chart that shows actual and target data back to 2005 for the percent of major incidents cleared in less than 90 minutes.
Connecticut CTDOT Performance Measures Quarterly Reports, 2009 Second Quarter (April 1, 2009 - June 30, 2009), Connecticut Department of Transportation, undated. http://www.ct.gov/dot/lib/dot/documents/dperformancemeasures/pmeasures2009q2.pdf This document reports on a variety of performance measures. Page 26 of the PDF provides details of the performance measure used to track incident clearance time on Connecticut’s state highway system—average highway incident duration time. The report indicates the following performance target values and reported values for the second quarter of 2009:
Performance target values • Cars: less than 45 minutes. • Jackknifed tractor-trailers: less than 3 hours. • Overturned tractor-trailers: less than 5 hours.
Reported values for second quarter 2009
• Cars: 48 minutes. • Jackknifed tractor-trailers: 2 hours and 25 minutes. • Overturned tractor-trailers: 4 hours and 41 minutes.
On the Move: Performance Metrics Report, Connecticut Department of Transportation, January 2009. http://www.ct.gov/dot/lib/dot/documents/dperformancemeasures/pmetrics.pdf Page 49 of the PDF describes the agency’s approach to performance measures for incident management:
The Department has begun to establish performance measures for monitoring average incident duration for three categories: passenger vehicles, jackknifed tractor trailers and overturned tractor trailers on I-95. Although

7
no clear standard has been defined to date by FHWA, the Department has defined incident duration as the time elapsed from notification until all blocked travel lanes are open. Data collected for the I-95 corridor over the past 5 years has resulted in an average duration of 40 minutes for passenger vehicles and 101 minutes for jackknifed tractor trailers. The Department is currently collecting data for the last category. The goal is to reduce incident duration with the support of the Statewide Incident Management Program (SIMP) and a coordinated effort with other first responder agencies so the public can be assured that Connecticut’s SIMP is working at its highest performance level of capacity. Efforts to create an evaluation process for each category’s average duration will be completed to determine the effectiveness of the current incident management process each year.
Florida Open Roads Policy: Quick Clearance for Safety and Mobility, State of Florida, October/November 2002. http://www.dot.state.fl.us/trafficoperations/Traf_Incident/pdf/Open_Roads_Policy_FDOT_FHP.pdf The Open Roads Policy is an agreement between the Florida Highway Patrol and Florida DOT. The agreement states: “Roadways will be cleared as soon as possible. It is the goal of all agencies that all incidents be cleared from the roadway within 90 minutes of the arrival of the first responding officer. This goal being made with the understanding that more complex scenarios may require additional time for complete clearance.” Best Practices for Traffic Incident Management in Florida, Center for Urban Transportation Research, University of South Florida, April 21, 2005. http://www.dot.state.fl.us/research-center/Completed_Proj/Summary_TE/FDOT_BC353_47_rpt.pdf This report recommends specific performance measures to be employed in evaluating incident management system performance. Recommended short-term performance measures include:
• Clearance time, as defined in the Open Roads Policy. • Response times. • Site clearance time. • Incident duration.
These short-term measures were chosen largely because they can be readily measured or estimated once a direct link is established to Florida Highway Patrol’s (FHP’s) computer-aided dispatch (CAD) system. The report notes that the CAD provides the best source of traffic incident-related time-stamped data that is available statewide. The report recommends an interface that creates a separate data network where all live CAD data is consolidated and published, and sensitive information is blocked from access by Florida DOT staff. Long-term performance measures recommended in the report include:
• Recovery time. • Incident influence time. • Incident-related delay. • Lane-miles of backup. • Secondary crash rates.
An incident timeline, which appears on page 10 of the PDF, is a tool that can be used to assess incident performance and identify areas that require attention in future incidents. Elements of the incident timeline include:
• Incident occurs. • Required help arrives. • Initial notification. • Summon wrecker. • Incident verified. • Wrecker arrives. • Law enforcement dispatch. • Other help and fire/rescue leave. • Fire/rescue dispatch. • Wrecker clears the lanes. • Fire/rescue arrive. • Wrecker leaves the site. • Law enforcement arrive. • Law enforcement leaves the site. • Incident commander summons help. • Normal traffic flow.
The segment of the incident timeline related to clearance time is presented in Figure 9 on page 28 of the PDF.

8
Idaho Transportation Incident Management Plan, Idaho Department of Transportation, January 2008. http://itd.idaho.gov/publications/detour/ITD%20TIM%20Plan_Final_2008.pdf This document provides general procedures for responding to transportation-related incidents, a notification procedure and checklist, contact information and training specifications. Incidents are classified using one of the following (the timing of each response includes the period from incident detection to when traffic is fully restored):
• Response A: Up to 30 minutes. Includes stalled vehicles, minor traffic accidents or any impacts to traffic that can be safely moved to shoulders.
• Response B: 30 minutes to 2 hours. Includes most severe traffic accidents that require investigation or
cleanup.
• Response C: More than 2 hours. Includes catastrophic traffic accidents, hazardous materials or local disasters. This response requires notification to the Idaho DOT.
Maryland 2010 Annual Attainment Report of Transportation System Performance, Maryland Department of Transportation, undated. http://www.mdot.state.md.us/Planning/CTP_10-15/2010_Attainment_Report.pdf In Maryland, the performance measure associated with incident management is user cost savings for the traveling public. Cost savings are calculated using Coordinated Highways Action Response Team (CHART) incident response data. This report notes that, in 2008, the total user cost savings were $980 million, just short of the annual target of $1 billion. Performance Evaluation and Benefit Analysis for CHART in Year 2007, Gang-Len Chang, Steven Rochon, undated. http://chartinput.umd.edu/Chart2007final.pdf This report presents the performance evaluation study of CHART in 2007, including the operational efficiency and resulting benefits. Page 21 of the PDF provides the only performance measurements identified in the report:
To evaluate the efficiency and effectiveness of emergency response operations, CHART 2007 used five time parameters for performance measurements: “Received Time,” “Dispatched Time,” “Arrival Time,” “Cleared Time” and “Confirmed Time.”
Response times for incidents classified as “collisions-fatalities” are discussed on page 60 of the PDF:
Figure 6.1 summarizes the average incident duration of each nature for Year 2007 and Year 2006. The statistical results indicate that the average incident duration for CF (Collision–Fatalities) is significantly higher than that of the other types of nature. According to such statistics, it seems that once an incident has resulted in any fatality, its duration will last up to 3 hours on average. In contrast, incidents caused by Disabled Vehicles on average took much shorter duration.
See http://chartinput.umd.edu/index.html for CHART evaluation results dating back to 2001. Utah Utah Performance Elevated, Agency Performance: Utah Department of Transportation http://performance.utah.gov/agencies/udot.shtml (scroll to “Performance Reports” and select “Incident Management”) From the web site: Utah Performance Elevated is a comprehensive initiative seeking to improve performance and efficiency within state government. The four central pillars to this initiative are performance management, strategic planning, collaboration and training, as well as enterprise innovation. UDOT's Incident Management Teams support the Utah Highway Patrol in clearing incidents. Performance measures include clearing incidents as follows:
• Noninjury incidents: 30 minutes or less.

9
• Serious injuries: 60 minutes or less. • Fatalities: less than 2 hours.
Virginia Investigation of System Operations Performance Measures for the Virginia Department of Transportation, Brian L. Smith, B. Brian Park, Ramkumar Venkatanarayana, Simona Babiceanu, Virginia Department of Transportation, Report No. VTRC 07-CR16, June 2007. http://cts.virginia.edu/docs/UVACTS-13-0-120.pdf The purpose of this research was to develop a system operations performance measurement program for the Virginia DOT. VDOT’s Incident Management Committee recommended defining an incident as “an unexpected event that adversely impacts traffic flow” and defining the duration of an incident as the time elapsed between first notification until all lanes have been cleared. The report notes that data to support these definitions do not exist for all areas of the state. The following metrics are reported for incidents:
• Average and median incident duration. • Total number of incidents. • Incidents by type.
Data for these metrics were obtained from the Virginia Operational Information System (VOIS), a system developed to coordinate incident management activities on a statewide basis. Inventory of System Operations Data Collection and Use in the Virginia Department of Transportation, Catherine C. McGhee, Virginia Department of Transportation, Report No. VTRC 06‐R21, January 2006. http://www.virginiadot.org/vtrc/main/online_reports/pdf/06-r21.pdf The purpose of this project was to develop a comprehensive inventory of operations data collection activities that occur within VDOT and to document the uses of the data collected. The report recommends the following actions related to data quality and incident management:
• VDOT’s Operations Management Division should initiate a data quality assessment program. • VDOT’s Operations Management Division in consultation with the Information Technology
Applications Division should establish a common format for archiving data so that data can be shared across work units and applications.
• Where possible, data should be stored at the lowest level of aggregation possible to allow application for the greatest number of uses.
Page 10 of the PDF includes a discussion of VOIS, which was developed to facilitate the sharing of real-time information about events that impact traffic flow. VOIS contains data on road conditions, incidents, work zones and maintenance requests.
Washington The Gray Notebook, GNB 35 (for the quarter ending September 30, 2009), Washington State Department of Transportation, November 20, 2009. http://www.wsdot.wa.gov/NR/rdonlyres/09664820-E3E1-421B-BA12-C3114AC432F9/0/GrayNotebookSep09.pdf The Gray Notebook is WSDOT’s quarterly performance report on transportation systems, programs and department management. The performance measure related to incident management is the average length of time to clear major incidents lasting more than 90 minutes on key highway segments; the current target for this performance measure is 155 minutes. From page 15 of the report (page 27 of the PDF):
Operate Efficiently–Incident Response Quarterly Update: In Quarter 3 of 2009, the statewide average clearance time was 12.9 minutes, up 2.4% from the same quarter last year. The average duration of the 70 over-90-minute lane-blocking incidents on the nine key corridors was 156 minutes during Quarter 3, 2009, and

10
the annualized average for the three quarters of 2008 to date is 156 minutes, just above the target of 155 minutes.
The quarterly update specific to incident response begins on page 18 of the report (page 30 of the PDF). From page 19 of the report (page 31 of the PDF):
In Quarter 3, there were no extraordinary (6+ hour) incidents. However, one-third of the total number of over-90-minutes incidents lasted between three to five hours compared to only 20% lasting three to five hours during the first two quarters of the year. It is not clear why these medium-length incidents took such a jump in Quarter 3. WSDOT and WSP will continue to track and analyze these trends.
Government Management Accountability and Performance (GMAP), Transportation GMAP Reports, Transportation Final 01-15-10, State of Washington. http://performance.wa.gov/Transportation/TR011510/mobility/IncidentResponseTimes/Pages/Default.aspx This web page provides an overview of the progress toward the overall strategic goal of reducing average clearance time for 90-minute-and-longer incidents on key highway segments. JOPS: A Joint Operations Policy Statement, Washington State Patrol, Washington State Department of Transportation, July 2008. http://www.watimcoalition.org/pdf/JOPS.pdf A discussion of traffic incident management begins on page 5 of the report (page 11 of the PDF). JOPS states that the Washington State Patrol (WSP) and WSDOT will collaborate to safely clear highway incidents within a mutual goal of 90 minutes. Actions to support this goal include:
• WSP and WSDOT jointly conduct at least one training session semiannually and include local fire agencies.
• At each annual JOPS meeting, WSP and WSDOT jointly report the number of over-90-minute incident debriefs conducted during the previous year and identify the key lessons learned.
• A daily summary of all over-90-minute incidents statewide is compiled by WSP and provided to WSDOT. The use of technology is also analyzed as part of the over-90-minute incident debrief. If it is determined that technology issues are consistently impacting the ability of both agencies to meet the 90-minute clearance time, those issues are identified at the annual JOPS meeting and an appropriate course of action is determined. Strategic Plan for Traffic Incident Management, Washington State Department of Transportation, July 2008. http://www.wsdot.wa.gov/NR/rdonlyres/B79A29B1-2F56-43CA-BBC0-AFB25FACE209/0/IRStrategicPlan.pdf Page 22 of the PDF describes the data partnership between WSP and WSDOT:
WSDOT and WSP now have a common measure of success in addition to their own agency performance measures when it comes to measuring our quick-clearance goals. Both agencies are now using “All Lanes Open” for reporting performance with the 90-minute goal. Even more significant is the shared use and analysis of WSP CAD data as the primary source of this performance measurement effort. Prior to the establishment of the data partnership, WSDOT was using WITS data and using “Last Responder Leaves the Scene” as its measure of success while the patrol was using CAD data for their “All Lanes Open” measure. Since WSP’s CAD system is the only source of statewide data for all traffic incidents, this data sharing and analysis partnership has improved the accuracy of performance measurement reporting in both agencies. By agreeing to use “All Lanes Open” for GMAP reporting, incident responders in both agencies now share a common performance measure in addition to agency specific measures. The use of “All Lanes Open” and “Last Responder Leaves the Scene” as performance measures is consistent with the Federal Highway Administration’s Focus States Initiative to develop national quick-clearance performance measures.

11
Regional Strategies Efforts to reduce incident response time in the metro Atlanta region and on urban freeways in the Twin Cities are highlighted below. Georgia Metro Atlanta Traffic Incident Management Enhancement (TIME) Task Force Inc. http://www.timetaskforce.com/index.html Traffic Incident Management Enhancement (TIME) originated in 2002 to develop and sustain a regionwide incident management program to facilitate the safest and fastest roadway clearance. TIME is composed of concerned incident responders from transportation agencies, fire, rescue, police, towing, emergency medical services and others. Related documents:
• Metro Atlanta Traffic Incident Management Strategic Vision, May 2, 2006 http://www.timetaskforce.com/documents/final%20strategic%20vision.pdf
• State of Georgia Open Roads Policy
http://www.timetaskforce.com/documents/presentationsmeetings07/Open%20Roads%20Policy%20DRAFT09-11-07.pdf From the policy: Agencies will work together to implement initiatives from the Metro Atlanta Traffic Incident Management Strategic Vision. The high priority initiatives are:
.…Provide monetary incentives for heavy duty towing and recovery operators who provide clearance within 90 minutes at incidents with significant impacts on roadways.
The appropriate agencies will meet for a de-briefing within ten (10) working days following any incident that requires complete closure of an Interstate highway (in one or both directions of travel) for more than three (3) hours and following any incident that requires closure of one or more lanes for more than six (6) hours.
Minnesota 2008 Annual Transportation Performance Report, Minnesota Department of Transportation, May 2009. http://www.dot.state.mn.us/measures/pdf/Annual%20Measures%20Report%205-18%20(small).pdf This report provides Minnesota DOT’s assessment of clearance time for incidents on the 360 miles of urban freeways in the Twin Cities. Mn/DOT’s target is 35 minutes or less. In 2008, Mn/DOT reduced average clearance time slightly for the second straight year to 37.1 minutes, benefiting from increased Freeway Incident Response Safety Team (FIRST) truck staffing and expansion of Mn/DOT’s new computer-aided incident detection system to areas beyond current coverage of FIRST incident response trucks. See page 28 of the PDF for further details.
Best Practices: Data Management and Performance Measurement
Below we highlight reports that use new research, an examination of previous research, case studies, surveys and stakeholder input to identify best practices in incident management. The reports offer real-world examples of how transportation agencies are responding to issues of data quality and interagency cooperation, and illustrate how data can be used to monitor performance. In addition to these reports, we highlight a FHWA self-assessment program that provides agencies with an easy-to-use tool for measuring TIM program performance. Identifying Methods and Metrics for Evaluating Interagency Coordination in Traffic Incident Management, University of Minnesota, Duluth, University of Minnesota, Twin Cities, Intelligent Transportation Systems Institute Research and Innovative Technology Administration, May 2009. http://www.its.umn.edu/Publications/ResearchReports/pdfdownload.pl?id=1118 This study’s objectives were to identify quantitative performance metrics that can be used to evaluate TIM performance and identify a method for using these metrics as feedback to improve interagency coordination and

12
overall TIM performance. The report notes that performance evaluation of interagency coordination is one area of TIM in which little success has been achieved. Recommendations arising from the research include:
• Modify data collection and archiving methods to support a process-centered approach to performance evaluation. This might involve:
o Reconfiguring current traffic incident data collection and archiving methods to track relevant timing data for the agencies involved in TIM. In some regional TIM centers, this data is in addition to the incident descriptors currently logged.
o Storing data using coding capable of supporting a variety of data-filtering and analysis methods. This could involve a specialized means of entering, storing and retrieving relevant incident timing data through development of a software application or front-end interface to an existing program like Excel.
o Relatively few modifications to real-time incident logging; however, training and other steps may have to be taken to improve the quality of the real-time data entry.
• Using appropriate statistical tools, analyze archival incident response data to support internal benchmarking
and subsequent process improvement efforts. This could be helpful in suggesting root causes of poor incident response performance.
• For each major incident type, compile process charts that illustrate the steps and completion sequences for
each responding agency, allowing for comparison of actual response processes in the field to recommended guidelines.
• Develop a simulation model of the incident response process. The benefits of a simulation model include
the ability to quickly explore changes in the incident response process, such as modifying initial responder locations, altering the number of available responders or changing the task sequences.
Information Sharing for Traffic Incident Management, FWHA, Report No. FHWA-HOP-08-059, January 2009. http://ntl.bts.gov/lib/30000/30800/30832/tim_info_sharing.pdf This report describes how information is obtained and shared during an event to best support a safe, quick response. Also addressed are the technical and institutional barriers to information exchange and the methods developed to overcome these barriers. Case study information is presented to illustrate how agencies share information. From page 22 of the PDF:
Kentucky’s Intelligence Fusion Center, a unified hub that uses a remotely accessed data sharing and analysis system, coordinates and connects all levels of law enforcement and public safety agencies as well as the private sector.
From page 29 of the PDF:
Utah’s integrated CAD-TMC system was intended to include the following elements: • Create common message sets. • Support inter-agency service requests via data specification sets (DSS). • Select commonly used operating system and language. • Develop legacy system interfaces between state, county, and municipal government systems. • Integrate transit. • Develop event tracking to manage and update planned events.
While the Utah Department of Transportation (UDOT) and Utah Highway Patrol (UHP) staffs were previously co-located, integration of the systems eliminated the need for operators of either agency to observe multiple computer terminals. The result of this inter-agency cooperation has enhanced field operations and real-time information exchange from the earliest notification of an incident through its eventual resolution. Field device information from cameras, loop detectors, and other ITS applications were available to all staffs and provided more accurate and reliable incident location data. Incidents were documented more efficiently and with better data. Staffs from different agencies were able to work together more effectively because they were receiving and responding to the same information. They were able to achieve much improved inter-agency working relationships, both during the management of an incident and during non-incident planning/debriefing sessions.
13
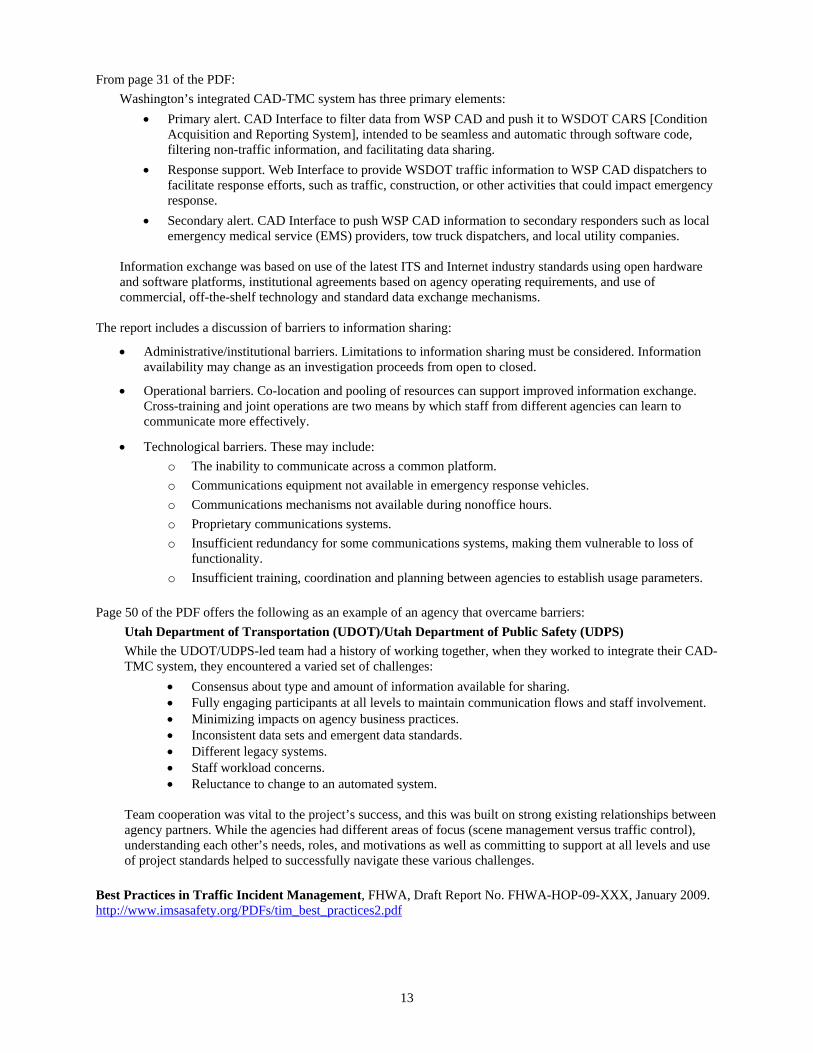
From page 31 of the PDF: Washington’s integrated CAD-TMC system has three primary elements:
• Primary alert. CAD Interface to filter data from WSP CAD and push it to WSDOT CARS [Condition Acquisition and Reporting System], intended to be seamless and automatic through software code, filtering non-traffic information, and facilitating data sharing.
• Response support. Web Interface to provide WSDOT traffic information to WSP CAD dispatchers to facilitate response efforts, such as traffic, construction, or other activities that could impact emergency response.
• Secondary alert. CAD Interface to push WSP CAD information to secondary responders such as local emergency medical service (EMS) providers, tow truck dispatchers, and local utility companies.
Information exchange was based on use of the latest ITS and Internet industry standards using open hardware and software platforms, institutional agreements based on agency operating requirements, and use of commercial, off-the-shelf technology and standard data exchange mechanisms.
The report includes a discussion of barriers to information sharing:
• Administrative/institutional barriers. Limitations to information sharing must be considered. Information availability may change as an investigation proceeds from open to closed.
• Operational barriers. Co-location and pooling of resources can support improved information exchange.
Cross-training and joint operations are two means by which staff from different agencies can learn to communicate more effectively.
• Technological barriers. These may include: o The inability to communicate across a common platform. o Communications equipment not available in emergency response vehicles. o Communications mechanisms not available during nonoffice hours. o Proprietary communications systems. o Insufficient redundancy for some communications systems, making them vulnerable to loss of
functionality. o Insufficient training, coordination and planning between agencies to establish usage parameters.
Page 50 of the PDF offers the following as an example of an agency that overcame barriers:
Utah Department of Transportation (UDOT)/Utah Department of Public Safety (UDPS)
While the UDOT/UDPS-led team had a history of working together, when they worked to integrate their CAD-TMC system, they encountered a varied set of challenges:
• Consensus about type and amount of information available for sharing. • Fully engaging participants at all levels to maintain communication flows and staff involvement. • Minimizing impacts on agency business practices. • Inconsistent data sets and emergent data standards. • Different legacy systems. • Staff workload concerns. • Reluctance to change to an automated system.
Team cooperation was vital to the project’s success, and this was built on strong existing relationships between agency partners. While the agencies had different areas of focus (scene management versus traffic control), understanding each other’s needs, roles, and motivations as well as committing to support at all levels and use of project standards helped to successfully navigate these various challenges.
Best Practices in Traffic Incident Management, FHWA, Draft Report No. FHWA-HOP-09-XXX, January 2009. http://www.imsasafety.org/PDFs/tim_best_practices2.pdf

14
This draft report uses published information sources and input from TIM personnel in California, Maryland, Tennessee, Texas and Utah to identify best practices. The tools and strategies reported to be most effective in addressing cross-cutting TIM challenges include:
• Joint traffic/emergency management centers housing multiple agencies to enhance agency relations and institutionalize TIM.
• Local and virtual TIM training to encourage joint and effective training among responders. • Expedited standards development processes and minimum interoperability requirements to encourage the
cost-effective use of technology for TIM. A discussion of performance measurement begins on page 68 of the PDF. The report notes that common challenges stem from:
• A lack of consensus among TIM agencies and available supporting data. • Inconsistent data definitions. • Concerns over data confidentiality and system security.
Traffic Control Concepts for Incident Clearance, FHWA, Report No. FHWA-HOP-08-057, January 2009. http://ntl.bts.gov/lib/30000/30800/30830/fhwahop08057.pdf This report provides a general overview of the traffic control activities associated with incident management, and addresses various state laws and policies that are intended to encourage safe, quick clearance of incidents. 2009 Traffic Incident Management (TIM) Self-Assessment (SA) Guide http://ops.fhwa.dot.gov/eto_tim_pse/docs/09timsaguide/index.htm The TIM self-assessment was designed to provide an easy-to-use tool for measuring TIM program performance. Questions with regard to data collection, integration and sharing include:
• Does the TIM program use a traffic management center (TMC)/traffic operations center (TOC) to coordinate incident detection, notification and response?
• Is public safety co-located with transportation in the TMC/TOC? • Has the TIM program achieved TMC-CAD integration so that incident data and video information is
transferred between agencies and applications? • Does the TIM program have specific policies and procedures for traffic management during incident
response (i.e., signal timing changes, opening/closing of HOV [high-occupancy vehicle] lanes/ramp metering)?
• Does the TIM program provide for interoperable, interagency communications on-site between incident responders?
The 2009 TIM SA survey is only available online and may be accessed at http://myata.truckline.com/TIMSA. The TIM SA Guide and the companion scoring template are available as a Microsoft Excel spreadsheet at http://ops.fhwa.dot.gov/eto_tim_pse/docs/09timsaguide/09timsatemplate.xls. Analysis and Production of the Traffic Incident Management State Self-Assessments (TIM SA) National Report: National Analysis Report, FHWA, September 29, 2008. http://ntl.bts.gov/lib/30000/30800/30824/tim_na_rpt.pdf From the executive summary: The Traffic Incident Management Self-Assessment (TIM SA) provides a means for evaluating progress in achievement of individual TIM program components and overall TIM program success. Now in its sixth year, the TIM SA also has allowed the Federal Highway Administration (FHWA) to identify program gaps and target resources to TIM program advancement. Traffic Incident Management Performance Measures Focus States Initiative, FHWA http://ops.fhwa.dot.gov/eto_tim_pse/preparedness/tim/pm.htm From the web site: The Traffic Incident Management Performance Measures Focus States Initiative (FSI) involves 11 states that have defined three traffic incident performance measures and conducted field tests of two of these measures. The following measures were defined in December 2005 and field tested for 18 months:

15
1. Reduce roadway clearance time. Defined as the time between first recordable awareness of incident by a responsible agency and first confirmation that all lanes are available for traffic flow.
2. Reduce incident clearance time.
Defined as the time between first recordable awareness of incident by a responsible agency and time at which the last responder has left the scene.
The third measure that was defined at the final project workshop in October 2007 has not yet been field tested:
3. Reduce the number of secondary crashes. Defined as incidents for which a response or intervention is taken, where a collision occurs either a) within the incident scene or b) within the queue (which could include opposite direction) resulting from the original incident.
Related documents:
• Presentation: “TIM Program-Level Performance Measurement Focus States Initiative Update,” October 2007 http://www.ntoctalks.com/webcast_archive/to_oct_10_07/to_oct_10_07_no.pdf
• Presentation: “Florida ITS and TIM Performance Measures,” October 2007
http://www.ntoctalks.com/webcast_archive/to_oct_10_07/to_oct_10_07_av.pdf
• Presentation: “WisDOT Performance Measures,” October 2007 http://www.ntoctalks.com/webcast_archive/to_oct_10_07/to_oct_10_07_kb.pdf
NCHRP 20-7, Guide to Benchmarking Operations Performance Measures http://www.catt.umd.edu/research/nchrp-guide.html This web site provides a January 2008 draft report and links to a wealth of supporting materials for the NCHRP project that tested the operations performance measures developed by the National Transportation Operations Coalition in 2005. Implementation guidelines for the incident duration performance measure are available at http://www.catt.umd.edu/documents/incident_duration_guide_v3.pdf. Statewide Incident Reporting Systems—Business and Technology Plan, Final Report, NCHRP Project 20-7, Task 215, October 2006. http://onlinepubs.trb.org/onlinepubs/archive/NotesDocs/NCHRP%2020-7%20215%20Final%20Report.pdf Researchers used feedback and input received through an extensive outreach effort, including web-based surveys, detailed discussions with selected state DOTs and a full-day workshop held in June 2006, to document statewide incident reporting systems and strategies. The report presents the experience of four states that are using different approaches to integrate the public safety CAD and the DOT’s incident reporting system. Two states—Washington and Utah—were participants in a field operational test sponsored by the U.S. DOT to demonstrate CAD/DOT integration and information sharing.
• Washington’s implementation involved connecting WSP’s new CAD system and the WSDOT Condition Acquisition and Reporting System to provide the DOT with information about highway incidents and other impacts.
• Utah, the other CAD/DOT operational test participant, uses a very different model and level of integration
between the transportation and public safety systems. UDOT’s Commuterlink interfaces with five external agency CAD systems using a two-way data feed and peer-to-peer relationship rather than a centralized architecture concept.
• Oregon DOT’s model involves access as authorized users of the Oregon State Police CAD to enter and track incidents. Operators at ODOT’s TOC enter data into CAD, the Highway Traffic Conditions Reporting System, and a third operational system. ODOT is developing a new statewide reporting system, which will include an interface to the OSP CAD, to reduce the multiple steps for data entry and provide a two-way information sharing capability.
• Arizona implemented an interface between its Phoenix Traffic Operations Center and Arizona Department
of Public Safety to allow TOC operators to view DPS CAD data using a one-way data feed that provides

16
view-only privileges on a dedicated terminal. Operators at the TOC can view statewide CAD data, and then enter information into the Highway Condition Reporting System, Arizona’s statewide reporting system. Information is prefiltered by DPS before being transmitted to the ADOT TOC.
Lessons learned related to data reliability include:
• There are gaps and/or inconsistencies in data from public safety CAD systems. For example, DOT reporting systems often rely on information fields, whereas pertinent information in CAD is often in free-form text, requiring DOT operators to extract relevant information to enter in the predefined fields in their reporting system.
• Automated interfaces to CAD incident data still rely on DOT operator judgment and experience for effective information management.
Sharing Information Between Public Safety and Transportation Agencies for Traffic Incident Management, NCHRP Report 520, 2004. http://onlinepubs.trb.org/onlinepubs/nchrp/nchrp_rpt_520.pdf This report uses case studies to examine information sharing for incident management. Topics addressed include communication methods; benefits and performance measures; and institutional, technology and operational implications. Measuring and Communicating the Effects of Traffic Incident Management Improvements, NCHRP Research Results Digest 289, May 2004. http://onlinepubs.trb.org/onlinepubs/nchrp/nchrp_rrd_289.pdf This digest presents the results of NCHRP Project 20-7/Task 173, which reviewed current practice around the U.S. and convened a workshop of state DOTs to determine the best performance measures for TIM. Selected items of interest in the report include:
• Table 2.3 on page 9 of the PDF shows the type of incident information collected by study participants.
• Table 2.4 on page 10 of the PDF shows the performance measures used by study participants. • Page 21 of the PDF begins a discussion of how the definition, collection and reporting of incident
performance data can be made more uniform.
• Recommendations for developing performance measures begin on page 30 of the PDF.
Programs to Reduce Incident Clearance Times States looking for ways to improve incident management have found towing programs to be successful in reducing incident clearance times. Below we provide a summary of a recent towing summit and a report of a scanning tour of innovative towing programs. We also highlight towing programs in three states—Colorado, Florida and Washington—and regional programs in metro Atlanta, Houston and Los Angeles County. The programs in Florida, Washington and metro Atlanta offer incentives for qualifying towing contractors. Towing Summit Summary, I-95 Corridor Coalition, March 2008. http://www.i95coalition.org/i95/Portals/0/Public_Files/pm/reports/full404.doc This 2008 towing summit held by the I-95 Corridor Coalition was billed as the first of its kind in the nation. Towing programs discussed at the summit included:
• Florida’s Rapid Incident Scene Clearance (RISC) incentive program. • Georgia’s Towing and Recovery Incentive Program (TRIP). • Colorado DOT’s I-70 Corridor Heavy Tow Program. • The Big Rig Tow project in Los Angeles County. • Houston’s SAFEClear program.
17
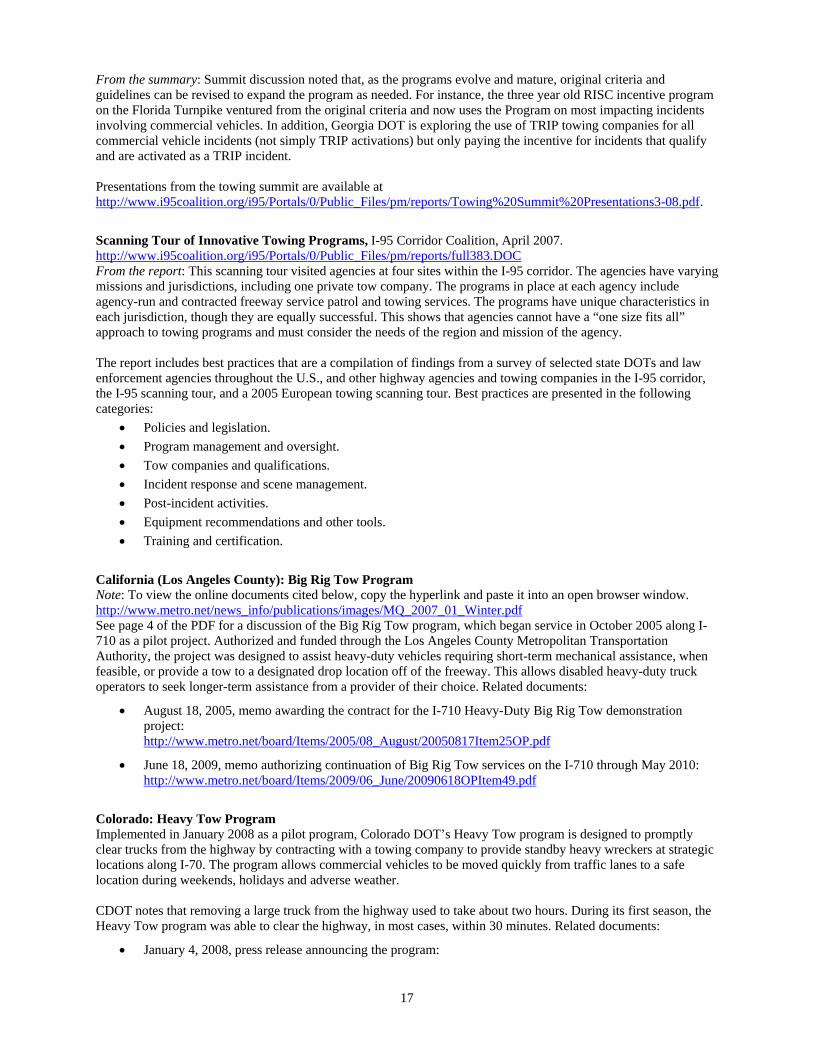
From the summary: Summit discussion noted that, as the programs evolve and mature, original criteria and guidelines can be revised to expand the program as needed. For instance, the three year old RISC incentive program on the Florida Turnpike ventured from the original criteria and now uses the Program on most impacting incidents involving commercial vehicles. In addition, Georgia DOT is exploring the use of TRIP towing companies for all commercial vehicle incidents (not simply TRIP activations) but only paying the incentive for incidents that qualify and are activated as a TRIP incident. Presentations from the towing summit are available at http://www.i95coalition.org/i95/Portals/0/Public_Files/pm/reports/Towing%20Summit%20Presentations3-08.pdf. Scanning Tour of Innovative Towing Programs, I-95 Corridor Coalition, April 2007. http://www.i95coalition.org/i95/Portals/0/Public_Files/pm/reports/full383.DOC From the report: This scanning tour visited agencies at four sites within the I-95 corridor. The agencies have varying missions and jurisdictions, including one private tow company. The programs in place at each agency include agency-run and contracted freeway service patrol and towing services. The programs have unique characteristics in each jurisdiction, though they are equally successful. This shows that agencies cannot have a “one size fits all” approach to towing programs and must consider the needs of the region and mission of the agency. The report includes best practices that are a compilation of findings from a survey of selected state DOTs and law enforcement agencies throughout the U.S., and other highway agencies and towing companies in the I-95 corridor, the I-95 scanning tour, and a 2005 European towing scanning tour. Best practices are presented in the following categories:
• Policies and legislation. • Program management and oversight. • Tow companies and qualifications. • Incident response and scene management. • Post-incident activities. • Equipment recommendations and other tools. • Training and certification.
California (Los Angeles County): Big Rig Tow Program Note: To view the online documents cited below, copy the hyperlink and paste it into an open browser window. http://www.metro.net/news_info/publications/images/MQ_2007_01_Winter.pdf See page 4 of the PDF for a discussion of the Big Rig Tow program, which began service in October 2005 along I-710 as a pilot project. Authorized and funded through the Los Angeles County Metropolitan Transportation Authority, the project was designed to assist heavy-duty vehicles requiring short-term mechanical assistance, when feasible, or provide a tow to a designated drop location off of the freeway. This allows disabled heavy-duty truck operators to seek longer-term assistance from a provider of their choice. Related documents:
• August 18, 2005, memo awarding the contract for the I-710 Heavy-Duty Big Rig Tow demonstration project: http://www.metro.net/board/Items/2005/08_August/20050817Item25OP.pdf
• June 18, 2009, memo authorizing continuation of Big Rig Tow services on the I-710 through May 2010:
http://www.metro.net/board/Items/2009/06_June/20090618OPItem49.pdf
Colorado: Heavy Tow Program Implemented in January 2008 as a pilot program, Colorado DOT’s Heavy Tow program is designed to promptly clear trucks from the highway by contracting with a towing company to provide standby heavy wreckers at strategic locations along I-70. The program allows commercial vehicles to be moved quickly from traffic lanes to a safe location during weekends, holidays and adverse weather. CDOT notes that removing a large truck from the highway used to take about two hours. During its first season, the Heavy Tow program was able to clear the highway, in most cases, within 30 minutes. Related documents:
• January 4, 2008, press release announcing the program:

18
http://www.coloradodot.info/news/news-releases/pilot-program-designed-to-quickly-clear-i-70-west
• November 26, 2008, press release announcing the second year of the program: http://www.coloradodot.info/news/news-releases/new-programs-to-assist-traffic-along-i-70-west
Florida: Rapid Incident Scene Clearance Program (RISC) Rapid Incident Scene Clearance Program (RISC) was introduced on the Florida Turnpike in 2004 to support Florida’s Open Roads Policy. This incentive-based program provides for the rapid removal of the more complex scenarios that would require additional time for complete clearance. The program is most commonly used when incidents cause complete roadway closures on limited-access highways. Related documents:
• Procedural document: Rapid Incident Scene Clearance (RISC), Traffic Engineering and Operations, Topic No. 750-030-020-a, effective September 18, 2008. http://www2.dot.state.fl.us/proceduraldocuments/procedures/bin/750030020.pdf This document provides specifications for inspections, notification, RISC implementation, funding, performance measures and training. Also included are forms and an implementation timeline that provides incentives and penalties, including:
o $600 flat rate service payment if arrival time is within 60 minutes and recovery services are not needed.
o 90-minute clearance time: $2,500 bonus, plus $1,000 bonus if additional equipment is used; $600 bonus if requested additional equipment is not used.
o 180-minute clearance time: $0 bonus. o More than 180 minutes: If roadway is not cleared within 180 minutes, a penalty of $10/minute
($600/hour) is assessed.
• Training presentation: “Rapid Incident Scene Clearance (RISC): Orientation 2009” http://dm.metriceng.com/D1TIMTraining/RISC%20Training%20of%20TIM%20Agencies/RISC%20Orientation_fhp%20revision_3.19.09.ppt
o In 2007, the RISC contractor made the 90-minute clearance time 93 out of 98 times, yielding a 95 percent success rate.
o In 2008, the RISC contractor made the 90-minute clearance time 66 out of 68 times, yielding a 97 percent success rate.
o Total incident duration, from activation to clearance, ranged from 176.6 minutes in 2004 to 120.5 minutes in 2009.
• Newsletter: Sunguide Disseminator, FDOT’s Traffic Engineering and Operations Quarterly News, April
2009. http://www.dot.state.fl.us/trafficoperations/Newsletters/2009/2009-004-Apr.pdf An article on page 1 of this newsletter describes expansion of RISC from the Florida Turnpike to FDOT’s District Seven.
Georgia (Metro Atlanta): Towing and Recovery Incentive Program (TRIP) Implemented in January 2008, TRIP is a financial incentive program for expedited towing and recovery services for large commercial vehicle incidents on the metro Atlanta Interstate system. TRIP is an initiative of the TIME task force (see page 11 of this Preliminary Investigation for more information about the TIME task force.) The incentive program is intended to help meet the region’s goal of clearing major incidents within 90 minutes. Wrecker companies that have been approved for TRIP membership are assigned a designated route of the Interstate to respond to qualifying large-scale incidents. When called to a TRIP-activated incident, approved companies will receive a monetary bonus for response and clearance within designated time frames. Related documents:
• TRIP application http://www.timetaskforce.com/documents/TRIP/TRIP%20application%20and%20instructions.pdf
• Presentation: “2008 Traffic Conference for Mobility and Safety”
http://www.ncdot.org/doh/preconstruct/traffic/conference/2008/reports/Day2a_08.pdf
• TIME task force newsletter: Georgia’s Traffic Incident Management Times, August 2009. http://www.timetaskforce.com/documents/newsletter/TIME_newsletter_August2009.pdf

19
Highlights from the article on page 1 of this newsletter include: o Since TRIP’s implementation in January 2008, there have been 88 TRIP activations in the Atlanta
region. In approximately 95 percent of these activations, arrival and clearance times were met and incentives paid.
o Four companies participated in the TRIP program from January 2008 to April 2009. o The average clearance time for TRIP-qualifying incidents decreased from an average of 269
minutes in 2007 (before TRIP implementation) to 93 minutes in 2009. These numbers show an average time saving of 2 hours and 56 minutes per incident.
o The success of the TRIP program has prompted the expansion of the program from its original boundaries.
o The Towing and Recovery Association of America has modeled the TRIP training program to adopt national education standards.
Texas (City of Houston): SAFEClear Program http://www.houstontx.gov/safeclear/index.html The SAFEClear program’s private sector freeway service patrol model divides Houston freeways into segments with assigned operators responsible for their own segments. Related document:
• Report: SafeClear Performance Report 2008 http://www.houstontx.gov/safeclear/2008report/2008performance-safeclear.pdf This report tracks performance measures of collision, response time, clearance time and duration. See below for a comparison of the goals and actual data for the amount of time elapsed between the notification of the tow operator and removal of the disabled vehicle:
o Within 90 minutes Goal: 98 percent Actual: 99.5 percent o Within 20 minutes Goal: 70 percent Actual: 84.5 percent
Washington: Blok-Buster Major Incident Tow Program http://www.wsdot.wa.gov/Operations/IncidentResponse/initiatives.htm From the Washington State DOT web site: When involved in highway incidents, the biggest trucks cause the longest delays. The Legislature funded the Blockage Buster Tow Incentive Program to remove heavy truck collisions faster. Participating tow companies are eligible for up to $2,500 bonus compensation if they meet our quick-clearance requirements at major incidents. Related document:
• Proposal to Expand Major Incident Tow Program (MIT) Coverage: Executive Summary, Washington State Department of Transportation, May 2008. http://www.leg.wa.gov/JTC/Meetings/Documents/MITExeSummary070808.pdf From the executive summary: The legislature provided $346,000 to fund a two year pilot program to implement an incentive program to expedite the clearance of heavy- truck collisions. Based upon a similar program in Florida, the original proposal limited the scope of the program to King, Pierce, and Snohomish Counties. The program is designed to target the most challenging heavy-truck collisions, and it is funded for approximately 40 activations a year. Based upon historical data, it was anticipated that about 20 activations a year would occur in King County, with another 10 activations each in Pierce and Snohomish Counties.
During the first 10 months of the program, there have been 11 activations or an average of 1.1 activations per month. This is below the projected activation level of 3.3 activations per month, or 40 per year. However, 81 percent of activations have met the 90 minute clearance requirement, so we believe the program is working as intended.

20
National, Regional and State Coalitions Coalitions that focus on incident management or consider the topic one of its primary areas of interest are highlighted below. National Traffic Incident Management Coalition (NTIMC) http://timcoalition.org/?siteid=41 NTIMC led the development of a National Unified Goal (NUG) for TIM that addresses responder safety; safe and quick clearance; and prompt, reliable and interoperable communications. The NUG, formally launched in November 2007, encourages state and local transportation and public safety agencies to adopt unified, multidisciplinary policies, procedures and practices. Related documents:
• Brochure: “Nine Keys to Success for Traffic Incident Management Programs” http://www.transportation.org/sites/ntimc/docs/J5224-Tri_keyS(1).pdf
• Report: “Benefits of Traffic Incident Management”
http://www.transportation.org/sites/ntimc/docs/Benefits11-07-06.pdf
• Report: “Example Strategies for Building Stronger State Traffic Incident Management Programs” http://www.transportation.org/sites/ntimc/docs/Institutional%20Models.pdf
• Report: “National Unified Goal for Traffic Incident Management: Frequently Asked Questions” http://www.transportation.org/sites/ntimc/docs/NUG-FAQ-11-07a.pdf
• Report: “Prompt, Reliable Incident Communications”
http://www.transportation.org/sites/ntimc/docs/Incident%20Communications11-16-06-v3.pdf Washington Traffic Incident Management Coalition (WaTIMCo) http://www.watimcoalition.org/ Washington State DOT; Washington State Patrol; fire, towing and other incident responder representatives and stakeholders are partners in WaTIMCo, a coalition that oversees implementation of the NTIMC’s NUG. The web site provides information about regional conferences and training that is presented to and by all three disciplines (WSDOT, WSP and fire). The goal for the training is to initiate communication within these groups and work together with unified command. I-95 Corridor Coalition: Coordinated Incident Management Committee http://www.i95coalition.org/i95/Committees/IncidentManagement/tabid/74/Default.aspx The I-95 Corridor Coalition is an alliance of transportation agencies, toll authorities and related organizations, from Maine to Florida, with affiliate members in Canada. The Coordinated Incident Management Committee “facilitates, supports, and enhances the coordination and implementation of interagency efforts in response to major incidents.” Check the web site for a Quick Clearance Toolkit that includes videos, documents and information about workshops. The site also includes information about a wealth of projects, some completed and others ongoing or pending, related to incident management.

21
Research in Progress A final report is expected soon for a project under way in Oregon to identify and recommend procedures to address barriers that may affect quick clearance of incidents. The I-95 Corridor Coalition is sponsoring a project, also expected to conclude early this year, that will report on best practices of incident management teams. SPR 658: Oregon Institutional Barriers Delaying Incident Clearance, Oregon Department of Transportation, expected completion date September 20, 2009. (This project is still in process. ODOT elected to have the principal investigator complete the work as soon as feasible and not process a contract extension.) http://www.oregon.gov/ODOT/TD/TP_RES/ActiveProjectsII.shtml#SPR_658 The objectives of this study are to:
• Using a variety of data resources, examine recent traffic incidents where full highway closure occurred to determine the extent to which the incident and associated traffic obstructions impact traffic operations.
• Identify institutional barriers that may affect the rapid clearance of incidents occurring on Oregon highways.
• Identify administrative procedures that could be implemented to expedite incident clearance and estimate the benefit of these recommended procedures.
Research results will be incorporated in the Oregon Traffic Incident Management Strategic Plan currently being developed. An October 1, 2009, progress report indicated that work continues on the draft final report and associated interviews. Completion of the draft final report was expected during the second quarter of FY 2010 (October 1, 2009, through December 31, 2009). Identify and Study Best Incident Management Team Programs, I-95 Corridor Coalition, expected completion date: January 2010. http://www.i95coalition.org/i95/Projects/ProjectDatabase/tabid/120/agentType/View/PropertyID/240/Default.aspx This project will identify, study and report on best practices associated with incident management (IM) teams, beginning with North Carolina and New Jersey, and then proceeding to study other programs. The project is expected to review protocols for major events and incidents; how programs were established and enacted, including necessary training and operational implementation; and source identification and analysis of statistics provided by involved entities to assess the impact of the IM team programs. An interdisciplinary information exchange forum will present the project findings. Efficient Incident Response Program Operations, Washington State Department of Transportation, expected completion date: June 30, 2010. http://trac29.trac.washington.edu/projects/project/show_form/220 The objective of this project is to evaluate the current state of the practice of the incident response (IR) program in Washington. The evaluation will include an inventory and comparative analysis of program elements. An analysis of deployment statistics and service level will determine how incidents affect congestion on the roadway. This analysis can be used to develop a needs-based system to guide the department on deploying IR program elements. The project will also include an analysis that identifies the "tipping point" that determines when incidents can be expected to result in congestion.